Embed Size (px)
Citation preview
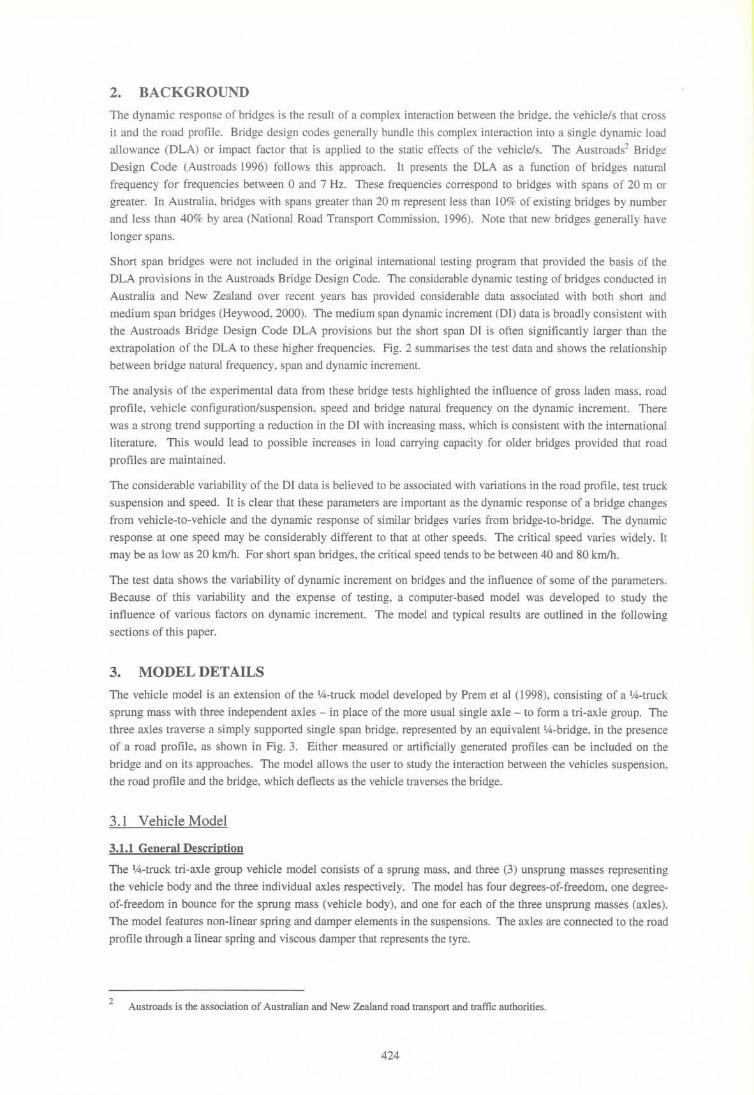
7th International Svmposium on Heavv Vehicle Weights & Dimensions
Delft, The Netherlands, .June 16 - 20, 2002
DYNAMIC INTERACTION OF VEHICLES AND BRIDGES
Wayne Roberts Hans Prem
Rob Heywood Geoff Boully
Infratech Systems & Services, 24 Bank Street, West End, Queensland 4101, Australia. RTDynamics 1
, Suite 11, Bulleen Corporate Centre, 79 Manningham Road, Bulleen, Victoria 3105, Australia. Infratech Systems & Services, 24 Bank Street, West End, Queensland 4101 , Australia. VicRoads, 3 Prospect Hill Road, Camberwell, Victoria 3124, Australia.
ABSTRACT
Many studies conducted worldwide over a period of more than a decade have confirmed that large dynamic effects
can be induced in bridges by the combination of heavy vehicles and uneven road profiles. In Australia,
approximately 75% of the bridges have spans between 5 and 15 m. Many of these short span bridges have shown
dynamic effects due to vehicle-bridge interaction that far exceed the provisions of the current Australian Bridge
Design Code, and in some cases dynamic increments in excess of 100% have been recorded, even for heavily
loaded events. The introduction of the new Australian Bridge Design Standard will see the design load for bridges
increase to allow for heavier and more innovative vehicles in the future, and it is important to investigate vehicle
bridge interaction associated with these future vehicle types.
This paper presents results from computer-based dynamic models that were developed to investigate the complex
probLem of dynamic interaction between heavy vehicles and bridges in the presence of uneven road profiles. The
models were used to investigate the influence of the main parameters governing dynamic responses of bridges to
the crossing of heavy vehicles, such as bridge natural frequency and damping, vehicle mass and suspension
characteristics, road profiles on the bridge approaches and deck, and vehicle speed. Results from parametric
studies were found to be generally consistent with .field measurements and experience. The work described in this
paper is part of an ongoing program of research in Australia that is aimed at delivering recommendations to
AUSTROADS with respect to the dynamic load allowance both for the design of new bridges and the assessment of
existing bridges.
1. INTRODUCTION
Many studies conducted worldwide over a period of more than a decade have confirmed that large dynamic effects
can be induced in bridges by the combination of heavy vehicles and uneven road profiles. In Australia,
approximately 75% of the bridges have spans between 5 and 15 m, and during dynamic testing using heavy
vehicles, many of these short span bridges have shown dynamic effects due to vehicle-bridge interaction that far
exceed the provisions of the current Australian Bridge Design Code (Austroads, 1996). In some cases dynamic
increments in excess of 100% have been recorded, even for heavily loaded events.
In Australia there is continuing pressure for current bridges built throughout the last millennium to carry a diverse
range of heavy vehicle configurations and types as illustrated in Fig. 1. The introduction of the new Australian
Bridge Design Standard (Standards Australia, 2000) will see the design load for bridges increase to allow for
heavier and more innovative vehicles in the future. Thus, it is important to understand vehicle-bridge interaction
and the effects of heavy vehicles on bridges to quantify the dynamic loading to:
1. Allow the safe and efficient evaluation of the capacity of old bridges to carry present vehicles.
2. Provide design standards for new bridges that will be consistent with vehicles and bridges of the future.
3. Provide guidelines for the maintenance of road profiles to avoid unnecessarily high dynamic loadings on
bridges from vehicles.
This paper looks at the issues associated with vehicle-bridge interaction in Australia, presents the development of a
vehicle-bridge interaction model which was created to study the interaction between vehicles and bridges, and
presents the results of a preliminary parametric study.
Infratech Systems & Services, and RTDynamics (Roads and Transport Dynamics), are Business Units of Texcel Pty Ltd.
423
2. BACKGROUND
The dynamic response of bridges is the result of a complex interaction between the bridge, the vehicle/s that cross
it and the road profile. Bridge design codes generally bundle this complex interaction into a single dynamic load
allowance (OLA) or impact factor that is applied to the static effects of the vehicle/so The Austroads2 Bridge
Design Code (Austroads 1996) follows this approach. It presents the DLA as a function of bridges natural
frequency for frequencies between 0 and 7 Hz. These frequencies correspond to bridges with spans of 20 m or
greater. In Australia, bridges with spans greater than 20 m represent less than 10% of existing bridges by number
and less than 40% by area (National Road Transport Commission, 1996). Note that new bridges generally have
longer spans.
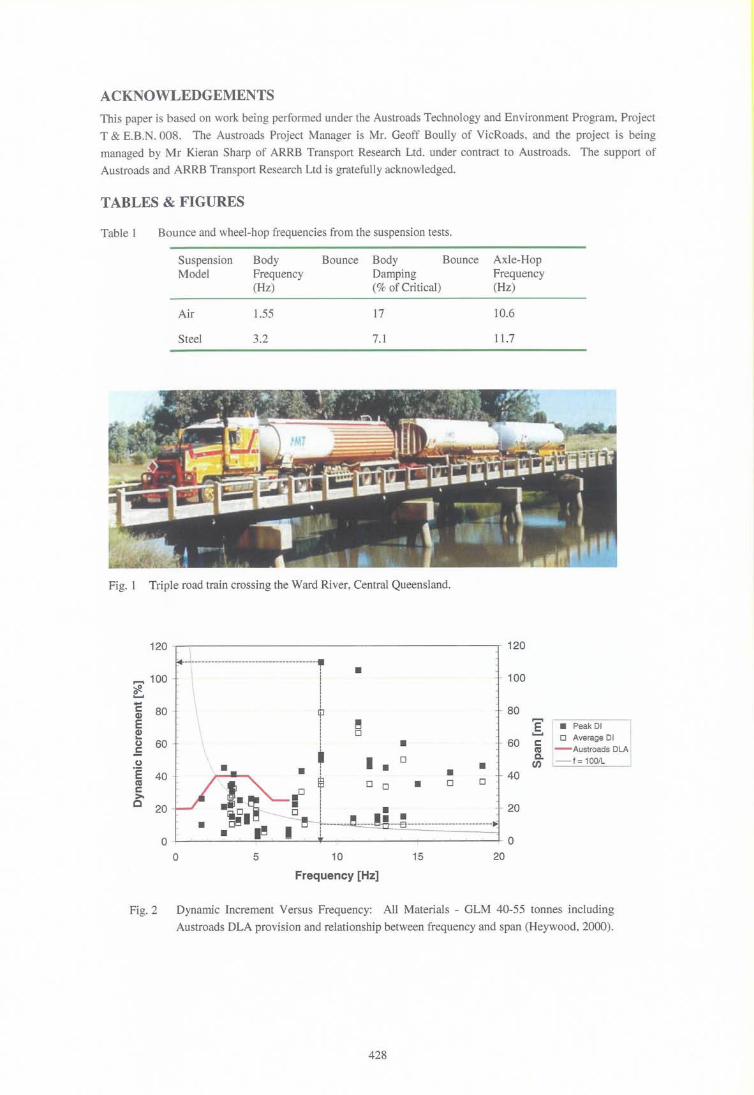
Short span bridges were not included in the original international testing program that provided the basis of the
DLA provisions in the Austroads Bridge Design Code. The considerable dynamic testing of bridges conducted in
Australia and New Zealand over recent years has provided considerable data associated with both short and
medium span bridges (Heywood, 2000). The medium span dynamic increment (01) data is broadly consistent with
the Austroads Bridge Design Code DLA provisions but the short span 01 is often significantly larger than the
extrapolation of the DLA to these higher frequencies. Fig. 2 summarises the test data and shows the relationship
between bridge natural frequency, span and dynamic increment.
The analysis of the experimental data from these bridge tests highlighted the influence of gross laden mass, road
profile, vehicle configuration/suspension, speed and bridge natural frequency on the dynamic increment. There
was a strong trend supporting a reduction in the 01 with increasing mass, which is consistent with the international
literature. This would lead to possible increases in load carrying capacity for older bridges provided that road
profiles are maintained.
The considerable variability of the Dl data is believed to be associated with variations in the road profile, test truck
suspension and speed. It is clear that these parameters are important as the dynamic response of a bridge changes
from vehicle-to-vehicle and the dynamic response of similar bridges varies from bridge-to-bridge. The dynamic
response at one speed may be considerably different to that at other speeds. The critical speed varies widely. It
may be as low as 20 km/h. For short span bridges, the critical speed tends to be between 40 and 80 km/h.
The test data shows the variability of dynamic increment on bridges and the influence of some of the parameters.
Because of this variability and the expense of testing, a computer-based model was developed to study the
influence of various factors on dynamic increment. The model and typical results are outlined in the following
sections of this paper.
3. MODEL DETAILS
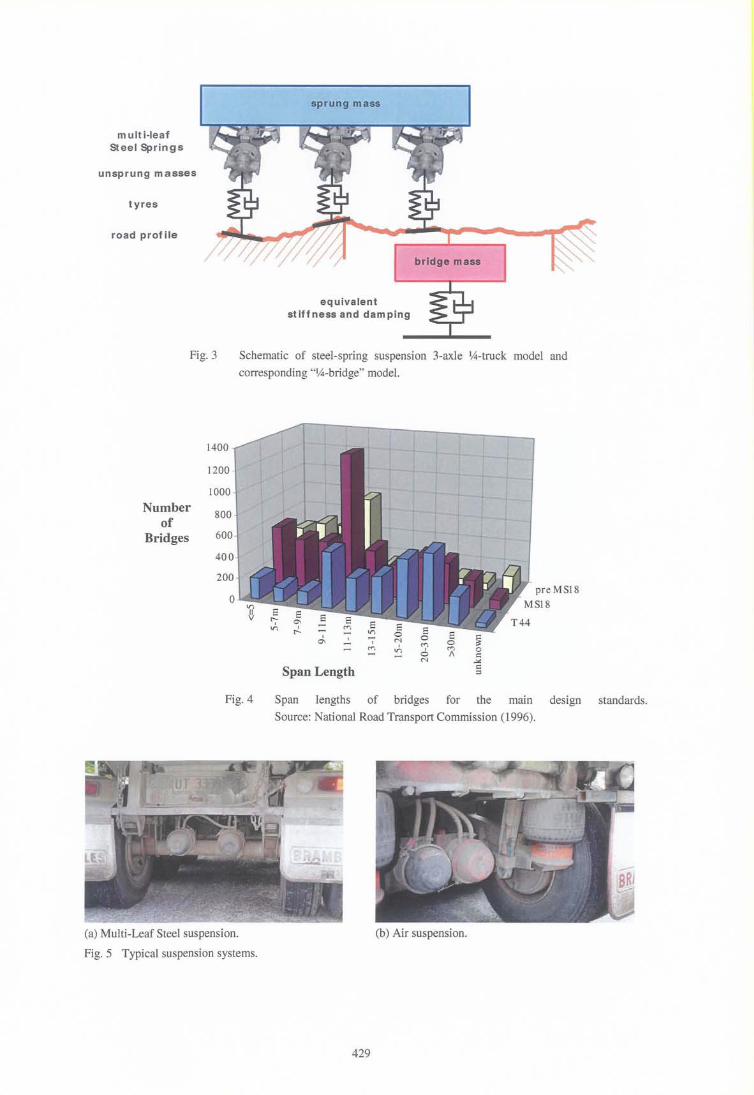
The vehicle model is an extension of the lA-truck model developed by Prem et al (1998), consisting of a lA-truck
sprung mass with three independent axles - in place of the more usual single axle - to form a tri-axle group. The
three axles traverse a simply supported single span bridge, represented by an equivalent lA-bridge, in the presence
of a road profile, as shown in Fig. 3. Either measured or artificially generated profiles can be included on the
bridge and on its approaches. The model allows the user to study the interaction between the vehicles suspension,
the road profile and the bridge, which deflects as the vehicle traverses the bridge.
3 .1 Vehicle Model
3.1.1 General Description
The tA-truck tri-axle group vehicle model consists of a sprung mass, and three (3) un sprung masses representing
the vehicle body and the three individual axles respectively. The model has four degrees-of-freedom, one degree
of-freedom in bounce for the sprung mass (vehicle body), and one for each of the three unsprung masses (axles).
The model features non-linear spring and damper elements in the suspensions. The axles are connected to the road
profile through a linear spring and viscous damper that represents the tyre.
2 Austroads is the association of Australian and New Zealand road transport and traffic authorities.
424
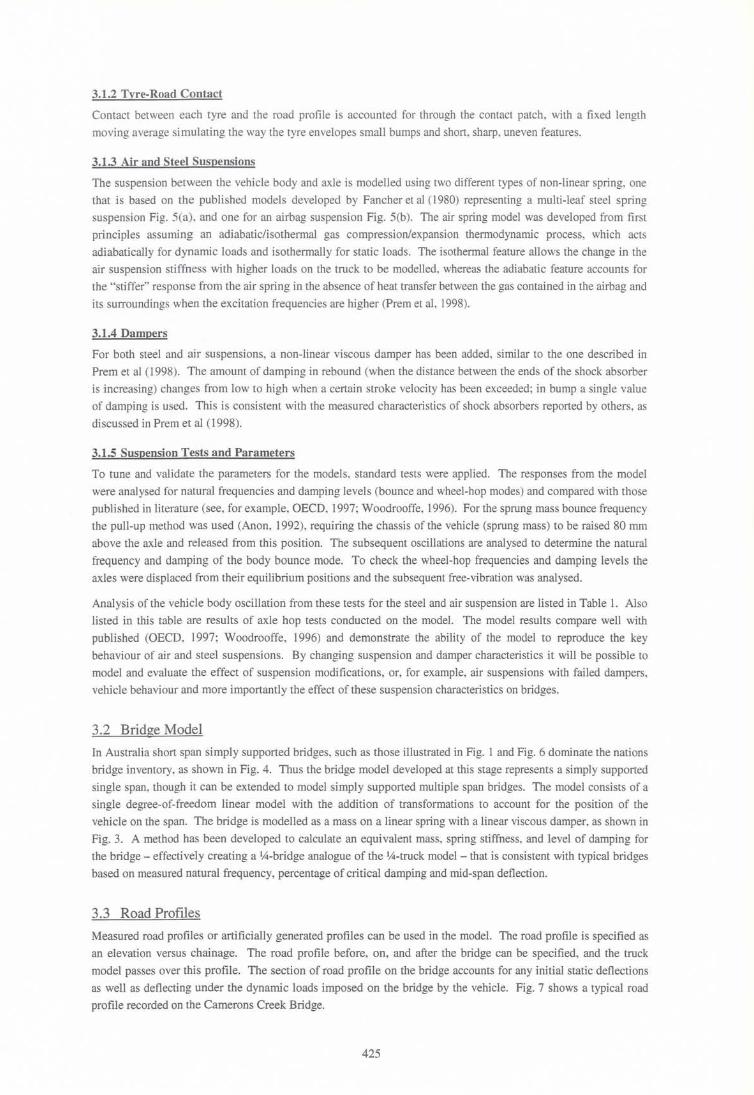
3.1.2 Tyre-Road Contact
Contact between each tyre and the road profile is accounted for through the contact patch, with a fixed length
moving average simulating the way the tyre envelopes small bumps and short, sharp, uneven features.
3.1.3 Air and Steel Suspensions
The suspension between the vehicle body and axle is modelled using two different types of non-linear spring, one
that is based on the published models developed by Fancher et al (1980) representing a multi-leaf steel spring
suspension Fig. 5(a), and one for an airbag suspension Fig. 5(b). The air spring model was developed from first
principles assuming an adiabaticlisothermal gas compression/expansion thermodynamic process, which acts
adiabatically for dynamic loads and isothermally for static loads. The isothermal feature allows the change in the
air suspension stiffness with higher loads on the truck to be modelled, whereas the adiabatic feature accounts for
the "stiffer" response from the air spring in the absence of heat transfer between the gas contained in the airbag and
its surroundings when the excitation frequencies are higher (Prem et aI, 1998).
3.1.4 Dampers
For both steel and air suspensions, a non-linear viscous damper has been added, similar to the one described in
Prem et al (1998). The amount of damping in rebound (when the distance between the ends of the shock absorber
is increasing) changes from low to high when a certain stroke velocity has been exceeded; in bump a single value
of damping is used. This is consistent with the measured characteristics of shock absorbers reported by others, as
discussed in Prem et al (1998).
3.1.5 Suspension Tests and Parameters
To tune and validate the parameters for the models, standard tests were applied. The responses from the model
were analysed for natural frequencies and damping levels (bounce and wheel-hop modes) and compared with those
published in literature (see, for example, OECD, 1997; Woodrooffe, 1996). For the sprung mass bounce frequency
the pull-up method was used (Anon, 1992), requiring the chassis of the vehicle (sprung mass) to be raised 80 mm
above the axle and released from this position. The subsequent oscillations are analysed to determine the natural
frequency and damping of the body bounce mode. To check the wheel-hop frequencies and damping levels the
axles were displaced from their equilibrium positions and the subsequent free-vibration was analysed.
Analysis of the vehicle body oscillation from these tests for the steel and air suspension are listed in Table 1. Also
listed in this table are results of axle hop tests conducted on the model. The model results compare well with
published (OECD, 1997; Woodrooffe, 1996) and demonstrate the ability of the model to reproduce the key
behaviour of air and steel suspensions. By changing suspension and damper characteristics it will be possible to
model and evaluate the effect of suspension modifications, or, for example, air suspensions with failed dampers,
vehicle behaviour and more importantly the effect of these suspension characteristics on bridges.
3.2 Bridge Model
In Australia short span simply supported bridges, such as those illustrated in Fig. 1 and Fig. 6 dominate the nations
bridge inventory, as shown in Fig. 4. Thus the bridge model developed at this stage represents a simply supported
single span, though it can be extended to model simply supported multiple span bridges. The model consists of a
single degree-of-freedom linear model with the addition of transformations to account for the position of the
vehicle on the span. The bridge is modelled as a mass on a linear spring with a linear viscous damper, as shown in
Fig. 3. A method has been developed to calculate an equivalent mass, spring stiffness, and level of damping for
the bridge - effectively creating a 14-bridge analogue of the 14-truck model - that is consistent with typical bridges
based on measured natural frequency, percentage of critical damping and mid-span deflection.
3.3 Road Profiles
Measured road profiles or artificially generated profiles can be used in the model. The road profile is specified as
an elevation versus chainage. The road profile before, on, and after the bridge can be specified, and the truck
model passes over this profile. The section of road profile on the bridge accounts for any initial static deflections
as well as deflecting under the dynamic loads imposed on the bridge by the vehicle. Fig. 7 shows a typical road
profile recorded on the Camerons Creek Bridge.
425
Thus, the influence on vehicle bridge interaction of profiles on bridge approaches at the abutments and on the
bridge decks can be studied.
3.4 Vehicle-Bridge Interaction Modelling
Both the bridge and the vehicle are modelled as interacting dynamic systems. The road profile causes dynamic
wheel forces, which induces a dynamic bridge response which in-turn modifies the road profile. Thus there is an
interaction between the vehicle and the bridge. Simulations can be performed with interaction between vehicle and
bridge either enabled or deactivated.
To evaluate the effectiveness of the model and to demonstrate its capabilities, the model was used to simulate
experiments that were conducted during the dynamic load testing of the Camerons Creek Bridge as part of the
OECD DIVINE Project (OECD, 1997). During the testing of Camerons Creek bridge, road profiles were
recorded, as well as dynamic wheel forces and bridge responses for a range of truck test speeds. Because the
recorded results are based on a 6-axle prime mover and semi-trailer combination, two simulations were used to
model the results. One model was used for the prime mover and one model for the trailer with the results
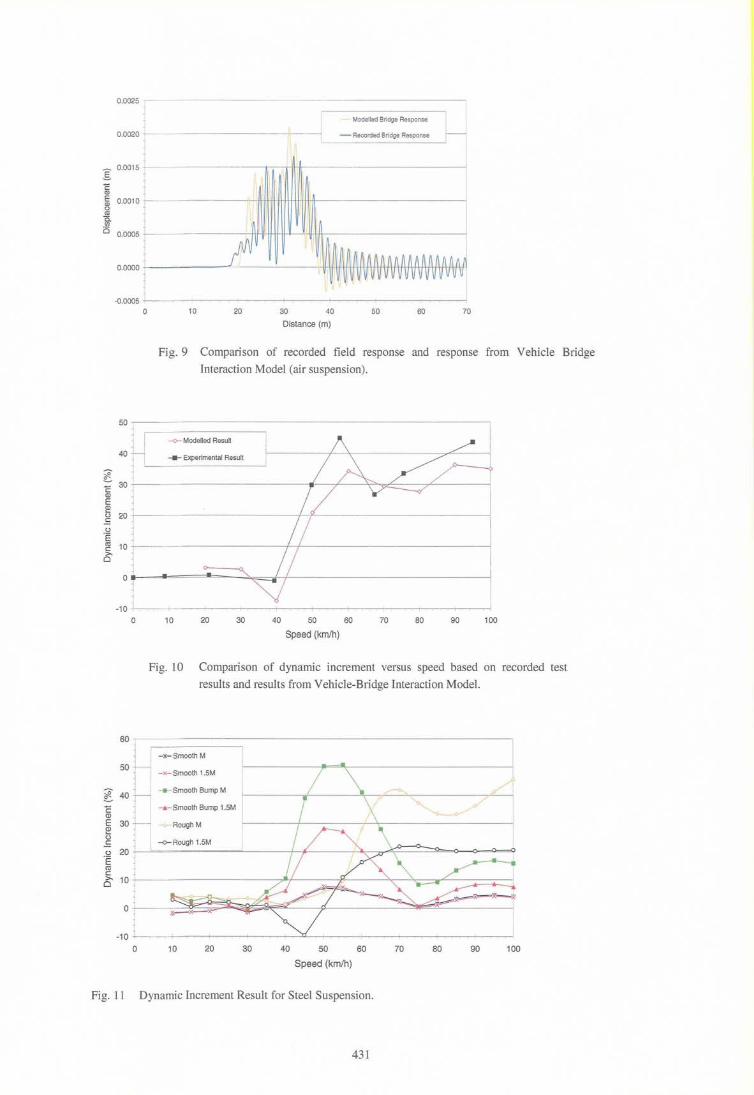
superimposed to represent the passage of the truck over the bridge. Fig. 8 compares the bridge response from the
model for a truck with steel suspension, and Fig. 9 for an air suspended truck. The results from the model compare
well with the experimental results and show the ability of the model to simulate vehicle-bridge interaction. The
model can also be used to simulate dynamic wheel forces and comparison of these wheel forces with the recorded
wheel forces at Camerons Creek also shows that there is good agreement. Fig. 10 shows a comparison of results
based on dynamic increment versus speed. The graph compares the results from the model using a tri-axle group
with the experimental results for a 6-axle prime mover and semi-trailer. Again there is good agreement between
experimental and modelled results.
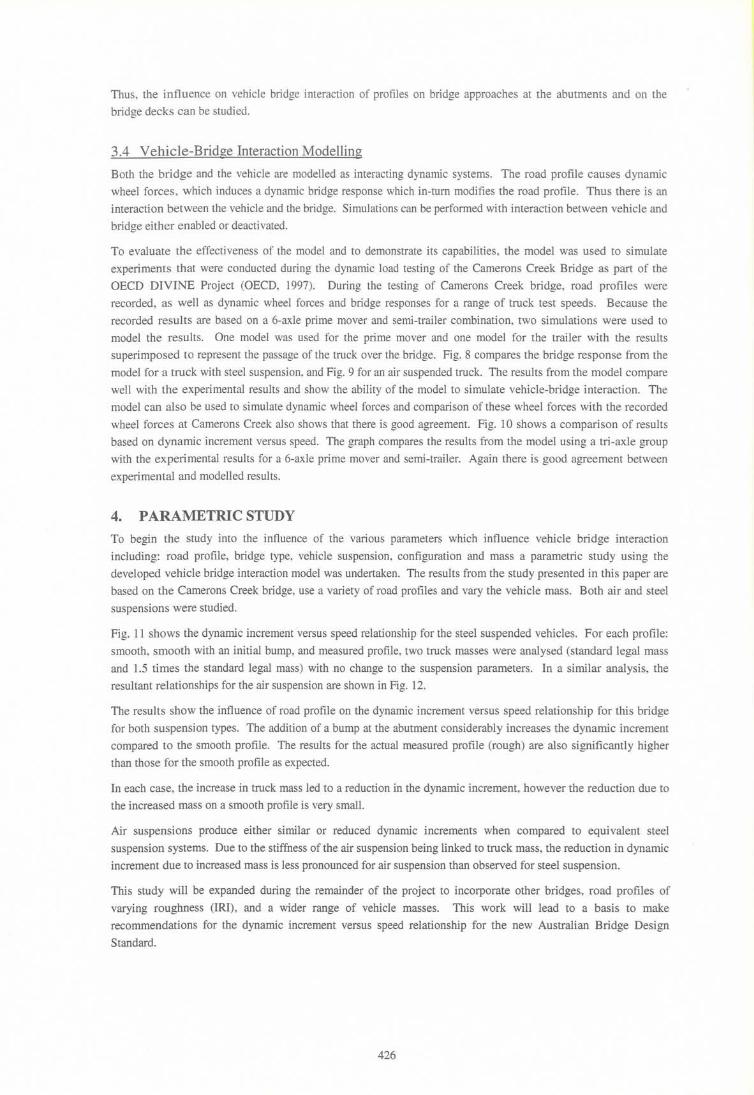
4. PARAMETRIC STUDY
To begin the study into the influence of the various parameters which influence vehicle bridge interaction
including: road profile, bridge type, vehicle suspension, configuration and mass a parametric study using the
developed vehicle bridge interaction model was undertaken. The results from the study presented in this paper are
based on the Camerons Creek bridge, use a variety of road profiles and vary the vehicle mass. Both air and steel
suspensions were studied.
Fig. 11 shows the dynamic increment versus speed relationship for the steel suspended vehicles. For each profile:
smooth, smooth with an initial bump, and measured profile, two truck masses were analysed (standard legal mass
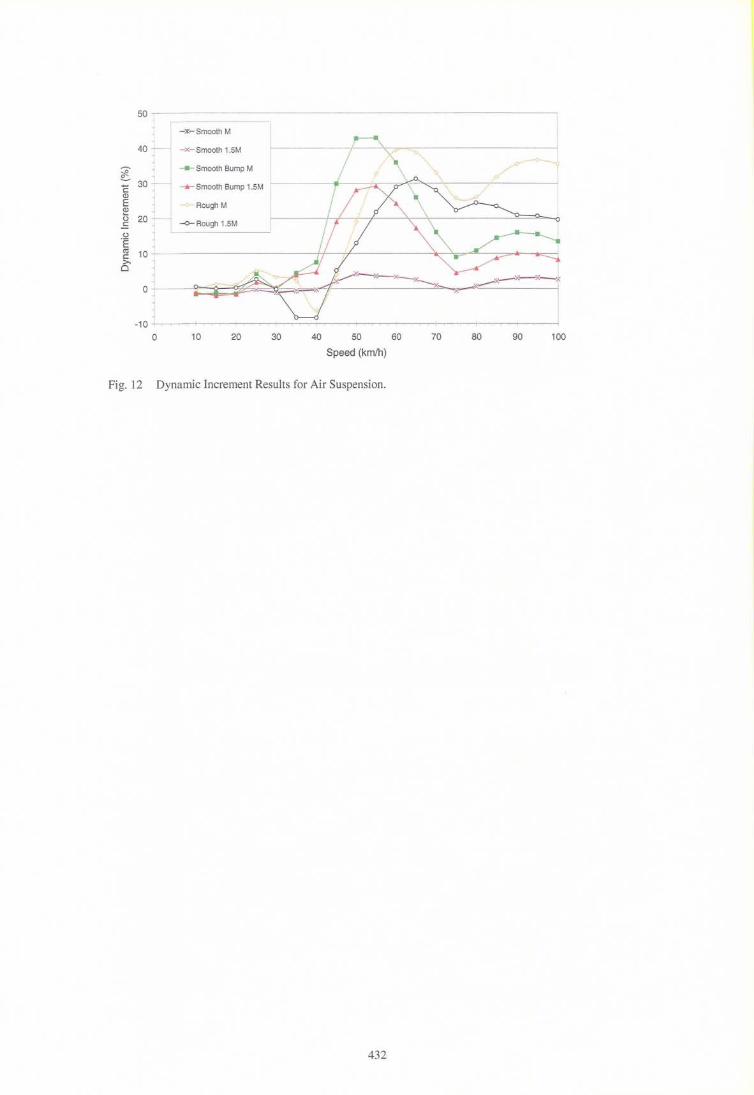
and 1.5 times the standard legal mass) with no change to the suspension parameters. In a similar analysis, the
resultant relationships for the air suspension are shown in Fig. 12.
The results show the influence of road profile on the dynamic increment versus speed relationship for this bridge
for both suspension types. The addition of a bump at the abutment considerably increases the dynamic increment
compared to the smooth profile. The results for the actual measured profile (rough) are also significantly higher
than those for the smooth profile as expected.
In each case, the increase in truck mass led to a reduction in the dynamic increment, however the reduction due to
the increased mass on a smooth profile is very small.
Air suspensions produce either similar or reduced dynamic increments when compared to equivalent steel
suspension systems. Due to the stiffness of the air suspension being linked to truck mass, the reduction in dynamic
increment due to increased mass is less pronounced for air suspension than observed for steel suspension.
This study will be expanded during the remainder of the project to incorporate other bridges, road profiles of
varying roughness (IRI), and a wider range of vehicle masses. This work will lead to a basis to make
recommendations for the dynamic increment versus speed relationship for the new Australian Bridge Design
Standard.
426
5. MODEL APPLICATIONS
The vehicle bridge interaction model developed for this project has a wide range of other applications. These
include:
1. Studying vehicle-road interaction.
2. Assist with the design of "bridge friendly" suspension systems.
3. A basis for a Bridge Roughness Index (BRI). A BRI could be developed, similar to IRI but designed to
quantify the influence of road profile on bridge response. The BRI could then be monitored as part of
routine network level roughness surveys to determine when unevenness levels on bridges and bridge
approaches exceeded specified levels indicating that profile repair was required.
6. CONCLUSION
This paper has reviewed the development of a computer model, which includes the ability to study the effect of
heavy vehicle suspension systems, vehicle mass, road profiles, and bridge behaviour on vehicle bridge interaction.
Comparison of the model outputs with field test results from dynamic testing of bridges shows good agreement
between the two results. The model is currently being used to conduct a parametric study which will allow
recommendations to be made for appropriate dynamic increment values for the new Australian Bridge Design
Standard. Dynamic increment is a measure of the increased effects of heavy vehicles on bridges due to dynamic
effects over and above the static effects. To date the results of this study have shown that the road profile is a
significant factor in vehicle bridge interaction and that dynamic increment values generally decrease with
increasing vehicle mass. The model also has a number of other applications, which may be further developed in
the future.
REFERENCES
ANON (1992), Council Directive 92/7IEEC, Annex III - Conditions Relating to Equivalence between Certain
Non-Air Suspensions Systems and Air Suspension for Vehicle Driving Axles(s). The Council of the European
Communities. February 1992
AUSTROADS (1996), A USTROADS Bridge Design Code, Austroads, Sydney, NSW.
CANTIENI, R, KREBS, W., HEYWOOD, RJ., (2000), Dynamic Interaction between Vehicles and
Infrastructure Experiment, June 2000, OECD IR 6 DIVINE Project, Element 6 Bridge Research, EMPA & QUT
FANCHER, P.S., ERVIN, RD., MacADAM, c.c. and WINKLER, C.B. (1980), Measurement and
Representation of the Mechanical Properties of Truck Leaf Springs. SAE Paper No. 800905. Society of
Automotive Engineers, Inc.: Warrendale, PA, United States.
HEYWOOD RJ. (2000), Dynamic Interaction of Vehicles and Bridges, Austroads Project No NT&E 9909,
Report No 9909/2.
NATIONAL ROAD TRANSPORT COMMISSION (1996), Mass Limits Review, Appendices to Technical
Supplement No.2: Road and Bridge Statistical Data Tables. Prepared by Austroads Project Team 3.E.51 for
National Road Transport Commission: Melbourne, Vic.
OECD (1997), Dynamic Interaction of Vehicles and Infrastructure Experiment. Proc, Asia-Pacific Concluding
Conference OECD DIVINE Project Melbourne Hilton Melbourne Australia, November 5-7.
PREM, H., GEORGE, RM. and McLEAN, J.R (1998), Methods for Evaluating the Dynamic Wheel-Load
Performance of Heavy Vehicle Suspensions. Proc, 5th Int. Symp. on Heavy Vehicle Weights & Dimensions.
Maroochydoore, Queensland, Australia. March 29-April 2.
STANDARDS AUSTRALIA (2000), DR00380 Draft Standardfor Bridge Design, Standards Australia, Sydney.
WOODROOFFE, J.H.F. (1996), Heavy Vehicle Suspensions: Methods for Evaluating Road-Friendliness.
Roaduser Research Report C-96-4 to National Research Council Canada, Centre for Surface Transportation
Technology. Final Report.
427
ACKNOWLEDGEMENTS
This paper is based on work being performed under the Austroads Technology and Environment Program, Project
T & E.B.N. 008. The Austroads Project Manager is Mr. Geoff Boully of VicRoads, and the project is being
managed by Mr Kieran Sharp of ARRB Transport Research Ltd. under contract to Austroads. The support of
Austroads and ARRB Transport Research Ltd is gratefully acknowledged.
TABLES & FIGURES
Table 1 Bounce and wheel-hop frequencies from the suspension tests.
Suspension Body Bounce Body Bounce Model Frequency Damping
(Hz) (% of Critical)
Air 1.55 17
Steel 3.2 7.1
Fig. 1 Triple road train crossing the Ward River, Central Queensland.
120
....., 100 -~ ~
E 80 Cl)
E Cl) "-(J 60 ..5 (J
"e m 40 t:: >-C 20
0
0
• 5
•
• I • 0
10
Frequency [Hz]
• • 0
15
Axle-Hop Frequency (Hz)
10.6
11.7
120
100
80
g • Peak 01
60 t:: o Average 01
m - Austroads OLA 0- -f = 100/L • U'J
0 40
20
0
20
Fig. 2 Dynamic Increment Versus Frequency: All Materials - GLM 40-55 tonnes including
Austroads DLA provision and relationship between frequency and span (Heywood, 2000).
428
m ult i-leaf Steel Springs
unsprung m asses
tyres
road prof ile
sprung mass
equivalent st iff ness and dam ping
Fig. 3 Schematic of steel-spring suspension 3-axle lA-truck model and
corresponding "lA-bridge" model.
1400
1200
1000
Number 800
of Bridges 600
400
200
0
Fig. 4
(a) Multi-Leaf Steel suspension.
Fig. 5 Typical suspension systems.
..... I ,....;
0\
Span Length
Span lengths of bridges for the main design standards.
Source: National Road Transport Commission (1996).
(b) Air suspension.
429
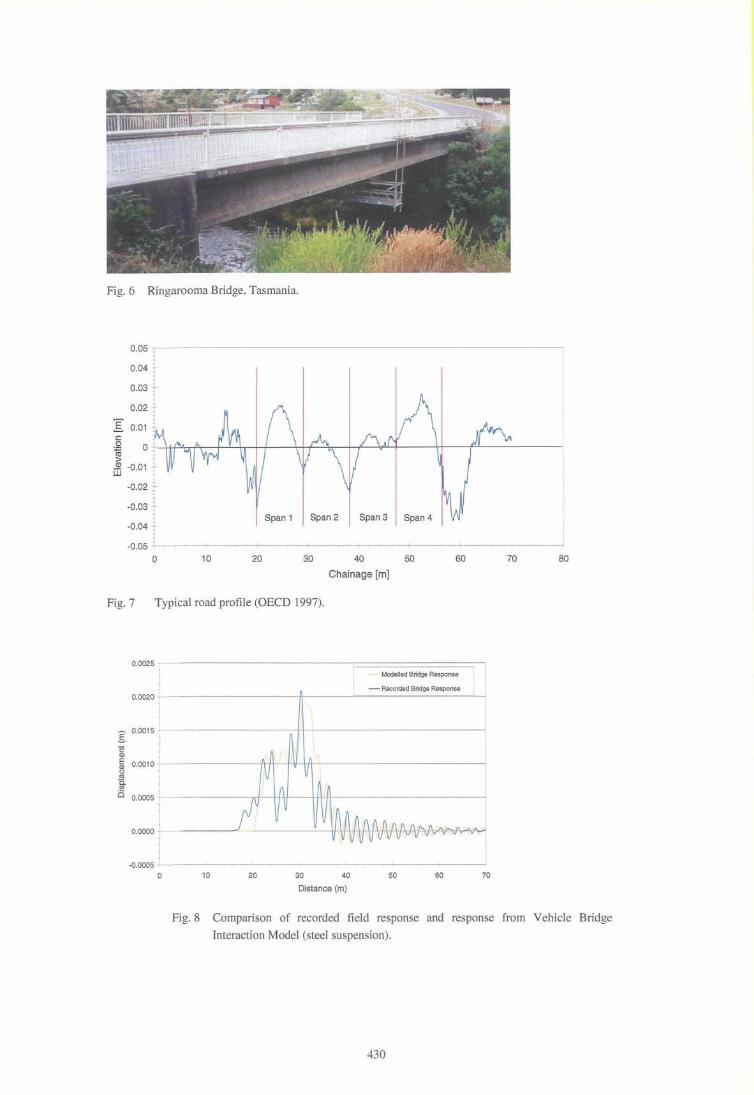
Fig. 6 Ringarooma Bridge, Tasmania.
0.05 ~
0.04
0.03
0.02
I 0.01 c:
.Q 0 co > <J) -0.01 ill
-0.02
-0.03
-0.04
-0.05
0 10 20 30 40 50 60 70 80
Chainage [m]
Fig. 7 Typical road profile (OECD 1997).
0.0025
0.0020
I 0.0015
C Q)
E 0.0010 Q) u C1l 0.. rn is 0.0005
0.0000
-0.0005
0 10
Fig. 8
- Modelled Bridge Response
- Recorded Bridge Response
20 30 40 50 60 70
Distance (m)
Comparison of recorded field response and response from Vehicle Bridge
Interaction Model (steel suspension).
430
I c Cl)
0.0025 ~------------------------------,
Modelled Bridge Response
0.0020 --------------,.---1 - Recorded Bridge Response
1 0.0015 +---------- ---;--,--,--'IHI--------------____j
~ 0.001 0 +----------....;...wt+t·tH·t+H-tt~+Hl------------____j
al a. (/)
is
~ C Cl)
E ~ '-' E '-' 'E ell c >. 0
~ C Q)
E ~ '-' E '-' 'E ell c >. 0
0.0005 +-----------tI1HH+l++H----'YI-H-l---------------1
0.0000 +--------' ~-------lH_!_-t++H-Hftt++Hcl+H_/_++_H+f+t\+I+I+t_H-H+!
50
40
30
20
10
0
-10 ,
0
60
50
40
30
20
10
0
-10 .
0
10 20 30 40 50 60 70
Distance (m)
Fig. 9 Comparison of recorded field response and response from Vehicle Bridge
Interaction Model (air suspension).
--0- Modelled Resun
___ Experimental Result
10 20 30 40 50 60 70 80 90 100
Speed (km/h)
Fig. 10 Comparison of dynamic increment versus speed based on recorded test
results and results from V ehicle-Bridge Interaction Model.
- :t:- Smooth M
- x- Smooth 1.5M
____ Smooth Bump M
.......... Smooth Bump 1.5M "O-_<Y
Rough M
--0- Rough 1.5M
~-x-
10 20 30 40 50 60 70 80 90 100
Speed (km/h)
Fig. 11 Dynamic Increment Result for Steel Suspension.
431
50 ~
1 -:K-Smooth M .ob -x- Smooth 1.5M
~ 30~ --- Smooth Bump M
C -..- Smooth Bump 1.5M (]) 1 E Rough M (])
t; 20 -0- Rough 1.5M E
t)
·E ell 10 c: >-0
0
o 10 20 30 40 50 60 70 80 90 100
Speed (km/h)
Fig. 12 Dynamic Increment Results for Air Suspension.
432