Embed Size (px)
Citation preview
1
University of Essex
Department of Psychology
Psychology Project (PS300)
“The effect of spatial frequency and waviness of riloids on levels of discomfort and perceived illusory motion”
Tiffany Mitchell
Supervised by Paul Hibbard
1104558
Date: 01/05/14 Word Count: 5,420
2
“The effect of spatial frequency and waviness of riloids on levels of discomfort
and perceived illusory motion” Abstract Two experiments were conducted into the effect of spatial frequency and
waviness (mui) of “riloid” stimuli in order to assess the effects of these variables
upon ratings of discomfort and perceived illusory motion. These stimuli were
composed to replicate a painting by Bridget Riley, named “Fall”. Participants were
shown sequences of riloids and asked to rate levels of discomfort and motion in
separate trials. The second experiment involved tracking the eye movements of
participants simultaneously. It was found that discomfort and perceived motion
ratings increased as waviness, or mui (μ) and spatial frequency (λ) increased in
experiment one. However, when mui and frequency peaked, discomfort and motion
ratings decreased. Ratings of discomfort and perceived motion were also highly
correlated. Effects were maximised at mid-range and the correlation between
discomfort and motion suggested that they were measuring the same phenomenon.
Experiment two was conducted to investigate this and to discover if gaze stability
impacted upon these variables. This experiment found that varying μ and λ still had
the same effect upon discomfort and motion ratings. However, mui did not achieve
as high a significance as in experiment 1. Frequency, on the other hand, reached
higher significance for discomfort ratings. Discomfort and motion were still highly
correlated. It was found that while gaze stability demonstrated weak correlations with
both discomfort and motion ratings, these were not statistically significant. This may
have been partially to do with technical faults leading to loss of eye tracking data.
3
Introduction Research into the area of optical illusions in psychology is often based around
the work of artists such as Bridget Riley. Perception is a wide topic in the field of
psychology and is core in emphasising the role of individual differences in how each
individual views the world and objects in it. The human eye is a complex mechanism
and researchers are keen to discover in what exact quality and quantity optical
illusions differ from natural images; why we see false movement and distortions in op
art that we do not see when observing natural scenery and control stimuli. Research
into this area often involves analysing neural responses to stimuli and is therefore a
useful tool in bringing psychologists further understanding of the human brain
structure. Optical illusions often affect the clarity of lines by altering patterns (Wade
1978). Such images can induce uncomfortable feeling such as migraines, which
research by Khalil (1991) suggests can be predicted by how susceptible an
individual is to visual discomfort. This research aims to expand on why perceived
motion is experienced and why discomfort often results from viewing optical illusions.
In 2003, Zanker et al conducted a study into gaze stability of observers
viewing optical illusions. This research was based around images with similar
composition to Riley’s painting “Fall” (fig. 1). The algorithms used to generate these
images can be viewed in the methods section of the report. The aim of Zanker’s
study was to determine the role of eye movements in the perception of illusory
motion. Zanker used control images as a comparison marker against the illusory
stimuli and used pinhole viewing to induce alternate focusing, reducing the effects of
accommodation when viewing images and therefore lessening illusory effects. It was
found that observers could indeed keep their gazes fixated within the dedicated
region. However, many saccades (small rapid eye movements) were observed
during the experiment. These did not decrease significantly in frequency when
observing the control images, which suggests that these eye movements are present
4
throughout image observations but act to cause the perception of illusory motion only
when optical illusions are viewed; a “motion-detector” network. Experiments by
Ditchburn (1973) have shown that the eyes constantly move involuntarily, even when
participants are instructed to keep their gaze steady.
Zanker, Hermens and Walker conducted research into the strength of motion
illusions in 2010, also using images based on Riley’s “Fall”. To avoid subjective
rating issues, a two-alternative forced choice (2AFC) paradigm was used to offer
participants simultaneous options within a given time limit. Using controls versus
illusory stimuli, Zanker discovered that whilst amplitude and undulation (waviness) of
the lines in the illusions were effective upon illusion strength, other factors such as
stimuli presentation, duration and fixation conditions did not have a significant effect.
Computer predictions of saccades matched data collected in the actual experiment
and this provided support for the role of the individual’s involuntary saccades in the
perception of illusory motion.
Current research conducted by Clarke, Hare and Hibbard (in preparation) into
optical illusions is looking into the mechanisms behind and ways of measuring
potential discomfort upon viewing the stimuli. This research also looks into the
possibility that excessive neural responses cause optical illusions to occur and cause
discomfort to individuals. “Riloids” used by Zanker in previous research were also
used in this study. Various methods were used to rate participant’s subjective
discomfort judgments, in order to establish a reliable normalised scale. This research
found that spatial frequency had a significant effect upon discomfort, due to contrast
sensitivity. Additionally, mui (“waviness”) of stripes had an effect, although smaller
than that of spatial frequency. Cortical function appeared to have a very important
role in these findings. Spatial frequency has previously had an effect upon
discomfort, as in O’Hare and Hibbard’s research (2011), spatial frequency of 0.375-
1.5 cycles per degree was found to cause more discomfort in observers than higher
5
frequencies. Fernandez and Wilkins (2008) additionally suggest that mid-range
spatial frequencies cause higher discomfort levels.
The two experiments we have conducted in this instance uses the same
images that Zanker and other researchers utilised, in the form of Bridget Riley’s
“Fall”. This research builds upon previous studies into apparent motion but also
discomfort, aiming to find out if there is a relationship between these two subjective
ratings instead of only observing and gathering data based on just one, as in the
other experiments. The independent variables to be altered will be spatial frequency
and mui (waviness). Based on the studies discussed, there is already convincing
evidence linking spatial frequency with both discomfort in optical illusions - mui also
appears to be linked, as in Zanker et al (2010). Our aim is to find out if motion and
discomfort are related by conducting a correlation and if illusory movement is indeed
caused by the motion-detector that Zanker suggests. We will test ratings of
discomfort and perceived illusory motion against varying levels of line waviness and
spatial frequency.
It is hypothesised that a) increasing the waviness (mui) of lines will increase
ratings of both subjective discomfort and perceived illusory motion. It is also thought
that b) increasing the grating (spatial frequency) of lines will have an increasing
effect upon the dependent variables. Additionally, we expect in that c) in experiment
2, observers will find it difficult to keep their gaze steady as mui and spatial
frequency increase. Lastly, we expect that d) there will be a positive correlation
between measures of discomfort and motion ratings, as one increases so will the
other.
Experiment two utilises the methods of eye tracking to observe the
contributions of eye movements to perceived motion. This will give an idea of how
stable observers can keep their gaze whilst viewing the optical illusions. The
relationship between discomfort and motion has yet to be tested, so should provide
6
interesting insight into the field of optical illusions in psychology and provide ground
for further research, dependent upon any effects observed.
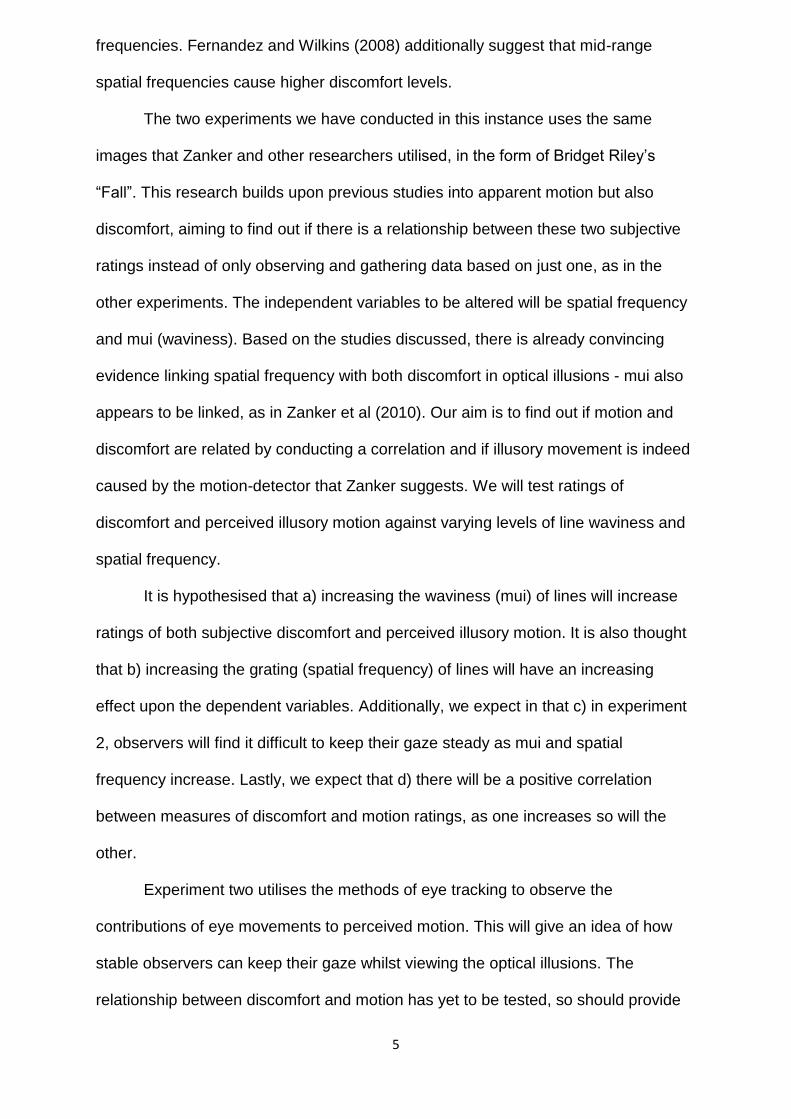
Figure 1. “Fall” by Bridget Riley. Method: Experiment 1 Participants
10 undergraduate students were recruited from the University of Essex, using
opportunity and volunteer sampling. Two of the participants were the experimenters.
Restrictions applied to individuals with migraines or epilepsy, who could not
participate due to the sensitive nature of the images.
Apparatus The experiment was written in Matlab 2013 with the Psychophysics Toolbox
software and presented on a Windows PC. Participants progressed through the
experiment by using the space bar on a QWERTY keyboard. The screen resolution
was 1024x768 and the refresh rate of the monitor was 100Hz.
7
Materials and Stimuli
Participants each took part in one block of 42 trials to rate discomfort and one
block of 42 trials to rate perceived motion, totalling 84 trials per participant. Stimuli
were presented in random order and the order that participants completed the two
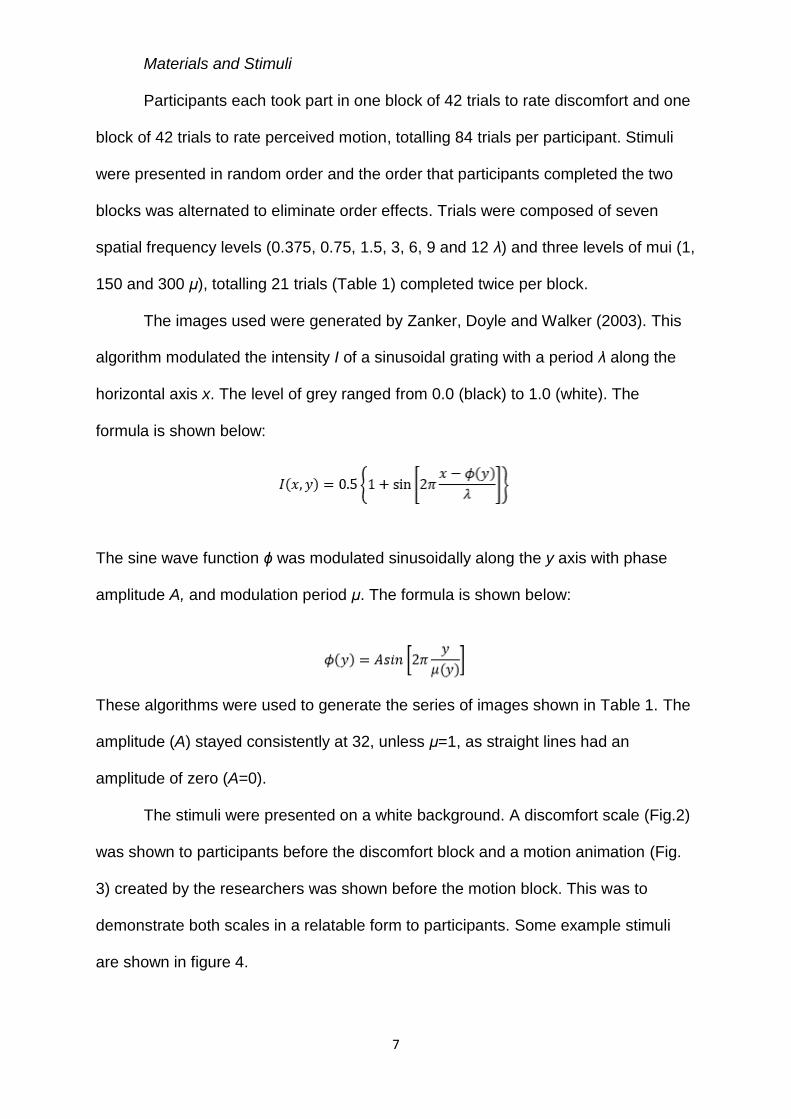
blocks was alternated to eliminate order effects. Trials were composed of seven
spatial frequency levels (0.375, 0.75, 1.5, 3, 6, 9 and 12 λ) and three levels of mui (1,
150 and 300 μ), totalling 21 trials (Table 1) completed twice per block.
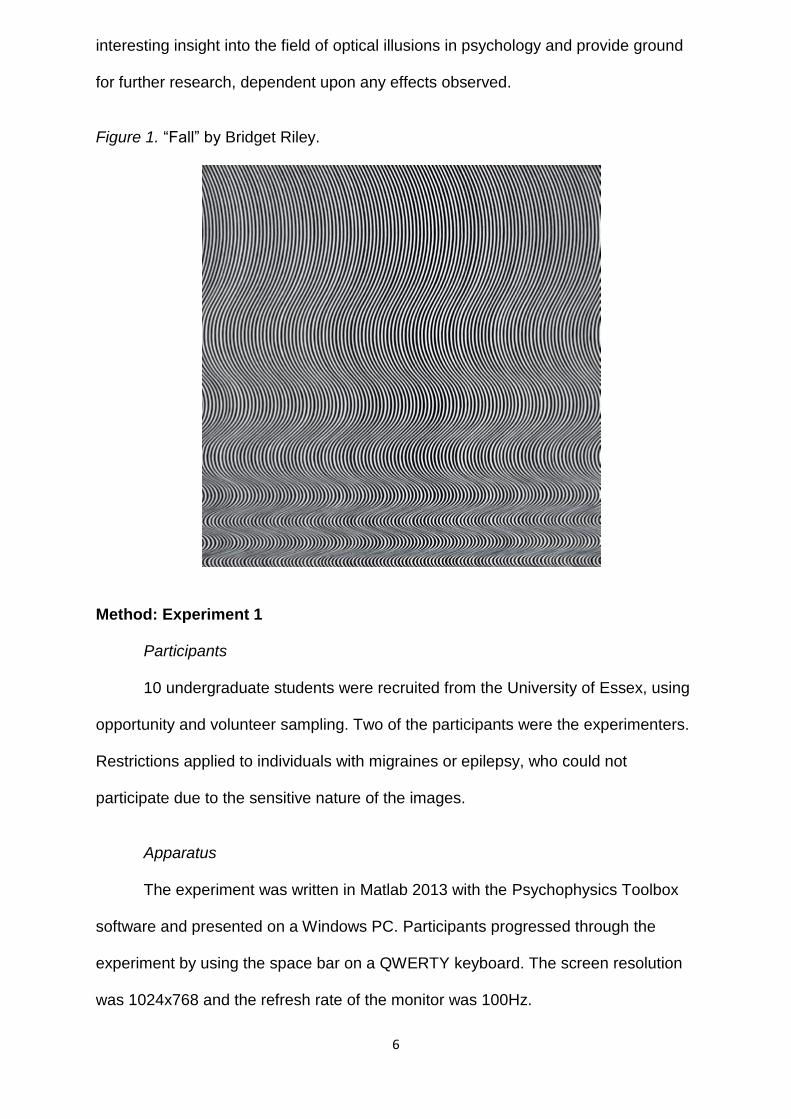
The images used were generated by Zanker, Doyle and Walker (2003). This
algorithm modulated the intensity I of a sinusoidal grating with a period λ along the
horizontal axis x. The level of grey ranged from 0.0 (black) to 1.0 (white). The
formula is shown below:
The sine wave function ϕ was modulated sinusoidally along the y axis with phase
amplitude A, and modulation period μ. The formula is shown below:
These algorithms were used to generate the series of images shown in Table 1. The
amplitude (A) stayed consistently at 32, unless μ=1, as straight lines had an
amplitude of zero (A=0).
The stimuli were presented on a white background. A discomfort scale (Fig.2)
was shown to participants before the discomfort block and a motion animation (Fig.
3) created by the researchers was shown before the motion block. This was to
demonstrate both scales in a relatable form to participants. Some example stimuli
are shown in figure 4.
8
Table 1: The 21 experimental trials.
Figure 2: Example discomfort rating scale (Wong et al. 2001). Figure 3: Example animated motion rating scale.
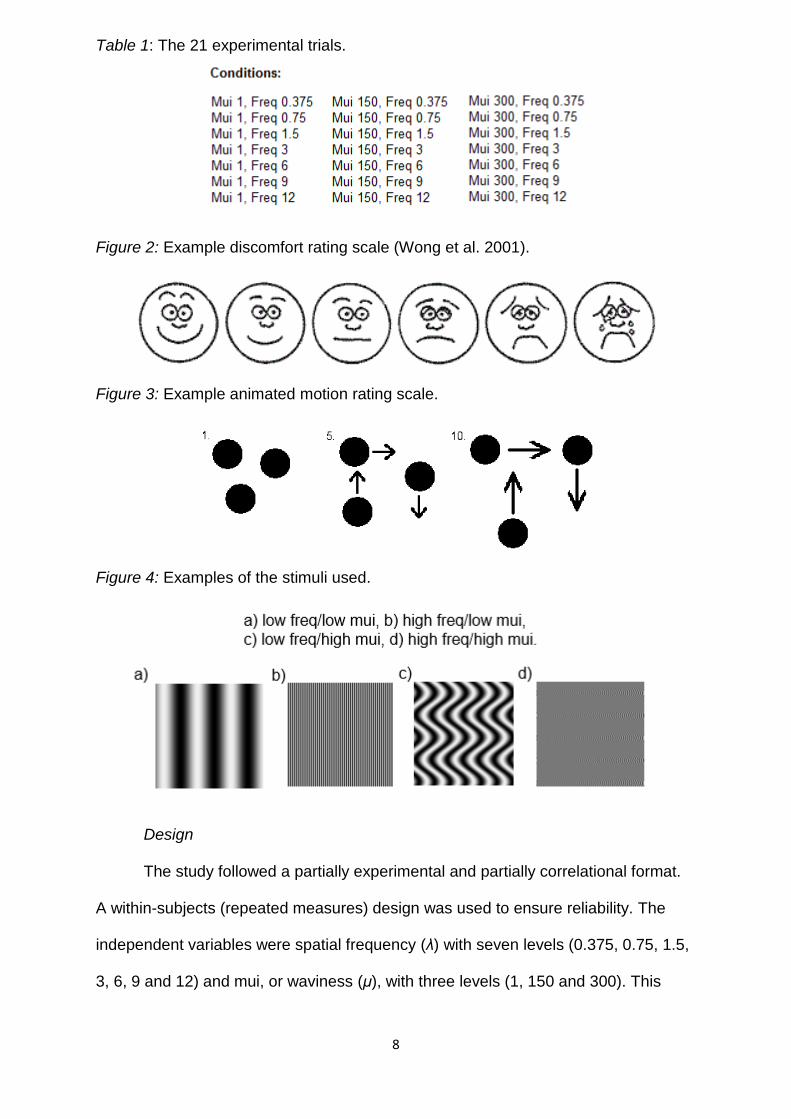
Figure 4: Examples of the stimuli used.
D Design The study followed a partially experimental and partially correlational format.
A within-subjects (repeated measures) design was used to ensure reliability. The
independent variables were spatial frequency (λ) with seven levels (0.375, 0.75, 1.5,
3, 6, 9 and 12) and mui, or waviness (μ), with three levels (1, 150 and 300). This
9
made a total of 21 separate stimuli (Table 1). The dependent variables were
subjective discomfort ratings and ratings of perceived illusory motion, on rating
scales of 1-10. These two variables created the two separate blocks completed by
participants; the “discomfort” and “motion” blocks, of 42 (2x21) trials per block. All
conditions were presented twice per block and in random order for counterbalancing
purposes (84 trials per participant).
Procedure Prior to starting “discomfort” trials, participants were shown a discomfort scale
(Fig. 2) as a point of relation to a 1-10 (1 – lowest discomfort and 10 – highest
discomfort) subjective rating scale. Similarly, prior to “motion” trials, observers were
shown a motion animation (Fig. 3) to relate to the same 1-10 scale for motion. These
examples were used to aid observers in relating the scale to actual feelings of
discomfort and real-life motion. In the experiment, a fixation cross was presented for
50ms, followed by the stimuli for 500ms. The participant would then gave a rating of
1-10 for discomfort or motion, which was spoken aloud and then recorded by the
researchers. The space bar was then pressed by the observer to proceed to the next
trial. Participants were instructed to keep their gaze steady throughout the
experiment and were allowed a short interval between the two blocks to rest. There
were no practice trials prior to the experiment.
Method: Experiment 2
Participants 9 undergraduate students were recruited from the University of Essex, using
opportunity and volunteer sampling. Restrictions applied to individuals with migraines
or epilepsy, who could not participate due to the sensitive nature of the images.
10
Caution was applied to those who wore glasses as eye tracking can be unsuccessful
in some instances.
Apparatus The experiment was written in Matlab 2013 with the Psychophysics Toolbox software
and presented on a Windows PC. Participants progressed through the experiment by
using the space bar on a QWERTY keyboard. The screen resolution was 800x600
and the refresh rate of the monitor was 100Hz. The eye tracking software also
operated from a Windows PC, which was set up prior to and controlled during the
experiment by the researchers. The eye tracking equipment used was an SR
Research Eyelink eyetracker.
Materials and Stimuli Participants each took part in one block of 21 trials to rate discomfort and one
block of 21 trials to rate perceived motion, totalling 42 trials per participant. Stimuli
were presented in random order and the order that participants completed the two
blocks was alternated to eliminate order effects. Trials were composed of seven
spatial frequency levels (0.375, 0.75, 1.5, 3, 6, 9 and 12 λ) and three levels of mui (1,
150 and 300 μ), totalling 21 trials (Table 1) completed once per block. The stimuli
was presented on a white background. A discomfort scale (Fig.2) was shown to
participants before the discomfort block and a motion animation (Fig. 3) created by
the researchers was shown before the motion block. This was to demonstrate both
scales in a relatable form to participants. Some example stimuli are shown in figure
4.
The images used were generated by Zanker, Doyle and Walker (2003). The
algorithms used to generate the stimuli were identical to those used in experiment 1.
The stimuli were presented on a white background. A discomfort scale (Fig.2) was
shown to participants before the discomfort block and a motion animation (Fig. 3)
11
created by the researchers was shown before the motion block. This was to
demonstrate both scales in a relatable form to participants. Example stimuli can be
viewed in figure 4.
Design
The study followed a partially experimental and partially correlational format.
A within-subjects (repeated measures) design was used to ensure reliability. The
independent variables were spatial frequency (λ) with seven levels (0.375, 0.75, 1.5,
3, 6, 9 and 12) and mui, or waviness (μ), with three levels (1, 150 and 300). This
made a total of 21 separate stimuli (Table 1). The dependent variables were
subjective discomfort ratings and ratings of perceived illusory motion, on rating
scales of 1-10. These two variables created the two separate blocks completed by
participants; the “discomfort” and “motion” blocks, of 21 (3x7) trials per block. All
conditions were presented twice per block and in random order for counterbalancing
purposes (42 trials per participant).
Procedure The eye tracking equipment was set up, calibrated and validated to ensure
the equipment had the correct coverage of the right eye of the observer. Prior to
starting “discomfort” trials, participants were shown a discomfort scale (Fig. 2) as a
point of relation to a 1-10 (1 – lowest discomfort and 10 – highest discomfort)
subjective rating scale. Similarly, prior to “motion” trials, observers were shown a
motion animation (Fig. 3) to relate to the same 1-10 scale for motion. These
examples were used to aid observers in relating the scale to actual feelings of
discomfort and real-life motion. In the experiment, a fixation cross was presented for
50ms, followed by the stimuli for 500ms. The participant would then gave a rating of
1-10 for discomfort or motion, which was spoken aloud and then recorded by the
researchers. The space bar was then pressed by the observer to proceed to the next
12
trial. Participants were instructed to keep their gaze steady throughout the
experiment and were allowed a short interval between the two blocks to rest. There
were no practice trials prior to the experiment but the validation of the eye tracking
system ensured that the data collected was consistent in quality.
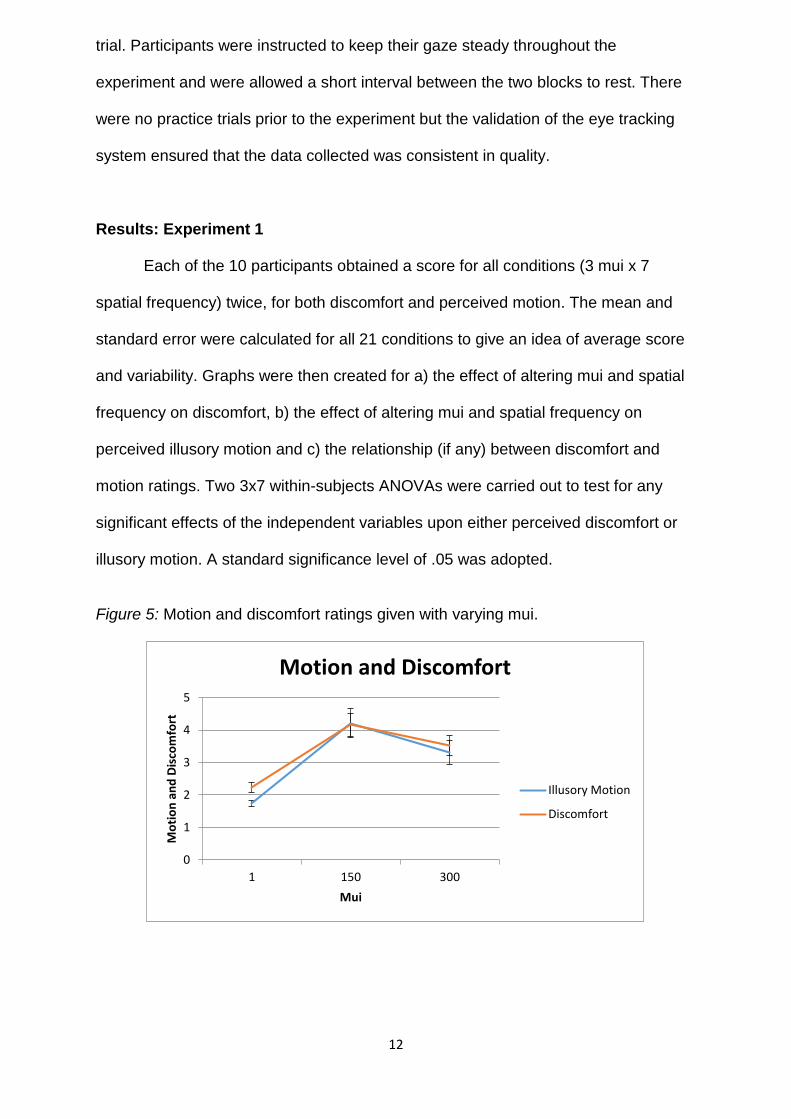
Results: Experiment 1 Each of the 10 participants obtained a score for all conditions (3 mui x 7
spatial frequency) twice, for both discomfort and perceived motion. The mean and
standard error were calculated for all 21 conditions to give an idea of average score
and variability. Graphs were then created for a) the effect of altering mui and spatial
frequency on discomfort, b) the effect of altering mui and spatial frequency on
perceived illusory motion and c) the relationship (if any) between discomfort and
motion ratings. Two 3x7 within-subjects ANOVAs were carried out to test for any
significant effects of the independent variables upon either perceived discomfort or
illusory motion. A standard significance level of .05 was adopted.
Figure 5: Motion and discomfort ratings given with varying mui.
0
1
2
3
4
5
1 150 300
Mo
tio
n a
nd
Dis
com
fort
Mui
Motion and Discomfort
Illusory Motion
Discomfort
13
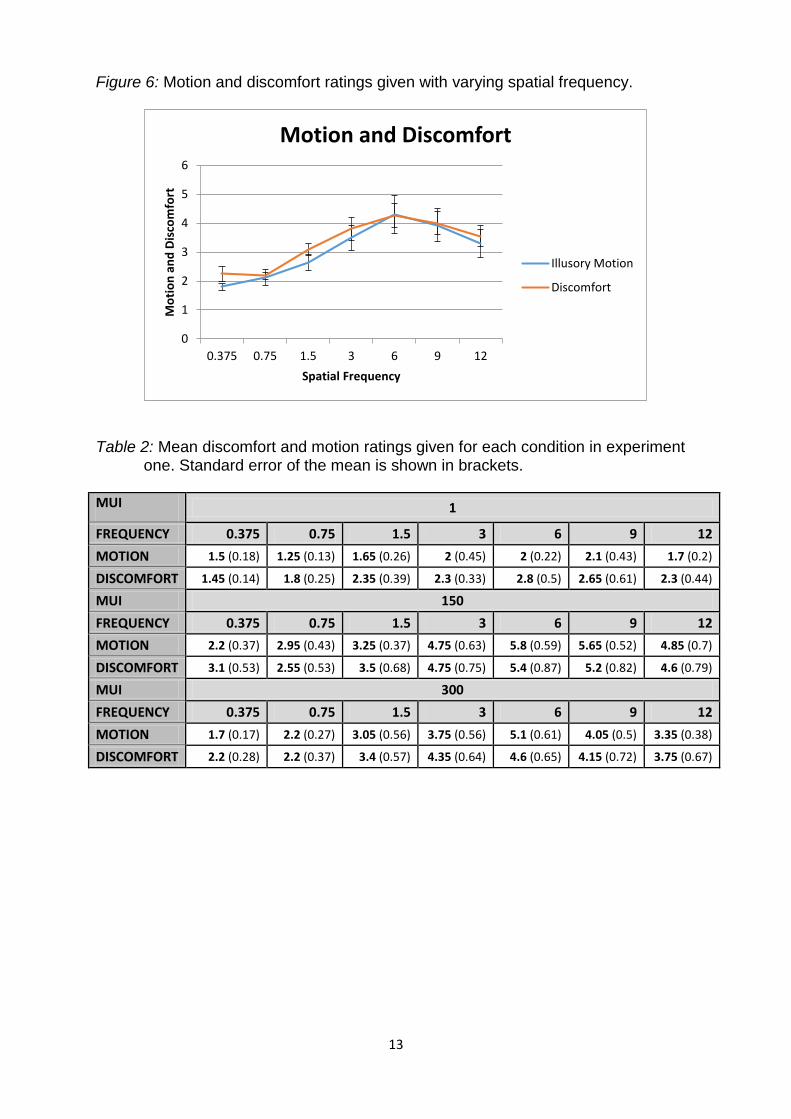
Figure 6: Motion and discomfort ratings given with varying spatial frequency.
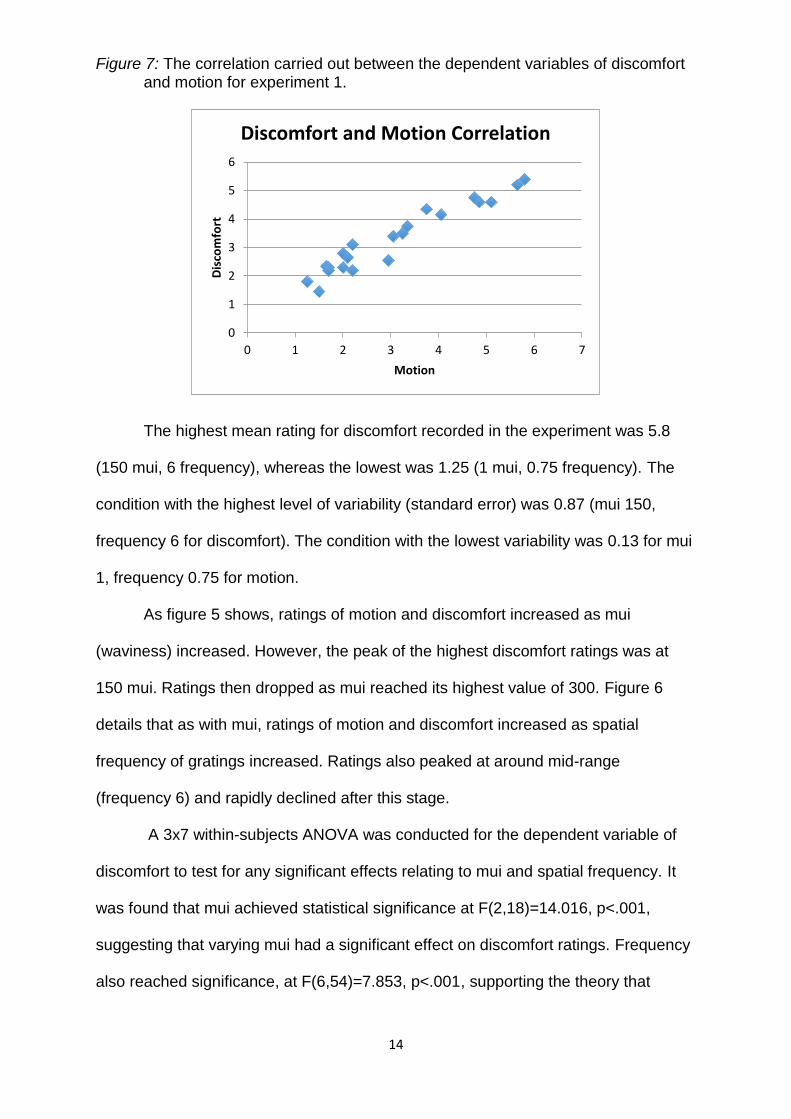
Table 2: Mean discomfort and motion ratings given for each condition in experiment one. Standard error of the mean is shown in brackets.
MUI 1
FREQUENCY 0.375 0.75 1.5 3 6 9 12
MOTION 1.5 (0.18) 1.25 (0.13) 1.65 (0.26) 2 (0.45) 2 (0.22) 2.1 (0.43) 1.7 (0.2)
DISCOMFORT 1.45 (0.14) 1.8 (0.25) 2.35 (0.39) 2.3 (0.33) 2.8 (0.5) 2.65 (0.61) 2.3 (0.44)
MUI 150
FREQUENCY 0.375 0.75 1.5 3 6 9 12
MOTION 2.2 (0.37) 2.95 (0.43) 3.25 (0.37) 4.75 (0.63) 5.8 (0.59) 5.65 (0.52) 4.85 (0.7)
DISCOMFORT 3.1 (0.53) 2.55 (0.53) 3.5 (0.68) 4.75 (0.75) 5.4 (0.87) 5.2 (0.82) 4.6 (0.79)
MUI 300
FREQUENCY 0.375 0.75 1.5 3 6 9 12
MOTION 1.7 (0.17) 2.2 (0.27) 3.05 (0.56) 3.75 (0.56) 5.1 (0.61) 4.05 (0.5) 3.35 (0.38)
DISCOMFORT 2.2 (0.28) 2.2 (0.37) 3.4 (0.57) 4.35 (0.64) 4.6 (0.65) 4.15 (0.72) 3.75 (0.67)
0
1
2
3
4
5
6
0.375 0.75 1.5 3 6 9 12
Mo
tio
n a
nd
Dis
com
fort
Spatial Frequency
Motion and Discomfort
Illusory Motion
Discomfort
14
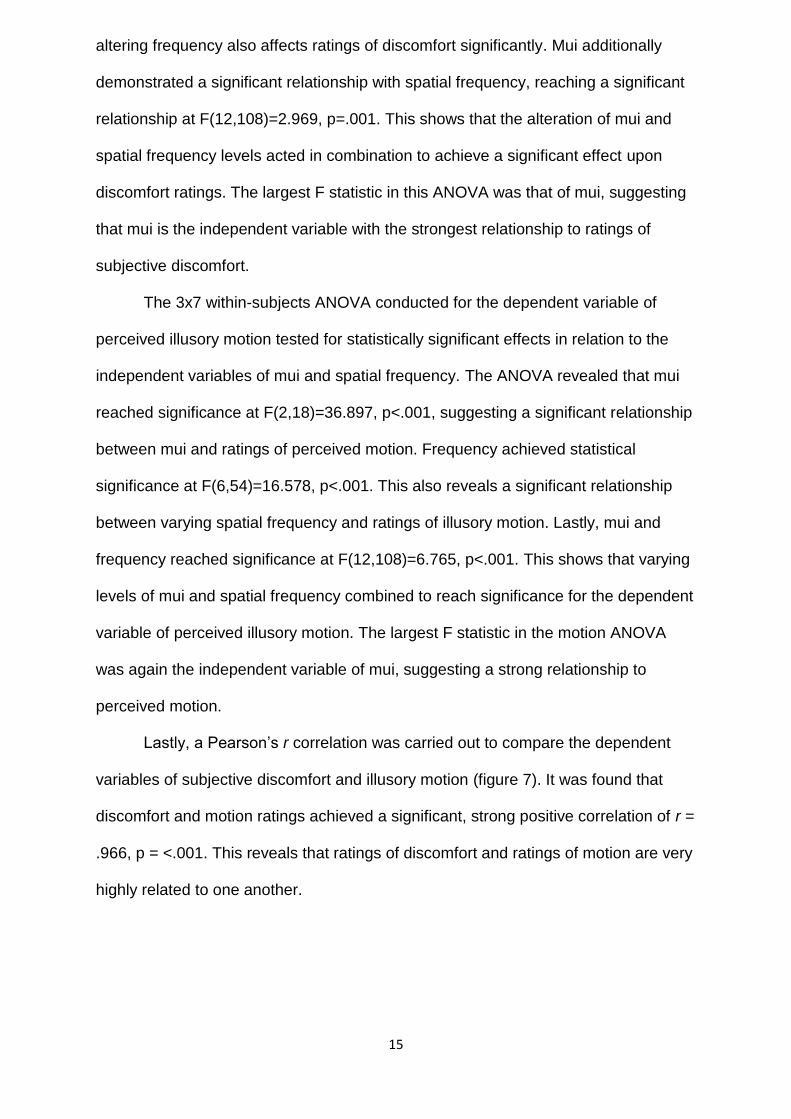
Figure 7: The correlation carried out between the dependent variables of discomfort and motion for experiment 1.
The highest mean rating for discomfort recorded in the experiment was 5.8
(150 mui, 6 frequency), whereas the lowest was 1.25 (1 mui, 0.75 frequency). The
condition with the highest level of variability (standard error) was 0.87 (mui 150,
frequency 6 for discomfort). The condition with the lowest variability was 0.13 for mui
1, frequency 0.75 for motion.
As figure 5 shows, ratings of motion and discomfort increased as mui
(waviness) increased. However, the peak of the highest discomfort ratings was at
150 mui. Ratings then dropped as mui reached its highest value of 300. Figure 6
details that as with mui, ratings of motion and discomfort increased as spatial
frequency of gratings increased. Ratings also peaked at around mid-range
(frequency 6) and rapidly declined after this stage.
A 3x7 within-subjects ANOVA was conducted for the dependent variable of
discomfort to test for any significant effects relating to mui and spatial frequency. It
was found that mui achieved statistical significance at F(2,18)=14.016, p<.001,
suggesting that varying mui had a significant effect on discomfort ratings. Frequency
also reached significance, at F(6,54)=7.853, p<.001, supporting the theory that
0
1
2
3
4
5
6
0 1 2 3 4 5 6 7
Dis
com
fort
Motion
Discomfort and Motion Correlation
15
altering frequency also affects ratings of discomfort significantly. Mui additionally
demonstrated a significant relationship with spatial frequency, reaching a significant
relationship at F(12,108)=2.969, p=.001. This shows that the alteration of mui and
spatial frequency levels acted in combination to achieve a significant effect upon
discomfort ratings. The largest F statistic in this ANOVA was that of mui, suggesting
that mui is the independent variable with the strongest relationship to ratings of
subjective discomfort.
The 3x7 within-subjects ANOVA conducted for the dependent variable of
perceived illusory motion tested for statistically significant effects in relation to the
independent variables of mui and spatial frequency. The ANOVA revealed that mui
reached significance at F(2,18)=36.897, p<.001, suggesting a significant relationship
between mui and ratings of perceived motion. Frequency achieved statistical
significance at F(6,54)=16.578, p<.001. This also reveals a significant relationship
between varying spatial frequency and ratings of illusory motion. Lastly, mui and
frequency reached significance at F(12,108)=6.765, p<.001. This shows that varying
levels of mui and spatial frequency combined to reach significance for the dependent
variable of perceived illusory motion. The largest F statistic in the motion ANOVA
was again the independent variable of mui, suggesting a strong relationship to
perceived motion.
Lastly, a Pearson’s r correlation was carried out to compare the dependent
variables of subjective discomfort and illusory motion (figure 7). It was found that
discomfort and motion ratings achieved a significant, strong positive correlation of r =
.966, p = <.001. This reveals that ratings of discomfort and ratings of motion are very
highly related to one another.
16
Results: Experiment 2
Each of the 9 participants obtained a score for all 21 conditions (3 mui x 7
spatial frequency), for both discomfort and perceived motion (42 scores per
observer). The mean and standard error were calculated for all 21 conditions to give
an idea of average score and variability. Graphs were then created for a) the effect
of altering mui and spatial frequency on discomfort and b) the effect of altering mui
and spatial frequency on perceived illusory motion. Two ANOVAs were carried out to
test for any significant effects of the independent variables upon either perceived
discomfort or illusory motion. A standard significance level of .05 was adopted.
Discomfort and motion were again correlated.
Gaze stability was analysed in relation to first mui and then spatial frequency.
It was then correlated against discomfort and then motion. Unfortunately, eye
tracking was not successful for 6 out of 9 participants, due to a technical fault.
Therefore, only eye tracking data from 3 participants is available for analysis.
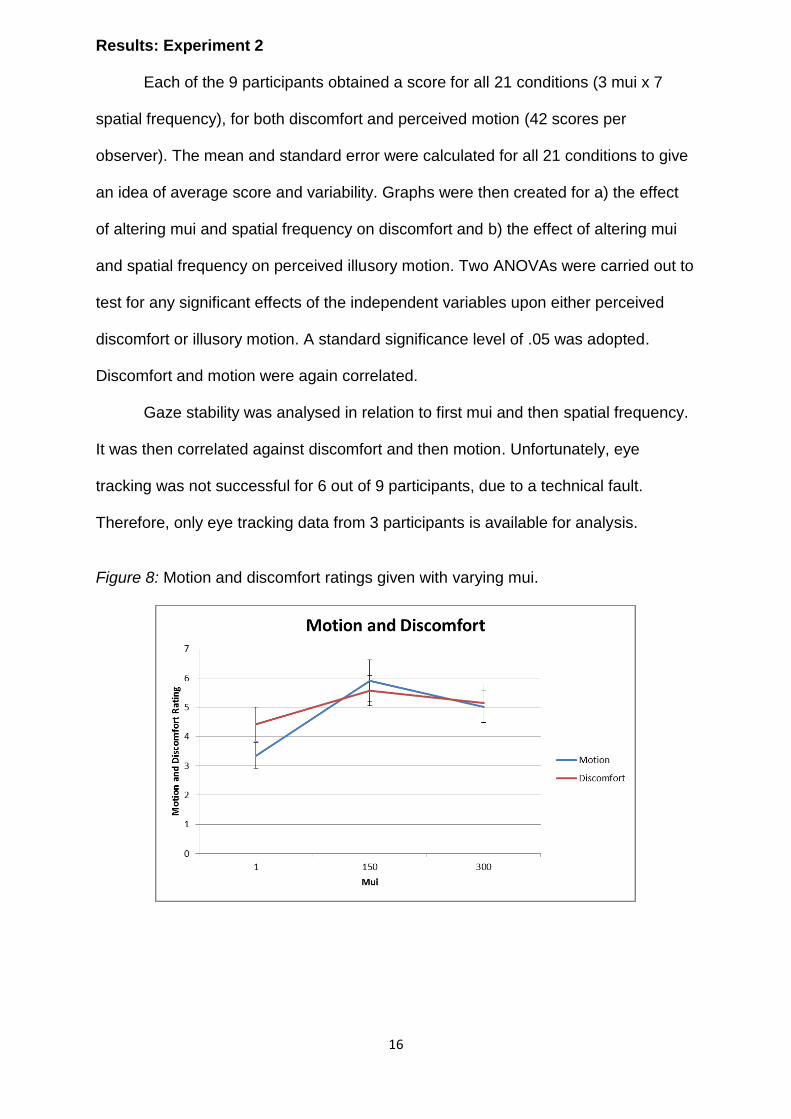
Figure 8: Motion and discomfort ratings given with varying mui.
17
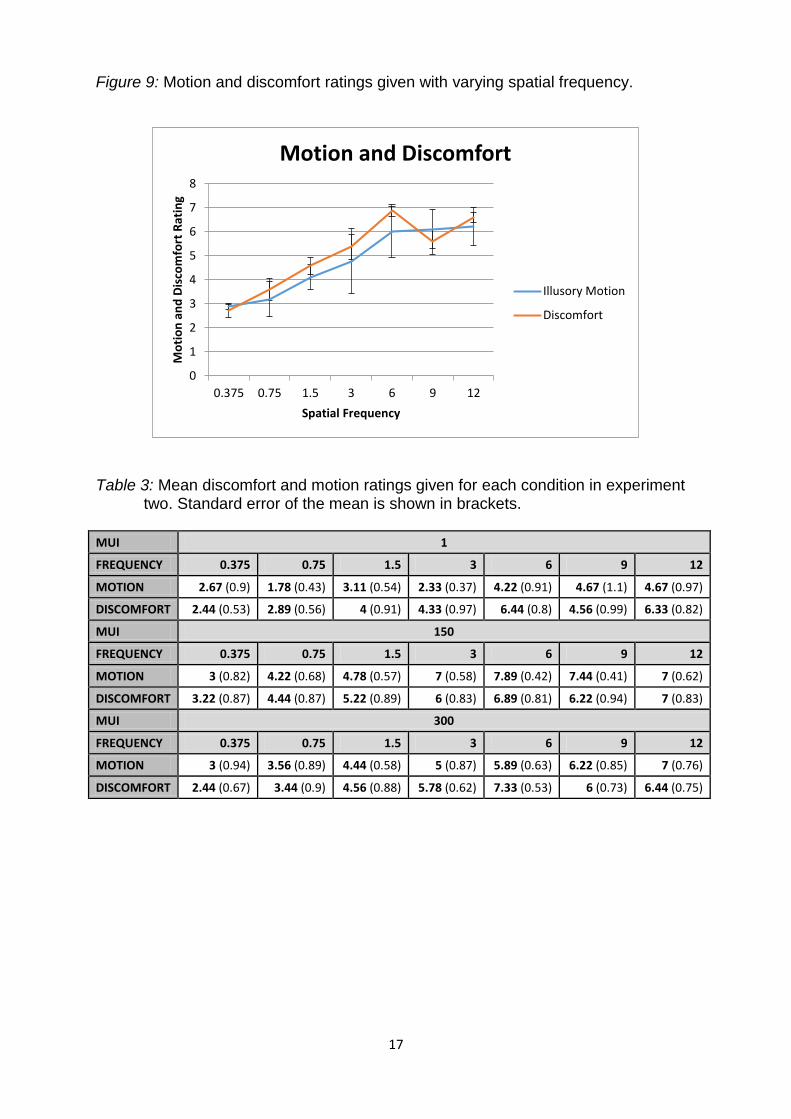
Figure 9: Motion and discomfort ratings given with varying spatial frequency.
Table 3: Mean discomfort and motion ratings given for each condition in experiment two. Standard error of the mean is shown in brackets.
MUI 1
FREQUENCY 0.375 0.75 1.5 3 6 9 12
MOTION 2.67 (0.9) 1.78 (0.43) 3.11 (0.54) 2.33 (0.37) 4.22 (0.91) 4.67 (1.1) 4.67 (0.97)
DISCOMFORT 2.44 (0.53) 2.89 (0.56) 4 (0.91) 4.33 (0.97) 6.44 (0.8) 4.56 (0.99) 6.33 (0.82)
MUI 150
FREQUENCY 0.375 0.75 1.5 3 6 9 12
MOTION 3 (0.82) 4.22 (0.68) 4.78 (0.57) 7 (0.58) 7.89 (0.42) 7.44 (0.41) 7 (0.62)
DISCOMFORT 3.22 (0.87) 4.44 (0.87) 5.22 (0.89) 6 (0.83) 6.89 (0.81) 6.22 (0.94) 7 (0.83)
MUI 300
FREQUENCY 0.375 0.75 1.5 3 6 9 12
MOTION 3 (0.94) 3.56 (0.89) 4.44 (0.58) 5 (0.87) 5.89 (0.63) 6.22 (0.85) 7 (0.76)
DISCOMFORT 2.44 (0.67) 3.44 (0.9) 4.56 (0.88) 5.78 (0.62) 7.33 (0.53) 6 (0.73) 6.44 (0.75)
0
1
2
3
4
5
6
7
8
0.375 0.75 1.5 3 6 9 12
Mo
tio
n a
nd
Dis
com
fort
Rat
ing
Spatial Frequency
Motion and Discomfort
Illusory Motion
Discomfort
18
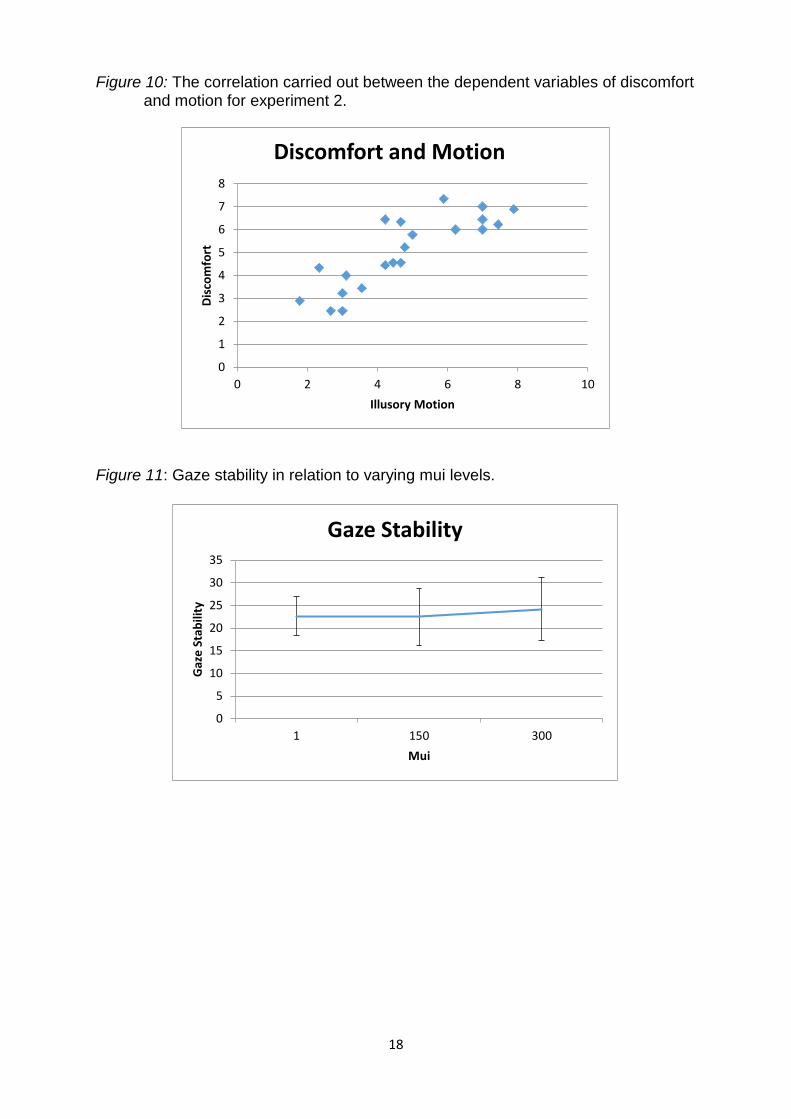
Figure 10: The correlation carried out between the dependent variables of discomfort and motion for experiment 2.
Figure 11: Gaze stability in relation to varying mui levels.
0
1
2
3
4
5
6
7
8
0 2 4 6 8 10
Dis
com
fort
Illusory Motion
Discomfort and Motion
0
5
10
15
20
25
30
35
1 150 300
Gaz
e S
tab
ility
Mui
Gaze Stability
19
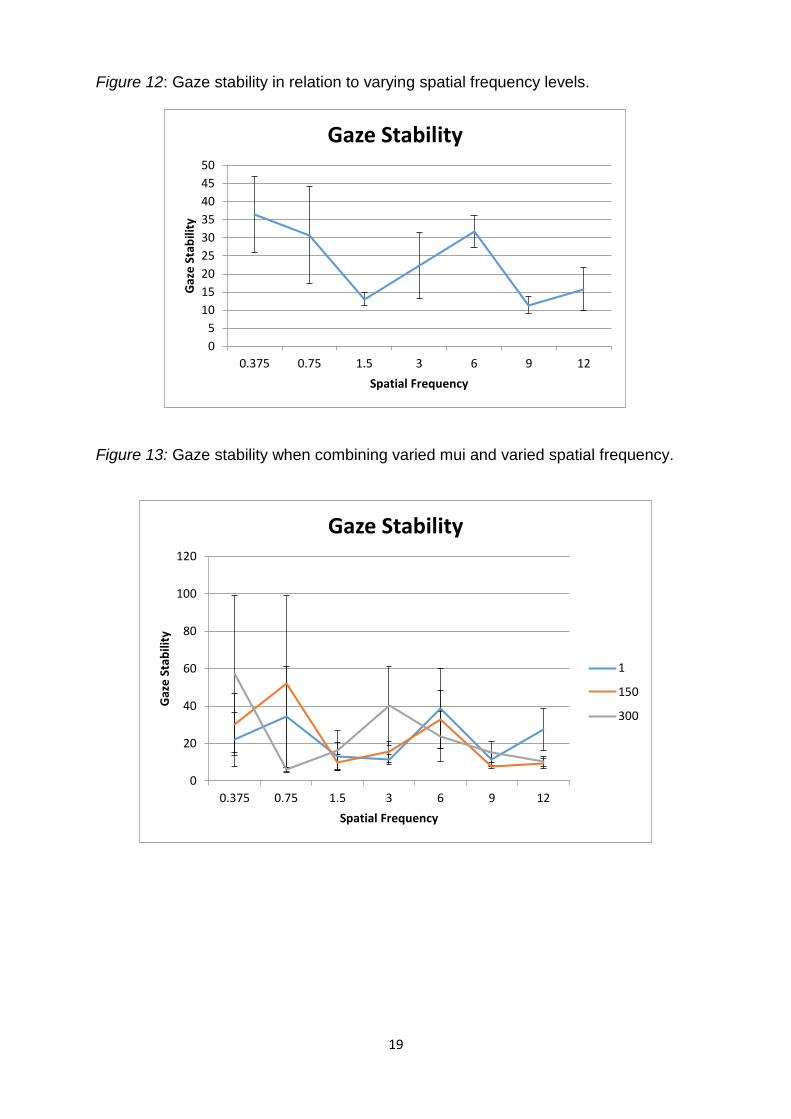
Figure 12: Gaze stability in relation to varying spatial frequency levels.
Figure 13: Gaze stability when combining varied mui and varied spatial frequency.
0
5
10
15
20
25
30
35
40
45
50
0.375 0.75 1.5 3 6 9 12
Gaz
e S
tab
ility
Spatial Frequency
Gaze Stability
0
20
40
60
80
100
120
0.375 0.75 1.5 3 6 9 12
Gaz
e S
tab
ility
Spatial Frequency
Gaze Stability
1
150
300
20
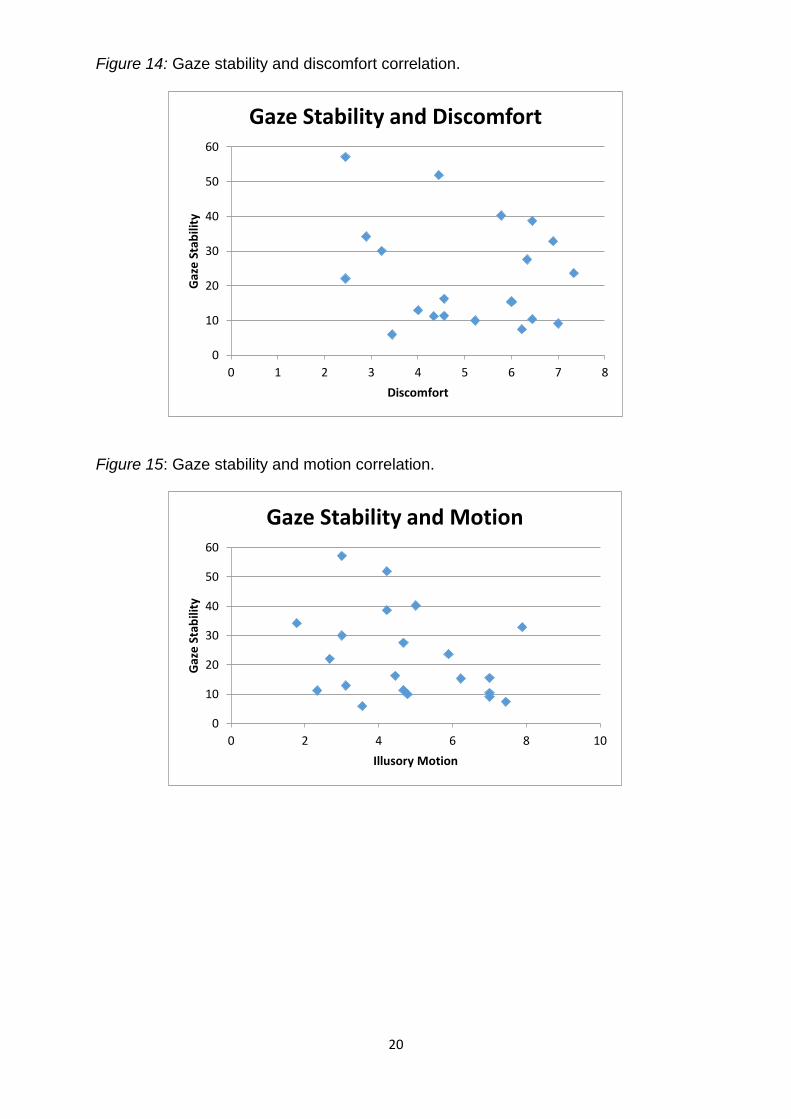
Figure 14: Gaze stability and discomfort correlation.
Figure 15: Gaze stability and motion correlation.
0
10
20
30
40
50
60
0 1 2 3 4 5 6 7 8
Gaz
e S
tab
ility
Discomfort
Gaze Stability and Discomfort
0
10
20
30
40
50
60
0 2 4 6 8 10
Gaz
e S
tab
ility
Illusory Motion
Gaze Stability and Motion
21
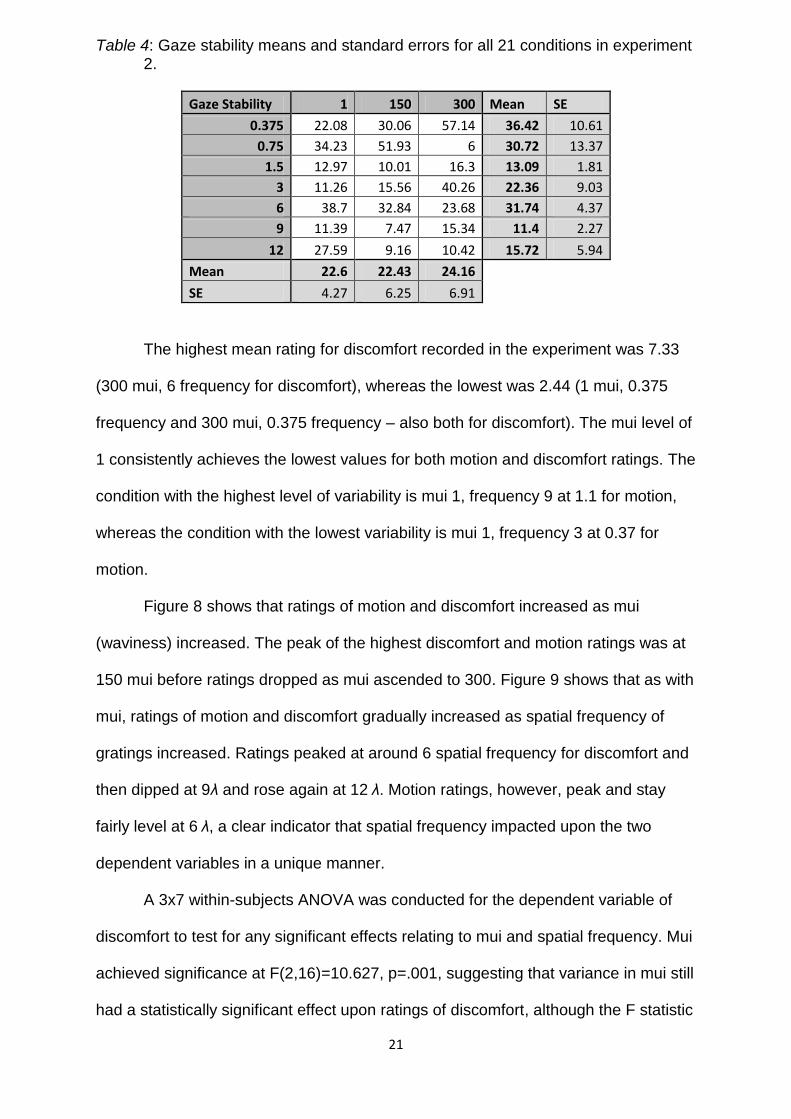
Table 4: Gaze stability means and standard errors for all 21 conditions in experiment 2.
Gaze Stability 1 150 300 Mean SE
0.375 22.08 30.06 57.14 36.42 10.61
0.75 34.23 51.93 6 30.72 13.37
1.5 12.97 10.01 16.3 13.09 1.81
3 11.26 15.56 40.26 22.36 9.03
6 38.7 32.84 23.68 31.74 4.37
9 11.39 7.47 15.34 11.4 2.27
12 27.59 9.16 10.42 15.72 5.94
Mean 22.6 22.43 24.16 SE 4.27 6.25 6.91
The highest mean rating for discomfort recorded in the experiment was 7.33
(300 mui, 6 frequency for discomfort), whereas the lowest was 2.44 (1 mui, 0.375
frequency and 300 mui, 0.375 frequency – also both for discomfort). The mui level of
1 consistently achieves the lowest values for both motion and discomfort ratings. The
condition with the highest level of variability is mui 1, frequency 9 at 1.1 for motion,
whereas the condition with the lowest variability is mui 1, frequency 3 at 0.37 for
motion.
Figure 8 shows that ratings of motion and discomfort increased as mui
(waviness) increased. The peak of the highest discomfort and motion ratings was at
150 mui before ratings dropped as mui ascended to 300. Figure 9 shows that as with
mui, ratings of motion and discomfort gradually increased as spatial frequency of
gratings increased. Ratings peaked at around 6 spatial frequency for discomfort and
then dipped at 9λ and rose again at 12 λ. Motion ratings, however, peak and stay
fairly level at 6 λ, a clear indicator that spatial frequency impacted upon the two
dependent variables in a unique manner.
A 3x7 within-subjects ANOVA was conducted for the dependent variable of
discomfort to test for any significant effects relating to mui and spatial frequency. Mui
achieved significance at F(2,16)=10.627, p=.001, suggesting that variance in mui still
had a statistically significant effect upon ratings of discomfort, although the F statistic
22
is not as strongly supportive as that of experiment one. Frequency reached statistical
significance at F(6,48)=13.671, p<.001, showing that there is an even stronger
relationship between spatial frequency level and discomfort than in the first
experiment. Mui and spatial frequency F(12,96)=.711, p=.737 did not achieve
significance in this instance against discomfort, which implies that when mui and
frequency interact together, there is no significant effect upon ratings of discomfort.
The largest F statistic calculated in this ANOVA was that of frequency’s effect upon
discomfort, showing that this was the independent variable with the largest effect on
subjective discomfort ratings.
Another 3x7 within-subjects ANOVA was carried out for the dependent
variable of motion to test for significant effects of mui and spatial frequency. Mui
achieved significance at F(2,16)=13.001, p=<.001, suggesting that variance in mui
still has a significant effect upon ratings of motion, although not as strong as the
effect observed in experiment one. Frequency reached statistical significance at
F(6,48)=15.046, p<.001, showing that there is a slightly weaker relationship between
spatial frequency level and discomfort than in the first experiment. Mui and spatial
frequency reached significance at F(12,96)=2.068, p=.026. This means that the
interaction of changing mui and spatial frequency had a significant effect upon
motion level ratings. The largest F statistic in this ANOVA was the effect of frequency
upon ratings of perceived motion, suggesting that frequency had the largest effect on
motion ratings.
A Pearson’s r correlation was undertaken to compare the dependent variables
of subjective discomfort and illusory motion (figure 10). It was found that discomfort
and motion ratings achieved a significant, strong positive correlation of r = .842, p =
<.001. This reveals that ratings of discomfort and ratings of motion are very highly
related to one another, as in experiment 1.
23
It is crucial to remember that the gaze stability data discussed here is a limited
representation, as a technical fault lead to data loss. The data analysed here is the
data of 3 participants only (3 discomfort rating data and 3 motion rating data). The
condition with the highest mean eye movement was 300 mui/0.375 frequency
(57.14), whereas the lowest was 300 mui/0.75 frequency (6). The mui with the
highest gaze stability variation is 300 (6.91) and the lowest mui 1 (4.27). The
frequency level with the highest variation was 0.75 (13.37) and the lowest was 1.5
(1.81).
Figure 11 details the change of gaze stability based on the level of mui. Gaze
stability remained almost level at around 23-25, suggesting that mui had little effect
on participant’s ability to hold their gaze. Figure 12 shows how gaze stability altered
based on the level of spatial frequency in stimuli. Eye movement peaks (around 35)
at the lowest frequency of 0.375 and then declines until 1.5, where it rises to around
32 at frequency 6. It then declines again to around 13-15 (9 λ) and rises again at 12 λ
to around 15. Figure 13 displays the gaze stability data in combination with the three
mui levels and seven levels of spatial frequency. There is a general tendency for the
highest eye level movements to appear in mui levels 150 and 300. There is most
variability in eye movement between frequency levels 0.375 and 0.75, whereas level
1 of mui peaks at frequency level 6. The level of 300 mui rises for the second time at
around 3 λ, before falling again.
Correlations were carried out between gaze stability/discomfort and gaze
stability/motion. Figure 14 displays the scatter plot for gaze stability vs discomfort. It
was found that r=-.228, p=.321. This means that as discomfort levels decreased,
more eye movement was observed. Although this demonstrates a negative
correlation, this was not significant. Figure 15 shows the correlation plot for gaze
stability vs reported motion levels. In this case, r=-.284, p=.212. As illusory motion
24
levels decreased, more eye movement occurred. This weak negative correlation was
also not significant.
Discussion: The key findings in experiment 1 were firstly that mui had a significant
relationship with both discomfort levels and perceived illusory motion reports. This
means that the level of mui was predictive of both of these measures. Spatial
frequency also had a significant relationship with both dependent variables and
predicted their outcomes in the same manner. It was also discovered that discomfort
and motion rating levels were very highly correlated.
In experiment 2, mui was found to have a significant relationship with
discomfort and motion ratings still, but to a lesser extent than in the first experiment.
Frequency still achieved statistical significance for discomfort and motion, more so
for discomfort than in the previous experiment. The correlation between discomfort
and motion was still very high. Gaze stability data was incomplete due to a technical
issue with the eye tracker, but eye tracking data for three participants still remained.
Gaze stability demonstrated very weak negative correlations with both subjective
discomfort and perceived illusory motion ratings, but was not statistically significant
in correlation with either dependent variable.
Hypothesis A predicted that increasing mui (waviness) would increase ratings
of both discomfort and perceived motion. This was found to be true until mui reached
the midpoint of 150 for both dependent variables and then declined at 300 mui. This
was the case for both experiments. We can infer from this that the effects of mui
upon both dependent variables is stronger at mid-range; not too low or too high a
waviness.
Hypothesis B stated that by increasing spatial frequency of the grating,
discomfort and motion ratings would also increase. Until mid-range, frequency also
25
had an increasing effect upon the variables and then suddenly dropped. In
experiment 2, however, discomfort ratings peaked again at the highest frequency
level. This also suggests that altering the frequency may be most effective in
initiating feelings of discomfort and creating illusory motion at mid-range (around 6),
where it was not too low nor too high to cause significant illusion or discomfort.
In experiment 2, hypothesis C predicted that observers would find it harder to
keep a steady gaze when mui and spatial frequency increased. Mui seemed to have
little effect upon eye movement, as it remained constant. However, movement in
relation to changing spatial frequency peaked and dropped on a few separate
occasions, most interestingly around mid-range to high frequency. The combination
of changing both mui and spatial frequency levels appears to have levelled out the
previous erratic effects of frequency levels alone. However, there is a general
tendency for eye movements to occur less at the higher end of the scale, particularly
for 150 and 300 μ.
Hypothesis D was that discomfort and motion ratings would positively
correlate and increase respectively to one another. This was found to be true in each
experiment, as discomfort and motion ratings appeared to have a very strong,
positive correlation to one another. However, this created the concern that perhaps
the discomfort and motion concepts used were in fact measuring the same
phenomenon.
When considering gaze stability, the fact that there was very little data is most
likely the reason for the large amount of variability in eye movements. Therefore, it is
not possible to necessarily tell whether participants were able to keep their gazes
within the fixation area. We can, however, tell that there were indeed many saccades
during the experiment, although the exact variability from the fixation point may have
been less if more data was collected. The eye tracking data collected in this
experiment was not supportive of Zanker’s motion-detector network theory, as there
26
was a weak negative correlation between gaze stability and motion – more motion
was observed by participants when the eyes moved less. This could have been due
to the small amount of usable data but could also be explained by another aspect of
Zanker’s 2003 study. The fact that saccades did not lessen in frequency when
observers were presented with control images in Zanker’s research shows that the
eyes are in a constant state of motion, as Ditchburn asserted. Due to individual
differences, some may be less susceptible to motion illusions than others. One
possible theory is that individuals find it harder to keep their gaze stable when
specifically instructed to do so. This still does not support the concept of a motion-
detector network; it is more likely that some of us experience cortical hyper-excitation
as Clarke et al suggest and that dependent on the type of stimuli, illusory motion can
be experienced.
On the other hand, in support of Zanker et al (2010), varying mui was found to
be effective on perceived motion. Furthermore, these experiments provided further
evidence that as in Clarke et al, mui had an effect upon discomfort. Interestingly, mui
demonstrated a very strong relationship with discomfort as well as motion. It can be
inferred from this that as well as spatial frequency, mui is a key factor in the
perception of optical illusions.
O’Hare and Hibbard (2011) detailed that the effect of spatial frequency on
discomfort ratings peaked at around 0.375-1.5 cycles per degree. However, this
research concluded that the peak of both discomfort and motion ratings for spatial
frequency was at 6 cycles per degree. It is a noteworthy comparison but a quite
separate finding from other research. This could have been caused by the
methodological differences between studies. For example, O’Hare and Hibbard used
a viewing distance of around 45cm, whereas specific viewing distance was not
monitored within this research
27
Fernandez and Wilkins (2008) commented that mid-range frequencies would
have a larger effect upon discomfort levels and this has indeed proved to be the
case. However, it has also proved to be the case that mid-range spatial frequency
was most effective at creating illusory motion and also that mid-range mui has the
largest effect on both discomfort and motion ratings. When both mui and spatial
frequency are at mid-range, this effect is also present. This presents an interesting
conclusion for further investigations, as mui and spatial frequency have proven to be
excellent predictors of both subjective ratings in this instance and provide a strong
predictor still when combined.
In relation to the strong positive correlation between discomfort and motion, it is
quite possible that individuals found it hard to differentiate between the two
measures. It is plausible that had a different scale (perhaps a 1-5 instead of 1-10
scale for both measures) been used, participants may have found it easier to rate
stimuli. The fact that both discomfort and motion ratings had a (non-significant) weak
negative correlation with gaze stability still implies that they may measure the same
thing. However, it is totally possible that discomfort and motion are separate
measures that both coincidentally have a very strong relationship to the chosen
variables.
In summary, the interesting findings from these experiments are that discomfort
and motion are highly correlated and that mui and spatial frequency both have strong
effects. The fact that mid-range seems to be the optimum level for causing
discomfort and illusory motion may be due to individual contrast sensitivity combined
with the low clarity of lines that can occur when the two independent variables
interact. Further study into gaze stability is needed to verify these conclusions, as the
small sample size in experiment 2 led to data distortions and more patterns may
have emerged if this issue was rectified. One large area of study that is largely
lacking in this area of study is that of actual brain activity measures. Clearer
28
conclusions could be drawn if there was an accurate picture of cortical activity in
relation to both eye tracking data and subjective measures. This could then highlight
the role in which individual differences contribute to such phenomena and provide
useful insight into the study of visual perception in psychology.
29
References: Clarke A. D. F., O’Hare L., Hibbard P. B. (in preparation). Rating Riloids: Measurement and mechanisms of visual discomfort in Op Art-like images.
Ditchburn R. W. (1973). Eye-movements and visual perception. Oxford, England: Clarendon. (1973). xv 421 pp. Fernandez, D., & Wilkins, A. J. (2008). Uncomfortable images in art and nature. Perception, 37(7), 1098-1013. Khalil, N. M. (1991). Investigations of visual function in migraine using visual evoked potentials and visual psychophysical tests. PhD thesis. University of London. O’Hare, L., Hibbard, P. B. (2011). Spatial frequency and visual discomfort. Vision Research, 51(15), 1767-1777.
Riley B, 1999 The Eye's Mind: Bridget Riley. Collected Writings 1965-1999 (London: Thomas & Hudson)
Wade, N. (1978). Op Art and visual perception. Perception, 7(1), 21-46.
Wong D.L., Hockenberry-Eaton M., Wilson D., Winkelstein M.L., Schwartz P.: Wong’s Essentials of Pediatric Nursing, ed. 6, St. Louis, 2001, p. 1301. Zanker J.M., Doyle M., Walker R. (2003). Gaze stability of observers watching Op
Art Pictures. Perception, 32, 1037- 1049.
Zanker J.M., Hermens F., Walker R. (2010). Quantifying and modeling the strength
of motion illusions perceived in static patterns. Journal of Vision, 10(2):13, 1-
14.