Embed Size (px)
Citation preview
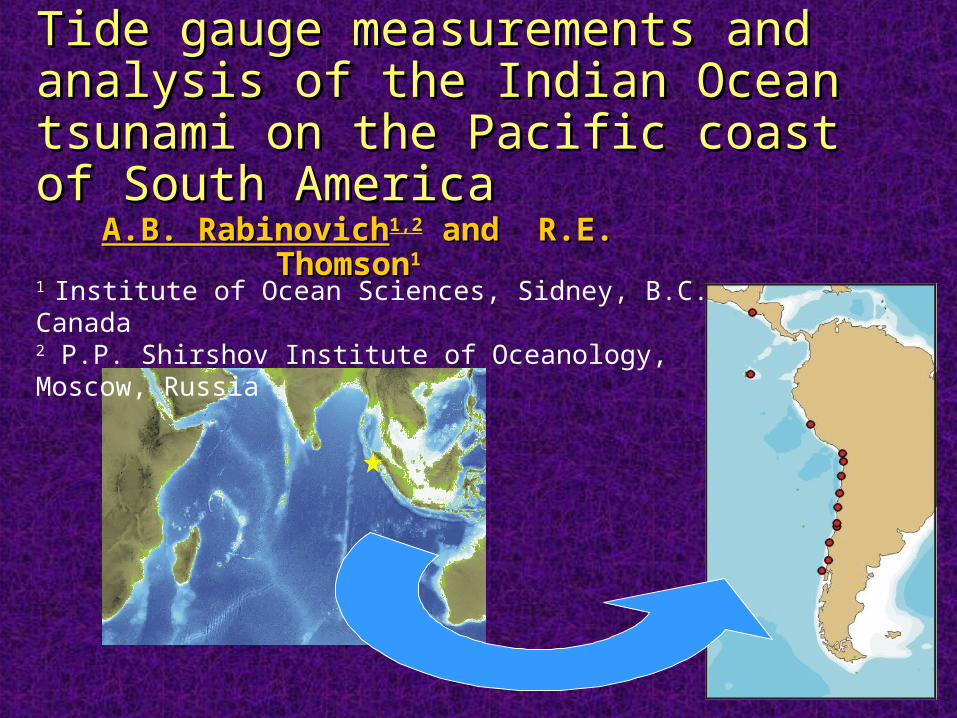
Tide gauge measurements and analysis Tide gauge measurements and analysis of the Indian Ocean tsunami on the of the Indian Ocean tsunami on the Pacific coast of South AmericaPacific coast of South America
A.B. RabinovichA.B. Rabinovich1,21,2 and R.E. Thomson and R.E. Thomson11
1 Institute of Ocean Sciences, Sidney, B.C. Canada2 P.P. Shirshov Institute of Oceanology, Moscow, Russia
>
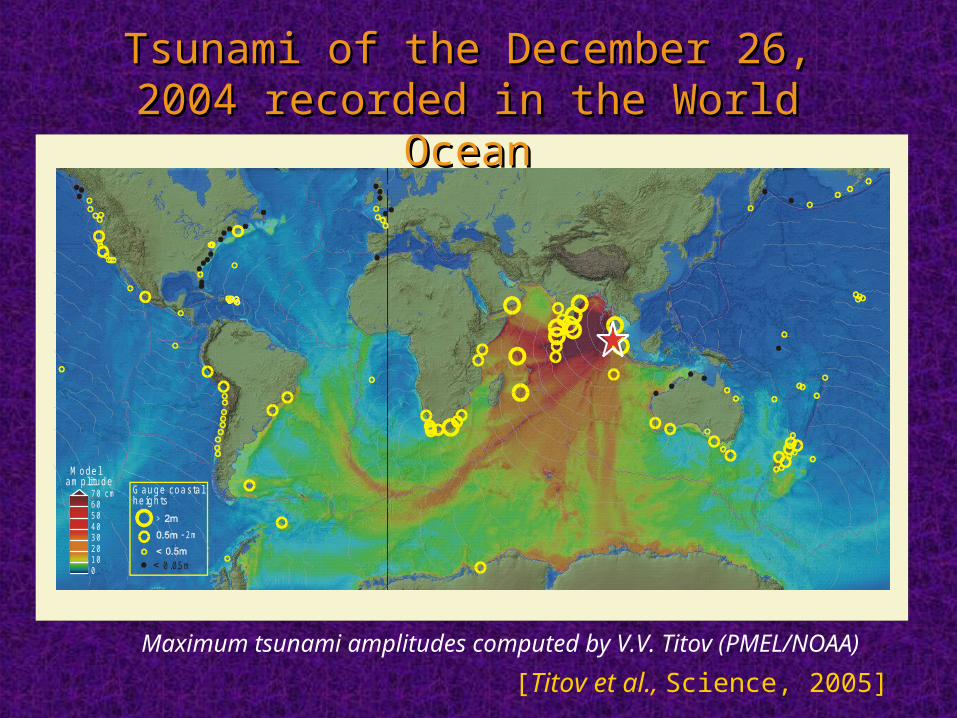
- 2 m
G auge coastalhe ights
M ode l am plitude
7 0 cm6 05 04 03 02 01 00 0.05m
Maximum tsunami amplitudes computed by V.V. Titov (PMEL/NOAA)
Tsunami of the December 26, 2004 Tsunami of the December 26, 2004 recorded in the World Oceanrecorded in the World Ocean
[Titov et al., Science, 2005]
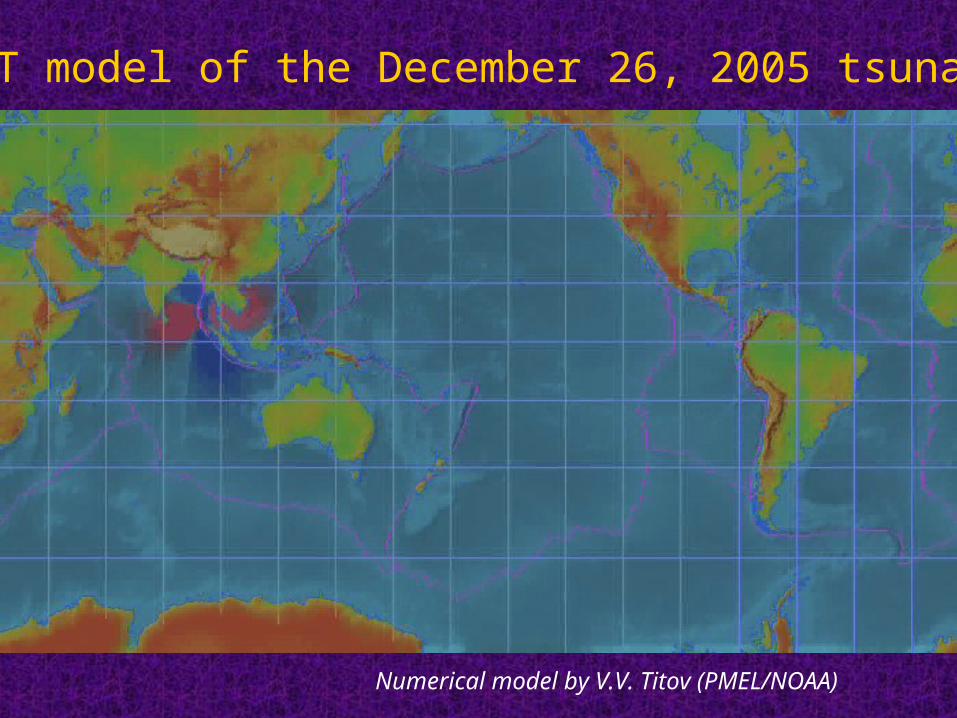
MOST model of the December 26, 2005 tsunami
Numerical model by V.V. Titov (PMEL/NOAA)
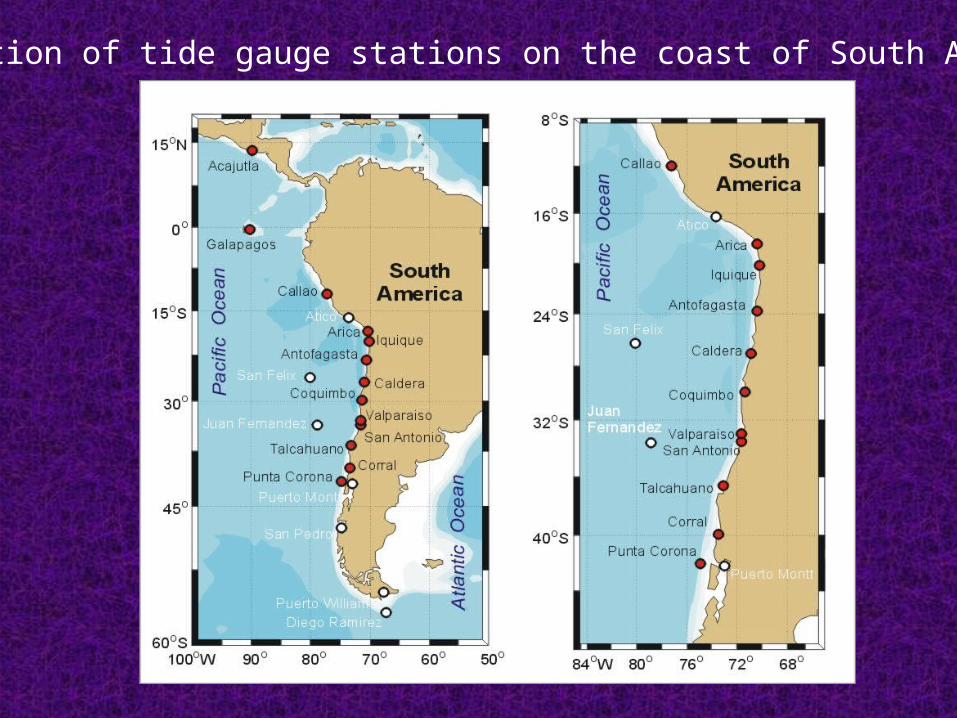
Location of tide gauge stations on the coast of South America
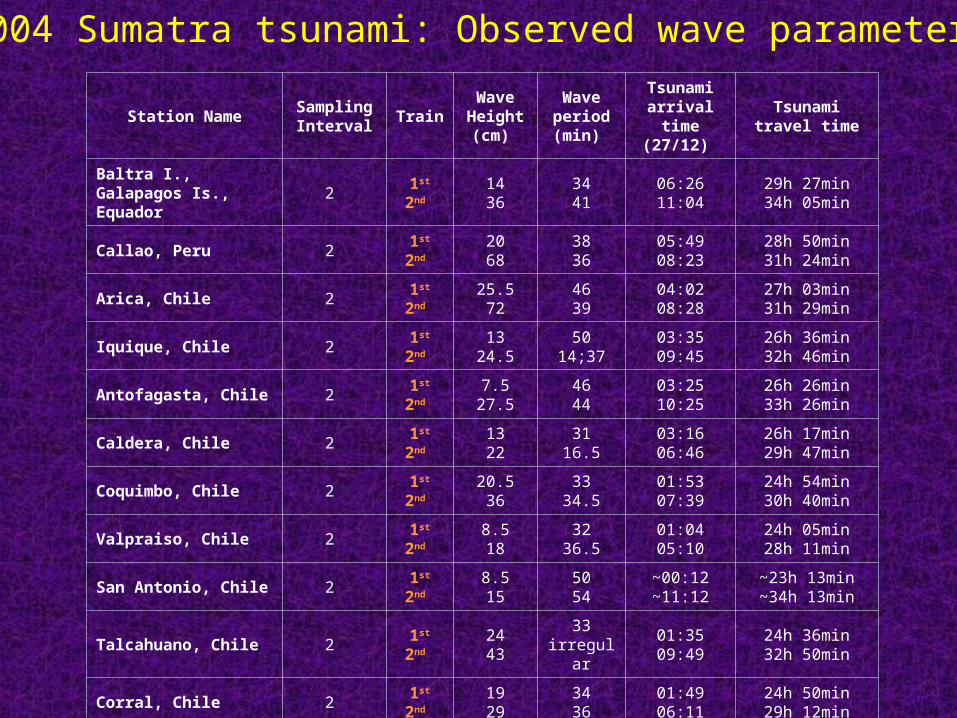
Station NameSampling Interval
TrainWave Height (cm)
Wave period (min)
Tsunami arrival time
(27/12)
Tsunami travel time
Baltra I., Galapagos Is., Equador
2 1st
2nd 1436
3441
06:2611:04
29h 27min34h 05min
Callao, Peru 2 1st
2nd 2068
3836
05:4908:23
28h 50min31h 24min
Arica, Chile 2 1st
2nd 25.572
4639
04:0208:28
27h 03min31h 29min
Iquique, Chile 2 1st
2nd 13
24.550
14;3703:3509:45
26h 36min32h 46min
Antofagasta, Chile 2 1st
2nd 7.5
27.54644
03:2510:25
26h 26min33h 26min
Caldera, Chile 2 1st
2nd 1322
3116.5
03:1606:46
26h 17min29h 47min
Coquimbo, Chile 2 1st
2nd 20.536
3334.5
01:5307:39
24h 54min30h 40min
Valpraiso, Chile 2 1st
2nd 8.518
3236.5
01:0405:10
24h 05min28h 11min
San Antonio, Chile 2 1st
2nd 8.515
5054
~00:12~11:12
~23h 13min~34h 13min
Talcahuano, Chile 2 1st
2nd 2443
33irregular
01:3509:49
24h 36min32h 50min
Corral, Chile 2 1st
2nd 1929
3436
01:4906:11
24h 50min29h 12min
Punta Corona, Chile 2 1st <5 ~20 01:45 24h 45min
2004 Sumatra tsunami: Observed wave parameters
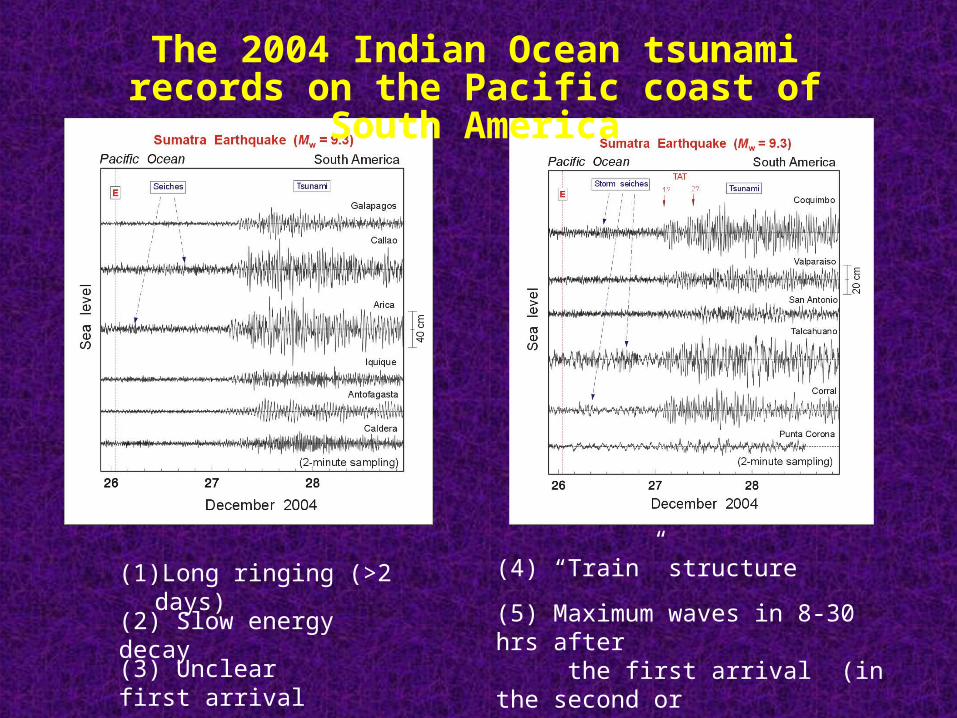
The 2004 Indian Ocean tsunami records on the Pacific coast of South America
(1) Long ringing (>2 days)
(2) Slow energy decay
(3) Unclear first arrival
(4) “Train” structure
(5) Maximum waves in 8-30 hrs after the first arrival (in the second or third train)
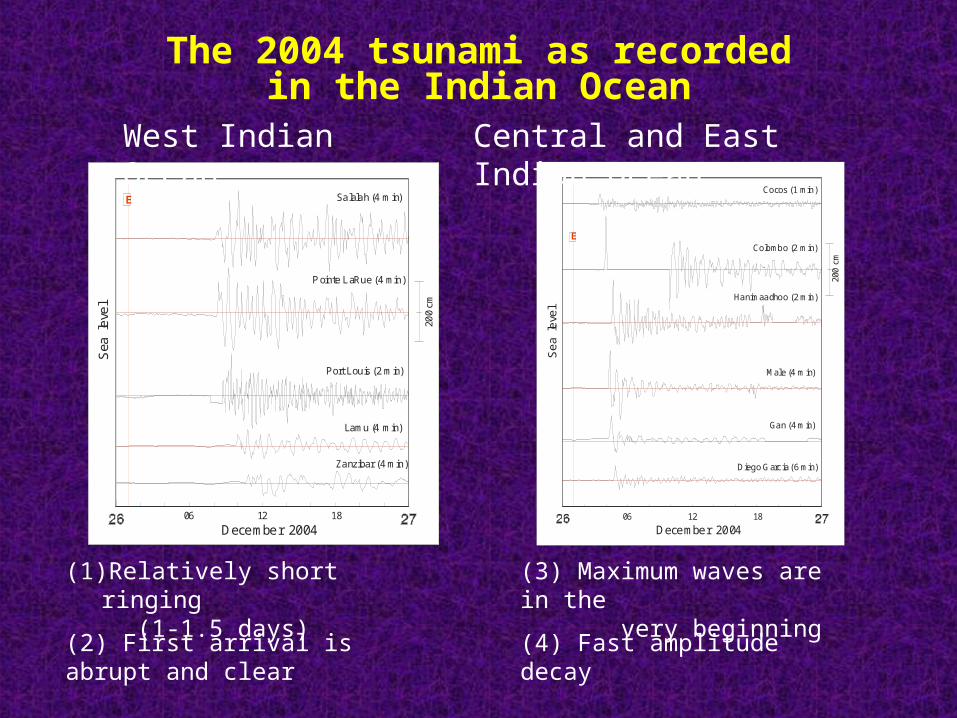
The 2004 tsunami as recorded in the Indian Ocean
200
cm
December 2004
Sea
le
vel
E
Port Louis (2 min)
Lamu (4 min)
Pointe LaRue (4 min)
Salalah (4 min)
Zanzibar (4 min)
06 12 18
West Indian Ocean
200
cm
Hanimaadhoo (2 min)
Male (4 min)
Gan (4 min)
Colombo (2 min)
Cocos (1 min)
Diego Garc ia (6 min)
December 2004
Se
a le
vel
E
06 12 18
Central and East Indian Ocean
(1) Relatively short ringing (1-1.5 days)
(3) Maximum waves are in the very beginning
(4) Fast amplitude decay(2) First arrival is abrupt and clear
S evero K urilsk
20 c
m
TAT
Decem ber 2004
E
A dak I. (AK )
Tsunami
Sea
le
vel
(R ussia)
S and Po in t (A K)
D utch H arbor (AK )
K od iak I. (A K )
1 2
1 2
1 2
1 2
Atm ospherically-induced seiches
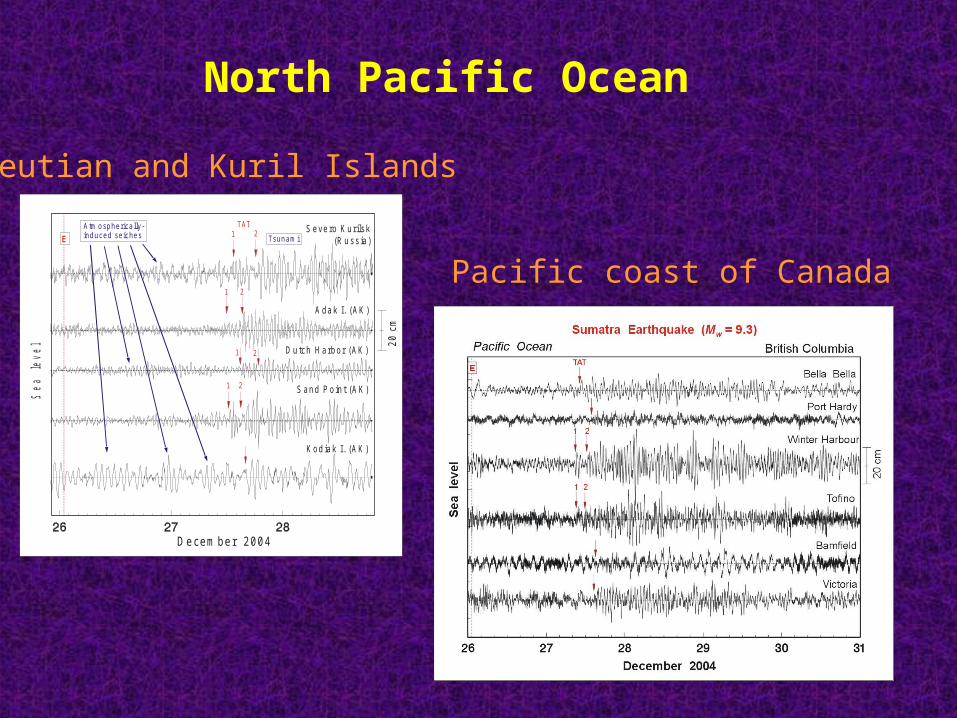
North Pacific Ocean
Aleutian and Kuril Islands
Pacific coast of Canada
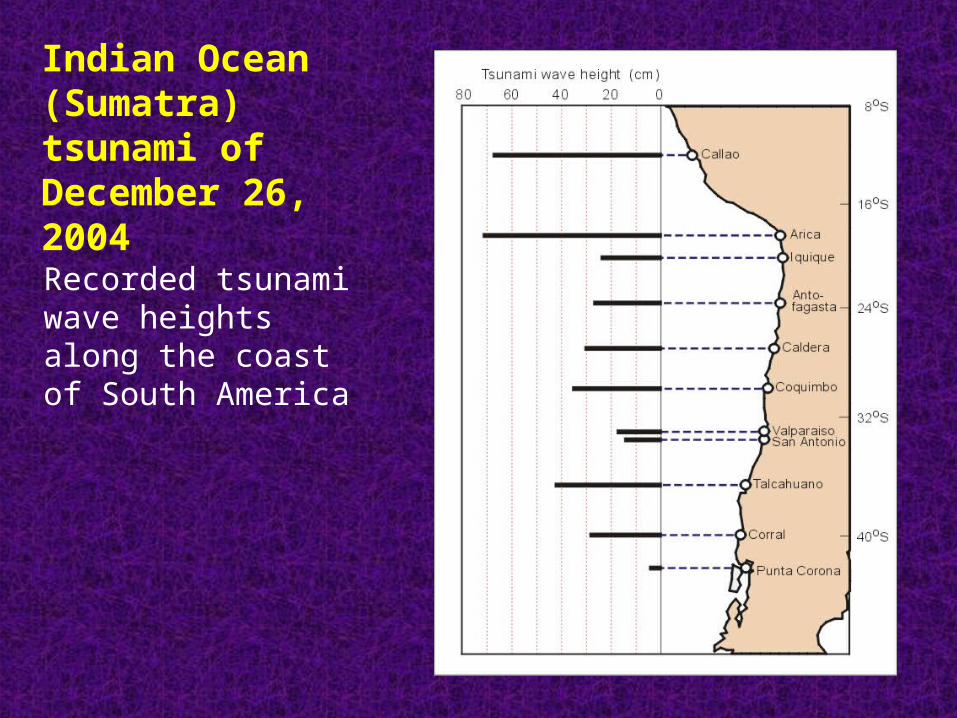
Recorded tsunami wave heights along the coast of South America
Indian Ocean (Sumatra) tsunami of December 26, 2004
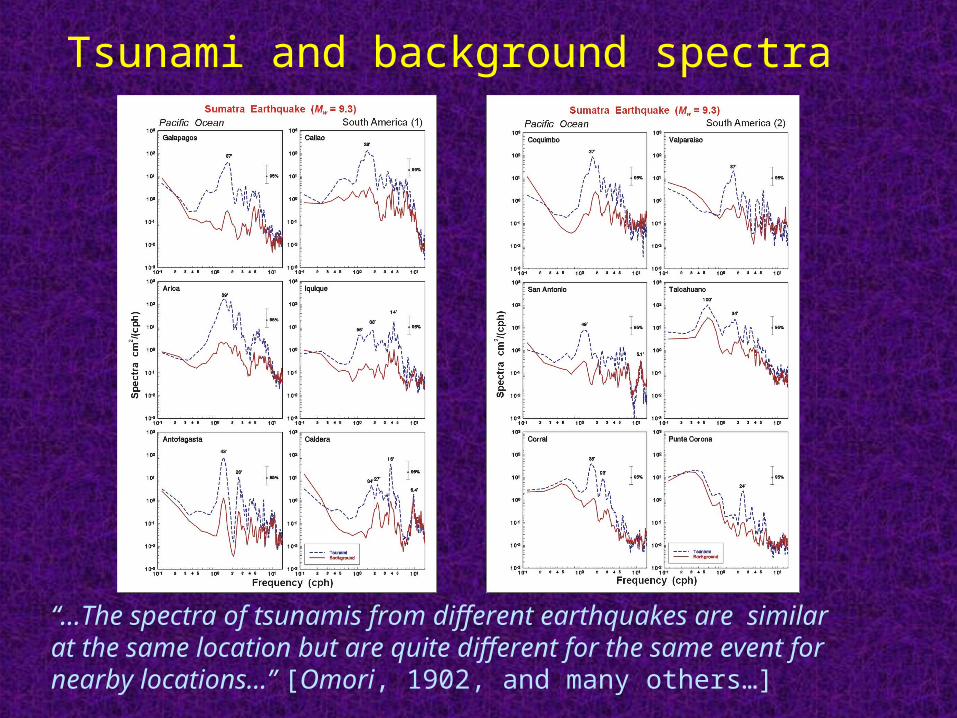
Tsunami and background spectra
“…The spectra of tsunamis from different earthquakes are similar at the same location but are quite different for the same event for nearby locations…” [Omori, 1902, and many others…]
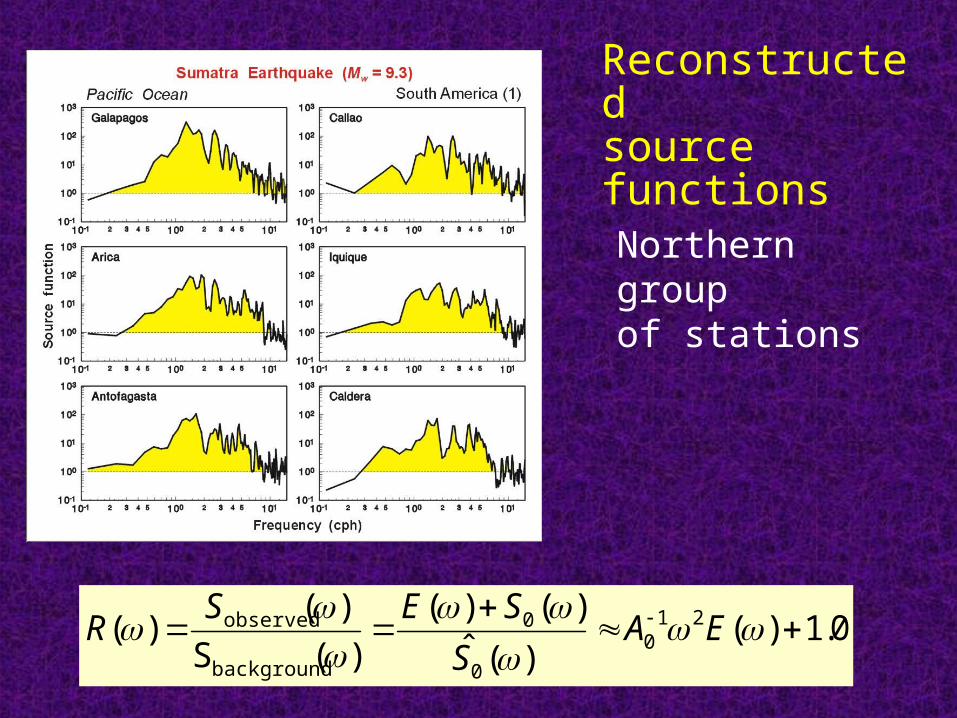
Northern groupof stations
Reconstructed source functions
0.1)()(ˆ
)()(
)(S
)()( 21
0
0
0
background
observed
EA
S
SESR
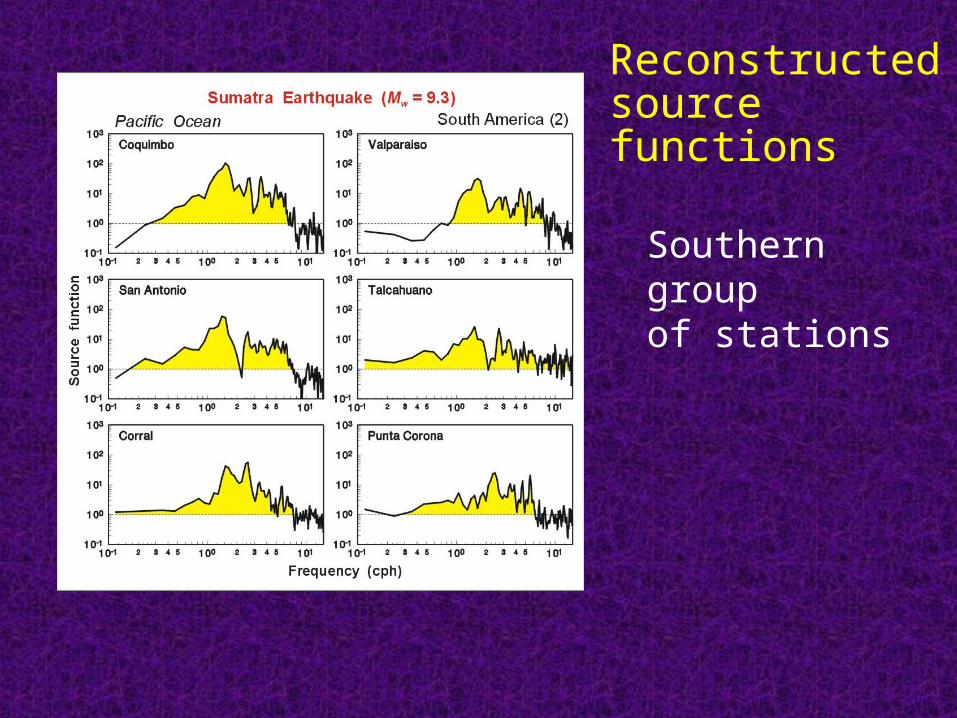
Southern groupof stations
Reconstructed source functions
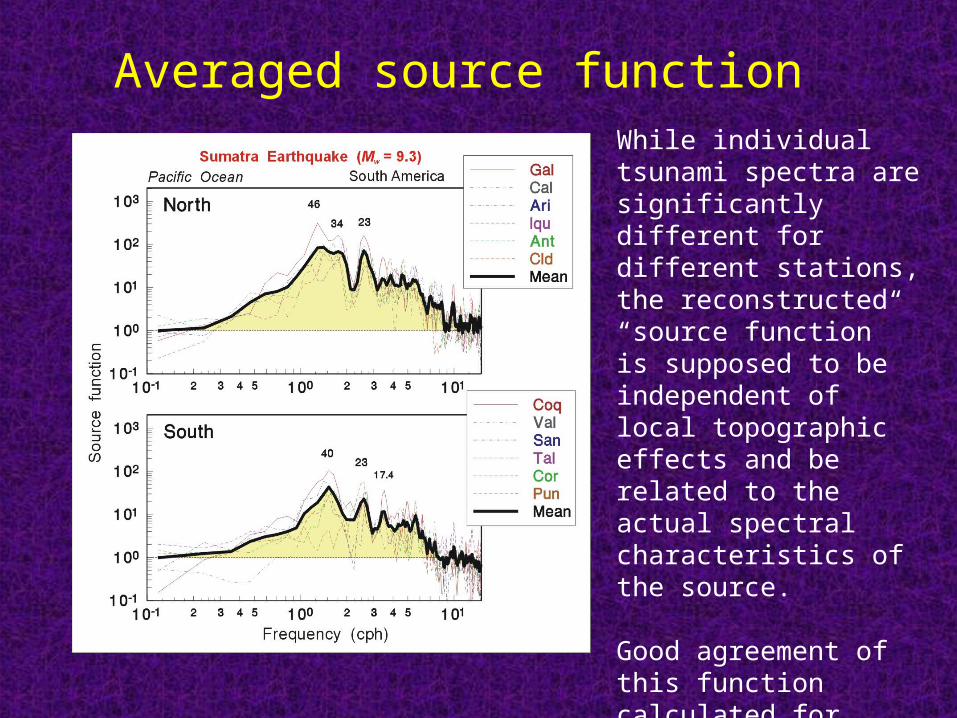
Averaged source functionWhile individual tsunami spectra are significantly different for different stations, the reconstructed “source function” is supposed to be independent of local topographic effects and be related to the actual spectral characteristics of the source.
Good agreement of this function calculated for various sites and different regions supports this assumption.
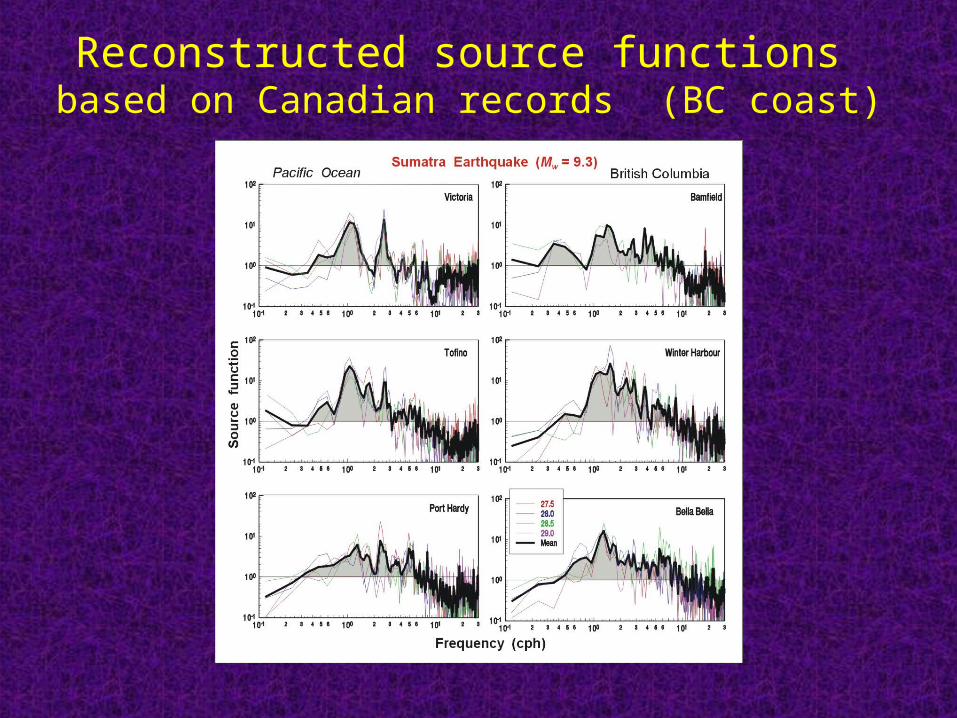
Reconstructed source functions based on Canadian records (BC coast)
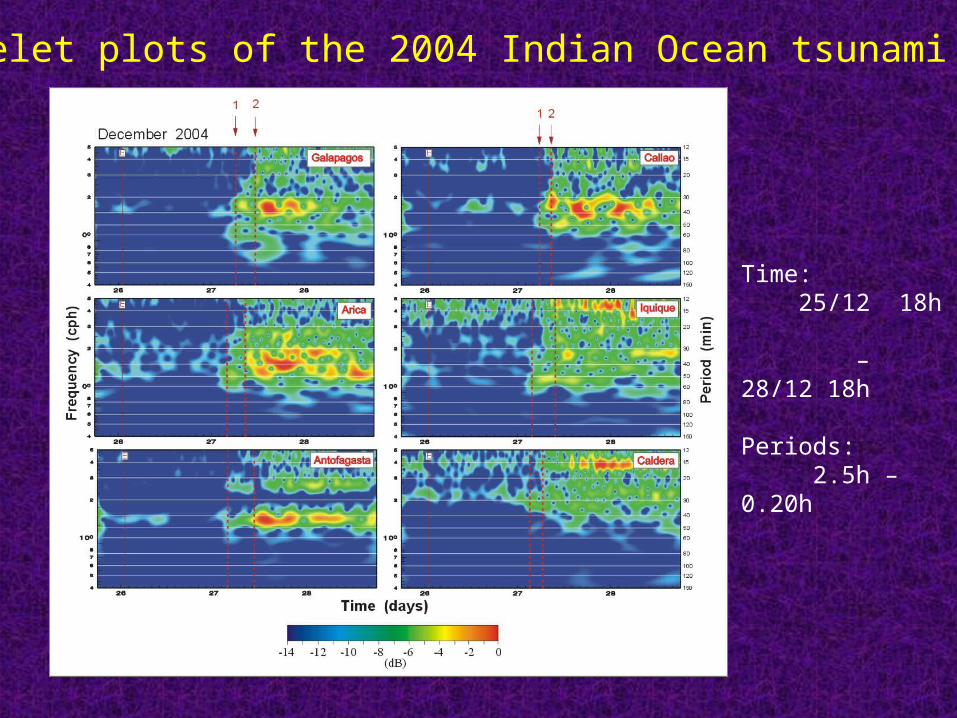
Wavelet plots of the 2004 Indian Ocean tsunami (1)
Time: 25/12 18h – 28/12 18h
Periods: 2.5h – 0.20h
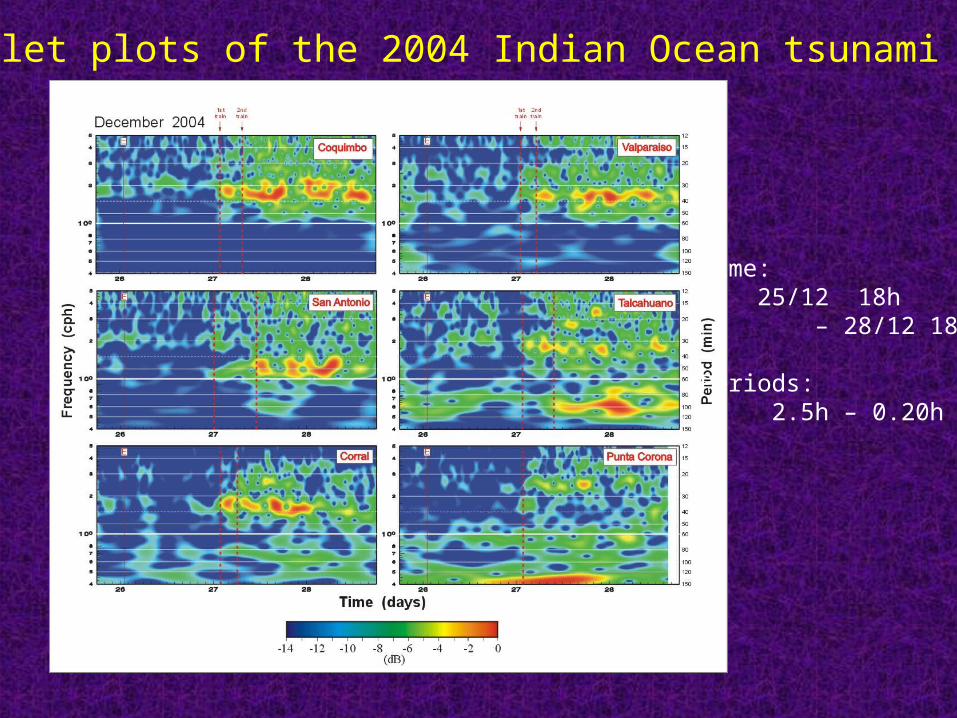
Wavelet plots of the 2004 Indian Ocean tsunami (2)
Time: 25/12 18h – 28/12 18h
Periods: 2.5h – 0.20h
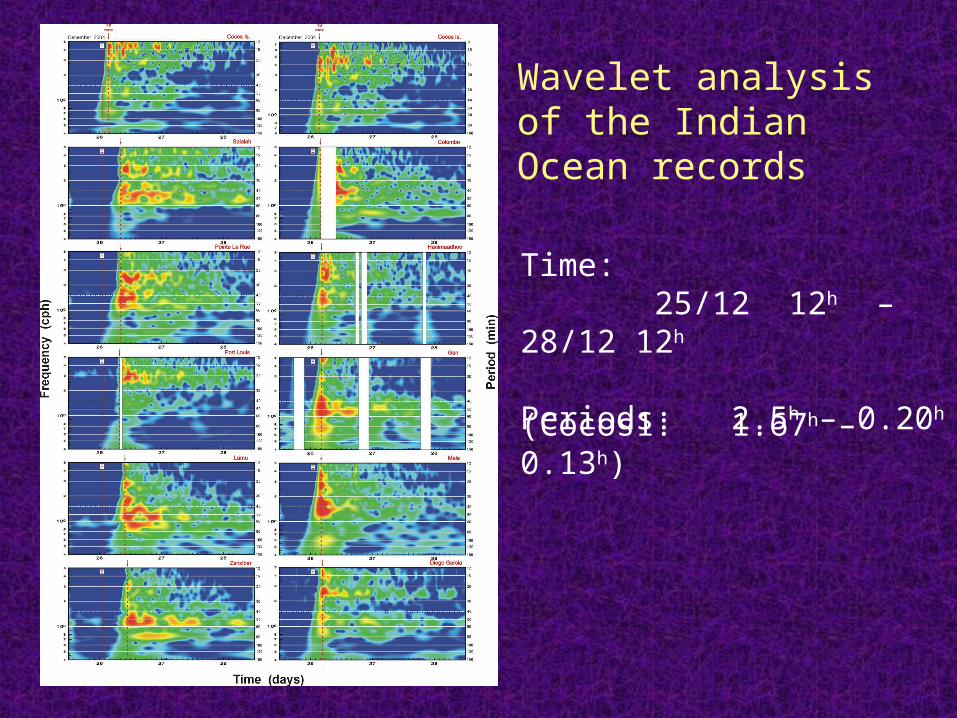
Wavelet analysis of the Indian Ocean records
Time: 25/12 12h – 28/12 12h
Periods: 2.5h – 0.20h
(Cocos1: 1.67h – 0.13h)
Conclusions:Conclusions:1.1. The 2004 Sumatra tsunami was the first global-The 2004 Sumatra tsunami was the first global-
scale tsunami in the “instrumental era” and it was scale tsunami in the “instrumental era” and it was observed throughout the World Ocean, including observed throughout the World Ocean, including the North Pacific, North Atlantic and Antarctic the North Pacific, North Atlantic and Antarctic Oceans.Oceans.
2. This tsunami was clearly measured by tide gauges along the entire Pacific coast of South America with wave heights ranging from a few cm (Punta Corona) to 72 cm (Arica).
3. The resonant characteristics of the shelf and coastline strongly determine the observed features of tsunami waves, in particular wave heights and periods; maximum waves were observed at sites having eigen (natural) periods from 30 to 60 minutes.
4. The recorded tsunami waves are characterized by long ringing (>2days), slow energy decay, and clear train wave structure with maximum waves related mainly to the second or third train (8-30 hours after the first arrival); from this point of view these records are quite different from those observed in the Indian Ocean but similar to those observed in the North Pacific and North Atlantic.
5. The observed spectra of tsunami waves had peaks significantly different for different stations; in contrast, these peaks were in good agreement with background peaks at the same sites. Significant tsunami oscillations were observed at stations with local resonant periods of 30-50 min, apparently corresponding to the periods of arriving tsunami waves.
6. In contrast to individual tsunami spectra, the reconstructed “source function” is found to be very consistent and almost independent of local topographic effects and is apparently related to the spectral characteristics of the source.


![Mor & Rabinovich-Einy - law.haifa.ac.illaw.haifa.ac.il/images/documents/Relational MP - Mor - Rabinovich... · MOR & RABINOVICH-EINY.DOCX (DO NOT DELETE) 5/11/2012 2:36 PM 2012] RELATIONAL](https://img.pdfslide.us/doc/110x75/5baa17da09d3f221798bb9de/mor-rabinovich-einy-lawhaifaacillawhaifaacilimagesdocumentsrelational.jpg)