Embed Size (px)
Citation preview

Instrumentación Revista Mexicana de Fisica 40, No. 3 (199,) •• 7-,58
Three-dimensional gauging by electronie moiréeontouring*
R. ROORÍCUEZ- VERACentro de Investigaciones en Optica, A. C.
Apartado postal 1-948, 37fJoo León, Guanajuato MéxicoRecibido el 15 de diciembre de 1993; aceptado el 15 de febrero de 1994
ABSTRACT. Three-dimensional gauging involves the measurement and mapping of three-dimen-sional surfaees. Gauging accuracy depends on measurement accuracy in the images, image seale,and stereo-geometry. In industrial applications such as for quality control, multiple cameras areoften needed to provide adequate stereoscopic coverage of the object. This paper reports anopto-electronic technique for obtain shape gauging from a diffuse object using just one camera.The surface to be measured is modulated by a linear fringe pattern that is projected using aconventional slide projector. In order to obtain a contour map of the surface, demodulation iscarried out electronically producing a moiré patlern. Digital image processing by a computer,linked to the opto-electronic device is employed to determine the surface shape.
RESUMEN.La calibraci6n tridimensional involucra la medida y mapeo de superficies tridimensio-nales. La exactitud de la calibraci6n depende de la exactitud en las imágenes, de la escala y laestereogeometría. En aplicaciones industriales, tales como control de calidad, son frecuentementenecesarias varias cámara.', para proporcionar un intervalo estereoscópico adecuado del objeto. Esteartículo reporta una técnica optoelectrónica para obtener medición de forma de un objeto difuso,empleando s610una cámara. La superficie a medir es modulada por un patr6n de franjas liueal queson proyectadas usando un proyector de transparencias convencional. Con el fin de obtener un mapade contornos de la superficie, la demodulaci6n es llevada a cabo electr6nicamente produciendo unpatr6n de moiré. Para determinar la forma de la superficie, se emplea procesamiento digital deimágenes mediante una computadora ligada al instrumento optoelectrónico.
PAes: 89.20.+a; 42.80.-f; 42.30.Va
1. INTROOUCTION
Gauging is an important process in manufacturing, and computer vision has airead y gai-ned widespread applications for gauging in two dimensions. The ability of vision systemsto perform 2-D measurement for process and quality control is one of the major impetusesfor recent development of computer vis ion techniques [1]. The challenge in 3-D gaugingis the development of hardware and software for automated operation to achieve theaccuracy and speed that are usually needed in a manufacturing environment. Industrialmeasurement applications include many tasks that are time critica!. While faster mea-surement techniques are always desirable, there are also certain levels of accuracy andrepeatability that must be maintained.
-Part of this work was carried out at Loughborough University of Technology, England.
448 R. RODRÍGUEZ-VERA
Three-dimensional gauging based on fringe projection has been known for a longtime [2-8]. The most common methods involve projection of (a) optical interferencefringes [2,3] or (b) a physical grating [4-8). The former approach requires coherent lightsources such as a laser to produce interference fringes obtained by the superposition of twoplane wavefronts. The target surface is placed in the interference field in such way that thefringes are deformed accordcing to the shape of the surface. In the second approach (b),a grating is imaged on the surface target by using a conventional slide projector in whitelight illumination. The grating image is again deformed by the surface shape. A thirdmethod that uses coherent or incoherent illumination has been investigated by the aut-hor [9]. This approach is based on the Talbot eífect, ¡.e., the imaging of a periodic objectwithout using an optical system (self-imaging). The Talbot image of a linear grating, incollimated illumination, is formed on the target that is spatially modulated by the shapeof the surface. By imaging the deformed grating on a second grating placed on aplanedisplaced angularly with respect to the first, a contour map is created. The technique wasused as a means to discriminate between hills and valleys of the object by using whitelight illumination [10].This can be achieved by associating a diíferent colour Talbot planewith a diíferent plane of the target. One major disadvantage of this technique (as well asthe interference fringe projection) is related to the object size to be tested. It must be atleast the same size as the collimation optical system field.In earlier work, moiré patterns had been formed by double exposure of the projected
fringes onto photographic film [41. The arrival of the low cost microcomputer, togetherwith CCD- based opto-electronic system for fast detection of information, has left photo-graphic techniques behind. Similar to the electronic speckle contouring (ESC) technique inelectronic speckle pattern interferometry (ESPI) [11], fringe projection moiré can be usedto obtain the topography of an object by "grid" contours [7,8], ¡.e., a set of deformed linessuperimposed on the surface target; and "depth" contours, a set of fringes whose depth isequidistant to a reference plane [4-6). The first method requires direct processing of thedeformed grating without using a second one. Projection moiré contouring where depthcontours are obtained requires imaging of the deformed grating on a second referencegrating.Electronic moiré contouring (EMC) [12] is a technique based on the traditional pro-
jection moiré contouring technique, but with the variation that electronic demodulationis used to obtain the contour maps. This technique encodes the topographic informationoptically by projecting a linear grating on a surface target. The grating is deformedaccording to the target surface shape. Decodification is carried out by subtracting elec-tronically the captured (by a CCD camera) encoded information between two diíferentsta tes of the target or with a reference grating, which can be gencrated by computer.The electronic apparatus, dcsigned specially to work in a video ratio, is built up by A/Dand D/A converters, a pass-band filter, an image subtractor, a rectifier, and a contraststretcher. Putting all the parts together, a compact electronic system is constructed.The optical projection and capture systems and the electronic device plugged to a pccomputer, conform the EMC setup. Experimental rcsults indicate that the EMC techni-que may be extended as an industrial tool for quality control, or as feedback data inflexible manufacturing systems. In order to evaluate the EMC technique, fringe analysiswas carried out by comparing fringe subtraction between reference and specimen gratings
THREE-DIMENSIONAL GAUGlNG BY ELECTRONIC MOIRÉ CONTOURING 449
using the electronic device and proprietary image processing equipment in a personalcomputer. A phase-stepping technique has been employed for data reduction, towards thefull automation of the method.
2. TIIE EMC SYSTEM
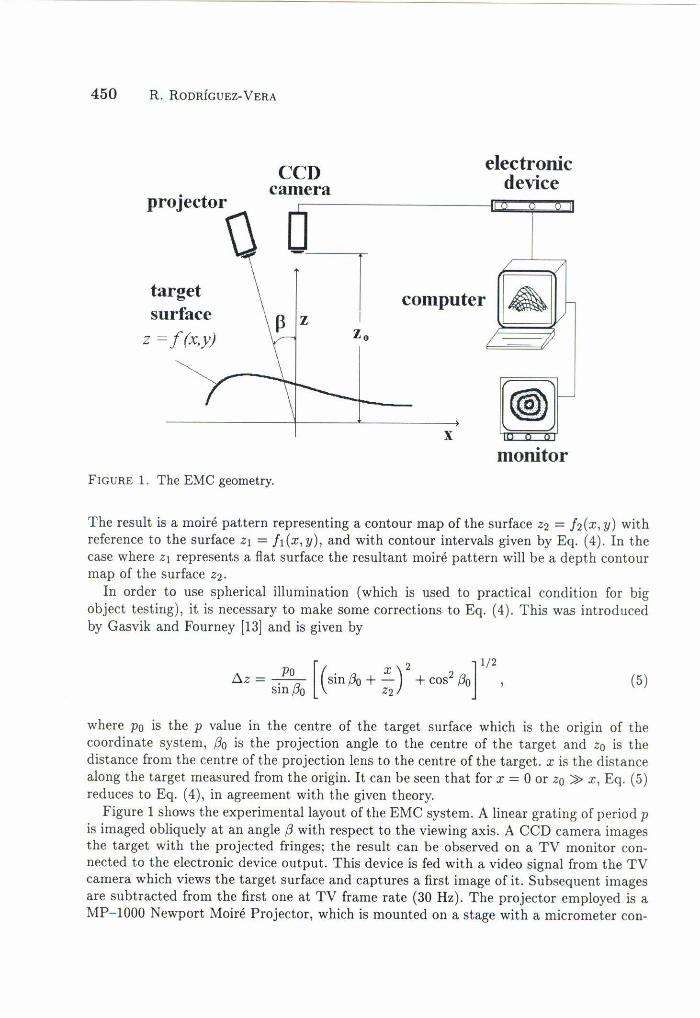
Consider an target surface described by Z¡ = f¡ (x, y) (Fig. 1). A linear grating whoserulings are perpendicular to the plane of the paper is projected on the surface. If theangle between the projection and viewing axes is 13, the intensity distribution on theimage plane is described by 141
2"I¡(x, y, z) = A + B cos -[xcos 13- z¡ sinl3J,p
(1)
where A and B are constants and p is the grating periodoConsider a second target surface function Z2 = h(x, y), which may represent a deviation
from Z¡ or the real target surface under test if Z¡ is a flat, reference surface. Its intensity is
2"12(x, y, z) = A + B cos -[xcos 13- z2 sinl3J,p (2)
These intensity distributions, represented by voltage signals V¡ an V2, are proportional toI¡ and 12 respectively. The resulting processed video image is proportional to
2" 2"V¡ - V2 ex II¡ - hl = B cos -[xcos 13 - zl sin 13] - B cos -[xcos 13 - Z2 sin 131p p
~ Ksin [~(Z¡ - Z2) sin 13] sin 2; [x cos 13+ (Z2; z¡) sin 13] , (3)
where K is a constant. Equation (3) represents the original projected fringe (except for aslight difference in phase) amplitude modulated by the factor
This modulation function corresponds to the moiré fringes and has a minimum wherever
" .-(Z2 - z¡) Sin 13 = n",p
where n is an integer, hence
npfu = (Z2 - z¡) = -;--13'
Sin(4)
450 R. RODRÍGUEZ-VERA
,------------11[' l::d=:!i¡:! :::::Ji!) ]¡I
electronicdevice
~/ -/
~
>-
x
computer
CCDcamera
targetsurfacez =[(x,y)
monitorFIGURE 1. The EMe geometry.
The result is a moiré pattern representing a contour map of the surface Z2 = h(x, y) withreference to the surface ZI = f¡ (x, y), and with contour intervals given by Eq. (4). In thecase where ZI represents a fiat surface the resultant moiré pattern will be a depth contourmap of the surface Z2.
In order to use spherical illumination (which is used to practical condition for bigobject testing), it is necessary to make some corrections to Eq. (4). This was introducedby Gasvik and Fourney [13) and is given by
[
2 ] 1/2D.z = .P0(3 (sin (30 +.:..) + cos2 (30 ,
SIn o Z2(5)
where Po is the P value in the centre of the target surface which is the origin of thecoordinate system, (30 is the projection angle to the centre of the target and Zo is thedistance from the centre of the projection lens to the centre of the target. x is the distancealong the target measured from the origino It can be seen that for x = O or Zo » x, Eq. (5)reduces to Eq. (4), in agreement with the given theory.Figure 1 shows the experimental layout of the EMC system. A linear grating of period P
is imaged obliquely at an angle (3 with respect to the viewing axis. A CCO camera imagesthe target with the projected fringes; the result can be observed on a TV monitor con-nected to the electronic device output. This device is fed with a video signal from the TVcamera which views the target surface and captures a first image of it. Subsequent imagesare subtracted from the first one at TV frame rate (30 Hz). The projector employed is aMP-I000 Newport Moiré Projector, which is mounted on a stage with a micrometer con-

THREE-DIMENSIO:'<AL GAUGl:'<G BY ELECTRONIC MOIRÉ CONTOURI:'<G 451
la) lb) Id
FIGURE 2. Experimental results for absolute sbape measurjllg: (a) contour map, (b) unwrappedphase map, and (e) wire-mesh isometric.
trolled transverse arrangement. The grating is fixed in the projector. The resultant imagedisplayed on the monitor is an image of the target with moiré fringes superimposed upon it.
3. 50ME APPLlCATIONS
In the following sections, some applications of the EMe system will be described. Theseapplications were simulated on real targets like plastic bottles, and thin plastic plates.
3.1. Example 1: Absolute shape measurement
For absolute shape measurement of a target, an image of a known, flat surface supe-rimposed with projected fringes is captured in the electronic device. A 40 mm diameterspherical target is then replaced for the flat surface and its image is subtracled from thalof the flat surface withoul allering lhe fringe projeclion layoul. Fig. 2a is a pholographfrom the monilor of lhe conlour map. In order lo oblain lhe phase map and isomelricplOl from lhe conlour map, lhe phase-stepping method is used [61. Three conlour pallernsare caplured: one al -120°, lhe second 0° and lhird shifled with respecl lo lhe lasl oneby +120°. This is achieved by lranslaling lhe projeclion system lransversely wilh themicro-posilioner. The lranslation is perpendicular to the projection axis, by &(120°) ofthe grating pitch. Three intensity values !¡, h, and 13 al each pixel location are used tocompute the phase of the contour pattern from the relation [61:
(6)
Evaluating Eq. (6) at every pixel locatjon transforms the three contour patterns jntoa modulo 2" (wrapped) phase distribution which is directly related to the shape of thesurface. Fig. 2b and 2c show the phase map and isometric plot respectively.
452 R. RODRÍGUEZ-VERA
(a) (b)
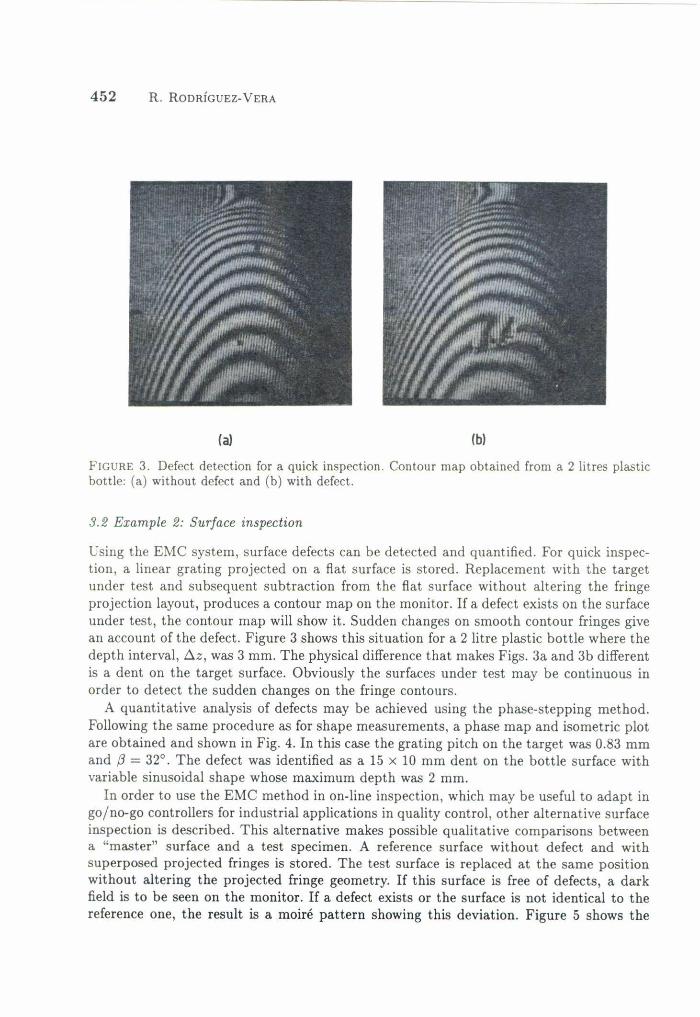
FIGURE3. Defect detection for a quick inspection. Contour map obtained from a 2 litres plasticbottle: (a) without defect and (b) with defecto
3.2 Example 2: Surfaee inspection
Using the EMC system, surface defects can be detected and quantified. For quick inspec-tion, a linear grating projected on a !lat surface is stored. Replacement with the targetunder test and subsequent subtraction from the !lat surface without altering the fringeprojection layout, produces a contour map on the monitor. If a defect exists on the surfaceunder test, the contour map will show it. Sudden changes on smooth contour fringes givean account of the defecto Figure 3 shows this situation for a 2 litre plastic bott!e where thedepth interval, c,.z, was 3 mm. The physical difference that makes Figs. 3a and 3b differentis a dent on the target surface. Obviously the surfaces under test may be continuous inorder to detect the sudden changes on the fringe contours.A quantitative analysis of defects may be achieved using the phase-stepping method.
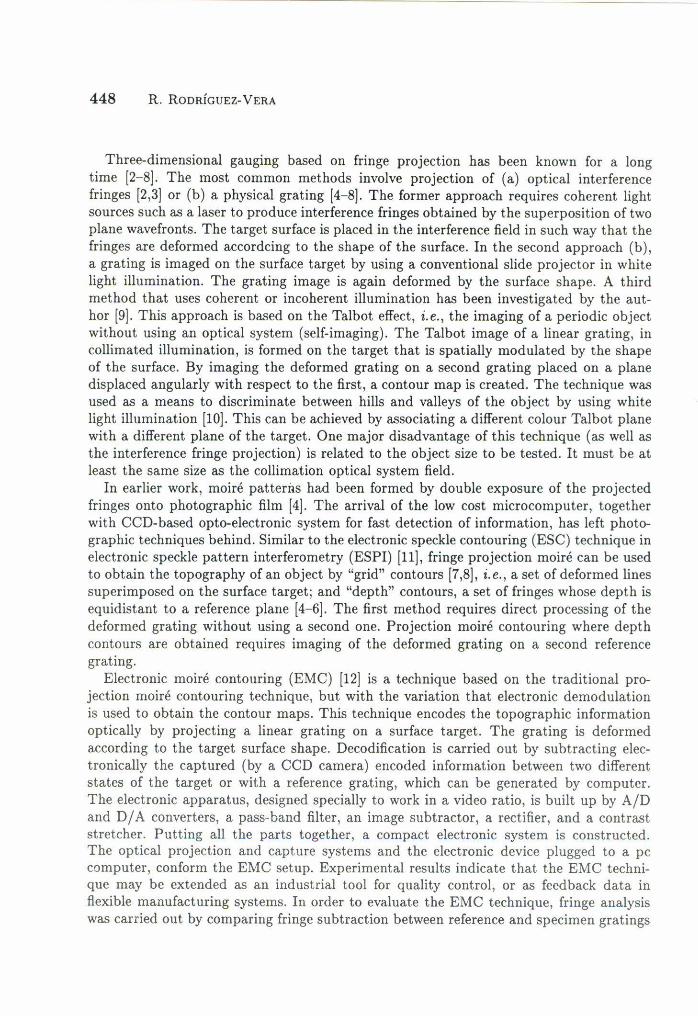
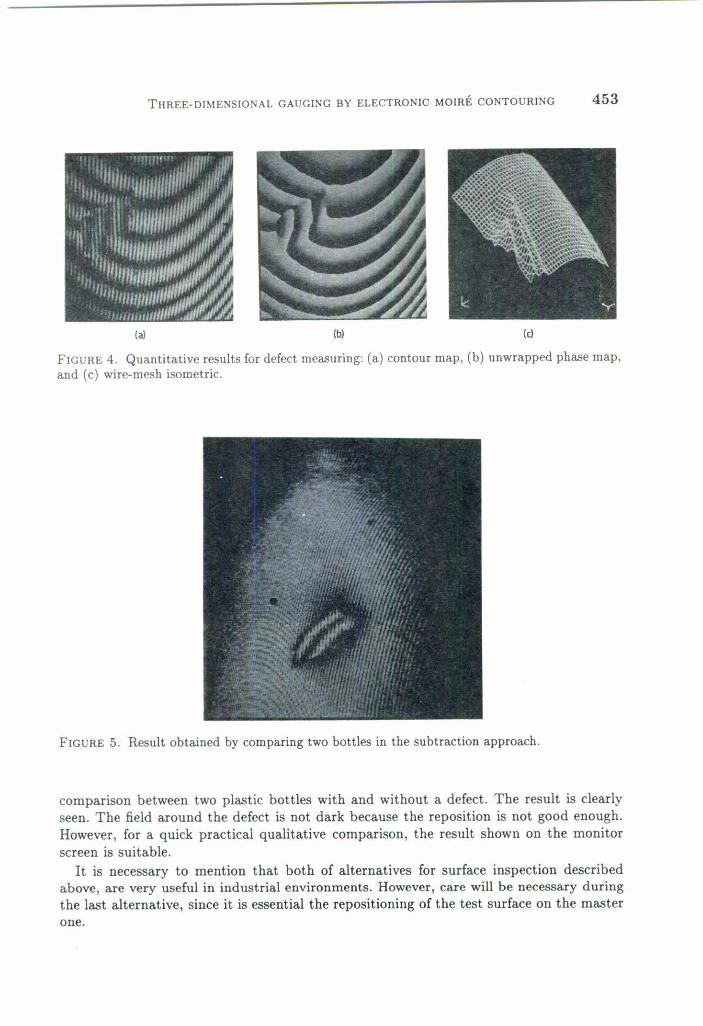
Following the same procedure as for shape measurements, a phase map and isometric plotare obtained and shown in Fig. 4. In this case the grating pitch on the target was 0.83 mmand /3 = 32°. The defect was identified as a 15 x 10 mm dent on the bottle surface withvariable sinusoidal shape whose maximum depth was 2 mm.In order to use the EMC method in on-line inspection, which may be useful to adapt in
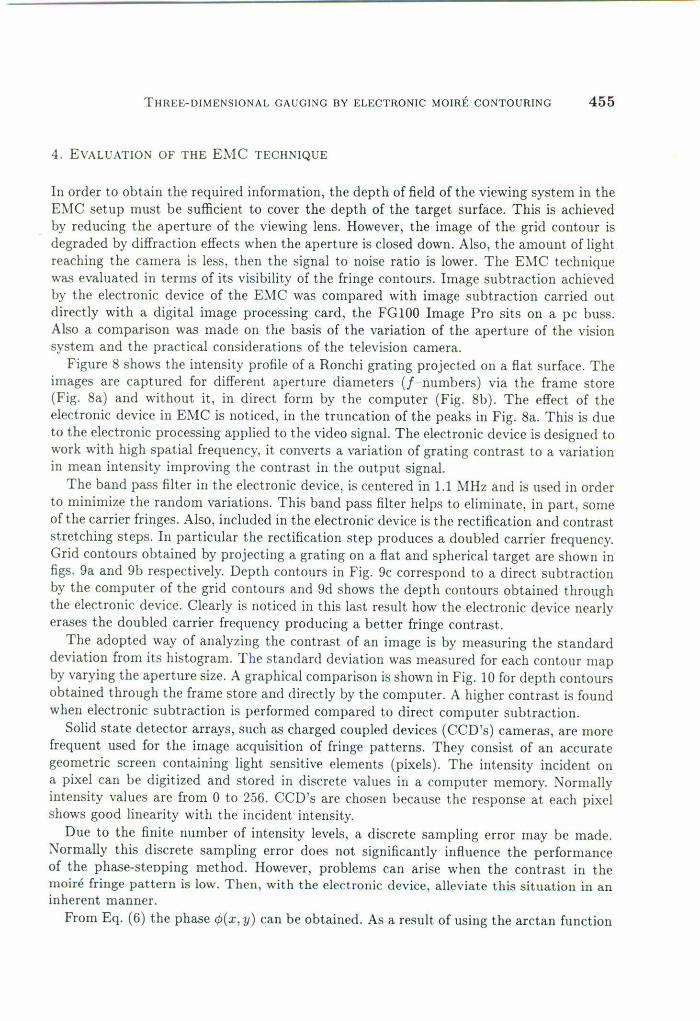
go/no-go controllers for industrial applications in quality control, other alternative surfaceinspection is described. This alternative makes possible qualitative comparisons betweena "master" surface and a test specimen. A reference surface without defect and withsuperposed projected fringes is sto red. The test surface is replaced at the same positionwithout altering the projected fringe geometry. If this surface is free of defects, a darkfield is to be seen on the monitor. If a defect exists or the surface is not identical to thereference one, the result is a moiré pattern showing this deviation. Figure 5 shows the
TIIREE-D1MENSIONAL GAUGI:"G BY ELECTRONIC MOmÉ CONTOURING 453
(al Ibl Id
FIGURE 4. Quantitative results for defeet measuring: (a) eontour map, (b) uIlwrapped phase map,and (e) wire-mesh isometrie.
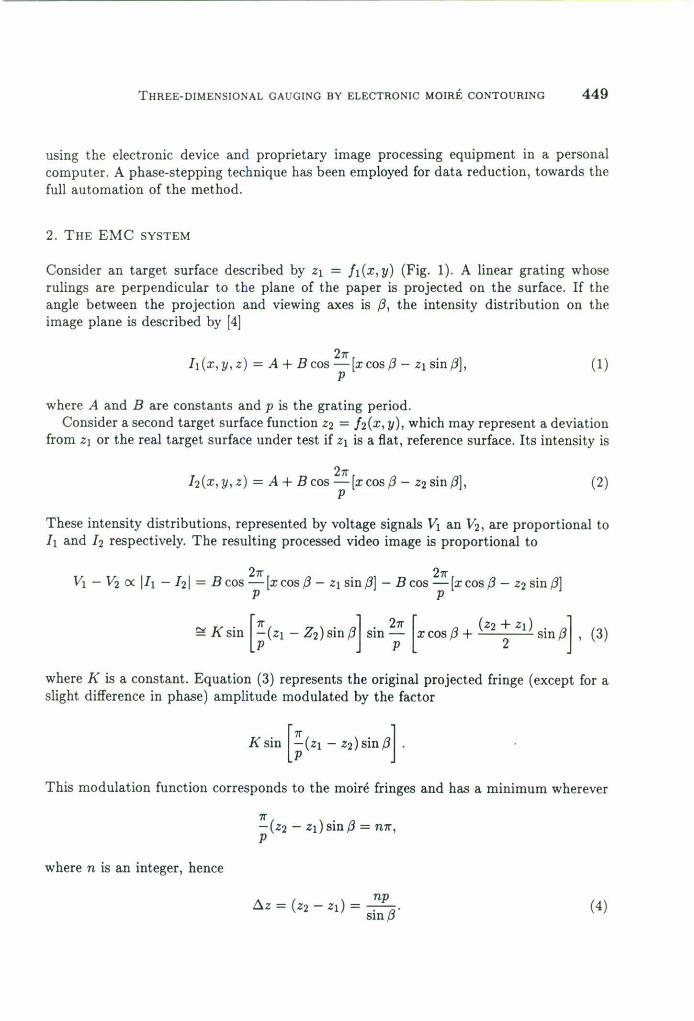
FIGURE 5. Result obtained by comparing two bottles in the subtraction approaeh.
comparison between two plastic bottles with and without a defecto The result is clearlyseen. The field around the defect is not dark beca use the reposition is not good enough.However, for a quick practical qualitative comparison, the result shown on the monitorscreen is suitable.
It is necessary to mention that both of alternatives for surface inspection describedaboye, are very useful in industrial environments. However, care will be necessary duringthe last alternative, since it is essential the repositioning of the test surface on the masterQne.

454 R. RODRÍGUEZ-VERA
T60mm
1(a)
p
(b)
p
FIGURE6. A thin plastic surface. (a) Initial eylindrical form, and (b) surfaee shape aequired byapplying a load P.
(al (bl (oFIGURE 7. Final deformalion resull after lhe surfaee is loaded (a) eonlour map, (b) unwrappedphase map (e) final shape formo
3.3 Examp/e 3: Deformation measurement
In order to demonstrate the possibility of extending the EMe teehnique to deformationmeasurement, a thin plastie cylindrical surface was tested. The dimensions of this cylinderare shown in Fig. 6a, where initially the surface is of 50 mm in radius and 60 mm in length.An image of this initial state of the shape with projected fringes on it is stored. A loadP is applied to the middle part of the surface which produces a deformation depicted inFig. 6b. Deformation contours appearing over the surface can be seen on the monitor. Byusing the usual phase-stepping procedure, the final acquired shape of the deformed targetis obtained as seen in Fig. 7. In this case the contour interval is 2.5 mm which indicatesthat the larger deviation (centre of the target) from the original undeformed is 5 mm.
TIIREE-DIMENSIONALGAUGlNGBY ELECTRONICMOIRÉCONTOURING 455
4. EVALUATIO:-;OF THE EMC TECII:-;IQUE
In order to obtain the required information, the depth of field of the viewing system in theEMC setup must be sufficient to cover the depth of the target surface. This is achievedby reducing the aperture of the viewing lens. However, the image of the grid contour isdegraded by diffraction effects when the aperture is closed down. Also, the amount of lightreaching the camera is less, then the signal to noise ratio is lower. The E:-'lC techniquewas evaluated in terms of its visibility of the fringe contours. Image subtraction achievedby the electronic device of the EMC was compared with image subtraction carried outdirectly with a digital image processing card, the FG 100 Image Pro sits on a pc buss.AIso a comparison was made on the basis of the variation of the aperture of the visionsystem and the practical considerations of the television camera.
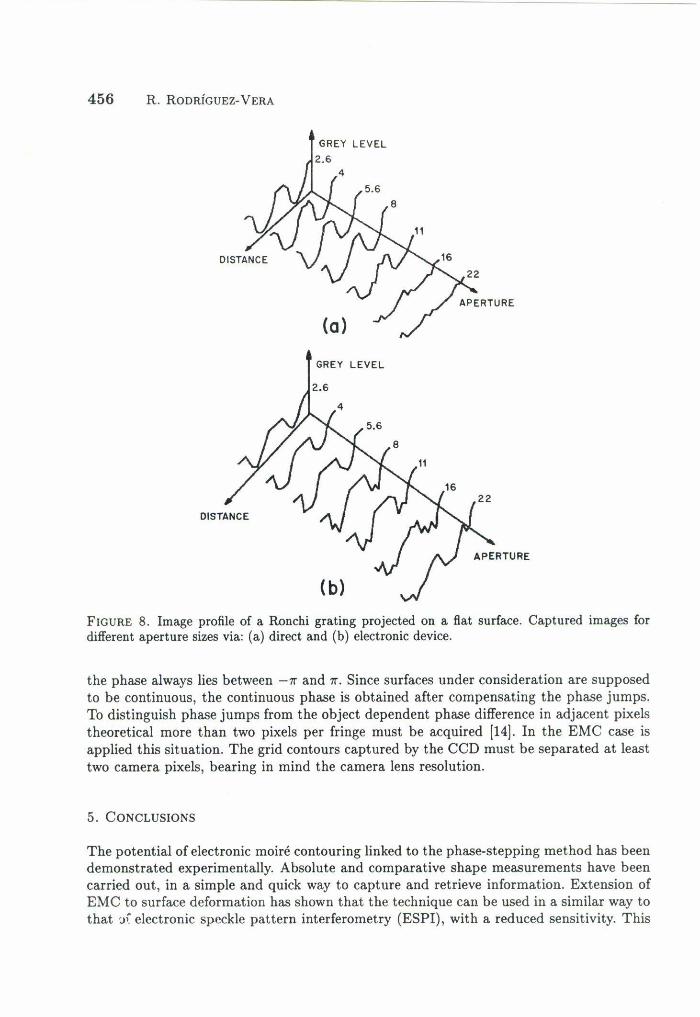
Figure S shows the intensity profile of a Ronchi grating projected on a flat surface. Theimages are captured for different aperture diameters (J-numbers) via the frame store(Fig. Sa) and without it, in direct form by the computer (Fig. Sb). The effect of theelectronic device in EMC is noticed, in the truncation of the peaks in Fig. Sa. This is dueto the electronic processing applied to the video signa!. The electronic device is designed towork with high spatial frequency, it converts a variation of grating contrast to a variationin mean intensity improving the contrast in the output signa!.The band pass filter in the electronic device, is centered in 1.1 !\1Hz and is used in order
to minimize the random variations. This band pass filter helps to eliminate, in part, someof the carrier fringes. Also, included in the electronic device is the rectification and contraststretching steps. In particular the rectification step produces a doubled carrier frequency.Grid contours obtained by projecting a grating on a flat and spherical target are shown infigs. 9a and 9b respectively. Depth contours in Fig. 9c correspond to a direct subtractionby the computer of the grid contours and 9d shows the depth contours obtained throughthe electronic device. Clearly is noticed in this last result how the electronic device nearlyerases the doubled carrier frequency producing a better fringe contrast.The adopted way of analyzing the contrast of an image is by measuring the standard
deviation from its histogram. The standard deviation was measured for each contour mapby varying the aperture size. A graphical comparison is shown in Fig. 10 for depth contoursobtained through the frame store and directly by the computer. A higher contrast is foundwhen electronic subtraction is performed compared to direct computer subtraction.Solid state detector arrays, such as charged coupled devices (CCD's) cameras, are more
frequent used for the image acquisition of fringe patterns. They consist of an accurategeometric screen containing light sensitive elements (pixels). The intensity incident ona pixel can be digitized and sto red in discrete values in a computer memory. Normallyintensity values are from O to 256. CCD's are chosen because the response at each pixelshows good linearity with the incident intensity.
Due to the finite number of intcnsity levels, a discrete sampling error may be made.Normally this discrete sampling error does not significantly influcnce the performanceof the phase-steDping method. lIowever, problems can arise when the contrast in themoiré fringe pattern is low. Thcn, with the elcctronic devicc, allcviate this situation in aninherent manncr.From Eq. (6) the phase cf>(x, y) can be obtained. As a result of using the arctan function
456 R. RODRÍGUEZ-VERA
GREY LEVEL
2.6
GREY LEVEl2.6
FIGURE8. Image profile of a Ronchi grating projected on a flat surface. Captured images fordifferent aperture sizesvia: (a) direct and (b) electronicdevice.
the phase always lies between -7r and 7r. Since surfaces under consideration are supposedto be continuous, the continuous phase is obtained after compensating the phase jumps.To distinguish phase jumps from the object dependent phase difference in adjacent pixelstheoretical more than two pixels per fringe must be acquired [141.In the EMC case isapplied this situation. The grid contours captured by the CCD must be separated at leasttwo camera pixels, bearing in mind the camera lens resolution.
5. CONCLUSIONS
The potential of electronic moiré contouring linked to the phase-stepping method has beendemonstrated experimentally. Absolute and comparative shape measurements have beencarried out, in a simple and quick way to capture and retrieve information. Extension ofEMC to surface deformation has shown that the technique can be used in a similar way tothat 'J' electronic speckle pattern interferometry (ESPI), with a reduced sensitivity. This

THREE-DIMENSIONALGAUGINGBY ELECTRONICMOIRÉCONTOURING 457
(a)
(e) (d)FIGURE9. (a) and (b) grid contours generated by projecting a linear grating on a tlat and sphe-rical objects, respectiye]y. Depth contours generated by subtracting the aboye grid contours Yia:(c) direct and (d) electronically .
••• ,.o~ 60>~o ,.o~ 40o•~ 30~,.,.
,.. 5.6 11 16 22
APERTUR[
FIGURE10. Contour contrast comparison produced (.) electronically and (+) usmg tl'o computer.
is usefu] when measurement of large displacement or shape of big targets measurement isdesired.This method is yery suitable for comparing the shape of different targets and therefore
offers a powerful means for measuring the surface profile difference between a productspecimen and a master target in real time. This is obtained by subsequent recordingof the master and the product, resultillg in a moiré pattern which maps the differencebetween the two targets due to, for example, manufacturing defects.
Finally it ls necessary to mention that with conyentlonal holographic or ESP! systems,
458 R. RODRíGUEZ-VERA
the eontour interval obtained is of the order of '\, the wavelength of the light employed.Sometimes it is not neeessary to use sueh a high sensitivity. For example, if big targetsare tested, like ear body panels, where defeets of 1-5 mm on an are a of 1 square meter ormore exist, the EMC teehnique is far better for earrying out sueh testing.
ACKNOWLEDGEMENTS
1 would like to thank Or. O. Kerr for his useful eomments and suggestions, Mr. K. Topleyfor producing the photographie material, and Mrs. J. Redman for the line drawings, aU ofthem from Loughborough University of Teehnology, Oepartment of Meehanieal Engine-ering, England. The finaneial support provided by CONACyT is gratefuUy aeknowledged.
REFERENCEs
1. A. Novini, Prac. SPIE 1526 (1991) 2.2. P.O, Varman, Opto and Lasers in Eng. 5 (1984) 41.3. M.R. Morshedizadeh and e.M. Wykes, J. Phys. E: Sci. Instrum. 22 (1989) 88.4. J.D. Hovanesian and Y.Y. Hung, Appl. Opt. 10 (1971) 2734.5. K.J. Gasvik, Appl. Opto 22 (1983) 3543.6. G.T. Reid, R.e. Rixon, and H.!. Messer, Opto and Laser Technol. 16 (1984) 315.7. M. Halioua and H.C. Liu, Opto and Lasers in Eng. 11 (1989) 185.8. M. Takeda and K. Mutoh, Appl. Opto 22 (1983) 3977.9. R. Rodriguez-Vera, D. Kerr, and F. Mendoza-Santoyo, J. Mod. Opto 38 (1991) 1935.10. R. Rodriguez-Vera, D. Kerr, and F. Mendoza-Santoyo, Prac. SPIE 1553 (1991) 55.11. R. Rodriguez-Vera, D. Kerr, and F. Mendoza-Santoyo, J. Opto Soco Am. 9A (1992) 2000.12. R. Rodriguez-Vera and D. Kerr, in Prac. o/Int. Con/erence Fringe Analysis'92, Leeds
University, England (16-17 Sept., 1992) p. 31.13. K.J. Gasvik and M.E. Fourney, J. Appl. Mech. 53 (1986) 652.14. J.E. Greivenkamp and J.B. Bruning, in Optical Shop Testing, D. Malaeara, Ed. Wiley Series
in Pure and Applied Opties, John Wiley and Sons, New York (1992) chapter 14.