Embed Size (px)
Citation preview

Three-dimensional (3D) volumetric analysis as a tool for urban planning: a case study of Chennai
C. Faiz Ahmed & S. P. Sekar Department of Planning, School of Architecture and Planning, Anna University, Chennai, India
Abstract
With cities getting bigger, wider and more complex, urban planners are put under severe mental pressure to understand the rapid urban growth and development and accordingly plan for it. The conventional development plans make it even more challenging to visualize the growth, as most of the plans prepared are in two-dimensions (2D), while the growth and development of the built-environment occurs in three-dimension (3D). Today with the latest state-of-the-art 3D tools and techniques, visualization for efficient planning and decision making is possible with 3D analysis. 3D models can be integrated with any of the following stages of urban planning process like data collection and checking, analysis, estimation and presentations, for better understanding of the real world developments. For urban planners, in this context, it is an opportunity to familiarize and integrate 3D models in the urban planning process. This paper explores the possibilities of integrating 3D models in the daily urban planning process for quantification and visualization of demand generated in physical infrastructure requirements. For effective visualization, planning, analysis and decision making, the present research considered the current development status of the study area, in accordance with master plan II of Chennai, which permits to develop up to 1.5 Floor Space Index (FSI). The current study attempts to visualize the demand of water supply and solid waste generated for varying FSI of 2.5 and 4.0. To demonstrate this concept an information-rich 3D models of the pilot study area were generated and volumetric analyses were performed using ArcSceneTM. The result establishes a strong correlation between FSI and physical infrastructure requirements that are visualized and quantified using 3D volumetric study. Keywords: 3D city, built-environment, visualization, urban planning, volumetric analysis, GIS, infrastructure planning.
The Sustainable City VIII, Vol. 1 731
www.witpress.com, ISSN 1743-3541 (on-line) WIT Transactions on Ecology and The Environment, Vol 179, © 2013 WIT Press
doi:10.2495/SC130621

1 Introduction
Urban planning involves several processes, procedures and explorations in the planning and design of an urban area. It demands a comprehensive understanding of issues related to horizontal and vertical expansions of cities. Most of the development plans prepared are two-dimensions (2D). These conventional 2D plans, limits the capability of assessing the provision of infrastructure facilities for such a rapidly expanding urban area. As the cities grow bigger and more complex the limitations of two-dimensional plans are becoming apparent [2, 7]. As a result, most of the analysis is restricted to two-dimensions, while the city expands in three-dimension [5, 11]. With this outmoded 2D plan, urban planners allow an increase of floor space index (FSI) without taking into consideration of the availability of adequate infrastructure facilities. An increase in FSI is likely to result in an increase in population density and thereby creating a strong bearing on the physical infrastructure facilities like water supply, sewerage, power consumption, solid wastes and urban roads [8]. Urban planners are ambiguous in using three-dimensional (3D) tools because of its intricacy in data integration, modeling, cost and lack of appropriate skills in integrating 3D models in the daily planning process. Thereby compromising on the efficiency and effectiveness of the plans prepared [1, 13]. This obsolete method of urban planning and management should be updated with technological developments, which aid planners in efficient planning [12]. This research is built on the following question, “Can 3D city model act as a dynamic tool for assessment of physical infrastructure with varying floor space index (FSI) and aid urban planners in efficient planning and decision making?” In practice, most of the applications of 3D city models are restricted to visualization of built-form. This research proposes integration of 3D city models for analysis of urban problems that occur in the everyday urban planning process and decision making. To demonstrate the visual and volumetric competencies, the study area shown in Figs 1 and 2 is demarcated as the pilot area from a part of the Velachery, Detailed Development Plan (DDP), prepared by the Chennai Metropolitan Development Authority (CMDA). ESRI product ArcMap™ and ArcScene™ were used for base map preparation (2D) and for creation of information rich 3D models for visualization and analysis respectively.
2 Floor space index (FSI) and volumetric analysis
The concept of FSI indicates the maximum build-able potential of a plot of land. The FSI to be allowed in an area takes into consideration of the availability of physical and social infrastructure facilities, including open spaces, transport facilities, requirements for protection against fire, water supply, sewerage, solid waste and electricity. There exists a thumb rule of in urban planning that the floor space index (FSI) has a bearing on infrastructure facilities of that area. An increase in FSI increases the population density and it has a strong bearing on the
732 The Sustainable City VIII, Vol. 1
www.witpress.com, ISSN 1743-3541 (on-line) WIT Transactions on Ecology and The Environment, Vol 179, © 2013 WIT Press

infrastructure facilities provided. Using volumetric study this correlation can be exclusively assessed and analyzed. Volumetric Study is a quantitative study carried out to determine the ‘volumetric-ness’ of the city i.e. analysis of building density and volume of activities influencing other activities or other requirements over an urban space [5, 6]. For example, while describing, an activity, say residential, this is normally shown as a 2D map. In practice when we compare two identical residential developments of varying intensities, one can be low rise development and other can be high rise development. Using 2D maps visualization and quantification of these variations in volume and intensity of development is very much limited. Urban planners are forced to conceptualize a ‘mental map’ of ‘some’ intensity of development for planning and decision making, thereby creating enormous pressure on urban planners. Conventionally, planners looking for the intensity of development, compute the total floor area of each zone. 2D maps may give ‘some size’, but it is a “mere number” in terms of ‘some size’ but it does not reveal tangible real world volume (in terms of bulkiness spread, verticality etc.). This process critically takes away the planner's analytical ability and limits planning proficiency. To improve the efficiency of planning decision making, a volumetric study is proposed, which is defined as; a system that dynamically depicts all necessary parametric data as described above, allows to compute relationship between plan, ground truth, actual development, the gap between and, analysis of how much of ‘x’ facility to be in place of a ‘y’ level of development in a ‘z’ zone. Allowing dynamic demarcation of the zone or boundary enables planners to compare areas of similar growth and development.
Figure 1: Velachery study area location map (source: Google Earth).
The Sustainable City VIII, Vol. 1 733
www.witpress.com, ISSN 1743-3541 (on-line) WIT Transactions on Ecology and The Environment, Vol 179, © 2013 WIT Press

Figure 2: Study area profile, with digitized building outlines – drawn by the authors based on field survey 2013.
3 Methodology
3.1 Study area profile
The study area is a part of Velachery, Detailed Development Plan (DDP) in Chennai, India (Figs 1 and 2). The study area consists of different type of land-uses such as residential, commercial and institutional use (Industrial use is not within the study area limit) and the built structure varies from single floor structures to nine floor structures with different floor-wise uses.
Table 1: Existing development regulations (DR) of the study area (source: Master Plan II of CMDA-2026CMDA 2026).
Existing Land use Analysis (Classification as per Master Plan II of CMDA)
Area (Sq.m)
Residential use 10193.39 Mixed use 42208.54 Commercial 6022.23 Institutional 2099.94
Total Study Area 60524.1 Development Regulation for the study area FSI Source: Master Plan II of CMDA-2026 1.5 Plot coverage
Residential – 70% Commercial – 70% Institutional – 40%
734 The Sustainable City VIII, Vol. 1
www.witpress.com, ISSN 1743-3541 (on-line) WIT Transactions on Ecology and The Environment, Vol 179, © 2013 WIT Press

3.2 Conceptual framework
Using Google imagery, the profile of each building within the study limit, that is one depth of the building on either side of the abutting road, is digitized; their uses and number of floors are enumerated through a primary survey in the year 2013. These digitized buildings are overlapped with the proposed land use of Chennai 2026, II Master Plan, for their compatibility. FSI, setback, and maximum permissible height and other zoning related information are taken from development regulation of Chennai [3]. Through the primary survey, the existing development is traced and a 2D base map is prepared using ArcGIS™ (Fig. 3). Using this 2D base map, information –rich 3D models were generated to perform volumetric analysis of physical infrastructure assessments like water supply, solid waste generated etc., (Table 2).
Figure 3: Conceptual framework for creating 3D information-rich models, for performing volumetric analysis on physical infrastructure.
3.3 Information-rich 3D city model
3D information-rich models and the database associated with models of the city provide significant support to planners in various aspects of urban planning,
Volumetric analysis using 3D models on physical infrastructure (water supply, solid waste etc.).
(ArcScene™)
Identification of study area
Identification of Land-uses in the study area
Examining the study area zoning regulations
Digitization of Study Area, using Google Imagery
Creation of 2D Base Map using ArcMap™
Conducting field survey for marking building heights, number of floors, floor-wise use of buildings, number of households
Creation of information-rich 3D Base Map using ArcScene™
The Sustainable City VIII, Vol. 1 735
www.witpress.com, ISSN 1743-3541 (on-line) WIT Transactions on Ecology and The Environment, Vol 179, © 2013 WIT Press
analysis and decision making [1]. Effective and efficient retrieval of geo-referenced, heterogeneous spatial information, visualization and storage of data are the characteristics of 3D information rich city models (Figs 4 and 5), which can be extensively used in the management of urban spaces [6, 7, 9, 10, 14].
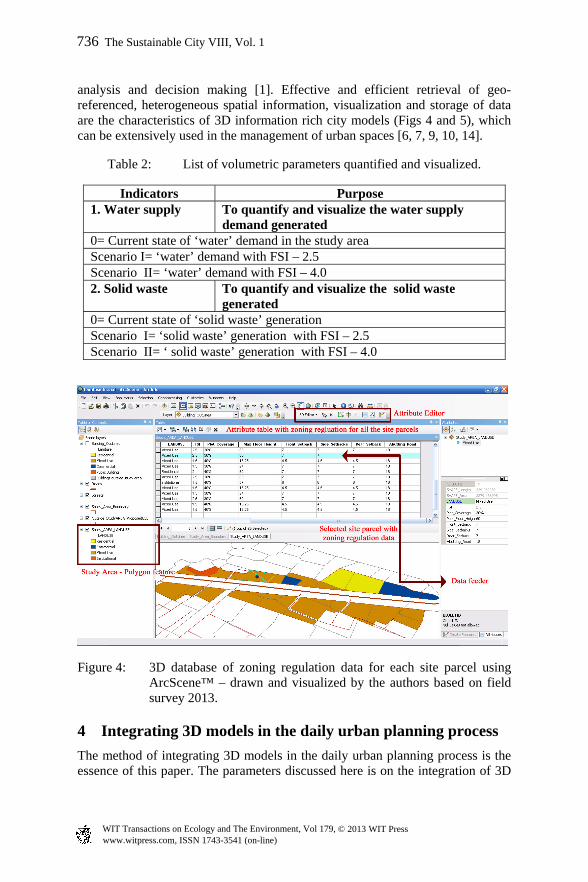
Table 2: List of volumetric parameters quantified and visualized.
Indicators Purpose 1. Water supply To quantify and visualize the water supply
demand generated 0= Current state of ‘water’ demand in the study area Scenario I= ‘water’ demand with FSI – 2.5 Scenario II= ‘water’ demand with FSI – 4.0 2. Solid waste To quantify and visualize the solid waste
generated 0= Current state of ‘solid waste’ generation Scenario I= ‘solid waste’ generation with FSI – 2.5 Scenario II= ‘ solid waste’ generation with FSI – 4.0
Figure 4: 3D database of zoning regulation data for each site parcel using ArcScene™ – drawn and visualized by the authors based on field survey 2013.
4 Integrating 3D models in the daily urban planning process
The method of integrating 3D models in the daily urban planning process is the essence of this paper. The parameters discussed here is on the integration of 3D
736 The Sustainable City VIII, Vol. 1
www.witpress.com, ISSN 1743-3541 (on-line) WIT Transactions on Ecology and The Environment, Vol 179, © 2013 WIT Press

models in assessing the physical infrastructure in relation to varying floor space index (FSI) through volumetric analysis. In order to perform the volumetric analysis for establishing the correlation between the FSI and physical infrastructure, the following information is extracted from the 3D rich-information city model generated using ArcScene™. The 3D base model includes the data on volume of activities generated over the study area in terms of residential, commercial and institutional (Table 3). Also the floor-wise use of buildings across the study area, number of households within the study area and the water supply demand and the solid waste generated over the study area.
Table 3: Use-wise area statement of the study area (source: compiled by the authors based on the field survey 2013).
Use-wise Area Statement Area (Sq.m) Volume of activities (Cu. m) (Height – 3m)
Residential 61755 185265 Commercial 22071 66213 Institutional 2228 6684 Total 86054 258162 FSI achieved 1.42 -----
4.1 Water supply demand generated over the study area for varying FSI
Chennai Metropolitan Water Supply and Sewerage Board (CMWSSB), is constituted for attending the growing needs of water supply and sewerage services in the Chennai Metropolitan Area and plan for it. CMWSSB sets certain guidelines for calculation of water demand based on the size of the floor area by making equivalence with the dwelling unit size (Table 5). With this background information, three scenarios were generated, 1- Current water demand across the study area with 1.5 FSI, 2- Water demand with 2.5 FSI and 3- Water demand with 4.0 FSI (Fig. 5).
Table 4: Calculation of equivalent dwelling units as per CMWSSB.
Utility of buildings Area per dwelling units sq. m
Equivalent dwelling units
Residential (Housing/Apartment)
50 1
Commercial (Office) 100 1
Commercial (Restaurant) 50 1
Institutional (Hospital) 25 1 Water supply to be provided per dwelling units = 90 lpcd
Source: based on the norms of CMWSSB
The Sustainable City VIII, Vol. 1 737
www.witpress.com, ISSN 1743-3541 (on-line) WIT Transactions on Ecology and The Environment, Vol 179, © 2013 WIT Press

Figure 5: Quantification and visualization of building-wise water demand across the study area based on 1.5, 2.5 and 4.0 FSI.
738 The Sustainable City VIII, Vol. 1
www.witpress.com, ISSN 1743-3541 (on-line) WIT Transactions on Ecology and The Environment, Vol 179, © 2013 WIT Press

Table 5: Volumetric results of water demand in three scenarios.
Scenarios FSI Total built-up Area (sq. m)
Total Water Demand (lpcd)
Mean water demand (lpcd)
Current status
1.42 86054 138600 1372
I 2.5 147866 229680 2274 II 4.0 240584 366660 3630
The demand for water supply increases with the increase in floor space index (FSI) (Table 5). The current development status demands a water supply of 138600 lpcd with average mean water demand of 1372 lpcd per building within the study area. Scenario I and II (Fig. 5, Table. 6), are simulated with and FSI of 2.5 and 4.0 for demand assessment and visualization of water supply. The results show a mean water demand increase of 2274 lpcd and 3630 lpcd for FSI of 2.5 and 4.0 respectively. An information base of such nature would enable the urban planners and decision makers in efficient planning and management of urban systems. In practice such tools are not readily available that can be integrated in the daily urban planning process. Conventionally, FSI is the key planning parameter upon which physical infrastructures like water supply, sewerage, solid waste, power, consumptions etc., are planned. But in reality the infrastructure delivered and the demand generated do not complement one another.
4.2 Solid waste generation across the study area in three scenarios
Solid waste management is one of the major challenges an urban planner has to address in a rapidly expanding city especially in cities like Chennai. On an average the per capita solid waste generation in Chennai is 0.6 kg/day which is the highest in the country [3, 4]. Increasing the built-up area with a rise in FSI allocation, the solid waste generated over the study area also accumulates with a number of dwellers. Fig. 6 shows the three scenarios of solid waste generation across the study area with the help of 3D volumetric analysis. The average solid waste generated per building is 9.15, 15.2, 24.13 kg/day for an FSI of 1.5, 2.5 and 4.0 respectively (Table 6). Volumetric increase in activities across the study area and their assessment, quantification and visualizations are possible with 3D tools which ultimately aid urban planners in efficient planning and decision making.
Table 6: Volumetric results of solid waste generation in three scenarios.
Scenarios FSI Total number of dwelling units
Total solid waste generated (kg/day)
Mean solid waste generated (kg/day)
Current status
1.42 1540 924 9.15
I 2.5 2552 1534 15.2 II 4.0 4074 2437 24.13
The Sustainable City VIII, Vol. 1 739
www.witpress.com, ISSN 1743-3541 (on-line) WIT Transactions on Ecology and The Environment, Vol 179, © 2013 WIT Press

Figure 6: Quantification and visualization of building-wise solid waste generation across the study area based on 1.5, 2.5 and 4.0 FSI.
740 The Sustainable City VIII, Vol. 1
www.witpress.com, ISSN 1743-3541 (on-line) WIT Transactions on Ecology and The Environment, Vol 179, © 2013 WIT Press

The results presented here is limited to the demands generated for water supply and solid wastes generated for a change in current floor space index (FSI) of 1.5 to the scale of 2.5 and 4.0 the study area. Similarly, the impact of other physical infrastructure parameters like sewerage, traffic generation, street lighting and much more can be simulated and quantified using 3D volumetric analysis. The 3D analysis can be carried out in a larger study area for most appropriate results which can be used in everyday planning and decision making by urban planners.
5 Conclusion
Each stage of the urban planning process demands a comprehensive understanding of the urban problems for efficient planning and design in rapidly expanding urban areas. One of the most prominently used regulatory tools by urban planners in developing countries like India, is the floor space index (FSI). Based on the FSI both physical and social infrastructure facilities are effectively assessed for a given planning area. The 3D volumetric study results presented in this research establish a new methodology of 3D models that enables better planning. A conventional two-dimensional (2D) plans hardly provide such informed decision making. For example, the water supply demands across the study increases three times to that of the current demand and the solid waste generated is about 2.5 metric tons per day, for an increase in FSI of 3.5, which are quantified and visualized three-dimensionally. Similarly all the other physical infrastructure parameters can be quantified, visualized and projected for the increase in FSI. Three-dimensional (3D) volumetric analysis is one such mechanism which can be used for quantification, simulation and analysis of built-environment which this research proposes to integrate it with everyday urban planning processes for efficient planning and decision making.
References
[1] Al-Douri, Firas A. Salman. Impact of Utilizing 3D Digital Urban Models on the Design Content of Urban Design Plans in US Cities. Ph.D. Thesis, 2006.
[2] Batty, Michael, Besussi Elena, Maat Kees, and Jaap Harts Jan. “Representing Multifunctional Cities: Density and Diversity in Space and Time.” Working Paper-71, CASA, UCL, 2003.
[3] CMDA. Second Master Plan for Chennai Metropolitan Area, 2026. Chennai: Chennai Metropolitan Development Authority, 2008.
[4] Esakku, S., A. Swaminathan, O. Parthiba Karthikeyan, J. Kurian, and K. Palanivelu. “Municipal Solid Waste Management in Chennai city, India.” Eleventh International Waste Management and Landfill Symposium. Cagliari: CISA, Environmental Sanitary Engineering Centre, Italy, 2007.
The Sustainable City VIII, Vol. 1 741
www.witpress.com, ISSN 1743-3541 (on-line) WIT Transactions on Ecology and The Environment, Vol 179, © 2013 WIT Press

[5] Hwang, Iris and Se Young. Towards a volumetric city: A Critical Assessment of Hong Kong’s Embryonic Conditions. The University of Hong Kong: Ph.D Thesis, 2009.
[6] Koninger, A, and S Bartel. “3D-GIS for urban purposes.” GeoInformatica, 1998: 2 (1), 79-103.
[7] Lee, J., and M.P Kwan. “A combinatorial data model for representing topological relations among 3D geographical features in micro‐spatial environments.” International Journal of Geographical Information Science, 2005: 10:9, 1039–1056.
[8] Nandi, Sangeeta, and Shama Gamkhar. “Urban challenges in India: A review of recent policy measures.” Habitat International, 2013: (39) 55-61.
[9] Qing, Zhu, Hu Mingyuan, Zhang Yeting, and Du Zhiqiang. “Research and Practice in Three-Dimensional City Modeling.” Geo-spatial Information Science, 2009: 12 (1), 18-24.
[10] Ross, Lutz, Jannes Bolling, Jürgen Döllner, and Birgit Kleinschmit . “Enhancing 3D City Models with Heterogeneous Spatial Information: Towards 3D Land Information Systems.” AGILE. Springer, 2009. 113-133.
[11] Thill, Jean-Claude, Thi Hong Diep Dao, and Yuhong Zhou. “Traveling in the three-dimensional city: applications in route planning, accessibility assessment, location analysis and beyond.” Journal of Transport Geography, 2011: 19, 405–421.
[12] Xu, Hanwei, Rami Badawi, Xiaohu Fan, Jiayong Ren, and Zhiqiang Zhang. “Research for 3D Visualization of Digital City based on SketchUp and GIS.” International Symposium on Spatial Analysis, Spatial-Temporal Data Modeling, and Data Mining. Xinming Tang: SPIE, 2009. 7492 (74920Z), 1-6.
[13] Zhongyuan, Z. (2012). Research on Modeling Precision and Standard of 3D Digital City. 2011 International Conference on Environmental Science and Engineering (pp. 12 (521–527)). Singapore: Procedia Environmental Sciences.
[14] Zlatanova, S., and J. Beetz. “3D spatial information infrastructure: The case of Port Rotterdam.” Usage, Usability, and Utility of 3D City Models, 2012: 03010.
742 The Sustainable City VIII, Vol. 1
www.witpress.com, ISSN 1743-3541 (on-line) WIT Transactions on Ecology and The Environment, Vol 179, © 2013 WIT Press


![Chemical Calc[1].Problems[Volumetric Analysis]](https://img.pdfslide.us/doc/110x75/54752568b4af9f7f5f8b4632/chemical-calc1problemsvolumetric-analysis-55845ca679f98.jpg)