Embed Size (px)
Citation preview
Theory of Quantitative Analysis
I. Volumetric Analysis
The term Volumetric /titrimetric analysis refers to quantitative chemical analysis carried out by determining the volume of a solution of accurately known concentration which reacts quantitatively with a measured volume of solution of a substance to be estimated.
Terminology
Titrant – A solution of accurately known concentration is called titrant or standard solution.
Titrand – A solution whose concentration is to be determined is called titrand or analyte.
Titration - The process of adding the standard solution to the titrand until the reaction is complete is termed titration.
Equivalence point or the theoretical (or stoichiometric) end point – During a titration the point at which the reaction between a titrant and titrand is just complete is termed equivalence point or theoretical and point or stoichiometric end point.
End point - the completion of the titration is detected by some physical change produced by the solution it self (change in colour) or by addition of another reagent or by any other physical/electrical measurement. The point at which an indicator changes its colour during the titration is known as the visible end point.
Titration error : A reagent added to detect the visible end point should concide with the stoichiometric or the theoretical end point. In practice, there is a small difference between the two; this represents titration error. The indicator selected should be such that there is minimum titration error.
Primary Standard - It is a compound of high purity from which a standard solution can be prepared by weighing a calculated amount and dissolving it in a defined volume of solvent. A primary standard has the following requirements.
1. It should be available in highly pure, crystalline form with known impurity and is readily soluble.
2. It should not be oxidised by air, affected by carbon dioxide or hydroscopic.3. It should have a high molecular mass so that weighing errors may be negligible
Example – Sodium carbonate Na2 CO3 ,sodium tetraborate Na2 B4 O7 ,silver nitrate AgNO3
sodium chloride NaCl, potassium dichromate K2 Cr2 O7 sodium oxalate, Na2C2O4
spectroscopically pure metals like zinc, copper, manganese, etc.
Secondary standard – A secondary standard is used for estimation and whose concentration has been found by titrating against a primary standard. This process is known as standardisation
Molarity- Concentration of solution is commonly expressed in terms of molarity (M) or molar concentration.
Molarity (M) = Moles of solute
Volumeof solution∈liters
Or Molarity (M) = Weight of substancesMolecular weight X 1000
Volume∈ml
Requirements of titrimetric method
1. There should be a single reaction between titrant and titrand which can be expressed by a chemical equation.
2. The substances should react completely in stoichiometric proportions3. The reaction should be relatively fast; most ionic reactions are fast, otherwise a catalyst
may be used. 4. An indicator must be available to detect h end point. If no visible indicator is available,
the detection of end point is achieved by measuring change in potential, electrical conductivity or absorbance by using suitable instruments.
Types of reactions
There are several reactions employed in titrimetric analysis. They can broadly be classified into two types.
1. There is no change in oxidation states as they are dependent on combination of ions. a) Neutralization or acid – base reactions- These include acidimetry – titration bases
with standard acid and alkalimetry- titration of acids with standard base. The titrations proceed with combination of hydrogen and hydroxide ions to form water. These also include titration in non-aqueous solvents involving organic compounds.
b) Complexation reactions - The titration proceeds with combination of ions to form a complex.
c) Precipitation reactions - The titration proceeds with combination of ions to form a complex.
2. There is a change in oxidation state. The standard solutions are either oxidizing or reducing agents. There are called redox titrations.
Neutralization titrations
Principle- A neutralization titration is based on the chemical reaction between an acid and a base. The underlying ionic reaction is :
H+ + OH- H2O
The aim of titration is to estimate the amount of acid which is exactly chemically equivalent to amount of base. If both the acid and base are strong electrolytes, the solution at the end point will be neutral (pH = 7); but if either acid or base of weak electrolyte, the salt will be hydrolysed and the solution at the end point will be slightly acidic or basic. The reaction proceeds with a change in hydrogen ion concentration.
Neutralisation or acid-base indicators
The indicators change colour according to the hydrogen ion concentration of the solution and therefore are also called pH indicators.
These indicators change from a predominantly acid colour to a predominantly alkaline colour or vice-versa. The change is not sudden but takes place within a small range of pH known as colour –change interval or indicator range. The range usually extends ± 1 to pH of that particular indicator.
pH range = pK ± 1
and pK = - log K, where K = dissociation constant of indicator.
The colour change interval varies approximately over 2 units of pH; within this range indicator changes from one colour to another colour. Example – For methyl red the colour is red at pH 4.2 (or less) and a distinct yellow at pH 6.3 (or above). In pH range 4.2 to 6.3 the indicator colour is a mixture of red and yellow colour. Thus the colour –change interval is from pH 4.2 to 6.3.
pK value of methyl red is 5.0. so, in solutions whose pH is 5.1 = 4 or less, the indicator is clear red and in solutions of pH 5+1 = 6 or kore , the colour is distinctly yellow. Hence the colour change interval is pH 4 to 6.
For most acid-base titrations it is possible to select an indicator which exhibits a distinct colour change at a pH close to the equivalence point. Mixed indicators are used when a sharp colour change occurs over a very narrow and selected range of pH . (Table 1) .
Table 1 : Examples of indicators
Indicator pH range Acid colour Basic colourCresol redThymol blueBromophenol blueMethyl orangeCongro redBromocresol greenMehyl redBromothymol bluePhenolphthaleinThymol phthalein
2.0-1.81.2-2.82.8-4.63.0-4.63.0-5.03.6-5.2.2-6.36.0-7.68.3-10.09.3-10.5
RedRed
YellowRedBlue
YellowRed
YellowColourlessColourless
YellowYellow
BlueYellow
RedBlue
YellowBluePinkPink
Neutralisation curves and Selection of Indicator
The neutralization process is followed by studying the change in hydrogen ion concentration. The change in pH in the region of equivalence point enables the choice of indicator with minimum titration error. The curve obtained by plotting pH on the y –axis against the volume of alkali added on the x-axis is known as neutralization curve.
1. Neutralization of a strong acid with a strong base – Consider the reaction between HCl and NaOH (fig. 2) .
HCl + NaOH NaCl + H2O Or H+ + OH- H2O
Suppose we take 25 ml of 0.1 M HCL and gradually add 0.1. M NaOH. As the reaction proceeds, H+ ions from HCL get neutralized by OH- ions from NaOH and consequently
concentration of H+ ion decreases and pH of the solution increases. At the initial stages, the pH increases very gradually but in the vicinity of the equivalence point there is sharp rise in pH. At 49.9 ml of NaOH pH is 4.0; when exactly 50 ml of NaOH is added, the neutralization is just complete and pH of the solution will be 7.
When 50.1 ml of NaOH is added, the pH rises to 10. pH close to end point ranges from 4.3 – 9.7. this pH range is called inflection. The inflection depends on the concentration of the titrant and titrand.
Any indicator which shows colour change between pH 4.3 – 9.7 can be used for this titration. For example methyl orange, bromothymol blue, phenolphthalein, methyl red etc., can be (table 2.1)
Fig. 2 : pH – neutralisation curve for the titration of 0.1 M HCl with 0.1 M NaOH.
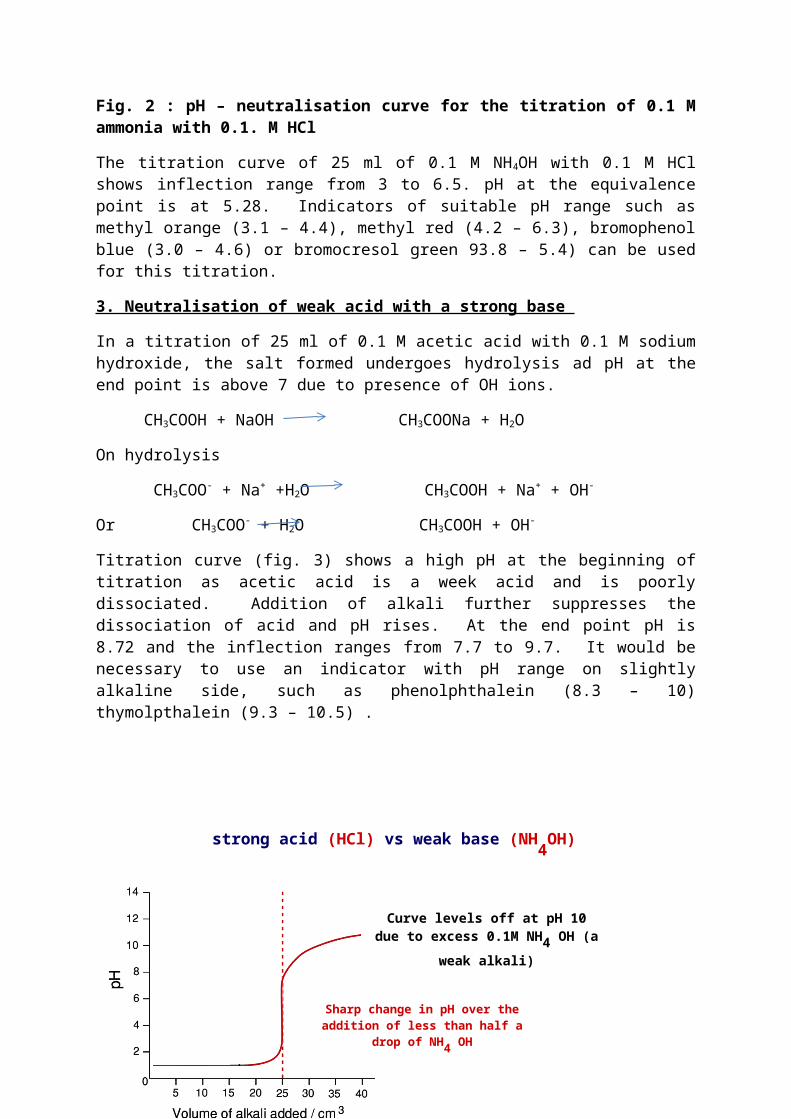
2. Neutralisation of a strong acid with a weak base.
Take the example of titration of 25 ml of 0.1. M HCl with 0.1 M aqueous ammonia solution
HCl + NH4OH NH4Cl +H2O
The salt thus hydrolyses
NH4+ + Cl- + H2O NH4OH + H+ + H+ + Cl-
Or
NH4+ + H2O NH4OH + H+
Due to formation of H+ ions, the pH at the end point is on the acidic side , i.e. < 7.
Very little pH change during the initial
20cm3
Very sharp change in pH over the addition of less than half a drop of
NaOH
pH at the start due to 0.1M HCl (strong monoprotic
acid)
strong acid (HCl) vs strong base (NaOH)
pH at the End point = 7
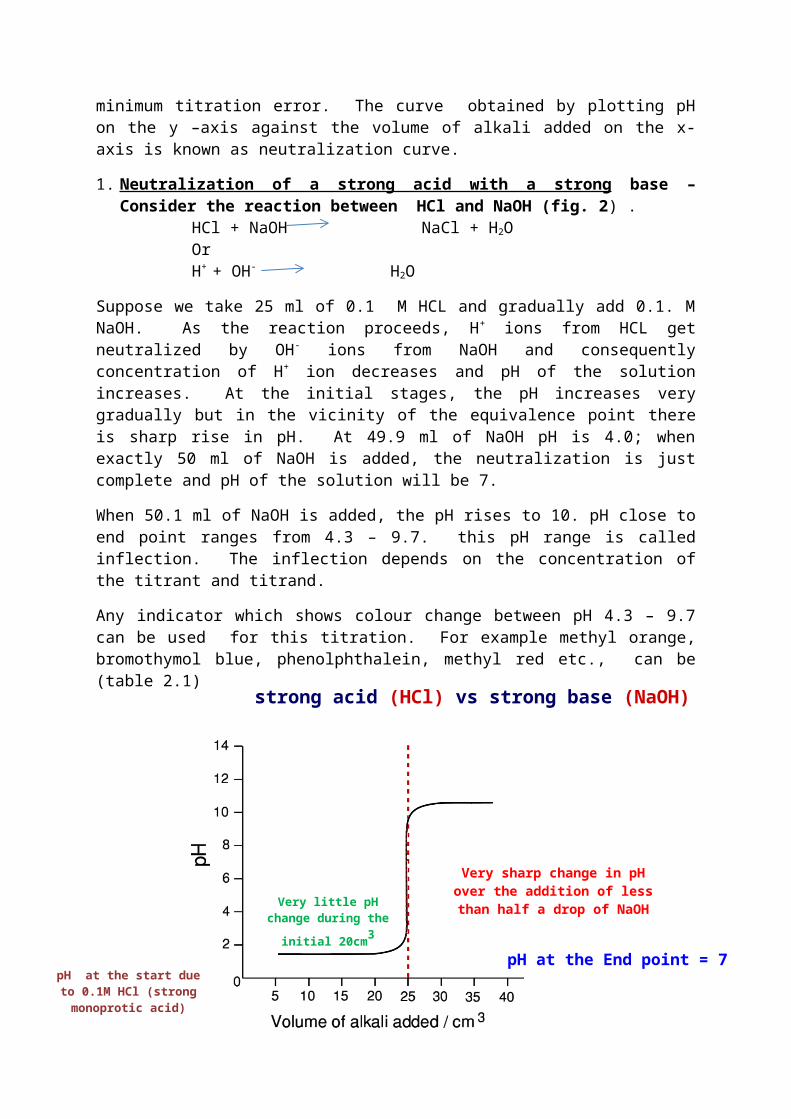
Fig. 2 : pH – neutralisation curve for the titration of 0.1 M ammonia with 0.1. M HCl
The titration curve of 25 ml of 0.1 M NH4OH with 0.1 M HCl shows inflection range from 3 to 6.5. pH at the equivalence point is at 5.28. Indicators of suitable pH range such as methyl orange (3.1 – 4.4), methyl red (4.2 – 6.3), bromophenol blue (3.0 – 4.6) or bromocresol green 93.8 – 5.4) can be used for this titration.
3. Neutralisation of weak acid with a strong base
In a titration of 25 ml of 0.1 M acetic acid with 0.1 M sodium hydroxide, the salt formed undergoes hydrolysis ad pH at the end point is above 7 due to presence of OH ions.
CH3COOH + NaOH CH3COONa + H2O
On hydrolysis
CH3COO- + Na+ +H2O CH3COOH + Na+ + OH-
Or CH3COO- + H2O CH3COOH + OH-
Titration curve (fig. 3) shows a high pH at the beginning of titration as acetic acid is a week acid and is poorly dissociated. Addition of alkali further suppresses the dissociation of acid and pH rises. At the end point pH is 8.72 and the inflection ranges from 7.7 to 9.7. It would be necessary to use an indicator with pH range on slightly alkaline side, such as phenolphthalein (8.3 – 10) thymolpthalein (9.3 – 10.5) .
Steady pH change
Sharp change in pH over the addition of less than half a drop of NaOH
Curve levels off at pH 13 due to excess 0.1M NaOH
(a strong alkali)
weak acid (CH3
COOH) vs strong base (NaOH)
The equivalence point here is at a pH 8.3 ie >7. Phenolphthalein is an indicator that changes color at this equivalence point.
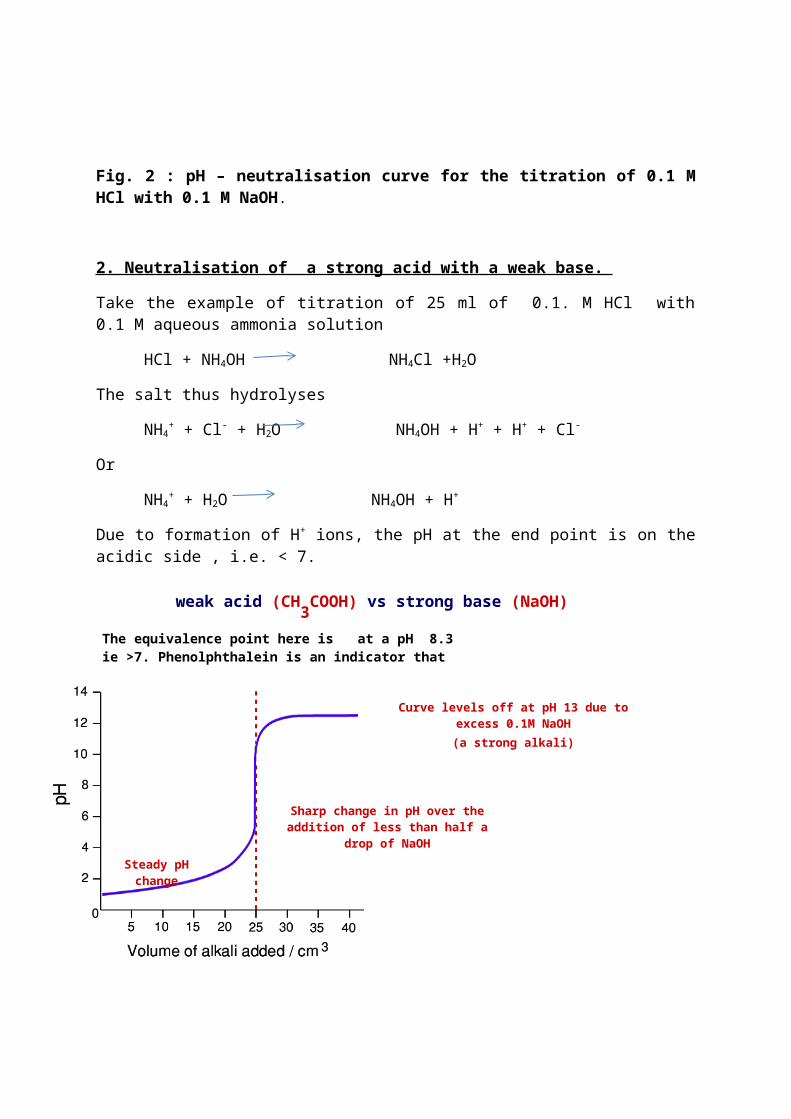
Fig. 3:pH – neutralisation curve for the titration of 0.1. MCH3COOH with 0.1 M NaOH
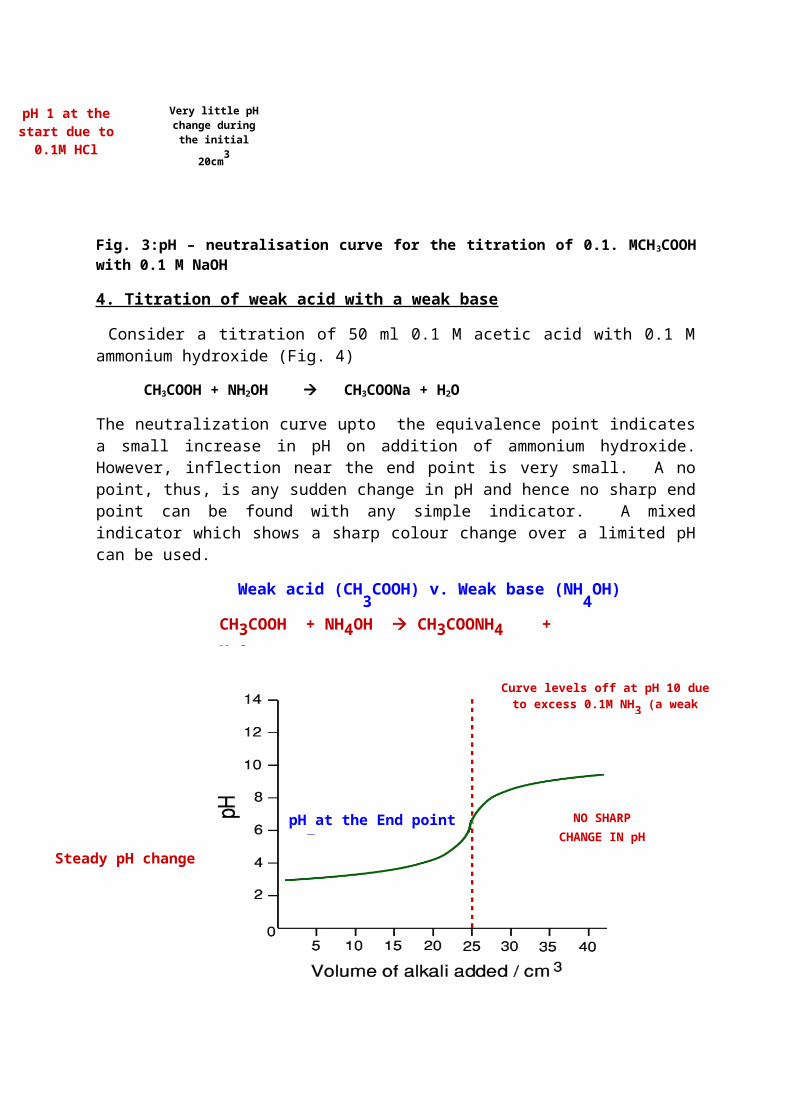
4. Titration of weak acid with a weak base
Consider a titration of 50 ml 0.1 M acetic acid with 0.1 M ammonium hydroxide (Fig. 4)
CH3COOH + NH2OH CH3COONa + H2O
The neutralization curve upto the equivalence point indicates a small increase in pH on addition of ammonium hydroxide. However, inflection near the end point is very small. A no point, thus, is any sudden change in pH and hence no sharp end point can be found with any simple indicator. A mixed indicator which shows a sharp colour change over a limited pH can be used.
Fig. 4 pH neutralisation curve for the titration of 0.1 MCH3COOH with 0.1 MNH4OH
Very little pH change during the
initial 20cm3
Sharp change in pH over the addition of less than half a drop of NH4 OH
Curve levels off at pH 10 due to excess 0.1M NH4 OH (a weak alkali)
pH 1 at the start due to 0.1M HCl
strong acid (HCl) vs weak base (NH4
OH)
Weak acid (CH3COOH) v. Weak base (NH4OH)
Steady pH change
NO SHARPCHANGE IN pH
Curve levels off at pH 10 due to excess 0.1M NH3 (a weak alkali)
CH3COOH + NH4OH CH3COONH4 + H4O
pH at the End point = 7
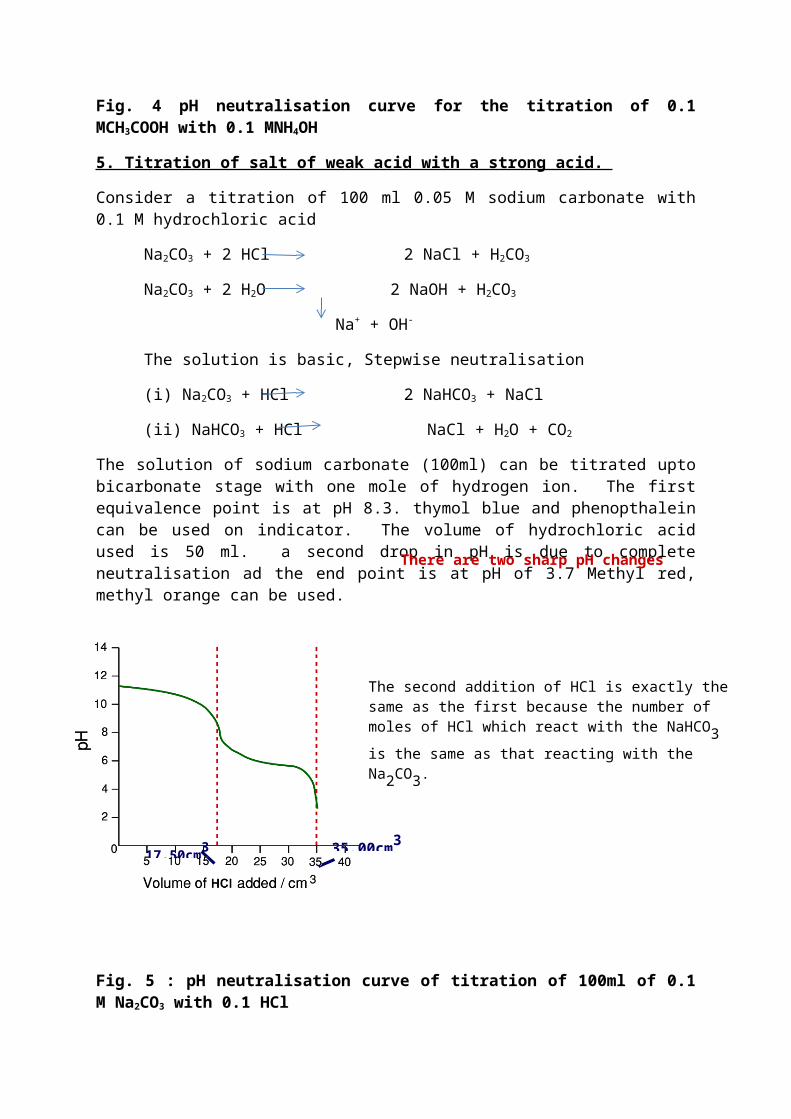
5. Titration of salt of weak acid with a strong acid.
Consider a titration of 100 ml 0.05 M sodium carbonate with 0.1 M hydrochloric acid
Na2CO3 + 2 HCl 2 NaCl + H2CO3
Na2CO3 + 2 H2O 2 NaOH + H2CO3
Na+ + OH-
The solution is basic, Stepwise neutralisation
(i) Na2CO3 + HCl 2 NaHCO3 + NaCl
(ii) NaHCO3 + HCl NaCl + H2O + CO2
The solution of sodium carbonate (100ml) can be titrated upto bicarbonate stage with one mole of hydrogen ion. The first equivalence point is at pH 8.3. thymol blue and phenopthalein can be used on indicator. The volume of hydrochloric acid used is 50 ml. a second drop in pH is due to complete neutralisation ad the end point is at pH of 3.7 Methyl red, methyl orange can be used.
Fig. 5 : pH neutralisation curve of titration of 100ml of 0.1 M Na2CO3 with 0.1 HCl
Universal or multiple range Indictors. By suitably mixing certain indicators the colour change may be made to extend over a large range of pH; such mixtures are called universal indicators.
Complexometric titrations
The complex formation reaction for titrimetric analysis should be rapid, have a well defined stoichiometry, with high equilibrium constant. The majority of complexation titrations are carried out using multidentate ligands like EDTA (Fig.2.7) or similar substances as complexones.
35.00cm3
The second addition of HCl is exactly the same as the first because the number of moles of HCl which react with the NaHCO3 is the same as that reacting with the Na2CO3.
There are two sharp pH changes
17.50cm3
Principle
Several metal ions combine with ligands (complexones) to give mostly soluble metal complexes. A metal ion sensitive indicator which is also a ligand is employed which detects the change in metal ion concentration. The colour of metal indicator complex is different from free indicator and sudden colour change is observed at the equivalence point.
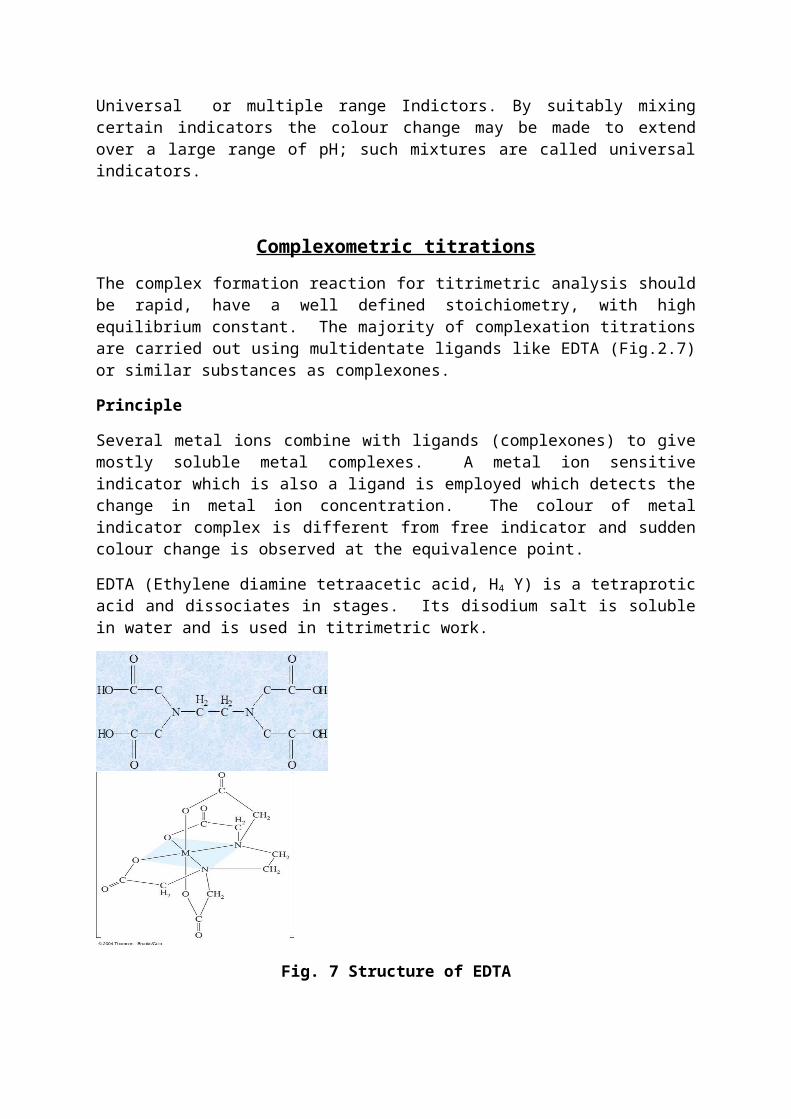
EDTA (Ethylene diamine tetraacetic acid, H4 Y) is a tetraprotic acid and dissociates in stages. Its disodium salt is soluble in water and is used in titrimetric work.
Fig. 7 Structure of EDTA
EDTA is considered to be the best complexing agent in the quantitative analytical reactions owing to the following facts.
i. Its relatively low pricedii. The spatial structure of its anion which has six donor atoms, thus corresponding with
the coordination number most frequently encountered among the metals. iii. It forms strainless 5 five membered rings on chelation iv. It reacts with all cations at least to some extent with the exception of alkali metals.
To simplify the representation of EDTA, reaction with various metals, it is assigned the formula H4Y and hence the disodium salt as Na2H2Y which gives the complex forming ion H2
Y2 in aqueous solution. The reactions with the different cations may be written as below.
M2+ + H2 Y2- ⇌ MY2 + 2H+
M3+ + H2 Y2- ⇌ MY- + 2H+
M4+ + H2 Y2 ⇌ MY + 2H+
Mn+ + H2 Y2- ⇌ (MY) (n-4)+ + 2H+
Thus the dissociation of complex formed depends of H+ ion concentration. The formation of more H+ ion may start the reverse reaction (A buffer is added to regulate the pH). Most titrations are carried out in neutral or alkaline solution. To move reaction in forward direction product must be removed, so as base is added.
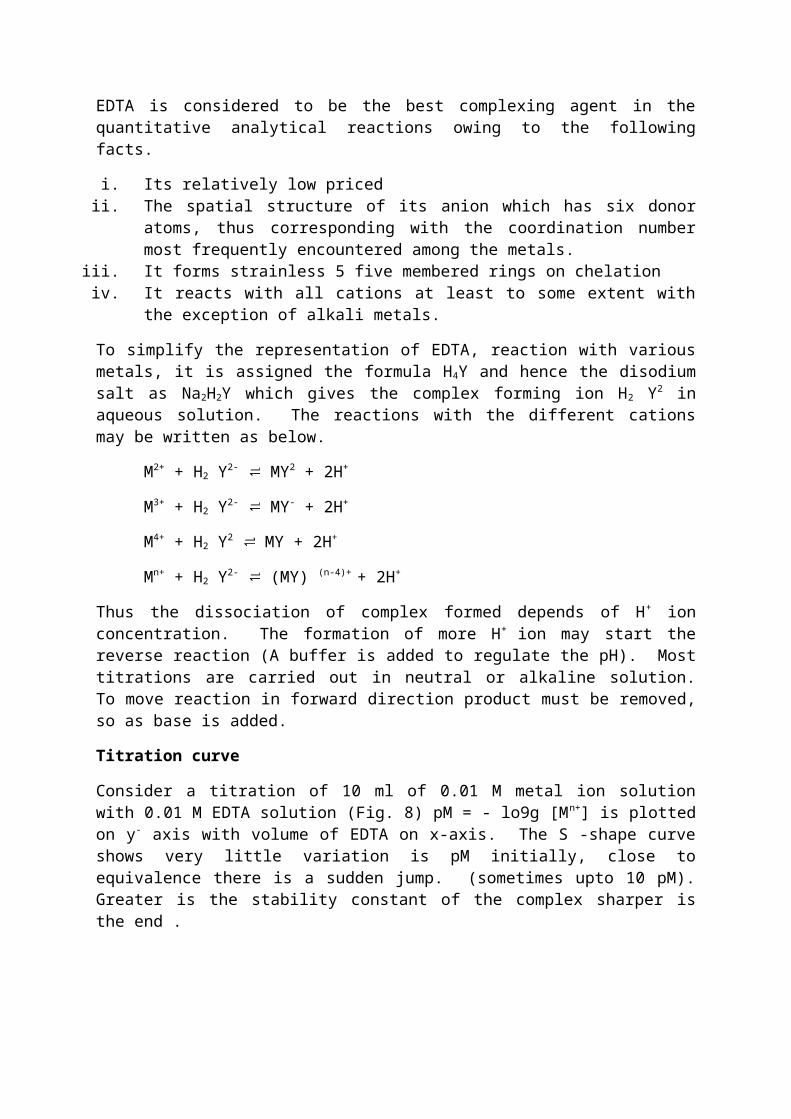
Titration curve
Consider a titration of 10 ml of 0.01 M metal ion solution with 0.01 M EDTA solution (Fig. 8) pM = - lo9g [Mn+] is plotted on y- axis with volume of EDTA on x-axis. The S -shape
curve shows very little variation is pM initially, close to equivalence there is a sudden jump. (sometimes upto 10 pM). Greater is the stability constant of the complex sharper is the end .
Fig.8 . Titration curve of the titration of 0.01 M meal ion solution with 0.01 M EDTA
Metal ion indicators (Metallochromes)
These metal sensitive indicators called metallochromes contain various chelating groups and posses resonance systems, typical of dyestuff. The use of metal ion indicator in an EDTA titration may be written as
M- In + EDTA M-EDTA + In
The colour of free indicator is markedly different from M- In complex. The M- In complex dissociates partly and during the titration freed metal is totally complexed by EDTA leaving the indicator free.
The indicator colour is affected by hydrogen ion concentration. Erichrome Black T (solochrome black) exhibits the following acid- base behaviour:
H2In- H In2 – In3-
Red pH 5.3 -7.3 Blue pH 10.5 -12.5 yellow – orange
Requisites of a metal ion indicator
1. The colour of free indicator is different from metal – indicator complex 2. The reaction will proceed if only M- In complex is less stable the M-
EDTA complex.3. The indicator should be very sensitive to free metal ion concentration 4. The colour change and detection of end point must be with in the chosen range of pH. 5. The colour reaction should be specific or at least or at least metal selective
Examples : Murexide, Erichrome blck T (solochrome black), patton and Reeder’s Indicator, Fast sulphate black F, Zincon.
The titration of a metal ion with EDTA is similar to the
titration of a strong acid (M+
) with a weak base (EDTA)
The Titration Curve has three distinct regions:
Before the equivalence point (excess Mn+)
At the equivalence point ([EDTA]=[Mn+] After the equivalence point (excess EDTA)
Precipitation titrations
Titrations involving precipitation reactions are very few, largely due to lack of suitable indicators, slow rate of reaction and uncertain composition of precipitate.
A precipitation reaction can be used for titrimetry when it satisfies the following conditions.
1. Rate of precipitation must be fast. 2. The reaction between titrand and the precipitating reagent should have definite
stoichiometry. 3. There should be no coprecipitation 4. A suitable indicator must be available.
Principle and titration curve
Most of the precipitation titrations involve use of silver nitrate and hence are called argentimetric titrations. These involve combination of ions to form a precipitate.
Cl- + agNO3 AgCl + NO-3
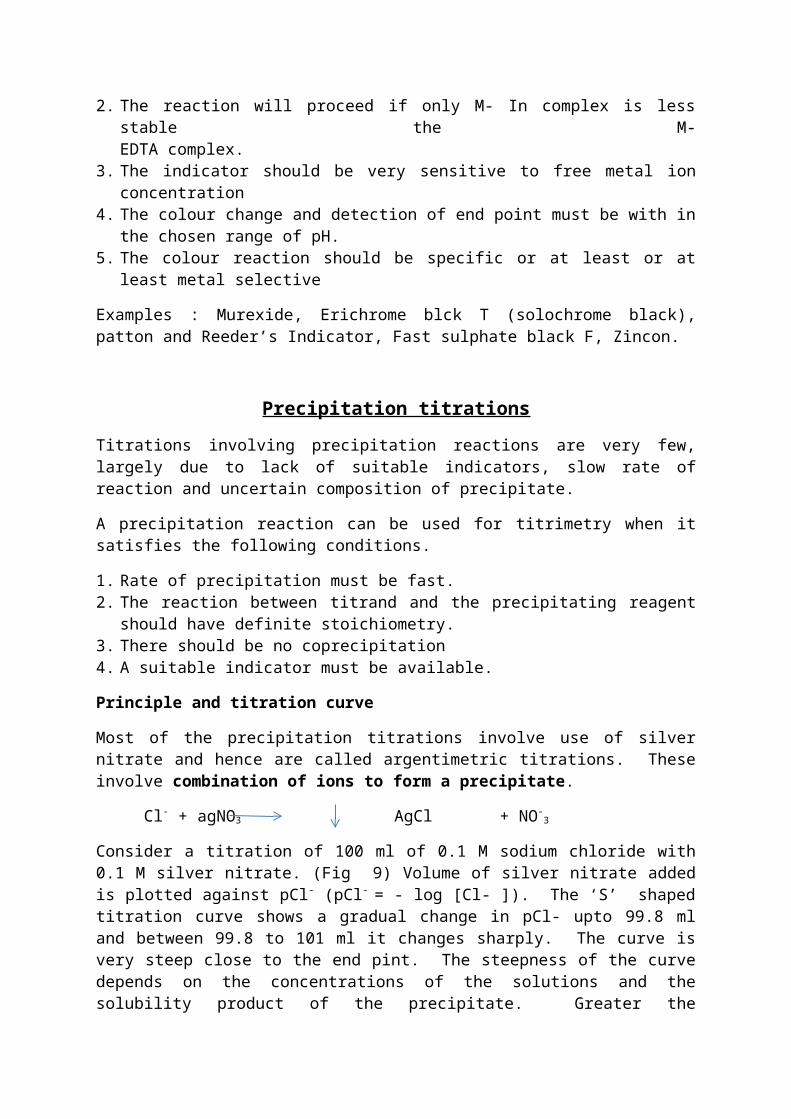
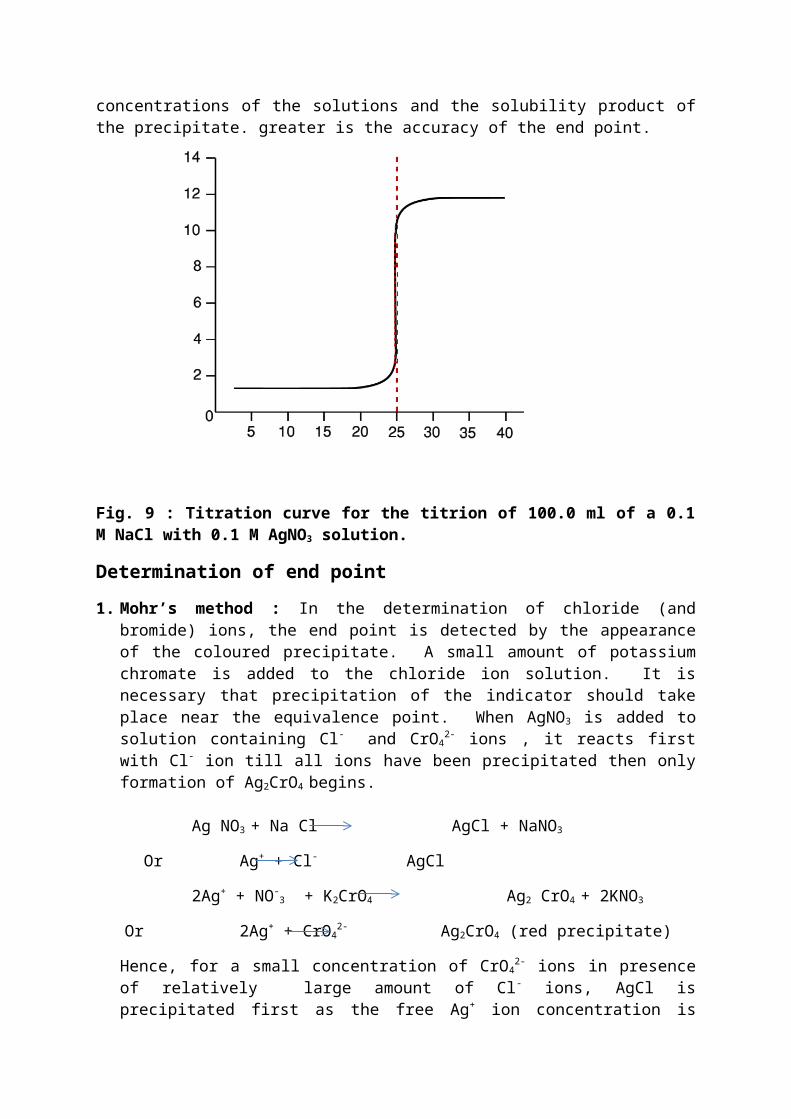
Consider a titration of 100 ml of 0.1 M sodium chloride with 0.1 M silver nitrate. (Fig 9) Volume of silver nitrate added is plotted against pCl- (pCl- = - log [Cl- ]). The ‘S’ shaped titration curve shows a gradual change in pCl- upto 99.8 ml and between 99.8 to 101 ml it changes sharply. The curve is very steep close to the end pint. The steepness of the curve depends on the concentrations of the solutions and the solubility product of the precipitate. Greater the concentrations of the solutions and the solubility product of the precipitate. greater is the accuracy of the end point.
Fig. 9 : Titration curve for the titrion of 100.0 ml of a 0.1 M NaCl with 0.1 M AgNO3
solution.
Determination of end point
1. Mohr’s method : In the determination of chloride (and bromide) ions, the end point is detected by the appearance of the coloured precipitate. A small amount of potassium
chromate is added to the chloride ion solution. It is necessary that precipitation of the indicator should take place near the equivalence point. When AgNO3 is added to solution containing Cl- and CrO4
2- ions , it reacts first with Cl- ion till all ions have been precipitated then only formation of Ag2CrO4 begins.
Ag NO3 + Na Cl AgCl + NaNO3
Or Ag+ + Cl- AgCl
2Ag+ + NO-3 + K2CrO4 Ag2 CrO4
+ 2KNO3
Or 2Ag+ + CrO42- Ag2CrO4 (red precipitate)
Hence, for a small concentration of CrO42- ions in presence of relatively large amount of
Cl- ions, AgCl is precipitated first as the free Ag+ ion concentration is never high enough to cause the solubility product of Ag2CrO4 to be exceeded. AgCl is precipitated first as the free Ag+ to be exceeded. After all Cl- ions are precipitated, on adding the next drop of AgNO3 solution gives the red coloured Ag2CrO4 and indicates the end point.
2. Volhard’s method – The end point is indicated by formation of a soluble coloured compound. For titration of Ag+ ion in presence of free nitric acid with standard potassium thiocyanate or ammonium thiocyanate solution. A solution of iorn (III) nitrate or iron (III) sulphate is used as indicator. The addition of thiocyanate solution produces first a precipitate of silver thiocynate.
Ag+ + SCN- AgSCN When this reaction is complete, the slight excess of thiocyanate produces a reddish brown colouration due to the formation of complex ion: Fe3+ SCN- [Fe(SCN)]2+
3. Fajan’s method : Adsorption indicators – K. Fajan introduced the use of adsorption indicators in precipitation titration. The action of indicator is due to the fact that at the equivalence point the indicator is adsorbed by the precipitate and during this process of adsorption a change is colour occurs. These indicators are usually organic acid dyes i.e. Fluorescein and eosin series, used as their sodium salt, or basic dyes viz, Rhodamine seris as their halogen salt. Action of these indicators is based on the properties of colloids. A precipitate has a tendency to adsorb its own ion; this is known as primary adsorption. This is followed by oppositely charged ions holding on to the precipitate by way of secondary adsorption. When AgNO3 is added to NaCl solution, a precipitate of AgCl is formed. This precipitate is surrounded by excess of Na+ and Cl- ions and it absorbs its own ion. i.e. Cl- ion by primary adsorption followed by Na+ ion as secondary adsorption. Just after the end point there are no free Cl- ions and there is an excess of Ag+ ion. The precipitate of AgCl now adsorbs Ag+ ion by primary adsorption and NO-
3 ion by secondary adsorption. If fluorescein is also present in the solution, the negative fluorescein ion gets more strongly adsorbed than NO-
3 ion and the precipitate appears pink .
Before end point : AgCl // Cl- // Na+
Precipitate Primary adsorption Secondary adsorption After end point : AgCl // Ag+ // NO-
3
Precipitate Primary adsorption Secondary adsorption
In presence of indicator: AgCl // Ag+ // Fluorescein- Pink
Precipitate Primary adsorption Secondary adsorption
4. Turbidity method - The appearance of turbidity sometimes marks the end point of a reaction. In Gay Lussac’s method of estimation of silver with chloride ion, the turbidity caused by the addition of a few drops of one solution to the other shows that end point is not reached. The titration is continued until the addition of solution produces no turbidity.
AgNO3 + NaCl AgCl + NaNO3
Redox titrations
Oxidation is defined as a process accompanied by loss of electron(s) whereas reduction is gain of electron and in a redox reaction the two occur simultaneously. Oxidising agent is a substance which gains electrons and itself gets reduced. On the other hand, reducing agent losses electron and gets oxidized in the process of reduction.
Principle and titration curve – In an oxidation-reduction titrations, the substance to be determined is either oxidized or reduced. Several elements which show variable oxidation states take part in redox reactions. These reactions are fast and quantitative. When a standard solution of oxidizing agent is used for titrations, it is termed a oxidimetry. Some common oxidizing agents used are potassium permanganate (permanganatometry), potassium dischromate (dichrometry), ceric sulphate (ceremetry), iodine (Iodimetry) potassium iodate etc. The determination of oxidizing agent by a standard solution of a reducing agent is called reductimetry. Some primary standard reducing agents are oxalic acid, stannous chloride, sodium arsenite.
Titration curve -
Consider a titration of 100 ml of 0.1 M Ferrous ion solution with 0.1 M ceric ion solution in presence of dil sulphuric acid (Fig 10)
Fig. 10 Change of potential in the titration of 100 ml 0.1 M Fe2+, Fe3+, Ce3+ ions.
As there are no Ce3+ ions, only ferrous- ferric system exists and the potential is calculated from E1, After the end point, all the Fe2+ ions are oxidized to Fe3+ and only Ce4+ /Ce3+ system will exist. The potential is given by E2.
E1 = 0.75 + 0.0591
1 log ¿¿
E1 = 1.45 + 0.0591
1 log ¿¿
A sharp change in potential is observed close to equivalence point. An ideal redox indicator should show a colour change between 0.93 V to 1.27 volt.
Indicators in redox titrations
1. Self indicator – Some redox reactions can be carried out without the use of any indicator as the reagent itself shows a sharp colour change at the end point. Such reagents are self indictors. Example, KMnO4 solution. During the course of redox reaction Mn2+ ion which is colourless. At the end point, the solution is colourless as KMnO4 is utilized in oxidizing say, from Fe2+ to Fe3+. First drop of KMnO4 after the end point is not consumed in redox process and remains as MnO4
- imparting a faint pink colour to the solution. The colour change is not related to redox potential.
2. External Indicators – completion of reaction is indicated by the use of a substance outside the reaction mixture. Such a substance is external indicator. Example; Potassium hexacyanoferrate (III) is an external indicator during the estimation of Fe2+ ions with potassium dichromate in acid medium. Fe2+ forms blue coloured complex of ferro- ferricyanide.
Fe2+ + [Fe (CN)6]3- [Fe, Fe (CN)6]- blue When whole of Fe2+ ion gets oxidized by dichromate, the indicator will not be give blue colour. Test is carried out on spot plate by withdrawing a drop of reaction mixture and testing with K3 [Fe(CN)6].
3. Redox indicators - these indicators change colour when the potential of the solution reaches a definite value; the colour change does not depend on the specific chemical property of oxidizing or reducing agent. These can be reversibly oxidized or reduced and both the forms have different colour.
Indox + ne- Indred The range of potential in which the indicator changes it colour must be within the limits of sharp change in potential in the titration curve. Example –diphenylamine is colourless in reduced form at a potential below 0.73 V and at 0.79 V and above it changes to oxidized form which is blue- violet in colour. Between 0.73 – 0.79 V the colour changes from colourless to blue and this range is called transition potential. (Table )
Table Example of redox indicators
Indicator Oxidized form Reduced form Transition potential V1.10Phenathroline-iron complexDiphenylamine
Methylene blue
Blue
Violet
Blue
Red
Colourless
Colourless
1.11
0.76
0.53
Ferroin Blue Red 1.2Examples of Redox titrations
1. Permangnatometry It s based on reaction of KMnO4 as an oxidizing agent. Oxidation may proceed in acid or in alkaline solutions. Oxidation in acid solution
MnO4- + 8H+ + 5e- Mn2 + 4H2O ; EO =1.51V
Pink coloured MnO4- ion is reduced to Mn2+ which is colourless. The standard electrode
potential of MnO4-/Mn2+ is 1.51 V and hence it is a strong oxidizing agent. H2SO4 is
most suitable acid as it has no action upon permanganate. In dilute solution with HCl the following tales place.
2MnO4- + 10Cl- + 16H+ 2Mn2 + 5Cl2 + 8H2O.
Some KMnO4 gets used up in oxidizing Cl- and it give wrong result. Similar reaction takes place with HNO3.
Oxidation in alkaline solution MnO4
- + 3e- + 2H2O 2MnO2 + 4OH- ; E0 = 0.59 MnO4-/Mn4+
On the basis of E0 values KMnO4 is stronger oxidizing agent in acid medium.
Detection of end point – No indicator is used as potassium permanganate solution acts as self – indicator.
2. Dichrometry It is based on the use of K2Cr2O7 as oxidizing agent. It is not a strong oxidizing agent as KMnO4. E0 for Cr6+/Cr3+ is 1.36 Volta., but still it has some advantages over KMnO4
-
1. K2Cr2O7 is a primary standard2. The aqs. Solutions are sable indefinitely if protected from evaporation 3. It can be used in presence of dil. HCl as it does not get reduced by it.
Cr2O72- + 14H+ 6e- 2Cr3+ + 7H2O
Yellow Green
Detection of end point
(i) Internal indicator – More commonly used internal indicators are
a) N-Phenyl anthranilic acid
b) 10% solution of diphenyl amine in conc. H2SO4-
c) 1% solution f diphenyl benzidine in conc. H2SO4-
At the end point green coloured Cr3+ ions are formed and it is difficult to ascertain end point by visual method and use of a redox, indicator is must. The suitable indicators are used in presence of syrupy phosphoric (V) acid. The potential range of diphenylamine is 0.73 – 0.791 V. Below 0.73 V. It is in reduced form and colourless and above 0.79 V it is in oxidized from i.e. Blue.
In estimation of Fe2+ ion the change in potential is from 0.95 – 1.4 V and diphenylamine should be unsuitable. However when phosphoric acid is added, it lowers the
concentration of Fe3+ by complexing it, as a result the sharp change in curve begins at lower potentials of 0.71 V and diphenylamine could thus be used.
ii) External indicator – Potassium hexacyanoferrate (III)
3. Iodimetry When a standard solution of iodine is used it is termed iodimetry. Standard solution of iodine is prepared by dissolving I2 in KI solution. The standard electrode potential. E0 I2/21- is 0.534 Volts. When an excess of I- is present then a tri iodide ion is formed
KI + I2 KI3
Or I2 + I- I3-
And E0 = I/I3 = 0.535 V. Iodine is much weaker oxidizing agent as compared to KMnO4+
K2Cr2O7but is can effectively oxidize Sn3+ , H2SO3, H2S and hypo.
Two important sources of error in titrations involving iodine are 1) loss of iodine due to its volatile nature. 2) acid solution of I2 get oxidised by air.
4. Iodometry In the indirect titration the liberated iodine is estimated. An oxidising agent is treated with iodide ion and liberated iodine is estimated by titration. The common oxidising agents are potassium dichromate, cupric, ion, per oxides etc. Example
Cr2 O2-7 + 14H+ + 61- 2 Cr3+ +312 +7H2O
2Cu2+ + 41- Cu2I2 + I2 I2 + 2Na2S2O3 2NaI + Na2S4O6
Direction of end point Solution of I2 has intense yellow colour and in otherwise colourless solutions it serves as its own indicator. However, test is more sensitive by using starch as indicator. Starch reacts with I2 in presence of I- ion to give a blue- violet complex even at very low concern of I2- it can not be used in strongly acidic medium due to hydrolysis of starch. However, starch has following disadvantages a) insoluble in cold water b) instability of its suspension in water c) it gives a water soluble comples with I2; that’s why starch should be added only close to end point. Use of sodium starch glycollate has no shortcomings of starch.