Embed Size (px)
Citation preview
• Clinical case studies
• Volumetric Measurements
• Visualization & Change Tracking
• Perfusion Analysis
• PET/CT Image Analysis
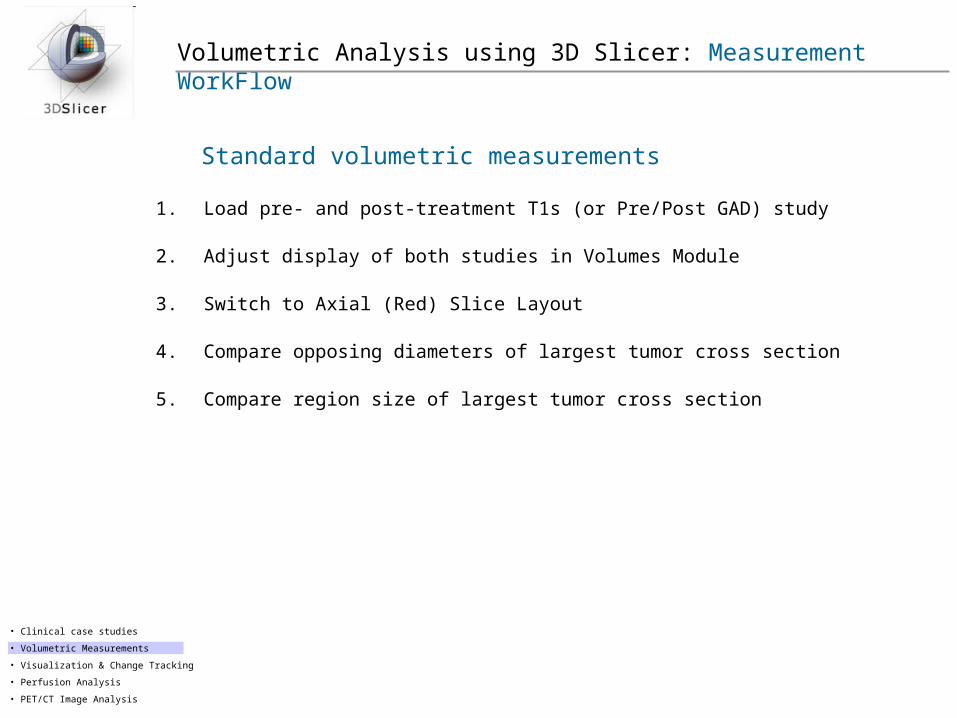
Volumetric Analysis using 3D Slicer: Measurement WorkFlow
1. Load pre- and post-treatment T1s (or Pre/Post GAD) study
2. Adjust display of both studies in Volumes Module
3. Switch to Axial (Red) Slice Layout
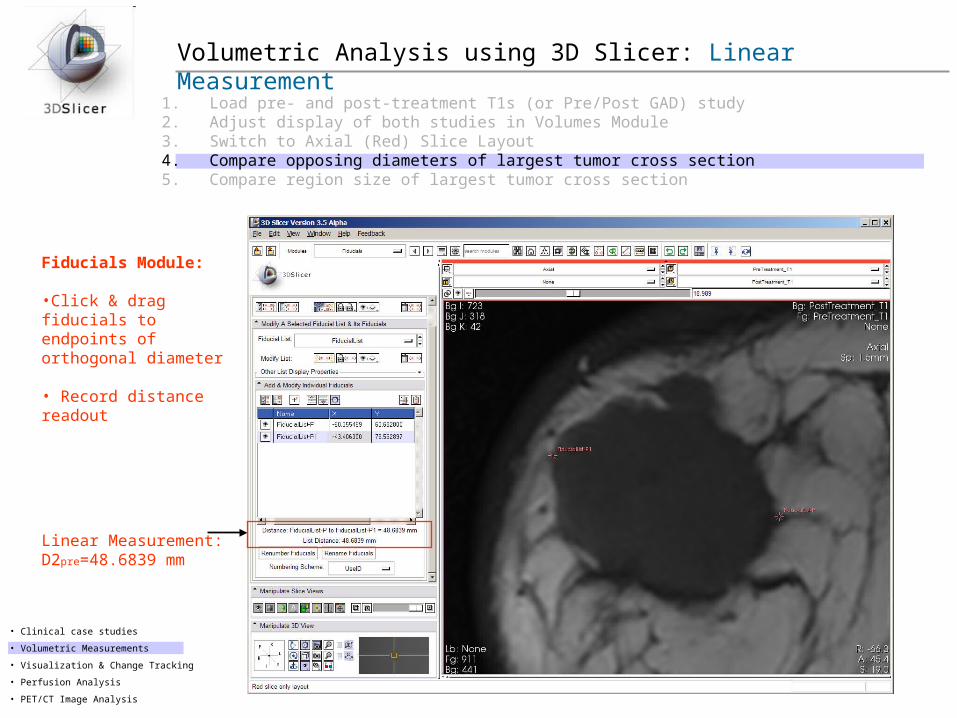
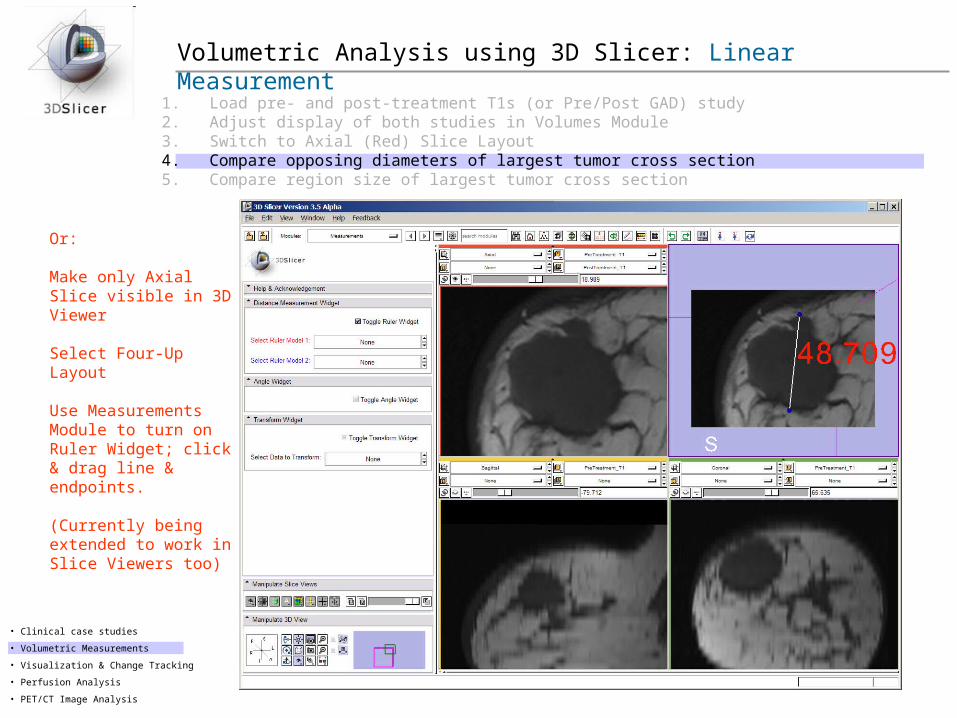
4. Compare opposing diameters of largest tumor cross section
5. Compare region size of largest tumor cross section
Standard volumetric measurements
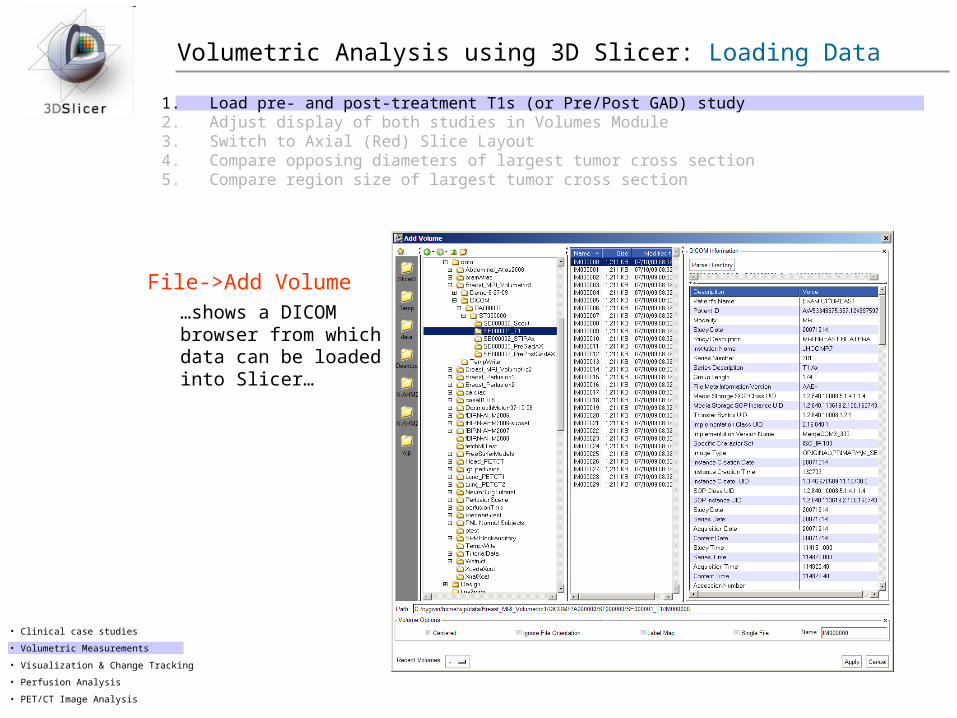
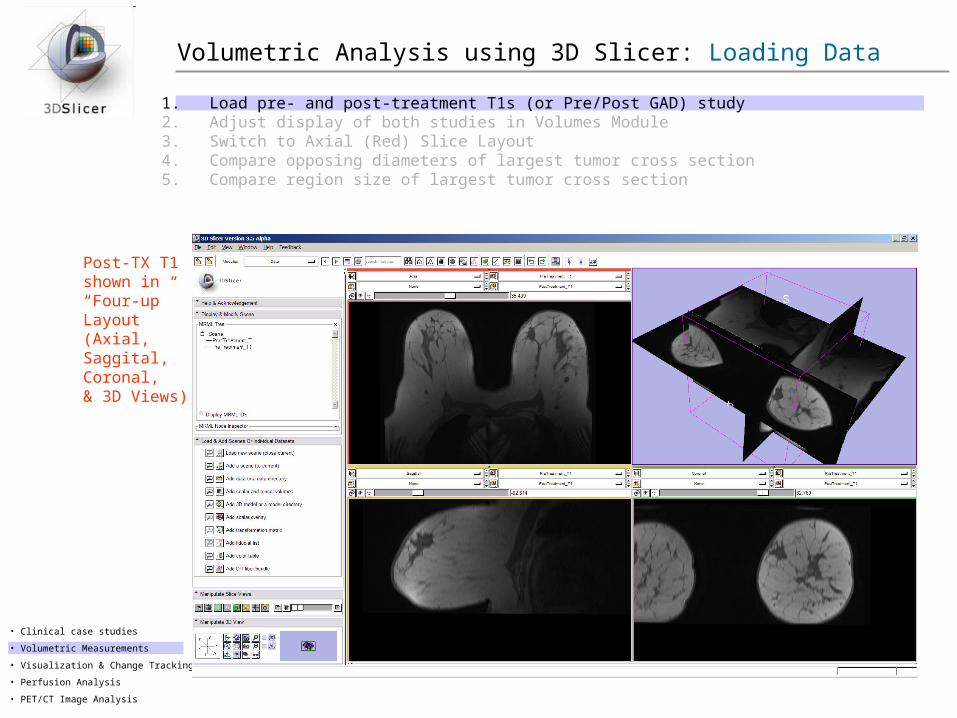
Volumetric Analysis using 3D Slicer: Loading Data
1. Load pre- and post-treatment T1s (or Pre/Post GAD) study 2. Adjust display of both studies in Volumes Module3. Switch to Axial (Red) Slice Layout 4. Compare opposing diameters of largest tumor cross section5. Compare region size of largest tumor cross section
File->Add Volume…shows a DICOM browser from whichdata can be loadedinto Slicer…
• Clinical case studies
• Volumetric Measurements
• Visualization & Change Tracking
• Perfusion Analysis
• PET/CT Image Analysis
Volumetric Analysis using 3D Slicer: Loading Data
1. Load pre- and post-treatment T1s (or Pre/Post GAD) study 2. Adjust display of both studies in Volumes Module3. Switch to Axial (Red) Slice Layout 4. Compare opposing diameters of largest tumor cross section5. Compare region size of largest tumor cross section
• Clinical case studies
• Volumetric Measurements
• Visualization & Change Tracking
• Perfusion Analysis
• PET/CT Image Analysis
Post-TX T1shown in“Four-up” Layout(Axial,Saggital,Coronal,& 3D Views)
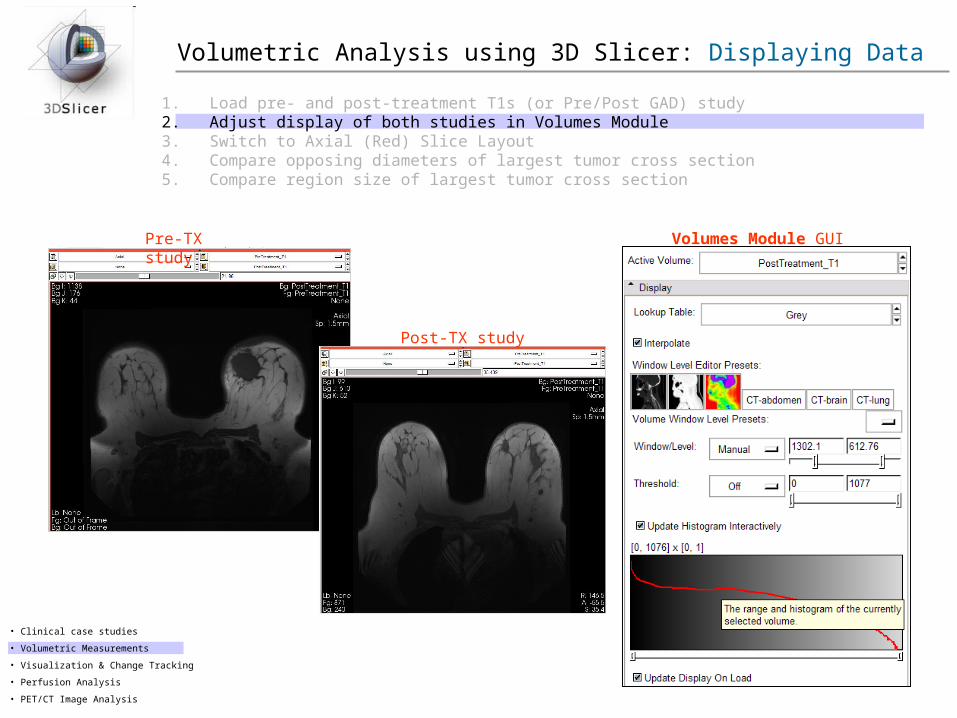
Volumetric Analysis using 3D Slicer: Displaying Data
1. Load pre- and post-treatment T1s (or Pre/Post GAD) study 2. Adjust display of both studies in Volumes Module3. Switch to Axial (Red) Slice Layout 4. Compare opposing diameters of largest tumor cross section5. Compare region size of largest tumor cross section
• Clinical case studies
• Volumetric Measurements
• Visualization & Change Tracking
• Perfusion Analysis
• PET/CT Image Analysis
Volumes Module GUIPre-TX study
Post-TX study
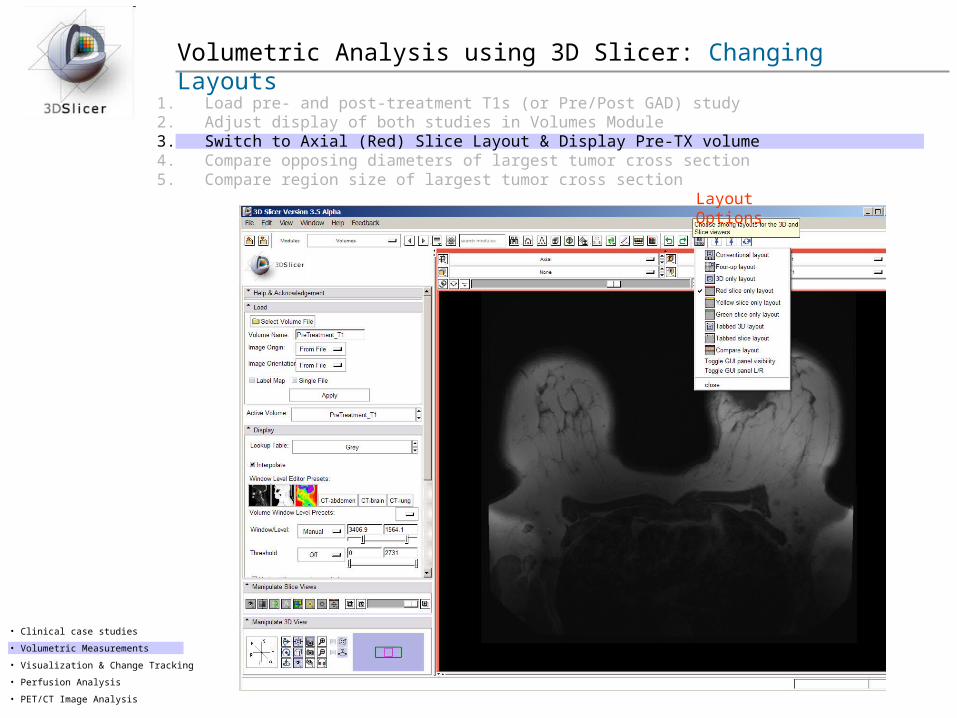
Volumetric Analysis using 3D Slicer: Changing Layouts
1. Load pre- and post-treatment T1s (or Pre/Post GAD) study 2. Adjust display of both studies in Volumes Module3. Switch to Axial (Red) Slice Layout & Display Pre-TX volume4. Compare opposing diameters of largest tumor cross section5. Compare region size of largest tumor cross section
• Clinical case studies
• Volumetric Measurements
• Visualization & Change Tracking
• Perfusion Analysis
• PET/CT Image Analysis
Layout Options
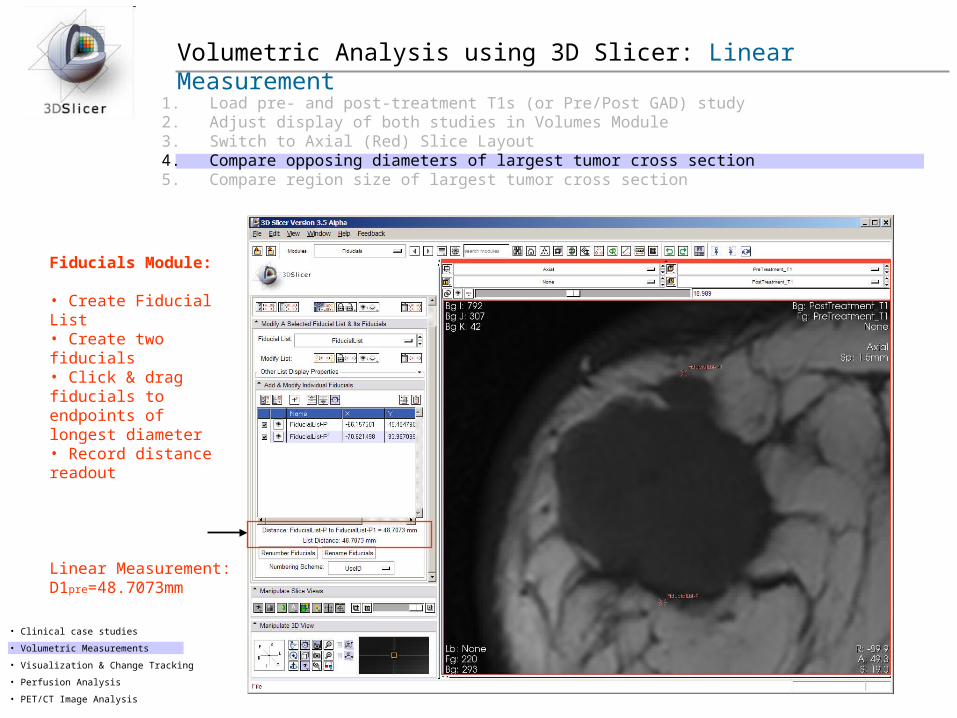
Volumetric Analysis using 3D Slicer: Linear Measurement
1. Load pre- and post-treatment T1s (or Pre/Post GAD) study 2. Adjust display of both studies in Volumes Module3. Switch to Axial (Red) Slice Layout 4. Compare opposing diameters of largest tumor cross section5. Compare region size of largest tumor cross section
• Clinical case studies
• Volumetric Measurements
• Visualization & Change Tracking
• Perfusion Analysis
• PET/CT Image Analysis
Fiducials Module:
• Create Fiducial List• Create two fiducials• Click & drag fiducials to endpoints of longest diameter• Record distance readout
Linear Measurement:D1pre=48.7073mm
Volumetric Analysis using 3D Slicer: Linear Measurement
1. Load pre- and post-treatment T1s (or Pre/Post GAD) study 2. Adjust display of both studies in Volumes Module3. Switch to Axial (Red) Slice Layout 4. Compare opposing diameters of largest tumor cross section5. Compare region size of largest tumor cross section
• Clinical case studies
• Volumetric Measurements
• Visualization & Change Tracking
• Perfusion Analysis
• PET/CT Image Analysis
Fiducials Module:
•Click & drag fiducials to endpoints of orthogonal diameter
• Record distance readout
Linear Measurement:D2pre=48.6839 mm
Volumetric Analysis using 3D Slicer: Linear Measurement
1. Load pre- and post-treatment T1s (or Pre/Post GAD) study 2. Adjust display of both studies in Volumes Module3. Switch to Axial (Red) Slice Layout 4. Compare opposing diameters of largest tumor cross section5. Compare region size of largest tumor cross section
• Clinical case studies
• Volumetric Measurements
• Visualization & Change Tracking
• Perfusion Analysis
• PET/CT Image Analysis
Or:
Make only Axial Slice visible in 3D Viewer
Select Four-Up Layout
Use Measurements Module to turn on Ruler Widget; click & drag line & endpoints.
(Currently being extended to work in Slice Viewers too)
Volumetric Analysis using 3D Slicer: Linear Measurement
• Clinical case studies
• Volumetric Measurements
• Visualization & Change Tracking
• Perfusion Analysis
• PET/CT Image Analysis
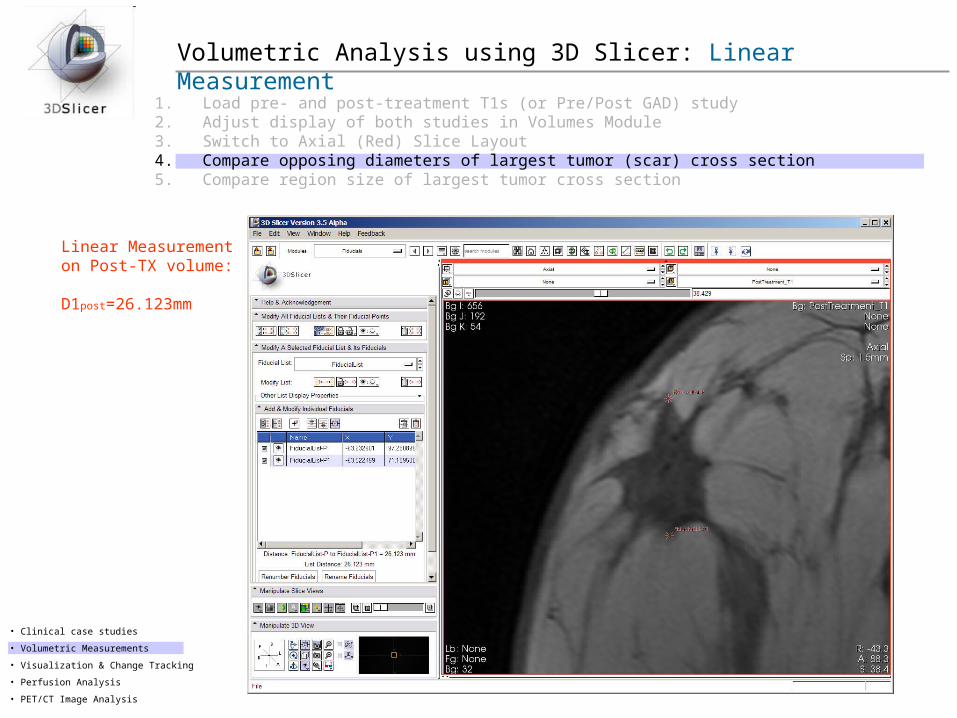
Linear Measurementon Post-TX volume:
D1post=26.123mm
1. Load pre- and post-treatment T1s (or Pre/Post GAD) study 2. Adjust display of both studies in Volumes Module3. Switch to Axial (Red) Slice Layout 4. Compare opposing diameters of largest tumor (scar) cross section5. Compare region size of largest tumor cross section
Volumetric Analysis using 3D Slicer: Linear Measurement
• Clinical case studies
• Volumetric Measurements
• Visualization & Change Tracking
• Perfusion Analysis
• PET/CT Image Analysis
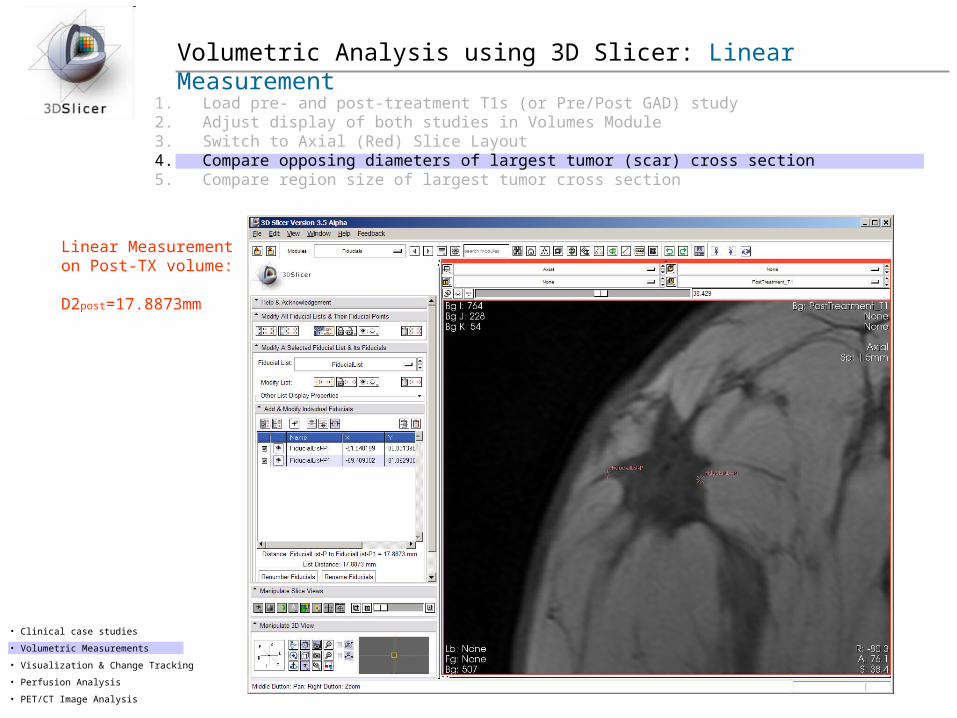
Linear Measurementon Post-TX volume:
D2post=17.8873mm
1. Load pre- and post-treatment T1s (or Pre/Post GAD) study 2. Adjust display of both studies in Volumes Module3. Switch to Axial (Red) Slice Layout 4. Compare opposing diameters of largest tumor (scar) cross section5. Compare region size of largest tumor cross section
Volumetric Analysis using 3D Slicer: ROI Comparison
• Clinical case studies
• Volumetric Measurements
• Visualization & Change Tracking
• Perfusion Analysis
• PET/CT Image Analysis
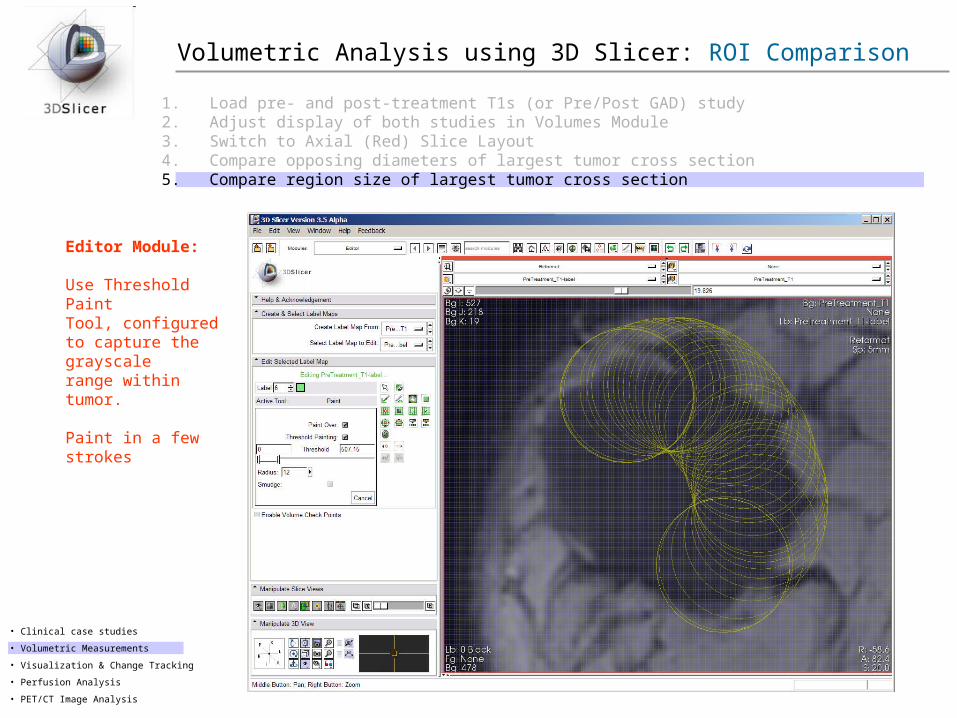
Editor Module: Use Threshold PaintTool, configuredto capture the grayscale range within tumor.
Paint in a fewstrokes
1. Load pre- and post-treatment T1s (or Pre/Post GAD) study 2. Adjust display of both studies in Volumes Module3. Switch to Axial (Red) Slice Layout 4. Compare opposing diameters of largest tumor cross section5. Compare region size of largest tumor cross section
Volumetric Analysis using 3D Slicer: ROI Comparison
• Clinical case studies
• Volumetric Measurements
• Visualization & Change Tracking
• Perfusion Analysis
• PET/CT Image Analysis
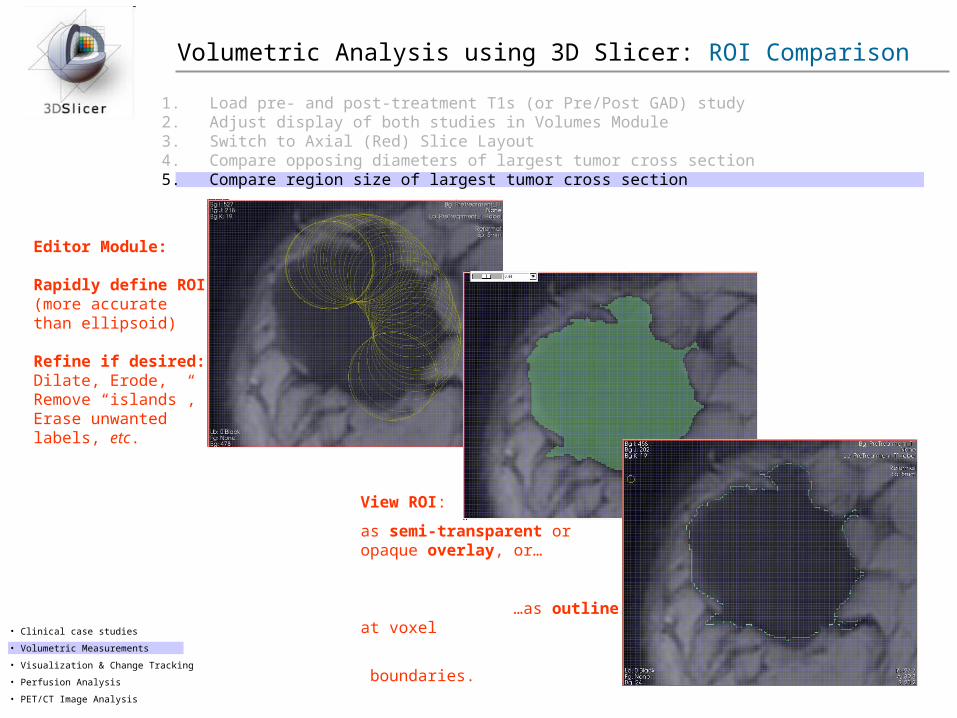
Editor Module: Rapidly define ROI(more accurate than ellipsoid)
Refine if desired:Dilate, Erode, Remove “islands”,Erase unwanted labels, etc.
1. Load pre- and post-treatment T1s (or Pre/Post GAD) study 2. Adjust display of both studies in Volumes Module3. Switch to Axial (Red) Slice Layout 4. Compare opposing diameters of largest tumor cross section5. Compare region size of largest tumor cross section
View ROI:
as semi-transparent or opaque overlay, or…
…as outline at voxel
boundaries.
Volumetric Analysis using 3D Slicer: ROI Comparison
• Clinical case studies
• Volumetric Measurements
• Visualization & Change Tracking
• Perfusion Analysis
• PET/CT Image Analysis
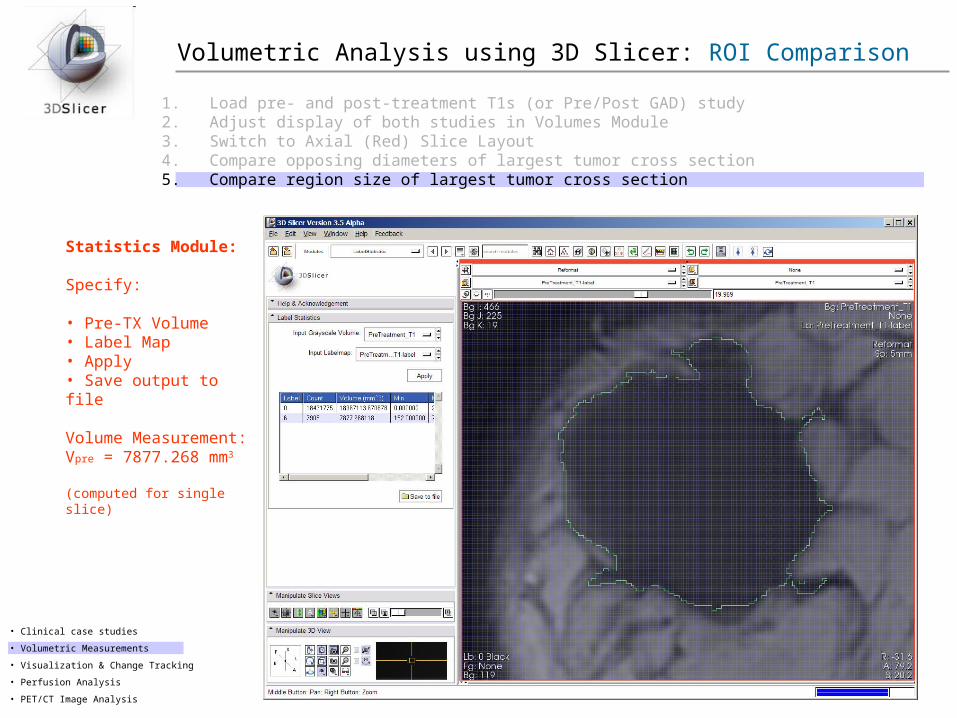
Statistics Module: Specify:
• Pre-TX Volume• Label Map• Apply• Save output to file
Volume Measurement:Vpre = 7877.268 mm3
(computed for single slice)
1. Load pre- and post-treatment T1s (or Pre/Post GAD) study 2. Adjust display of both studies in Volumes Module3. Switch to Axial (Red) Slice Layout 4. Compare opposing diameters of largest tumor cross section5. Compare region size of largest tumor cross section
Volumetric Analysis using 3D Slicer: ROI Comparison
• Clinical case studies
• Volumetric Measurements
• Visualization & Change Tracking
• Perfusion Analysis
• PET/CT Image Analysis
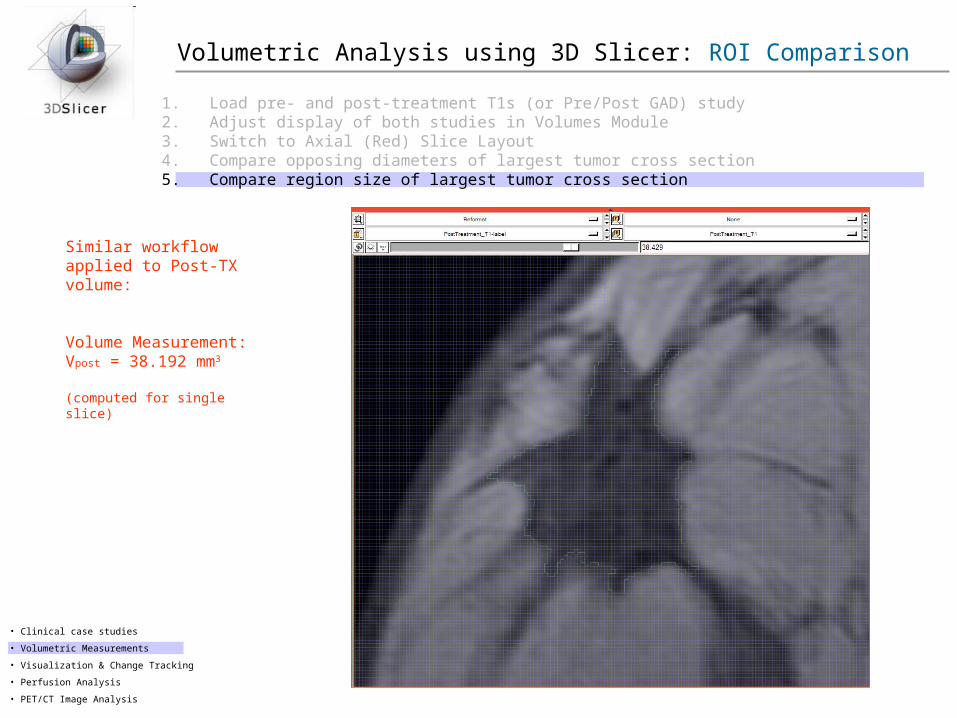
Similar workflow applied to Post-TX volume:
Volume Measurement:Vpost = 38.192 mm3
(computed for single slice)
1. Load pre- and post-treatment T1s (or Pre/Post GAD) study 2. Adjust display of both studies in Volumes Module3. Switch to Axial (Red) Slice Layout 4. Compare opposing diameters of largest tumor cross section5. Compare region size of largest tumor cross section
Volumetric Analysis using 3D Slicer: ROI Comparison
• Clinical case studies
• Volumetric Measurements
• Visualization & Change Tracking
• Perfusion Analysis
• PET/CT Image Analysis
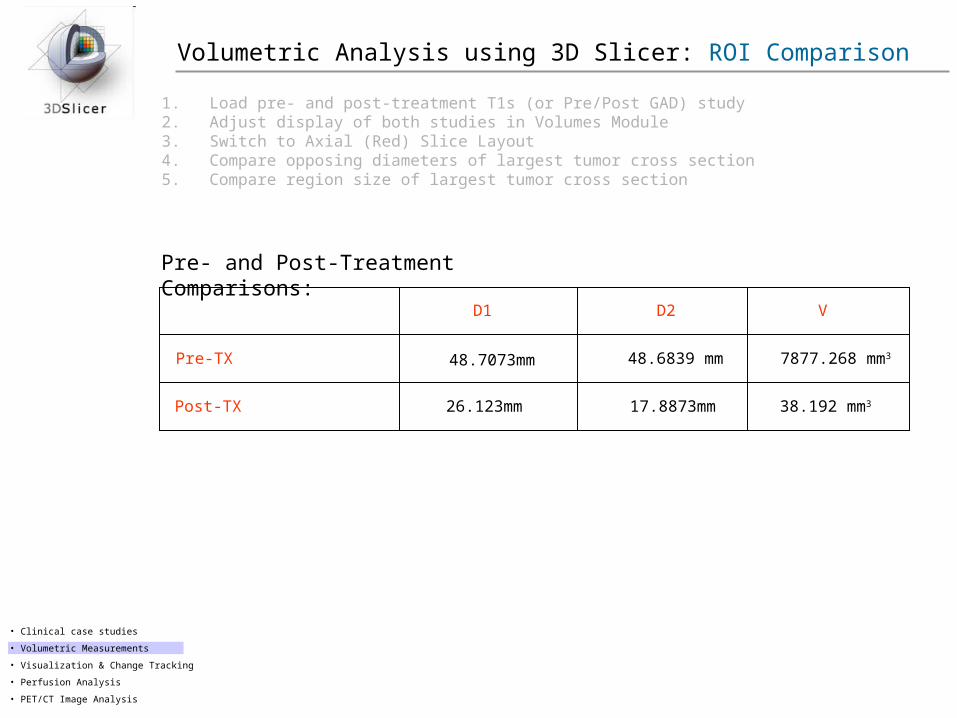
Pre- and Post-Treatment Comparisons:
1. Load pre- and post-treatment T1s (or Pre/Post GAD) study 2. Adjust display of both studies in Volumes Module3. Switch to Axial (Red) Slice Layout 4. Compare opposing diameters of largest tumor cross section5. Compare region size of largest tumor cross section
Post-TX
Pre-TX
VD2D1
38.192 mm3
7877.268 mm3
17.8873mm26.123mm
48.6839 mm48.7073mm
• Clinical case studies
• Volumetric Measurements
• Visualization & Change Tracking
• Perfusion Analysis
• PET/CT Image Analysis
Volumetric Analysis using 3D Slicer: Volume Change Analysis
1. Create left breast volume of interest (for both pre- and post-TX)
2. Mask out background using Editor Tools:
3. Run MRI bias field correction (10 iterations):
4. Run histogram matching: input = preTX, ref = post-TX
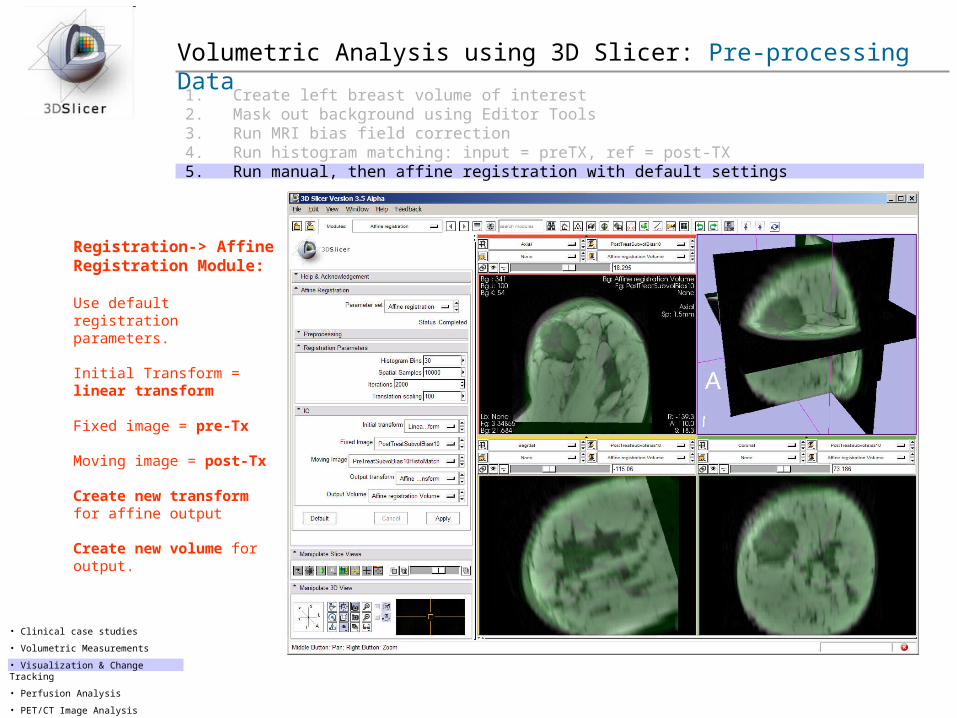
5. Run manual, then affine registration with default settings
Step B. Perform Change Tracking Analysis on registered datasets
6. Use ChangeTracker Wizard
Pre-process Data & Perform Volume Change Analysis
Step A. Prepare data for registration & register pre- and post-TX
• Clinical case studies
• Volumetric Measurements
• Visualization & Change Tracking
• Perfusion Analysis
• PET/CT Image Analysis
Volumetric Analysis using 3D Slicer: Pre-processing Data
1. Create left breast volume of interest for pre- and post-TX datasets2. Mask out background using Editor Tools3. Run MRI bias field correction4. Run histogram matching: input = preTXbiascorr, ref = postTXbiascorr5. Run manual, then affine registration with default settings
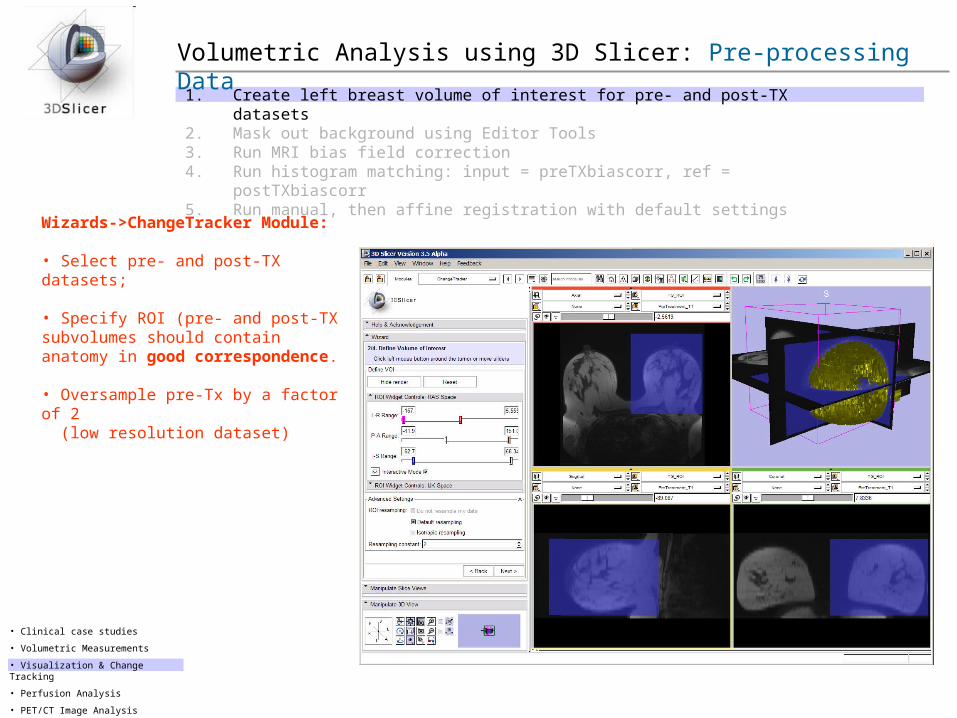
Wizards->ChangeTracker Module:
• Select pre- and post-TX datasets;
• Specify ROI (pre- and post-TX subvolumes should contain anatomy in good correspondence.
• Oversample pre-Tx by a factor of 2 (low resolution dataset)
• Clinical case studies
• Volumetric Measurements
• Visualization & Change Tracking
• Perfusion Analysis
• PET/CT Image Analysis
Volumetric Analysis using 3D Slicer: Pre-processing Data
1. Create left breast volume of interest for pre- and post-TX datasets2. Mask out background using Editor Tools3. Run MRI bias field correction4. Run histogram matching: input = preTX, ref = post-TX5. Run manual, then affine registration with default settings
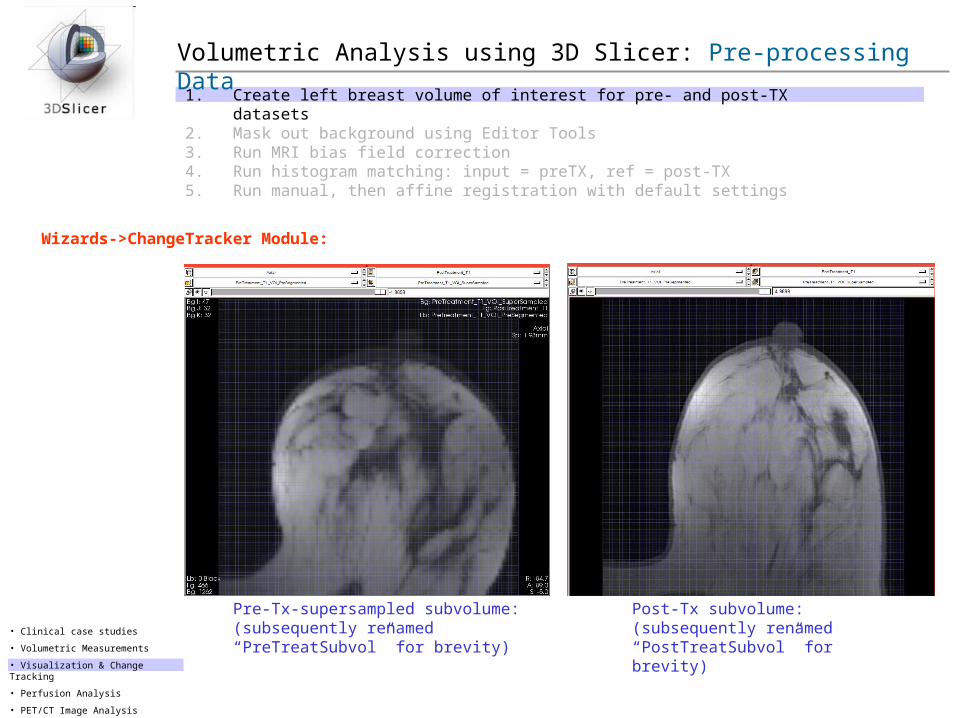
Wizards->ChangeTracker Module:
Pre-Tx-supersampled subvolume:(subsequently renamed “PreTreatSubvol” for brevity)
Post-Tx subvolume:(subsequently renamed “PostTreatSubvol” for brevity)
• Clinical case studies
• Volumetric Measurements
• Visualization & Change Tracking
• Perfusion Analysis
• PET/CT Image Analysis
Volumetric Analysis using 3D Slicer: Pre-processing Data
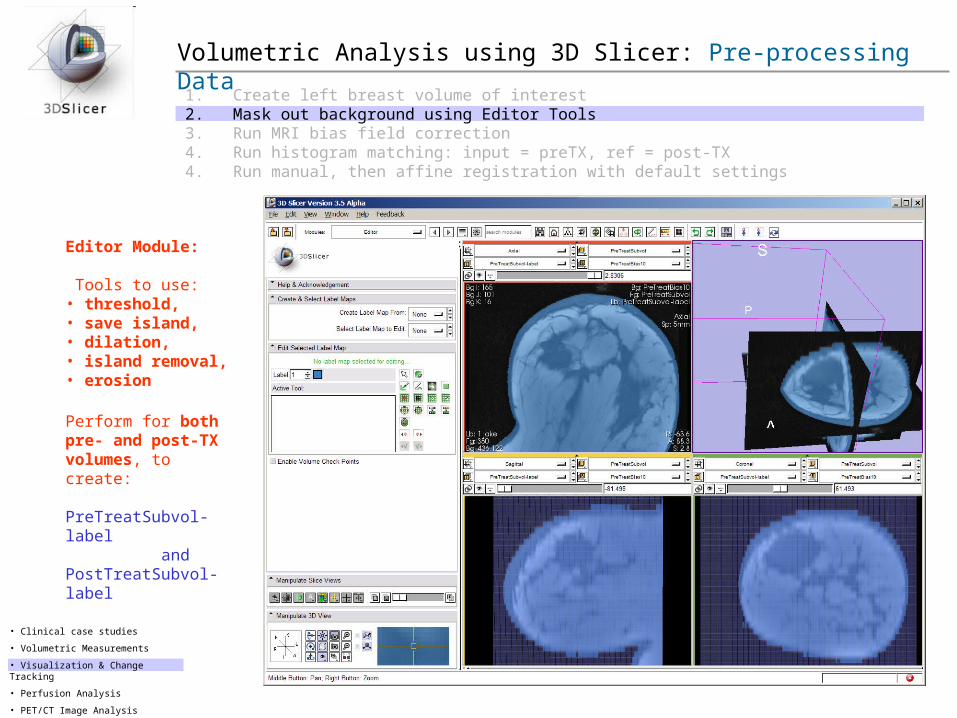
1. Create left breast volume of interest2. Mask out background using Editor Tools3. Run MRI bias field correction 4. Run histogram matching: input = preTX, ref = post-TX4. Run manual, then affine registration with default settings
Editor Module:
Tools to use:• threshold, • save island, • dilation, • island removal,• erosion
Perform for both pre- and post-TX volumes, to create:
PreTreatSubvol-label andPostTreatSubvol-label
• Clinical case studies
• Volumetric Measurements
• Visualization & Change Tracking
• Perfusion Analysis
• PET/CT Image Analysis
Volumetric Analysis using 3D Slicer: Pre-processing Data
1. Create left breast volume of interest2. Mask out background using Editor Tools3. Run MRI bias field correction4. Run histogram matching: input = preTX, ref = post-TX5. Run manual, then affine registration with default settings
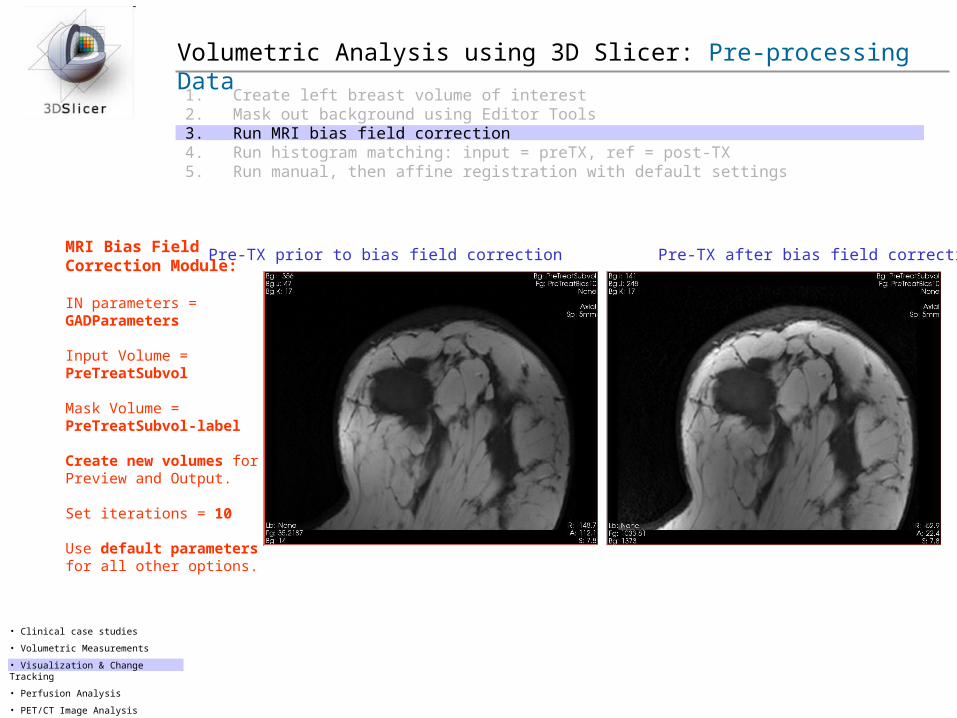
MRI Bias Field Correction Module:
IN parameters = GADParameters
Input Volume =PreTreatSubvol
Mask Volume =PreTreatSubvol-label
Create new volumes for Preview and Output.
Set iterations = 10
Use default parameters for all other options.
Pre-TX prior to bias field correction Pre-TX after bias field correction
• Clinical case studies
• Volumetric Measurements
• Visualization & Change Tracking
• Perfusion Analysis
• PET/CT Image Analysis
Volumetric Analysis using 3D Slicer: Pre-processing Data
1. Create left breast volume of interest2. Mask out background using Editor Tools3. Run MRI bias field correction4. Run histogram matching: input = preTX, ref = post-TX5. Run manual, then affine registration with default settings
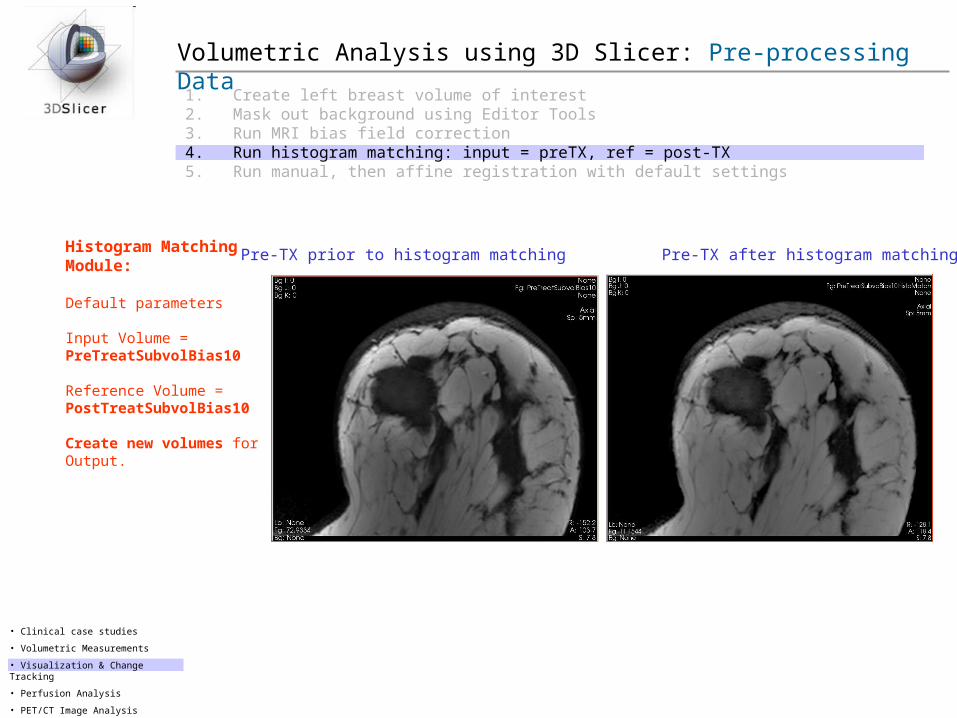
Histogram Matching Module:
Default parameters
Input Volume =PreTreatSubvolBias10
Reference Volume =PostTreatSubvolBias10
Create new volumes for Output.
Pre-TX prior to histogram matching Pre-TX after histogram matching
• Clinical case studies
• Volumetric Measurements
• Visualization & Change Tracking
• Perfusion Analysis
• PET/CT Image Analysis
Volumetric Analysis using 3D Slicer: Pre-processing Data
1. Create left breast volume of interest2. Mask out background using Editor Tools3. Run MRI bias field correction4. Run histogram matching: input = preTX, ref = post-TX5. Run manual, then affine registration with default settings
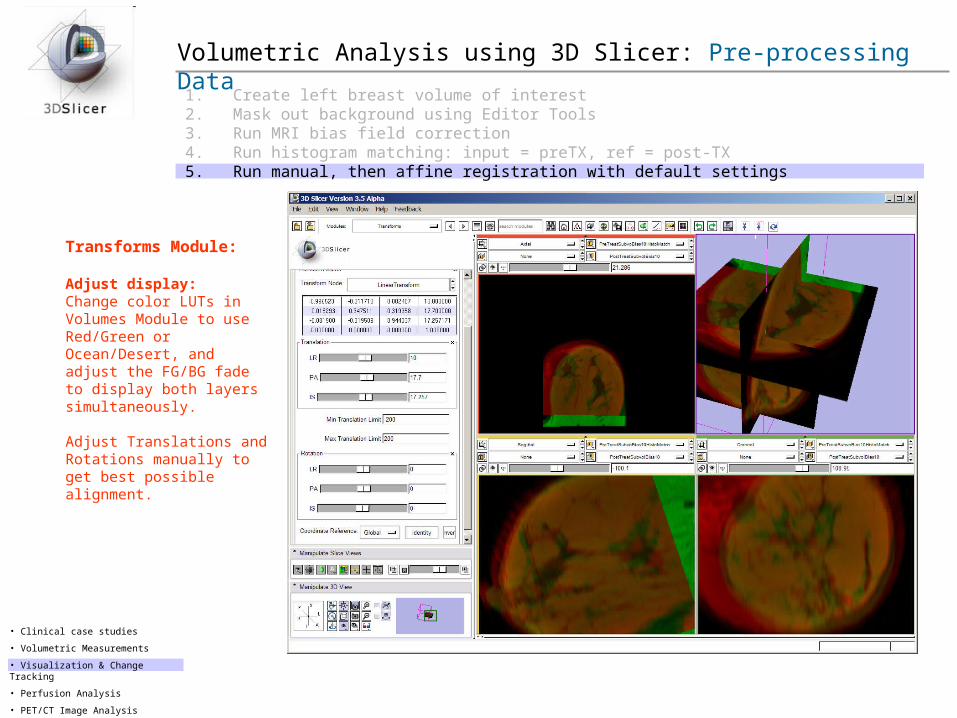
Transforms Module:
Adjust display:Change color LUTs in Volumes Module to use Red/Green or Ocean/Desert, and adjust the FG/BG fade to display both layers simultaneously.
Adjust Translations and Rotations manually to get best possible alignment.
• Clinical case studies
• Volumetric Measurements
• Visualization & Change Tracking
• Perfusion Analysis
• PET/CT Image Analysis
Volumetric Analysis using 3D Slicer: Pre-processing Data
1. Create left breast volume of interest2. Mask out background using Editor Tools3. Run MRI bias field correction4. Run histogram matching: input = preTX, ref = post-TX5. Run manual, then affine registration with default settings
Registration-> Affine Registration Module:
Use default registration parameters.
Initial Transform = linear transform
Fixed image = pre-Tx
Moving image = post-Tx
Create new transform for affine output
Create new volume for output.
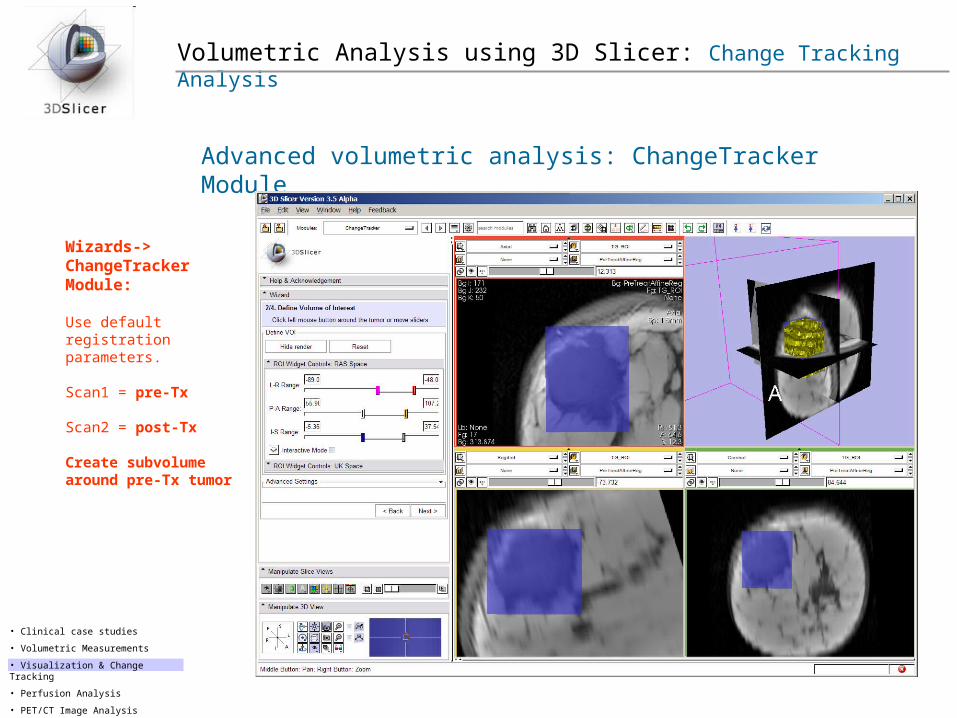
Volumetric Analysis using 3D Slicer: Change Tracking Analysis
Advanced volumetric analysis: ChangeTracker Module
• Clinical case studies
• Volumetric Measurements
• Visualization & Change Tracking
• Perfusion Analysis
• PET/CT Image Analysis
Wizards-> ChangeTracker Module:
Use default registration parameters.
Scan1 = pre-Tx
Scan2 = post-Tx
Create subvolume around pre-Tx tumor
Volumetric Analysis using 3D Slicer: Change Tracking Analysis
Advanced volumetric analysis: ChangeTracker Module
• Clinical case studies
• Volumetric Measurements
• Visualization & Change Tracking
• Perfusion Analysis
• PET/CT Image Analysis
Wizards-> ChangeTracker Module:
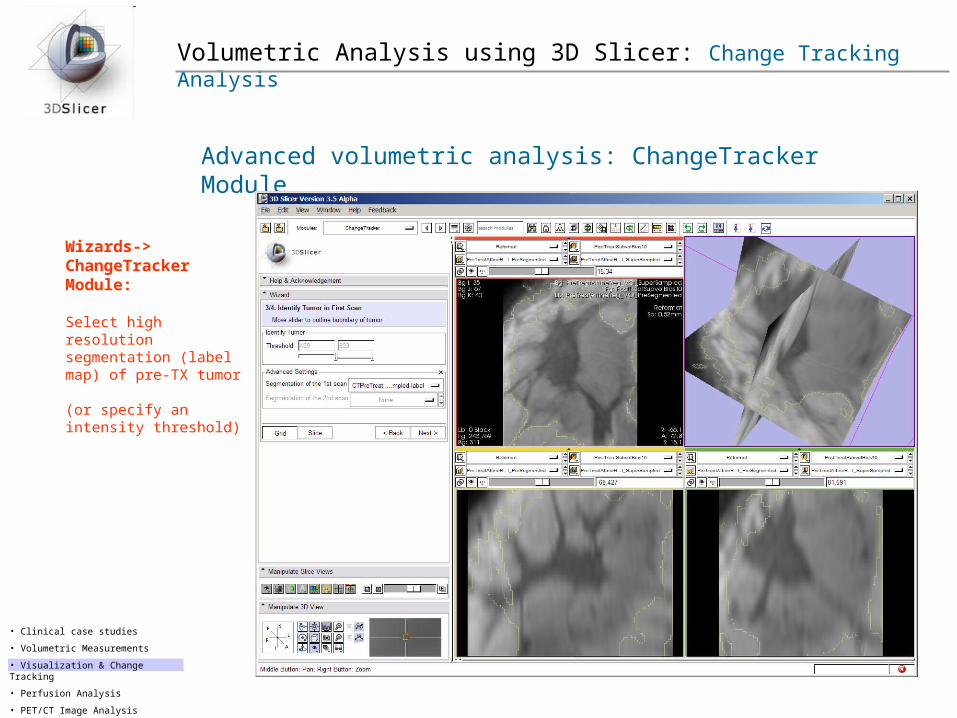
Select high resolution segmentation (label map) of pre-TX tumor
(or specify an intensity threshold)
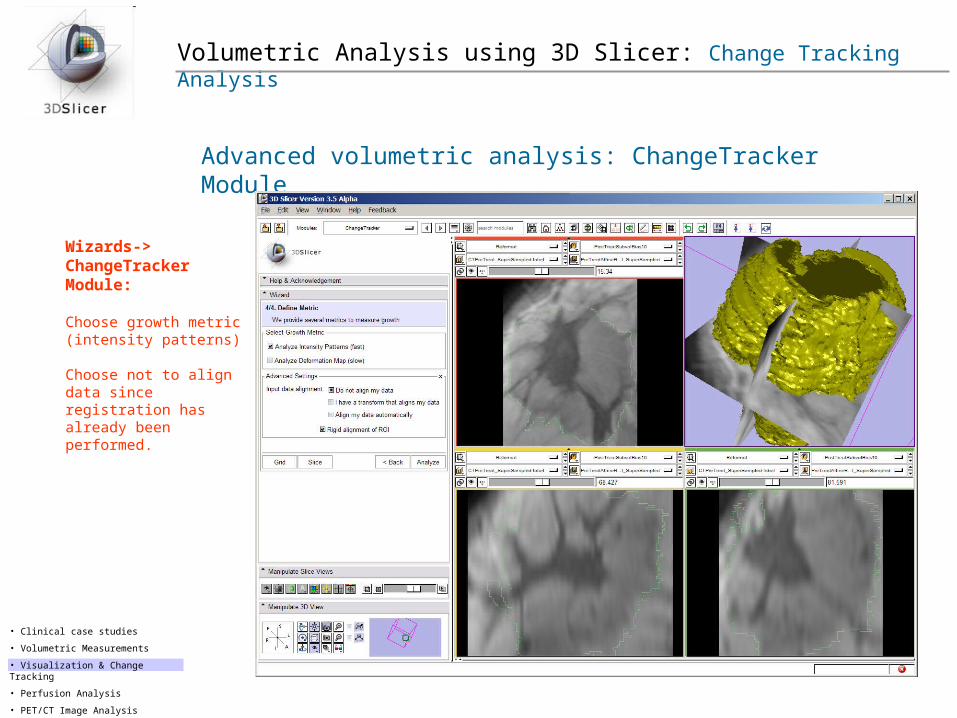
Volumetric Analysis using 3D Slicer: Change Tracking Analysis
Advanced volumetric analysis: ChangeTracker Module
• Clinical case studies
• Volumetric Measurements
• Visualization & Change Tracking
• Perfusion Analysis
• PET/CT Image Analysis
Wizards-> ChangeTracker Module:
Choose growth metric(intensity patterns)
Choose not to align data since registration has already been performed.
Volumetric Analysis using 3D Slicer: Pre-processing Data
Advanced volumetric analysis: Building 3D Models
• Clinical case studies
• Volumetric Measurements
• Visualization & Change Tracking
• Perfusion Analysis
• PET/CT Image Analysis
Volumetric Analysis using 3D Slicer: Pre-processing Data
Advanced volumetric analysis: Visualization
• Clinical case studies
• Volumetric Measurements
• Visualization & Change Tracking
• Perfusion Analysis
• PET/CT Image Analysis
Volumetric Analysis using 3D Slicer: Volume Change Analysis
Advanced volumetric analysis: Computing Changes
• Clinical case studies
• Volumetric Measurements
• Visualization & Change Tracking
• Perfusion Analysis
• PET/CT Image Analysis


![Chemical Calc[1].Problems[Volumetric Analysis]](https://img.pdfslide.us/doc/110x75/547806305806b5e8188b46f0/chemical-calc1problemsvolumetric-analysis.jpg)