Embed Size (px)
Citation preview

This work is licensed under a Creative Commons Attribution-NonCommercial-ShareAlike License. Your use of this material constitutes acceptance of that license and the conditions of use of materials on this site.
Copyright 2006, The Johns Hopkins University and William W. Eaton. All rights reserved. Use of these materials permitted only in accordance with license rights granted. Materials provided “AS IS”; no representations or warranties provided. User assumes all responsibility for use, and all liability related thereto, and must independently review all materials for accuracy and efficacy. May contain materials owned by others. User is responsible for obtaining permissions for use from third parties as needed.

Schizophrenia and Bipolar Disorders II: Analytic Epidemiology and the Search for Etiologic Clues
William Eaton, PhDJohns Hopkins University
3
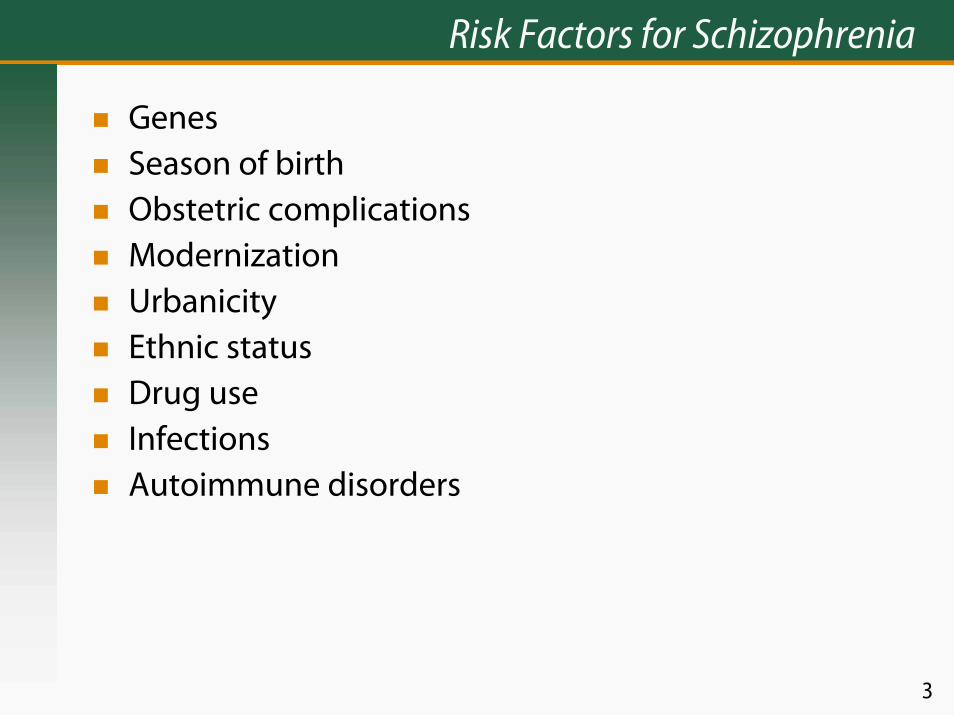
Risk Factors for Schizophrenia
GenesSeason of birthObstetric complicationsModernizationUrbanicityEthnic statusDrug useInfectionsAutoimmune disorders

4
Prevalence Correlates for Schizophrenia
Marital statusSocioeconomic status

5
Marital Status and Schizophrenia
Reasons Given for Switching to Injection Drug Use Author/Date Place Male Female
Odegaard, 1946 Norway 4.7 3 Odegaard, 1953 Norway 4.3 3.7 Norris, 1956 England 6.2 3.7 Thomas, 1963 New York 4 3.3 Thomas, 1963 Ohio 6.7 3.4 Stein, 1970 England 7.2 2.6
Adapted from Eaton, Acta Psychiatr Scand., 1975

6
Marital Status and Psychoses
Mental Hospitals in Canada, 1950–1952 First Admissions per 1,000 Population
Single/
Married Ratio Never
Married Married Widowed Divorced
Schizophrenia Male 9.3 0.95 0.10 0.16 0.75 Female 3.2 0.68 0.21 0.18 0.92
Bipolar disorder Male 2.1 0.19 0.09 0.21 0.24 Female 1.1 0.20 0.13 0.21 0.23
Adapted from: Gregorv, Can Psychiatr Assoc J., 1959

7
Schizophrenia and Being Single
First-admission and re-admission
Adapted from: Agerbo et al, Arch Gen Psychiatry, 2004; National Centre for Register-based Research, Aarhus, Denmark

8
Socioeconomic Status and Schizophrenia
"Incidence" studies since 1975
Finland 1979
Northern Ireland 1982
Netherlands 1983
Ireland, rural 1987
Ireland, urban 1987
Finland 1993
0 1 2 3 4 5 6 7 8Relative Risk for Lower versus Upper Class

9
Taiwan Studies of Schizophrenia
Prevalence per 1,000 Social Class 1946–1948 1961–1963
Upper 3.5 0.8 Middle 1.2 1.1 Lower 4.5 2.1
Adapted from: Warner, Schizophr Bull.,1995; from work of Lin T., Psychiatry 1953; and Lin et al, in Cardell, W; T Lui, Mental Health Research in Asia and the Pacific. Honolulu: East-West Center Press; 1969.

10
SES and Marital Status: Conclusions
Single persons have high riskLow SES persons have high riskBoth associations could be entirely due to insidious onsetThe chain of causation is complex

11
Genetics
Genetics

12
Family Studies of DSM-III Schizophrenia
Family Studies of DSM-III Schizophrenia
Author Date Cases/
Controls First-Degree
Relatives Morbid Risk
Baron 1985 90 366 5.8 90 374 0.6 Kendler 1985 332 723 3.7 318 1,056 0.2 Frangos 1985 116 572 4 116 694 0.7
Adapted from: Kendler, 1988, Handbook of Schizophrenia; Studies of DSM-III with controls, personal interviews with relatives, and blind diagnoses

13
Twin Studies of Schizophrenia
Author Date Country MZ DZ Heritability
Luxenburger 1928 Germany 14/22 0/13 **
Rosanoff 1934 USA 25/41 7/53 0.84
Essen-Moller 1941 Sweden 7/11 4/27 0.87
Kallman 1946 USA 191/245 59/318 0.9
Slater 1953 England 28/41 11/61 0.73
Inouye 1963 Japan 33/55 2/11 0.66
Kringlen 1967 Norway 31/69 14/96 0.61
Fischer 1973 Denmark 14/23 12/43 0.4
Gottesman 1972 England 15/26 4/34 0.86
Tienari 1975 Finland 7/21 6/42 0.53
Kendler 1983 USA 60/194 18/277 0.91
Data from: Kendler, 1988, Handbook of Schizophrenia; DZ are same sex; not age corrected

14
Danish Adoption Study
****Research Design****Method Sample
5483 AdopteesAdoptionRegisterPsychiatric Register
507
34 Index Cases 34 Controls(Case Notes)
247 RelativesFolkeregister 265 Relatives
Mortality/Refusal
173Biologic
74 Adoptive
174Biologic
91Adoptive
PsychiatricInterview
Schizophrenic: 11Spectrum 26
81
118
Normal
35 140 48
4976
****Results****Frequencies
13
31
316
121
25
41
sex===ses
Adapted from: Kety, Rosenthal, Wender, Schulsinger, Jacobsen, 1973

15
Genomic Scan in Schizophrenia
Results for part of chromosome 6
Locus Prior H P in Stage I P in Stage II
No 0.77
D6S274 Yes 0.64 0.005
D6S285 Yes 0.66
D6S299 No 0.38
D6S306 No 0.42
D6S276 No 0.3
D6S273 No 0.04
D6S291 No 0.04 0.05
D6S271 No 0.87

16
Genome Scan Meta-Analysis of Schizophrenia
Adapted from: Lewis et al, Am J Hum Genet 2003, Table 2

17
Genome Scan Meta-Analysis of BPD
Model 1: BP-I or BP-I & SAB
Adapted from: Segurado et al., Am J Hum Genet 2003, Table 3

18
Genetics: Conclusion
Schizophrenia and bipolar disorder are inherited− The degree of inheritance is stronger than for most
psychiatric disorders− It is unlikely to be a Mendelian pattern
Inheritance pattern is different for schizophrenia and bipolar disorder

19
Environmental Risk Factors: Conditions of Birth
Environmental Risk FactorsConditions of Birth

20
Season of Birth and Schizophrenia
Investigator Year Sample 12 1 2 3 4 5 6 7 8 9 10 11Northern Hemisphere Tramer 1929 3100 Petersen 1934 3467 de Sauvage Nolting 1934 2589 Huntington 1938 10420 Laestadius 1949 2232 de Sauvage Nolting 1951 2090 Norris and Chowning 1962 3617 Hare and Price 1968 3596 Dalen 1968 16238 Hare et al. 1974 5139 Odegard 1974 19740 Videbech et al. 1974 7427 Parker and Balza 1977 3508 Shimura et al. 1977 7960 Torrey et al. 1977 53584 O’Hare et al. 1980 4855 Watson et al. 1984 3556 Kendell and Kemp 1985 2653 Hafner et al. 1987 2020
ContinuedAdapted from: Eaton and Chen, 2004
21
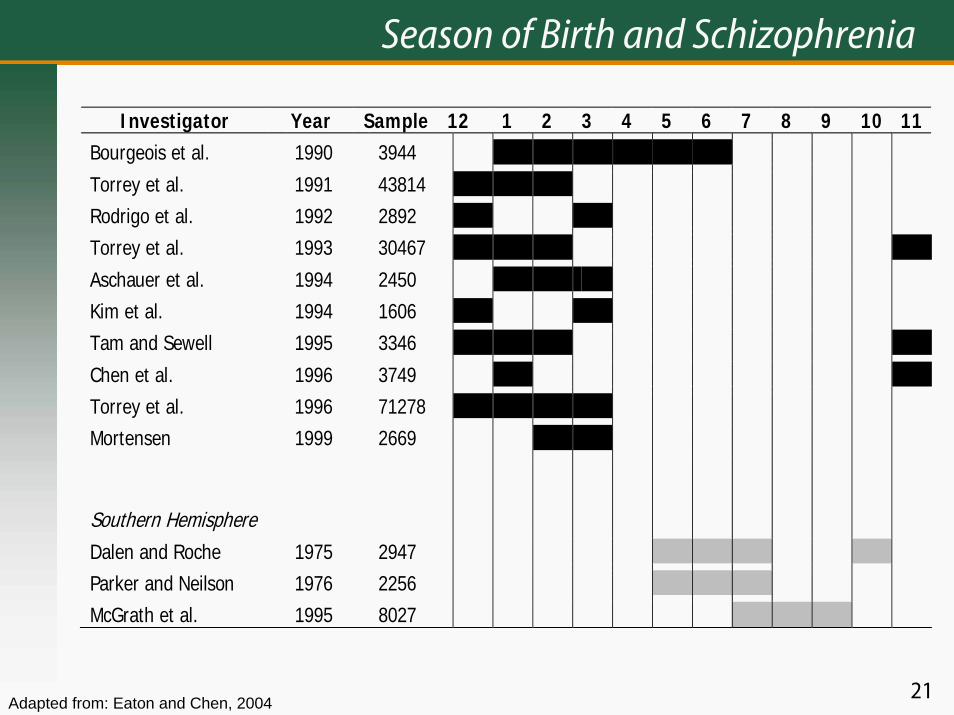
Season of Birth and Schizophrenia
Investigator Year Sample 12 1 2 3 4 5 6 7 8 9 10 11Bourgeois et al. 1990 3944 Torrey et al. 1991 43814 Rodrigo et al. 1992 2892 Torrey et al. 1993 30467 Aschauer et al. 1994 2450 Kim et al. 1994 1606 Tam and Sewell 1995 3346 Chen et al. 1996 3749 Torrey et al. 1996 71278 Mortensen 1999 2669 Southern Hemisphere
Dalen and Roche 1975 2947 Parker and Neilson 1976 2256 McGrath et al. 1995 8027
Adapted from: Eaton and Chen, 2004

22
Season of Birth in Denmark
Adapted from: Videbech et al, Acta Osychiatr Scand. 1974, Figure 1.

23
Obstetric Complications and Schizophrenia
Author
Woerner
McNeil
Jacobsen
Eagles
O'Callaghan
Kinney
Gunther-Genta
Done
Buka
Date
1973
1978
1980
1990
1992
1994
1994
1991
1993
Sample
46
70
63
27
65
9
24
57
8
0.1 0.2 0.5 2.0 5.0 10.0
Odds Ratios and 95% Confidence Intervals in 9 Studies
Adapted from: Geddes and Lawrie, BJP, 1995; Studies of obstetric records only;Done estimate from original BMJ 1991
24
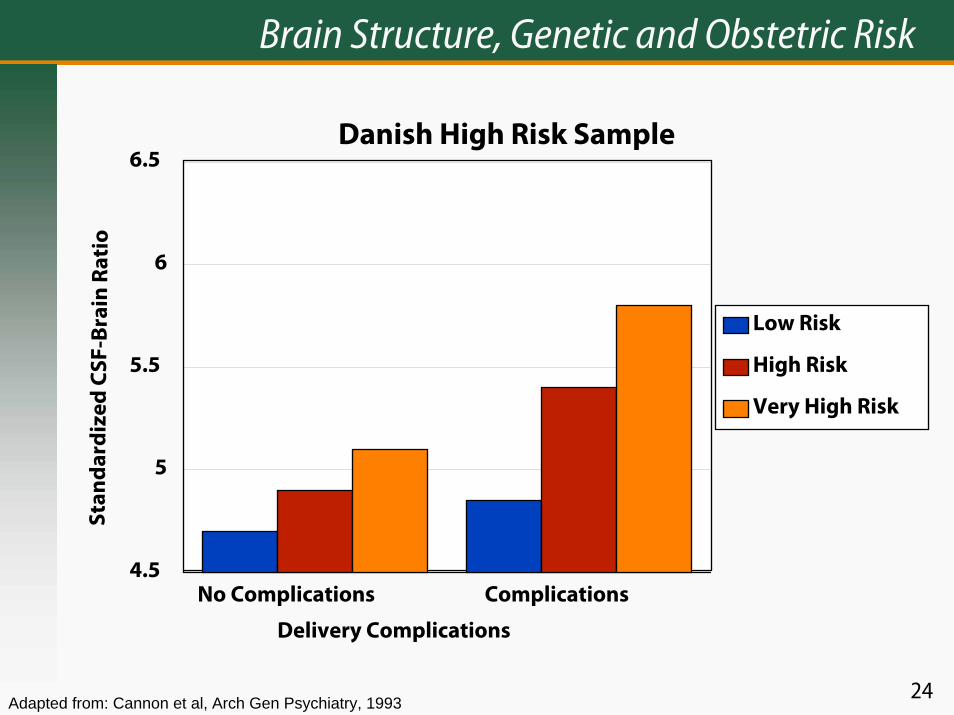
Brain Structure, Genetic and Obstetric Risk
Danish High Risk Sample
No Complications Complications
Delivery Complications
4.5
5
5.5
6
6.5
Stan
dar
diz
ed C
SF-B
rain
Ra t
io
Low Risk
High Risk
Very High Risk
Adapted from: Cannon et al, Arch Gen Psychiatry, 1993

25
SOB and OCs: Conclusions
Season of birth (SOB) is a consistent but weak risk factor for schizophrenia—but not BPD Season of birth expresses a cause that is not geneticObstetric complications are a consistent risk factor of moderate strength for schizophrenia—but not BPDSOB and OCs interact with genetic risk in some as-yet-unknown wayThere are intriguing specific complications that involve high riskInfection is probably part of the causal picture

26
Urban Residence
Urban Residence

27
Urban Areas
Continued

28
Urban Areas

29
Manic-Depressive Insanity
30
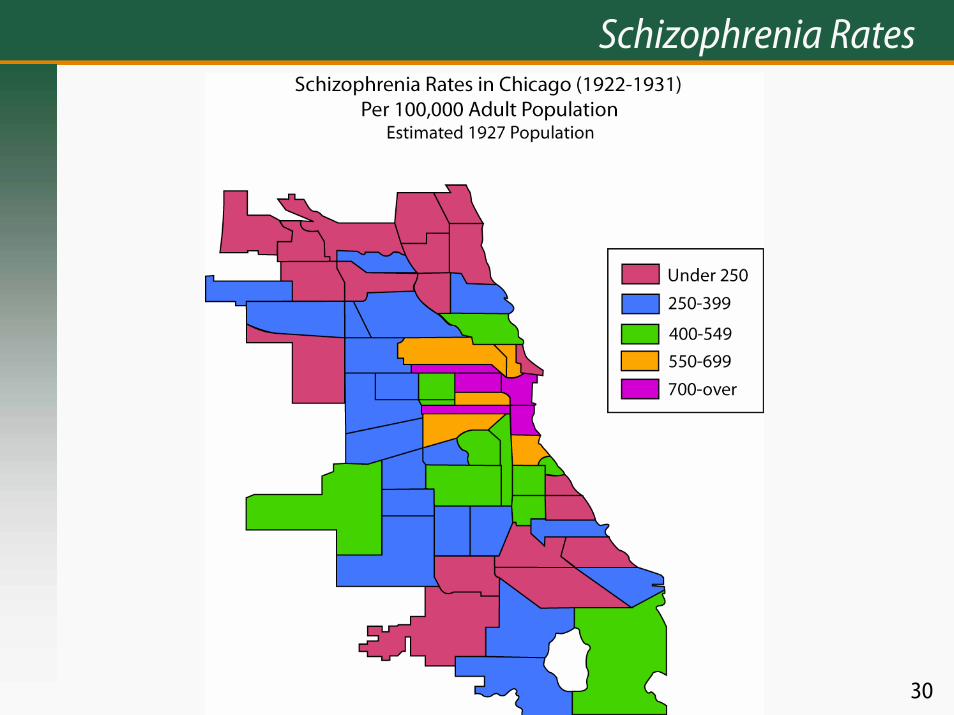
Schizophrenia Rates

31
Schizophrenia

32
Place of Residence and Schizophrenia
First Hospitalization in Maryland, 1965
0-14
15-19
20-24
25-29
30-34
35-39
40-44
45-49
50-54
55-59
60-64
65+
Age at First Hospitalization
0
0.25
0.5
0.75
1
1.25
1.5
1.75
An
nu
al R
ate
per
100
0
Center City
Metro-urban
Rural
Data from: Eaton, J Health Soc Behav., 1974

33
Place of Upbringing and Schizophrenia
Swedish Conscripts Cities Large Towns Small Towns Rural
Cases 74 30 81 83 Others 10,311 4,970 14,583 19,059 Incidence/1000/year 0.51 0.43 0.4 0.31 Crude Odds Ratio 1.65 1.39 1.28 1 Adjusted Odds Ratio 1.57 1.37 1.26 1
Data from: Lewis et al, Lancet, 1992

34
Urbanization and Risk for Psychosis in Denmark
7
6
5
4
3
2
1
0
Rural SmallCities
LargeCities
Suburbs Copenhagen
Schizophrenia
Non-AffectivePsychosis
Affective Psychosis
Relative Risks and 95% Confidence Intervals
(Reference)

35
Is Schizophrenia a Modern Disease?
Is Schizophrenia a Modern Disease?

36
Hieronymus Bosch, The Cure of Folly, 16th Century

37
Hieronymus Bosch, Ship of Fools, 1490-1500

38
Pieter Breughel, Dulle Griet (“Mad Meg”), 16th Century

39

40

41
She speaks much of her father; says she hears there’s tricks in the world, and hems, and beats her heart, spurns enviously at straws, speaks things in doubt that carry but half sense. Her speech is nothing, yet the unshaped use of it doth move the hearers to collection. They aim at it and botch the words up fit to their own thoughts; which, as her winks and nods and gestures yield them, indeed would make one think there would be thought, though nothing sure, yet much unhappily.
—Shakespeare, Hamlet;Act 4, Scene 5, describing Ophelia
42
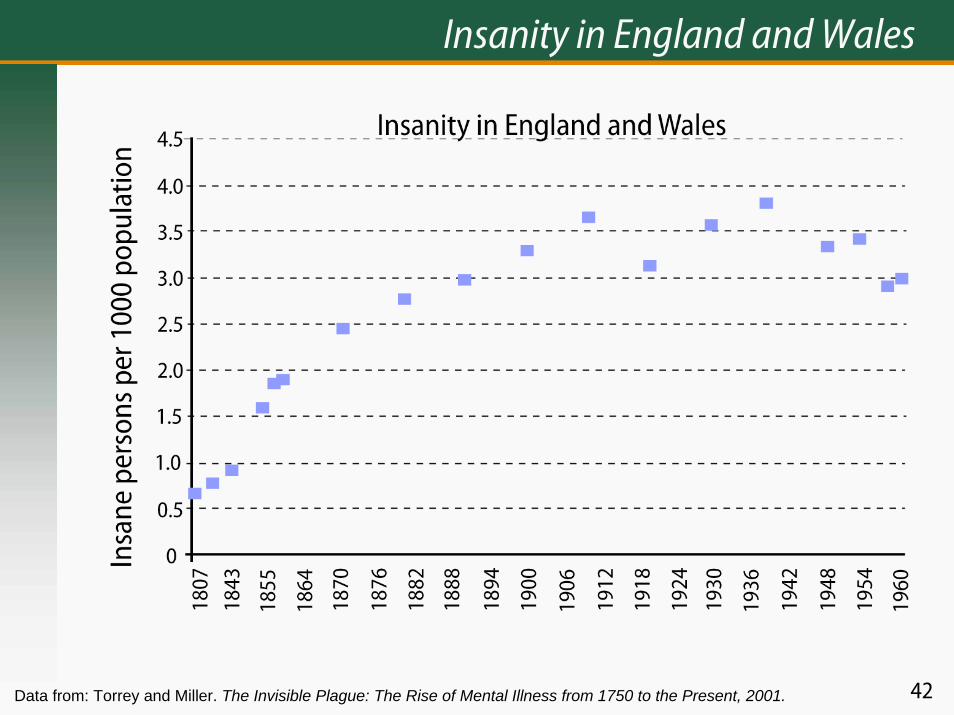
Insanity in England and Wales
Data from: Torrey and Miller. The Invisible Plague: The Rise of Mental Illness from 1750 to the Present, 2001.

43
Asylum Admission Rates: England and Wales
1860
1865
1870
1875
1880
1885
1890
1895
1900
1905
1910
Year of Admission
0.3
0.35
0.4
0.45
0.5
0.55
0.6
0.65
0.7
Ann
ual R
ate
per
100
0
44
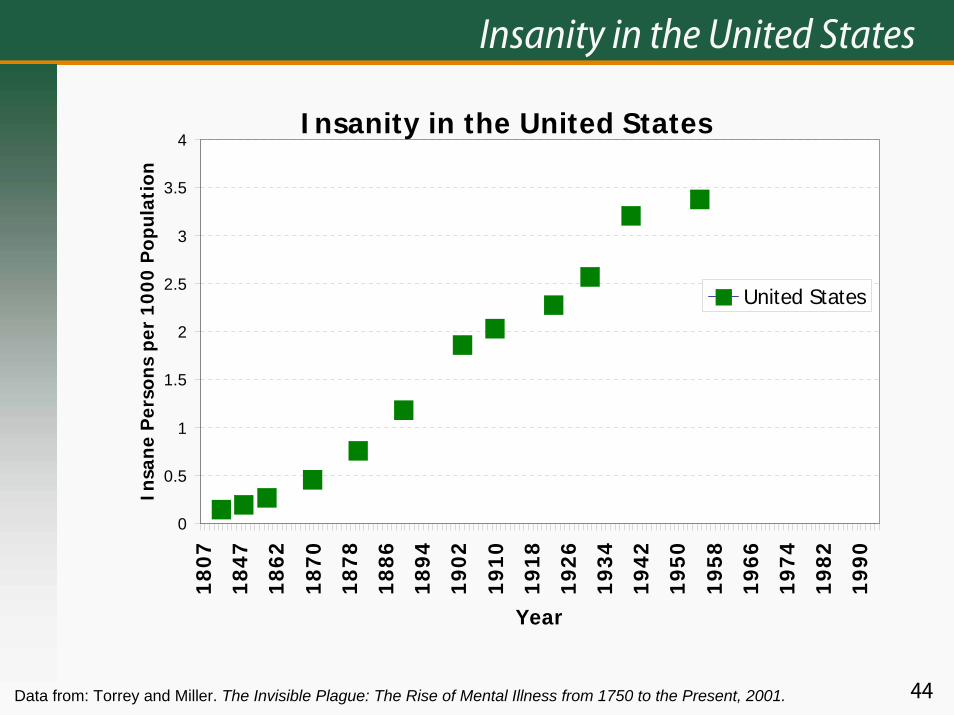
Insanity in the United States
Insanity in the United States
0
0.5
1
1.5
2
2.5
3
3.5
4
1807
1847
1862
1870
1878
1886
1894
1902
1910
1918
1926
1934
1942
1950
1958
1966
1974
1982
1990
Year
Insa
ne P
erso
ns p
er 1
000
Pop
ulat
ion
United States
Data from: Torrey and Miller. The Invisible Plague: The Rise of Mental Illness from 1750 to the Present, 2001.

45
Insanity in Atlantic Canada
Insanity in Atlantic Canada
0
0.5
1
1.5
2
2.5
3
3.5
4
4.5
1807
1843
1855
1864
1870
1876
1882
1888
1894
1900
1906
1912
1918
1924
1930
1936
1942
1948
1954
1960
Year
Insa
ne P
erso
ns p
er 1
000
Pop
ulat
ion
Data from: Torrey and Miller. The Invisible Plague: The Rise of Mental Illness from 1750 to the Present, 2001.

46
Insanity in Ireland
Insanity in Ireland
0
1
2
3
4
5
6
7
818
07
1843
1855
1864
1870
1876
1882
1888
1894
1900
1906
1912
1918
1924
1930
1936
1942
1948
1954
1960
Year
Insa
ne p
erso
ns p
er 1
000
Pop
ulat
ion
Data from: Torrey and Miller. The Invisible Plague: The Rise of Mental Illness from 1750 to the Present, 2001.

47
Insanity in Four Countries
Insanity in Four Countries
0
1
2
3
4
5
6
7
818
07
1843
1855
1864
1870
1876
1882
1888
1894
1900
1906
1912
1918
1924
1930
1936
1942
1948
1954
1960
Year
Insa
ne P
erso
ns p
er 1
000
Popu
latio
n
England and Wales Ireland Atlantic Canada United States
Data from: Torrey and Miller. The Invisible Plague: The Rise of Mental Illness from 1750 to the Present, 2001.

48
Admissions to Aarhus Hospital
Admissions to Aarhus Hospital
0
100
200
300
400
500
600
700
800
1852
-185
6
1857
-186
1
1862
-186
6
1867
-187
1
1872
-187
6
1877
-188
1
1882
-188
6
1887
-189
1
1892
-189
6
1897
-190
1
1902
-190
6
1907
-191
1
1912
-191
6
1917
-192
1
1922
-192
6
1927
-193
1
1931
-193
6
1937
-194
1
1942
-194
6
1947
-195
1
Year of Admission
Num
ber o
f Per
sons
Source: Redrawn from Stromgen, Br J Psychiatry, 1987

49
Insanity in the United States
Insanity in the United States
0
0.5
1
1.5
2
2.5
3
3.5
4
1807
1847
1862
1870
1878
1886
1894
1902
1910
1918
1926
1934
1942
1950
1958
1966
1974
1982
1990
Year
Insa
ne P
erso
ns p
er 1
000
Pop
ulat
ion
United States Masschusetts United States
Data from: United States, 1840–1955, Torrey and Miller, 2001; Massachusetts, 1844–1930, Goldhamer and Marshall in Eaton, 2001; United States, 1969–1994, Witkin et al, 1998.
50
Explanations for Rise in Schizophrenia, 1850–1950
New Virus (Hare)Cephalopelvic disproportion (Warner)Life planning (Eaton and Harrison)New toxinNew contact with vector (Torrey and Yolken)N. B.: genetics is not a good explanation

51
Modern, Urban Life: Conclusions
Schizophrenia may have emerged in the past 500 yearsBipolar disorder is ancientUrban life raises risk for schizophreniaUrban life is not associated with risk for bipolar disorderExplanations for the urban risk include social and biological causes

52
Ethnicity
Ethnicity
53
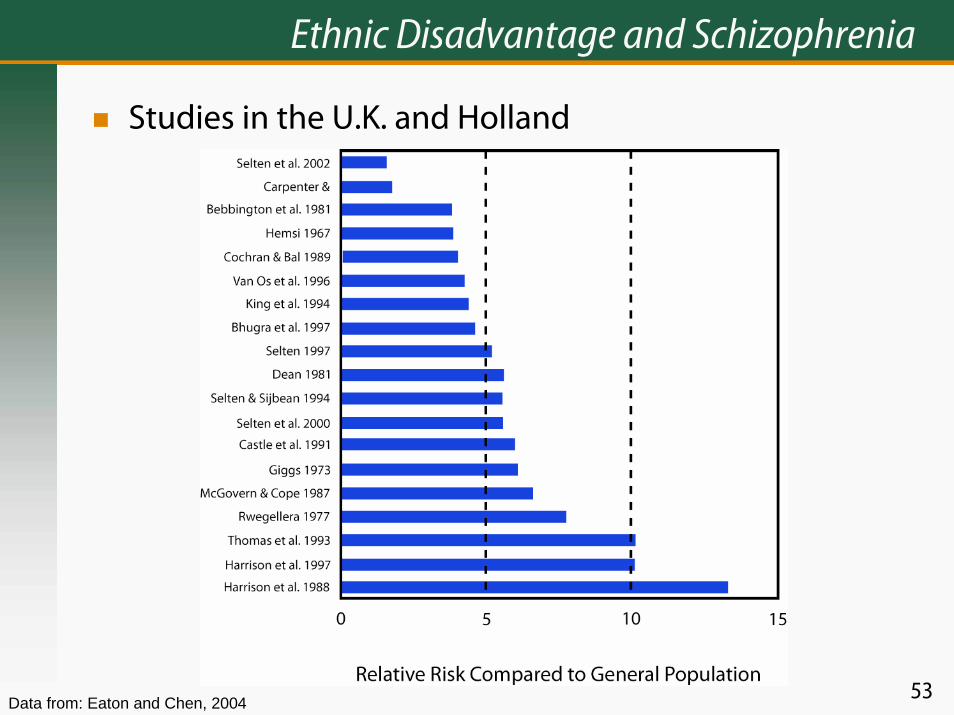
Ethnic Disadvantage and Schizophrenia
Studies in the U.K. and Holland
Data from: Eaton and Chen, 2004

54
Ethnic Disadvantage: Conclusions
In certain settings, disadvantaged ethnic status is a consistent and strong risk factor for schizophreniaThe differential risk is not explained by genetic differences in ethnic groupsFor bipolar disorder, ethnic differences may possibly be genetic in origin

55
Drug Use and Schizophrenia
Prospective Studies Location Relative Risk Sweden 2.3
Netherlands 2.8 New Zealand 6.6
Data from: Witton et al, Cannibis as a causal factor for psychosis—a review of the evidence. In Gattaz, W.G., and Hafner, H., Search for the Causes of Schizophrenia, Volume V, Darmstadt, Steinkopf, 2004, pages 133–149.

56
Infection and Autoimmune Hypotheses
Infection and Autoimmune Hypotheses

57
Findings That Link Infections and Schizophrenia
Cohort studies of flu epidemics and high ratesCase control studies of antibodies− Toxoplasma− Herpes simplex virus− Prenatal rubella

58
Recent Studies of Toxoplasma and Schizophrenia
Data from: Torrey & Yolkem, Emerg Infect Dis., 2003

59
IgG Antibodies
IgG Antibodies* in Maternal Sera at Birth of CPP Offspring 27 Adult Psychotics 54 Controls
Toxoplasma gondii 0.22 0.20 Human parvovirus 0.22 0.19 Rubella virus 0.58 0.51 Cytomegalovirus 0.45 0.50 Herpes simplex virus 1 0.94 1.03 Herpes simples virus 2 0.40** 0.24 *Optical density units via immunoassay **Significantly different from controls at p < 0.04

60
Prenatal Rubella Exposure and Nonaffective Psychosis
Total Non-NAP NAP Relative risk (a) Unexposed (Saratoga study)
164 159 5 1.0
(b) Unexposed (ECA study)
1346 1333 13 1.0
Rubella exposed 70 59 11 (a) 5.2 (1.9-14.3) (b) 16.3 (7.6-35.0)
Modified from text in Comparison of Diagnostic Outcomes.
Source: Brown et al., Am J Psychiatry, 2000

61
Arthritis and Schizophrenia
Odds Ratios and 95% Confidence Intervals in 6 studies Author Date Sample
Ross et al. 1950 1608
Pilkington 1955 318
Baldwin 1980 7718
Mohamed et al. 1982 162
Allebeck et al. 1985 11342
Oken & Schulzer 1999 229972
Oken & Schulzer 1999 1984
Mors et al. 1999 20495
.05 0.1 0.2 0.5 1.0
2.0 5.0
Data from: Eaton and Chen, 2004

62
Prevalence of Celiac Disease in Cases of Schizophrenia
Data from linked Danish National Case Registers Prevalence/1,000 Relative Risk*
Cases Controls Univariate Adjusted Celiac 1.5 0.5 3.2 3.2 (1.8–5.9) Chrons Disease 4.5 3.4 1.3 1.4 (1.0–1.9) Ulcerative Colitis 6.2 4.7 1.3 1.4 (1.0–1.8)
Data from: Eaton et al, BMJ, 2004

63
Schizophrenia: Autoimmune Disease?
Findings that suggest Schizophrenia might be some sort of autoimmune disease− Relapsing course with unpredictable episodes;
autoantibodies can produce psychosis (SLE)**− Immunologic abnormalities (Ganguli et al)
Decreased IL 2**Increased IL 2 receptors*Increased IL 6*
− Autoimmune disorders are associated with schizophrenia
Thyroid disorders are more common**Rheumatoid Arthritis is less common**Celiac disease is more common**
Mary Munoz:
What do * refer to?
Mary Munoz:
What do * refer to?What do * refer to?

64
Prenatal Autoimmune
Schizophrenia involves heterozygous advantageRelatives of schizophrenics are protected from viral but not bacterial infectionsWinter birth of schizophrenics suggests influenzaSecond trimester influenza infection is most riskyMaternal antibodies cross the placentaAntibodies to influenza cross-react with brain tissue
Source; Wright and Murray, Ann Med., 1993; Wright et al, Schizophr Res., 1996

65
Population Attributable Risk for Three Risk Factors
Risk Factor PAR in Percent Schizophrenia in sibling or parent 5.5 Season of birth 10.5 Place of birth 34.6
Data from: Mortensen et al, NEJM, 1999