Embed Size (px)
Citation preview
\Np5 a5sV5
POLICY RESEARCH WORKING PAPER 2515
Firm-Level Survey Provides This rich new database on4,000 Asian firms-operating
Data on Asia's Corporate in Indonesia, the Republic of
rn * * 1 ) ~~~~~~~~~~~~~~~Korea, Malaysia, theCrisis and Recovery Kra aasa hPhilippines, and Thailand-
focuses on the impact of
Mary Hallward-Driemeier Asia's economic crisis and onthe longer-run deterrninants
of productivity, employment
practices, and financial
structure.
The World Bank
Development Research Group
Macroeconomics and Growth HJanuary 20011
Pub
lic D
iscl
osur
e A
utho
rized
Pub
lic D
iscl
osur
e A
utho
rized
Pub
lic D
iscl
osur
e A
utho
rized
Pub
lic D
iscl
osur
e A
utho
rized
Pub
lic D
iscl
osur
e A
utho
rized
Pub
lic D
iscl
osur
e A
utho
rized
Pub
lic D
iscl
osur
e A
utho
rized
Pub
lic D
iscl
osur
e A
utho
rized

l m( Y RFsFARCH WORKING PAPER 2515
Summary findings
Researchers have decried the limited supply of objective, The questionnaire focused on measuring the impact ofcoinparable firm-level data from developing countries. the regional financial crisis at the microeconomic levelHallward-Driemeier describes a new database that helps and understanding the longer-run determinants offill this information gap. productivity, employment practices, and financial
The database has detailed records on 4,000 firms structure.operatitig in Indonesia, the Republic of Korea, Malaysia, This database-the first step in the important Firmthe Philippines, and Thailand. A comparable survey Analysis and Competitiveness Surveys initiative that theinstrument and sampling methodology was used in each World Bank is spearheading-will be joined bycountry, and all five studies were carried out additional country databases. The aim is to fill the gap insimultaneously. The data cover three years (1996-98), much-needed microeconomic evidence using comparableallowing for measurements of firm performance before instruments.and immediately after the East Asian financial crisis.
This paper-a product of Macroeconomics and Growth, Development Research Group-is part of a larger effort in thegroup to collect comparable firm-level information from developing countries. The research was funded by the Bank's
Research Support Budget under the research project "Impact of the East Asian Crisis" (RPO 632-28). Copies of this paperare available free from the World Bank, 1818 H Street NW, Washington, DC 20433. Please contact Emily Khine, roomMC3 -341, telephone 202-473-7471, fax 202-522-3518, email address kkhine(4Cworldbank.org. Policy Research WorkingPapers are also posted on the Web at w-ww.worldbank.orgiresearch/workingpapers. The author may be contacted atmhallward(i worldbank.org. January 2001. (33 pages)
'The Poticy Research Workinig Paper Series disseminates the findinigs of work in progress to encourage the exchange of ideas about
development issues. An objective of the series is to get the findings out quickly, even if the presentations are less thani fully polished. The
papers carry the naames of the authors antd should be cited accordingly. The findings, interpretationzs, anid conclusionzs expressed in this
paper are entirely those of the authors. They do not necessarily represent the view of the World Bank, its Executive Directors. or the
countries they represent.
Pr5{l(aol v rhe Policy Research Dissemination Center
Firm-Level Survey Provides Data onAsia's Corporate Crisis and Recovery
Mary Hallward-DriemeierDECRG*
I am extremely grateful to Francis Colaco, David Dollar, Dominique Dwor-Frecaut, Kyle Peters and KenSokoloff whose support and guidance were instrumental to the survey initiative and to Giuseppe Iarossi,Stacy Nemerof, Dee Sutthiphisal, Dennis Tao, and Hairong Yu for their tremendous assistance inorganizing the dataset. The cooperation and participation of National Development Planning Agency(BAPPENAS) and Bada Pusat Statistik in Indonesia, Korea Institute for Industrial Economics and Trade(KIET) in Korea, the Economic Planning Unit in the Prime Minister's Office in Malaysia, the NationalStatistics Office and the National Economic and Development Authority in the Philippines and the Ministryof Industry in Thailand are gratefully acknowledged. Financial support was received by the Policy andHuman Resource Development Fund (Japan) and the Asia-Europe Meeting (ASEM) Trust Fund.
1

Firm-Level Survey Provides Data onAsia's Corporate Crisis and Recovery
Mary Hallward-DriemeierDECRG
A new database of 4000 firms in 5 East Asian countries1 provides insights into theprivate sector at a critical time in the region's development. There has been an extensivedebate on the degree of technological improvement and factor accumulation in the regionand what characteristics best predict productivity growth2 . With the recent financialcrisis, concerns of credit constraints and the extent of unemployment has gainedwidespread public attention.3 Until now, these questions have been examined usingaggregate data or through case studies. The new database makes available extensive firmlevel information that can address these questions and other pressing issues of thedeterminants of competitiveness and firm reactions to the crisis.
The database provides information for the same firms over a three year period,covering 1996 to 1998. Designed to analyze a broad ranges of issues, both within andacross the participating countries, it contains information on such topics as productivity,firm structure, financial position, employment practices, investment and technologyacquisition. The data was collected using similar survey instruments and samplingmethodologies so that cross country comparisons can be made directly.
Many existing firm-level databases are restricted to a single country, ask mostlysubjective questions or are limited to a particular type of firm or aspect of a firm'sbehavior. (For an overview of existing surveys see Recanatini, Wallsten and Xu 2000).This database is a contribution as it provides a wide set of comparable and objectivemeasures for a large sample of firms in 5 countries. Building on the example of theRegional Program on Enterprise Development (RPED) overseen by the World Bank thatsampled 150-200 firms in 5 African countries between 1993-95, this database greatlyincreases the sample size and is the first to be made publicly available. It is the hope thatmore such comparable firm-level datasets will be made public in the near future as part ofthe World Bank's Firm Analysis and Competitiveness Surveys (FACS) initiative.
Comparison with other firm-level databases
Basic firm-level production and employment data is collected in most countries.However, it is only made available to the public in aggregate form, with rare exceptions.This greatly limits the type of research for which it can be used. The most common firm-level data that is publicly available covers publicly traded firms. These firms are requiredto disclose certain types of information as a condition of being listed on the exchange.Companies such as Worldscope and Extel have made businesses out of gathering thisinformation from company reports, compiling it and selling it to reserachers and analysts.
' While Malaysia conducted the survey and participated in the regional conference to discuss the resultsand policy implications of the findings, the government officials chose not to make the raw data availablefor the regional database at this time. Aggregate statistics, however, are presented here for comparison andadditional ones are available on the database website.2 See Young 1995, Young 1996, Krugman 1996, Hseih 1997, Rodrik 1998.3 See Ghosh 1998, Ferri and Domac 1998, Ito and Pereira Da Silva 1998, Sachs 1997.
2

Researchers have long taken advantage of this information to study firm behavior invarious OECD countries. This source of information has also recently been exploited fora broader set of countries in East Asia. Claessens, Djankov, and Lang (1998, 1999)examine the publicly listed companies in East Asia to analyze the importance ofownership structures and links to banks in the financial position of firms. However, thereare two shortcomings of this data, particularly in the context of developing countries.First, there are only a limited number of variables available. Thus, it is not possible toderive calculations on productivity, worker turnover or export behavior. Second, thesample of firms is hardly representative of the broader population of firms in thesecountries. In the Southeast Asian countries, non-financial sector listed firms only number146 in the Philippines, 258 in Korea, 264 in Indonesia, 636 in Malaysia and 427 inThailand. Understanding the performance and financial practices of the largest firms in acountry is certainly important, but a broader set of firms is needed to shed light on theeconomy as a whole.
In recent years there has been increased attention paid to qualitative surveys ofcountries' business environment such as those conducted by Transparency International,the World Economic Forum and the World Bank Business Environment Survey. Whilebased on the responses of individuals, the measures are not tied to firm-specificperformance. Available in aggregated form, they seek to capture features of the nationaleconomy. The measures are based on interviews with CEOs who report their impressionsof the severity of various potential bottlenecks to doing business in a country. Thus thesedatasets provide purely subjective measures. A prime concern of using this data is howto interpret comparisons made across countries. There can be cultural differences in thedegree to which respondents will complain about issues, and there are differences inexpectations against which actual conditions-are measured. For example, if there is notradition of using the judicial system to resolve contract disputes, it is not necessarilygoing to be ranked as low as in a country where people do expect fairer judicial practices,but are frustrated by weaknesses or corruption in the system. (Pfeffermann 2000)
There are a number of datasets available that are more limited in scope. Theyfocus on a particular sector within a country or have information on a particular aspect offirm behavior, such as training4, production and productivity5, tax payments6 or tradepractices7. These databases point to the importance of having quality micro-dataavailable. Almost all such studies conclude that greater data collection efforts would beextremely valuable (See Tybout 1998). This database is one step towards filling thisinformation gap.
This database thus makes a contribution on several dimensions. First, the surveycontains objective, quantitative measures of firm performance. While it does includesome qualitative measures, attempts were made to ask complementary questions that give
4 Batra and Tan (1997) for Colombia, Mexico and Taiwan (China)5 Aw and Hwang (1995) for Taiwan (China); Corbo and deMelo (1986) for Chile; Cortes et.al (1987) forColombia; Bhavani (1991), Hill and Kalirajan (1993), Little et.al. (1987), Page (1984) and Ramaswamy(1994) for India; Page (1980) for Ghana; Tyler (1979) for Brazil; Kalirijan and Tse (1989) for Malaysia;Pitt and Lee (1981) for Indonesia. Biggs et al. (1995) and Bigsten et. al. (1999) are some of the few crosscountry studies available, using the comparable data from the RPED study in Africa.6Gauthier and Gersovitz (1997) .7 Kraay (1998), Aitken, Hanson and Harrison (1994).
3

an objective measure of the issue. For example, managers were asked how much of aproblem red tape and bureaucracy are, and they are also asked the number of days it takesto clear goods through customs. Also, production, employment, investment and balancesheet data give quantitative measures of firm performance that can be directly used formeaningful comparisons.
The surveys use comparable methodologies and survey instruments in all fivecountries. While particular questions were modified to reflect institutional differences,the databases can easily be linked together. This greatly reduces difficulties associatedwith combining data on different countries.
The database features large, randomly selected samples with good coverage ofsubgroups of firms. Each country sampled between 650-950 firms, for a total of over4000 firms. Thus, there are adequate numbers of firms to analyze sub-groups based onsector, size, export practices etc. Also, the samples were drawn randomly rather thanfocusing on the best performers or only listed companies. Thus, the results are applicableto the wider population of manufacturing firms in the economy, making it easier todetermine policy implications and recommendations.
The data covers three years, creating a panel rather than a simple cross-section offirms. This gives the opportunity to look at changes over time. In particular, it allows formeasures of the impact of the crisis. For econometric studies, it also allows for firmheterogeneity to be controlled for and provides greater opportunities to use laggedvariables as instruments in cases where the endogeneity of an explanatory variable couldbe of concern.
Finally, there is comprehensive coverage of firm behavior in the database. Thesurvey not only collects information on production, it has extensive data on financialcharacteristics of the firm, its employment practices, corporate governance information,methods of acquiring technology, and responses to the crisis. The rich set of variablesallows different characteristics to be linked in analyzing research questions.
This paper describes the database, discussing the variables that are included, themethodology used in collecting the data and outlines some of the results coming frominitial studies. It also raises avenues of research that could be examined using thedatabase.
Motivation for the Survey:
The survey was undertaken to fill an important information gap in theparticipating countries. Thailand initiated the project. Beyond gathering basicproduction and employment numbers, there was little information available to policymakers about the private sector. With years of high growth, this had not seemed to be aconstraint. However, by 1996, Thai exports were falling after years of spectaculargrowth. There was a growing appreciation for the need to better understand thedeterminants of competitiveness and technology transfer. Thailand fielded a firstindustrial survey in the fall of 1997, with technical assistance provided by the WorldBank. Other countries in the region were interested to benchmark themselves and soonthe survey took on a regional dimension. With the onset of the crisis, policy makers hadan even greater impetus to learn more about their industrial sectors and the challenges
4

facing enterprises as they tried to weather the rise in interest rates, depreciation andregional recession.
From the researchers' perspective, the collection of this data provides a newopportunity to learn about firm behavior on a broad set of dimensions and in a mannerthat is consistent across countries. Much progress has been made on this front forhouseholds, with the Living Standards Measurement Studies (LSMS) project nowcovering 22 countries. There has historically been a paucity of comparable firm-leveldata, particularly in developing countries. The World Bank is responding to thischallenge with its FACS initiative. This cross-country firm-level dataset represents thefirst of several such data collection efforts. The aim is to use a standardizedquestionnaire across countries to systematically collect data of interest to policy makersand researchers. Currently, there are FACS projects underway in India, Morocco andBolivia. A number of additional countries are interested and likely to participate in theproject in the near future.
Description of the Data:
The data covers five of the principal countries in East and Southeast Asia that were hit bythe financial crisis in 1997: Indonesia, Korea, Malaysia, the Philippines and Thailand. Ineach country, 650-950 firms were interviewed for the database, for a total of 4003establishments. The survey was conducted independently in each country, but acomparable instrument and methodology was used in each. This allows for meaningfulcomparisons to be made across countries. The overlapping sectoral coverage allows forbenchmarking and sector-specific studies also to be conducted.
The information was gathered using a two-pronged approach. Enumeratorsvisited each firm and conducted hour-long interviews with the owner or top manager ofthe establishment. This more qualitative information covered topics ranging from theownership structure of the firm, responses to the crisis, technology acquisition, views onthe business environment, and relationships with banks and other financial institutions.
A second part of the questionnaire asked for quantitative information. There werethree principal sections: production information, financial accounts and human resourcequestions. This part of the questionnaire was mailed to the plants a couple of weeks priorto the interview. It asks for more specific numbers that would be included in records butthat would not necessarily be recalled in an interview setting. It was designed to becompleted by the accountant and personnel manager. The enumerators discussed it withthe appropriate finance and/or personnel manager during the visit to the firm.Inconsistencies or incomplete answers could then be addressed directly. If necessary,follow-up interviews were conducted to ensure this second part was completed.
It should be noted that the response rates for these sections are somewhat lowerthan the first part of the questionnaire. Sometimes this was due to a failure of the plant tokeep such records. Occasionally there was a refusal to disclose the figures due toconcerns that too much information would be divulged - this was particularly true for thebalance sheet information. When there was less than full participation, the enumeratorsand their supervisors would try repeated contacts, often eliciting the help of tradeassociation members too.
5

The interviews were all conducted in parallel in the participating countries, so thetime-reference is the same. The questionnaires were finalized in mid-1998 and surveyswere launched in October and November 1998 and were finished by early March 1999.The timing of the surveys, a year and a half after the onset of the crisis, means adequatetime has passed to examine the real impact of the crisis and the steps firms had made inresponse.
In addition to gathering current data, the questionnaire asked for retrospectivedata on production, finances and labor. Retrospective data was limited to quantitativequestions that would rely on objective records, minimizing some of the weaknessesassociated with using such types of questions. Having past records increases the scopefor measuring the impact of the crisis, allows for the study of pre-crisis behavior and forthe analysis of some (limited) trends.
A number of criteria were used to focus the scope of the survey. The participatinggovernments were particularly interested in issues surrounding the competitiveness oftheir manufacturing sectors. Rather than be comprehensive of the entire manufacturingsector of the economy, a large sampling was taken of key industries. Thus, the five-sevenlargest contributors to GDP or trade were targeted in the study. As the products arelargely tradable goods (whether or not they are actually traded) they should be good testcases for how competitive the firms are.
Sampling
The sample frames were designed in collaboration with the national statisticalagencies of the participating governments, with technical assistance from the WorldBank. The most recent registry of manufacturing establishments was taken as thepopulation of plants from which the samples were drawn. The specifics for each countryare listed below:
Indonesia: The sample was drawn from The Directory of Large and MediumManufacturing Establishments (defined as having 20 or more employees) that is overseenby BPS (the national statistical office). It contains the population of registeredmanufacturing establishments based on the national industrial census.
Korea: The Ministry of Industry provided the sample of firms from its database ofregistered enterprises. The enumeration was carried out by N.I.C.E. under thesupervision of the Korean Institute for Industrial Economics and Trade (KIET).
Malaysia: The National Statistics Office provided the population of registered firms. Theactual enumeration was carried out by A.C.Nielsen, under the supervision of theEconomic Planning Unit of the Prime Mvinister's Office.
Philippines: The sample was drawn from The List of Establishments, 3800manufacturing establishments compiled and updated by the National Statistical Officeand used as the basis for their industrial statistics surveys.
Thailand: The sample was drawn from the Ministry of Industry's Factory RegistrationDatabase, comprised of 122,000 plants.
Within the populations of manufacturing enterprises, key sectors were targeted forthe survey. The decision to focus on particular sectors rather than the entire spectrum of
6

manufacturing enterprises stemmed from the desire to have adequate responses inparticular industries so as to do sector-specific analysis. To ensure adequate responses bysector, each country chose 5 to 7 sectors, based on their importance in GDP or exportsales. Preference was also given to sectors being covered by other participatingcountries.
Autoparts Chemicals Electronics Food Garments Machinery TextilesProcessing
Indonesia X X X X X
Korea X X X X X
Malaysia X X X X X X X
Philippines X X X X X
Thailand X X X X X
Once the sectors were selected, the populations were reduced to only includethose firms registered as having 20 or more employees. As the challenges facing micro-enterprises can be quite different, the sample was limited to small, medium and largefirms. Twenty employees was chosen as the cutoff as it was a natural breaking point inthe classification of firms in all the countries except Malaysia. At the time of the actualinterview, some of the enterprises were employing fewer than 20 employees, so thedatabase does include some smaller firms.
From the pool of firms with 20 or more employees in the chosen sectors,establishments were drawn randomly. The priority was to have a representative sampleso that the conclusions could be applied more broadly than if only the top performerswere surveyed. Sample weights are available upon request.
Caveats
A number of caveats should be kept in mind when interpreting the data. The firstis that there is survivorship bias. Unavoidably, only those firms that were still in businessat the time of the survey could be included. Thus those firms that would have been mostvulnerable at the outbreak of the crisis would not be represented in the group ofrespondents. This should be kept in mind, particularly in analyzing the effects of thecrisis. Attempts were made to gauge the extent to which this could be a problem. Thepopulation frame drew on 1996 registrations of firms and so the number of non-respondents due to bankruptcy could be reported. The rates were 10-15%, with thenumber highest in Indonesia. In the Thai case there is the possibility of looking at thefirms that went out of business directly as it was the country that had already run a surveythe previous year. About ten percent of firms that were in operation in the fall of 1997were no longer so in the fall of 1998. This is higher than the normal rate of attrition, butdoes not indicate that the survivorship bias is too drastic.
8 The Malaysian sample frame differs somewhat as it built on the sample of firms used in a prior surveyconducted by the Economic Planning Unit two years prior to this survey. Interested to build a panel, thosefirms in the selected sectors were included, regardless of the number of employees. Thus, Malaysia has ahigher incidence of very small firms.
7
A second caveat is that there is variation in the response rates of differentquestions. This is particularly true of the financial data. The response rates vary acrosscountry, but they are particularly low in Indonesia. The phenomenon stems from the factthat this was sensitive data, and, for many of the smaller companies, there were asked forinformation that they do not normally keep. As participation was voluntary, the firmscould not be compelled to respond.
A further caveat for the financial data is that there are not standard accountingrules in place in the countries surveyed. While the terms used were carefully explained,there is also no guarantee that the definitions used are comparable across all firms, evenwithin the same country. The enumerators did their best to ensure a consistent set ofdefinitions were used, but researchers are cautioned that the financial data should beclosely examined before drawing conclusions.
Lastly, there was only minimal outside verification of the numbers reported on thesurveys. The enumerators did ask if there were clear inconsistencies and clarifiedresponses accordingly. However, there were not many sources available to verify thedata, particularly as the survey asked for several figures that are not otherwise collected.In some instances it was possible to link our survey with the national statistical databases.However, there is no way to ensure that the numbers reported to the government and tothe survey enumerators, even if consistent, are in fact accurate.
Prior to the launching of the survey, there had been a concern that respondentswould not be too precise in their answers. In fact, the reverse was true. Manyrespondents were so keen to provide exact answers that the calculation of the requesteclfigures was a daunting task. In such cases enumerators were told to encourage themanagers to provide their best estimate, but that accuracy to the decimal point was notnecessary. This was particularly important to ensure that sections in the second part ofthe questionnaire were not left blank.
Questionnaire
The questionnaire is extensive, covering many aspects of firm behavior. Due tothe large number of variables, it is not possible to describe each in great detail. Rather,each of the 9 principal sections is discussed, highlighting those variables that are notgenerally available in other sources. Brief descriptions summarizing the data should giveresearchers a flavor of the type of hypotheses that can be examined. Sections 1-6 wereasked during the interview with the manager or owner of the establishment. Sections ,'-9were completed by the accountant and personnel manager.
1. General information about the firm
Before focusing on the particular plant being surveyed, background information isgathered on the firm it is a part of. For the 76% percent of respondents that are single-plant firms, there is no distinction between the firm and the plant. For multi-plant firms,each plant is not included in the survey. The units of selection were plants not firms, so itis a random event if multiple plants in the same firm were surveyed.
This section focuses on three principal issues: the legal organization of the firrn,the ownership structure of the firm, and the previous experience of the founder of thecompany. The information can be used for measures of the size and age of the firm, the
8

concentration of ownership, the extent of foreign ownership and the background of theprincipal entrepreneur. Table 1 shows the breakdown of foreign versus domesticownership of firms. Sixteen to 35% of firms have a foreign partner with a 10%ownership stake, the rates being lowest in Indonesia and Korea and highest in thePhilippines. Within the sample, 30% are single proprietorships or partnerships, 20% arelisted firms, 40% are private companies and 10% are cooperatives or have another formof legal organization. On average, about a fifth of the principal enterpreneurs had hadprior experience in the industry, and just over a quarter of them had worked for amultinational corporation or joint venture.
2. General information about the plant
The section gathers information on the type of products the plant produces, itsprimary markets, the government incentive programs the plant participates in, and itsprincipal sources of finance and credit arrangements. The characteristics of the firms inthe sample are shown in Table 1. Firms are categorized by size, export status, foreignownership and sector. Firms are defined here as 'small' if they have less that 150employees. About 60% of firms are small according to this definition. Exporters slightlyoutnumber non-exporters, although there is significant variation across sectors and sizesof firms. Together with the information in section 1, this provides many of the standardcontrols used in firm level studies.
3. Impact of the regional crisis
The survey contains information of the impact of the crisis on three principalareas: production, finances and employment.
i) Production: The database contains information about changes in capacityutilization, domestic and export sales, and the channels through which the crisis was felt.The detrimental impact was widespread, with over 70% of firms reporting declines incapacity utilization.9
Table 2 profiles the firms that were recovering or expanding in 1998 relative totheir performance in 1996. This is only a small share of the firms, about 13%. There arelarge sectoral differences across these firms, with only 2% of these firms in the autopartssector and 36% in textiles and garments. This is consistent with the degree of outwardorientation of these sectors and that 70% of the expanding firms were exporters.
Despite the initial hopes for an export-led recovery, the data clearly shows thatwhile exporting firms were relatively better off (non-exporters declines were on averagealmost 10% greater), still over a third of exporting firms reported declines in performanceof 10-25%. With a significant share of exports sold to neighboring countries, the regionalrecession has impacted the demand for exports. Coupled with falling dollar prices inmany sectors, it is not surprising that the exporting firms have not all experienced thedevaluation as sufficient to boost their sales.
The survey results shed some light on the reason for the lack of export-ledrecovery. Exporters in Korea, Malaysia and Thailand were asked for the reasons for the
9 One interesting result is that the fall in capacity is not just associated with the crisis. Particularlynoticeable in Thailand is that capacity utilization was already falling prior to the devaluation in July 1997.
9

decline in export. The most important reason given was the lack of foreign demand andthe lack of stability of foreign markets. The collapse of domestic demand in the fivecountries and the recession in Japan also hurt exporters, because of the importance ofintra-regional trade. Including Japan, about half of the exports of the five countries go tothe region (the exception is the Philippines that sells a greater share of its exports to theUS). (See Waiquamdee, Drairiksh, and Phongsanarakul (2000)).
ii) Finances: The second subsection gathers information on the financial positionof the plant. It asks about liquidity, working capital and availability of credit. It asks alsofor an evaluation of the factors affecting credit availability. Table 3 shows the results forfirms reporting difficulties with inadequate liquidity and the ranking of the factors theyperceived to be the source of the problem. Thai and Korean firms were most likely tocomplain about inadequate liquidity, with decreased revenue and higher input costs as theprime areas of concern. Financial dimensions, in terms of existing debt burden andaccess to external capital, ranked lower. This finding is consistent with over 70% offirms reporting lower capacity utilization, while 20% report having sought and beendenied additional external credit. Credit constraints captured the headlines, but thedecline in domestic demand was a first order problem for more of the manufacturingsector.
iii) Employment: The last area of focus in this section is how the crisis affectedthe employment practices of the plant. The database has information on the extent towhich plants changed the size of their workforce, the profile of workers who were nolonger working at the plant and alternative measures to layoffs that the firm waspursuing.
Almost half the firms in the survey were employing fewer workers in 1998 thanthey had been prior to the crisis. The rate is highest in Korea, where 60% have fewerworkers. Korea and Thailand are also the countries where the proportion of redundanciesare greatest, with over a quarter of firms reporting a decline in employment of over 25%7o.In Korea, the reduction in total employment was close to 20%. Malaysia is the countrywhere the impact on employment has been mildest. Across sectors, autopartsexperienced the largest reductions with 73% of the firms reducing their workforces,followed by electronics and machinery.
Younger workers were disproportionately made redundant in all countries butKorea. Most of the lost jobs had formerly been held by 21-30 year old workers.Likewise the job losses were concentrated in the production jobs rather than managerialor technical staff. Production jobs represent close to two-thirds of the jobs, but representthree-quarters of the lost jobs. This is most striking in Malaysia and Thailand. Theaverage tenure of those made redundant was 1 to 3 three years. The implication of thesepatterns is that younger workers with less firm-specific human capital have been thosethat are let go.
The one exception to this pattern is Korea. In Korea, almost half of the lost jobshad been held by workers in their 30s. Korean firms also had a lower share of productionjobs being shed, consistent with the lower overall share of production jobs in Korea, butthis category still bore a disproportionate share of the lost jobs. Along with thePhilippines, Korean firms also had a higher share of workers with 6 to 10 years tenure
10

being let go. This could represent a significant loss of human capital. On the other hand,bearing in mind the loosening of inflexible labor markets, this is consistent with Koreanfirms using the opportunity to substantially restructure their workforces. Thisexplanation is consistent with the fact that Korean firms are also the most likely to befilling vacancies; a sign that they are reacting to meet their changes in labor demand.
One striking finding is that employment changes are only loosely correlated withchanges in capacity utilization; there is evidence of labor hoarding in Indonesia, Thailandand Malaysia. Thus, while the data indicates Korea has made the most progress inadjusting its labor force to the new market conditions, significant labor reductions couldstill be on the horizon. (see Meng and Duncan (2000))
Research Questions:* Are SME's credit constrained?* Does a firm's inability to raise capital affect their production decisions?* Is there evidence of labor hoarding?
4. Business environment and infrastructure
This section asked managers to rate various business environment factors. Thefocus is not simply on the current state of affairs due to the crisis. Rather, managers werealso asked to take a longer run perspective. The questions allow the perceived chiefobstacles to growth to be identified and ranked. In addition, countries included questionson the effectiveness of various government programs. The programs listed included bothshort run crisis measures as well as pre-existing incentive programs.
This section includes both qualitative questions and quantitative measure ofbottlenecks. For the qualitative measures, managers were asked to rank variousdimensions of the business environment on a scale of 1 to 5. These measures are mostuseful for intra-country comparisons and to rank the order of bottlenecks.10 There isconsiderable variation among the each of the factors' scores, demonstrating thatrespondents did differentiate between the severity of different types of potentialbottlenecks. Several macroeconomic variables receive high scores, i.e. the decline indemand and high interest rates, that reflect the severity of the crisis at the time of thesurvey. However, several structural issues are flagged, particularly for non-exporters andforeign firms. These firms find red-tape and corruption to be severe bottlenecks, as is thesupply of technical workers. Local firms and non-exporters found access to finance to bea greater obstacle. These qualitative measures are complemented by quantitativemeasures of bottlenecks. Thus firms are asked about the degree of red tape as well as thenumber of days it takes to get a shipment through customs (see Figure 1), and they areasked about the quality of infrastructure as well as whether they have their owngenerator.
Research Questions:
'° There are differences in mean scores across countries in the level of complaints made by therespondents. This could be due to cultural differences or differences in expectations for what is seen asacceptable business conditions.
11

* How do government assistance programs improve productivity, labor practices,and/or investment decisions?
* What types of bottlenecks do exporters find most constraining?* How do government policies affect firm location?
5. Technology and product/process development
The section asks about the R&D practices of the plant and its sources oftechnology acquisition. Managers report whether they conduct R&D and if so, whatshare of sales it represents. They also provide their sources of new technology,differentiated between domestic and foreign sources. About a quarter of firms acquiretheir technology from foreign sources; over a third of exporters versus one in sixdomestically oriented firms. The most common sources are licensing, transfers frompartner/parent companies or through the hiring of technical experts.
This section also provides various measures of technology sophistication. Itprovides measures of the degree of automation of production, the means of verifying theaccuracy of outputs, and the vintage of a firm's capital stock (see Figure 2). Thedifferences between exporters and non-exporters is striking. Other than in Korea, whereall firms have large shares of new equipment, exporters use significantly more recentforms of equipment.
The survey also includes questions on the relationship with other firms such assubcontractors - both whether they do subcontracting and if they use subcontractors.This information is useful to examine one of the possible channels of technologydiffusion. Aggregate data cannot answer the question of how technology is diffused.Information on the sources of technology, its upstream and downstream linkages andmeasures of productivity allow for this important issue to be examined. (See Blomstromand Kokko 1997, Aitken and Harrison (1996) and Haddad and Harrison (1993)). Thesection also provides information on the number of days between when an order isreceived and the product is delivered.
Research Questions:* What determines firms' decisions to adopt new technologies?* Does (foreign) ownership affect the extent of technology diffusion?* Do sub-contracting relationships foster greater technology diffusion?
6. General financial practices
This section asks questions about the number and type of financial institutions theplant does business with. It asks about the sources of finance a firm uses and whether itsstatements are reviewed by external auditors. It also asks about the role of its board ofdirectors and how major decisions are made.
In section three when firms gave feedback on the impact of the crisis on theirfinancial position, declines in cash flow were highlighted over declines in access tocredit. Examining the sources of working capital and the reliance on internal fundsdemonstrates why this pattern is reasonable, particularly for the SMEs and non-listedenterprises. Only about 25 (Indonesia and Malaysia) to 40 percent (Thailand) of working
12

capital requirements of surveyed firms come from loans, the bulk (between 50 and 65percent) of working capital requirements come from retained earnings, see Figure 3.Also Thai and Indonesian firrns get about one third and Korean, Malaysian, and Filipinofirms about 15 percent of their working capital from informal sources of financing-family, partners, informal money lenders. Thus Thailand, the country with the highestreliance on loans to finance working capital, is also the country where firms complainedthe most about the lack of loans for working capital. Given this high reliance on internalfunds for working capital, it is less surprising that firns report liquidity concerns fromreduced sales over credit availability as the principal cause for output declines.
A central issue of corporate governance is the relationship between the firm andits financial institution(s). The disclosure and transparency of information is of particularinterest. Firms were asked if they were required to provide audited statements to receivea loan. Of those with 20% or more of their financing provided by bank or financialcompany loans, the share that are so required ranged from 40% in Indonesia and Thailandto 70% in Korea, Malaysia and the Philippines. If firms are only interested in securing aletter of credit for trade finance, the issue of transparency is not so important. But to theextent that many firms' only source of finance is short-term trade credit that they in factuse to finance investment or other longer run activities, the issue is still pressing. For theSMEs, the concern of the lack of transparency is mitigated somewhat by the fact that overhalf the SMEs have maintained a relationship with the same financial institution over theentire life of the enterprise. Even if there is no objective reporting of financialinformation in these cases, the financial institution will have built up knowledge abouttheir client.
Research Questions:* Does management entrenchment (tenure, equity, and familial ties) affect corporate
decisions?* How do ownership links affect leverage decisions?
7. Production and investment
The data in this section provides the basis for productivity analysis. It reportsinformation on production, sales, purchases of inputs, energy, changes in inventory, andinvestment. It also gathers information on the destination markets for exports. With thisinformation, value added can easily be computed. The information on capital and laborare available too so production functions can best estimated. These measures ofproductivity can be compared with those available in the technology sections. There is agrowing literature on productivity studies in East Asia. (Young (1995), Hsieh (1999))Much of the analysis has used industry level data. With microdata now available, thisdataset provides the opportunity to make a substantial contribution to this debate (SeeHallward-Driemeier, larossi, and Sokoloff (2000)).
Table 5 reports the capital intensities of firms across sectors and countries. Koreais clearly the most capital intensive country, followed by Malaysia, then Thailand and thePhilippines and finally by Indonesia. This is consistent with the differences in thevintage of capital reported in section 5 and Figure 2. Country differences are alsoreflected in the investment behavior of firms. However, important differences in theexport orientation and size of firms emerge. There is a steady overall rate of firms that
13

invest every year (about two-thirds), with rates highest in Korea and lowest in Indonesia.With the onset of the crisis, the number of firms in each country that invest does notchange dramatically. Rather, the adjustment comes in the size of the investment, with thelarge majority making smaller investments relative to their capital stocks. There is alsoevidence of the lumpy nature of investments; small firms are less likely than large firmsto invest every year, but when they do, their investment is larger relative to their capita]stock. In contrast, larger firms have greater opportunities to smooth their investmentdecisions.(See Hallward-Driemeier, (2000)).
One issue in using the production data over time is the use of an appropriatedeflator. With variations in the extent of price changes across sectors and betweendomestic and foreign prices, aggregate deflators can be misleading. Thus, firm-specificprice changes are reported, see Table 4. Given the extent of the devaluation thatoccurred during the time of the survey, it is particularly important to distinguish betweendomestic and foreign price changes. Firms were asked to report the average change in theprices of four categories of goods. The first two are of inputs, those inputs from domesticsources and those that are imported. The last two reflect changes in prices of sales, forgoods sold domestically and for goods that are exported. These prices changes, inconjunction with the accompanying weights for the shares of inputs that are imported orpurchased from domestic sources and of goods sold abroad and domestically, firm-specific deflators can be constructed. It should be noted that the responses representindices for the establishment's entire product line, and do not reflect the changes in priceof a single item. For researchers wanting a broader based price index, country-sectoraverages can be used. Looking at such an index reveals that there are significant sectordifferences in prices changes. Thus, autoparts experienced the most modest priceincreases; consistent with it being on of the hardest hit manufacturing sectors.
Research Questions:* Are firns that use foreign-sourced technology or that have ISO-9000 certification
producing higher value added per worker?* What are the main correlates of high total factor productivity?* How does economic and/or political uncertainty affect investment?
8. Employment and Training
Firms were asked to report total employment and employment by categories ofworkers. The classifications are: mangers and supervisors, engineers and technicalworkers, production workers and non-production workers. The exact definitions varyonly slightly across countries so as to be consistent with the worker classificationsreported to the departments of labor. Except for Korea, the categories also broken downby the share of male and female workers in each category. Information is also reportedon the number of hirings, firings and vacancies. In addition, there is information onwages and total compensation. This is also reported by total employment and by workercategories.
This section contains questions on the training received by employees of the firms(see Figure 4). The number of workers in each category that received formal training isreported, along with the average number of weeks of training. Firms also indicate iftraining levels are higher or lower than they had been three years earlier.
14
The share of workers with various levels of educational attainment are reported.At least four different levels are given that roughly correspond to primary education,secondary education, vocational training and tertiary education. The number anddefinitions of educational attainment to differ across countries reflecting the variations ineducation structures in each country.
Lastly, firms are asked to provide the share of labor costs in the total costs ofproduction. This can provide a consistency check as total compensation and othercomponents of costs and sales are reported elsewhere in the survey.
Research Questions:
* What influences a firm's decisions to invest in training its workers?* What is the impact of labor regulations on hiring, growth, and technology decisions
of firms?* Are there gender differences in employment practices and if so, what are the factors
shaping them?
9. Corporate finance: assets, liabilities, collateral, guarantees
This section provides detailed balance sheet information. It reports the assets andliabilities of the firms. It also asks for information on hedging, collateral and guaranteesof loans. It also has certain entries for the income statement such as sales, cost of goodssold, profits, foreign exchange gains/losses and interest expenses. While much of thisinformation is available for publicly traded companies, it is highly unusual to have itavailable for unlisted companies. This will allow for research to be extended to newclasses of finns. However, precisely as this is information firms are not used toreporting, caveats regarding the quality of some of the entries should be kept in mind.
Short-term borrowing in foreign currency and the sudden reversal of capital flowsare often cited as important causes of the financial crisis. Certainly average debt-equityratios are high, particularly in Korea (see Table 6). And of these loans, the majority areshort-term, leaving firms particularly vulnerable to large changes in interest rates (SeeDwor-Frecaut, Hallward-Driemeier and Colaco (2000)). However, this data illustratesthat for the manufacturing firms, foreign borrowing was concentrated in a small numberof firms (See Kawai, Hahm and larossi (2000)). Based on the survey results, themanufacturing sector does not seem to have been a major player, particularly relative tothe real estate and financial services sectors. With the exception of Korea, less than 10%of financing was in foreign currency, see Figure 9. Korea is notable for its greaterreliance on foreign borrowing, with a quarter of firms engaging in this practice. Thatthere are more listed companies in the Korean sample is one explanation for this. Of theshare of financing that is in foreign currency, only in Korea and Malaysia is the majorityof it not short-term. However, it remains true that most of the effect of the depreciationwould have been transmitted through alternative channels (e.g. the impact on banks) thanthrough the balance sheets of manufacturing firms.
Research Questions* How does the indebtedness of firms affect performance?* Can supplier credit substitute for financial institution debt?* What factors affect the access to capital of similar firms in different countries?
15
Confidentiality
Given the richness of the data and the confidential nature of some of the figuresreported, modifications were made to protect the individual identities of firms.Safeguarding respondents' identities is in keeping with the legal requirements of thecounterpart government agencies and ensured the cooperation of firm managers inresponding to the survey and interviews. The process by which the confidentiality ofresponses was protected was designed to minimize the loss of information to researchers.
Two sources of identifying information existed. The first was the firm name andcontact information. All this information was simply deleted. The second source stemsfrom the possibility of inferring the identity of the respondent based on combining anumber of pieces of information in the survey. For example, if there is a textile plant witha foreign partner located in the northeast that has 1000 employees and has been inoperation for 35 years, it would be easy to find it in the survey as there are not manyfirms who would fit such a description. Large firms are particularly susceptible to beingidentified and so the following three steps were taken:
i) Certain variables were aggregated into indicator variables. Thus, rather thangive the province a firm was located in, firms are reported as being in the greater capitalcity area or outside this area. Likewise firms are reported as being founded pre and post1990.
ii) Many variables were converted to ratios. Such a transformation rarelycompromise the usefulness of the data to researchers, but makes it considerably moredifficult to match up the data with prior information one might have on the levels ofvariables. Three denominators were used. For all variables regarding numbers of people,ratios are reported as a share of total employment (e.g. number of technical workers/totalemployment). For components of sales, income or expenditures, the ratios are shares oftotal sales. For components of assets, investment or liabilities, the ratios are reportedover total assets. The ratios are calculated year by year, so that the denominator is of thesame year as the numerator. The one exception are the values of employment, sales andassets for 1997 and 1998 are reported as ratios relative to their 1996 values.
iii) The value of the denominators (total employment, sales and assets in 1996)are available for small and medium enterprises, but are capped for large firms. Thus, forSMEs, the level values of all the variables can be calculated if they are of particularinterest to the researcher. However, for the large firms, all the rest of the information isincluded in the database, but in ratio form rather than levels. Several criteria were used todefine 'large' (i.e. over 500 employees, top 10% of sales, top 5% of assets, top 5% ofpaid up capital), and a firm is considered 'large' if it meets at least one criteria.
The database is available through the World Bank website, at:http:\\www.worldbank.org\research\facs. The individual country databases and theircorresponding documentation can be downloaded from this site. The documentationincludes a more detailed description of the sampling methodology, the questionnaire, afile with variable definitions and names and any modification done to protect theconfidentiality of the firms' responses. There is also a link to the site that gives a numberof papers that have already been written using the data that were presented at aconference in Bangkok, attended by high ranking policy makers and members of the
16

private sector. As new papers are written, it is hoped that they too will be made availableon this site. Please contact the Research Department for information on how to do this.
Conclusion:The database provides a rich source of information on a large number of firms. It
has two primary areas of focus: one is the impact of the crisis and the other are longer rundeterminants of productivity, employment practices and financial structure. Quantitative,objective measures are provided so that indicators of firm performance can beconstructed. Already the data has been used for a regional conference attended by high-ranking policy makers."1 Govermment studies of the impact of the crisis and determinantsof productivity are being currently being carried out. The discussion above has pointedout some of the many remaining avenues for additional research.
This database will be joined by additional country databases as part of the FirmAnalysis and Competitiveness Surveys (FACS) initiative being spearheaded by the WorldBank. The aim is to fill the gap in much needed micro-evidence using comparableinstruments. This database is the first step in this important project.
l The conference was chaired by Dr. II SaKong, former Minister of Finance of Korea and currentlyChairman and CEO of the Institute for Global Economics; Dr. Zeti Akhtar Aziz, Deputy Governor of BankNegara Malaysia, M.R. Chatu Mongol Sonakul, Governor of the Bank of Thailand; Secretary BenjaminDiokno , of the Department of Budget and Management of the Philippines and Dr. Mari Pangestru,Executive Director of htheCenter for Strategic and International Studies of Indonesia. The conference washeld March 31-April 2, 1998 and provided 160 senior government officials, business people and academicsto use the insights from the mnicro-date to discuss the prospects for Asian corporate recovery. The outcomeof the discussions are available in "Asian Corporate Recovery: Findings from Firm-Level Surveys in FiveCountries", Dominique Dwor-Frecaut, Francis Colaco and Mary Hallward-Driemeier (eds.), The WorldBank, 2000.
17

Bibliography
Aitken, Brian, Gordon Hanson and Ann Harrison. "Spillovers, Foreign Investment andExport Behavior." Journal of International Economics, 43(1/2) (August 1997), pp.103-132.
Aitken, Brian and Ann Harrison. "Do Domestic Firms Benefit from Foreign DirectInvestment? Evidence from Panel Data."
Arellano, M. and S. Bond, "Some Tests of Specification for Panel Data: Monte CarloEvidence and an Application to Employment Equations," Review of EconomicStudies 58, (1991) 277-297.
Athey, Michael and Prem Laumas, "Internal Funds and Corporate Investment in India"Journal of Development Economics 45 (1994), 287-303.
Biggs, Tyler, Manju Shah and Pradeep Srivastava. "Technological Capabilities andLearning in African Enterprises." World Bank Technical Paper No. 288, AfricaTechnical Department Series, 1995.
Biggs, Tyler and Pradeep Srivastava. "Structural Aspects of Manufacturing in Sub-Saharan Africa: Findings from a Seven Country Enterprise Survey. Wrld BankDiscussion Paper No. 346, 1996.
Brunetti, Aumo, Gregory Kisunko and Beatrice Weder. "Credibility of Rules andEconomic Growth: Evidence from a Worldwide Survey of the Private Sector."World Bank Economic Review v12, n3 (September 1998): 353-84.
Bigsten, Arne, Paul Collier, Stefan Dercon, Bernard Gauthier, Jan Willem Gunning,Anders Isaksson, Abena Oduro, Remco Oostendorp, Cathy Pattilo, MansSoderbom, Michel Sylvain, Francis Teal and Albert Zeufack, "Investment inAfrica's Manufacturing Sector: A Four Country Panel Data Analysis, " OxfordBulletin of Economics and Statistics, 61,4 (1999), 489-512.
Bond, Stephen, Julie Elston, Jacques Mairesse and Benoit Mulkay, "Financial Factorsand Investment in Belgium, France, Germany and the U.K.: A Comparison UsingCompany Panel Data," NBER Working Paper Series No. 5900, (Jan. 1997)
Bond, Stephen and Costas Meghir, "Dynamic Investment Models and the Firm'sFinancial Policy, Review of Economic Studies (1994), 197-222.
Carpenter, Robert, Steven Fazzari and Bruce Petersen, "Financing Constraints andInventory Investment: A Comparative Study with High-Frequency Panel Data,"The Review of Economics and Statistics, (1998), 513-519.
18

Claessens, Stijn and Simeon Djankov, "Publicly Listed East Asian Corporates: Growth,Financing and Risks" in Asian Corporate Recovery: Findings from Firm-LevelSurveys in Five Countries, Washington DC: The World Bank (2000), p. 18-35.
Claessens, Stijn, Simeaon Djankov and Larry Lang, "Who Controls East AsianCorporates?", World Bank Policy Research Working Paper No. 2054. (1999).
Clerides, Sofronis, Saul Lach and James Tybout. "Is 'Learning-by-Exporting"Important? Micro-Dynamic Evidence from Colombia, Mexico and Morocco",Quarterly Journal of Economics, 454(3) (August 1998), pp. 903-947.
Dollar, David and Mary Hallward-Driemeier, "Crisis, Adjustment and Reform inThailand's Industrial Firms, World Bank Research Observer, 15, 1 (2000) 1-22.
Dwor-Frecaut, Dominique, Mary Hallward-Driemeier and Francis Colaco, "AsianCorporate Credit Needs and Governance" in Asian Corporate Recovery: Findingsfrom Finn-Level Surveys in Five Countries, Washington DC: The World Bank(2000), p. 61-81.
Dwor-Frecaut, Dominique, Francis Colaco, and Mary Hallward-Driemeier (eds.), AsianCorporate Recovery: Findings from Firn-Level Surveys in Five Countries,Washington DC: The World Bank (2000).
Fazzari, Steven, Glenn Hubbard and Bruce Peterson, "Financing Constraints andCorporate Investment," Brookings Papers on Economic Activity, (1988), 141-195.
Fazzari, Steven, Glenn Hubbard and Bruce Petersen, "Investment-cash flow sensitivitiesare useful: A comment on Kaplan and Zingales," The Quarterly Journal ofEconomics, (May 2000) 695-705.
Hallward-Driemeier, Mary, Dominique Dwor-Frecaut and Francis Colaco, "AsianManufacturing Recovery: A Firm-Level Analysis" in Asian Corporate Recovery:Findings from Finn-Level Surveys in Five Countries, Washington DC: The WorldBank (2000), p. 1-17.
Harris, John., Fabio Schiantarelli and Miranda Siregar, "The Effects of FinancialLiberalization on the Capital Structure and Investment Decisions of IndonesianManufacturing Establishments," The World Bank Economic Review (1994) 17-47.
Hoshi, Takeo, Anil Kashyap and David Scharfstein, "Corporate Structure, Liquidity andInvestment: Evidence from Japanese Industrial Groups, " The Quarterly Journalof Economics (February 1991), 33-60.
Hsieh, Chang-Tai, "Productivity Growth and Factor Prices in East Asia. " AmericanEconomic Review 89(2), (1999), 133-138.
19

Hubbard, R. Glenn, "Capital Market Imperfections and Investment," Journal ofEconomic Literature 35 (1998), 193-225.
Jorgenson, Dale, "Econometric Studies of Investment Behavior: A Survey," Journal ofEconomic Literature 9 (Dec. 1971), 1111-1147.
Kawai, Masahiro, Hongjoo Hahm and Giuseppe larossi, "Corporate Foreign Debt in EastAsia: Too Much or Too Little?" in Asian Corporate Recovery: Findings fromFirm-Level Surveys in Five Countries, Washington DC: The World Bank (2000),p. 111-121.
Kaplan, Steven N. and Luigi Zingales, "Do Investment-Cash Flow Sensitivities ProvideUseful Measures of Financing Constraints?" The Quarterly Journal of Economics,(Feb. 1997) 47p.
Kaplan, Steven and Luigi Zingales, "Investment-Cash Flow Sensitivities are not ValidMeasures of Financing Constraints," The Quarterly Journal of Economics, (May2000) 707-712.
Kraay, Aart. "Exports and Economic Performance: Evidence from a Panel of ChineseEnterprises," The World Bank Policy Research Working Paper.
Krugman, Paul. "The Myth of Asia's Miracle" Foreign Affairs, 73 (6) 1994, p. 62-78.
Levine, Ross. "Financial Development and Economic Growth: Views and Agenda,"Journal of Economic Literature, 35(2), (June 1997), p.6 8 8-7 2 6.
Little, Ian. "Small Manufacturing Enterprises in Developing Countries, " World BankEconomic Review, Jan. 1987 1(2), p. 203-236.
Little, Ian , Dipak Mazumdar and John Page, Small Manufacturing Enterprises: AComparative Analysis of India and Other Economies. New York: OxfordUniversity Press, 1987.
Mairesse, Jacques, Bronwyn Hall and Benoit Mulkay, "Firm-Level Investment in Franceand the United States: An Exploration of What We Have Learned in TwentyYears," NBER Working Paper No. 7435.
Mairesse, J. and B. Dormont. "Labour and Investment Demand at the Firm Level: AComparison of French, German and U.S. Manufacturing 1970-79, " EuropeanEconomic Review, 28(2) (1985) 201-23 1.
Meng, Xin and Ronald Duncan, "Corporate Employment and Public Policy" in AsianCorporate Recovery: Findings from Firn-Level Surveys in Five Countries,Washington DC: The World Bank (2000), p.12 3-1 4 0.
20

Nabi, Ijaz, "Investment in Segmented Capital Markets, " The Quarterly Journal ofEconomics (1989) 453-462.
Recanatini, Francesca, Scott Wallsten and Colin Xu, "Surveying Surveys andQuestioning Questions," World Bank Policy Research Working Paper, No. 2307(March 2000).
Reinikka, Ritva and Jakob Svensson, "Confronting Competition: Investment Responseand Constraints in Uganda," World Bank mimeo (1999).
Roberts, Mark and James Tybout. Industrial Evolution in Developing Countries: MicroPatterns of Turnover, Productivity and Market Structure. New York: OxfordUniversity Press, 1996.
Rodrik, Dani. "TFPG Controversies, Institutions and Economic Performance in EastAsia." NBER Working Paper No. 5914, (February 1997).
Schaller, Hunter, "Asymmetric Information, Liquidity Constraints and CanadianInvestment," Canadian Journal of Economics 26 (August 1993), 552-574.
Stiglitz, Joseph and Andrew Weiss, "Credit Rationing in Markets with ImperfectInformation," The American Economic Review 71, 3 (1981) 393-410.
Stone, Andrew, "Listening to Firms," The World Bank Policy Research Working Paper,No. 923 (1992).
Tan, Hong W. and Geeta Batra, Enterprise Training in Developing Countries: Incidence,Productivity Effects and Policy Implications, The World Bank, 1995.
Tybout, James R, "Credit Rationing and Investment Behavior in a Developing Country,"Review of Economics and Statistics 65 (1983), 598-607.
Tybout, James, "Manufacturing Firms in Developing Countries: How Well do they doand Why?," The World Bank Policy Research Working Paper, No. 1965 (1998).
Recanatini, Francesca, Scott Wallsten and Lixin Colin Xu, "Surveying Surveys andQuestioning Questions: Learning from the World Bank Experience" World BankPolicy Research Working Paper, No. 2307 (2000).
Waiquamdee, Atchana, Soravis Drairiksh, and Wasana Phongsanarakul, "Corporates'Views of the Constraints to Recovery" in Asian Corporate Recovery: Findingsfrom Firm-Level Surveys in Five Countries, Washington DC: The World Bank(2000), p. 18-35.
Whited, Toni M., "Debt, Liquidity Constraints, and Corporate Investment: Evidencefrom Panel Data," Journal of Finance 47 (Sept. 1992), 1425-1460.
21

World Bank, The East Asian Miracle, Washington D.C. 1993.
Young, Alwyn, "The Tyranny of Numbers: Confronting the Statistical Realities of theEast Asian Growth Experience." Quarterly Journal of Economics, 110 (1995)641-680.
Young, Alwyn. "A Tale of Two Cities: Factor Accumulation and Technical Change inHong Kong and Singapore." NBER Macroeconomics Annual, 1992.
22

Table 1. Characteristics of the Sample
Sim E>pxxt onentation FDI finn Sector Total
Small Large NonetesEers E r,es No Yes Food Textilaegarnent Eectr./IMach. Chem. Auto. #of fims
CountlyIndonesia 530/c 470/o 61% 390/o 84% 16% 32% 260/o 13% 290/o 00/0 940
KDrea, Rep. of 65% 35% 25% 75% 83% 1P70/ 0% 230/% 35% 280/c 14% 857Malaysia 73% 27%/ 53% 47P 74% 26% 22% 26% 170/o 17/ 4% 849
Philippines 47/o 530/ 47/o 530/o 65% 35% 24% 38% 200/ 1 7/ 0% 694Thailand 620/o 380/o 430/o 570/o 700/o 30% 10%/c 54% 16% 0% 200/o 652
SectorFood 64% 360/o 630/o 370/o 84% 16%0. 718
Textiles and garments 61% 390/o 470/o 53% 82% 18% .. 1291Bectmnocs and electncal macNnery 56% 44% 30% 700/o 60% 40%0. 806
Chericals 60%/o 40% 460/o 54% 760/o 24%0. 779Auto parts 630/% 37% 45% 55% 74% 260/o 276
SizeSmall . 61% 39%/O 86% 14% 18% 32% 18% 200/o 8% 2186Large 24% 76% 620/o 380/a 16% 320/a 230/o 200/c 7/o 1404
Exor anentationNoriexporters 80% 20% 92% 80/c 25% 33% 13% 19% 70/o 1785
Expoiters 44% 560/o 630/o 370/o 12% 320/% 260/o 190/a 70/o 2084
FDI fimiNo 69% 31% 54% 460/o 200/% 35% 17/o 200/a 7% 2985
Yes 380/o 620/o 190/% 81% 12% 25% 34% 20%/a 70/o 945
r/ndedessLow 63% 370/o 490/% 51% 730/a 27/o 1P/o 33% 22% 200/a 8%
Figh 55% 45% 36% 64% 76% 24% 12% 35% 24% 19%h 9°h
Foreign bonrangNo 670/o 330/o 490/o 51% 80h/o 20%/o 16% 36% 21% 20h/a 8% 1656
Yes 370/o 630/o 130/° 87% 5B0/c 420/o 60/a 29% 300/o 21% 13%/o 907
Total 61% 390/o 460/o 54% 76% 24% 18% 320/a 200/o 200/ 7/o 3992
Note: Percentages represent the share of the row variable that has the correspondng column characteristic.
Source: World Bank, Asian Corporate Crisis and Recovey Frm-Level Survey 1999
23

Table 2. Who Is Recovering: Characteristics of the Finns that Expanded in 1998 Relative to the End of 1997Reported as percent (bv country) of firms that have expanded
By size By export orientation FDI firm Sector
SmafD Large Nonexporters Exporters No Yes Food Text and garm. Elec. mach. Chem. Auto. Total % SampleIndonesia 43.1% 56.9% 40.1% 59.6% 79.4% 20.6% 47.6% 7.9% 17.5% 26.9% 51 6.3%
Korea 70.1% 29.1% 21.9% 78.1% 81.9% 18.1% 31.4% 25.0% 32.4% 1.0% 103 12.0%Malaysia 65.1% 34.9% 39.3% 60.7% 68.5% 31.5% 31.5% 19.1% 20.2% 27.0% 2.3% 86 10.6%
Philippines 43.9% 56.3% 33.8% 66.2% 59.8% 40.2% 25.6% 40.2% 19.5% 14.1% 71 12.6%Thailand 56.0% 44.0% 25.9% 74.1% 67.0% 33.0% 12.1% 66.4% 12.9% 8.6% 100 15.2%
Total 57.9% 42.1% 30.8% 69.2% 71.2% 28.8% 20.4% 38.3% 21.3% 19.1% 2.9%
Source: World Bank, Asian Corporate Crisis and Recovery Firm-Level Survey 1999
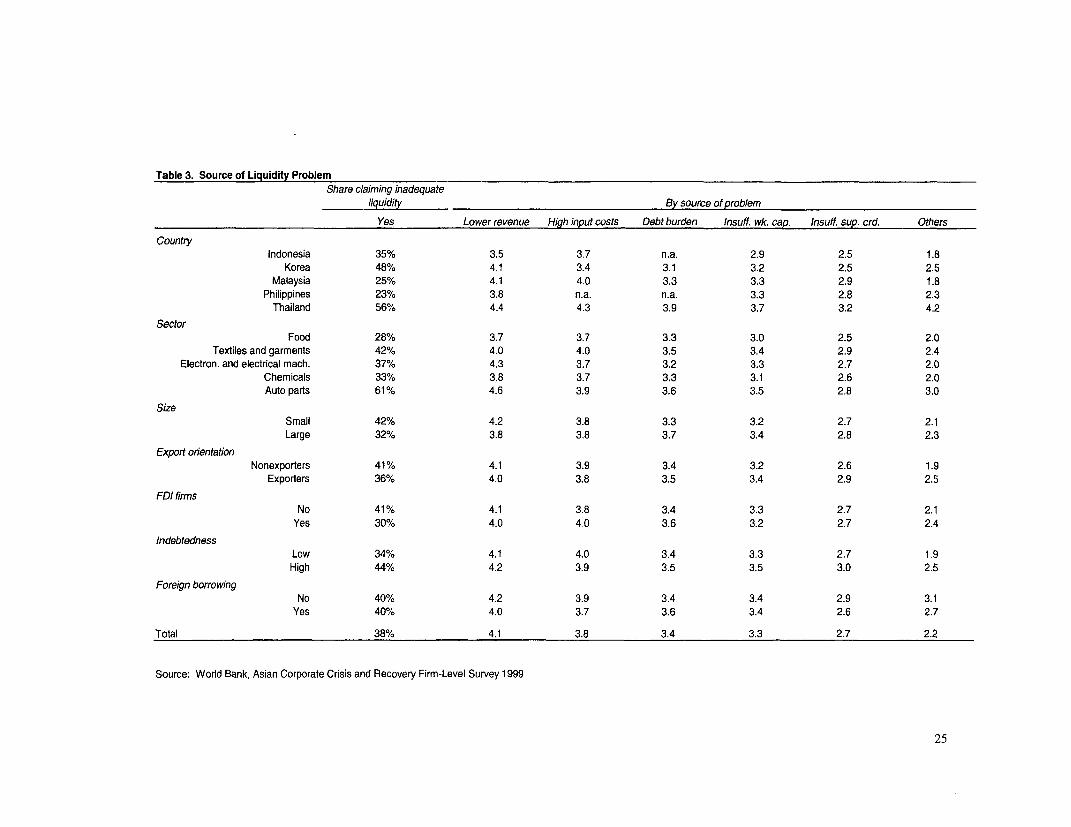
Table 3. Source of Liquidity ProblemShare claiming inadequate
liquidity By source of problem
Yes Lower revenue High input costs Debt burden Insuff. wk cap. Insuff. sup. crd. Others
CountryIndonesia 35% 3.5 3.7 n.a. 2.9 2.5 1.8
Korea 48% 4.1 3.4 3.1 3.2 2.5 2.5
Malaysia 25% 4.1 4.0 3.3 3.3 2.9 1.8
Philippines 23% 3.8 n.a. n.a. 3.3 2.8 2.3
Thailand 56% 4.4 4.3 3.9 3.7 3.2 4.2
SectorFood 28% 3.7 3.7 3.3 3.0 2.5 2.0
Textiles and garments 42% 4.0 4.0 3.5 3.4 2.9 2.4
Electron. and electrical mach. 37% 4.3 3.7 3.2 3.3 2.7 2.0
Chemicals 33% 3.8 3.7 3.3 3.1 2.6 2.0
Auto parts 61% 4.6 3.9 3.6 3.5 2.8 3.0
sizeSmall 42% 4.2 3.8 3.3 3.2 2.7 2.1
Large 32% 3.8 3.8 3.7 3.4 2.8 2.3
Export orientationNonexporters 41% 4.1 3.9 3.4 3.2 2.6 1.9
Exporters 36% 4.0 3.8 3.5 3.4 2.9 2.5
FDI firmsNo 41% 4.1 3.8 3.4 3.3 2.7 2.1
Yes 30% 4.0 4.0 3.6 3.2 2.7 2.4
IndebtednessLow 34% 4.1 4.0 3.4 3.3 2.7 1.9
High 44% 4.2 3.9 3.5 3.5 3.0 2.5
Foreign borrowingNo 40% 4.2 3.9 3.4 3.4 2.9 3.1
Yes 40% 4.0 3.7 3.6 3.4 2.6 2.7
Total 38% 4.1 3.8 3.4 3.3 2.7 2.2
Source: World Bank, Asian Corporate Crisis and Recovery Firm-Level Survey 1999
25

TABLE 4: FIRM-SPECIFIC PRICE DEFLATORS: SALES (1996==100)Food Textiles Garments Chemical Machinery Electronics Autoparts
Indonesia 1997 141 140 145 144 1421998 192 203 211 217 213
Korea 1997 109 107 109 103 1051998 116 122 115 107 112
Malaysia 1997 120 122 120 115 126 116 1101998 133 136 134 127 139 127 118
Philippines 1997 115 122 127 130 1291998 126 140 142 148 151
Thailand 1997 115 117 114 119 1141998 122 129 126 131 125
PRICE DEFLATORS: INPUT PRICES (1996=100)Food Textiles Garments Chemical Machinery Electronics Autoparts
Indonesia 1997 150 148 152 147 1461998 237 245 237 236 221
Korea 1997 108 110 110 107 1051998 121 128 124 117 115
Malaysia 1997 119 121 123 120 122 121 1131998 134 140 137 134 141 138 124
Philippines 1997 115 120 126 130 1301998 126 132 145 148 146
Thailand 1997 124 123 122 126 1251998 143 139 137 149 138
26

TABLE 5: CAPITAL PER WORKER, 1997
Indonesia Korea Malaysia Philippines ThailandFood 1.49 5.71 3.92 4.83Textile 2.11 11.85 8.28 3.04 4.86Garment 0.79 1.31 1.29 0.64Chemicals 2.58 18.83 12.34 4.91Machinery 10.15 5.88Electronics 2.61 12.08 7.96 3.22 4.49Autoparts 23.97 12.55 5.65
27

Table 6. Financial Structure by Firm Characteristics
Total equity/ Short-term debt/ Foreign debt/total financing total debt total debt
1996 1997 1998 1996 1997 1998 1996 1997 1998
CountryIndonesia 52.7% 53.7% 56.3% 55.4% 55.1% 56.2% 6.9% 6.0% 6.1%
Korea 35.3% 34.7% 41.9% 50.9% 51.9% 50.0% 36.9% 29.7% 29.2%Malaysia 44.6% 46.2% 45.5% 52.5% 53.1% 52.8% 8.5% 9.8% 10.0%
Philippines 37.6% 43.9% 44.3% 51.3% 55.8% 55.5% 8.7% 8.9% 8.8%
Thailand 47.1% 46.8% 51.1% 55.3% 57.6% 56.8% 10.7% 12.4% 13.2%
SectorFood 48.7% 50.5% 51.3% 53.6% 54.2% 53.9% 5.7% 5.6% 5.0%
Textiles and garments 43.1% 44.9% 48.9% 53.3% 55.6% 55.9% 14.2% 12.7% 13.2%
Electronics and electrical machinery 40.4% 41.7% 44.5% 53.8% 55.5% 54.9% 23.1% 21.9% 21.3%Chemicals 44.4% 45.9% 49.6% 51.4% 52.3% 49.9% 19.5% 17.7% 17.6%
Auto parts 42.0% 43.2% 46.6% 52.4% 53.3% 52.5% 26.4% 22.1% 23.5%
SizeSmall 46.6% 48.2% 51.6% 50.2% 51.4% 50.9% 11.6% 10.6% 10.7%Large 39.1% 40.4% 43.0% 56.3% 58.3% 57.9% 25.0% 22.5% 22.7%
Export orientationNonexporters 49.4% 51.1% 53.7% 50.2% 51.9% 51.8% 5.1% 5.6% 5.3%
Exporters 39.1% 40.3% 44.0% 54.7% 56.1% 55.1% 25.4% 22.4% 22.6%
FDI flrmsNo 43.8% 45.3% 48.5% 50.9% 52.4% 51.6% 14.1% 11.9% 12.0%
Yes 42.8% 44.4% 47.3% 59.0% 60.7% 60.4% 27.4% 27.8% 27.8%
Total 43.6% 45.1% 48.3% 53.0% 54.5% 53.8% 17.4% 15.8% 15.9%
Source: World Bank, Asian Corporate Crisis and Recovery Firm-Level Survey 1999

Figure 1: Time to Clear Goods Through Customs
12 - 7
10 -__
8 - - -
co68-t 6 ---
0
4 -
2 -
Indonesia Korea Malaysia Philippines Thailand
29

FIGURE 2: VINTAGE OF CAPITAL STOCKS
Non - Exporters40 -
30 -* <4 years
20 E~~~~~~~~~~~~~~~~~~-11114 -6 years107 - 10 years
1 0 -0~ _ | T T _ | _ | lO>p10 yeam
10
Indonesia Korea Malaysia Philippines Thailand
Exporters40-
30 _-_ -I_ _ <4 years
20 -P- _ . -q _ _ * 4 - 6 years10 7-10 years
10 ~~~~~~~~~~~~~~0> 10 years
10
Indonesia Korea Malaysia Philippines Thailand
30

Figure 3. Sources of Working Capital, 1998
Indonesia: Small Indonesia: Large
35% 35%41%
24% 31%
Korea: Small Korea: Large11%/ 19%
f j j a 4 5 %~~~~~~~~~~5
53%
36%3 6 %
Malaysia: Small Malaysia: Large10%1%
21%
50%0/
69% 31%
Philippines: Small Philippines: Large
13% -_14%
4%51%28%9
5 9 %~~~935%
Thailand: Small Thailand: Large
27% 25%
37%
36% 47%
| Retained earnings * Loans O Otherl
Source: World Bank, Asian Corporate Crisis and Recovery Firm-Level Survey 1999
31

Figure 4: Share of Firms with Formal Training Programs
60-
50-z
40. m30-
20-z
Indonesia Korea Malaysia Philippines Thailand
IN Non-Exporter U Exporter|

Figure 5. Foreign Debt as a Share of Total Debt
25-
* Long-term
20- -___ ___________-----~---- U Short-term
~15 -
P6 10-
5-
0 96 97 98 96 97 98 96 97 98 96 97 98 96 97 98
Indonesia Korea Malaysia Philippines Thailand

Policy Research Working Paper Series
ContactTitle Author Date for paper
WPS2493 Annuity Markets in Comparative Estelle James November 2000 A. YaptencoPerspective: Do Consumers Get Dimitri Vittas 31823Their Money's Worth?
WPS2494 The Relevance of Index Funds for Ajay Shah November 2000 A. YaptencoPension Investment in Equities Kshama Fernandes 311323
WPS2495 The Australian Annuity Market David M. Knox November 2000 A. Yaptenco311323
WPS2496 Perspectives on the Sources of Somik V. Lall November 2000 R. YazigiHeterogeneity in Indian Industry G. Chris Rodrigo 37176
WPS2497 State Policies and Women's Monica Das Gupta November 2000 M. Das GuptaAutonomy in China, India, and the Sunhwa Lee 31983Republic of Korea, 1950-2000: Patricia UberoiLessons from Contrasting Danning WangExperiences Lihong Wang
Xiaodan Zhang
WPS2498 Sustaining Economic Welfare: Kirk Hamilton November 2000 L. RiveraEstimating Changes in Per Capita 82819Wealth
WPS2499 The Treatment of Non-Essential Isidro Soloaga December 2000 L. TabadaInputs in a Cobb-Douglas Technology: 36896An Application to Mexican RuralHousehold-Level Data
WPS2500 Investigating Corruption Canice Prendergast December 2000 H. Sladovich37698
WPS2501 Anti-Corruption Policies and Jeff Huther December 2000 A. SantosPrograms: A Framework for Anwar Shah 31675Evaluation
WPS2502 Implications of the Currency Crisis Masahiro Kawai December 2000 A. Azarconfor Exchange Rate Arrangements Shigeru Akiyama 36049in Emerging East Asia
WPS2503 Proposed Strategy for a Regional Masahiro Kawai December 2000 A. Azarcor.Exchange Rate Arrangement in Shinji Takagi 36049Post-Crisis East Asia
WPS2504 Social Capital and the Quality of Stephen Knack December 2000 P. Sintim-Aboag;:EGovernment: Evidence from the 38526United States

Policy Research Working Paper Series
ContactTitle Author Date for paper
WPS2505 Family Altruism and Incentives Roberta Gatti December 2000 R. Bonfield31248
WPS2506 Ethnicity and Wage Determination Abigail Barr December 2000 R. Bonfieldin Ghana Abena Oduro 31248
WPS2507 Public Expenditures and Gunnar S. Eskeland December 2000 H. SladovichEnvironmental Protection: When Is 37698the Cost of Funds Irrelevant?
WPS2508 Sources of Financial Assistance for Mattias Lundberg December 2000 V. SoukhanovHouseholds Suffering an Adult Mead Over 35271Death in Kagera, Tanzania Phare Mujinja
WPS2509 How Tax Policy and Incentives Jacques Morisset December 2000 N. BusjeetAffect Foreign Direct Investment: Neda Pirnia 33997A Review
WPS2510 Environmental Protection and Gunnar S. Eskeland December 2000 H. SladovichOptimal Taxation 37698
WPS2511 Monetary Policy under Flexible Pierre-Richard Ag6nor December 2000 M. GosiengfiaoExchange Rates: An Introduction to 33363Inflation Targeting
WPS2512 Quantifying the Impact of Technical Keith E. Maskus December 2000 L. TabadaBarriers to Trade: A Framework for John S. Wilson 36896Analysis Tsunehiro Otsuki
WPS2513 Do State Holding Companies Facilitate Michel Kerf December 2000 M. LeonPrivate Participation in the Water Sector? 36151Evidence from Cote d'lvoire, the Gambia,Guinea, and Senegal
WPS2514 Intersectoral Dynamics and Economic Norbert M. Fiess January 2001 A. PillayGrowth in Ecuador Dorte Verner 88046
I,