Embed Size (px)
Citation preview

Schedule 1
1
Number of APs 5 Population : 561963
Number of GPs 65 Area: 1561.80 Sq.Km
Number of MBs 1 Population : 75000
Number of TCs 1 Area: 9.09 Sq.Km
2
3
Enclosed : Annexure I & II
4
Enclosed : Annexure I & II
5
(Rs. In crores)
Assignment of
taxes
Devolution of tax
revenueGrants-in-aid Others (specify)
2 nd SFC NIL
PRIs 10.0533
ULBs 0.6511 0.5936
3rd SFC NIL
PRIs2007-08 8.7858 0.91302008-09 21.3049 9.8373 4.09702009-10 22.5403 3.2802 4.42472010-11 23.7889 3.2802 4.7787ULBs2007-08 2.4782 0.44932008-09 6.0094 0.49452009-10 6.3579 0.51452010-11 6.7101 0.0596
Transfer of resources to PRIs/ULBs set out by the State Finance Commission
Average population covered by PRIs and ULBs at each level as on 1.4.2001
(as per Census 2001). Please append in an extra sheets (in excel sheet) population figures of all PRIs and ULBs
from which the average is obtained.
Average area covered by PRIs and ULBs at each level as on 1.4.2001
(as per Census 2001). Please append in an extra sheets (in excel sheet) area figures of all PRIs and ULBs from
which the average is obtained.
THIRTEENTH FINANCE COMMISSION
NAME OF THE DISTRICT BANGAIGOAN, ASSAM
INFORMATION ON LOCAL BODIES
Number of Local Bodies at each tier of Panchayati Raj Institutions (PRIs) and each level of Urban Local Bodies
(ULBs) in the States (as on 1.4.2008)
Date of Last PRI Election; Last ULB Election
89 S1

Schedule -2A
Recommended
by SFC*
Actual
transfers
Recommended
by SFC*
Actual
transfers**
Recommended
by SFC*
Actual
transfers
Recommended
by SFC*
Actual
transfers
2002-03 NIL NIL 0.2081 NIL NIL NIL 0.2080 NIL
2003-04 NIL NIL 0.2344 NIL NIL NIL 0.2344 NIL
2004-05 NIL NIL 0.2642 NIL NIL NIL 0.2641 NIL
2005-06 NIL NIL 0.2985 NIL NIL NIL 0.2985 NIL
2006-07
2007-08 1.7572 0.9130
2008-09 9.8373 4.2610 4.0970
2009-10 3.2802 4.5081 4.4247
2010-11 3.2802 4.7578 4.7787
2011-12
2012-13
2013-14
2014-15
* If SFC not constituted or where the first SFC has been consititued and its award is yet to be made or yet to be implemented, leave this column blank.
** Actual transfer against devolution has been shown as nil because the entire salary expenditure of provincialised Panchayat staff has been met out of the
Consolidated Fund of the State.
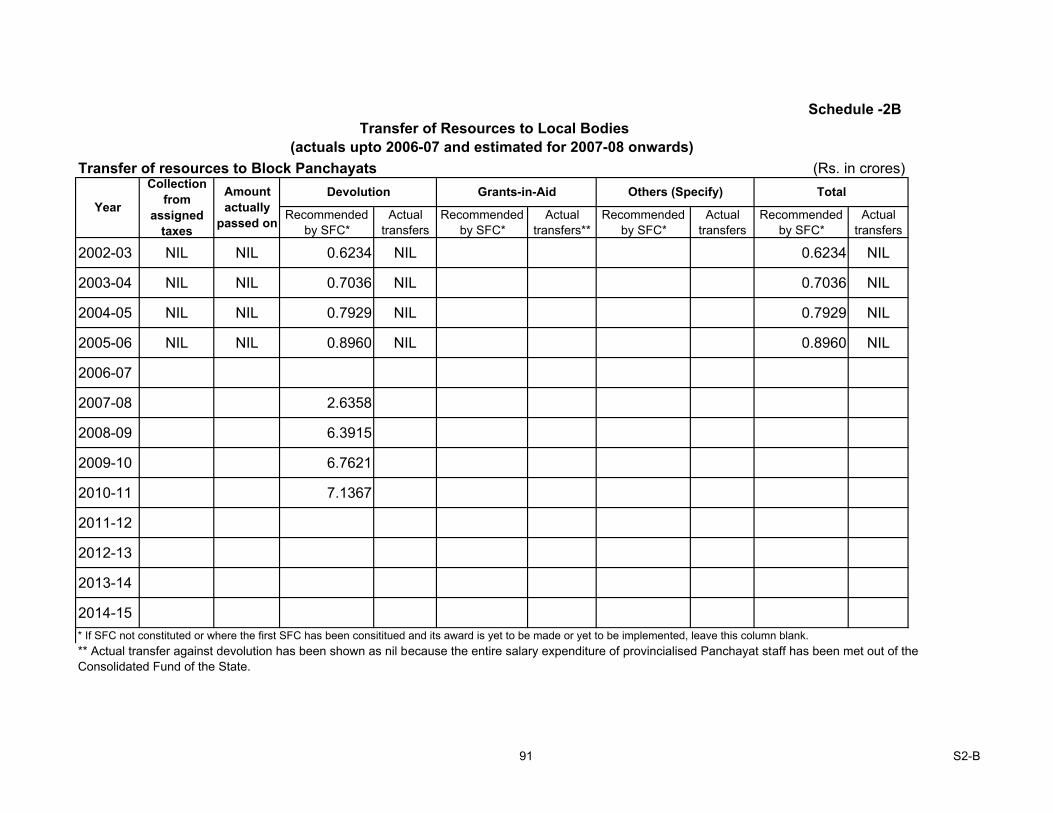
Transfer of Resources to Local Bodies
(actuals upto 2006-07 and estimated for 2007-08 onwards)
Grants-in-Aid Others (Specify) Total
Year
Collection
from
assigned
taxes
Amount
actually
passed on
Devolution
(Rs. in crores)Transfer of resources to District Panchayats
90 S2-A
Recommended
by SFC*
Actual
transfers
Recommended
by SFC*
Actual
transfers**
Recommended
by SFC*
Actual
transfers
Recommended
by SFC*
Actual
transfers
2002-03 NIL NIL 0.6234 NIL 0.6234 NIL
2003-04 NIL NIL 0.7036 NIL 0.7036 NIL
2004-05 NIL NIL 0.7929 NIL 0.7929 NIL
2005-06 NIL NIL 0.8960 NIL 0.8960 NIL
2006-07
2007-08 2.6358
2008-09 6.3915
2009-10 6.7621
2010-11 7.1367
2011-12
2012-13
2013-14
2014-15
* If SFC not constituted or where the first SFC has been consititued and its award is yet to be made or yet to be implemented, leave this column blank.
** Actual transfer against devolution has been shown as nil because the entire salary expenditure of provincialised Panchayat staff has been met out of the
Consolidated Fund of the State.
Grants-in-Aid Others (Specify) Total
Year
Collection
from
assigned
taxes
Amount
actually
passed on
Devolution
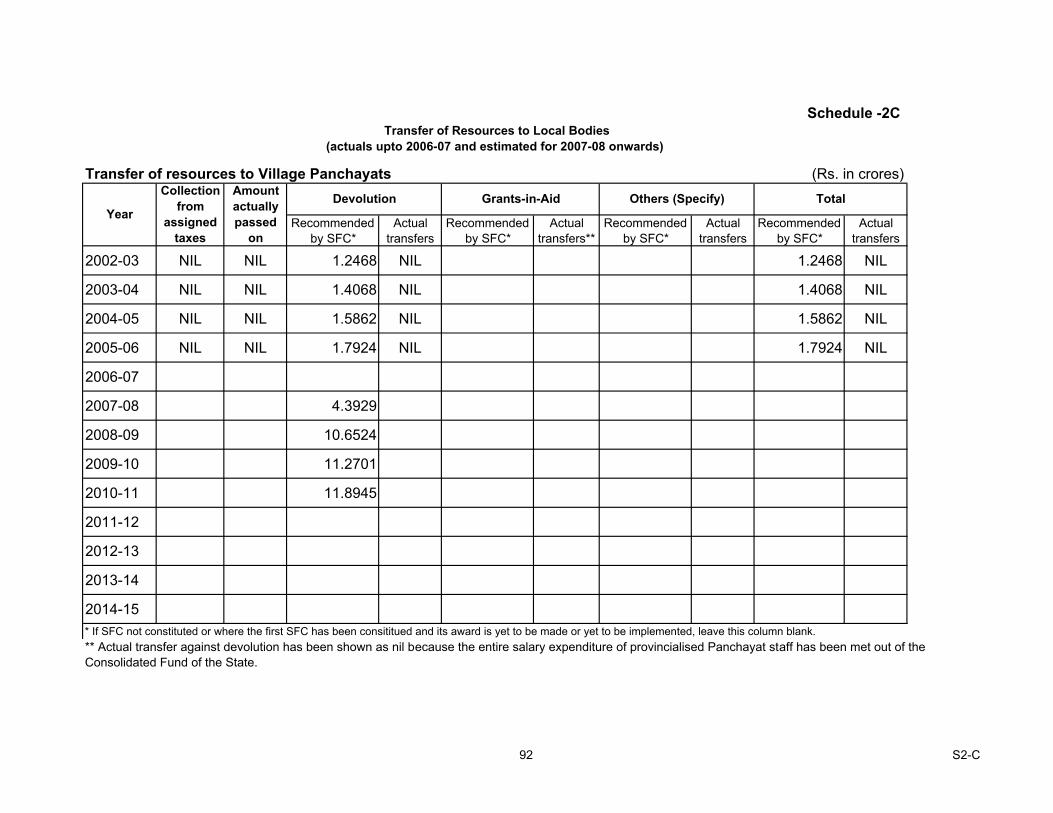
Transfer of Resources to Local Bodies
(actuals upto 2006-07 and estimated for 2007-08 onwards)
Schedule -2B
(Rs. in crores)Transfer of resources to Block Panchayats
91 S2-B
Recommended
by SFC*
Actual
transfers
Recommended
by SFC*
Actual
transfers**
Recommended
by SFC*
Actual
transfers
Recommended
by SFC*
Actual
transfers
2002-03 NIL NIL 1.2468 NIL 1.2468 NIL
2003-04 NIL NIL 1.4068 NIL 1.4068 NIL
2004-05 NIL NIL 1.5862 NIL 1.5862 NIL
2005-06 NIL NIL 1.7924 NIL 1.7924 NIL
2006-07
2007-08 4.3929
2008-09 10.6524
2009-10 11.2701
2010-11 11.8945
2011-12
2012-13
2013-14
2014-15
* If SFC not constituted or where the first SFC has been consititued and its award is yet to be made or yet to be implemented, leave this column blank.
** Actual transfer against devolution has been shown as nil because the entire salary expenditure of provincialised Panchayat staff has been met out of the
Consolidated Fund of the State.
Year
Others (Specify) TotalCollection
from
assigned
taxes
Amount
actually
passed
on
Devolution Grants-in-Aid
Transfer of Resources to Local Bodies
(actuals upto 2006-07 and estimated for 2007-08 onwards)
Schedule -2C
Transfer of resources to Village Panchayats (Rs. in crores)
92 S2-C
Recommended
by SFC*
Actual
transfers
Recommended
by SFC*
Actual
transfers
Recommended
by SFC*
Actual
transfers
Recommended
by SFC*
Actual
transfers
2002-03
2003-04
2004-05
2005-06
2006-07
2007-08
2008-09
2009-10
2010-11
2011-12
2012-13
2013-14
2014-15
* If SFC not constituted or where the first SFC has been consititued and its award is yet to be made or yet to be implemented, leave this column blank.
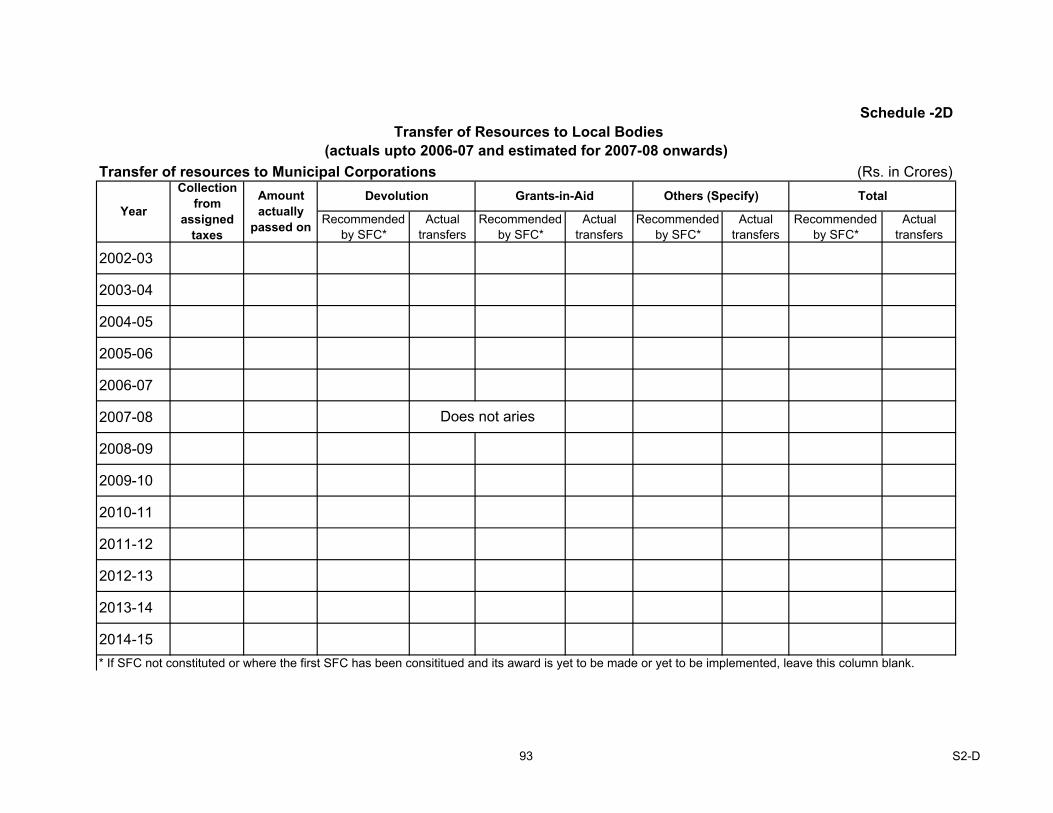
Schedule -2D
(Rs. in Crores)Transfer of resources to Municipal Corporations
Grants-in-Aid Others (Specify) Total
Year
Collection
from
assigned
taxes
Amount
actually
passed on
Devolution
Does not aries
Transfer of Resources to Local Bodies
(actuals upto 2006-07 and estimated for 2007-08 onwards)
93 S2-D

Recommended
by SFC*
Actual
transfers
Recommended
by SFC*
Actual
transfers
Recommended
by SFC*
Actual
transfers
Recommended
by SFC*
Actual
transfers
2002-03 0.1014 NIL 0.1117 0.2131 NIL
2003-04 0.1143 0.0592 0.1117 0.226 0.0592
2004-05 0.1289 0.0500 0.1117 0.2406 0.0500
2005-06 0.1456 0.0500 0.1117 0.2573 0.0500
2006-07 0.0700 0.0700
2007-08 1.6191 0.1988
2008-09 3.9262 0.4852
2009-10 4.1539 0.0493
2010-11 4.3840 0.0498
2011-12
2012-13
2013-14
2014-15
* If SFC not constituted or where the first SFC has been consititued and its award is yet to be made or yet to be implemented, leave this column blank.
Schedule -2E
Transfer of resources to Municipalities ( Bongaigoan MB) (Rs. in Crores)
Grants-in-Aid Others (Specify) Total
Year
Collection
from
assigned
taxes
Amount
actually
passed on
Devolution
Note:- The figure shown against the column actual transfer under devolution is not based on the recommendations of SFC. As per government decision only
the proceeds of M.V. Tax were shared with MBs & TCs.
Transfer of Resources to Local Bodies
(actuals upto 2006-07 and estimated for 2007-08 onwards)
94 S2-E
Recommended
by SFC*
Actual
transfers
Recommended
by SFC*
Actual
transfers
Recommended
by SFC*
Actual
transfers
Recommended
by SFC*
Actual
transfers
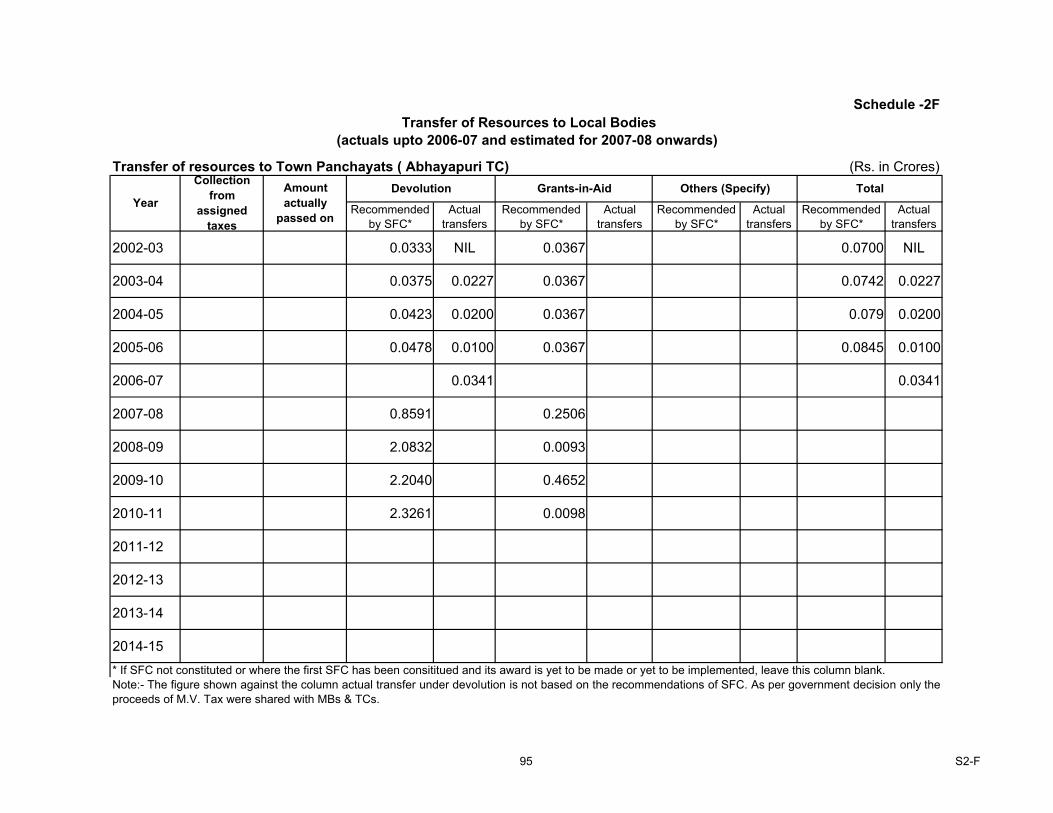
2002-03 0.0333 NIL 0.0367 0.0700 NIL
2003-04 0.0375 0.0227 0.0367 0.0742 0.0227
2004-05 0.0423 0.0200 0.0367 0.079 0.0200
2005-06 0.0478 0.0100 0.0367 0.0845 0.0100
2006-07 0.0341 0.0341
2007-08 0.8591 0.2506
2008-09 2.0832 0.0093
2009-10 2.2040 0.4652
2010-11 2.3261 0.0098
2011-12
2012-13
2013-14
2014-15
* If SFC not constituted or where the first SFC has been consititued and its award is yet to be made or yet to be implemented, leave this column blank.
Schedule -2F
Transfer of resources to Town Panchayats ( Abhayapuri TC) (Rs. in Crores)
Year
Collection
from
assigned
taxes
Amount
actually
passed on
Devolution
Transfer of Resources to Local Bodies
(actuals upto 2006-07 and estimated for 2007-08 onwards)
Note:- The figure shown against the column actual transfer under devolution is not based on the recommendations of SFC. As per government decision only the
proceeds of M.V. Tax were shared with MBs & TCs.
Grants-in-Aid Others (Specify) Total
95 S2-F

Budget Head/s
(Sub Head/s)
Amount (Rs. In
thousand)
1 2 3 4 5 6
As per activity
Mapping issued vide
Notification No PDA
336/2001/Pt III/32
dated 25.06.2007.
Under process NIL
Schedule – 3A
Functions / Services transferred to PRIs and Expenditure thereon.
Revenue Expenditure on the function/service
in the year preceding the year of transferAverage rate of growth
of revenue expenditure
in the preceding 5
years before transfer
Date of transferInstitution to which
transferred
Name of function /
service
96 S3-A
Budget Head/s
(Sub Head/s)
Amount (Rs. In
thousand)
1 2 3 4 5 6
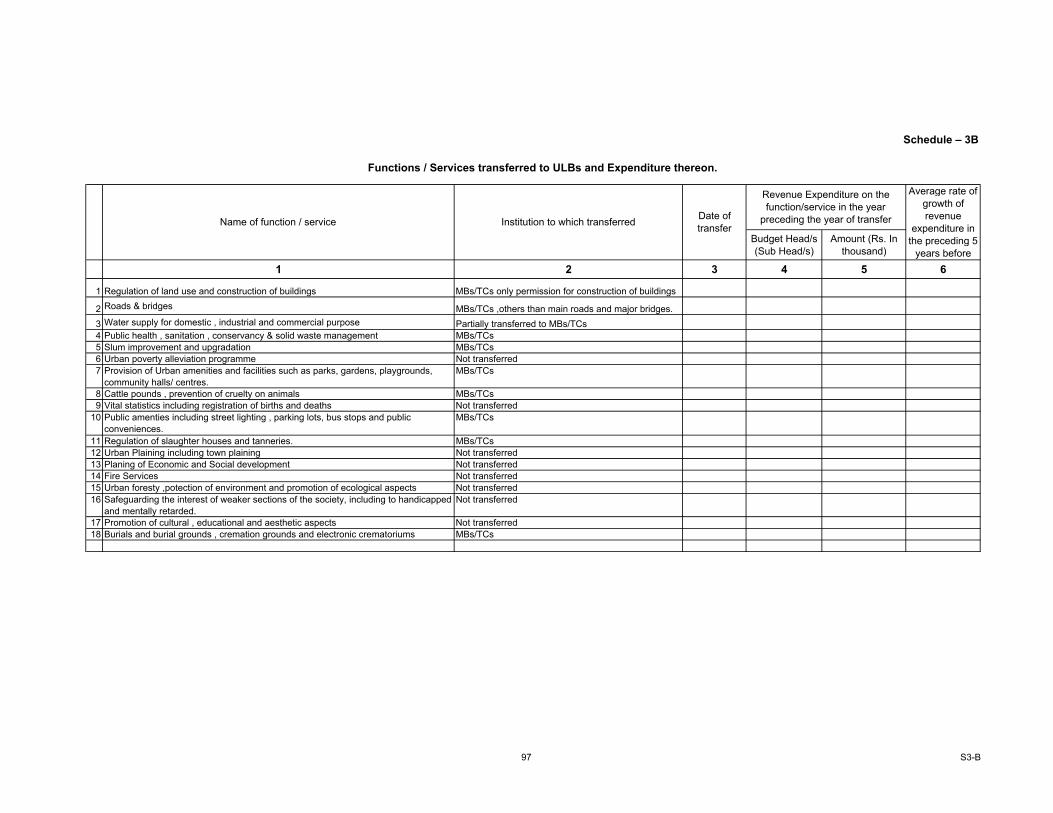
1 Regulation of land use and construction of buildings MBs/TCs only permission for construction of buildings
2 Roads & bridges MBs/TCs ,others than main roads and major bridges.
3 Water supply for domestic , industrial and commercial purpose Partially transferred to MBs/TCs
4 Public health , sanitation , conservancy & solid waste management MBs/TCs
5 Slum improvement and upgradation MBs/TCs
6 Urban poverty alleviation programme Not transferred
7 Provision of Urban amenities and facilities such as parks, gardens, playgrounds,
community halls/ centres.
MBs/TCs
8 Cattle pounds , prevention of cruelty on animals MBs/TCs
9 Vital statistics including registration of births and deaths Not transferred
10 Public amenties including street lighting , parking lots, bus stops and public
conveniences.
MBs/TCs
11 Regulation of slaughter houses and tanneries. MBs/TCs
12 Urban Plaining including town plaining Not transferred
13 Planing of Economic and Social development Not transferred
14 Fire Services Not transferred
15 Urban foresty ,potection of environment and promotion of ecological aspects Not transferred
16 Safeguarding the interest of weaker sections of the society, including to handicapped
and mentally retarded.
Not transferred
17 Promotion of cultural , educational and aesthetic aspects Not transferred
18 Burials and burial grounds , cremation grounds and electronic crematoriums MBs/TCs
Schedule – 3B
Functions / Services transferred to ULBs and Expenditure thereon.
Revenue Expenditure on the
function/service in the year
preceding the year of transfer
Average rate of
growth of
revenue
expenditure in
the preceding 5
years before
Date of
transferInstitution to which transferredName of function / service
97 S3-B
Tax
Non Tax
(Incl. user
charges)
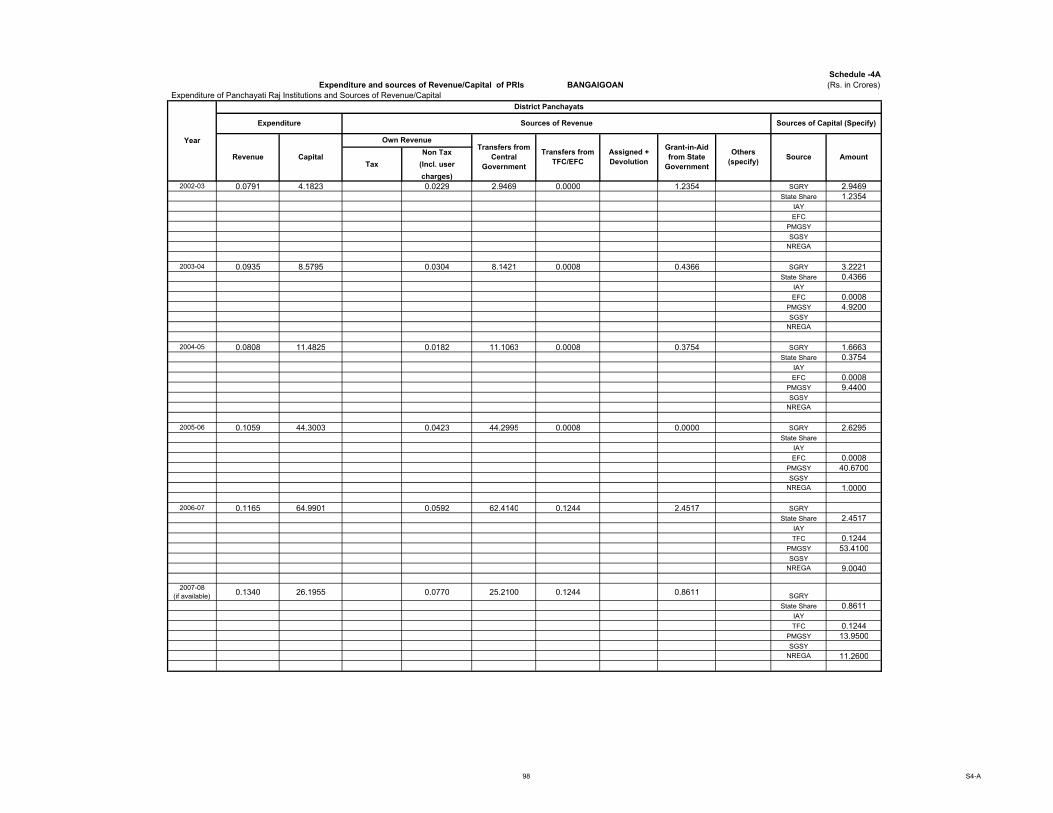
2002-03 0.0791 4.1823 0.0229 2.9469 0.0000 1.2354 SGRY 2.9469
State Share 1.2354
IAY
EFC
PMGSY
SGSY
NREGA
2003-04 0.0935 8.5795 0.0304 8.1421 0.0008 0.4366 SGRY 3.2221
State Share 0.4366
IAY
EFC 0.0008
PMGSY 4.9200
SGSY
NREGA
2004-05 0.0808 11.4825 0.0182 11.1063 0.0008 0.3754 SGRY 1.6663
State Share 0.3754
IAY
EFC 0.0008
PMGSY 9.4400
SGSY
NREGA
2005-06 0.1059 44.3003 0.0423 44.2995 0.0008 0.0000 SGRY 2.6295
State Share
IAY
EFC 0.0008
PMGSY 40.6700
SGSY
NREGA 1.0000
2006-07 0.1165 64.9901 0.0592 62.4140 0.1244 2.4517 SGRY
State Share 2.4517
IAY
TFC 0.1244
PMGSY 53.4100
SGSY
NREGA 9.0040
2007-08
(if available)0.1340 26.1955 0.0770 25.2100 0.1244 0.8611
SGRY
State Share 0.8611
IAY
TFC 0.1244
PMGSY 13.9500
SGSY
NREGA 11.2600
Revenue CapitalTransfers from
TFC/EFC
Others
(specify)Source Amount
Grant-in-Aid
from State
Government
Assigned +
Devolution
Year Own Revenue
District Panchayats
Expenditure Sources of Revenue Sources of Capital (Specify)
Transfers from
Central
Government
Schedule -4A
Expenditure and sources of Revenue/Capital of PRIs BANGAIGOAN
Expenditure of Panchayati Raj Institutions and Sources of Revenue/Capital
(Rs. in Crores)
98 S4-A

Tax
Non Tax
(Incl. user
charges)
2002-03 0.2161 7.7684 0.0015 0.1755 5.5192 0.0000 2.2492 SGRY 4.4203
State Share 2.2492
IWDP 0.4505
EFC
SGSY 0.6484
HARIYALI
NREGA
2003-04 0.2786 7.7521 0.0004 0.1811 6.8752 0.0072 0.8696 SGRY 4.8331
State Share 0.8696
IWDP
EFC 0.0072
SGSY 1.5471
HARIYALI 0.4950
NREGA
2004-05 0.2552 12.3176 0.0006 0.1740 9.9798 0.0074 2.3304 SGRY 6.6653
State Share 2.3304
IWDP
EFC 0.0074
SGSY 2.0770
HARIYALI 1.2375
NREGA
2005-06 0.4788 16.5335 0.0003 0.1810 15.8869 0.0036 0.6430 SGRY 10.5179
State Share 0.6430
IWDP
EFC 0.0036
SGSY 2.8814
HARIYALI 0.9876
NREGA 1.5000
2006-07 0.5602 21.4258 0.0004 0.2534 16.2955 0.3730 4.7573 SGRY
State Share 4.7573
IWDP
TFC 0.3730
SGSY 1.4695
HARIYALI 1.3200
NREGA 13.5060
2007-08
(if available)0.6554 22.2692 0.0005 0.3294 20.5780 0.3730 1.3182 SGRY
State Share 1.3182
IWDP 0.4125
TFC 0.3730
SGSY 2.4852
HARIYALI 0.8003
NREGA 16.8800
Year
Block Panchayats
Expenditure Sources of Revenue Sources of Capital (Specify)
Revenue Capital
Own RevenueTransfers from
Central
Government
SourceOthers
(specify)Amount
Transfers from
TFC/EFC
Assigned +
Devolution
Grant-in-Aid
from State
Government
99 S4-A
Tax
Non Tax
(Incl. user
charges)
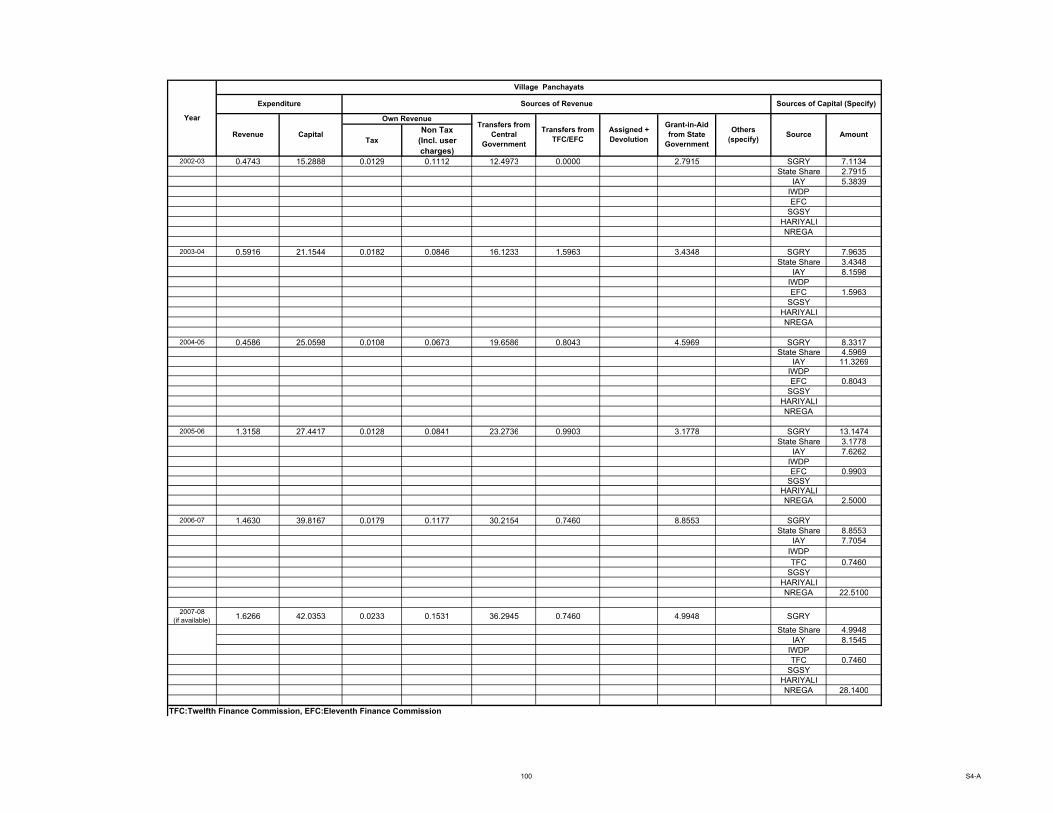
2002-03 0.4743 15.2888 0.0129 0.1112 12.4973 0.0000 2.7915 SGRY 7.1134
State Share 2.7915
IAY 5.3839
IWDP
EFC
SGSY
HARIYALI
NREGA
2003-04 0.5916 21.1544 0.0182 0.0846 16.1233 1.5963 3.4348 SGRY 7.9635
State Share 3.4348
IAY 8.1598
IWDP
EFC 1.5963
SGSY
HARIYALI
NREGA
2004-05 0.4586 25.0598 0.0108 0.0673 19.6586 0.8043 4.5969 SGRY 8.3317
State Share 4.5969
IAY 11.3269
IWDP
EFC 0.8043
SGSY
HARIYALI
NREGA
2005-06 1.3158 27.4417 0.0128 0.0841 23.2736 0.9903 3.1778 SGRY 13.1474
State Share 3.1778
IAY 7.6262
IWDP
EFC 0.9903
SGSY
HARIYALI
NREGA 2.5000
2006-07 1.4630 39.8167 0.0179 0.1177 30.2154 0.7460 8.8553 SGRY
State Share 8.8553
IAY 7.7054
IWDP
TFC 0.7460
SGSY
HARIYALI
NREGA 22.5100
2007-08
(if available)1.6266 42.0353 0.0233 0.1531 36.2945 0.7460 4.9948 SGRY
State Share 4.9948
IAY 8.1545
IWDP
TFC 0.7460
SGSY
HARIYALI
NREGA 28.1400
TFC:Twelfth Finance Commission, EFC:Eleventh Finance Commission
Source Amount
Own RevenueYear
Village Panchayats
Expenditure Sources of Revenue Sources of Capital (Specify)
Assigned +
Devolution
Transfers from
TFC/EFC
Transfers from
Central
Government
Grant-in-Aid
from State
Government
Others
(specify)Revenue Capital
100 S4-A

(Rs. In Crore)
Name of the District Panchayat 5 65
Total Area of District Panchayat 1561.80 Sq.km 1561.80 Sq.km
Total Population of District Panchayat 561963 561963
S.N. Items 2004-05 2005-06 2006-07 2007-08 2004-05 2005-06 2006-07 2007-08 2004-05 2005-06 2006-07 2007-08
I Expenditure
A Revenue 0.0808 0.1059 0.1165 0.1340 0.2552 0.4788 0.5602 0.6554 0.4586 1.3158 1.4630 1.6266
B Capital 11.4825 44.3003 64.9901 26.1955 12.3176 16.5335 21.4258 22.2692 25.0598 27.4417 39.8167 42.0353
II Sources of Revenue
A Own Revenue
i. Own tax 0.0006 0.0003 0.0004 0.0005 0.0108 0.0128 0.0179 0.0233
ii. Own non-tax 0.0182 0.0423 0.0592 0.0770 0.1740 0.1810 0.2534 0.3294 0.0673 0.0841 0.1177 0.1531
B Transfers from Central Government #
I SGRY 1.6663 2.6295 6.6653 10.5179 8.3317 13.1474
ii SGSY 2.0770 2.8814 1.4695 2.4852
iii PMGSY 9.4400 40.6700 53.4100 13.9500
iv NREGA 1.0000 9.0040 11.2600 1.5000 13.5060 16.8800 2.5000 22.5100 28.1400
v BRGF
vi Hariyali 1.2375 0.9876 1.3200 0.8003
vii IAY 11.3269 7.6262 7.7054 8.1545
viii IWDP 0.4125
C. Transfers from TFC/EFC 0.0008 0.0008 0.1244 0.1244 0.0074 0.0036 0.3730 0.3730 0.8043 0.9903 0.7460 0.7460
D. Assigned + Devolution
E. Grant-in-Aid from State Government 0.3754 2.4517 0.8611 2.3304 0.6430 4.7573 1.3182 4.5969 3.1778 8.8553 4.9948
F. Others (specify)
# : Provide information on each of the CSS like SGRY, NREGS, IAY, PMGSY etc from which money is received in the space provided below. Insert additional rows if needed.
TFC:Twelfth Finance Commission, EFC:Eleventh Finance Commission
Separate format to be filled for each district.
Expenditure and Sources of Revenue of PRIs - District-wise BANGAIGOAN
Year Year
(detail information on each of the CSS to be given
below)
Expenditure and source of Revenue of Panchayati Raj Institutions(Information to be provided District-wise)
Block Panchayats
Year
Schedule - 4B
No. of Village panchayats:
Total area of village panchayats:
Total population of village panchayats:
Village Panchayats
(aggregate information of all block panchayats in a district to be provided ) (aggregate information of all block panchayats in a district to be provided )
BONGAIGOAN
1561.80 Sq Km
561963 Total population of block panchayats:
District Panchayat
No. of Block panchayats:
Total area of block panchayats:
101 S4-B

Tax
Non Tax
(Incl. user
charges)2002-03
2003-04
2004-05
2005-06
2006-07
2007-08
(if available)
TaxNon Tax (Incl.
user charges)
2002-03 0.3927 0.0000 0.0936 0.2793 0.0000 0.0000 0.0000 0.0000 SJSRY
State Share
NSDP
MV
EFC
IDSMT
UIDSSMT
IHSDP
2003-04 0.4848 0.4340 0.1101 0.3286 0.2345 0.0903 0.0592 0.0500 SJSRY 0.2220
State Share 0.0500
NSDP
MV 0.0592
EFC 0.0903
IDSMT 0.0125
UIDSSMT
IHSDP
2004-05 0.5704 0.2341 0.1237 0.3692 0.0266 0.0600 0.0500 0.0975 SJSRY 0.0266
State Share 0.0975
NSDP
MV 0.0500
EFC 0.0600
IDSMT
UIDSSMT
IHSDP
Revenue
Year
Municipalities : Bongaigoan, MB
Expenditure Sources of Revenue Sources of Capital (Specify)
Transfers from
Central
Government
Amount Capital
Own Revenue
Assigned +
DevolutionSource
Source
Transfers from
TFC/EFC
Grant-in-Aid
from State
Government
Others
(specify)
Transfers from
Central
Government
Year
Municipal Corporations
Expenditure Sources of Revenue Sources of Capital (Specify)
Revenue CapitalAssigned +
DevolutionAmount
Own RevenueGrant-in-Aid
from State
Government
Others
(specify)
Transfers from
TFC/EFC
Schedule -4C
Expenditure and sources of Revenue/Capital of Urban Local Bodies
Expenditure of Urban Local Bodies and Sources of Revenue/Capital
(Rs. in Crores)
102 S4-C
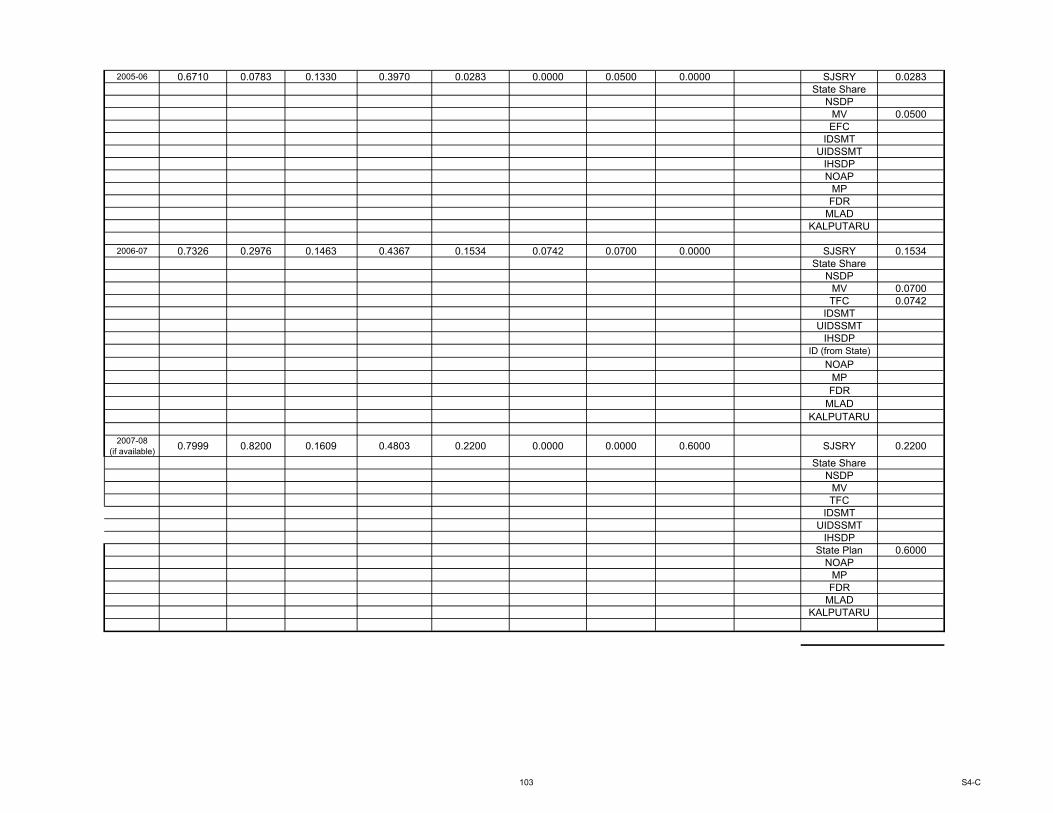
2005-06 0.6710 0.0783 0.1330 0.3970 0.0283 0.0000 0.0500 0.0000 SJSRY 0.0283
State Share
NSDP
MV 0.0500
EFC
IDSMT
UIDSSMT
IHSDP
NOAP
MP
FDR
MLAD
KALPUTARU
2006-07 0.7326 0.2976 0.1463 0.4367 0.1534 0.0742 0.0700 0.0000 SJSRY 0.1534
State Share
NSDP
MV 0.0700
TFC 0.0742
IDSMT
UIDSSMT
IHSDP
ID (from State)
NOAP
MP
FDR
MLAD
KALPUTARU
2007-08
(if available)0.7999 0.8200 0.1609 0.4803 0.2200 0.0000 0.0000 0.6000 SJSRY 0.2200
State Share
NSDP
MV
TFC
IDSMT
UIDSSMT
IHSDP
State Plan 0.6000
NOAP
MP
FDR
MLAD
KALPUTARU
103 S4-C

TaxNon Tax (Incl.
user charges)
2002-03 0.1091 0.0000 0.1000 0.0153 0.0000 0.0000 0.0000 0.0000 SJSRY
State Share
NSDP
MV
EFC
IDSMT
UIDSSMT
IHSDP
2003-04 0.1347 0.3442 0.1176 0.0180 0.3017 0.0198 0.0227 0.0000 SJSRY 0.0617
State Share
NSDP
MV 0.0227
EFC 0.0198
IDSMT 0.2400
UIDSSMT
IHSDP
2004-05 0.1585 0.0857 0.1322 0.0202 0.0057 0.0600 0.0200 0.0000 SJSRY 0.0057
State Share
NSDP
MV 0.0200
EFC 0.0600
IDSMT
UIDSSMT
IHSDP
2005-06 0.1865 0.3556 0.1421 0.0217 0.2468 0.0288 0.0100 0.0700 SJSRY 0.0068
State Share 0.0700
NSDP
MV 0.0100
EFC 0.0288
IDSMT 0.2400
UIDSSMT
IHSDP
Loan (State)
NOAP
MP
FDR
MLAD
KALPUTARU
Transfers from
TFC/EFC
Transfers from
Central
Government
Assigned +
DevolutionCapital
Own Revenue
Revenue
Expenditure
Grant-in-Aid
from State
Government
Sources of Capital (Specify)Sources of Revenue
Others
(specify)
Year
Nagar Panchayats Abhayapuri ,TC
Source Amount
104 S4-C

2006-07 0.2018 0.2939 0.1563 0.0238 0.0636 0.0362 0.0341 0.1600 SJSRY 0.0636
State Share 0.1600
NSDP
MV 0.0341
TFC 0.0362
IDSMT
UIDSSMT
IHSDP
ID (from State)
NOAP
MP
FDR
MLAD
KALPUTARU
2007-08
(if available)0.2184 0.5700 0.1719 0.0262 0.1200 0.0000 0.0000 0.4500 SJSRY 0.1200
State Share 0.0500
NSDP
MV
TFC
IDSMT
UIDSSMT
IHSDP
State Plan 0.4000
NOAP
MP
FDR
MLAD
KALPUTARU
TFC:Twelfth Finance Commission, EFC:Eleventh Finance Commission
UIDSSMT: Urban Infrastructure Development Scheme for Small and Medium Towns
IDSMT: Integrated Development of Small and Medium Towns
IHSDP : Integrated Housing and Slum Development Programme
105 S4-C
(Rs. In Crore)
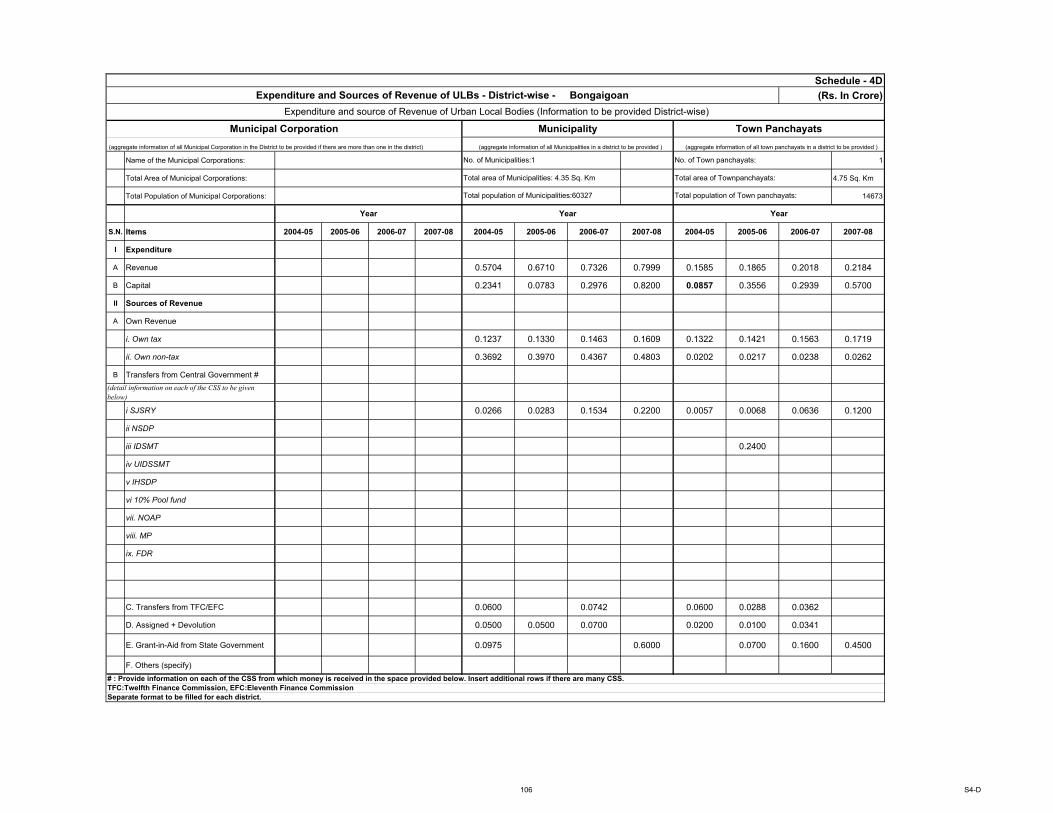
(aggregate information of all Municipal Corporation in the District to be provided if there are more than one in the district)
Name of the Municipal Corporations: 1
Total Area of Municipal Corporations: 4.75 Sq. Km
Total Population of Municipal Corporations: 14673
S.N. Items 2004-05 2005-06 2006-07 2007-08 2004-05 2005-06 2006-07 2007-08 2004-05 2005-06 2006-07 2007-08
I Expenditure
A Revenue 0.5704 0.6710 0.7326 0.7999 0.1585 0.1865 0.2018 0.2184
B Capital 0.2341 0.0783 0.2976 0.8200 0.0857 0.3556 0.2939 0.5700
II Sources of Revenue
A Own Revenue
i. Own tax 0.1237 0.1330 0.1463 0.1609 0.1322 0.1421 0.1563 0.1719
ii. Own non-tax 0.3692 0.3970 0.4367 0.4803 0.0202 0.0217 0.0238 0.0262
B Transfers from Central Government #
i SJSRY 0.0266 0.0283 0.1534 0.2200 0.0057 0.0068 0.0636 0.1200
ii NSDP
iii IDSMT 0.2400
iv UIDSSMT
v IHSDP
vi 10% Pool fund
vii. NOAP
viii. MP
ix. FDR
C. Transfers from TFC/EFC 0.0600 0.0742 0.0600 0.0288 0.0362
D. Assigned + Devolution 0.0500 0.0500 0.0700 0.0200 0.0100 0.0341
E. Grant-in-Aid from State Government 0.0975 0.6000 0.0700 0.1600 0.4500
F. Others (specify)
(detail information on each of the CSS to be given
below)
Municipal Corporation
Total population of Municipalities:60327
No. of Municipalities:1
Total population of Town panchayats:
Year Year Year
No. of Town panchayats:
Total area of Municipalities: 4.35 Sq. Km Total area of Townpanchayats:
# : Provide information on each of the CSS from which money is received in the space provided below. Insert additional rows if there are many CSS.
TFC:Twelfth Finance Commission, EFC:Eleventh Finance Commission
Separate format to be filled for each district.
Schedule - 4D
Expenditure and Sources of Revenue of ULBs - District-wise - Bongaigoan
Expenditure and source of Revenue of Urban Local Bodies (Information to be provided District-wise)
Municipality Town Panchayats
(aggregate information of all Municipalities in a district to be provided ) (aggregate information of all town panchayats in a district to be provided )
106 S4-D