Embed Size (px)
Citation preview

EFFECTS OF DISPERSION TECHNIQUES ON FLAMMABILITY
AND MECHANICAL PROPERTIES OF
PHENOLIC/E-GLASS NANOCOMPOSITES
THESIS
Presented to the Graduate Council of Texas State University-San Marcos
in Partial Fulfillment of the Requirements
for the Degree
Master of SCIENCE
by
Dmitri Kabakov, B.S.
San Marcos, Texas December 2010

EFFECTS OF DISPERSION TECHNIQUES ON FLAMMABILITY
AND MECHANICAL PROPERTIES OF
PHENOLIC/E-GLASS NANOCOMPOSITES
Committee Members Approved:
________________________ Jitendra S. Tate, Chair
________________________ Joseph H. Koo
________________________ Vedaraman Sriraman
Approved:
_________________________ J. Michael Willoughby Dean of Graduate College

COPYRIGHT
by
Dmitri Kabakov
2010

FAIR USE AND AUTHOR’S PERMISSION STATEMENT
Fair Use
This work is protected by the Copyright Laws of the United States (Public Law 94-553, section 107). Consistent with fair use as defined in the Copyright Laws, brief quotations from this material are allowed with proper acknowledgment. Use of this material for financial gain without the author’s express written permission is not allowed.
Duplication Permission
As the copyright holder of this work I, Dmitri Kabakov, authorize duplication of this work, in whole or in part, for educational or scholarly purposes only.

v
ACKNOWLEDGMENT
This research and thesis conclude my five years of education at Texas State University –
San Marcos. It was an exciting period of my life, and the University made me a better person. It
allowed me to learn a lot not only about the surrounding world, but also about myself. I am very
grateful to all the people I met while in college and especially to my advisor, professor,
supervisor, and friend – Jitendra Tate.
I was also a student-athlete balancing school and work with my practices and
competitions. Therefore, without my coaches Adam Hudson and Galina Bukharina and the entire
track and field team my educational goals would not have been accomplished. I am deeply
thankful to the athletic program at Texas State for their support and care.
Support and help also came from my friends, classmates, and teammates. I believe that
only in a good group that big goals can be achieved. All those people in my life contributed
directly and indirectly to this project.
The following list acknowledges individuals who were involved in this project in
different stages, and my deepest gratitude to them all: Aram Mekjian of Mektech Composites,
Inc.; Dr. H. Celio of Texas Materials Institute and Dr. Koo’s research group members of the
University of Texas at Austin; A. Herrera, T. Akinola, B. Barrier, and D. Velez of the Ingram
School of Engineering; and A. Martinez and J. Hancock of IEIS at Texas State University.
This manuscript was submitted on October 31st, 2010.

vi
TABLE OF CONTENTS
ACKNOWLEDGMENT ...................................................................................................v
LIST OF TABLES .......................................................................................................... ix
LIST OF FIGURES ..........................................................................................................x
ABSTRACT .................................................................................................................. xii
CHAPTERS
I. INTRODUCTION .........................................................................................................1
Background Information...........................................................................................1
Reinforcement Materials ...............................................................................1
Reinforcement Forms....................................................................................4
Resins ...........................................................................................................8
Nanocomposites.......................................................................................... 10
Phenolic Resins .......................................................................................... 11
Montmorillonite (MMT) Organoclay .......................................................... 12
Composites Manufacturing ..................................................................................... 14
Wet lay-up Method ..................................................................................... 15
Prepreg Method .......................................................................................... 15
Autoclave Processing .................................................................................. 16

vii
Pultrusion ................................................................................................... 17
Filament Winding ....................................................................................... 18
Resin Transfer Molding (RTM) .................................................................. 18
Vacuum Assisted Resin Transfer Molding (VARTM) ................................. 19
Objectives .............................................................................................................. 21
II. MANUFACTURING AND PERFORMANCE EVALUATION................................. 23
Material System ..................................................................................................... 23
Viscosity Study of Phenolic Resin .......................................................................... 24
Thermal Curing Study ............................................................................................ 25
Neat Resin Coupons: Manufacturing ...................................................................... 26
Initial Screening: Mass Loss on Resin Coupons ...................................................... 27
Nanomodifications of Phenolic Resin ..................................................................... 28
Blending of Nanoclay using High Shear Mixer ........................................... 28
Blending of Nanoclay using Planetary Centrifugal Mixing .......................... 31
VARTM Process: Nanocomposites Manufacturing ................................................. 33
Mass Loss Calorimeter Tests on Nano-modified Phenolic/E-Glass Composites ...... 34
Mechanical Testing ................................................................................................ 35
III. RESULTS AND DISCUSSION ................................................................................ 38
TEM Analysis: Exfoliation of Nanoclay after High Shear Mixing .......................... 38
SEM/EDS Analysis of Dispersion and Exfoliation ................................................. 39

viii
Dispersion after High Shear Mixing ............................................................ 41
Dispersion after Planetary Centrifugal Mixing ............................................ 42
Mass Loss Calorimetry: Mass Remaining Analysis ................................................ 43
Mass Remaining: High Shear Mixing ......................................................... 44
Mass Remaining: Planetary Centrifugal Mixing .......................................... 45
Mechanical Testing ................................................................................................ 46
Flexural Test ............................................................................................... 46
Compression Test ....................................................................................... 47
Interlaminar Shear Strength ........................................................................ 48
Tension Test ............................................................................................... 49
Analysis of Variance .............................................................................................. 51
VI. CONCLUSIONS ...................................................................................................... 53
APPENDIX A: Technical Data Sheets ............................................................................ 55
REFERENCES ............................................................................................................... 59

ix
LIST OF TABLES
Table Page
1. Properties of Typical Fibers (Strong, 2008) .............................................................................2
2. Properties of Typical Polymer Matrix Materials (Callister, 2007) ............................................9
3. Experimental Design ............................................................................................................. 23
4. High Shear Mixer’s Shear Rates ............................................................................................ 29
5. Mixing Procedure for Mixing Nanoclay with Phenolic Resin Using Planetary Centrifugal
Mixer............................................................................................................................. 33
6. Number of Test Samples in Each Category ............................................................................ 36
7. % mass remaining at 10 minutes of Mass Loss Test at 35 kW/m2 .......................................... 46
8. Mechanical properties of HS Composites .............................................................................. 51
9. Mechanical properties of PC Composites .............................................................................. 51
10. p-Values from ANOVA for Different Groups ...................................................................... 52

x
LIST OF FIGURES
Figure Page
1. Different weave patterns: plain, twill, satin and basket (Tang & Whitcomb, 1999) ..................7
2. SEM images of (a) Cloisite Na+ and (b) processed Cloisite Na+ (Horsch, Serhatkulu, Gulari, &
M., 2006) ....................................................................................................................... 13
3. Three steps of dispersion of nanoclay (Koo, 2006) ................................................................ 14
4. Schematic for VARTM ......................................................................................................... 21
5. Gel time study: viscosity vs. time for catalyzed phenolic resin............................................... 24
6. Rotational viscometer during experiment............................................................................... 25
7. Thermal cure of phenolic resin occurs after 35 min of rapid heating ...................................... 26
8. Silicone molds used to cast neat resin coupons for initial screening and for TEM analysis ..... 26
9. Mass loss calorimeter test on neat resin coupon ..................................................................... 27
10. High shear mixer without cooling jackets ............................................................................ 30
11. High shear mixer after modifications with cooling jackets on mixing chamber and hopper .. 31
12. The material container rotates and revolves in air or vacuum pressure at high speed. The
centrifugal power reaches to 400G force at highest speed (Courtesy of THINKY®) ....... 32
13. VARTM process setup inside an oven before impregnation ................................................. 33
14. Mass loss calorimeter setup ................................................................................................. 34
15. Composite specimens before testing with 0, 2.5, 5, and 7.5wt% nanoclay loading (left to
right) ............................................................................................................................. 35

xi
16. Composite specimens after testing at 0, 2.5, 5, and 7.5wt% nanoclay loading (left to right) . 35
17. TEM images of 2.5 wt.% loading of nanoclay after high shear mixing. Image is 800X800 nm
...................................................................................................................................... 38
18. TEM images of 5.0 wt.% loading of nanoclay after high shear mixing. Image is 1600X1600
nm ................................................................................................................................. 39
19. TEM images of 7.5 wt.% loading of nanoclay after high shear mixing. Left image is
800X800 nm; right image is 400X400 nm ..................................................................... 39
20. (a) Sodium (Na) presence (blue) at area of interest confirms that the particle is Cloisite® Na+
nanoclay; (b) SEM image of a particle ........................................................................... 41
21. SEM image of 5% nanoclay loading using high shear techniques ........................................ 42
22. SEM image of 5% nanoclay loading using planetary centrifugal mixing .............................. 43
23. Percentage mass remaining after 10 min under 35 kW/m2 heat flux ..................................... 44
24. Mass loss calorimetry results for high shear specimens ........................................................ 44
25. Mass loss calorimetry results for centrifugal planetary mixer ............................................... 45
26. Flexure test results: (a) Flexural strength, MPa; (b) Flexural modulus, MPa ........................ 47
27. Compression test results: Compression strength, MPa ......................................................... 48
28. Short beam test results: ILSS, MPa ...................................................................................... 49
29. Tension test results: (a)Ultimate Tensile Strength (UTS), MPa; (b)Tensile modulus, GPa ... 50

xii
ABSTRACT
EFFECTS OF DISPERSION TECHNIQUES ON FLAMMABILITY
AND MECHANICAL PROPERTIES OF
PHENOLIC/E-GLASS NANOCOMPOSITES
by
Dmitri Kabakov
Texas State University-San Marcos
December 2010
SUPERVISING PROFESSOR: JITENDRA S. TATE
Nanomaterials are currently the most researched materials in the scientific world. The
term “nanotechnology” or “nanotech” (NT) refers to the ability to measure, manipulate, and
organize matter at nano scale (Kobayasi, 2007, p. 13). It influences many aspects of our life,
such as social, cultural, and economic. There are more than a thousand NT consumer products on
the market and this number is constantly growing (Nanotechnology Consumer Products
Inventory, 2009). Manufacturers use the term “nano” in products’ names to increase sales, while
these products have no connection to NT. These products are widely known, such as the Indian
car Tata Nano or the music player iPod Nano. It shows that the word “nano” and NT in general

xiii
has a psychological effect and is a new marketing tool to promote new products. However,
products made of the true nanomaterials are rare on the market.
Nanomaterials have unique properties and, if properly used, can improve properties of
existing products. Nevertheless, there are many unsolved problems while using nanomaterials
including safety, handling, processing, and disposal. Also, nanomaterials cannot be used “as-is.”
The easiest way to use them is as a one of the constituents in other traditional materials
such as composite materials, and then it becomes a “nanocomposite.” Nanomaterials blended
into polymers can be called “polymer nanocomposite” or simply “nanopolymers.” Fiber
reinforced polymer nanocomposites consist of fiber reinforcement and a nanomodified polymer
matrix. Nanomodification of polymer matrices using the right kind of nanoparticle in the right
percentage, leads to multifunctional composites that enhances two or more properties, such as
mechanical, thermal, chemical, and barrier. The major challenge in property enhancement is
uniform dispersion of nanoparticles in the polymer matrix. Popular methods used for dispersing
nanoparticles into liquid thermoset resins are mechanical stirring, high shear mixing, centrifugal
mixing, and sonication.
E-glass/phenolic composites have gained popularity due to their excellent fire, smoke,
and toxicity (FST) properties. In this research water-based phenolic resin was modified using
low-cost montmorillonite nanoclay (Cloisite® Na+ ) to improve flammability properties. Two
different dispersion techniques, high-shear mixing and planetary centrifugal mixing, were used
to blend nanoclay into phenolic resin, followed by low-cost vacuum assisted resin transfer
molding (VARTM) to manufacture glass-reinforced nanocomposites. The loading of nanoclay
included 2.5, 5.0, and 7.5 wt.% in both techniques. The degree of dispersion was analyzed using
scanning electron microscopy (SEM) and transmission electron microscopy (TEM). Mass loss

xiv
calorimeter tests were conducted at a heat flux of 35 kW/m2. Mechanical properties such as
flexural strength, interlaminar shear strength (ILSS), and compressive strength were evaluated. It
is observed that 7.5wt.% loading of Cloisite® Na+ improves flammability properties in both
dispersion techniques. Planetary centrifugal mixing techniques did not fully exfoliate nanoclay
particles; however it did not adversely affect mechanical properties but still provided near
equivalent flammability performance as that of high shear mixing. It can be concluded that cost-
effective centrifugal mixing can be used in manufacturing nanocomposites to enhance
flammability property without sacrificing mechanical properties.
Key Words: Nanocomposite, nanoclay, phenolic, mechanical properties, flammability
properties, and dispersion

1
I. INTRODUCTION
Fiber reinforced (FR) polymer nanocomposites typically consist of carbon or glass
fiber, and a nanomodified polymer matrix. Using the right kind of nanoparticles to modify
polymer matrices with the right percentage can lead to multifunctional composites. The
major challenge in property enhancement is uniform dispersion of nanoparticles in polymer
matrix (Ray & Okamoto, 2003). This study attempts to evaluate effects of dispersion
techniques and the quality of dispersion of nanoclay in phenolic resin, and the flammability
and mechanical properties of FR polymer nanocomposites.
Background Information
Reinforcement Materials
Reinforcement for composites varies depending on their intended usage; it can be
fibers, whiskers, or particles. Fibers are the most common on the market. Especially long
fibers are now being sometimes referred to as a new class of solid materials, other
reinforcements are also used but due to fibers’ distinct properties, they are preferred in the
industries. Fibers have one very long axis with significantly higher strength in the longer
direction. They are available in many diameters and lengths including continuous that can be

2
used as is, or chopped to desired shape (Strong, 2008). The list of fiber types includes E-
glass, S-glass, carbon and aramid. Their properties are shown in Table 1.
Table 1: Properties of Typical Fibers (Strong, 2008)
Fiber Type Diameter
(µm)
Density
(g/cm3)
Tensile Strength (MPa)
Tensile Modulus
(GPa)
Elongation at break
(%) E-glass 8-14 2.5 3447 69 4.9 S-glass 10 2.5 4585 83 5.7 Carbon 7 1.8 4137 228 1.6 Aramid 12 1.45 3660 83 30
Carbon fiber
Carbon fiber is a very strong, light, and expensive material commonly used in making
of composites. It has very thin fibers with diameters ranging from 5 to 10 µm and consists of
carbon atoms, which are bonded together in microscopic crystals that are typically aligned to
the long axis of the fiber which makes it strong. Several thousand fibers are twisted together
to form a yarn, which could be used directly or woven into a fabric. Carbon fiber could also
be made into weave patterns and its combination with matrix form composite materials.
Carbon fiber has been studied to be ideal in many applications due to its high strength-to-
weight ratio (high specific strength), and also has a lower density than steel. Processing
temperature in making carbon fibers play a major role in determining carbon properties,
heating carbon in the range of 1500 – 2000oC exhibits highest tensile strength while carbon
heated from 2500 - 3000oC exhibits a higher modulus of elasticity, often called as graphite
fibers (Strong, 2008).

3
Glass fiber
Glass fibers are made from raw materials like silica sand, limestone, boric acid and
other ingredients. It is usually formed from extruding thin strand of silica-based, or other
formulation glass, into many fibers with small diameters. The most commonly type of fiber
glass used in industry is E-glass, others like A-glass, C-glass, D-glass, R-glass and S-glass
are also being used due to their various distinct properties. Nevertheless, E-glass still makes
up most of the fiberglass production in the world. Its specific components may differ slightly
in percentage, but usually fall within a particular range. The letter “E” in E-glass is used
because the glass fiber was originally made for electrical applications. The letter “S” is used
in S-glass because it has a high-strength formulation for use when tensile strength is the most
important property desired, while C-glass was developed to resist attack from chemicals,
mostly acids which destroy E-glass. A-glass was formed with alkaline lime glass with little,
or no, boron oxide. R-glass is a high mechanical requirement glass made of alumino silicate
without magnesium oxide and calcium oxide.
Pure silica is a major component used in making glass fiber. It requires a high
temperature to work with which constitute a drawback for flexibility in manufacturing
temperature. Impurities can be introduced into the constituents by the addition of other
materials in order to lower the working temperature. It also imparts other properties to the
glass that may be advantageous in different applications. In addition, most glass fibers are
rarely water soluble and depend on pH, in most cases the chloride ion will attack E-glass
surfaces.
Glass fiber has high ratio of surface area to weight and the larger its surface area, the
more susceptible it becomes to chemical attack. Glass fiber has a widely applications in

4
making of components where high strength-weight, excellent molded surfaces, dimensional
stability, high dielectric strength, and parts consolidation are important (Strong, 2008).
Although, glass fibers’ optimal usage in corrosion-resistant and electrical products
depends on the suitability as well as performance strength of the matrix used in conjunction
with the glass fiber. Glass fibers are fragile and could easily abrade when processing. This
could cause a major problem during weaving. In order to avoid loss of strength, which
depends on surface defects that might occur during handling, a temporary sizing is applied.
Sizing is the process of applying chemicals to the fiber strands in order to protect the fibers
during handling and also holds the individual filaments together. In most cases the size is
removed after weaving, and finish is applied. Finish is usually added to fiber to enhance its
compatibility with the matrix (Strong, 2008).
Reinforcement Forms
Fibers are available in many oriented forms such as chopped strand mat (CSM),
woven fabrics, braided, stitched and knitted fabrics.
Roving
Roving is the simplest and most common form of glass. Roving is bundle of few
thousand monofilaments and this term is used in glass industry. It can be chopped, woven or
processed and also used in creating secondary fiber forms for composite manufacturing. It is
supplied by weight with specific filament diameter.

5
Mats
Mats are generally non-woven fabrics derived from fibers and are held together by a
chemical binder. Chopped mats consist of randomly distributed fibers with a cut length of 38
mm to 63.5 mm (McConnell, 2010). They are isotropic because of the random nature of the
fibers and possess equal strength in all directions. The chemical binder does not give much
concern since it dissolves in styrene (a material contained in polyester and vinyl ester resins).
Chopped-strand mats (CSM) conform easily to complex shapes, by providing low-cost
plastic reinforcement, chopped-strand mats are primarily used in hand lay-up, continuous
laminating, and some closed molding applications.
Stronger than chopped-strand, continuous-strand mats are formed by swirling
continuous strands of fiber onto a moving belt, and finished with a chemical binder to hold
fibers in place. A non-dense fiber arrangement accepts a high ratio of resin to fiber, which
results in a thick, smooth, resin-rich finish. It is usually used in non-critical applications, as
most applications of composites are non-critical (McConnell, 2010).
Woven Fabrics
Woven fabrics are usually made on looms with different weaves and widths. They are
bi-directional and provide high strength in yarn direction, but the tensile strength is always
compromised because fibers are crimped as they pass over and under one another during the
weaving process. Wearing is commonly used in applications that require thick reinforcement,
especially in hand lay-up and vacuum assisted resin transfer molding (VARTM. Several
different weaves are used for bi-directional fabrics. In a plain weave, each yarn or roving
alternately crosses over and under each warp fiber. Harness satin and basket weaves, in

6
which the yarn or roving crosses over and under multiple warp fibers at a time, are more
pliable and conform easily to curved surfaces. Due to its relatively coarse weave, woven
roving wets quickly; it is relatively inexpensive and results in a thick fabric used for heavy
reinforcement, especially in hand lay-up operations (Tate, Kelkar, & Whitcomb, 2006).
Braided Fabrics
Braided fabrics are a continuous weave process that has at least one of its axial yarns
not crimped in the weaving process. This is commonly done by intertwining three or more
yarns and not twisting any two yarns around each other. This ingenious process gives braided
fabrics vastly improved strength and greater strength-to-weight ratio than woven fabrics. The
quasi-isotropic formation within a single layer tends to eliminates problem associated with
layering multiple fabrics with other formations and it also reduces delamination which is the
cause of most failures in composite. Braids are widely used in the industry because of the
possibility of maximizing properties in all directions of a part (Strong, 2008).
Knitted fabrics
Knitted fabrics are formed by simply placing yarns atop one another in practically
any arrangement and binding them together. Orienting all strands in one direction, for
example, results in a fabric with greater flexibility. Placing the yarns on top, rather than over
and under each other, makes greater use of their inherent strength. Since they have no
crimped fibers, knitted fabrics are more pliable than woven. Due to the wide variety of yarn
orientations and fabric weights, knitted fabrics are tailored to individual customer

7
requirements. They are much more elastic and are not available in lightweights (Strong,
2008).
Different weave types
Figure 1 displays some of the common types of weaves available. The fabric or long
direction is commonly called warp direction, while the cross or width direction is called the
fill or weft direction.
Figure 1: Different weave patterns: plain, twill, satin and basket (Tang & Whitcomb, 1999)
The plain weave is the simplest of the weave patterns, the warp and weft are aligned,
and are made by interlacing yarns in an alternating over-and-under pattern. There is usually
one warp fiber for one fill fiber. It has a peculiar checker board like appearance. This pattern
gives uniform strength in both directions when yarn size and count are similar in warp and
fill. The weave is considered stiff and stable, which is usually left quite open for good resin
penetration and air removal (Zac-Williams, 2006).
In the crowfoot satin weave, one warp yarn is taken over three and then under one fill
yarn. This produces a weave with improved unidirectional quality with more strength in the

8
fiber directions than with plain weave. The fabric is more pliable and can comply with
complex contours and spherical shapes (Strong, 2008).
The long-shaft or 8-harness satin weave typically has one warp yarn weaving over
seven fill yarns then under one fill yarn. It has a high degree of drape and stretch in all
directions. This weave is less stable and open than most weaves, therefore, it requires a
vacuum for resin impregnation and air removal. It is widely used in applications that need
complex shape formation and contoured surfaces. 5-harness satin weave follows the same
pattern (McConnell, 2010).
The basket weave is similar to the plain weave except that two warp yarns are woven
as one over and under two fill yarns. It is less stable than the plain weave and has similar
usages but it drapes on mild contours. Twill is formed with a diagonal parallel pattern, which
is made by passing the weft yarn over one or more warp yarns. It usually has some form of
offset between rows to create the characteristic diagonal pattern, and drapes because of this
pattern. Twill fabrics usually have front and back sides unlike the plain weave in which both
sides are the same. Twill recovers better from wrinkles than plain weave fabrics. It requires
vacuum for good resin impregnation and air removal (McConnell, 2010).
Resins
Resins are one of the most important components of polymer matrix composites.
While the loads are essentially carried by fibers, modulus and failure strain depends on
resin/matrix adhesion in the performance of composites. It also determines the type of
fabrication process, service temperature, and flammability and corrosion resistance of the
composite. Thermosets and thermoplastics are commonly used matrix systems.

9
Thermoplastic resins become soft when heated, may be shaped or molded while in a
heated semi-fluid state, and become rigid when cooled. Thermoset resins are usually liquids
or low melting point solids in their initial form. When used in making finished goods, these
thermosetting resins could be cured at room temperature or under high heat depending on the
desired properties. Unlike thermoplastic resins, once cured, solid thermoset resins cannot be
converted back into their original liquid state. Cured thermosets will not melt and flow, but
will soften when heated (and lose hardness), and once formed, they cannot be reshaped. Heat
distortion temperature (HDT) and the glass transition temperature (Tg) are used to measure
the softening of a cured resin. Both test methods (HDT and Tg) measure the approximate
temperature where the cured resin will soften significantly to yield (bend or sag) under load
(MDA Composites, 2009).
Table 2: Properties of Typical Polymer Matrix Materials (Callister, 2007)
Resin Liquid Density (g/ml)
Tensile Strength (MPa)
Tensile Modulus (GPa)
CTE (10-6/oC)
GT Tg, (oC)
Phenolic1 1.22 34.5-62.1 2.76-4.8 122 160 Polyester2 1.1-1.5 5.8-13 0.46-0.51 33-110 50-110 Vinyl Ester3 1.23 12.5 1.5 212-514 220 Epoxy4 1.20 60-75 2.7-3.2 59-212 140-176
1Phenolic Resin: Cellobond J2027L, Hexion Specialty Chemicals. 2Unsaturated Polyester: AROPOL 7241T15, Ashland Specialty Chemicals, Inc. 3Vinyl ester: Derkane Momentum 510-A40, Ashland Specialty Chemicals, Inc. 4Epoxy: Epikote RIM 135, Hexion Specialty Chemicals.
Thermosetting resins have a number of advantages, unlike thermoplastics, they retain
their strength and shape even when heated. This makes thermosetting resins well suited to the

10
production of permanent components and large, solid shapes. Additionally, these components
have excellent strength attributes (despite being brittle), they will not become weaker when
the temperature increases (Thomasnet, 2008). The most common thermosetting resins used in
the composites industry are unsaturated polyesters, epoxies, vinyl esters, polyurethanes, and
phenolics.
Nanocomposites
Nanocomposite refers to a composite material in which one of the components is
nanomaterial. There are two types of nanomaterials: synthesized nanomaterials and natural.
Some are synthesized nanomaterials, such as carbon nanotubes (CNT) or Carbon Nano
Fibers (CNF) (Yeh, Tai, & Lin, 2009). They are referred as “engineering nanomaterials.”
Some nanomaterials have been always existed in nature and are referred to as “natural
nanomaterials” or “industrial nanomaterials.” Organic nanoclays from Southern Clay
Products, Inc. are examples of natural nanomaterials. These materials have been around for a
long time but were not studied and used until recent years. During the last decades,
technological development allowed study and characterization of many nanomaterials.
Nanomaterials have unique properties, and are materials in the purest form. They have large
surface-area-to-volume ratio because of their size (Thostenson, Li, & Chou, 2005).
However, these materials and other nanoparticles cannot be used as structural
elements. Therefore, they should be used as part in composite materials. These materials are
called nancomposites and can be fiber reinforced. Nanocomposites have been extensively
investigated in recent years and found to have superior properties over conventional
composites, and are already being used in production. Nanoclays manufactured by Southern

11
Clay Products are used as additives to polymers. The major challenge in property
enhancement is uniform dispersion of nanoparticles in polymer matrix. These can be
achieved in different ways. The popular methods used for dispersing nanoparticles in liquid
thermoset resins are mechanical stirring, high shear mixing, centrifugal mixing, and
sonication. On the other hand, introduction of nanoparticles to composites increases
manufacturing cost and raises safety issues. As a result, usage of nanocomposites is limited
to specific applications.
Phenolic Resins
Phenolic resins exhibit excellent dimensional stability and excellent chemical and
corrosion resistance. The major contribution of phenolic resins as a matrix in fiber reinforced
composites is its fire, smoke, and toxicity (FST) characteristics (Botcher & Pilato, 1997).
There are numerous applications that require excellent FST characteristics such as aircraft
interiors, tunnel materials, offshore oilfield grating and deluge pipe, and fire safe
components. Pilato et al. have provided an excellent review on phenolic and related resins
and their nanomodification into FRP (Fiber reinforced plastics) systems (Pilato, Koo,
Wissler, & Lao, 2008). The introduction of a nanophase within a polymeric system has been
shown to substantially improve the overall physical and mechanical properties of the
resulting nanomodified polymers (Koo, 2006).
The use of nanomodified phenolic resins as matrix into fiber reinforced composites is
in its early stages. Koo et al. has investigated nanomodified (clay, POSS, and CNF) phenolic
resole resin into carbon fiber-reinforced composites for ablative applications. They have

12
reported that nanomodification lowers ablation rate and also lowers backside temperature rise
for rocket ablative materials (Bray, Beall, & Stretz, 2004).
Montmorillonite (MMT) Organoclay
Nanoclay is the most widely investigated nanoparticle in a variety of different
polymer matrices for a wide spectrum of applications (Botcher & Pilato, 1997) and (Pilato,
Koo, Wissler, & Lao, 2008). The origin of natural clay (bentonite) is in-situ alteration of
volcanic ash and hydrothermal alteration of volcanic ash. Bentonite contains mainly
montmorillonite but also can contain illite, kaolinite, quartz, zeolite, and carbonates. The
starting materials of Southern Clay Products (SCP) are volcanic eruptions in the Pacific
Ocean and western United States.
The chemical structure of MMT clays is layered sheets consisting of tetrahedral
silicate layers and the octahedral alumina layer. The chemical formula of the MMT clay is
Na1/3 (Al5/3Mg1/3)Si4O10 (OH)2. In the natural state Na+ cation resides on the MMT clay
surface. Layered silicates are hydrophilic materials hence they must be made hydrophobic to
become compatible with most polymers that are hydrophobic polymers. There are several
types of clay surface treatments performed such as quaternary ammonium salts and alkyl
imidazoles. Cloisite® Na+ (Figure 2) was used in this research. It is natural montmorillonite.
It is used as additive to improve various physical properties such as heat defection
temperature (HDT), coefficient of linear thermal expansion (CTE), and barrier properties.
Achieving exfoliation of montmorillonite in various polymers is a function of the
surface treatment of MMT clays and the mixing efficiency of the dispersing apparatus
(Varley, Groth, & Leong, 2008). For Cloisite® Na+, SCP recommends that it be dissolved in

13
either, water using high-shear mixing or to add directly into a water-soluble aqueous polymer
solution. This research uses water-based phenolic resin. Cloisite® Na+ was added into
phenolic resin and stirred well. Later high-shear mixing was used to achieve intercalation or
exfoliation.
Figure 2: SEM images of (a) Cloisite Na+ and (b) processed Cloisite Na+ (Horsch, Serhatkulu, Gulari, & M., 2006)
As shown in Figure 3, polymer-clay nanocomposites can be classified
morphologically into unmixed, intercalated, and exfoliated states depending on dispersion of
the nanoclays. The most desirable morphological state for polymer-clay nanocomposites is
exfoliation, followed by intercalation. The challenge of processing nanoclay is dispersing the
8-µm particles into millions of platelets using proper processing techniques and conditions.
Transmission electron microscopy (TEM) is the most useful technique to determine the
dispersion of the nanoparticles in the polymer matrix (Krishnamoorti, 2001) (Pinnavaia,
2000).

14
Figure 3: Three steps of dispersion of nanoclay (Koo, 2006)
Exfoliation of nanoparticles within polymer matrix is vital for major improvements in
properties. High-shear mixing is time-consuming and expensive method to achieve
exfoliation of nanoclays. This research indicates that intercalation state can be achieved by
using inexpensive dispersing technique, planetary centrifugal mixing.
Composites Manufacturing
Weight reduction offered by composite laminates over metals has made composite
parts attractive in many applications. Advanced composites are composites made by
optimizing the relationship of mechanical properties and weight, or optimizing thermal
performance and weight while engineering composites are composites made for superior
properties but focus on cost reduction. There are many methods used in making engineering
and advanced composites such as wet lay-up, prepreg method, autoclave processing, filament
winding, Resin Transfer Molding (RTM), and Vacuum Assisted Resin Transfer Molding
Unm ixed
D
Exfoliated
Intercalated
d
15
(VARTM). In the following section, a brief description of these methods, their advantages
and disadvantages are explained.
Wet lay-up Method
It is a method that involves laying of reinforcement into the mold followed by
applying the resin system. The wet composite is usually rolled by hand for even distribution
of the resin and air pockets removal. Another layer of reinforcement is placed on top of the
wet composite and resin poured into it. This same process is repeated until the desired
thickness is achieved; the composite is then allowed to dry through curing. Wet lay-up is a
simple method which does not require any special handling of wet fabrics, it allows the resin
to be applied only in the mold which helps in maintaining a neat working environment.
Variations in resin viscosity affect the curing process and also cause problems in creating
good wet-out of reinforcement. A mold release is usually applied to the mold thereby
preventing the composite from sticking and allows for easy removal of the composite from
the mold (Strong, 2008).
Prepreg Method
Prepreg method can be viewed to a great extent as an extension of the wet lay-up
method. The fibers are usually arranged in a unidirectional tape or a woven fabric, it is
impregnated with partially cured resin and stored in a way to avoid complete cure of the
resin. Prepregs are made in different rolls which could later be put or cut to fit into mold
depending on its desired usage. It is usually stacked up in layers until the desired thickness is
achieved. Prepregs are always made to be moldable so that complex shapes can be produced.

16
Prepregs usually have a limited shelf-life because its resins have already been
initiated when the prepreg is made. The shelf-life is usually several days to weeks and stored
at room temperature, but shelf life can be extended by storing the prepreg in the freezer. It is
a common practice to record the time out of the freezer in order to determine the remaining
shelf life. If prepregs are not stored well, they turn out dry and rigid which are difficult to
use. Although this method is slow and labor intensive, it offers better part definition, higher
fiber content and better consolidation than wet lay-up (Strong, 2008).
Autoclave Processing
This is the most common method used for curing thermoset prepregs (composite
world, 2010). It involves applying high pressure and heat to the part through the autoclave
atmosphere. The autoclave consists of a vessel that can be pressurized internally up to 5 bar
(~ 75 psi), before its contents are heated. The vessel is used for component curing and is
usually large, to accommodate large components. They are pressurized with gas, usually
nitrogen that is circulated through the heaters to maintain a uniform temperature throughout
the vessel. Attaining proper airflow is essential in achieving uniform temperature in the
vessel. Heat enters through the end side of the autoclave and circulates the entire area of the
vessel through a series of ducts and fans. This whole unit of the part in this case; composite is
kept in a vacuum bag to maintain vacuum pressure on the laminate. The outer membrane is
pressed against the laminate by atmospheric pressure. The part is then placed in the autoclave
where the bagged molding may be reconnected with the evacuation system to maintain the
vacuum. The autoclave is pressurized which augments the consolidated pressure. The
temperature of the autoclave is reduced when the resin is adequately cured. The major

17
advantage of the autoclave is the manufacturing of composites with high fiber volume
fraction and uniform thickness of the structure. However, the high cost of equipment is a
huge set back as well as stringent pressure code regulations in using autoclave processing
(Strong, 2008).
Pultrusion
This is a continuous molding process that combines fiber reinforcements and
thermosetting resin. It is widely used in making composite parts that have a constant cross-
section profile which is also automated. It is a process by which reinforcements are
positioned in a specific location using shapers to form a profile. It involves passing of
reinforcement through a resin bath where it is thoroughly coated with the resin before passing
through a heated metal pultrusion die (McConnell, 2010).
The dimension and shape of the die usually define the finished shape of the part being
fabricated. Heat is transferred by temperature control to the die which cures the combination
of the reinforcement and the resin passing through it, and heat energy transferred changes the
resin from liquid to solid. Solid laminates emerges from the pultrusion die having the exact
shape of the die cavity; the laminates usually solidifies when cooled and continuously pulled
through pultrusion machine by tandem pullers between the die exit and cut to the desired
length.
However, the initial capital investment on pultrusion is exceedingly high than most
other manufacturing processes which limits its common application but has low cost to high
volume production that justifies its usage in the industry (Strong, 2008).

18
Filament Winding
This is a process of winding resin-impregnated fiber on a mandrel surface in a precise
pattern. It is usually done by rotating the mandrel while a delivery head precisely position
fiber on the mandrel surface to form the part. Successive layers could be added using the
same or different winding angles until the required thickness is achieved.
Filament winding machines operate on the principles of controlling machine motion
through various axes. The basic motions are the spindle or mandrel rotational axis, the
horizontal carriage motion, and the cross or radial carriage motion axis. The mandrel or the
application head can rotate to give the fiber coverage over the mandrel and transverses
longitudinally giving the coverage.
In addition, filament winding does not use prepreg materials but incorporates the
impregnation of the fiber tows as part of the filament winding process. The use of more than
one type of reinforcement material may have some advantages in terms of cost and product
performance like a vessel wound with carbon fiber for strength and modulus, and then over
wound with aramid to protect the vessel from impact damage when in use.
Defining the relative speed of the mandrel and the head are important in successful
filament winding. The two motions determine the wrapping angles and the overlap as well as
the mechanical properties of the part (Strong, 2008).
Resin Transfer Molding (RTM)
This is a process that involves placement of reinforcement materials between two
matching mold surfaces. These matching mold surfaces are commonly called male and
female molds, and are usually closed in molding processes, and a low-viscosity resin system

19
is injected into the mold cavity through one or series of ports under moderate pressure. A
vacuum is usually used in enhancing the flow of the resin and reducing void formation.
Design of the mold is the most critical factor in proper resin transfer. The mold is
usually fabricated and ensures that resin reaches all areas with the same concentration. RTM
molds are usually made of composite materials but other materials may also be used; very
large and complex shapes can be made efficiently and inexpensively. Molds are vented in
such a way that air is pushed out of the mold by the resin but the vent is too shallow to allow
passage of resin outside. It is arguably one of the widely used manufacturing processes in
making composite laminates but control of resin uniformity is always difficult, radii and ends
are usually resin rich (Strong, 2008).
Vacuum Assisted Resin Transfer Molding (VARTM)
VARTM is an adaptation of the RTM process and is very cost-effective in making
large structures such as boat hulls. In this process, tooling costs are cut in half because one-
sided tools such as open molds are used to make the part. In this infusion process, fibers are
placed in a one-sided mold and a cover – either rigid or flexible – is placed over the top to
form a vacuum-tight seal. A vacuum procedure is used to draw the resin into the structure
through various types of ports. This process has several advantages compared to the wet lay-
up process used in manufacturing boat hulls. Because VARTM is a closed mold process,
styrene emissions are close to zero. Moreover, a high fiber volume fraction (70%) is achieved
by this process, and therefore, high structural performance is obtained for the part
(Mazumdar, 2002).

20
Distribution media aids the proper distribution of the resin over the reinforcement
while peel ply which is usually used in covering both top and bottom of the stacked fabrics
helps in easy removal of the composite part from the mold. This method also allows visual
monitoring of the resin amongst other things while impregnating and defects could be easily
spotted.
Generally, VARTM is an attractive and affordable method of fabricating composite
laminates and lends itself to the production of large scale and high quality parts provided the
resin system has low viscosity in the range of 100 to 1000 cP for proper wet out of the
fabrics. During VARTM, dry fabric is placed into a tool and vacuum bagged in conjunction
with the resin distribution line, the vacuum distribution line, and the distribution media. A
low viscosity resin is drawn into the fabric through the aid of a vacuum. Resin distribution
media ensures resin infiltration in the through-the-thickness direction. The key to successful
resin infiltration of the fabric is the design and placement of the resin distribution media
which allows complete wet-out of the fabric and eliminates voids and dry spots. Properly
designed and properly placed resin distribution media eliminate race tracking and resin
leakage around the fabric (Seemann W. H., 1990) (Seemann W. H., 1994). The schematic for
the fabrication is shown in Figure 4.
Although autoclave and RTM processes are the most widely used in aerospace and
other industries due to their regular high fiber volume fractions and uniform thickness of the
composite structures but autoclave is expensive and VARTM process has various
advantages; the process is relatively low cost for low volume production, and tools used are
relatively simple and inexpensive. It can be used to make large and complex parts such as
turbine blades, with their high fiber volume fraction, on-site manufacturing and repair is

21
possible. Styrene emission is major concern in open molding processes when using
unsaturated polyester and vinyl ester resins. VARTM is a closed molding process and has
less environmental concerns.
For example, most wind turbine blades are extremely long which could cost a fortune
in transferring them to turbine farms, but VARTM process could be set up on the farm
manufacturing and repairing blades and returning them to active service with very little down
time. The above process was used in manufacturing composite panels in this research. The
VARTM process is explained in detail in the next section.
Figure 4: Schematic for VARTM
Objectives
In this research two different mixing techniques are compared. High-shear (HS) is the
superior method of uniformly dispersing and exfoliating nanoclay. In contrast, planetary
centrifugal (PC) mixing is a good method for dispersion, but will not provide exfoliation,
since it provides only little or no shearing forces. Therefore, we expect to see mixture of
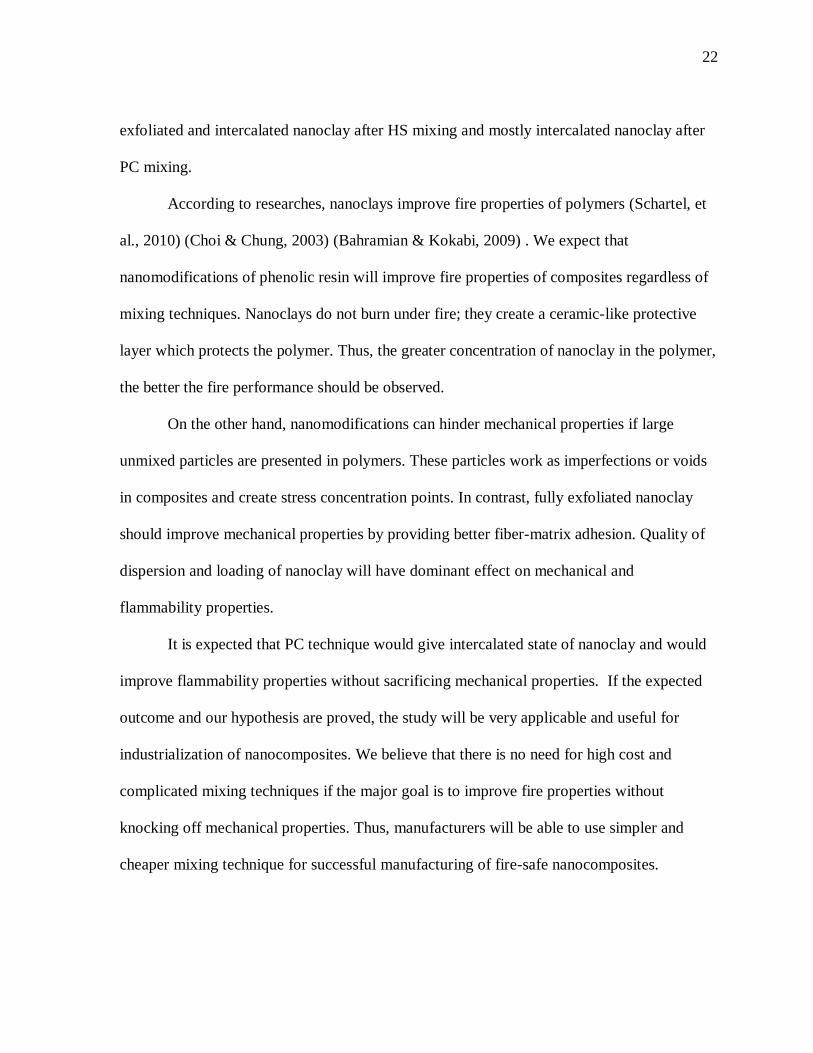
22
exfoliated and intercalated nanoclay after HS mixing and mostly intercalated nanoclay after
PC mixing.
According to researches, nanoclays improve fire properties of polymers (Schartel, et
al., 2010) (Choi & Chung, 2003) (Bahramian & Kokabi, 2009) . We expect that
nanomodifications of phenolic resin will improve fire properties of composites regardless of
mixing techniques. Nanoclays do not burn under fire; they create a ceramic-like protective
layer which protects the polymer. Thus, the greater concentration of nanoclay in the polymer,
the better the fire performance should be observed.
On the other hand, nanomodifications can hinder mechanical properties if large
unmixed particles are presented in polymers. These particles work as imperfections or voids
in composites and create stress concentration points. In contrast, fully exfoliated nanoclay
should improve mechanical properties by providing better fiber-matrix adhesion. Quality of
dispersion and loading of nanoclay will have dominant effect on mechanical and
flammability properties.
It is expected that PC technique would give intercalated state of nanoclay and would
improve flammability properties without sacrificing mechanical properties. If the expected
outcome and our hypothesis are proved, the study will be very applicable and useful for
industrialization of nanocomposites. We believe that there is no need for high cost and
complicated mixing techniques if the major goal is to improve fire properties without
knocking off mechanical properties. Thus, manufacturers will be able to use simpler and
cheaper mixing technique for successful manufacturing of fire-safe nanocomposites.

23
II. MANUFACTURING AND PERFORMANCE EVALUATION
Material System
Water-based liquid resole phenolic resin, Cellobond® J-2027L, was used with acid
catalyst, Phencat® 382 (both were supplied by Hexion Inc.). The resin was modified with
montmorillonite nanoclay, Cloisite® Na+, which was supplied by Southern Clay Products,
Inc. Nanoclay was blended with phenolic resin in 0.0, 2.5, 5.0, and 7.5 wt.% loadings.
Further phenolic resin was reinforced with E-glass woven roving fabrics, Rovcloth® 1854,
which was supplied by Fiberglass Industries. Sizing used on this fabric is compatible with
acid catalyzed phenolic resin. Fiber reinforced (FR) nanocomposites were manufactured
using VARTM process. Table 3 shows the experimental design of the study. It is 2-by- 3
design with a control group, which generates a total of seven groups.
Table 3: Experimental Design
Mixing Technique 0.0 % (Control)
2.5 % 5.0 % 7.5 %
High Shear 0 1.1 1.2 1.3
Planetary Centrifugal 0 2.1 2.2 2.3

24
Viscosity Study of Phenolic Resin
The viscosity of the resin is crucial for VARTM process. Ideally, viscosity should be
in the range of 100 to 1000 cP for proper impregnation of fabric in polymer resin. Once
catalyst is mixed with resin, exhothermic reaction begins. In this cross-linking reaction
viscosity of the resin increases and eventually resin stops flowing, it gels. Thus gel time is
time available for processing of composites. As per manufacturer’s data, 5wt% of acid
catalyst Phencat® 382 should provide 50 minutes of gel time in standard conditions. Gel time
was re-evaluated in-house using rotational viscometer (HAAKE 7R+ with spindle R2). The
resin and catalyst were mixed under a fume hood, degassed for 4 min at vacuum of 47 kPa,
and then heated to 35°C in standard conditions. In VARTM process, resin was heated at
35ºC, therefore, gel time study was also performed by heating resin at 35ºC. Figure 5
displays time vs. viscosity graph. Viscosity increased with respect to time. At 90 minutes,
viscosity was well-below 900 cP so test was stopped. The processing window of this resin
system is sufficient to use the VARTM process to manufacture composites.
Figure 5: Gel time study: viscosity vs. time for catalyzed phenolic resin
0
200
400
600
800
1000
1200
0 10 20 30 40 50 60 70 80 90 100
Visc
osity
, Pa•
s
Time, min

25
Figure 6: Rotational viscometer during experiment
It is known fact that as loading of nanoparticles is increased the viscosity of polymer
resin increases rapidly. Increase in viscosity poses difficulties in VARTM processing. High
viscosity resin would not flow through fabric. In such situation viscosity is decreased by
heating the resin or adding solvent. Both these solutions increase processing cost.
Fortunately, the viscosity was not an issue with his type of nanoclay at these loadings. The
VARTM process was successfully carried on for all of the test panels.
Thermal Curing Study
According to the manufacturer, the thermal curing occurs after 80°C. Thus, the
temperature of the resin should also be monitored and controlled during mixing process.
This study was performed to investigate the behavior of resin under high heat. Resin
was heated with no catalyst on a heated plate until the cross linking of the resin occurred. The
heater was set on the maximum heat setting and a small amount of resin (100 mL) was

26
placed into a glass beaker. The study confirmed that the resin does not cure until 30 minutes
even under rapid heating. Thermal curing began about 35 minutes (Figure 7). Therefore, it
was decided to limit mixing time in high shear mixing to 25 minutes as a safety precaution.
Figure 7: Thermal cure of phenolic resin occurs after 35 min of rapid heating
Neat Resin Coupons: Manufacturing
Neat resin coupons (11 cm x 11 cm) were cast using silicone molds as shown in
Figure 8. The molds were kept in the oven at 80ºC for 3 hours. These specimens were used
for initial screening on mass loss calorimeter and for dispersion analysis. Few small
specimens were cast for TEM analysis. TEM was used to evaluate the degree of dispersion of
nanoclay in the resin.
Figure 8: Silicone molds used to cast neat resin coupons for initial screening and for TEM analysis

27
Initial Screening: Mass Loss on Resin Coupons
The standard mass loss testing was performed according to ASTM E2102. A Mass
Loss Calorimeter was calibrated to flux of 35 kW/m2. The neat resin specimen (0.0 wt %)
exploded at surface on 55th sec of the experiment as shown in Figure 9. It was dangerous and
unsafe to proceed with testing. Also, the results of mass loss data were useless since material
was losing mass due to explosion and not burn. The phenolic resin used in this research is
water-based. This explosion was probably due to residue water remained in the specimen. It
was attempted to modify procedure: the specimens were further cured at 80ºC for 6 hours.
This would remove all moisture from material. The test was repeated, but still neat resin
coupons exploded. Therefore, it was decided to carry mass loss tests on reinforced
composites and skip initial screening.
Figure 9: Mass loss calorimeter test on neat resin coupon

28
Nanomodifications of Phenolic Resin
Blending of Nanoclay using High Shear Mixer
High shear (HS) mixer was the first of two techniques used for blending nanoclay into
phenolic resin. HS mixing is a very effective technique to disperse solid nanoparticles in
liquid polymer resins. Koo and coworkers have successfully used high-shear mixing
techniques to incorporate carbon nanotubes, layered silicates, nanosilicas, carbon nanofibers,
and POSS to form polymer nanostructured materials in several of their research programs
(Koo, 2006). Layered silicates, carbon nanofibers, and POSS were incorporated separately
into resole phenolic using high-shear, non-sparking paint mixing equipment to form different
polymer nanocomposites (Patton, Pittman, Wang, Hill, & Day, 2002) (Koo, Pilato, &
Wissler, 2007). Previous study indicates that, shear rate is in the order of 45,000 to 110,000 s-
1 provides good mixing in terms of intercalation and exfoliation of nanoclays (Cheng, 2006).
HS Mixer (IKA® Labor Pilot 2000/4) with a DR module was used in this research. This
mixer was previously used for successful dispersion and exfoliation of nanoclays in phenolic
resin (Tate, Kabakov, Koo, & Lao, 2009). It has three generators (stator and rotor together
are known as generator), two medium and one fine. The motor speed is controlled using
digital controller by changing motor frequencies. Shaft speed depends on the belt drive that
connects motor and shaft. As per manufacturer’s data, the radial (grinding) gap between
stator and rotor is fixed to 0.2 mm. The diameter of rotor (D) was 57mm. Shaft speed
determines the shear rate. Table 4 shows relationships between motor and shaft speed;
circumferential speed and shear rate. Previous study indicates that, shear rate is in the order
of 45,000 to 110,000 s-1 provides good mixing in terms of intercalation and exfoliation of

29
nanoclays (Koo, 2006). It was found that there is no recirculation that occurs if the frequency
of the motor is set lower than 35 Hz.
Table 4: High Shear Mixer’s Shear Rates
Motor Freq. (Hz)
Motor Speed (RPM)
Shaft speed (n)
(RPM)
Circumferential speed (Dn) (m/s)
Shear rate (circumferential speed/
grinding gap) (s-1)
0 0 0 0.000 0 10 600 1221 3.645 18223
20 1200 2536 7.570 37849 24 1440 3057 9.126 45632 30 1800 3848 11.486 57429 40 2400 5153 15.381 76906 50 3000 6455 19.268 96338 60 3600 7768 23.187 115935
In this research, 25-minute mixing at 40 Hz frequency was used which provided a
shear rate of about 76,906 s-1. Cooling jackets on mixing chamber and hopper were used to
avoid thermal curing of resin. Only the resin - without a catalyst - was mixed with nanoclay
in the high shear mixer. Phenolic resin was mixed in batches with nanoclay in three different
proportions: 2.5, 5.0, and 7.5% by weight.
High shear mixer was used for blending nanoclay into phenolic resin. Only the resin
(no catalyst) was mixed with nanoclay in the high shear mixer. The first batch of resin with
2.5 wt% of nanoclay was mixed for 50 min at 50 Hz frequency that gave shear rate of 96,338
sec-1. Since Cellobond® J2027L is a resole resin; it can cure simply by heating. During the
mixing in the high shear mixer, temperature of the resin rose to approximately 90ºC and
thermal curing occurred. Resin was solidified in the various parts of mixer such as stator,
rotor, and pipes. The arrangement of setup is displayed in Figure 10. Therefore, high shear

30
viscosity parameters needed to be modified. The thermal curing study was performed in
order to modify the high shear mixing procedure as explained in the next section.
Figure 10: High shear mixer without cooling jackets
In the modified procedure, the water cooling system was used both on the mixing
chamber and on hopper. Figure 11 display cooling lines on high shear mixer. The motor
frequency and mixing time were reduced to 40 Hz and 25 min, respectively. The temperature
of the resin and the mixing chamber was constantly monitored with IR thermometer. The
temperature was maintained below 50ºC.
31
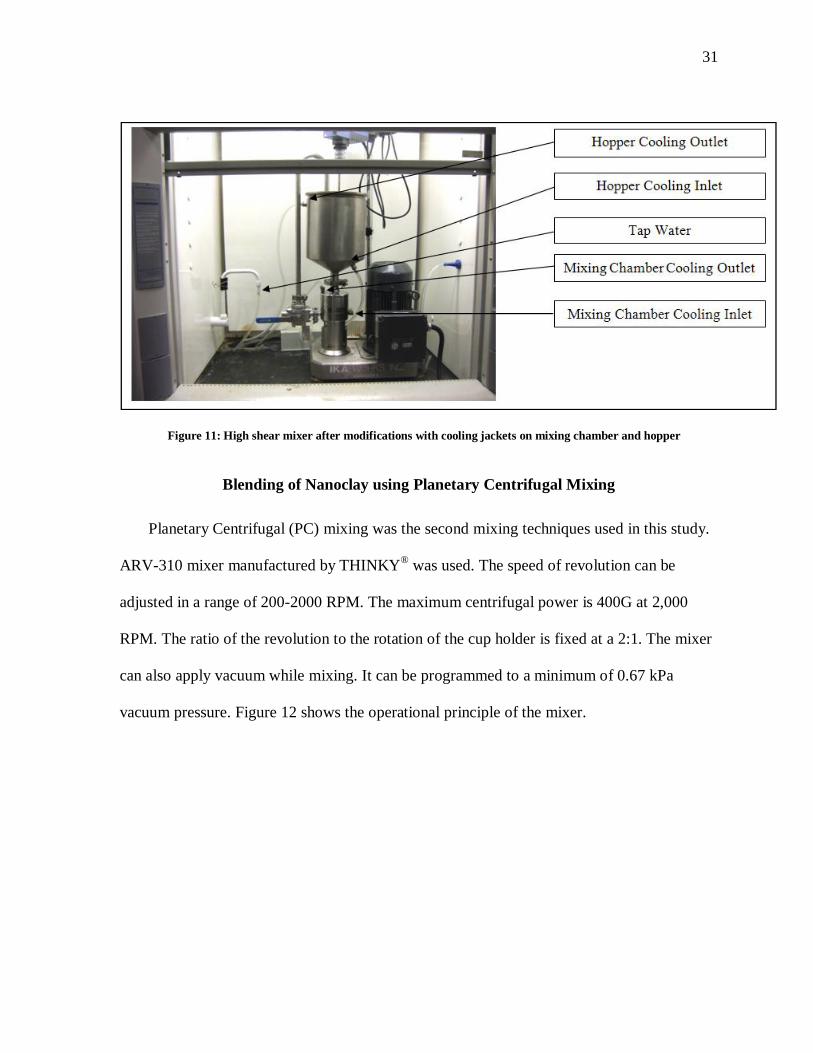
Figure 11: High shear mixer after modifications with cooling jackets on mixing chamber and hopper
Blending of Nanoclay using Planetary Centrifugal Mixing
Planetary Centrifugal (PC) mixing was the second mixing techniques used in this study.
ARV-310 mixer manufactured by THINKY® was used. The speed of revolution can be
adjusted in a range of 200-2000 RPM. The maximum centrifugal power is 400G at 2,000
RPM. The ratio of the revolution to the rotation of the cup holder is fixed at a 2:1. The mixer
can also apply vacuum while mixing. It can be programmed to a minimum of 0.67 kPa
vacuum pressure. Figure 12 shows the operational principle of the mixer.

32
Figure 12: The material container rotates and revolves in air or vacuum pressure at high speed. The
centrifugal power reaches to 400G force at highest speed (Courtesy of THINKY®)
PC mixers are simple in use. It provides uniform stirring during rotation and revolution,
concurrent defoaming and deaeration. These abilities are very critical for manufacturing of
FR polymer nanocomposites because it allows to eliminate voids and to produce quality
materials. The mixer was used to mix nanoclay with uncatalyzed resin and later to mix resin
with catalyst.
PC mixers can successfully disperse nanoclay in polymer resin but should not be able to
exfoliate platelets of nanoclay because it provides only a small amount of shearing force. The
nanoclay was not expected to be exfoliated in this study. The nanoclay was used in the same
weigh percentage as was with high shear mixer. Phenolic resin was mixed in batches with
nanoclay in 3 different loadings: 2.5, 5.0, and 7.5% by weight. Because of mixer’s limitations
only up to 150 mL of resin could be mixed at a time. The resin was mixed in batches right
before VARTM process. Nanoclay was added to uncatalyzed resin in a container and placed
in the mixing chamber. Table 5 shows the details of the mixing procedure. Since the resin is
water-based, vacuum pressure was kept above water vapor pressure. It should be noted that
temperature of resin rises to about 35°C after 2 min of mixing.

33
Table 5: Mixing Procedure for Mixing Nanoclay with Phenolic Resin Using Planetary Centrifugal Mixer
Speed Pressure Time Premixing (Step 1) 750 RPM 55 kPa 10 sec Final Mixing (Step 2) 2,000 RPM 55 kPa 2 min
The mixer was also used to mix resin with acid catalyst for all nanocomposites.
Nanomodified resin was mixed with 5.75% by weight (5% by volume) catalyst and mixed in
mixer for about 30 seconds at 2000 RPM and 55 kPa.
VARTM Process: Nanocomposites Manufacturing
All composites panels were manufactured using Vacuum Assisted Resin Transfer
Molding (VARTM) process. The resin was mixed at room temperature with catalyst in
planetary centrifugal mixer with vacuum of 55 kPa and infused at RT under 50 kPa. After
full infusion, composites were heated to 70ºC for 1 hour and kept under vacuum for 6 hours.
Composites were demolded after 12-16 hours. The edges of panel were trimmed and panel
was post cured at 80ºC for 3 hours. Panels were visually inspected for any defects such as dry
spots, discoloration, and surface voids. Fiber volume fraction of these panels was measured
using density method and found to be 0.45 ± 0.05.
Figure 13: VARTM process setup inside an oven before impregnation

34
Mass Loss Calorimeter Tests on Nano-modified Phenolic / E-Glass Composites
Fire Testing Technology (FTT) Mass Loss Calorimeter was used to evaluate
flammability properties of nanocomposites (Figure 14). FTT Mass Loss Calorimeter is an
inexpensive stand alone instrument that enables mass loss rates to be determined at any heat
flux in the range of the cone calorimeter model of ISO 5660.
Figure 14: Mass loss calorimeter setup
Mass loss testing was performed according to ASTM E2102 with flux of 35 kW/m2. The
heat flux was calibrated with a fluxmeter. The fluxmeter resistance which corresponds to this
flux was 6.1 mΩ. On the day of the testing, this heat flux corresponded to 550° C. According
to the standard, the exposed surface’s area should be square of 100 cm2. The specimen holder
had a top cover with standard open area. The specimens were held 25 mm below base of the
cone. The temperature of the cone remained constant and was controlled by a digital
controller and thermocouples. The data was manually collected every 10 seconds. Four
Cone Calorimeter
Thermocouple
Specimen Holder
Balances

35
specimens were tested for control panel (control panels contain no nanoparticles) and for PC
panels. Only one specimen was tested in HS categories (Figure 15). Right after the test, it
was noted that materials burn differently depending on loading of nanoparticles (Figure 16).
Figure 15: Composite specimens before testing with 0, 2.5, 5, and 7.5wt% nanoclay loading (left to right)
Figure 16: Composite specimens after testing at 0, 2.5, 5, and 7.5wt% nanoclay loading (left to right)
Mechanical Testing
Universal testing system MTS 810 was used to perform, collect, and analyze
mechanical tests. Specimens were cut using abrasive cutting water jet to avoid delaminations
and for consistency of geometries. Nanocomposites were tested according to following
ASTM standards. All tests were conducted in the displacement control mode with a rate
specified in the appropriate ASTM standard. Table 6 shows number of specimens in each
category. All the tests were performed according to the ASTM standards discussed below.

36
Table 6: Number of Test Samples in Each Category
Mixing Technique N/A High Shear Planetary Centrifugal Loading 0% 2.5% 5.0% 7.5% 2.5% 5.0% 7.5% Flexure 5 5 6 6 6 6 6 Short Beam 5 6 5 5 5 5 5 Compression 6 4 6 4 6 4 4 Tension 6 2 0 0 6 5 5 Mass Loss Calorimeter 4 1 1 1 4 4 4
Note: N/A – Not Applicable
Flexure tests were performed according to ASTM D 790 titled “Standard Test
Methods for Flexural Properties of Unreinforced and Reinforced Plastics and Electrical
Insulating Materials” to evaluate flexural strength and flexural modulus. Flexural properties
are dependent on both fiber reinforcement and matrix.
Short Beam tests were performed according to ASTM D 2344 titled “Standard Test
Method for Short-Beam strength of Polymer Matrix Composite Materials and their
Laminates” to evaluate interlaminar shear strength (ILSS). ILSS is major of fiber/matrix
adhesion and matrix dominant property. Low ILSS leads to poor bond between two layers,
delamination, and splitting of laminates. This test was chosen to evaluate effect of
nanomodification on interlaminar shear properties.
Compression tests were performed according to ASTM D 6641/D 6641M titled
‘Standard Test Method for Determining the Compressive Properties of Polymer Matrix
Composite Laminates Using a Combined Loading Compression (CLC) Test Fixture.’ This
test method determines the compressive strength and modulus properties of polymer matrix
composite materials.
Static tensile tests were performed according to ASTM D3039 titled “Standard Test
Method for Tensile Properties of Polymer Matrix Composite Materials.” The in-plane tensile
properties (viz.,) ultimate tensile strength (UTS or, Su), strain at UTS, and longitudinal tensile

37
modulus were evaluated. The axial strain was measured by an extensometer. Tensile strength
is fiber dominant property but matrix materials do have effect on tensile modulus and failure
strain.

38
III. RESULTS AND DISCUSSION
TEM Analysis: Exfoliation of Nanoclay after High Shear Mixing
Figures 17, 18, 19 display TEM images for high shear mixing of 2.5, 5, and 7.5 wt.%
loadings, respectively. TEM confirmed a good degree of exfoliation and dispersion of
nanoclay for all the coupons (Tate, Kabakov, Koo, & Lao, 2009). Based on TEM analyses,
the best nanoclay dispersion (mixture of interrelated and exfoliated states) in the phenolic
resin was observed in the 5wt% loading. For 7.5wt% loadings, stacks of nanoclays were
observed in the TEMs with unit bars of 100 and 50nm. It would be considered that nanoclays
are in an intercalated state in the phenolic resin.
Figure 17: TEM images of 2.5 wt.% loading of nanoclay after high shear mixing. Image is 800X800 nm

39
Figure 18: TEM images of 5.0 wt.% loading of nanoclay after high shear mixing. Image is 1600X1600 nm
Figure 19: TEM images of 7.5 wt.% loading of nanoclay after high shear mixing. Left image is 800X800 nm; right
image is 400X400 nm
SEM/EDS Analysis of Dispersion and Exfoliation
SEM was used to understand the morphology of nanoclay after different processes.
Small samples of nanomodified resin were fully cured and SEM/EDM analysis was

40
conducted at the Faulkner Nano Science and Technology (NST) facility of the University of
Texas at Austin. Hitachi S-5000 SEM was used to analyze dispersion of nanoclay in phenolic
resin. This SEM has a resolution of 0.4 nm at 30 kV (Hitachi High Technology Europe,
2010). The purpose of this analysis was to compare dispersion of nanoclay using different
mixing techniques.
A sample of resin was randomly selected. Samples with flat surfaces were selected
for analysis and attached to standard specimen holder of Hitachi S-5000. Specimens were
coated with silver in physical deposition chamber for 20 seconds. Then, they were analyzed
in SEM at beam voltage of 30 kV. This instrument also performs energy-dispersive X-ray
spectroscopy (EDS).
Nanomodified polymers were inspected in order to evaluate the degree of dispersion
of nanoclay. HS and PC samples were compared and was concluded that both mixing
techniques uniformly disperse clay, but the HS method provides better exfoliation.
In order to understand morphology of nanoclay, some of the areas were analyzed with
energy-dispersive X-ray spectroscopy. Figure 20 shows typical nanoclay particle in an
intercalated state and its spectroscopy. This particle is sodium rich – blue on the image. This
confirms that the particle is most likely nanoclay. The smallest dimension of this particle is
about 500 nm. Similar particles were found in all nanomodified polymers. The larger
particles appear to consist of many tightly bound tactoids, which align to form ellipsoidal
shaped agglomerations (Figure 21 and Figure 22).

41
(a) (b)
Figure 20: (a) Sodium (Na) presence (blue) at area of interest confirms that the particle is Cloisite® Na+ nanoclay; (b)
SEM image of a particle
Dispersion after High Shear Mixing
HS is superior mixing method for platy nanoclays. In this research after 25 min of
mixing at shear rate of 77,000 s-1, the nanoclay were observed in mix of intercalated and
exfoliated state and were uniformly dispersed in the matrix. Particles of small size were
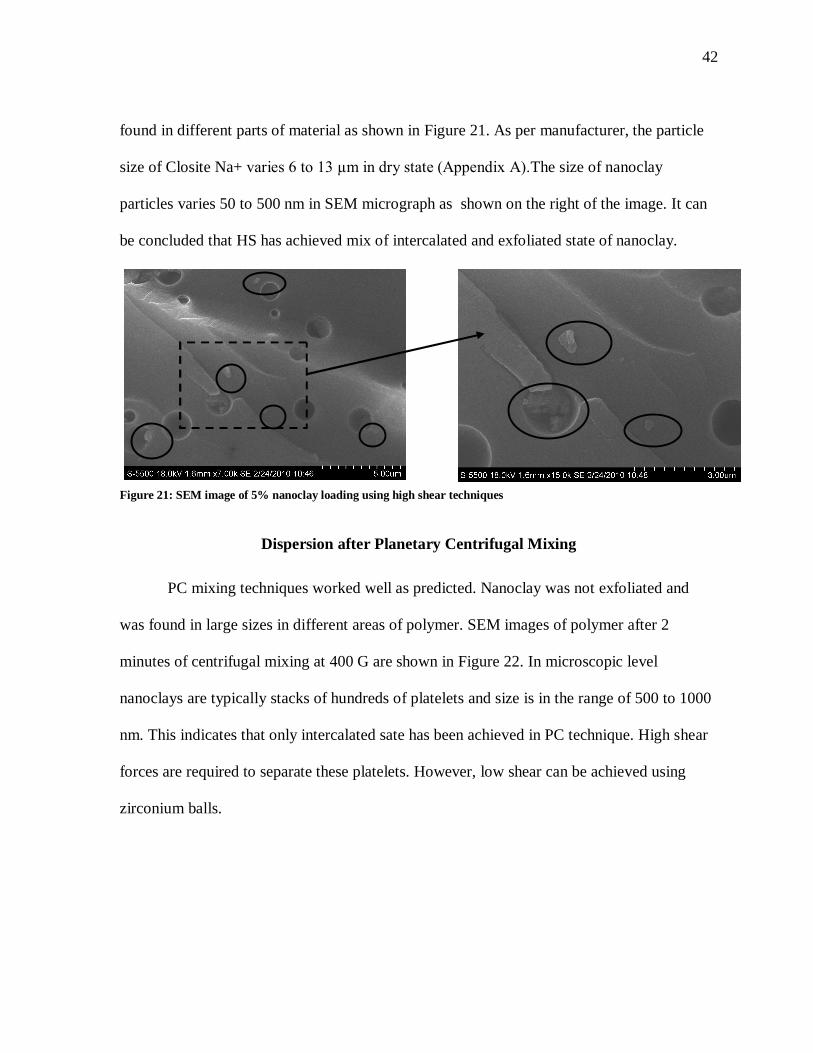
42
found in different parts of material as shown in Figure 21. As per manufacturer, the particle
size of Closite Na+ varies 6 to 13 µm in dry state (Appendix A).The size of nanoclay
particles varies 50 to 500 nm in SEM micrograph as shown on the right of the image. It can
be concluded that HS has achieved mix of intercalated and exfoliated state of nanoclay.
Figure 21: SEM image of 5% nanoclay loading using high shear techniques
Dispersion after Planetary Centrifugal Mixing
PC mixing techniques worked well as predicted. Nanoclay was not exfoliated and
was found in large sizes in different areas of polymer. SEM images of polymer after 2
minutes of centrifugal mixing at 400 G are shown in Figure 22. In microscopic level
nanoclays are typically stacks of hundreds of platelets and size is in the range of 500 to 1000
nm. This indicates that only intercalated sate has been achieved in PC technique. High shear
forces are required to separate these platelets. However, low shear can be achieved using
zirconium balls.

43
Figure 22: SEM image of 5% nanoclay loading using planetary centrifugal mixing
Mass Loss Calorimetry: Mass Remaining Analysis
Effects of increasing nanoclay concentration on the flammability properties (percent
mass remaining) are shown in Figure 23. Higher loading of nanoclay demonstrates higher
mass remaining after being exposed to 35 kW/m2 heat flux for 10 min. Higher the mass
remaining after 10 minutes of exposure, better are fire properties. These parameters of
experiment were selected based on recommendation from ASTM E2102. Similar test results
and trend were observed for HS and PC specimens. For HS composites mass remainder was
1.5% and 2.9% higher than control composites for 5.0wt% and 7.5wt% loading of nanoclay,
respectively. For PC composites mass remainder was 0.6% and 1.5% higher than control
composites for 5.0wt% and 7.5wt% loading of nanoclay, respectively. However, with 2.5
wt% loading of nanoclay mass remainder lowered compared to with both HS and PC
techniques. The possible explanation is quality of composite panels. In 2.5 wt% HS
composites, the nanoclay was mostly in intercalated state whereas for 5wt% and 7.5wt%
nanoclay was mix of intercalated and exfoliated state. The quality of dispersion might be
cause of drop in mass remainder for HS composites. In PC techniques mostly intercalated

44
state of nanoclay has been achieved. Secondly this technique might not provide good
distributive dispersion of nanoclay within polymer matrix domain. Therefore at 2.5wt%
performance might have drooped. Higher loadings provided more amount of nanoclay which
might have led to property improvement.
Figure 23: Percentage mass remaining after 10 min under 35 kW/m2 heat flux
Mass Remaining: High Shear Mixing
Figure 24 displays percentage mass loss with respect to time. It is observed that,
7.5wt% loaded specimen looses less mass which would exhibit better flammability
properties. Mass loss calorimeter tests were used for initial screening.
Figure 24: Mass loss calorimetry results for high shear specimens
84%85%86%87%88%89%90%91%92%93%
Control 2.5 HS 5.0 HS 7.5 HS 2.5 PC 5.0 PC 7.5 PC
Mas
s Rem
aini
ng,,
%
85
88
91
94
97
100
0 1 2 3 4 5 6 7 8 9 10 11
Mas
s Re
mai
ning
,, %
Time, min
0.0 %
2.5 %
5.0%
7.5 %

45
Mass Remaining: Planetary Centrifugal Mixing
Figure 25: Mass loss calorimetry results for centrifugal planetary mixer
Fiber reinforced composites manufactured with phenolic resin prepared by using PC
mixer performed slightly worse than high-shear composites (Figure 25). The best result was
obtained by composites with 7.5 wt% HS composites.. The 7.5 wt% PC composites were
second best after HS 7.5wt% and better than HS 5.0 wt% composites It is recommended that
wt% of nanoclay should be increased further to understand optimum level of loadings.
However there would be two concerns with higher wt% loading of nanoclay: increase in
viscosity of resin that would make VARTM processing difficult and decline in mechanical
properties as more locations of intercalated nanoclays would provide more stress riser
locations.
85%
88%
91%
94%
97%
100%
0 1 2 3 4 5 6 7 8 9 10 11 12
Mas
s Rem
aini
ng,,
%
Time , min
Control
2.5 Na+
5 Na+
7.5 Na+

46
Table 7: % mass remaining at 10 minutes of Mass Loss Test at 35 kW/m2
0 wt% 2.5 wt%` 5 wt% 7.5 wt% High Shear 89.0% (0.5)* 87.5% (N/A**) 90.5% (N/A) 91.9% (N/A) Planetary Centrifugal 89.0% (0.5) 87.3% (0.6) 89.6% (0.6) 90.5% (1.2)
Note: *standard deviation; **N/A – not available
Mechanical Testing
Composites were characterized in order to understand effect of dispersion on
mechanical performance. All test panels were manufactured using the same procedure.
Panels and test specimens were visually inspected for voids and dry fabric. Fiber volume
fraction of specimens was measured in order to confirm quality of panel. Fiber volume
fraction was in range of 0.49 ± 0.05. According to statistical analysis (shown in the later part
of the thesis), mechanical properties did not change. It means that nanomodifications do not
degrade these properties.
Flexural Test
Flexural test is a key parameter in evaluating performance of matrix (resin). Flexural
strength, strain, and modulus are matrix dependent properties. The following figures show
results of the tests (Figure 26). The standard specimen size of 100 mm X 13 mm was used.
Loading span was set to 80 mm and the loading rate to 2.0 mm/min. At 95% confidence
level, there is no strong statistical difference between mean values of flexural strength and
strains. Only flexural modulus significantly varies between categories. Control panel had the
lowest flexural modulus. That means that nanoclay makes material stiffer compare to the
base material.

47
(a)
(b)
Figure 26: Flexure test results: (a) Flexural strength, MPa; (b) Flexural modulus, MPa
Compression Test
Compression properties are matrix dominated properties. The test was conducted on
MTS 810 universal material testing system with compression fixture. Standard specimen size
for this fixture is 140 mm by 12 mm according to ASTM D6641. Gage length was kept the
same for all specimens at about 13 mm and the loading rate of 1.3 mm/min was applied. The
0
150
300
450
600
Control 2.5 HS 5.0 HS 7.5 HS 2.5 PC 5.0 PC 7.5 PC
Flex
ural
Str
engt
h, M
Pa
0.0
5.0
10.0
15.0
20.0
25.0
Control 2.5 HS 5.0 HS 7.5 HS 2.5 PC 5.0 PC 7.5 PC
Flex
ural
Mod
ulus
, GPa

48
test results can be found in Figure 27. Nanocomposites with 2.5% loading prepared by PC
had the highest compression strength. This composite showed 22% improvement compare to
the base material.
Figure 27: Compression test results: Compression strength, MPa
Interlaminar Shear Strength
The short-beam shear test is used to determine inter laminar shear strength (ILSS)
which is indicator of the fiber/matrix adhesion in the composite materials. The most
important aspects of the tests for these materials view shear as a peel phenomenon (shearing
along an adhesive plane). Short beam shear test is used as a quality control test of the
lamination process and related matrix-dominated properties of the composite. The specimen
span-to-thickness ratio is constrained to 4:1, forcing the shear stress to attain failure levels
before tension and compression stresses reach their ultimate values (Strong, 2008). This test
is similar to the flexure testing except that the sample-to-thickness ratio is much less and is
0
50
100
150
200
250
300
350
400
Control 2.5 HS 5.0 HS 7.5 HS 2.5 PC 5.0 PC 7.5 PC
Com
pres
sion
Stre
ngth
, MPa

49
approximately 4:1. These tests were performed according to ASTM D 2344/D 2344M. The
results are shown in Figure 28. Nanocomposites with 7.5% loading prepared by HS had
almost same ILSS as that of control while 2.5% PC composite had slightly better properties.
Figure 28: Short beam test results: ILSS, MPa
Tension Test
Tensile properties are reinforcement (fibers) dominated properties. Because all of the
composites used the same woven rowing E-glass and the same orientation of fibers,
significant differences in the results were not expected. According to ASTM D3039, standard
size specimens of 250 mm by 25 mm were cut along 0° fiber orientation. Then, the
specimens were inspected. Finally plastic tabs were adhesively bonded and specimens were
tested. Only samples in a few categories were tested and the results are shown in Figure 29:
Tension test results: (a) Ultimate Tensile Strength (UTS), MPa; (b) Tensile modulus,
GPaError! Reference source not found.. All of the test specimens failed in DGM
(Delamination at Gage area on the Middle) mode. Delamination occurs before other failures.
This indicates that the phenolic resin has low percent of elongation.
0
5
10
15
20
25
30
35
40
Control 2.5 HS 5.0 HS 7.5 HS 2.5 PC 5.0 PC 7.5 PC
ILSS
, MPa

50
(a)
(b)
Figure 29: Tension test results: (a) Ultimate Tensile Strength (UTS), MPa; (b) Tensile modulus, GPa
0
100
200
300
400
500
600
Control 2.5 HS 2.5 PC 5.0 PC 7.5 PC
UT
S, M
Pa
0
5
10
15
20
25
30
35
Control 2.5 HS 2.5 PC 5.0 PC 7.5 PC
Ten
sile M
odul
us, G
Pa

51
Table 8: Mechanical properties of HS Composites
0 wt% 2.5 wt% 5 wt% 7.5 wt% Tensile strength, MPa 444.29
(9.65)* 462.08 (3.15)
N/A** N/A
Tensile modulus, GPa 23.54 (1.52)
25.69 (0.77)
N/A N/A
Flexural strength, MPa 451.20 (25.93)
491.79 (34.37)
416.34 (49.97)
447.63 (59.65)
Flexural modulus, GPa 17.51 (1.13)
20.32 (0.85)
18.55 (0.62)
20.11 (1.40)
Compressive strength, MPa 270.03 (29.97)
299.44 (9.49)
253.08 (23.75)
319.23 (18.76)
Note: *standard deviation; **N/A – not available
Table 9: Mechanical properties of PC Composites
0 wt% 2.5 wt% 5 wt% 7.5 wt% Tensile strength, MPa 444.29
(9.65)* 472.95 (36.97)
512.74 (29.73)
499.76 (23.79)
Tensile modulus, GPa 23.54 (1.52)
23.79 (2.80)
28.13 (3.35)
27.73 (2.13)
Flexural strength, MPa 451.20 (25.93)
450.02 (35.22)
437.74 (172.68)
385.79 (58.97)
Flexural modulus, GPa 17.51 (1.13)
20.19 (1.12)
21.74 (1.31)
21.05 (1.074)
Compressive strength, MPa 270.03 (29.97)
330.48 (32.77)
307.96 (2.90)
278.12 (19.20)
Note: *standard deviation
Analysis of Variance
The major objective of this research was to improve flammability properties in cost-
effective way without deteriorating mechanical properties. PC mixing is an economical
method, while HS is more labor intensive. In order to evaluate significance of the result, one-
way analysis of variance (ANOVA) was performed at 95% confidence level (alpha 0.05)
using Palisade Stat Tools application for Microsoft Excel. ANOVA was performed for

52
different combinations of test groups in order to better compare and understand the effects of
mixing techniques and nanoclay concentration of mechanical properties. Differences between
the mean values are statistically significant if p-value is below 0.05. P-values were collected
and analyzed. Table 10 shows p-values for different properties and test groups. PC group
represent three different loadings mixed using planetary centrifugal mixer. HS group consists
of three loading mixed using high shear mixer. Control group is the base material without
nanomodifications. All represents results from the entire experiment, while n is the total
sample size.
Table 10: p-Values from ANOVA for Different Groups
n All PC and Control HS and Control PC and HS Flexural Strength 40 0.4805 0.6201 0.0942 0.4480 Flexural Modulus 40 0.0000 0.0001 0.0010 0.0009 Mass Remainder 15 NA 0.009 NA NA Note: In bold are p-value that are above or close to 0.05 significance level (n – total sample size, NA – not available)
Statistical analysis confirms that there are no significant differences between PC and
HS results for flexural strength (p-Value higher than 0.05). Flexural strength, one of the most
important matrix dominated properties, is statistically has no difference between control
material and nanomodified material. Most of the differences between mean values are
insignificant which means neither there is improvement nor loss in mechanical properties.
On the other hand, PC composites performed significantly better in mass loss test
compare to control material. The p-value calculated was only 0.009 (at alpha 0.05).

53
VI. CONCLUSIONS
Glass-reinforced phenolic nanocomposites were successfully manufactured using
low- cost VARTM process. Two different dispersion techniques were employed to uniformly
disperse nanoclay. Mass loss tests showed that nanoclay addition improves flammability
properties considerably at 5.0 and 7.5 wt.% loading. The major goal of the study was to
provide cost-effective method to manufacture nanocomposites that would improve
flammability properties without much sacrifice in mechanical properties. It is believed that
nanocomposites are the future of composites industry. Some nanocomposites have been
already used in mass production. Some of the challenges that manufacturers face in the
production of nanocomposites are expensive processing methods, high capital cost, quality
control, environmental and safety issues. Implementing cost-effective and high-efficiency
processing methods would be a key in bringing lab-based technologies into
commercialization.
Nanoclays are cheaper nanoparticles but are difficult to disperse uniformly in
polymer matrix. Exfoliation of nanoclays is critical because relatively large stacks of
nanoclays can become stress concentration points. Under mechanical loading micro cracks
can be initiated at these locations that will eventually propagate leading to premature failure.
It is difficult to achieve fully exfoliation state. Most of the mixing techniques would provide
a combination of exfoliation and intercalation. This research indicates that for improvement

54
of flammability property intercalation state is adequate. In this study, it is observed that high-
shear mixing is better technique to achieve exfoliation of Cloisite® Na+ nanoclay in phenolic
resin whereas planetary centrifugal mixing provided mostly intercalation state of nanoclay.
Using both techniques, significant improvement in flammability properties with addition of
7.5wt% of nanoclay was achieved. This improvement in flammability property does not
deteriorate other mechanical properties such as tension, flexure, compression, and ILSS.
High shear mixer, IKA® Labor Pilot 2000/4 with DR module, used in this study is
one of the most advanced models available on the market. It has very high shear rate.
However, this equipment is highly labor-intensive. There are difficulties in cleaning the
equipment associated with waste of material. High shear generates heat which can be a
problem with certain types of resins.
It can be concluded that cost-effective planetary centrifugal mixing can be used in
manufacturing nanocomposites if flammability property enhancement is a primary concern.
Planetary centrifugal mixer, such as ARV-310 by THINKY, can be used to successfully
disperse nanoclays in phenolic resin and improve flammability properties. We have
demonstrated this mixing method is significantly easier and faster than high shear method to
disperse nanoclays in a phenolic resin.

55
APPENDIX A: TECHNICAL DATA SHEETS

56

57

58
59
REFERENCES
Bahramian, A. R., & Kokabi, M. (2009). Ablation Mechanism of Polymer Layered Silicate
Nanocomposite Heat Shiel. Journal of Hazardous Materials (166), 445-454.
Bottcher, A & Pilato, L. A. (1997). 33 (3).
Bray, A. V., Beall, G., & Stretz, H. (2004). Nanocomposite Rocket Ablative Material.
Spicewood: Air Force Office of Scientific Research.
Callister, W. D. (2007). Materials Science and Engineering : An Introduction (7th ed.). John
Wiley & Sons.
Cheng, J. (2006). Polysyanate Ester/Small Diameter Carbon Nanotubes Nanocomposite
(Master's thesis). Austin: University of Texas.
Choi, M. H., & Chung, I. J. (2003). Mechanical and Thermal Properties of Phenolic Resin-
Layered Silicate Nanocomposite Synthesized by Melt Intercalation. Journal of
Applied Polymer Science, 90, 2316-2321.
Hitachi High Technology Europe. (2010, February 1). S-5500. (Hitachi) Retrieved February
1, 2010, from Hitachi High Technology Europe GmbH: http://www.hht-
eu.com/cms/5149.html
Horsch, S., Serhatkulu, G., Gulari, E., & Kannan, M. R. (2006). Supercritical CO2
Dispersion of Nano-Clays and Clay/Polymer Nanocomposites. Polymer (47), 7485-
7496.

60
Kobayasi, N. (2007). Introduction to Nanotechnology. (L. N. Patrikeeva, Ed., & L. V.
Chachoyan, Trans.) Moscow, Russia: Binom.
Koo, J. H. (2006). Polymer Nanocomposites: Processing, Characterization, and
Applications. New York: McGraw-Hill.
Koo, J. H., Pilato, L. A., & Wissler, G. E. (2007). Polymer Nanostructured Materials for
Propulsion Systems. (K. Wurster, Ed.) Journal of Spacecraft and Rockets.
Krishnamoorti, R. (2001). Polymer Nanocomposites: Synthesis, Characterization, and
Modeling. In R. A. Vaia (Ed.), ACS Symposium Series 804. Washington, DC: ACS.
Mazumdar, S. K. (2002). Composites Manufacturing: Materials, Product, and Process
Engineering . Boca Raton, Florida: CRC Press.
McConnell, V. (2010, February 5). Composite World. Retrieved February 21, 2010, from
Composite world.com: http://www.compositesworld.com/articles/resin-systems-
update-the-greening-of-thermosets
MDA Composites. (2009, march 4). Retrieved October 1, 2010, from MDA Composites:
http://www.mdacomposites.org
Nanotechnology Consumer Products Inventory. (2009, November 22). Retrieved November
22, 2009, from Nanotechnology - Project on Emerging Nanotechnologies:
http://www.nanotechproject.org/inventories/consumer/
Patton, R. D., Pittman, C. U., Wang, L., Hill, J. R., & Day, A. (2002). Ablation, Mechanical
and Thermal Conductivity Properties of Vapor Grown Carbon Fiber/Phenolic Matrix
Composites. Composites , Part A (33), 243-251.

61
Pilato, L., Koo, J., Wissler, G., & Lao, S. (2008). A Review - Phenolic and Related Resins
and Their Nanomodification Into Phenolic Resin FRP System. Journal of Advanced
Materials, 40, 5-16.
Pinnavaia, T. J. (2000). Polymer-Clay Nanocomposites. (G. W. Beall, Ed.) New York: John
Wiley & Sons.
Ray, S. S., & Okamoto, M. (2003). Polymer/Layered Silicate Nanocomposites: A Review
From Preparation to Processing. Progress in Polymer Science (28), 1539-1641.
Schartel, B., Weib, A., Srurm, H., Kleemeier, M., Hartwig, A., Vogt, C., et al. (2010).
Layered Silicate Epoxy Nanocomposites: Formation of the Inorganic-Carbonaceous
Fire Protection Layer. Polymers Advanced Technologies.
Seemann, W. H. (1990). Patent No. 4,902,215. United States of America.
Seemann, W. H. (1994). Patent No. 5,316,462. United States of America.
Strong, A. B. (2008). Fundamentals of Composites Manufacturing. Dearborn, Michigan,
United States of America: Society of Manufacturing Engineers.
Tang, X., & Whitcomb, J. D. (1999). Progressive Failure Behaviours of 2D Woven
Composites. Composite Materials.
Tate, J. S., Kabakov, D., Koo, J. H., & Lao, S. (2009). Nanomodified Phenolic/E-Glass
Composites. SAMPE. Baltimore.
Tate, J. S., Kelkar, A. D., & Whitcomb, J. D. (2006). Effect of Braid Angle on Fatigue
Performance of Biaxial Braided Composites. International Journal of Fatigue, 1239-
1247.
Thomasnet. (2008, January 13). Retrieved October 1, 2010, from www.thomasnet.com:
http://ww.thomasnet.com

62
Thostenson, E. T., Li, C., & Chou, T.-W. (2005). Nanocomposites in Context. Composites
Science and Technology (65), 491-516.
Varley, R. J., Groth, A. M., & Leong, K. H. (2008). The Role of Nanodispersion on the Fire
Peroformance of Organoclay-Polyamide Nanocomposite. Composite Science and
Technology (68), 2882-2891.
Yeh, M.-K., Tai, N.-H., & Lin, Y.-J. (2009). Mechanical Properties of Phenolic-Based
Nanocomposites Reinforced by Multy-Walled Carbon Nanotubes and Carbon Fiber.
Composites , Part A (39), 677-684.
Zac-Williams, A. (2006). Fatigue Behavior of 45 Degrees Fiberglass Braided Composites.
(THESIS). North Carolina Agricultural and Technical State University.

VITA
Dmitri Kabakov was a Graduate Research Assistant at Texas State University-San
Marcos. He grew up in Russia, but moved to Israel at a young age. In Israel, he graduated
from high school with honors and served in the army. He has been an athlete for 19 years and
holds the Israeli national record in heptathlon. He received his BS degree in Manufacturing
Engineering at Texas State and is currently pursuing an MS degree in Industrial Technology.
His research interests include nanomodified composite materials, nano-safety, and
manufacturing. He is active members of SME and SAMPE, participated in light-bridge
building competitions and was a finalist of the International Student Symposium at the
SAMPE 2010 ISSE, Seattle, WA in May 2010.
Contact Info: [email protected] This thesis was typed by Dmitri Kabakov