Embed Size (px)
Citation preview

i iciuum > - i i > LUIIUIHI
Doc. # 136
- 1 • I1
A HYDROGEOCHEMICAL INVESTIGATION OF INORGANIC CONSTITUENTS
IN SURFACE WATER AND GROUND WATER IN THE VICINITY OF A II
DISPOSAL SITE IN CLARK COUNTY, OHIO 4z
A thesis submitted in partial fulfillmentof the requirements for the degree of
Master of Science
By
LORI HOOSEB.S., Waynesburg College, 1982
1987Wrieht State universitv
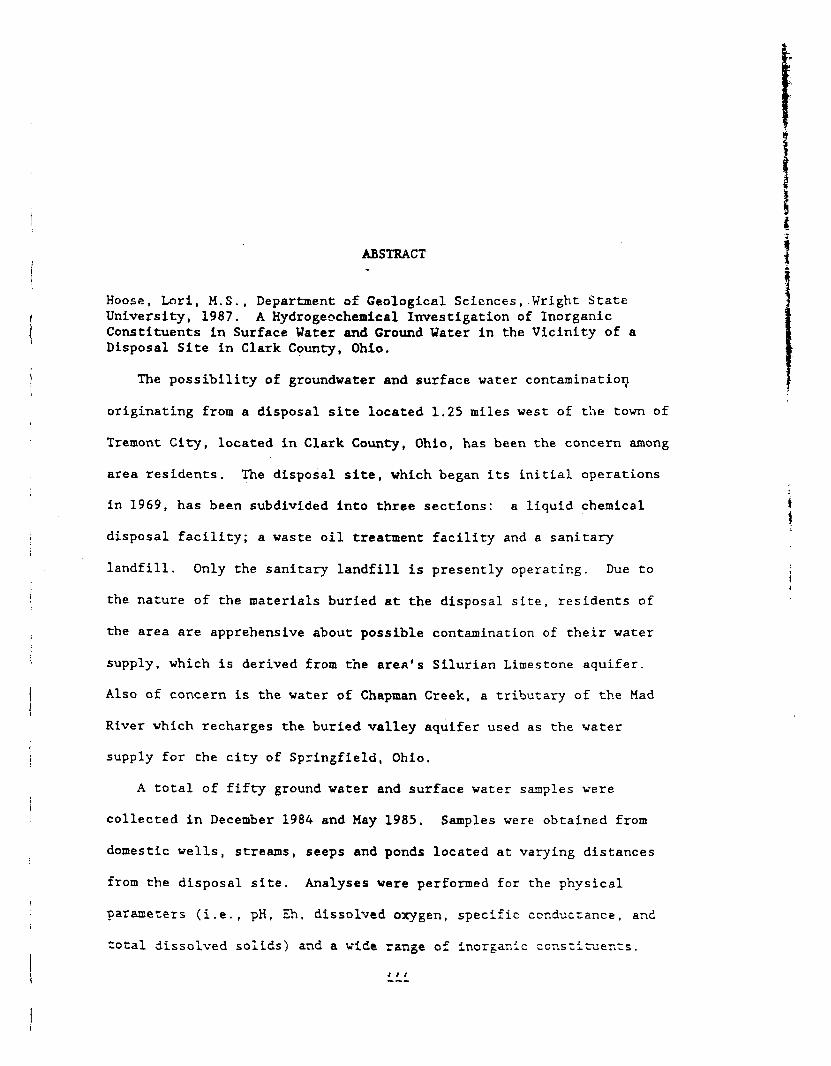
ABSTRACT
Hoose, Lori, M.S., Department of Geological Sciences, Wright StateUniversity, 1987. A Hydrogeochemical Investigation of InorganicConstituents in Surface Water and Ground Water in the Vicinity of aDisposal Site in Clark County, Ohio.
The possibility of groundwater and surface water contamination
originating from a disposal site located 1.25 miles west of the town of
Tremont City, located in Clark County, Ohio, has been the concern among
area residents. The disposal site, which began its initial operations
in 1969, has been subdivided into three sections: a liquid chemical
disposal facility; a waste oil treatment facility and a sanitary
landfill. Only the sanitary landfill is presently operating. Due to
the nature of the materials buried at the disposal site, residents of
the area are apprehensive about possible contamination of their water
supply, which is derived from the area's Silurian Limestone aquifer.
Also of concern is the water of Chapman Creek, a tributary of the Had
River which recharges the buried valley aquifer used as the water
supply for the city of Springfield, Ohio.
A total of fifty ground water and surface water samples were
collected in December 1984 and May 1985. Samples were obtained from
domestic wells, streams, seeps and ponds located at varying distances
from the disposal site. Analyses were performed for the physical
parameters (i.e., pH, Eh, dissolved oxygen, specific conductance, and
total dissolved solids) and a wide range of inorganic constituents.

ABSTRACT (continued)
Groundwater samples from sampling sites 9 and 11, located in
proximity to the eastern border of the disposal site, contain high
concentrations of Ca, Mg, Ni, Fe, Zn, Pb, Ba, K, Cl, N03, SOA,
HCC^, TDS and high values of specific conductivity, in comparison to>
background samples. This is evident in both sampling periods. The
samples from site 11 are at or above the EPA drinking water standards
for Pb, Cd and Fe concentrations.
The surface water sample from site CC, along the disposal sitesI
western border, contains high concentrations of Ca, Fe, Mn, HCO^ and
SO^. Along Chapman Creek at site 3, in the December sampling period,
elevated values of Ca, Fe, K, Mg, Mn, Na, Ni, N03, Si02, S04,
specific conductivity and TDS are present in comparison to samples
taken upstream.
In comparing the samples taken from proximity to the disposal site
with background samples, it is evident that the disposal site has had
an impact on the area's natural water, but to what extent cannot be
determined without further studies on the geology and water chemistry
of the area.

TABLE OF CONTENTSI
Page |
INTRODUCTION . . . . . . . . . . 1 . . . . . . . . . . . . . . . . 1. |i
Location . . . . . . . . . . . . . . . . . . . . . . . . . . . . 1
Geography . . . . . . . . . . . . . . . . . . . . . . . . . . . 1
The Disposal Site and Its History . . . . . . . . . . . . . . . A*
Tremont Landfill Company . . . . . . . . . . . . . . . . . . . 4
IWD Liquid Waste, Inc. . . . . . . . . . . . . . . . . . . . . 6
Chemical Waste Management . . . . . . . . . . . . . . . . . . . 6
Geologic Histroy . . . . . . . . . . . . . . . . . . . . . . . . 7
Local Geology . . . . . . . . . . . . . . . . . . . . . . . . . 8
Bedrock . . . . . . . . . . . . . . . . . . . . . . . . . . . 8
Glacial Deposits . . . . . . . . . . . . . . . . . . . . . . . 10
Hydrogeology . . . . . . . . . . . . . . . . . . . . . . . . . . 11
Purpose and Scope of Study . . . . . . . . . . . . . . . . . . . 13
PREVIOUS INVESTIGATIONS . . . . . . . . . . . . . . . . . . . . . 14
GEOCHEMICAL METHODS AND TECHNIQUES . . . . . . . . . . . . . . . . 16
Sample Collection . . . . . . . . . . . . . . . . . . . . . . . 16
Sample Analysis . . . . . . . . . . . . . . . . . . . . . . . . 17
Error Calculations . . . . . . . . . . . . . . . . . . . . . . . 18
Sample Locations . . . . . . . . . . . . . . . . . . . . . . . . 19
RESULTS AND DISCUSSION . . . . . . . . . . . . . . . . . . . . . . 25
Physical Parameters . . . . . . . . . . . . . . . . . . . . . . 25
Specific Conductivity . . . . . . . . . . . . . . . . . . . . 25

TABLE OF CONTENTS (CONTINUED)
Page
Total Dissolved Solids . . . . . . . . . . . . . . . . . . . . 32
pH . . . . . . . . . . . . . . . . . . . . . . . . . . . . . . 36•
Eh . . . . . . . . . . . . . . . . . . . . . . . . . . . . . . . 36 fts
Dissovlved Oxygen . . . . . . . . . . . . . . . . . . . . . . 41 fiMajor Constituents . . . . . . . . . . . . . . . . . . . . . . . 41
Bicarbonate . . . . . . . . . . . . . . . . . . . . . . . . . 41
Calcium . . . . . . . . . . . . . . . . . . . . . . . . . . . 46
Chloride . . . . . . . . . . . . . . . . . . . . . . . . . . ' . 50
Magnesium . . . . . . . . . . . . . . . . . . . . . . . . . . 53
Nitrate . . . . . . . . . . . . . . . . . . . . . . . . . . . 56
Potassium . . . . . . . . . . . . . . . . . . . . . . . . . . 59
Sodium . . . . . . . . . . . . . . . . . . . . . . . . . . . . 62
Sulfate . . . . . . . . . . . . . . . . . . . . . . . . . . . 65
Minor Constituents . . . . . . . . . . . . . . . . . . . . . . . 68
Barium . . . . . . . . . . . . . . . . . . . . . . . . . . . . 68
Boron . . . . . . . . . . . . . . . . . . . . . . . . . . . . 71
Cadmium . . . . . . . . . . . . . . . . . . . . . . . . . . . 74
Chromium . . . . . . . . . . . . . . . . . . . . . . . . . . . 77
Cobalt . . . . . . . . . . . . . . . . . . . . . . . . . . . . 80
Copper . . . . . . . . . . . . . . . . . . . . . . . . . . . . 83
Iron . . . . . . . . . . . . . . . . . . . . . . . . . . . . . 86
Lead . . . . . . . . . . . . . . . . . . . . . . . . . . . . . 89
Manganese . . . . . . . . . . . . . . . . . . . . . . . . . . 92
vi
TABLE OF CONTENTS (CONTINUED) ft
Page <
Nickel . . . . . . . . . . . . . . . . . . . . . . . . . . . . 95 I»
Silica . . . . . . . . . . . . . . . . . . . . . . . . . . . . 93 f*
Strontium . . . . . . . . . . . . . . . . . . . . . . . . . . . 98 t
Zinc . . . . . . . . . . . ~ . . . . . . . . . . . . . . . . . 101 ti
Total Organic Carbon (TOC) . . . . . . . . . . . . . . . . . . 104 j
Sunnnary of Results . . . . . . . . . . . . . . . . . . . . . . . 108
Comparison of Fall versus Spring Analysis. . . . . . . . . . . . 110
Chemical speciation using WATEQF . . . . . . . . . . . . . . . ' . Ill '
Water Quality . . . . . . . . . . . . . . . . . . . . . . . . . 112
Environmental Impact of the Disposal Site . . . . . . . . . . . 115
CONCLUSION . . . . . . . . . . . . . . . . . . . . . . . . . . . . 119 j
REFERENCES . . . . . . . . . . . . . . . . . . . . . . . . . . . . 128
vii

LIST OF FIGURES
Figure , Page
1 Study Area Location Map . . . . . . . . . . . . . . . . . 2
2 Disposal Site Location . . . . . . . . . . . . . . . . . 3
3 Disposal Site Subdivisions . . . . . . . . . . . . . . . 5
4 Sampling Site Locations . . . . . . . . . . . . . . . . . 21
5a Specific Conductance - December 1984 Sampling Period . . 30
5b Specific Conductance - May 1985 Sampling Period . . . . . 31
6a Total Dissolved Solids - December 1984 Sampling Period . 34
6b Total Dissolved Solids - May 1985 Sampling Period . . . . 35
7a pH - December 1984 Sampling Period . . . . . . . . . . . 37
7b pH - May 1985 Sampling Period . . . . . . . . . . . . . . 38
8a Eh - December 1984 Sampling Period . . . . . . . . . . . 39
8b Eh - May 1985 Sampling Period . . . . . . . . . . . . . . 40
9a Dissolved Oxygen - December 1984 Sampling Period . . . . 42
9b Dissolved Oxygen - May 1985 Sampling Period . . . . . . . 43
lOa Bicarbonate - December 1984 Sampling Period . . . . . . . 44
10b Bicarbonate - May 1985 Sampling Period . . . . . . . . . 45
lla Calcium - December 1984 Sampling Period . . . . . . . . . 48
lib Calcium - May 1985 Sampling Period . . . . . . . . . . . 49
12a Chloride - December 1984 Sampling Period . . . . . . . . 51
12b Chloride - May 1985 Sampling Period . . . . . . . . . . . 52
viii
LIST OF FIGURES
(continued)
Figure Page
13a Magnesium - December 1984 Sampling Period . . . . . . . . 54
13b Magnesium - May 1985 Sampling Period . . . . . . . . . . 55
14a Nitrate - December 1984 Sampling Period . . . . . . . . . 57
14b Nitrate - May 1985 Sampling Period . . . . . . . . . . . 58
15a Potassium - December 1984 Sampling Period . . . . . . . . 60
15b Potassium - May 1985 Sampling Period . . . . . . . . . . 61t
16a Sodium - December 1984 Sampling Period . . . . . . . . . 63
16b Sodium - May 1985 Sampling Period . . . . . . . . . . . . 64
17a Sulfate - December 1984 Sampling Period . . . . . . . . . 66
17b Sulfate - May 1985 Sampling Period . . . . . . . . . . . 67
18a Barium - December 1984 Sampling Period . . . . . . . . . 69
18b Barium - May 1985 Sampling Period . . . . . . . . . . . . 70
19a Boron - December 1984 Sampling Period . . . . . . . . . . 72
19b Boron - May 1985 Sampling Period . . . . . . . . . . . . 73
20a Cadmium - December 1984 Sampling Period . . . . . . . . . 75
20b Cadmium - May 1985 Sampling Period . . . . . . . . . . . 76
21a Chromium - December 1984 Sampling Period . . . . . . . . 78
21b Chromium - May 1985 Sampling Period . . . . . . . . . . . 79
22a Cobalt - December 1984 Sampling Period . . . . . . . . . 81
22b Cobalt - May 1985 Sampling Period . . . . . . . . . . . . 82
23a Copper - December 1984 Sampling Period . . . . . . . . . 84
23b Copper - May 1985 Sampling Period . . . . . . . . . . . . 85
24a Iron - December 1984 Sampling Period . . . . . . . . . . 87
24b Ircr. - May 1955 Sampling Period . . . . . . . . . . . . . 88

LIST OF FIGURES
(continued)
Figure Page
25a Lead - December 1984 Sampling Period . . . . . . . . . . . 90
25b Lead - May 1985 Sampling Period . . . . . . . . . . . . . 91
26a Manganese - December 1984 Sampling Period . . . . . . . . 93
26b Manganese - May 1985 Sampling Period . . . . . . . . . . . 94
27a Nickel - December 1984 Sampling Period . . . . . . . . . . 96
27b Nickel - May 1985 Sampling Period . . . . . . . . . . . . 97i
28a Silica - December 1984 Sampling Period . . . . . . . . . . 99
28b Silica - May 1985 Sampling Period . . . . . . . . . . . . 100
29a Strontium - December 1984 Sampling Period . . . . . . . . 102
29b Strontium - May 1985 Sampling Period . . . . . . . . . . . 103
30a Zinc - December 1984 Sampling Period . . . . . . . . . . . 105
30b Zinc - May 1985 Sampling Period . . . . . . . . . . . . . 106
31 Total Organic Carbon . . . . . . . . . . . . . . . . . . . 107

LIST OF TABLES
Table Page
1 Generalized Section of the Consolidated Rocks in
Clark County . . . . . . . . . . . . . . . . . . . . . . 9
2 Sampling Site Descriptions . . . . . . . . . . . . . . . . 23
3a Field Measurements and Anion Concentrations ,
December 1984 Sampling Period . . . . . . . . . . . . . 26
3b Concentrations of Cations in mg/1
December 1984 Sampling Period . . . . . . . . . . . . . 27
4a Field Measurements and Anion Concentrations
May 1985 Sampling Period . . . . . . . . . . . . . . . . 28
4b Concentrations of Cations in mg/1
May 1985 Sampling Period . . . . . . . . . . . . . . . . 29
5 Drinking Water Standards . . . . . . . . . . . . . . . . . 113
xi

ACKNOWLEDGMENTS
I wish to express my appreciation and thanks to the many people who
made the completion of ny thesis"possible. I would first like to
express special thanks to Dr. Paul Pushkar for the guidance and moral
support he has given me throughout my thesis work, and for his
friendship. I also thank my committee members, Dr. Galen Kenoyer and
Dr. Ken Kramer for their patience and help, and Dr. Ronald Schmidt for
giving me the original idea for my thesis.
For all the assistance given to me in my analytical and field work
I thank: Brent Huntsman and the Brehm Research Lab for the use of
their equipment and analytical knowledge; the Argonne National
Laboratories for the use of their ion chromatograph and Florence
Williams for her humor and assistance; Mark Rickertsen, Dan Fenno and
John Pavlik for their much needed assistance with my field work and for
making the days amusing. A special thank you Is extended to the
Department of Geological Sciences and all the friends I made during my
stay at Wright State.
To Laura Kaffenbarger, CF/WATER, and the citizens of Tremont City,
Ohio, I extend my appreciation and thanks. Without them,, this thesis
would not have been possible. A special thanks to Laura, who showed me
Just how far a dream and some determination can take someone. To
Marnee Hathaway I say thanks for everything, for typing this paper and
xii
being a friend. To my husband, Randy, I extend my love and gratitude,
for always being there when I need him and for being my friend.
Throughout the writing of this thesis I have had love, support and
guidance from my family. I thank them for being so patient with me;
Bruce, David, Marsha and especially Mom, I love you!
Finally, I wish to thank Kar"en and all the people who helped me
learn to live one day at a time.
xili

DEDICATION
To the memory of my Father,
Leonard Venner
xiv

( - INTRODUCTIONII
Location
The area of study surrounds a disposal site, located in the northeast
, section of German Township, Clark County, Ohio (Figure 1). It is bound byI
latitude 40"00e30" to 40'02'00" and longitude 83°53'00" to 83°50'00n. The
area includes portions of section 17, 11, 10, 23 and 16 of the Urbana West
7.5' quadrangle. The nearest settlement is the small town of Tremont City
with a population of approximately 400 people, located 1.25 miles east of
the disposal site (Figure 2). The city of Springfield, with a population
of 75,000 people, is located three miles southeast of the area of
investigation.
The disposal site, which is the focal point of the investigation, is
located on the north side of Snyder-Domer Road, 1.25 miles west of Tremont
City. The entire site includes 80 acres of land.
Geography
The entirety of Clark County is within the Till Plains Region of
the Central Lowlands Physiogeographic Province (Pirkle and Yoho,
1977). The area of study is located among the rolling hills of a
glaciated upland terrain. It is bounded and drained by two streams:
Storms Creek to the north and Chapman Creek to the south (Figure 2).
Both streams drain to the east-southeast and are tributaries of the Mad
River, located directly east. The Mad River flows past the City of
Sprinrfiald. rsch rzir.g the city's well field. Elevations range from
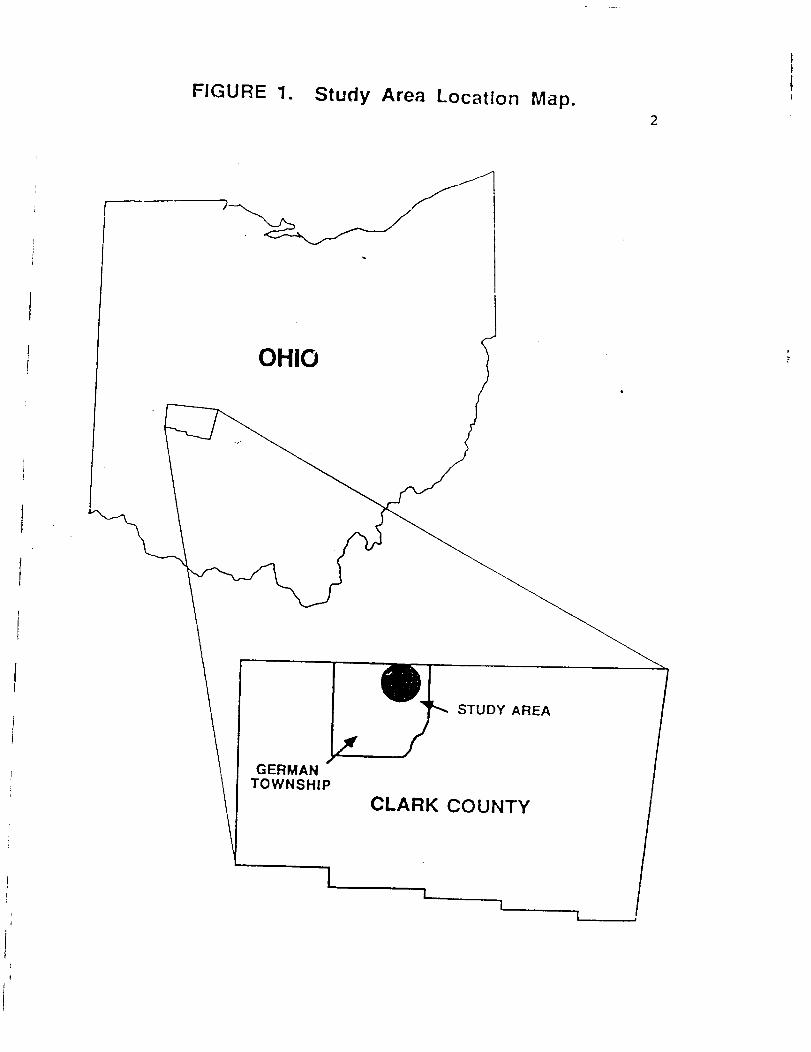
FIGURE 1. Study Area Location Map.
GERMANTOWNSHIP
CLARK COUNTY

FIGURE 2. DISPOSAL SITE LOCATION
li? • P."f:U7- ;*7TBr«
#• \F: :05? v • ' I/A.' ^^ i&^$% fe.^...i.- r,(>?>N/ s.-.Tt -'vyV;?'-«.:-5^C^;l:.ffl.lfe^^^StJfW--!^ *%«,»/ . ^S^SsiyiiaiB^h 'bi '• ^-f'L-^-'-L ':--•••-•?..**.iIBil'W i> .-.-.-.- —— •- —— -../.
Jl,4
4
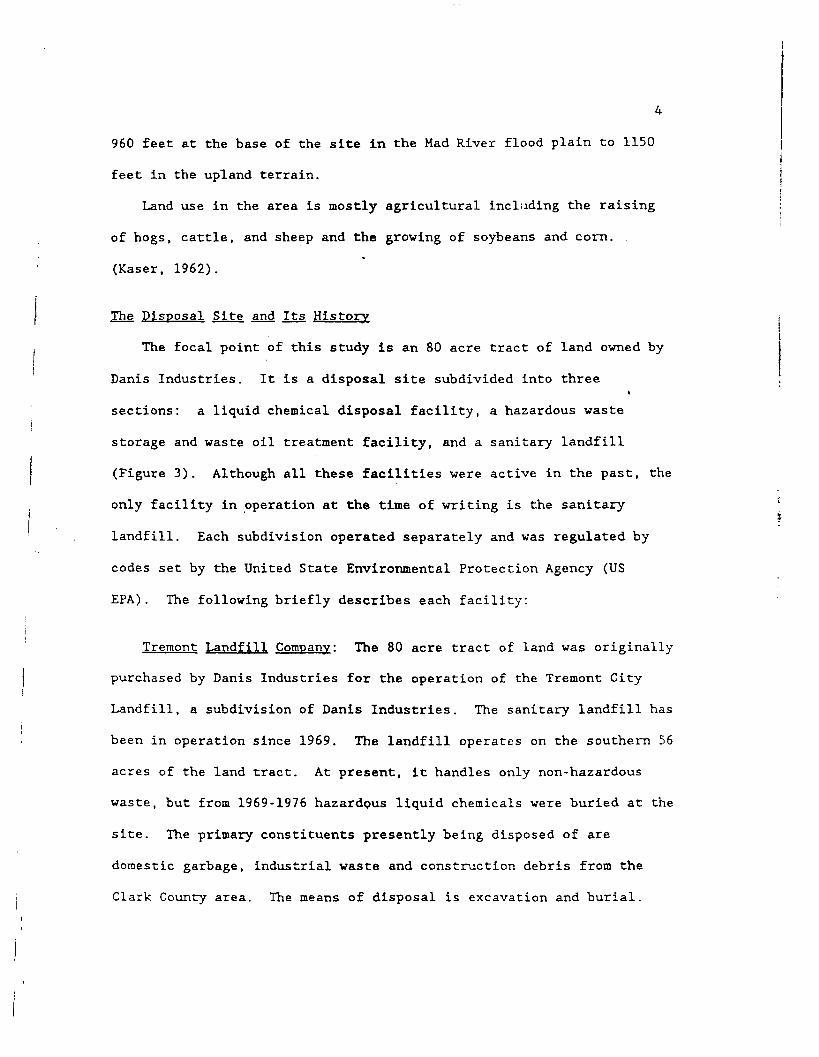
960 feet at the base of the site in the Mad River flood plain to 1150
feet in the upland terrain.
Land use in the area is mostly agricultural including the raising
of hogs, cattle, and sheep and the growing of soybeans and corn.
(Kaser, 1962).
The Disposal Site and Its History
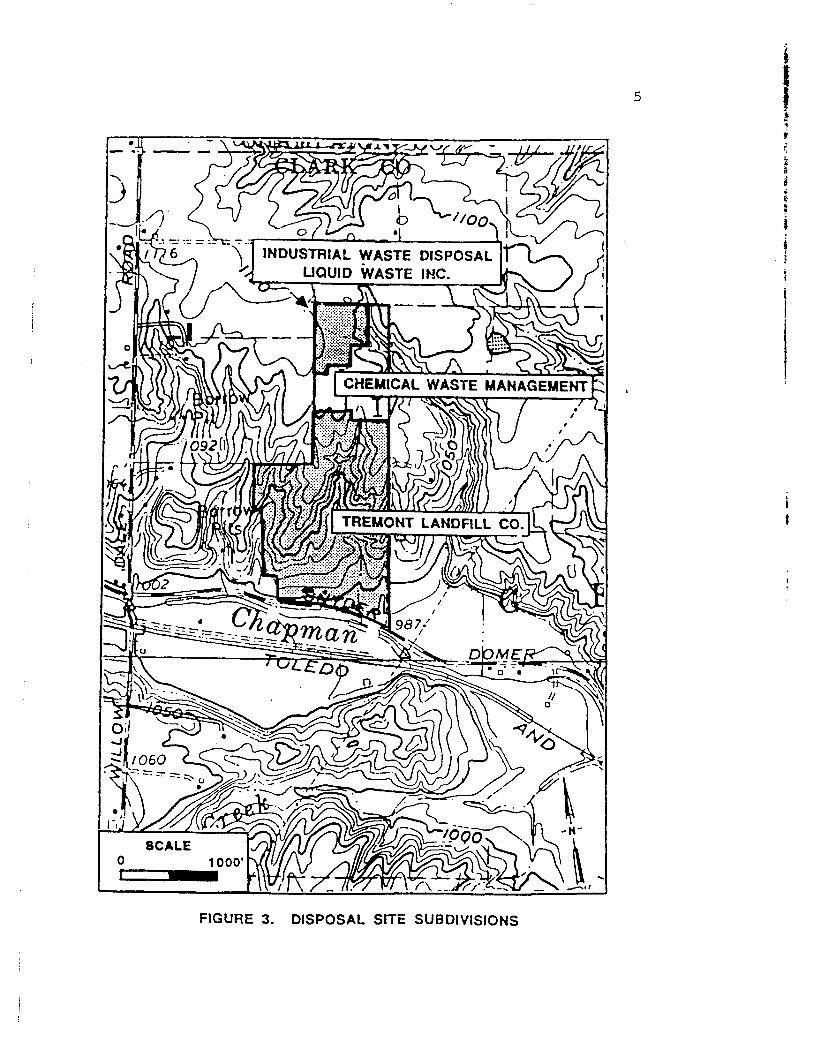
The focal point of this study is an 80 acre tract of land owned by
Danis Industries. It is a disposal site subdivided into three4
sections: a liquid chemical disposal facility, a hazardous waste
storage and waste oil treatment facility, and a sanitary landfill
(Figure 3). Although all these facilities were active in the past, the
only facility in operation at the time of writing is the sanitary
landfill. Each subdivision operated separately and was regulated by
codes set by the United State Environmental Protection Agency (US
EPA). The following briefly describes each facility:
Treniont Landfill Company: The 80 acre tract of land was originally
purchased by Danis Industries for the operation of the Tremont City
Landfill, a subdivision of Danis Industries. The sanitary landfill has
been in operation since 1969. The landfill operates on the southern 56
acres of the land tract. At present, it handles only non-hazardous
waste, but from 1969-1976 hazardous liquid chemicals were buried at the
site. The primary constituents presently being disposed of are
domestic garbage, industrial waste and construction debris from the
Clark County area. The means of disposal is excavation and burial.
INDUSTRIAL WASTE DISPOSALLIQUID WASTE INC.
CHEMICAL WASTE MANAGEMENT
TREMONT LANDFILL CO
FIGURE 3. DISPOSAL SITE SUBDIVISIONS

6
IWD Liquid Wasce. Inc.: In 1976, 8.5 acres of land was acquired by
Danis Industries from the northern portion of the Tremont Landfill
Company, and used as a liquid chemical disposal facility. This was
operated by Industrial Waste Disposal (IWD) Liquid Waste, Incorporated,
a subdivision of Danis Industries. This facility was in operation from
1976 to early 1980. The following constituents are known to have been
disposed of at this facility: Polyol, glues, adhesives, paint sludges,
asbestos slurry, polymerized resin scrap (phenolic), metal sludges andt
still bottoms (Ohio EPA, 1973). Some of these constituents are
classified as hazardous waste.
All materials buried at the facility were encapsulated in metal
drums and disposed of in cells excavated into the glacial till. After
each cell was filled, it was covered with the excavated till. Two to
three cells were open at any one time to segregate incompatible wastes.
In the summer of 1977, a liquid farming project was implemented on
the site. This involved the injection of waste margarine into the
soil, with aeration of the soil two to three times a day. This
practice continued through 1984.
Chemical Waste Management
In 1978, Danis Industries began the operation of a waste oil
treatment facility on a 15 acre parcel of land, north of the sanitary
landfill. In March 1980, this land and facility was sold to Chemical
Waste Management, Incorporated (CWM). CWM continued its operation
until it was sold back to Danis Industries in early 1985. This land
also served as a hazardous waste storage facility. When this practice
7
began is not clear, but it continued through 1984. Waste not suitable f\for the liquid chemical disposal facility was stored at this site until «
»
enough drums were accumulated for transfer to a proper disposal £i«
facility. . k
The waste oil treatment facility processed approximately 900,000 i
gallons of waste oil annually. The final product was sold to asphalt y
plants as fuel. Oil processed was Industrial waste oils primarily from
auto manufacturers and metal processors.I
Geologic History
During the Paleozoic era, Ohio was covered with a succession of
shallow seas which deposited what is now the bedrock of Clark County.
While these rocks were being deposited, a regional uplift was taking
place to the west. This uplift is a tectonic feature known as the
Cincinnati Arch. It is a northward plunging arch whose axis passes
through western Ohio in a north-south direction. To the south, the
axis passes just west of Cincinnati and continues south into Kentucky.
In the Paleozoic era, the last of the shallow seas receded and
erosion proceeded to destroy much of the deposited sediments. The
Mesozoic era was a period of stream erosion and deposition for the Ohio
region, which continued into the Tertiary Period.
During the Pleistocene epoch, glaciation altered the Ohio landscape
significantly. Prior to this, Clark County and much of the surrounding
area were part of the Teays River drainage system, the principle river
in northeastern North America. It flowed northwest through Ohio,
passing through eastern Clark County and exiting the county in the area
jusz east of German Township (Mcrris, 1932). The river system was
eliminated by a Pre-Illinoian ice sheet which dammed the river in the
region northwest of Clark County. Subsequent glaciations served to
fill in the entire drainage system with alluvium and till. During the
last of these glacial cycles, the Wisconsin, the Miami and Scioto lobes>
of the ice sheet formed in the west central Ohio region as the ice
front passed over the highlands north of Champaign County, near
Bellfontaine, Ohio. During the late Wisconsin period (23,000 - 10,000
B.P.). the Miami and Scioto lobes advanced and retreated over west•
central Ohio several times (Dreimanis, 1973). These fluctuations are
evidenced by the alternating till and gravel layers throughout the
ground moraine of west central Ohio.
After the final glacial retreat, two types of deposits remained,
till and outwash. In the Clark County area, the deposits occur in the
form of ground moraine, end moraines, outwash, and valley train
deposits left by glacial meltwaters (Norris, 1952).
Local Geology
Bedrock - The rocks that underlie the area of study are Ordovician
and Silurian carbonates with minor amounts of shale (Table 1). The
Silurian carbonates compose most of the bedrock of Champaign County
(Neese, 1978). Silurian rocks of the Brassfield formation and Niagara
underlie the glacial drift in Clark County (Norris, 1952). Included in
the Niagara group are the Cedarville and Springfield limestones, porous
dolomitic limestones believed to underlie the area of study.
The rocks underlying the Silurian carbonates are the Richmond,
Maysville, and Eden groups of Ordovician age. This is a thick sequence
of fine-textured calcareous shales with thin lavers of crystalline
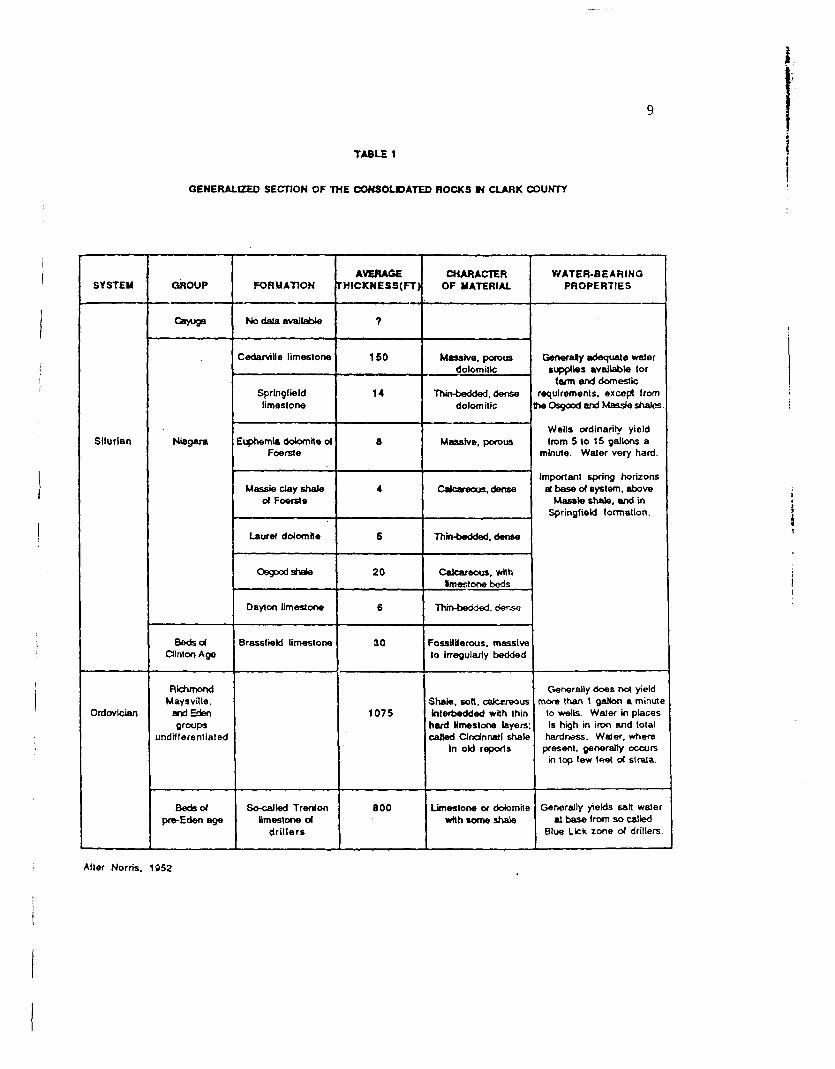
TABLE 1
GENERALIZED SECTION OF THE COKSOLDATED ROCKS M CLARK COUNTY
SYSTEM
Silurian
Ordovician
GROUP
Cayuga
Niagara
Beds ofClinton Age
RichnxxxlMaysville.
and Edengroups
undifferentiated
Beds ofpre-Eden age
FORMATION
No data available
Cedarville limestone
Springfieldlimestone
Euphemia dolomite otFoerste
Massie clay shaleot Foerste
Laurel dolomite
Osgood shate
Oayton limestone
Brassfield limestone
So-called Trertonlimestone of
drillers
AVERAGEHICKNESS(FT)
?
150
14
8
4
5
20
6
30
1075
SOO
CHARACTEROF MATERIAL
Massive, porousdolomillc
Thin-bedded, densedolomilic
Massive, porous
Calcareous, dense
Thin-bedded, dense
Calcareous, withImestooe beds
Thin-bedded, dense
FossiWerous, massiveto Irregularly bedded
Shale, soft, calcareoustnterbedded with thinhard limestone layerscalled Cincinnati shale
In old reports
Limestone or dolomitewith come shale
WATER-BEARINGPROPERTIES
Generally adequate walersupplies available for
farm and domesticrequirements, except from
the Osgood and Massie shales.
Wells ordinarily yieldIrom 5 to 1 5 gallons a
minute. Water very hard.
Important spring horizonsat base of system, above
Massie shale, and inSpringfield formation.
Generally does not yieldmore than 1 gallon a minute
to wells. Waler in placesIs high in iron and total
hardnoss. Water, wherepresent, generally occurs
in top few feet of strata.
Generally yields salt waterat base from so called
Blue Lick rone of drillers.
Alter Morris. 1952
10
limestone (Norris, 1952).
Glacial Deposits - The glacial deposits in the study area consist I|
almost entirely of ground moraine. This includes thick sequences of "
glacial till with interbedded lenses of sorted sands and gravel. Well i;'
logs indicate the thickness of the till is greater than 100 feet in the s3
upland portion of the study area.
Glacial outwash deposits were laid down in then existent meltwater
stream valleys and consist of well-sorted sand and gravel. The Mad
River, located east of the study area, flows through an extensive
outwash deposit. Valley train deposits exist under the strearabed of
f Chapman's Creek near Tremont City (Norris, 1952).t
Detailed hydrogeologic studies have been conducted on two of the
three subdivisions within the disposal site: the Tremont City Landfill
and the liquid chemical disposal facility. The studies were performed
, by H. Eagon (1984 a & b), the hydrogeologist at the disposal site. The
till underlying the disposal site is described by Eagon (1984a) as a
! sandy pebbly till with low to moderate plasticity. He infers four
major till zones underlying the disposal site: 1) an upper layer of
brown weathered till, 10 to 20 feet thick, 2) the underlying upper
i unoxidized grey till, approximately 30 feet thick, 3) a sandy intertill
zone, of varying thickness and 4) the lower dense grey till with a
maximum known thickness of 35 feet (Eagon, 1984a). Throughout the till
zones, continuous and discontinuous sand and gravel seams are present.i
Logs from monitoring wells at the disposal site have been used to
i construct cross sections in an attempt to located and determine the
extent of these sand and gravel seams, but the data are insufficient to
trace each seam accurately, a common problem in glaciated terrain
, 'Hanoi:. 198 a and 19

11The upper unoxidizeci grey till is observed in well logs from the
liquid chemical disposal facility, located in the upland portion of the
disposal site. It is also observed in the northern portion of the
sanitary landfill, but extensive excavation in the southern portion
leaves no evidence of this till zone. The sandy intertill zone is
observed in well logs from both facilities, supporting the belief that
it is an extensive continuous sand seam.
The lower grey till is again present in well logs from the liquid4
chemical disposal facility, but well depths are not sufficient to
determine its thickness. More information supplied by the well logs
indicates extensive sand and gravel seams throughout the lower grey
till zone. In the eastern third of the sanitary landfill, well logs
denote sand and gravel seams being thinner and fewer with till being
more abundant. These sand and gravel seams thicken to the southwest
and towards the southern border of the disposal site. These seams are
believed to lie directly on the bedrock in the southern most portion of
the site (Eagon, 1984b).
Studies conducted by graduate students in the Department of
Geological Sciences, Wright State University in the vicinity of the
disposal site emphasize the discontinuous nature of the till and sand
zones of this area (Clause, personal communication, 1985).
Hvdrogeology
Clark County has two principal groundwater sources: the valley
train and glacial outwash deposits of the Mad River Valley, and the
limestone bedrock underlying the glacial drift.

12
In the area of investigation, water is obtained from the Silurian
limestones of the Niagara group and sand and gravel deposits that rest
on the bedrock. The limestone aquifer, consisting of massive porous
limestones and dolomites, produces adequate water supplies for domestic
and farm use (Norris, 1952). The glacial drift covering the bedrock is
considered a poor water source, though some domestic wells located in
the thicker sand and gravel seams have obtained adequate supplies.
Laboratory permeability tests on till samples from the Liquid*
Chemical Disposal Facility disclosed permeabilities of 10"7 to 10"8
cm/sec. This is an average permeability for glacial tills (Eagon,
1984b).
Understanding groundwater flow patterns is essential to a water
quality study. Groundwater in the vicinity of the disposal site is
believed to flow in a south-southeast direction (Eagon, 1984a & b).
This would conform to the topography around the disposal site, which is
located on a hillside sloping to the south-southeast. Surface water
from the disposal site flows into Chapman Creek through a drainage pipe
along its southern border. Topography within the site has been altered
significantly due to excavation practices, and drainage ditches have
been emplaced to direct runoff water to the discharge pipe. Surface
water in the northern portion of the disposal site drains into the
intermittent stream flowing east of the disposal site.
Groundwater migration in the glacial till in and around the
disposal site is a concern of the citizens in the area due to the
possibility of contaminant migration offsite. Many of the sand seams
encountered in drilling operations are saturared (Eagon, 1954 a Q b).
13 5Due to the low permeability of the glacial till, Eagon believes that i
vertical migration of groundwater is non-existent. Instead, any *f
seepage into the till layers would migrate laterally along sand seams , |
resulting in seeps along the ravine cut by the intermittent stream or ;:-
the ravine on the west side of the oanitary landfill (Eagon, 1984 a & jI
b) . Since the sand seams within the till are discontinuous in many 1i
areas (Clause, personal communication, 1985), it is believed by the
author that the possibility of vertical migration of groundwater cant
not be discarded.
Purpose and Scope of Study
The disposal site located on Snyder-Domer Road has been the cause I
of concern to the residents of Tremont City and the surrounding area. «
Concerns of the citizens include: odor complaints, the discovery of 30
buried tanks in the sanitary landfill containing unknown wastes, the !
discharge of runoff water from the disposal site into Chapman Creek,
and the possibility of the migration of contaminants from the disposal
site into the local groundwater (CF/WATER, 1985).
The purpose of this study is to survey the geochemistry of ground-
water and surface water in the area surrounding the disposal site. It
is a preliminary study designed to examine water quality at various
distances from the site to determine if there has been any degradation
of the natural waters .
Geochemical interpretation of data collected from two separate
sampling periods is used to delineate trends in concentrations of
individual constituents in the waters.

PREVIOUS INVESTIGATIONS
The hydrology of Clark County was first studied by Fuller and Clapp
(1912) in an investigation of underground waters of southwestern Ohio.(1 A later study by W. Stout et al. (1944) discusses the hydrology of
Clark County and changes in surface drainage patterns due to
glaciation. A detailed study of the water resources of the county
I including depth-to-bedrock measurements was conducted by Norris et al.
(1952). Kaser (1962) investigated groundwater resources of the Eagle
City area northwest of Springfield, approximately two miles south of
the study area.
Geologic investigation of Clark County include a study of the
I glacial geology by Goldthwait (1959) and several geophysical studies.i
Spicer (1949) conducted an electrical resistivity investigation toI! determine depth to bedrock. Richard (1969) has used gravity
i measurements to delineate river valleys buried by till in the Clark
County area. Contrino (1973) expanded on Richard's study using seismic
; refraction ar.d gravity measurements.
Two hydrogeologic assessments have been conducted by Eagon (1984a,
1984b) on two subdivisions of the disposal site: the liquid chenical
disposal facility and the Tremont City Landfill. These are detailed
studies of the geology, hydrology and water quality of the disposal
site. Ongoing water quality studies are being conducted by the Ohio
EPA and Danis Industries at the disposal site.ij Students of the Department of Geological Sciences, Vright State
University, have completed or are in the process of completing studies

15
of the disposal site. These studies Include: a more extensive water
quality study (Dorinda Clause), a geophysical Investigation (Smith,
1986) and a hydrogeochemical modelling study (Herin, 1986).
Griffen and Shimp (1978) and Cartwright, et al. (1977) have studied
metal attenuation through glacial clays in areas similar in character-
istic to that of this study. These studies discuss the effect of
various clays on municipal landfill leachates.

GEOCHEMICAL METHODS AND TECHNIQUES
Sample Collection !I
Fifty water samples, comprising two sets of samples, were collected i
from 13 domestic wells, two streams, three ponds, and one spring in the jj
study area. The first set of 24 samples was collected in early !
December, 1984; the second set of 26 samples in mid-May, 1985. The two I
collection periods were chosen to observe any seasonal variations in '
groundwater and stream water chemical concentrations.
Groundwater samples were obtained from domestic wells and one
spring. Well selection was determined by the proximity to the disposal
site and the availability of well logs. Domestic wells located at '
varying distances up to 1.2 miles from the disposal site were sampled
for background chemical data. Well logs were obtained from the Ohio
Department of Natural Resources and the Clark County Health Department,
where available, and are presented in Appendix I.
At each sampling site, samples were collected in tvo 12.5 ml and
one 500 ml polyethelene bottles for alkalinity and total dissolved
solids, anion concentration, and cation concentration, respectively.
The bottles were cleaned by soaking in concentrated nitric acid,
rinsing with double quartz-distilled and exchanged water and air drying
in an oven.
All stream samples were taken near the center of the stream to
obtain representative samples. With few exceptions, groundwater
santplss from domestic wells were obtained from the outside tap located
closest to the well head, ensuring as little effect as possible from

17
household pipes. Water was run for approximately five to ten minutes
before collection to obtain a representative sample from the aquifer.
All samples were filtered in the field through a .45 micror. nucleopore
filter and care was taken to ensure minimal contact with the
atmosphere. Samples for cation analysis were preserved by
acidification with concentrated hydrochloric acid after filtration.
All samples were refrigerated until analysis.
•Sample Analysis
Water and air temperature, dissolved oxygen, specific conductance,
Eh and pH were measured at the sampling site, immediately after
sampling and filtering. Instruments used were; the model PEL pH - Eh
meter by the Sargent-Welch Scientific Company, the YSI model 33
Specific Conductivity meter and the YSI model 57 Oxygen meter.
Alkalinity was determined in the laboratory by potentiometric
titration the same day as the collection. Each sample was preserved by
refrigeration until analysis. pH was re-determined in the lab as a
check against the field measurement.' Total dissolved solids
determination was conducted on an unacidified filtered volume of sample
according to standard procedures (APHA et al., 1976).
Anion determination was conducted approximately three months after
sample collection at Argonne National Laboratories in Argonne,
Illinois. Filtered samples were preserved by refrigeration until
analysis. Anions determined include fluoride, chloride, sulfate,
nitrate. Analysis was performed on a Dionex Ion Chromatograph at
Argonne National Laborarory. Bicarbonate was determined by converting
18
alkalinity data Co milligrams of calcium carbonate per liter. This was
then divided by 0.8202 for conversion to an equivalent concentration of
bicarbonate (HCO-j-) (Hem, 1970).
Total Organic Carbon (TOC) vas determined only on the second
sampling set. Borosilicate glass bottles with teflon-lined caps vere
used to collect the samples and analysis vas completed within 24 hours
of collection. The Dohrmann Environtech Total Organic Carbon Analyzer
in the Brehm Environmental Sciences Laboratory was used.
Cations were analyzed using a Perkin-Elmer 3030 Atomic Absorption
Spectrophotometer. Samples were filtered and acidified with
concentrated HCL in the field to a pH<2 to keep all constituents in the
dissolved state. Cations analyzed were: Barium, Boron, Cadmium,
Calcium, Chromium, Cobalt, Copper, Iron, Lead, Magnesium, Manganese,
Nickel, Potassium, Silica, Sodium, Strontium, Titanium, and Zinc.
Standard procedures were used according to APHA et al., 1976 and the
Perkin-Elmer 3030 Atomic Absorption Spectrophotometer User Manual.
After all analyses were completed, a cation-anion balance was
performed on the data using WATEQF, a chemical speciation numerical
model. All samples show less than a ten percent difference in the
balance, with most samples showing less than a five percent
difference. This suggests that no major constituents were neglected in
the analysis and that there were no major analytical errors.
Error Calculations
In any analytical procedure there is a degree of error that is
introduced by the use of glassware, pipettes, etc., which must be
considered when presenting data. All cations were analyzed with an
arscir abscrpcian specrrsphorcmersr. This ir_srr- ssr.r hs

19 ;limit for each element, but which does not account for the error factor
introduced in the preparation of standards and substandards. |I
In determining the concentration of a constitutent in a sample, Ji
standards of predetermined concentrations are used. For this reason, «f
the analysis is only as accurate as the standards used. The instrument J
calibrates itself to the first standard aspirated. Therefore, the
analysis is only as accurate as the first standard aspirated.
Each standard was prepared using a commercial 1000 mg/1 atomic«
absorption standard, containing an accuracy of ±1%. Class A
glassware was used, each with its own degree of accuracy, which had to
be taken into account. Using the formula:
Final Concentration -
Initial Concentration x Volume of Initial ConcentrationVolume of Final Concentration
and including the maximum and minimum error for each standard, an error
range was determined for each elements' lowest standard. In presenting
the data, the standard deviation was taken into account as well as the
degree of error. In most cases, the standard deviation was
insignificant, therefore, minimizing the degree of error.
Sample Locations
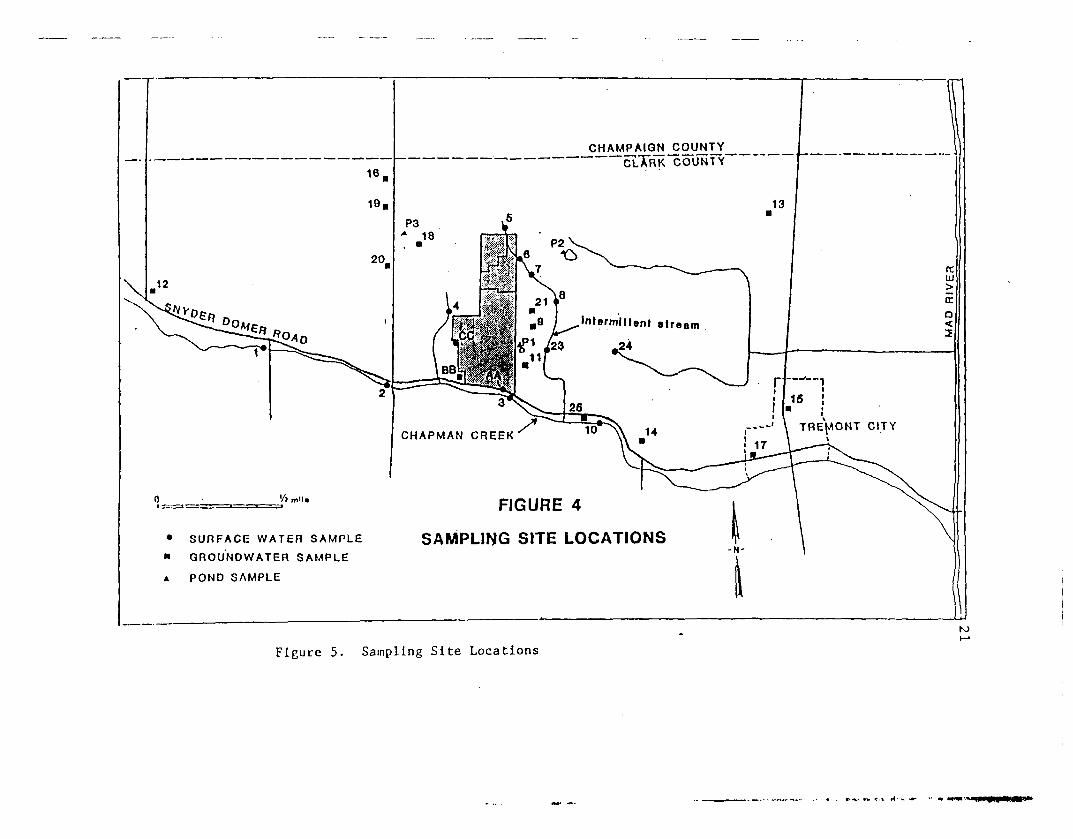
The map showing the sampling sites for each sampling period is
presented in Figure 4.
Four sites were sampled along Chapman Creek. Sites 1 and 2 are
upstream from the disposal site and are used for background data. Site
3 is downstream from the mixing zone below the discharge pipe for the
disposal site. This pipe discharges runoff water fron the sits

20
directly into Chapman Creek. Site 10 is some distance downstream from
the point of discharge of the intermittent stream into Chapman Creek
(refer to Figure 4).
The intermittent stream flows to the south-southeast along the•»
eastern border of the disposal site. Previous work indicates there is
concern that leachate from the disposal site could migrate through the
glacial till and discharge into this stream (Eagon 1984A). Site 5 is
located along the northern border of the liquid chemical disposal
facility, where the intermittent stream begins as a small spring
emerging from the crest of the upland region. This stream then passes
through the far northeast corner at the disposal site. Sampling sites
6, 7, 8 and 23 are located along the stream, downstream of the point
where it passes out of the disposal site and flows along its eastern
border. Small springs and seeps are found along the length of this
stream.
Site 4 is located along & small stream which flows south along the
western border of the disposal site. Stream site 24 is located east of
the site and is used for background data. Site 9 is a spring located
along the eastern border of the disposal site.
Groundwater samples used as background data include well sites 12,
13, 14, 15, 16, 17, 18, 19 and 20. The distance of the sampling sites
from the disposal site varies and this is taken into consideration in
the interpretation of the data. Well sites 11, 21 and 25 are closest
to the disposal site and are believed by the author to be representa-
tive of ground water in the vicinity of the sire.
CHAMPAIQN_COUNTYciTRK COUNTY
Inlermlllent stream
24
TREMONT CITY
FIGURE 4
SAMPLING SITE LOCATIONS• SURFACE WATER SAMPLE
" GROUNDWATER SAMPLE
A POND SAMPLE
Figure 5. Sampling Site Locations

22
The May 1985 sampling period resulted in minor alterations to the
sampling scheme. Due to the need for more data from the western side i
of the site, stream samples AA from the site's discharge pipe and CC >
from the stream to the west of the disposal site were added, as were $
the three ponds previously mentioned. Groundwater sample BB was also
added. Deleted from the May 1985 sampling were sites 7, 24, 15 and 21
due to lack of accessability to domestic wells or lack of water at the
stream sites. ji
« ;A detailed description of each sampling site is given in Table 2.
Sampling sites along the southeastern border of the disposal site are
mentioned often in the following discussion. These sites include 3, 9,
11 and 21 and are brought to the reader's attention at this point.

23
TABLE 2
SAMPLING SITE DESCRIPTIONS
SAMPLE[NUMBER
1
2
3
4
5
6
7
B
9
10
11
12
13
14
15
SAMPLETYPE
surfacewater
surfacewater
surfacewater
surfacewater
surfacewater
surfacewater
surfacewater
surfacewater
groundwater
surfacewater
groundwater
groundwater
groundwater
groundwater
groundwater
LOCATION
Chapman Creek at intersection ofSyr.der-Domer Rd. and Cotfin Pk.
Chapman Creek at intersection ofWillowdale Rd. and Snyder-Domer Rd.
Chapman Creek south of disposalsite
Small stream west of disposal she
The intermittent stream
The intermittent stream
The intermittent stream
The intermittent stream
Spring east of disposal site
Chapman Creek
residenc*-
residence
residence
residence
residence
COMMENTS
stream sample upstreamfrom disposal site
stream sample upstreamfrom disposal site
stream sample below disposalsite discharge pipe
stream sample from cowpasture
north of disposal site adjacentto liquid chemical disposal site
downstream from northernborder of disposal site
sample taken dose to seepon west side of ravine
sample taken downstreamfrom disposal site
domestic well sample fromtrailer SE of disposal she
domestic well sample usedfor background data
domestic well sample usedfor background data
domestic well sample usedfor background data
domestic well sample usedfor background data
DISTANCE/DIRECTIONFROM CLOSEST POINT
TO SITE(approximate)
.75 mi. west
.5 mi. west
100' south
*
500' west
50' north
<25' north
200' east
700' east
200' east
.35 mi. east
200' east
1.2 mi. west
1 mi. east
.6 ml. east
1.2 mi. east
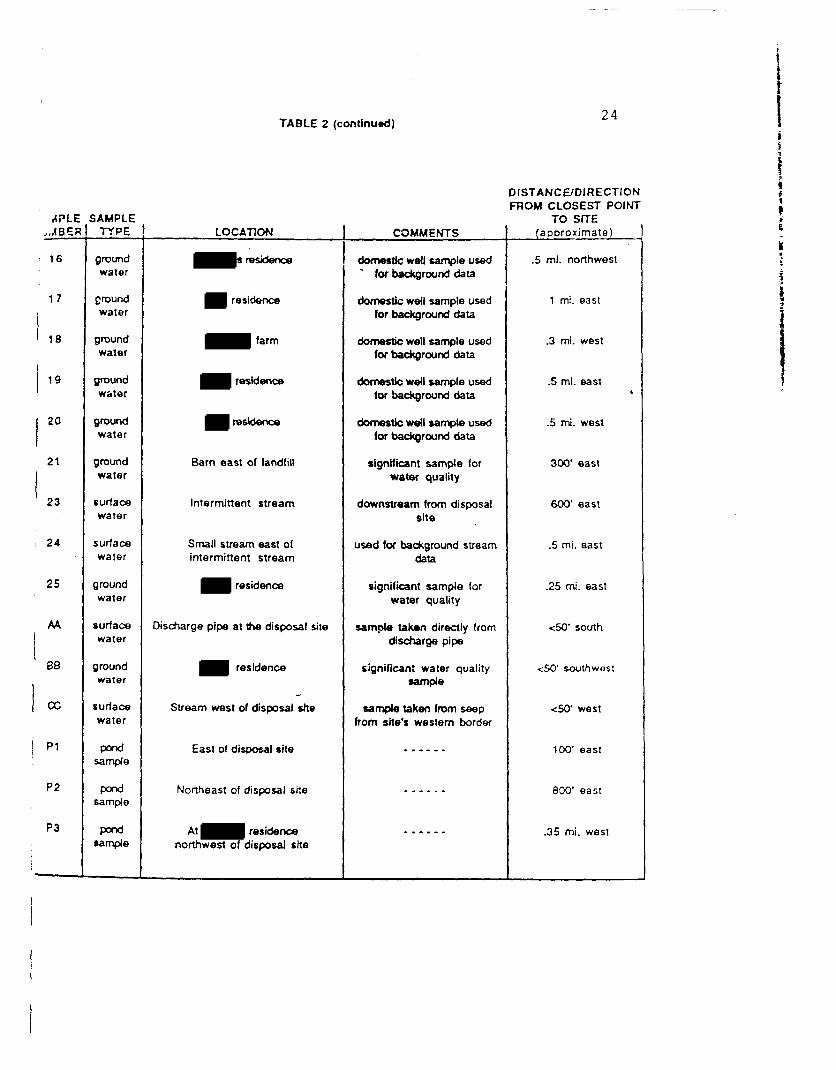
TABLE 2 (continued)24
^PLE,MBER
16
17
18
19
20
21
23
; 24
25
AA
88
CC
PI
P2
P3
SAMPLETYPE
groundwater
groundwater
groundwater
groundwater
groundwater
groundwater
surfacewater
surfacewater
groundwater
surfacewater
groundwater
surfacewater
poodsample
poodsample
Dondr*~ f*J
sample
LOCATION
s residence
residence
farm
residence
residence
Barn east of landfill
Intermittent stream
Small stream east ofintermittent stream
residence
Discharge pipe at the disposal site
residence
Stream west of disposal she
East of disposal site
Northeast of disposal site
At residencenorthwest of disposal site
COMMENT'S
domestic well sample usedfor background data
domestic well sample usedfor background data
domestic well sample usedfor background data
domestic well sample usedfor background data
domestic well sample usedfor background data
significant sample forwater quality
downstream from disposalsite
used for background streamdata
significant sample forwater quality
sample taken directly fromdischarge pipe
significant water qualitysample
sample taken from seepfrom she's western border
DISTANCE/DIRECTIONFROM CLOSEST POINT
TO SITE(aDoroximata)
.5 ml. northwest
1 mi. east
.3 mi. west
.5 mi. easti
.5 mi. west
300' east
600' east
.5 mi. east
.25 mi. east
<50' south
<50' southwest
<50' west
100' easi
800' east
.35 mi. west

RESULTS AND DISCUSSION
Chemical data from both sampling periods is presented in Tables 3A,
3B, 4A and 43. The occurrence and trends observed of each constituent
will be discussed separately in terms of physical parameters, major
constituents and minor constituents. Major constituents are those which
are commonly found in natural watars in concentrations exceeding 1 mg/14
(Freeze and Cherry, 1979). Minor constituents are those usually found in
concentrations below 1 mg/1.
Significant features and anomalous values noted in any of the
constituents are discussed separately following the section on minor
constituents.
Physical Parameters
Specific Conductivity
Specific conductivity is a measure of the electric conductance of
substances in water. The 2resence of charged ionic constituents makes
the solution conductive, i.e. the more ionic constituents present, the
more conductive the solution. For this reason, the measure of specific
conductance is used as an indicator of ion concentration (Hem, 1970).
The specific conductivity measurements in the December 1984
sampling period range from 320 micromhos to 625 micromhos in surface
water samples and from 395 micromhos to 950 micromhos in groundwater
samples (Figure 5a). The specific conductivity of the stream waters in
Chapman Creek increases significantly at site 3, located below the

FIELD MEASURbMbNTS ANU »NlOn oONCbm nATIOMaDECEMBER 1984 SAMPLING PERIOD
SAMPLINGSITE
12345
678910
1112 1131415 1
1617IB1920
21232425
pH
8.398.5
7.748.127.51
7.27.5
8.127.118.4
6.637.157.147.277.2
7.267.097.347.197.37
7.248.097.97.3
Eh'
354.9395.9365.6361.3355.7
237.89355.5372.1391.5274.7
237.12361.6380.3395.1396.4
204.4399.7187.5289.9344.3
155.2346.7388.8303.5
SPECIFICCONDUCTANCE
umhos/cm
440430600510455
550575495950 '625
950575480480550
530700395460415
460370320NA
DISSOLVEDOXYGENfppm)
11.49.611.99.658.0
6.66.98.64.58.8
1.71.81.8
1.254.9
2.054.752.752.10.9
5.411.310.0,3
ALKALINITY(meq/l)
5.0665.3257.3128.3495.896
7.8848.7486.8549.1855.372
16.0576.6796.8176.4636.522
7.9177.246.8587.4596.831
6.9695.3434.6466.461
TDS(ppm)
600580780700780
460760300700600
880560240180280
260380200340240
140360120260
HC03-(mg/l)
308.94324.88446.11509.39359.46
481.00533.73418.12560.41327.75
979.68407.49415.92394.31397.90
483. C7441.71418.42455.08416.78
425.17325.98283.48394.18
(mq/l)
•:-.•
0.35NA
0.35
0.77NA0.4
0.35NA
1.1NA
0.75NA1.0
0.52<.3NA
0.55
Cl-(mq/U |
21.419.421.820.611.8
12.312.313.524.221.7
10.3NA3.7<12.0NA
1.956.93.0NA4.1
5.1910.9NA
3.45
N03-(mg/l)-1^L_L_
33.9533.442.86.3
14.5
1.85<.5<.5
23.12°;<.5NA
10.61.05NA
<.524.6<.5NA<.5
<.57.85
NA<.5
SO4-_(mg/l)-L_a_z_
40.640.7
131.237.836.0
42.441.176.396.548.9
42.2NA
30.154.2NA
6.4527.514.6NA8.6
14.953.1NA I
10.2
' - mlllivolis- - nono observedMA - nol analyzed for that specific constituent.
(Tl

TABLE 3b
CONCENTRATIONS OF CATIONS IN mg/1DECEMBER 1984 SAMPLING PERIOD
SAMPLINGsire
III)10
II12131415
1617101020
21232425
Da
0.0390.1060.1170.0390.001
0.0040.1730.1060.1280.128
0.4070.2730.1280.1620.128
0.3510.0040.2960.0610.385
0.2510.061<.01
0.162
B
.
.
.•
<.7.
<.7.-
.
.
.
.-
.
.
.
.-
<.7..-
Cd
0.0010.0030.0050.007
•
0.0020.0040.0030.0020.002
0.0050.0070.005.-
0.001...
0.001
.
.-
•
Ca
84.883.7103.1111.586.3
109.4120.6100.3112.982.5
185.390.386.591.591 9
85.7100.176.685.371.6
82.379.264.071.7
Cr
0.0120.005<.003
-0.055
0.003-
<.003 i--
.-.-•
r
<.003-.-
.
.
.•
Co
0.020.0210.0210.0190.014
<.010.020.0130.020.013
0.0270.011<.01<.01
0.012
0.0120.01<.01
0.0180.027
0.030.0110.014<.01
Cu
0.0040.0030.007<.0020.004
.0.002<.0020.003<-002
<.0020.0030.0030.008
•
.0.046
---
.0.003
-0.002
Fe
0.067<.0090.1720.3210.273
0.0570.2760.0650.2960.356
3.7660.1930.1720.5370.272
2.510.1911.4950.4130.546
1.4680.235<.0090.508
Pb
_---
<.03
.-
--
0.07<.03<.030.050.03
.<.030.05
-0.04
.--"
Mq
29.329.540.340.329.3
34.042.535.141.629.3
67.232.830.631.531.5
35.030.428.533.526.4
29.326.923.726.3
Mn
0.0030.0030.1080.1570.002
0.0510.3780.0880.0090.007
0.0860.0020.0020.070.002
0.0270.0020.0340.0120.034
0.0950.0260.0030.003
Nl
0.0330.0270.0490.0260.049
0.0660.0710.0550.0850.052
0.0740.040.0610.0490.048
0.0510.060.0520.0580.048
0.0390.0460.0380.043
K
1.791.762.388.810.59
0.780.781.237.341.72
2.242.141.271.191.28
1.182.181.041.161.12
1.142.130.681.17
SI
3.413.215.335.68 •4.74
3.995.653.396.412.67
7.244.715.726.065.81
8.44.9
7.767.717.43
7.413.243.516.14
Na
.
.42.61.0-
4.921.51.8
47.4•
13.76.7---
16.132.33.71.94.4
.1.4-
0.5
Sr
1.2021.2410.4820.360.09
0.1080.1270.1170.121.37
0.3051.7672.8701.8880.239
10.2570.3896.8172.9827.927
2.070.0680.0344.843
Zn
.
.
.
.0.003
.
.
.
.-
1.710.0260.0460.0560.075
0.1320.0340.030.0530.191
0.234--
0.226
- - nono observedNJ

TABLE 4aFIELD MEASUREMENTS AND ANION CONCENTRATIONS
MAY 1985 SAMPLING PERIOD
SAMPLINGSIFE
I2345
68g
1011
1213141617
1819202325
I'll'2l'3AA118CC
PH
7.88.28.3
8.057.45
7.88.26.98.5
6.65
7.27.27.47.46.9
7.257.27.2
8.057.3
7.59.28.97.87.07.2
Eh'
381.6441.5401.3427.3421.5
494.1472.7454.1481.9232.1
639.8307.1541.9159.4644.5
177.1224.4301.2446.9136.1
438.7388.6387.8438.7179.7252.4
SPECIFICCONDUCTANCE
umhos/cm
460465500650600
525600850470
1050
510550540590825
525600490480520
330185310675525510
DISSOLVEDOXYGEN(PPm)
9.810.510.39.6
15.0
11.49.23.0
1 10.48.0
4.82.30.6
0.754.7
8.50.90.99.0
0.75
5.511.410.27.70.7
4.75
ALKALINITY(meq/l)
5.0095.0325.0597.0885.427
6.4815.9318.6565.00913.884
5.8886.S495.9727.7576.954
6.5547.2916.4635.1446.418
3.2911.8842.5385.9946.4067.725
TDS(PPm)
396397.5427.5455430
347.5380688350855
400392374332596
354342334318285
190130202
787.5350
427.5
HCO3--. (mfl/l) ...
305.63307.04308.72432.48331.14
395.44361.87528.13305.63847.08
359.25399.6364.4473.26424.27
399.87444.86394.31313.84391.6
200.81114.97154.87365.69390.85471.35
F-Limg/l)
NA---•
.NA..-
.
.-
1.0-
0.67-
0.8<.3<.3
0.4----"
Cl-(mfl/|)
18.417.1518.013.09.75
9.48.9524.5
18.2515.0
NANANA1.0#
1.92-
1.228.11.3
6.173.17NA
16.857.256.0
NO3-I (mq/l)
28.1518.524.01.75
20.25
1.75.
18.923.6
•
NANA'NA.
25.75
.
NA---
1.04-NA--*
SO4-(mg/D
36.534.038.526.2536.5
35.043.591.537.050.8
NANANA6.2
32.5
13.8NA
12.250.0210.2
25.72C.6NA
95.041.067.5
TOG-(PPm)
12.51.3.
3.60.6
7.05.04.3.
3.6
4.01.3..if
1.31.02.61.0
12.0
4.53.0
0.669.728.01.0
' = millivolts n - none observed at a 2/10 dilution.- >» nonu observedIIA - not nnalyzed for that specific constituent.
CO
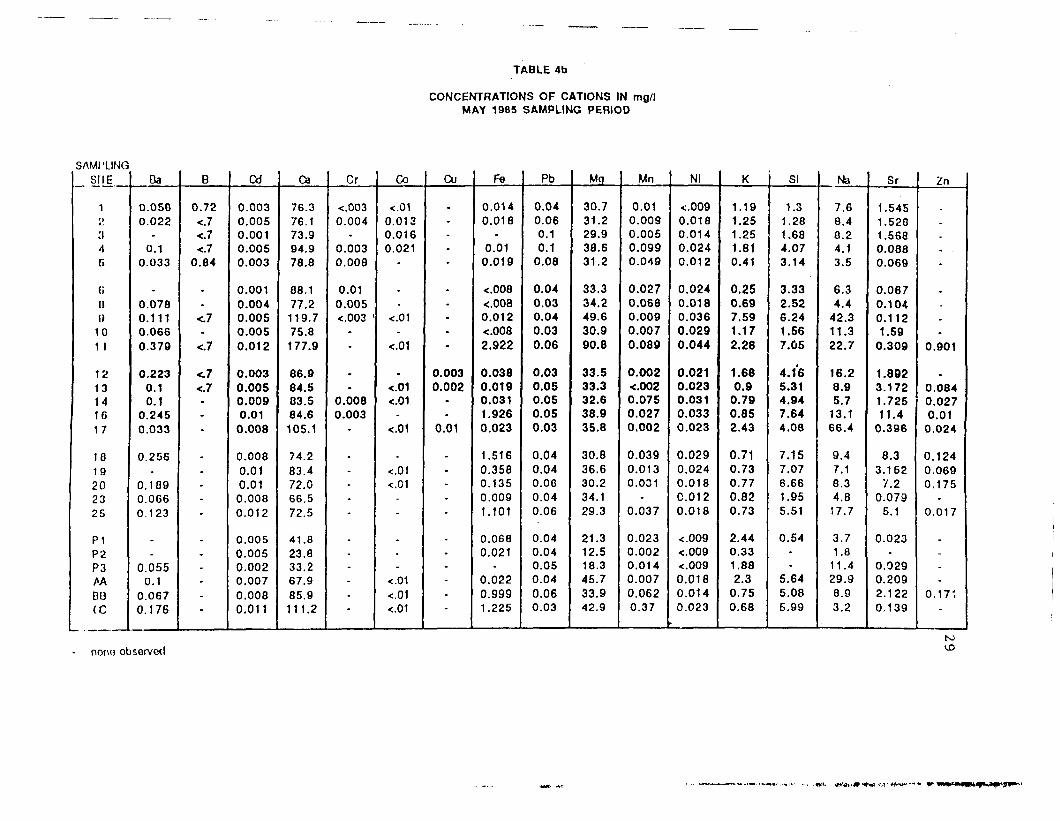
TABLE 4b
CONCENTRATIONS OF CATIONS IN mg/lMAY 1985 SAMPLING PERIOD
SAMPLINGSflE Da
0.0500.022.
0.10.033
.
0.0780.1110.0660.379
0.2230.10.1
0.2450.033
0.256.
0.1090.0660.123
_
.
0.0550.1
0.0670.176
B
0.72<J<.7<.7
0.84
.
.<.7.
<.7
•c.7<.7..-
_...-
,,...-
Cd
0.0030.0050.0010.0050.003
0.0010.0040.0050.0050.012
0.0030.0050.0090.010.008
0.0080.010.010.0080.012
0.0050.0050.0020.0070.0080.011
Ca
76.376.173.994.978.8
88.177.2119.775.8177.9
86.984.583.584.6105.1
74.283.472.066.572.5
41.823.833.267.985.9111.2
Cr
<.0030.004.
0.0030.008
0.010.005<.003 '.•
».
0.0080.003
-
.
.-.•
.
.
.
.
.•
Co
<.010.0130.0160.021
-
.-
<.01.
<.01
.
<.01<.01.
<.01
„
<.01<.01
--
.
.
.<.01<.01<.01
Cu
.-..-
.
.
.
.-
0.0030.002.-
0.01
.
.-.-
.
.--.*
Fe
0.0140.018
-0.01
0.019
<.008<.0080.012<.0082.922
0.0380.0190.0311.9260.023
1.5160.3580.1350.0091.101
0.0680.021
-0.0220.9991.225
Pb
0.040.060.10.1
0.08
0.040.030.040.030.06
0.030.050.050.050.03
0.040.040.060.040.06
0.040.040.050.040.060.03
Mq
30.731.229.938.631.2
33.334.249.630.990.8
33.533.332.638.935.8
30.836.630.234.129.3
21.312.518.345.733.942.9
Mn
0.010.0090.0050.0990.049
0.0270.0680.0090.0070.089
0.002<.0020.0750.0270.002
0.0390.0130.001
-0.037
0.0230.0020.0140.0070.0620.37
Nl
<.0090.0180.0140.0240.012
0.0240.0180.0360.0290.044
0.0210.0230.0310.0330.023
0.0290.0240.018C.0120.018
<.009<.009<.0090.0180.0140.023
K
1.191.251.251.810.41
0.250.697.591.172.28
1.680.9
0.790.852.43
0.710.730.770.820.73
2.440.331.882.3
0.750.68
SI
1.31.281.684.073.14
3.332.526.241.567.05
4.165.314.947.644.08
7.157.078.661.955.51
0.54--
5.645.085.99
Na
7.68.48.24.13.5
6.34.4
42.311.322.7
16.28.95.7
13.166.4
9.47.18.34.817.7
3.71.8
11.429.98.93.2
Sr
1.5451.5201.5680.0880.069
0.0670.1040.1121.59
0.309
1.8923.1721.72511.4
0.396
8.33.162
7.20.079
5.1
0.023-
0.0290.2092.1220.139
2n
_
_
,
-
,
.
.
.0.901
f
0.0840.0270.010.024
0.1240.0690.175.
0.017
_---
0.171~
4r>
101 1
1213141617
1019202325
P1P2P3AABB(C
norm observed

. _ _ _ _ _ _6ITRK COUNTY
000
CHAPMAN CREEK
FIGURE 5a.SPECIFIC CONDUCTANCE
DECEMBER 1984 SAMPLING PERIODIn umhos/cm
• SURFACE WATER S A M P L E• OROUNOWATER S A M P L E
POND SAMPLE
CHAMPAION_COUNTYCL.TRK COUNTY
Inlarmlltant ilr»am
TREMONT CITYC H A P M A N CREEK
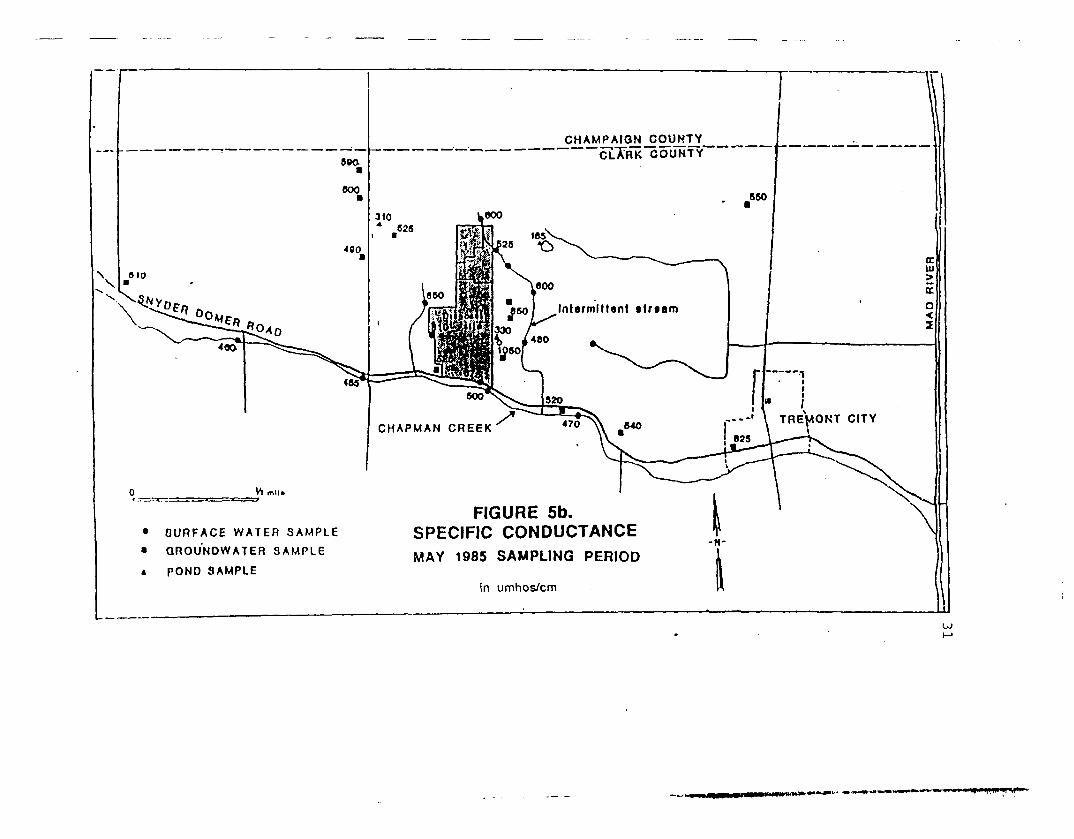
FIGURE 5b.SPECIFIC CONDUCTANCEMAY 1985 SAMPLING PERIOD
• OURFACE WATER SAMPLEQROU'NOWATER SAMPLEPOND SAMPLE
in umhos/cm

32
site's di.scharge pipe, and continues to increase downstream.
Groundwater samples contain the highest values at sites 11 and 9,
adjacent to the east side of the disposal site, each containing values
of 950 rnicromhos. The next highest value noted in the groundwater
samples is from site 17, containing 700 micromhos.
The specific conductivity in the May 1985 sample collection range
from 460 micromhos to 675 micromhos In the stream samples and 490
micromhos to 1050 micromhos in groundwater samples. Pond samples range4
from 185 to 330 micromhos (Figure 5b). The highest conductivity value
among the surface water samples is from site AA, taken directly from
the sites discharge pipe containing 675 micromhos. A slight increase
in conductivity is noted at site 3, which then decreases downstream.
Site 4 contains a high value of 650 micromhos. The highest values in
the groundwater samples are found at sites 11, 9, and 17 with values of
1050, 850 and 825 micromhos, respectively. All other groundwater
samples measured less than 610 micromhos.
Significant features noted with specific conductivity values
include: 1) conductivity in groundwater samples from sites 9 and 11,
along the eastern border of the disposal site, are consistently higher
than other groundwater samples. 2) Conductivity of both stream and
groundwater samples are higher in the May 1985 sampling period, with
few exceptions.
Total Dissolved Solids
The concentration of total dissolved solid (TDS) concentration in
water is the amount of dissolved material in a sample measured by
drying an aiiquioc of che sample and veighir.g chc remaining residue.

33
The accuracy of this measurement depends on the drying temperature and
any volatile behavior of the constituents present. It is useful for a
rough estimate of dissolved constituent quantities in a sample (Hem,
1970).
Total dissolved solid concentrations in the December 1984 sampling
period range from 120 mg/1 to 780 mg/1 in surface water samples and
from 140 mg/1 to 880 mg/1 in groundwater samples (Figure 6a). A
significant increase in TDS is noted in Chapman Creek water at site 3,
below the site's discharge pipe. The concentration decreases
downstream to levels present in the upstream samples used as background
data. Concentrations along the intermittent stream are highly variable
from 300 mg/1 to 780 mg/1. Groundwater samples containing the highest
TDS are from sites 11 and 9, containing 880 mg/1 and 700 mg/1,
respectively. It is notable that site 21 contains the lowest TDS in
the groundwater samples, though it is located in close proximity to the
sites containing the highest TDS concentrations.
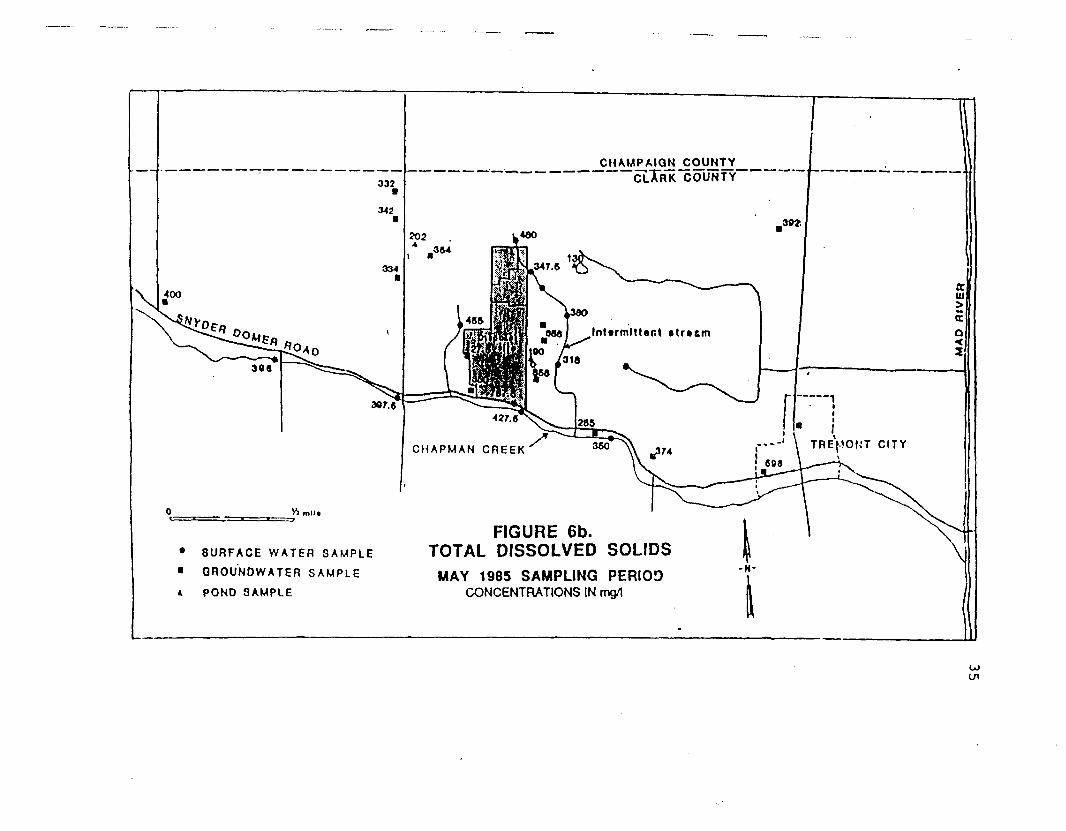
TDS concentrations in the May 1985 sampling period range from 318
mg/1 to 787.5 mg/1 in surface water samples and from 285 mg/1 to 855
mg/1 in groundwater samples. Pond samples range from 130 mg/1 to 202
mg/1 (Figure 6b). A slight increase in TDS occurs at site 3 along
Chapman Creek. The highest TDS value in the surface water samples is
from site AA, the discharge pipe, containing 787.5 mg/1. Groundwater
samples containing the highest TDS are from sites 9 and 11 with
concentrations of 688 mg/1 and 855 mg/1, respectively.
Significant features in TDS concentrations are: 1) The highest TDS
are from sites 9 and 11, east of the disposal site. 2) The highest
surface water values are from sites AA and 3, south of che disposal
site.

CHAMPAIQN_COUNTYCtTflK COUNTY
700/ Inlcrmltttnt ttrtim
CHAPMAN CREEK
FIGURE 6a.TOTAL DISSOLVED SOLIDSSURFACE WATER SAMPLE
QROUNDWATER SAMPLE
POND SAMPLEDECEMBER 1984 SAMPLING PERIOD
CONCENTRATIONS IN mg/1
CHAMPAIGN_COUNTYcTTRK COUNTY
Inlermltlanl ttrtem
TREpONT CITYCHAPMAN CREEK
FIGURE 6b.TOTAL DISSOLVED SOLIDS• SURFACE W A T E R SAMPLE
• (3ROUNDWATER S A M P L E
• POND SAMPLEMAY 1985 SAMPLING PERIOD
CONCENTRATIONS IN mg/l
UJUl
36
EH
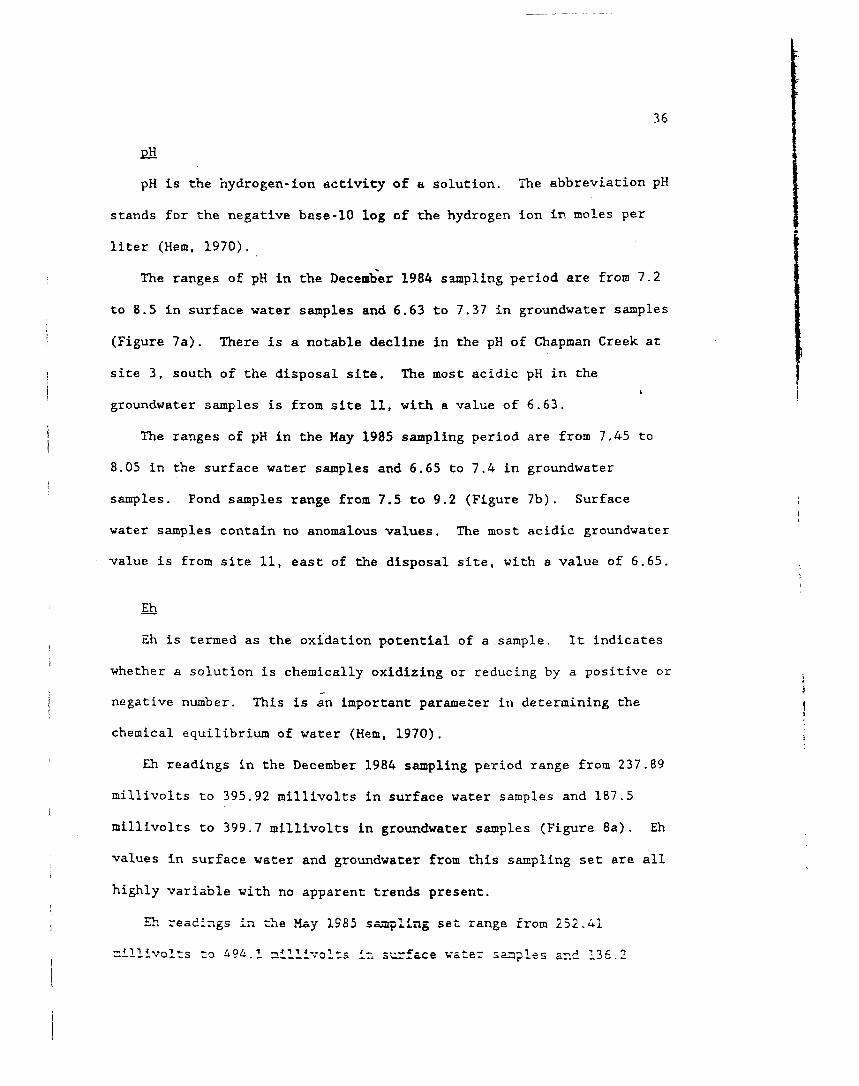
pH is the hydrogen-ion activity of a solution. The abbreviation pH
stands for the negative base-10 log of the hydrogen ion in moles per
liter (Hem, 1970).
The ranges of pH in the December 1984 sampling period are from 7.2
to 8.5 in surface water samples and 6.63 to 7.37 in groundwater samples
(Figure 7a). There is a notable decline in the pH of Chapman Creek at
site 3, south of the disposal site. The most acidic pH in the
groundwater samples is from site 11, with a value of 6.63.
The ranges of pH in the May 1985 sampling period are from 7,45 to
8.05 in the surface water samples and 6.65 to 7.4 in groundwater
samples. Pond samples range from 7.5 to 9.2 (Figure 7b). Surface
water samples contain no anomalous values. The most acidic groundwater
value is from site 11, east of the disposal site, with a value of 6.65.
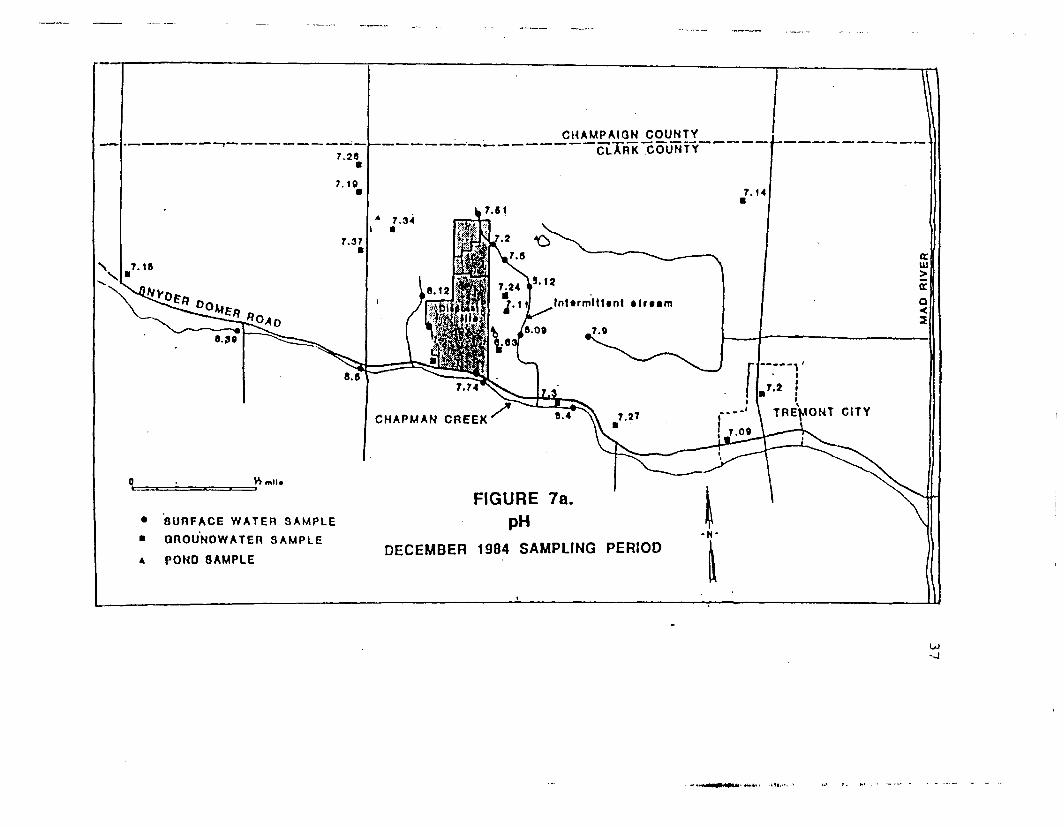
Eh
Eh is termed as the oxidation potential of a sample. It indicates
whether a solution is chemically oxidizing or reducing by a positive or
negative number. This is an important parameter in determining the
chemical equilibrium of water (Hem, 1970).
Eh readings in the December 1984 sampling period range from 237.89
millivolts to 395.92 millivolts in surface water samples and 187.5
millivolts to 399.7 millivolts in groundwater samples (Figure 8a). Eh
values in surface water and groundwater from this sampling set are all
highly variable with no apparent trends present.
Eh readings in the May 1985 sampling set range from 252.41
millivolts to 49 .1 millivolts in surface water samples and 136.2
CHAMPAIGN COUNTYCLA~RK COUNTY
Intermittent atreim
7.8
CHAPMAN CREEK
FIGURE 7a.PH
DECEMBER 1984 SAMPLING PERIOD
• SURFACE WATER SAMPLE• OnOUNDWATER SAMPLE• POND SAMPLE
u>-J

CHAMPAIGN CO_UNTYCOUNTY
Intermittent atreim
TREMONT CITYCHAPMAN CREEK
FIGURE 7b.PH
MAY 1985 SAMPLING PERIOD
• SURFACE WATER SAMPLE
• QROUNDWATER SAMPLE
POND SAMPLE
u>m
CHAMPAIQNJCOUNTYCL.TRX COUNTY
TREMONT CITY
FIGURE 8aEh
DECEMBER 1984 SAMPLING PERIOD• SURFACE W A T E R SAMPLE• OnOUNDWATER SAMPLE
A POND SAMPLE
u>

X •Jl.l
le» o0*?f*311.1
*o,
to mil .
I5».4
224.4
30t.2
MM«21.5
ASSI...^' 4,4., »£• x
;Tii
L««./.»!/
472.7
*»*.!
«4I.I>
• SURFACE W A T E R SAMPLE• QROU'NOWATER SAMPLEi POND SAMPLE
<Ot.J
CHAPMAN CREEK^
MM48T.9
_ . _COUNTY
«<».?
FIGURE 8bEh
MAY 1985 SAMPLING PERIOD
in millivolts
>or.r
\ /
• l r » a m
—— sj
/ */ w/ >/ a
/ °
4r- —— 1, (TREV°NT

^~ »t
millivolts to 644.52 millivolts in groundwater samples. Pond samples j
range from 387.81 to 438.69 millivolts (Figure 8b). Eh values are |f
again highly variable in this sampling period with no trends evident. (
Dissolved Oxygen ',
Dissolved oxygen is the measure of the dissolved oxygen content in [
water. This parameter is good only for the time of measurement because
it can change significantly with time due to contact with air. This
measurement is included in this study to supply additional data to
assist in the running of the computer program WATEQF.
Dissolved oxygen concentrations in the December 1984 sampling
period range from 6.6 ppm to 11.9 ppm in surface water samples and 0.9
ppm to 5.3 ppm in groundwater samples (Figure 9a).
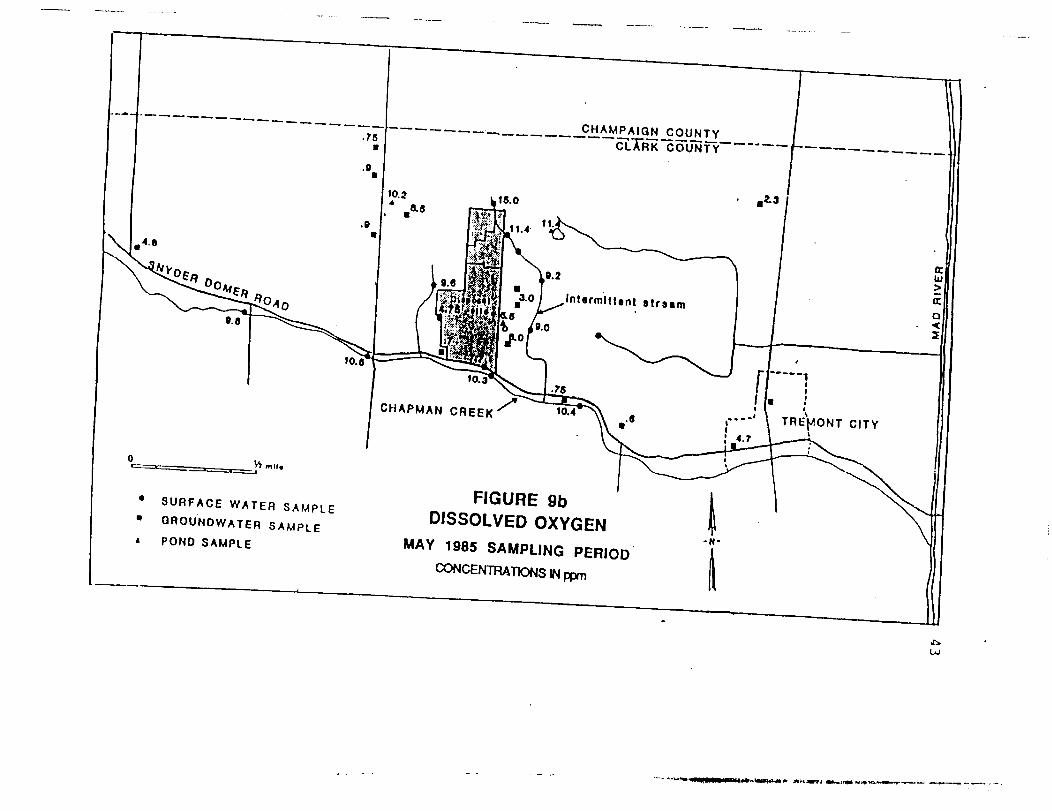
Dissolved oxygen concentrations in the May 1985 sampling period
range from 4.7 ppm to 15.0 ppm in the surface water samples and .7 ppm
to 8.5 ppm in groundwater samples. Pond samples range from 5.5 ppm to
11.4 ppm (Figure 9b).
Major Constituents
Bicarbonate
Bicarbonate, a dissolved form of carbon dioxide, occurs in
groundwater and surface water in variable concentrations, depending on
the environment. The concentration is highly dependent on the
carbonate equilibria of the water system.
Bicarbonate concentrations in the December 1984 samples range from
283.46 mg/1 to 533.73 mg/1 in surface water samples and 394.18 mg/1 to
979.67 mg/1 in groundwater samples (Figure lOa). The bicarbonate
C2r.cer.tra.tior. at sits 3 alcr.g Chapnan Creek is sirr.i£±-ar.t:lv hizier
thar. ether ccncer.traticr.s along the creek. Site 7, along the

CHAMP AiqN_COUNTYCLTRK COUNTY
4.81 lnt*rmllt«nl
TREMONT CITYCHAPMAN CREEK
FIGURE 9aDISSOLVED OXYGEN
DECEMBER 1984 SAMPLING PERIODCONCENTRATIONS IN ppm
• SURFACE WATER SAMPLE"» OROUNDVYATER SAMPLE
A POND SAMPLE
Intermittent Blrsam
CHAPMAN CREEKTREMONT CITY
FIGURE 9bDISSOLVED OXYGEN
MAY 1985 SAMPLING PERIOD
CONCENTRATIONS IN ppm
• SURFACE W A T E R SAMPLE
« QROUNOWATER SAMPLE
POND SAMPLE
Ul

CHAMPAiqN_COUNTYCL.TRK COUNTY
680.41 Inlarmllttnl stream
TREMONT CITYCHAPMAN CREEK'
FIGURE 10aBICARBONATESURFACE W A T E R SAMPLE
QROUNDWATER SAMPLEPOND SAMPLE
DECEMBER 1984 SAMPLING PERIODCXDNCENTRATIONS IN mg/1

CHAMP AIQN_COUNTYCL.TRK COUNTY
18-4.87 .* 308.87
381.87
Intermittent s t ream
TREMONT CITYCHAPMAN CREEK
FIGURE 10bBICARBONATE• SURFACE W A T E R SAMPLE
OROUNDWATER SAMPLE
POND SAMPLEMAY 1985 SAMPLING PERIOD
CONCENTRATIONS IN mg/l

46
intermittent stream, contains a high value of 53?-. 734 mg/1. The
highest bicarbonate concentrations in the groundwater samples are from
sites 9 and 11, containing 560.A15 mg/1 and 979.676 mg/1 respectively.
Bicarbonate concentrations in the May 1985 sampling period range
from 305.63 mg/1 to 471.35 mg/1 in surface water samples and 359.25
mg/1 to 847.08 mg/1 in groundwater samples. Pond samples range from
114.973 mg/1 to 200.812 mg/1 (Figure lOb). The highest bicarbonate
concentrations in the surface water samples are found at sites 4 and
CC, near the west border of the disposal site. The highest groundwater I
concentrations are found at sites 11 and 9, containing 847.08 mg/1 and
528.13 mg/1, respectively, significantly higher than backgroundi
samples. j
Significant features noted among the samples include: 1) The *4
highest bicarbonate concentrations among the groundwater samples are J
from sites 9 and 11 during both sampling periods. 2) Surface water |i
samples located closest to the disposal site contain the highest
bicarbonate concentrations.
Calcium
Calcium is a principal cation found in fresh water. In carbonate
terrain, it is usually the cation found in the highest concentration
(Hem, 1970).
Calcium concentration in samples collected during December 1984
range from 64.0 mg/1 to 120.6 mg/1 in surface water samples and 71.6 ;
mg/1 to 185.3 mg/1 in groundwater samples (Figure lla). Surface water
samples contain high calciua concentrations only in the vicinity of the
47
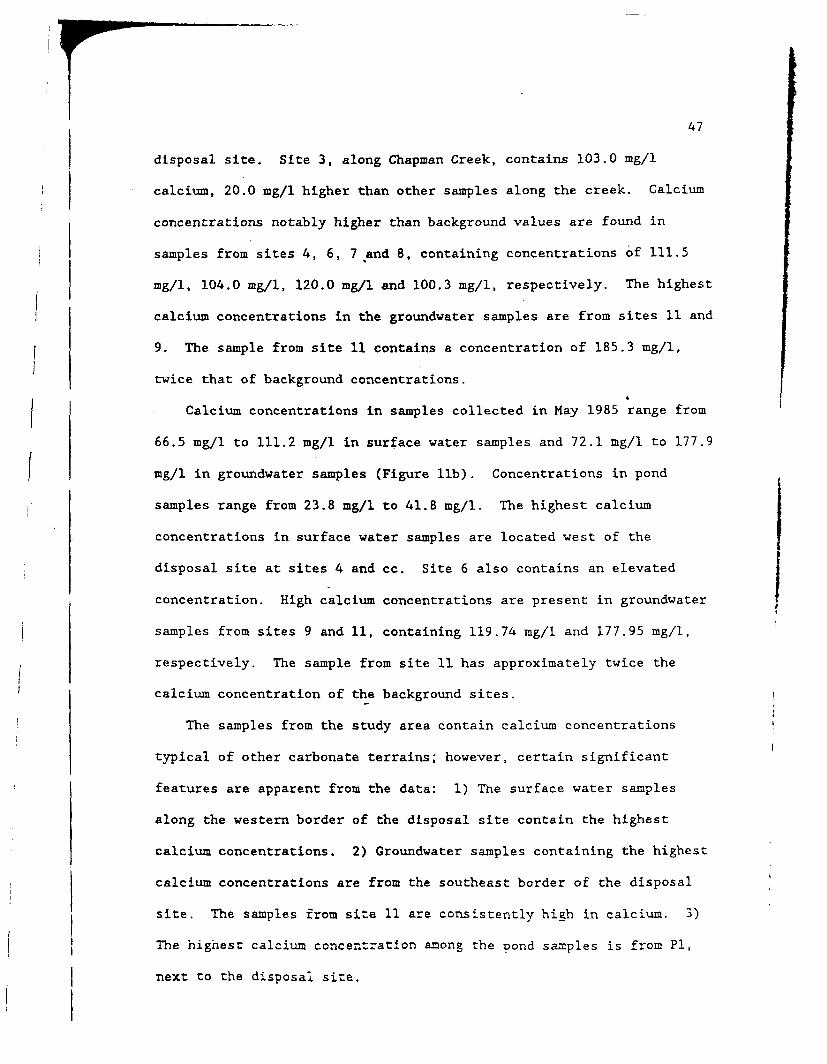
disposal site. Site 3, along Chapman Creek, contains 103.0 mg/1
calcium, 20.0 mg/1 higher than other samples along the creek. Calcium
concentrations notably higher than background values are found in
samples from sites 4, 6, 7^and 8, containing concentrations of 111.5
mg/1, 104.0 mg/1, 120.0 mg/1 and 100.3 mg/1, respectively. The highest
calcium concentrations in the groundwater samples are from sites 11 and
9. The sample from site 11 contains a concentration of 185.3 mg/1,
twice that of background concentrations.*
Calcium concentrations in samples collected in May 1985 range from
66.5 mg/1 to 111.2 mg/1 in surface water samples and 72.1 mg/1 to 177.9
mg/1 in groundwater samples (Figure lib). Concentrations in pond
samples range from 23.8 mg/1 to 41.8 mg/1. The highest calcium
concentrations in surface water samples are located west of the
disposal site at sites 4 and cc. Site 6 also contains an elevated
concentration. High calcium concentrations are present in groundwater
samples from sites 9 and 11, containing 119.74 mg/1 and 177.95 mg/1,
respectively. The sample from site 11 has approximately twice the
calcium concentration of the background sites.
The samples from the study area contain calcium concentrations
typical of other carbonate terrains; however, certain significant
features are apparent from the data: 1) The surface water samples
along the western border of the disposal site contain the highest
calcium concentrations. 2) Groundwater samples containing the highest
calcium concentrations are from the southeast border of the disposal
site. The samples from site 11 are consistently high in calcium. 3)
The highest calcium concentration among the pond samples is from PI,
next to the disposal site.

CLTRK COUNTY "" f~———— — — —
103.1
CHAPMAN CREEK TREMONT CITY
FIGURE 11aCALCIUM• SURFACE W A T E R SAMPLE
• QROU'NDWATER SAMPLE• POND SAMPLE DECEMBER 1984 SAMPLING PERIOD
CONCENTRATIONS IN mg/1

CHAMP AIONCOUNTYCOUNTY
Intermittent vtreim
----' » TREMONT CITY105.1 '
CHAPMAN CREEK
FIGURE 11bCALCIUM
SURFACE W A T E R SAMPLEDROUNDWATER SAMPLE
POND SAMPLEMAY 1985 SAMPLING PERIOD
CONCENTRATIONS IN mo/l
VO

50
Chloride
Chloride is the ionic form of the element chlorine, and is found at
low concentrations in most natural water (Hem, 1970). One of ^
chloride's attributes is its non-reactive characteristic. It does not 5
readily complex with other compounds, is not affected by
oxidation-reduction conditions, and is not readily adsorbed onto
mineral surfaces. This chemical behavior makes chloride a good tracer
for some hydrogeologic studies (Hem, 1970).
Chloride concentrations from the December 1984 sampling period
range from 10.9 mg/1 to 21.8 mg/1 in surface water samples and 1.9 mg/1
to 56.9 mg/1 in groundwater samples (Figure 12a). No significantly
anomalous values are noted among the surface water samples.
Groundwater samples containing high chloride concentrations are from
sites 17 and 9, containing 56.9 mg/1 and 24.2 mg/1, respectively. All
other groundwater samples contain concentrations below 12.0 mg/1.
The May 1985 samples contain chloride concentrations ranging from
8.1 mg/1 to 18.4 mg/1 in surface water samples and 0 mg/1 to 24.5 mg/1
in groundwater samples (Figure 12b). Only samples from ponds PI and P2
were included in the chloride analysis, containing 6.17 mg/1 and 3.17
mg/1, respectively. No anomalous values are noted in the surface water
samples. Groundwater samples containing the highest chloride
concentrations are from sites 9, 11, and BB, containing 24.5 mg/1, 15.0
mg/1 and 7.25 mg/1, respectively. Background samples analyzed
contained less than 1.92 mg/1. The sample from site 17 showed no
chloride with a 2/10 dilution of the sample. An undiluted analysis
could not be run.

CHAMPAIGN _COUNTYCL.TRK COUNTY
Intermittent itream
NO
TREMONT CITYCHAPMAN CREEK
FIGURE 12aCHLORIDE• SURFACE WATER SAMPLE
• QROUNDWATER SAMPLEPOND SAMPLE
DECEMBER 1984 SAMPLING PERIODCONCENTRATIONS IN mg/1

CHAMPAIONpOUNTYCOUNTY
24.61 Intermittent f t t reamL^8.1
19.0
CHAPMAN CREEK TREMONT.CITY
FIGURE 12bCHLORIDE• SURFACE WATER SAMPLE
• QROUNDWATER SAMPLE
» POND SAMPLE MAY 1985 SAMPLING PERIODCONCENTRATIONS IN mg/l
LHNJ

53t
Significant features observed from the chloride distributions are: I
1) There are high concentrations in the hillside spring, site 9; 2) ji
High chloride concentrations in the groundwater samples occur in the ,
south-southeast areas near the disposal site; and 3) High concentration !•» v
of chloride in the December Sampling at site 17, a domestic well beside \
Snyder-Domer Road.
Magnesium
In carbonate terrain, magnesium is one of the predominant
constituents in both groundwater and surface water, in most cases
second only to calcium (Hem, 1970).
Magnesium concentrations in samples from the December 1984 sampling
period range from 26.9 mg/1 to 42.5 mg/1 in surface water samples and
23.7 mg/1 to 67.2 mg/1 in groundwater samples (Figure 13a). Surface
water samples from sites 3 and 4 each contain a high concentration of
40.3 mg/1. The northern section of the intermittent stream also shows
high magnesium concentration. Groundwater samples show the highest
magnesium concentrations at sites 9 and 11. The sample from site 11
contains the highest concentration of 67.2 mg/1.
Magnesium concentrations in the May 1985 sampling period range from
29.9 mg/1 to 45.7 mg/1 in the surface water samples and 29.4 mg/1 to
90.8 mg/1 in groundwater samples. Concentrations in the pond samples
range from 12.5 mg/1 to 21.3 mg/1 (Figure 13b). The sample from site
AA, from the discharge pipe, contains the highest magnesium
concentration of the surface water samples, at 45.7 mg/1. Another high
concentration is from the sample at site CC. Groundvater samples
containing high magnesium values are from the s^urheasr area of the

CHAMPAIGN .COUNTYClTRK COUNTY
Intermittent <tr»im
23.7
TREMONT CITYCHAPMAN CREEK
FIGURE 13aMAGNESIUM• SURFACE W A T E R SAMPLE
OROU'NDWATER SAMPLEPOND SAMPLE
DECEMBER 1984 SAMPLING PERIODCONCENTRATIONS IN mg/l

CHAMPAIGN_COUNTY6TTRK COUNTY
34.2
40.6J Intermittent ctrtam
TREMONT CITYCHAPMAN CREEK
FIGURE 13bMAGNESIUM• SURFACE W A T E R SAMPLE
• QROUNDWATER S A M P L E
POND SAMPLEMAY 1985 SAMPLING PERIOD
CONCENTRATIONS IN mg/l

56
background concentrations. Pond sample PI contains the highest
magnesium concentration of 21.3 mg/1.
Magnesium concentrations from samples in the study area are
similar, in comparison, with concentrations in other carbonate terrains
(Hem, 1970). Significant features observed in the distribution of
magnesium are: 1) All surface water samples in the upper range of
magnesium concentrations are located in the proximity of the disposal
site. 2) Groundwater concentrations from samples at sites 11 and 9i
have the overall highest concentrations in the study area in both
sampling periods.
Nitrate i————— INitrate, one of the dissolved nitrogen species, is an element found I
throughout nature and is essential to all living species (Hem, 1970).
It is commonly used in fertilizers, and may reach high levels in .
groundwater near fields where livestock are kept. In landfills,
however, nitrogen is found at high concentrations only in its reduced
state (NH4+). •
Nitrate concentrations in the December 1984 sampling period range f5
from less than 0.5 mg/1 to 42.8 mg/1 in surface water samples and less j
than .5 mg/1 to 24.6 mg/1 in the groundwater samples (Figure 14a). !j
Surface water samples in Chapman Creek show a significant increase in ii
nitrate concentration at site 3 at the disposal site. Other surface •
water concentrations are extremely variable. Groundwater
concentrations are low with the exception of sites 17 and 9, containing
24.6 mg/1 and 23.1 mg/1, respectively.

CHAMPAIGN COUNTY
CHAPMAN CREEK
FIGURE 14aNITRATESURFACE WATER SAMPLE
QROUNDWATER SAMPLEPOND SAMPLE
DECEMBER 1984 SAMPLING PERIODCONCENTRATIONS IN mg/1

CHAMP AIQN_COUNTYcTTnK COUNTY
I n t e r m l l l o n t i l r a a m
TREMONT C!TYC H A P M A N CREEK
FIGURE 14bNITRATESURFACE W A T E R SAMPLE
OROUNDWATER SAMPLE
POND SAMPLE MAY 1985 SAMPLING PERIODCONCENTRATIONS IN mg/l
inoo

59
The May 1985 sampling period presents nitrate concentrations
ranging from 0 mg/1 to 28.15 mg/1 in surface water samples and 0 mg/1
to 25.75 mg/1 in groundwater samples. Only two pond samples were
analyzed for nitrate, of which only one contains nitrate (Figure 14b).
Nitrate concentrations in surface water samples from Chapman Creek all
range between 18 mg/1 to 28 mg/1. Of the groundwater samples analyzed,
only site 17 and 9 contain high nitrate concentrations.
The only significant feature observed in the nitrate analyses is*
the consistently high concentrations from groundwater samples at sites
9 and 17.
Potassium
Potassium is an alkali metal commonly found in all rocks,
especially in rock or soil containing clay minerals (Hem, 1970).
Potassium concentrations in waters from the December 1984 sampling
period range from .59 mg/1 to 8.61 mg/1 in surface water samples and
1.04 mg/1 to 7.34 mg/1 in groundwater samples (Figure 15a). Surface
water samples containing high concentrations of potassium are present
at sites 3 and 4. Other surface water samples are highly variable.
Groundwater samples contain less variable potassium concentrations.
The highest concentration, 7.34 mg/1, is from site 9. All other
groundwater samples contain potassium concentrations below 2.25 mg/1.
Potassium concentrations in waters from the May 1985 sampling
period range from 0.25 mg/1 to 2.30 mg/1 in surface water samples and
0.71 mg/1 to 7.59 mg/1 in groundwater samples. Potassium
concentrations from Pond samples range from 0.33 mg/1 co 2.44 mg/1
(Figure 15b) .
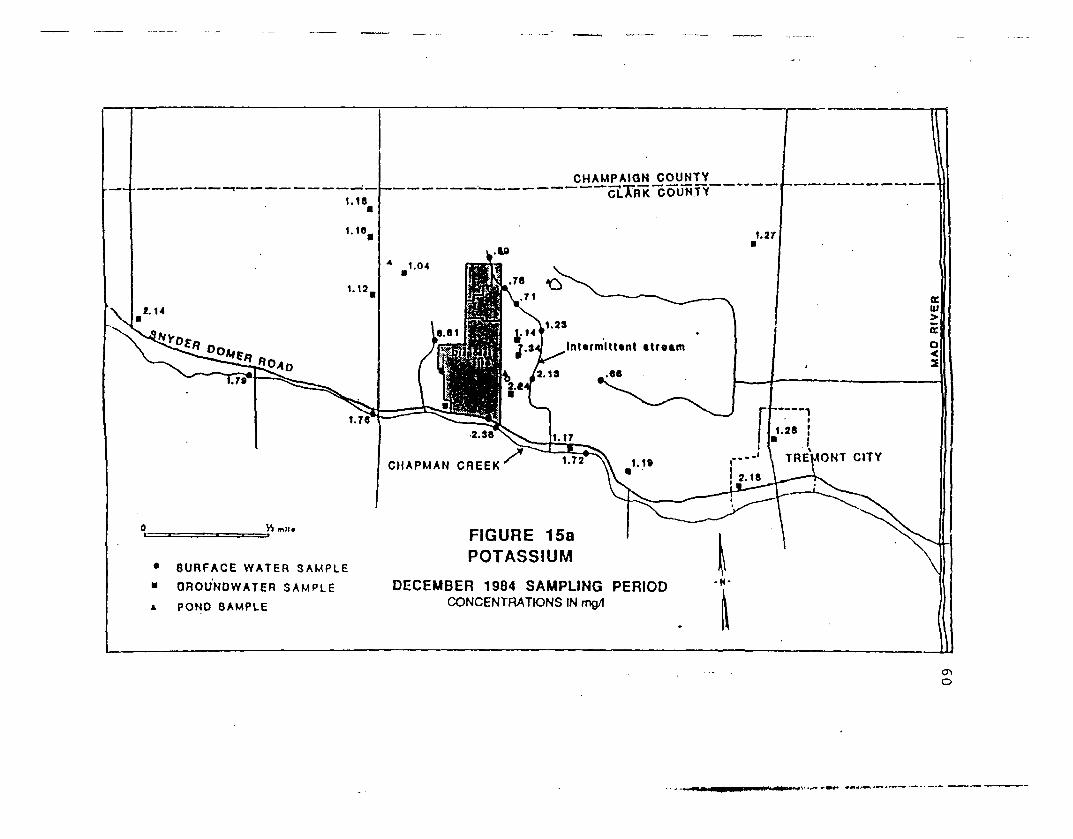
CHAMPAIONJOUNTYCOUNTY
Inttrmltttnt itrgtm
2.13 .96
CHAPMAN CREEK
FIGURE 15aPOTASSIUM• SURFACE WATER SAMPLE
QROU'NDWATER SAMPLEPOND SAMPLE
DECEMBER 1984 SAMPLING PERIODCONCENTRATIONS IN mg/1

CH AMP AIQN_C OUNTYCLA~RK COUNTY
Intermittent strtBtn
CHAPMAN CREEK
FIGURE 15bPOTASSIUM• SURFACE WATER SAMPLE
• OROU'NDWATER SAMPLEPOND SAMPLE
MAY 1985 SAMPLING PERIODCONCENTRATIONS IN mg/l

62
Surface water samples contain high potassium concentrations only at
sites 4 and AA. Ground water samples with upper range potassium
concentrations are located on the southeast side of the disposal site,
specifically sites 9 and 11. Site 17 contains an anomalously high
concentration of 2.43 mg/1, highest of the background wells sampled.
The highest concentration from a pond sample is located at PI.
Potassium concentrations from the study area are typical of
concentrations found in carbonate terrains. Significant features
observed are : 1) Groundwater samples containing high potassium
concentrations are located southeast of the disposal site. 2) The
groundwater sample from site 17 is consistently higher than background
concentrations.
Sodium
Sodium is a member of the alkali metal group and occurs in a wide
range of concentrations in natural water (Hem, 1970). Sodium
concentrations in waters from the December 1984 sampling period range
from undetectable to 42.6 mg/1 in surface water samples and
undetectable to 47.4 mg/1 in groundwater samples (Figure 16a). No
detectable sodium concentrations are evident along Chapman Creek except
at site 3, where the sample contains an elevated concentration of 42.6
mg/1. The sample at site 7 contains 21.5 mg/1, four times as much as
other samples along the intermittent stream. Groundwater concentra-
tions are high in samples at sites 9 and 17, containing 47.4 mg/1 and
32.3 mg/1, respectively.

CHAMPAIQN_COUNTYCL.TRK COUNTY
47.4] Inlermltlinl tlrvam
TREMONT CITYCHAPMAN CREEK
FIGURE 16aSODIUM• SURFACE WATER SAMPLE
OROUNDWATER SAMPLE
POND SAMPLEDECEMBER 1984 SAMPLING PERIOD
CONCENTRATIONS IN mg/l
cr>OJ

CHAMPAIQNCOiUNTYCOUNTY
Intermittent itnam
TREMONT CITYCHAPMAN CREEK
FIGURE 16bSODIUM• SURFACE W A T E R S A M P L E
• OROUNDWATER SAMPLE
POND SAMPLEMAY 1985 SAMPLING PERIOD
CONCENTRATIONS IN mg/1

65
Sodium concentrations in waters from the May 19S5 sampling period
range from 3.2 mg/1 to 29.9 mg/1 in surface water samples and 5.7 mg/1
to 66.4 mg/1 in groundwater samples. Concentrations in the pond
samples range from 1.8 mg/1 to 11.4 ag/1 (Figure 16b). Surface water
samples show little variation along both Chapman Creek and the
intermittent stream. The sample from site AA contains a high
concentration of 29.9 mg/1. Groundwater samples with elevated sodium
concentration at sites 17, 11 and 9 contain 66.4 mg/1, 22.7 gm/1 and
42.3 mg/1, respectively.
Significant features in sodium concentrations include: 1) The
samples from site 17 are consistently high in sodium. 2) Samples from
the southeast side of the disposal site are consistently higher than
background concentrations.iI
Sulfate
The element sulfur generally occurs in water in the oxidized state
as sulfate. One of the principal sources of sulfur in humid regions is
believed to be rainwater, often high in sulfur concentrations due to
air pollution. Fertilizers and sulfide minerals in the soils are other
sources (Hem, 1970). Landfills commonly have high SO " concentra-
tions in groundwater near the fills.
Sulfate concentrations in waters from the December 1984 sampling
period range from 36.0 mg/1 to 131.2 mg/1 in surface water samples and
6.45 mg/1 to 96.5 mg/1 in groundwater samples analyzed (Figure 17a).
Among the surface water samples, site 3, containing a concentration of
131.2 mg/1 is significantly higher than any other samples. Along the
intermittent stream, concentrations increase from 36.0 -g/1 at site 5

CHAMPAIGN JOUNTY
CHAPMAN CREEK
FIGURE 17aSULFATE• SURFACE WATER SAMPLE
• OROU'NDWATER SAMPLEt POND SAMPLE
DECEMBER 1984 SAMPLING PERIODCONCENTRATIONS IN mg/1
en01
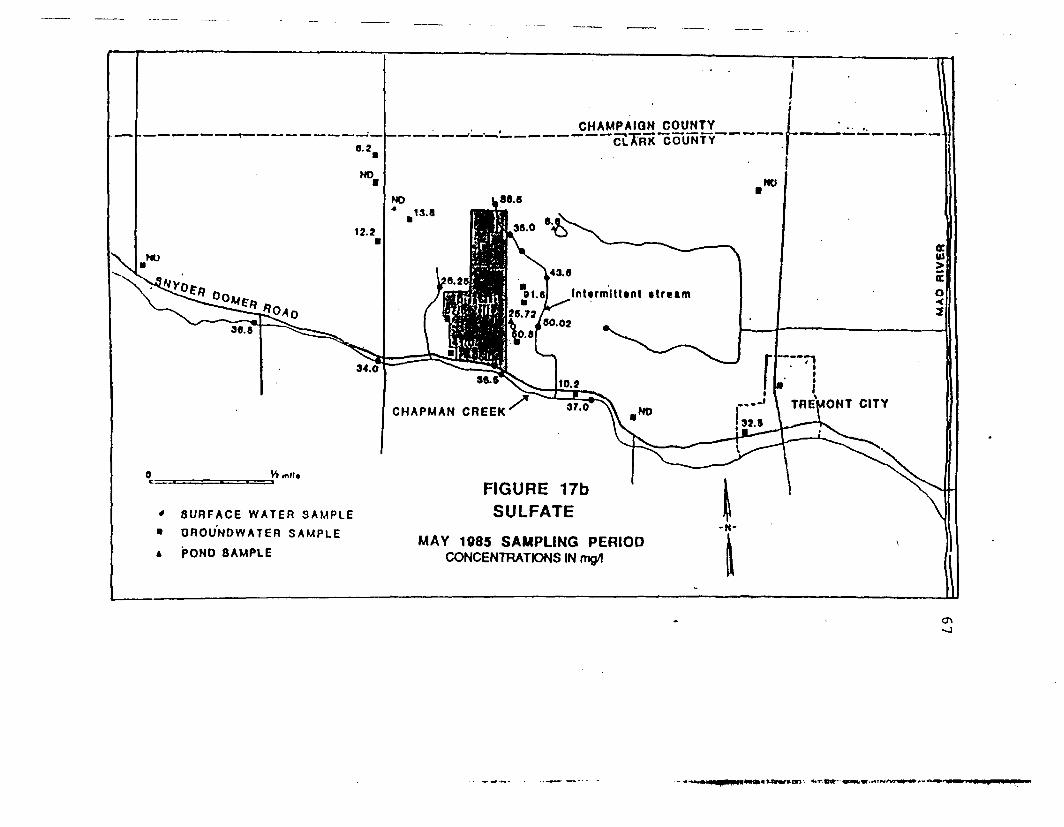
CHAMPAIGN COUNTY
CHAPMAN CREEK
FIGURE 17bSULFATE
MAY 1985 SAMPLING PERIODCONCENTRATIONS IN mg/1
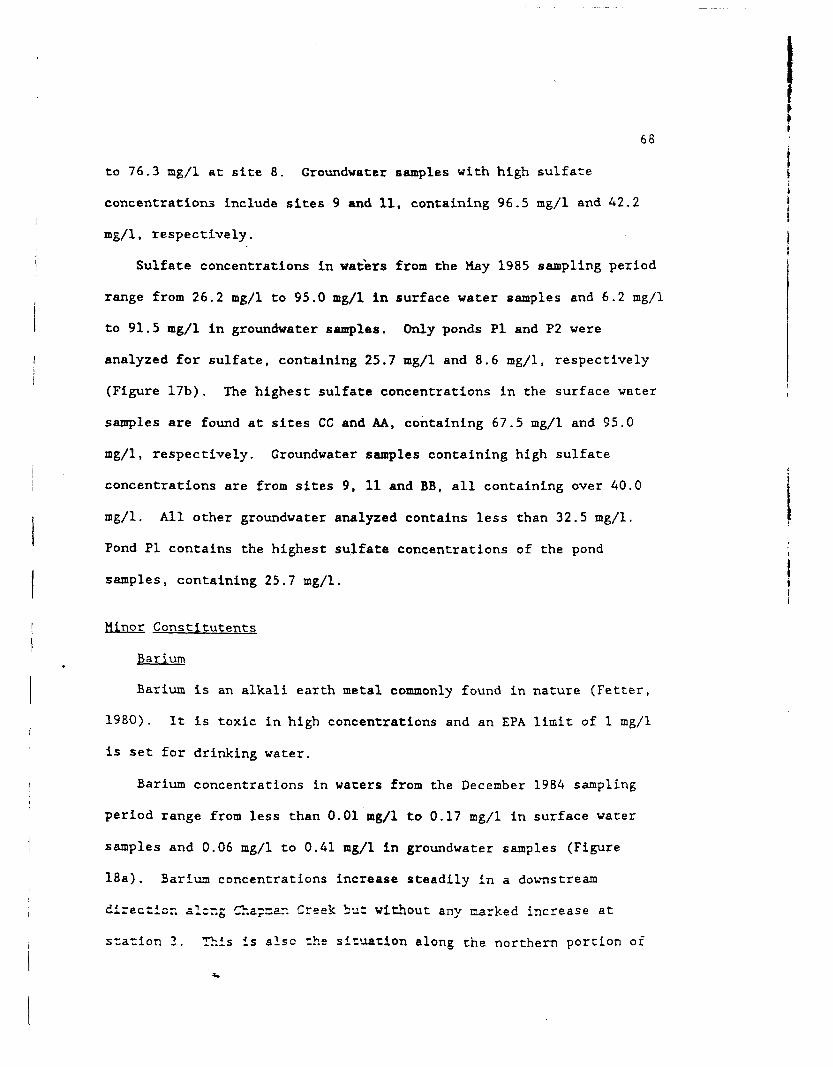
68
to 76.3 mg/1 at site 8. Groundwater samples with high sulfate ji
concentrations include sites 9 and 11, containing 96.5 mg/1 and 42.2 jI
mg/1, respectively. |ii
Sulfate concentrations in waters from the May 1985 sampling period
range from 26.2 mg/1 to 95.0 mg/1 in surface water samples and 6.2 mg/1
to 91.5 mg/1 in groundwater samples. Only ponds PI and P2 were
analyzed for sulfate, containing 25.7 mg/1 and 8.6 mg/1, respectively
(Figure 17b). The highest sulfate concentrations in the surface water
samples are found at sites CC and AA, containing 67.5 mg/1 and 95.0
mg/1, respectively. Groundwater samples containing high sulfate
concentrations are from sites 9, 11 and BB, all containing over 40.0
mg/1. All other groundwater analyzed contains less than 32.5 mg/1.
Pond PI contains the highest sulfate concentrations of the pond
samples, containing 25.7 mg/1.
Minor Constituents
Barium
Barium is an alkali earth metal commonly found in nature (Fetter,
1980). It is toxic in high concentrations and an EPA limit of 1 mg/1
is set for drinking water.
Barium concentrations in waters from the December 1984 sampling
period range from less than 0.01 mg/1 to 0.17 mg/1 in surface water
samples and 0.06 mg/1 to 0.41 mg/1 in groundwater samples (Figure
18a). Barium concentrations increase steadily in a downstream
directicr. ai—.g Chapsar. Creek but without any narked increase at
station 2. This is also the situation along the northern portion of

CHAMPAIQN_COUNTYCL.TRK COUNTY"
251-106
.124 Intermittent itrtim
.351.
.081,
.3fl5_
* .288
.273
Vl rnll*
• SURFACE W A T E R S A M P L E
• QROUNOWATER SAMPLE
A POND 3AMPLE
FIGURE 18aBARIUM
DECEMBER 1984 SAMPLING PERIODCONCENTRATIONS IN mg/l
CTvU5

CHAMPAIGN JCOUNTYcLTRK COUNTY
.1111 Inlsrmltltnl •Irtim
CHAPMAN CREEK
FIGURE 18bBARIUM• SURFACE W A T E R SAMPLE
• QROUNDWATER SAMPLEPOND SAMPLE
MAY 1985 SAMPLING PERIODCONCENTRATIONS IN mg/1

71
the Intermittent stream. The highest concentration in the groundwater
samples are from site 11, containing .41 mg/1 barium.
Barium concentrations in waters from the May 1985 sampling period
range from undetectable to 0.1 mg/1 in surface water samples and
undetectable to 0.38 mg/1 in groundwater samples. Pond samples range
from undetectable to 0.05 mg/1 (Figure 18b). Barium concentrations in
surface water samples are variable with the highest concentrations at
sites 4, 8, and AA. Groundwater samples are also highly variable. , The
highest barium concentration is found at site 11, containing .379
mg/1. No significant features were noted other than consistently high
barium concentrations in samples from site 11.
Boron
Boron is found in most natural waters as a minor constituent. It
is essential to plant growth but is toxic to some plants in high
concentrations (Hem, 1970). No levels have been set for drinking water
standards as of this writing.
Boron concentrations in waters from the December 1984 sampling
period range from undetectable to less than .7 mg/1 in surface water
samples (Figure 19a). Only one groundwater sample contains any
detectable boron, site 21 containing less than .7 ug/1. Boron is
detected only at sites 6 and 8 among the surface water samples, both
containing less than .7 mg/1.
Boron concentrations in waters of the May 1985 sampling period
range from undetectable to 0.84 mg/1 in surface vater samples and from
undetectable to less than 0.7 mg/1 In grour.dvater samples. No boron

CHAMPAIGN COUNTYCL.TRK COUNTY
TREMONT CITYCHAPMAN CREEK
FIGURE 19aBORON• SURFACE W A T E R S A M P L E
• QROUNDWATER SAMPLE
• POND SAMPLEDECEMBER 1984 SAMPLING PERIOD
CONCENTRATIONS IN m<j/1
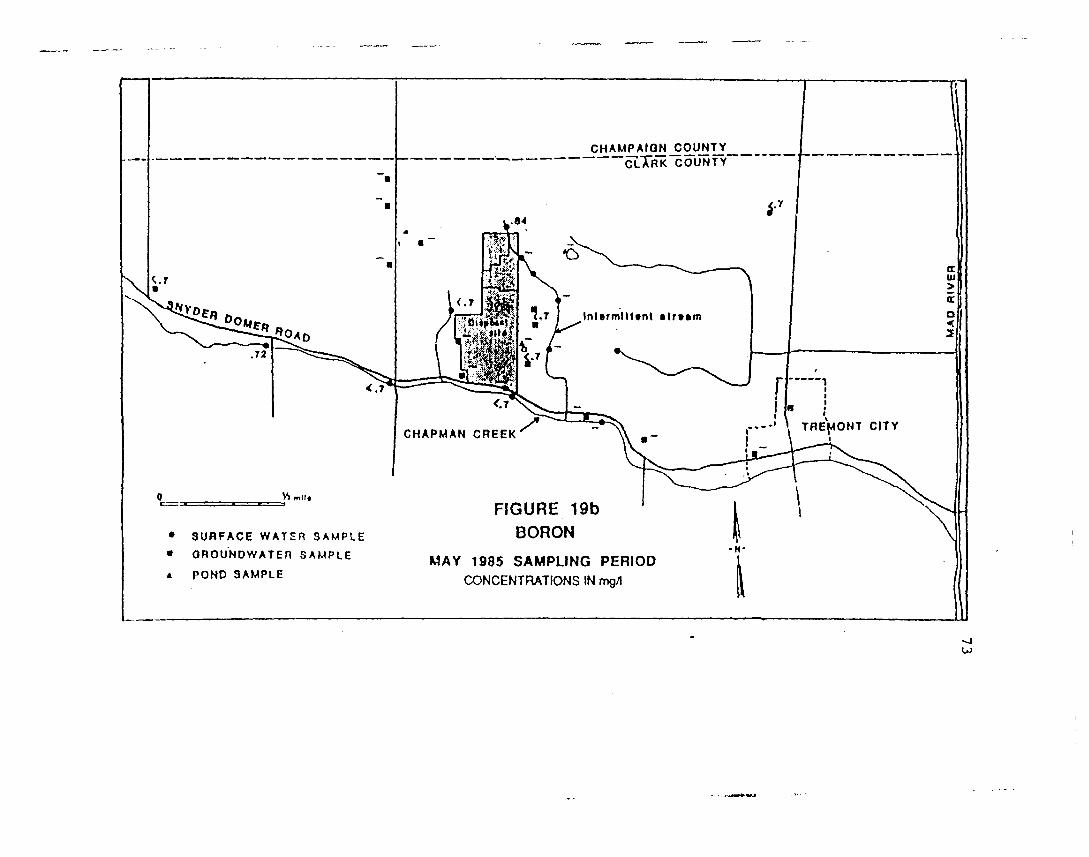
CHAMPAIQNJCOUNTYCJLTflK COUNTY
Intermittent • Irtam
TREMONT CITYCHAPMAN CREEK
FIGURE 19bBORON• SURFACE WATER SAMPLE
• OROUNDWATER SAMPLE• POND SAMPLE
MAY 1985 SAMPLING PERIODCONCENTRATIONS IN mg/l
u>

74
was detected in the pond samples. Boron concentrations in the surface
water samples are highest at sites 1 and 5, with concentrations of .72
ng/1 and .84 ffig/1 respectively. Groundwater samples showed no
anomalous values (Figure 19b).
Cadmium
Cadmium is not abundant in the environment and is toxic to animals
and humans in small concentrations (Fetter, 1980). A drinking water
standard of .01 mg/1 has been set by the EPA. •
Cadmium concentrations from the December 1984 sampling period in
both the surface water and groundwater samples ranged from undetectable
to .007 mg/1. The highest concentration of cadmium in the surface
water samples is from site 4, containing .007 mg/1. A slight increase
is noted at sample site 3 below the discharge pipe in Chapman Creek.
The highest groundwater concentration is found at site 12, containing
.007 mg/1 cadmium. Site 11's sample contains the next highest cadmium
concentration, .005 mg/1. All other samples contain .002 mg/1 or less
(Figure 20a).
Cadmium concentrations in the May 1985 sampling period range from
.001 mg/1 to .011 mg/1 in surface water samples and .005 mg/1 to .012
mg/1 in groundwater samples. Concentrations in pond samples range from
.002 mg/1 to .005 mg/1. The only anomalous concentration in the
surface water samples is from the site CC, containing .011 mg/1
cadmium. The highest concentrations in the groundwater samples are
from sites 11 and 25, both containing .012 =g/l. Other high
concentrations are noted at sites 16, 19 and 20, each containing .010
mg/I cadmium (Figure 20b).

CHAMPAIGNCOUNTYCOUNTY
Intermittent tlritm
TREMONT CITYCHAPMAN CREEK
FIGURE 20aCADMIUM3URFACE WATER SAMPLE
• "3ROUNOWATER SAMPLE
4 PONO 3AMPLEDECEMBER 1984 SAMPLING PERIOD
CONCENTRATIONS IN mgfl

CHAMPAIGN _COUNTYCLTRK COUNTY
Intermittent tlrttm
TREMONT CITYCHAPMAN CREEK
FIGURE 20bCADMIUMSURFACE W A T E R SAMPLE
OROUNDWATER SAMPLE
POND SAMPLE MAY 1985 SAMPLING PERIODCONCENTRATIONS IN mg/1
CTl

77
Though no clear trends are apparent in the cadmium concentrations,
the values are notably high in the May 1985 groundwater samples, some
above the EPA drinking water standard of .01 mg/1.
Chromium
Chromium is a metallic element which is found in the earth's crust
in moderate concentrations, but only at low concentrations, usually
less than .010 mg/1, in natural water (Fetter, 1980). A drinking water
standard of 0.05 mg/1 of total chromium has been set due to the
toxicity of chromium in a hexavalent state (EPA, 1976). Chromium
occurs in several oxidation states dependent on the thermodynamic
conditions present in the system. The analysis included in this study
is referred to as total chromium and does not indicate the element's
oxidation state. Chromium is often associated with industrial
pollution and can be corrosive in higher concentrations.
Chromium concentrations from waters of the December 1984 sampling
period range from undetected to .055 mg/1 in surface water samples and
from undetected to less than .003 mg/1 in groundwater samples. The
only anomalous value noted in December's samples is the .055 mg/1
chromium concentration from site 5, located next to the northern border
of the site. This drops off significantly downstream from this site
(Figure 21a).
Chromium concentrations in the May 1985 sampling period range from
undetectable to 0.01 mg/1 in surface water and from undetectable to
.008 mg/1 in groundwater samples. The highest concentrations Ir. the
surface samples are form site 6 and 5. near the northeast border cf the

* OURFACE W A T E R SAMPLE
* OROUNOWATER S A M P L E* POND SAMPLE
FIGURE 21aCHROMIUM
DECEMBER 1984 SAMPLING PER.QDCONCENTRATIONS IN mg/|
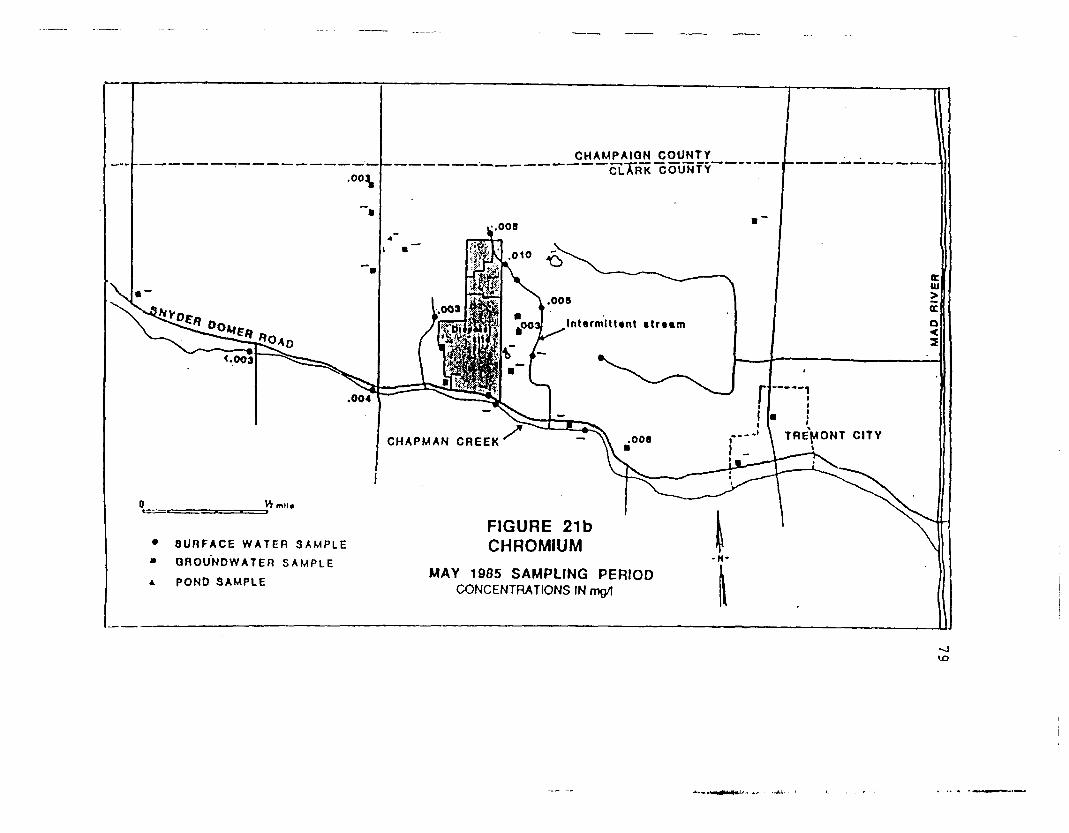
CHAMPAIGN _COUNTYCI.TRK COUNTY
IntormltUnt itrttm
TREMONT CITYCHAPMAN CREEK
FIGURE 21bCHROMIUM• SURFACE W A T E R S A M P L E
• OROUNDWATER S A M P L E
POND SAMPLE MAY 1985 SAMPLING PERIODCONCENTRATIONS IN mg/l
UD

80
site. The household well at site 14 contains the highest groundwater
chromium concentration of .008 mg/1 but this is well below EPA
standards for chromium (Figure 21b).
Significant features noted in the chromium analysis are: 1)
Chromium is found primarily in the surface water samples, in most cases
at lew concentrations, 2) The highest concentrations are found along
the northeast border of the site in the surface watei samples,
primarily site 5 and 6.
Cobalt
Cobalt is a minor constituent found in nature and is found in low
concentrations in groundwater and surface water (Hem, 1970). Cobalt is
also a known constituent in some industrial products such as paints and
lacquers. For this reason, it has been included in the analysis of
this study, as paints and paint by-products are known to have been
disposed of at this site.
Cobalt concentrations in the December 1984 sampling period range
from less than 0.01 mg/1 to 0.021 mg/1 in surface water samples and
from less than 0.01 ing/1 to 0.03 mg/1 in groundwater samples. No
anomalous values are noted in the surface water samples. The highest
concentrations in the groundwater samples are contained in samples fron
the east side of the disposal site, sampling sites 21 and 11,
containing .03 mg/1 and .027 mg/1 respectively. The samples from site
20 northwest of the disposal site also show a value of .027 mg/1
(Figure 22a).
CHAMPAIGN _COUNTYCL.TRK COUNTY
Inttrrnltlent •iriam
.011. <.014
,..-' \ YREMONT CITYI .010
CHAPMAN CREEK
FIGURE 22aCOBALTSURFACE WATER SAMPLE
• OROUNDWATER SAMPLE*. POND SAMPLE DECEMBER 1984 SAMPLING PERIOD
CONCENTRATIONS IN mg/1
oo

CHAMPAIGN COUNTY5LTRK COUNTY
Intermittent ctrtam
TREMONT CITYCHAPMAN CREEK
FIGURE 22bCOBALT• SURFACE WATER SAMPLE
" OROUNDWATER SAMPLE
POND SAMPLE MAY 1985 SAMPLING PERIODCONCENTRATIONS IN mg/1
00
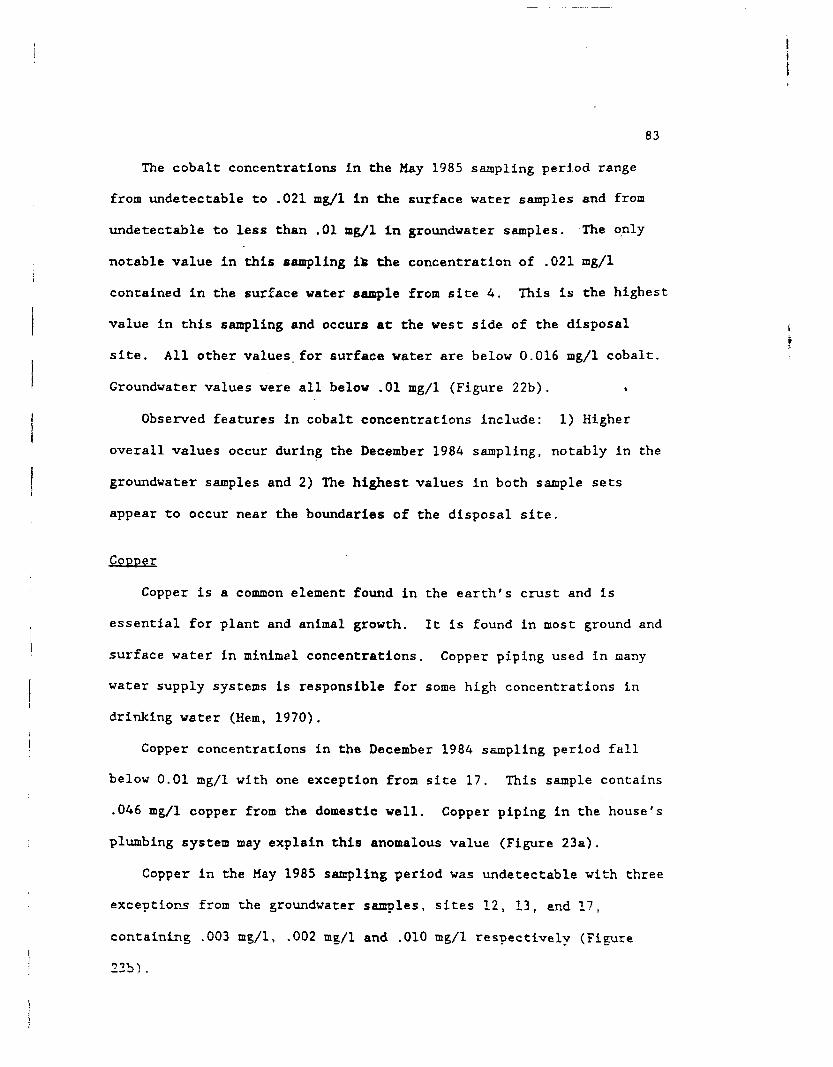
83
The cobalt concentrations in the May 1985 sampling period range
from undetectable to .021 mg/1 in the surface water samples and from
undetectable to less than .01 mg/1 in groundwater samples. The only
notable value in this sampling is the concentration of .021 mg/1
contained in the surface water sample from site 4. This is the highest
value in this sampling and occurs at the west side of the disposal
site. All other values for surface water are below 0.016 mg/1 cobalt.
Groundwater values were all below .01 mg/1 (Figure 22b). •
Observed features in cobalt concentrations include: 1) Higher
overall values occur during the December 1984 sampling, notably in the
groundwater samples and 2) The highest values in both sample sets
appear to occur near the boundaries of the disposal site.
Copper
Copper is a common element found in the earth's crust and is
essential for plant and animal growth. It is found in most ground and
surface water in minimal concentrations. Copper piping used in many
water supply systems is responsible for some high concentrations in
drinking water (Hem, 1970).
Copper concentrations in the December 1984 sampling period fall
below 0.01 mg/1 with one exception from site 17. This sample contains
.046 mg/1 copper from the domestic well. Copper piping in the house's
plumbing system may explain this anomalous value (Figure 23a).
Copper in the May 1985 sampling period was undetectable with three
exceptions from the groundwater samples, sites 12, 13, and 17,
containing .003 mg/1, .002 mg/1 and .010 mg/1 respectively (Figure

CHAMPAION_COUNTYCt-TRK COUNTY
002
Inttrmlttant itrtim
TRE^ONT CITY
FIGURE 23aCOPPER• SURFACE W A T E R SAMPLE
" OROUNOWATER SAMPLEt POND SAMPLE DECEMBER 1984 SAMPLING PERIOD
CONCENTRATIONS IN mg/l

C H A M A I G N COUNTYCOUNTY
Inlermlllent itr(«m
7REMONT CITYCHAPMAN CREEK
FIGURE 23bCOPPER• SURFACE WATER SAMPLE
• OROUNDWATER SAMPLE« POND SAMPLE MAY 1985 SAMPLING PERIOD
CONCENTRATIONS IN mg/1

86
No features were noted among the copper concentrations with the
exception of high concentrations from site 17, most likely due to the
house's copper piping.
Iron
Iron is an element found throughout nature in abundant
proportions. Iron is essential to all animals and plants metabolism.
Dissolved iron concentrations in natural waters are dependent upon the
chemical equilibrium of the system. This is controlled by pH,
oxidation and reduction, complexing and the presence of hydroxides,
carbonates and sulfides in the solution (Hem, 1970).
Iron concentrations in the December 1984 sampling period range from
less than .009 mg/1 to .36 mg/1 in surface water samples and .17 mg/1
to 3.12 ng/1 in groundwater samples. Iron in surface water samples
increases considerably at sites 3 and 10 along Chapman Creek, below the
discharge pipe. A high concentration is also noted at site 4,
containing .321 mg/1 iron. Groundwater iron concentrations are
significantly high from samples at sites 11 and 16, containing 3.12
mg/1 and 2.51 mg/1, respectively. Other high concentration over 1.0
mg/1 are present at sites 18 and 21. All other groundwater samples
contain concentrations less than .55 mg/1 (Figure 24a) .
Iron concentrations from the May 1985 sampling period range from
•undetectable to 1.22 mg/1 in surface water samples and less than .008
ng/1 to 2.92 mg/1 in surface water samples. Pond samples range from
undetectable to .07 mg/1. Many of the surface water samples contain
iron concentrations below the .008 mg/1 detection limit, with some
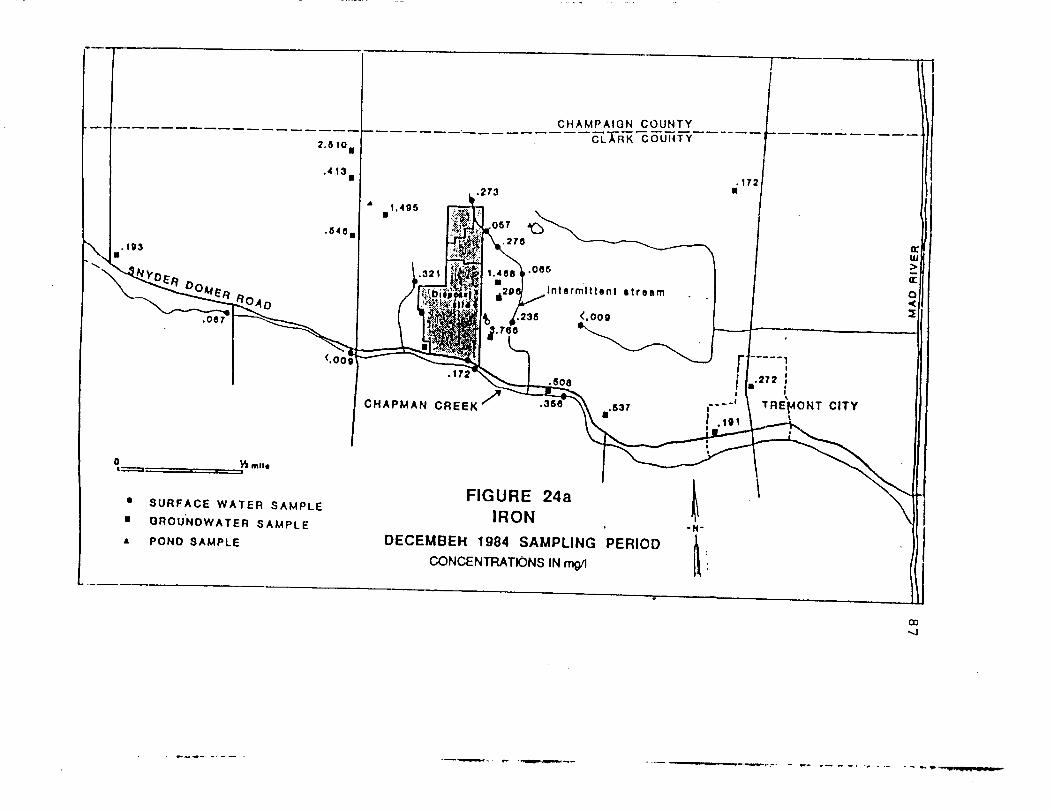
C H A M P A I G N COUNTYCLARK COUNTY
.005
I n te rm i t ten t s t r e a m
236 Coog
CHAPMAN CREEK TREMONT CITY
FIGURE 24aIRON
DECEMBEH 1984 SAMPLING PERIODCONCENTRATIONS IN mg/1
• SURFACE W A T E R SAMPLE• OROUNDWATER S A M P L E
POND SAMPLE
00

CHAMPAIQN_COU_NTYCI.TRK coUNfv
.012/ Jnlermlttent alrenm
TREMONT CITYCHAPMAN CREEK
FIGURE 24bIRON• SURFACE WATER SAMPLE
• QROUNDWATER SAMPLE
4 POND SAMPLE MAY 1985 SAMPLING PERIODCONCENTRATIONS IN mgA

39
exceptions including site CC, containing 1.22 mg/1. Grcundwater
samples containing the highest iron concentrations are from sites 11
and 15, containing 2.92 mg/1 and 1.93 mg/1, respectively. Sites 18, 25
and BB have samples containing above .99 mg/1 iron. All other
groundwater samples contain less than .37 mg/1 (Figure 24b).
Significant features in iron concentrations are: 1) Groundwater
samples from sites 16 and 11 are the highest in iron concentrations i
from both sampling periods. 2) Groundwater samples from the vicinity '4
cf the disposal site are higher in iron concentrations compared to
background values.
Lead*
Lead is an element known to be toxic to most species at elevated j
concentrations. The drinking water standard set by the EPA is .05
mg/1. ;
Lead concentrations from the December 1984 sampling period range
from undetectable to less than .03 mg/1 in surface water samples and
range from undetectable to .07 mg/1 in groundwater samples. The
highest lead concentration in the groundwater samples is from site 11,
containing .07 mg/1. Samples from site 18 and 14, both contain
concentrations of .05 mg/1 (Figure 25a).
Lead concentrations in the May 1985 sampling period range from .03
mg/1 to .10 mg/1 in surface water samples and .03 mg/1 to .10 mg/1 in
groundwater samples. Pond samples range from .04 mg/1 to .05 mg/1.
High concentrations of lead in surface water samples are found at sites
4 and 3, both containing .10 ng/1. The sample froa site 5 contains an
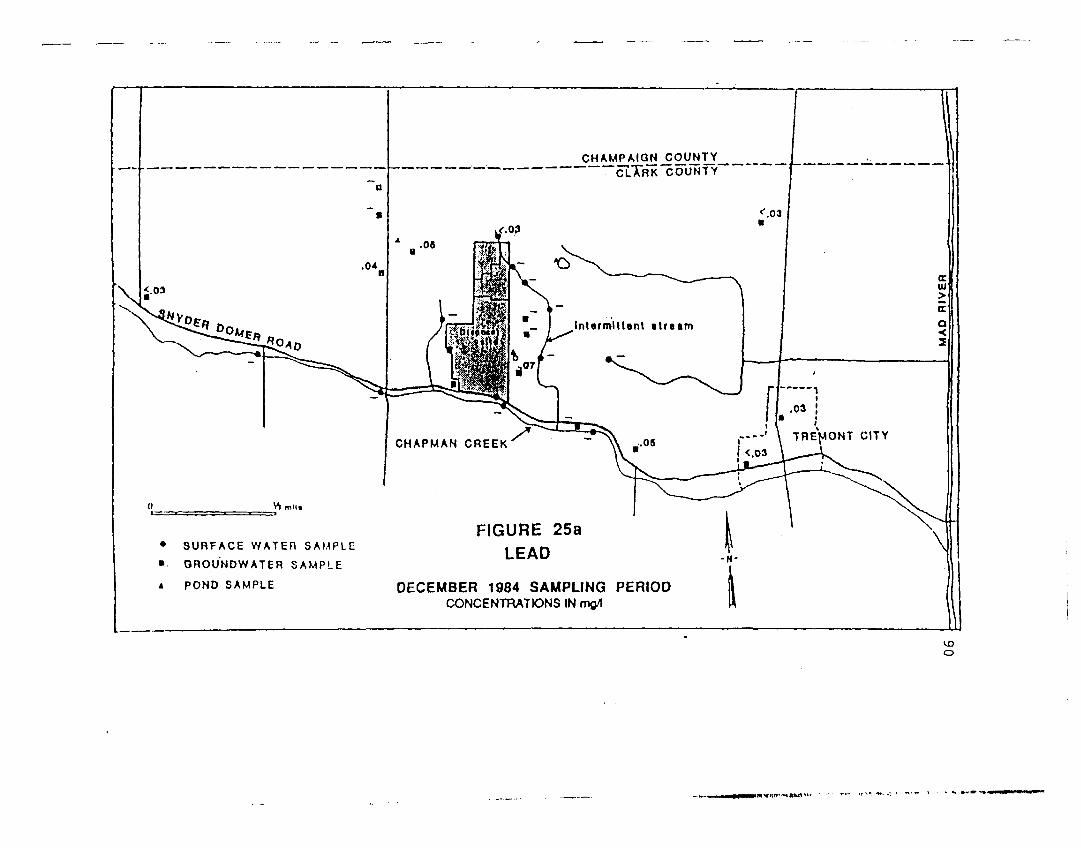
CHAMPAIGN COUNTYCOUNTY
Intermittent s t ream
TREMONT CITYCHAPMAN CREEK
FIGURE 25aLEAD• SURFACE WATER SAMPLE
• OROUNDWATER SAMPLE4 POND SAMPLE DECEMBER 1984 SAMPLING PERIOD
CONCENTRATIONS IN mg/l
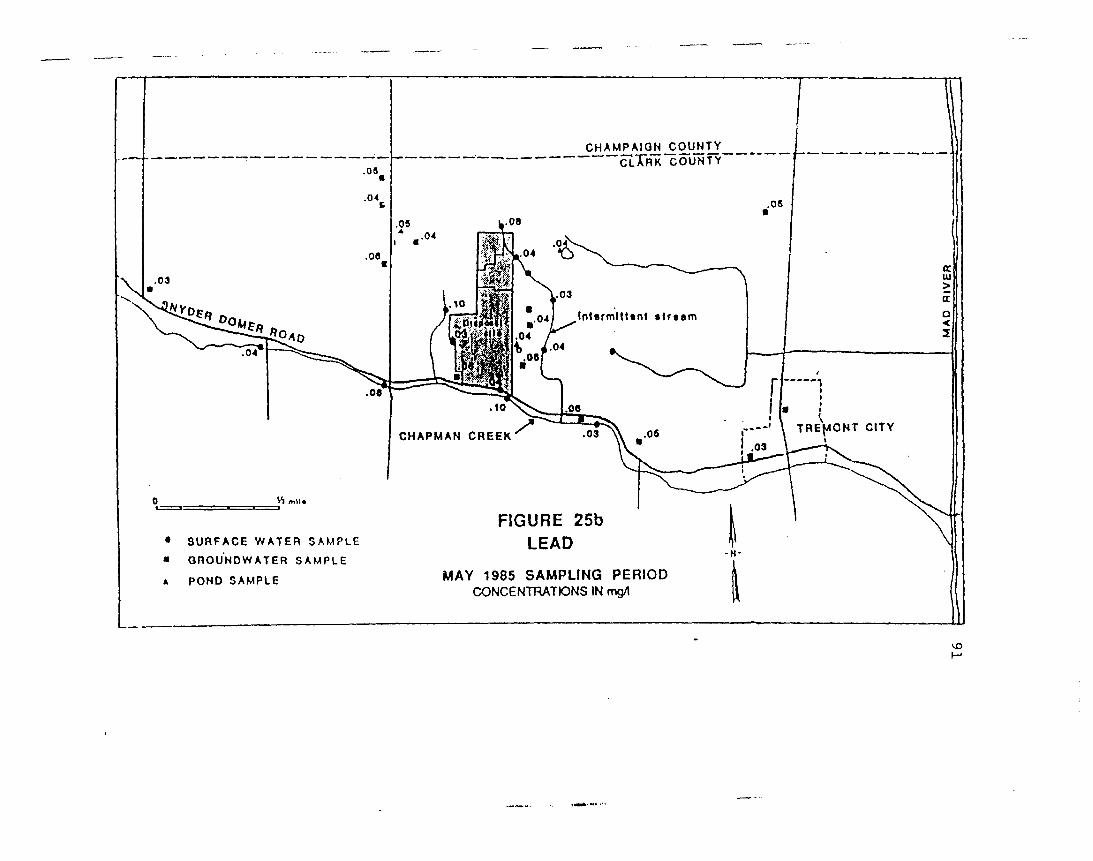
CHAMPAK3N DOUNTYCO"UNfY
TREMCNT CITYCHAPMAN CREEK
FIGURE 25bLEAD• SURFACE WATER SAMPLE
OROUNDWATER SAMPLE
POND SAMPLE MAY 1985 SAMPLING PERIODCONCENTRATIONS IN mg/l
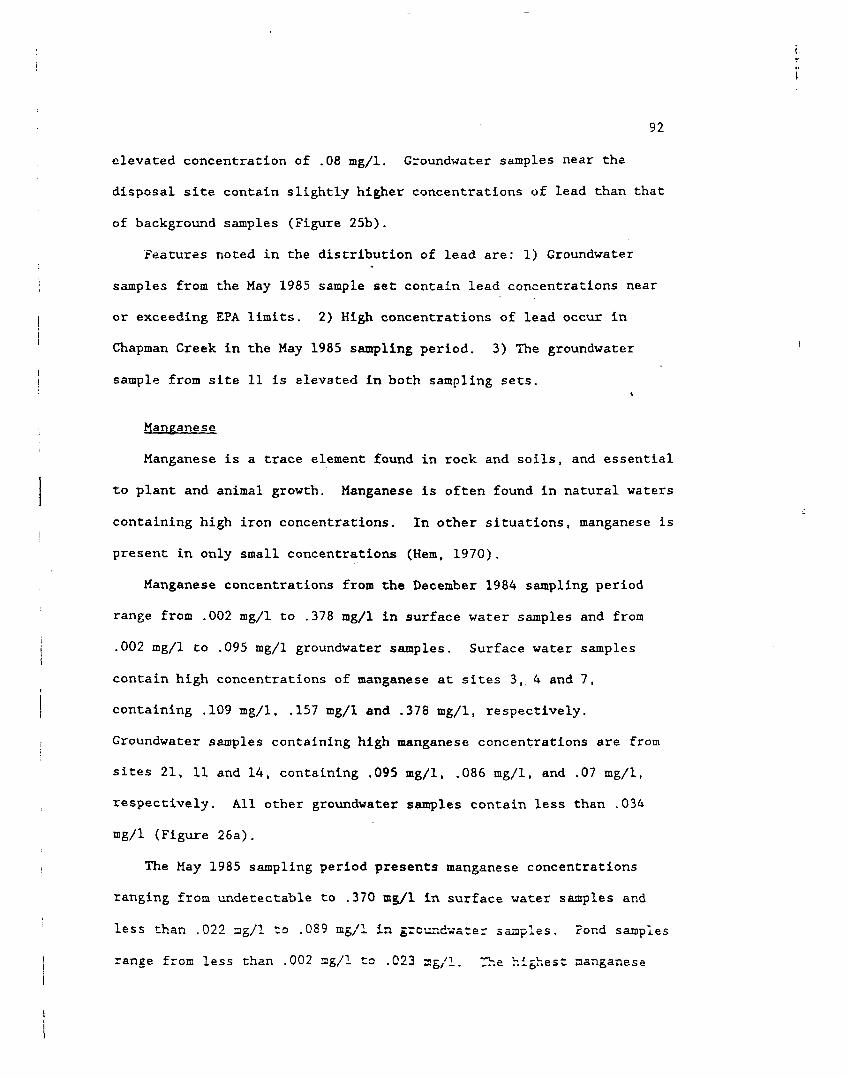
92
elevated concentration of .08 mg/1. Groundwater samples near the
disposal site contain slightly higher concentrations of lead than that
of background samples (Figure 25b) .
Features noted in the distribution of lead are: 1) Groundwater
samples from the May 1985 sample set contain lead concentrations near
or exceeding EPA limits. 2) High concentrations of lead occur in
Chapman Creek in the May 1985 sampling period. 3) The groundwater
sample from site 11 is elevated in both sampling sets.«
Manganese
Manganese is a trace element found in rock and soils, and essential
to plant and animal growth. Manganese is often found in natural waters
containing high iron concentrations. In other situations, manganese is
present in only small concentrations (Hem, 1970).
Manganese concentrations from the December 1984 sampling period
range from .002 mg/1 to .378 mg/1 in surface water samples and from
.002 mg/1 to .095 mg/1 groundwater samples. Surface water samples
contain high concentrations of manganese at sites 3,4 and 7,
containing .109 mg/1, .157 mg/1 and .378 mg/1, respectively.
Groundwater samples containing high manganese concentrations are from
sites 21, 11 and 14, containing .095 mg/1, .086 ng/1, and .07 mg/1,
respectively. All other groundwater samples contain less than .034
mg/1 (Figure 26a).
The May 1985 sampling period presents manganese concentrations
ranging from undetectable to .370 mg/1 in surface water samples and
less than .022 sg/1 to .089 mg/1 in ground-water samples. Pond samples
range from less than .002 mg/1 to .023 ag/1. The highest aariganese

_ _.ClTRK COUNTY
CHAPMAN CREEK TREMONT CITY
FIGURE 26aMANGANESE
SURFACE W A T E R S A M P L EOROU'NOWATER S A M P L EPOND SAMPLE DECEMBER 1984 SAMPLING PERIOD
CONCENTRATIONS IN mg/l
voU)

CHAMjMION_COUNTYCLA~RK COUNTY
.008
•0091 Intermittent strum
----' » TREMONT CITY
002CHAPMAN CREEK
FIGURE 26bMANGANESESURFACE W A T E R SAMPLE
OFIOUNDWATER SAMPLE
POND SAMPLEMAY 1985 SAMPLING PERIOD
CONCENTRATKDNS IN mg/t

95
concentrations in surface water samples are form sites 4 and CC,
containing .099 mg/1 and .370 mg/1 respectively. Manganese
concentrations in groundwater samples are highest at sites 11, 14, and
BB, containing .089 mg/1, .075 ng/1 and .062 mg/1, respectively. The
highest concentrations for pond samples Is from Pond PI, containing
.023 mg/1 (Figure 26b).
Notable features in manganese distribution are: 1) High manganese
concentrations in surface water samples are limited to the vicinity of•the disposal. 2) Groundwater samples indicate decreasing manganese
concentrations at samples further distances from the site.
Nickel is a metal non-toxic to humans, and found in low concen-
trations in natural waters. It is often found in high concentrations
in waters from highly mineralized regions.
Nickel concentrations in the December 1984 sampling set range from
.026 irg/1 to .071 ng/1 in surface water samples and .04 mg/1 to .085
mg/1 in groundwater samples. No anomalous nickel concentrations are
noted in the surface water samples except for a slight increase at site
3 along Chapman Creek. The highest nickel concentration in the
groundwater samples are from sites 11 and 9, but these are only
slightly higher than background concentrations (Figure 27a).
Nickel concentrations in the May 1985 sampling period range from
below .009 mg/1 to .029 mg/1 in surface water samples and .012 mg/1 to
.044 mg/1 in groundwater samples. Pond samples all contained
concentrations below .009 mg/1. Surface water samples contain no

CH AMPAI ON _COUNTYCtTRK COUNTY
^Intermittent s t ream
.048 .038
TREMONT CITYCHAPMAN CREEK
FIGURE 27aNICKELSURFACE W A T E R SAMPLE
OROUNDWATER S A M P L E
POND SAMPLE DECEMBER 1984 SAMPLING PERIODCONCENTRATIONS IN mg/1
UDCTi
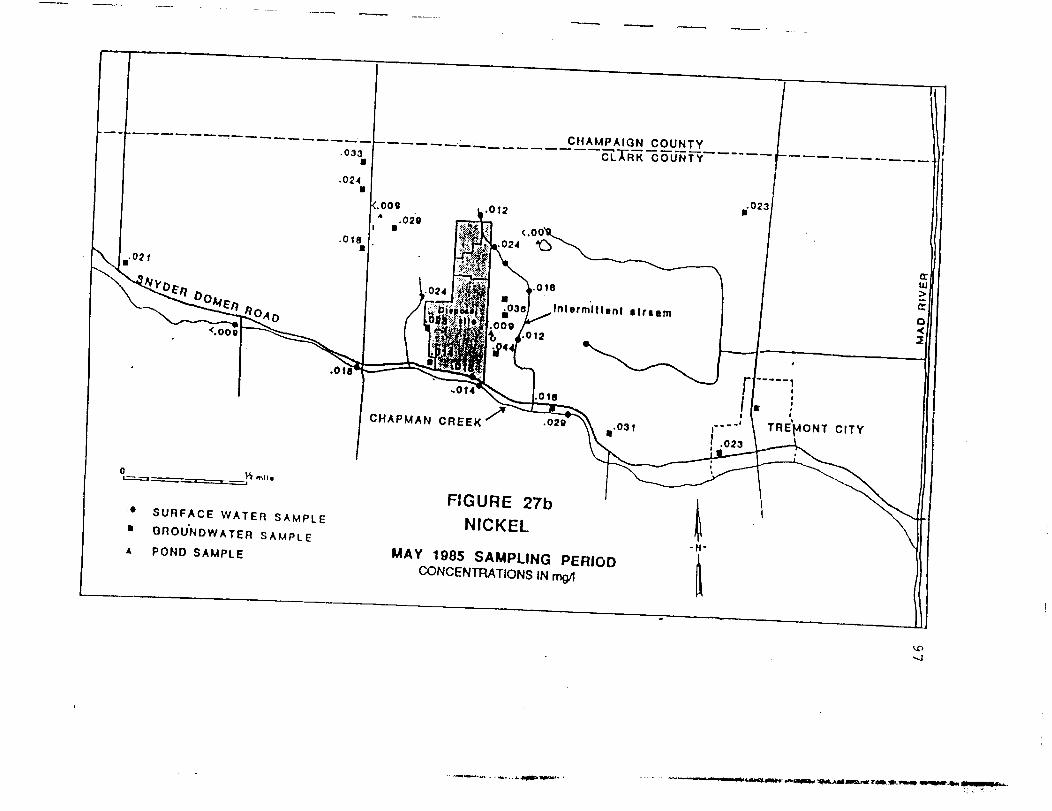
_ _ ._CL.TRK COUNTY
CHAPMAN CREEKTREMONT CITY
FIGURE 27bNICKEL
• SURFACE WATER SAMPLE• QROUNDWATER SAMPLE
POND SAMPLE MAY 1985 SAMPLING PERIODCONCENTRATIONS IN mg/l

98
anomalous nickel concentrations. Groundwater samples containing the
highest nickel concentrations are found at sites 11 and 9, as in
December's sampling set (Figure 27b). The only features evident are
consistently higher values at site 11 and 9 from groundwater samples.
Silica
Silica is the second most abundant element in the earth's crust and
is found in variable amounts in natural water. Groundwater samples are
generally higher in dissolved silica than surface water samples, as is
the case in both sampling periods of this study.
Silica concentrations from the December 1984 sampling period range
from 2.67 mg/1 to 5.68 mg/1 in surface water samples and 4.71 mg/1 to
8.40 mg/1 in groundwater samples (Figure 28a).
Silica concentrations in the May 1985 sampling period range from
1.28 mg/1 to 5.64 mg/1 in surface water samples and 4.08 mg/1 to 7.64
mg/1 in groundwater. Pond samples range from undetectable to .54 mg/1
(Figure 28b).
Silica concentrations are highly variable in both sampling periods
with no evident trends.
Strontium
Strontium is a common element found in minor amounts throughout
nature. It is usually found only in low concentrations in natural
waters with few exceptions (Hem, 1970).
Strontium concentrations in the December 1984 sampling period range
from .034 mg/1 to 1.37 mg/1 in surface water samples and .12 mg/1 to
10.26 mg/1 in groundwater samples. Surface water samples show a high

CHAMP AIGN_COUNTYCtTRK COUNTY
{.41g.4l/ IntBrmttlent • t r tam
TREMONT CITYCHAPMAN CREEK
FIGURE 28aSILICA• SURFACE WATER SAMPLE
» OROUNDWATER SAMPLE
POND SAMPLEDECEMBER 1984 SAMPLING PERIOD
CONCENTRATIONS IN mg/1

CHAMPAIGN COUNTYCtTflK COUNTY
2.62
0.24' Intermittent s t ream
, , TREMONT CITY
' j4.oeCHAPMAN CREEK
FIGURE 28bSILICA• SURFACE WATER SAMPLE
OROUNDWATER SAMPLE
POND SAMPLE MAY 1985 SAMPLING PERIODCONCENTRATIONS IN mo/1
oo

101
degree in variability in strontium concentrations as do groundwater
samples. Groundwater samples contain anomalous concentrations at sites
16, 18 and 20, containing 10.26 mg/1, 6.82 mg/1 and 7.93 mg/1,
respectively. Other groundwater samples contain less than 4.85 mg/1
strontium (Figure 29a).
Strontium concentrations in the May 1985 sampling period range from
.067 mg/1 to 1.59 mg/1 in the surface water samples and .11 mg/1 to
11.40 mg/1 in groundwater samples. Pond samples range from•
undetectable to .029 mg/1. No elevated strontium concentrations are
noted in the surface water samples. Groundwater samples containing the
highest strontium concentrations are from 16, 18 and 20, containing
11.40 mg/1, 8.3 mg/1 and 7.2 mg/1 strontium (Figure 29b).
The groundwater and surface water in the study area contain
unusually high concentrations of strontium. Samples from sites 16, 18
and 20 are consistently high. The limestones in the study area contain
unusually high concentrations of celestite (SrSO ) which may explain
the high concentrations of strontium in the water samples.
Zinc
Zinc is a trace metal commonly found in many rocks and throughout
the environment. It is essential to human metabolism but can be toxic
in large quantities. There is no EPA drinking water standard for zinc
but a suggested criterion of 5 mg/1 has been set for esthetic reasons.
Zinc concentrations In the December 1984 sampling period range from
.026 mg/1 to 1.71 mg/1 in the groundwater samples. The sample from
site 5 is the only surface water sample that contains detectable zinc.

CHAMPAIQN_COUNTYCI.TRK COUNTY
Intermittent s t r e a m
.034
.482
CHAPMAN CREEK TREMONT CITY
FIGURE 29aSTRONTIUM• SURFACE WATER SAMPLE
• OROU'NOWATER SAMPLEA POND SAMPLE
DECEMBER 1984 SAMPLING PERIODCONCENTRATIONS IN mg/l
ofO
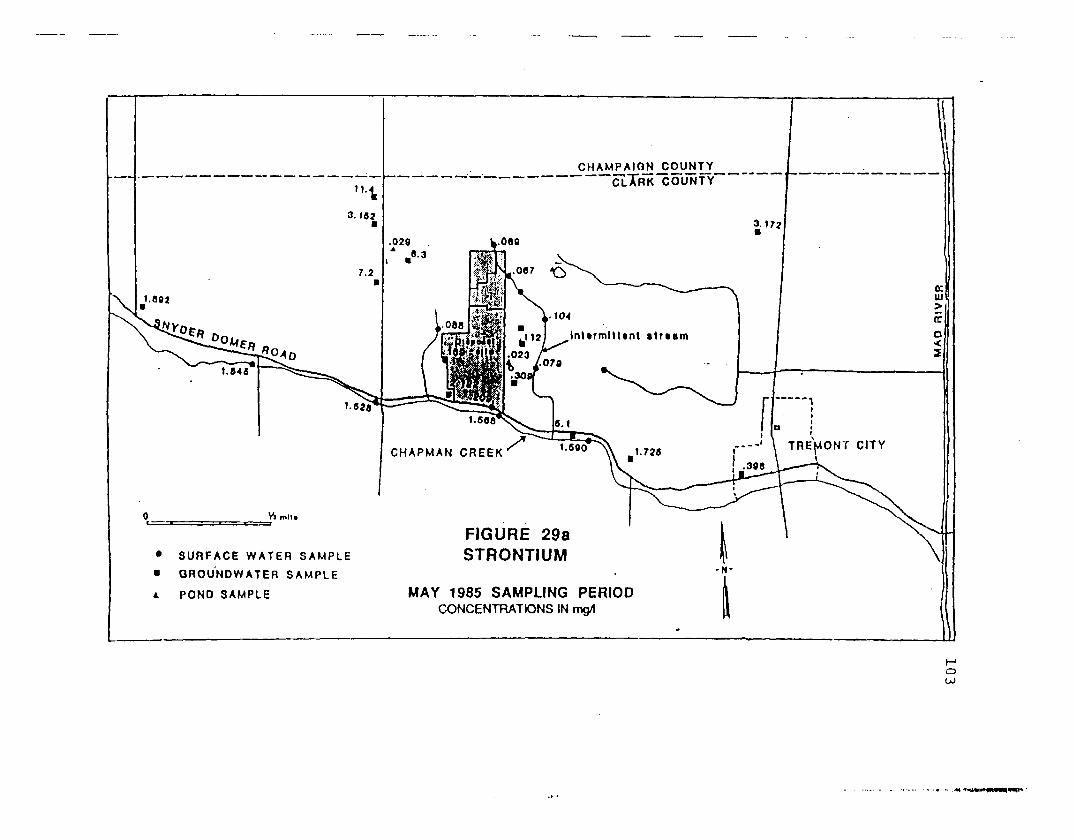
CHAMP AiqN_COUNTYcLTRK COUNTY
.104
ml Inltrmllltnt itrtam
TREMONT CITYCHAPMAN CREEK
FIGURE 29aSTRONTIUM• SURFACE W A T E R S A M P L E
• OROUNDWATER SAMPLE
A POND SAMPLE MAY 1985 SAMPLING PERIODCONCENTRATIONS IN mg/1

104
The highest zinc concentrations are contained in samples from the east
side of the disposal site, at sites 21, 11 and 25. The sample from
site 11 contains a zinc concentration of 1.71 mg/1, over seven times
higher than the next highest groundwater sample. Only site 5 from the
intermittent stream shows any zinc, .003 ng/1, in the surface water
samples (Figure 30a).
Zinc concentrations in the May 1985 sampling period range from
undetectable to .90 mg/1 in groundwater samples. No detectable zinc is*
found in either surface water or pond water samples. The only
anomalous zinc concentration is from the groundwater sample at site 11,
containing .90 mg/1 (Figure 30b).
The only obvious trend noted in zinc concentrations is the
continuously high zinc concentrations at site 11.
Total Organic Carbon (TOC)
Total organic carbon measurements are a comprehensive way of
looking at the total organic pollution load in a water system. This
measurement is very nonspecific because as it does not delineate
between different organic compounds. There can also be a high degree
of error due to poor instrumentation calibration.
TOC determination was performed only on the May 1985 samples set.
TOC concentrations range from 0 ppm to 12.5 ppm in surface water
samples and 0 ppm to 28.0 ppm in groundwater samples. Pond samples
range from 1.0 ppm to 3.0 ppm TOC (Figure 31).
The only evident feature is in the groundwater samples, which
contain the highest TOC concentrations near the disposal sits.

CH^ AMPAI ON _C OUN TYCLA~RK COUNTY
CHAPMAN CREEKTREf^ONT CITY
FIGURE 30aZINC• SURFACE W A T E R SAMPLE
• QROUNDWATER SAMPLEPOND SAMPLE DECEMBER 1984 SAMPLING PERIOD
CONCENTRATIONS IN mg/l

C H A MA I ON C OUN TYCO~UNfY
In termit tent i t ream
CHAPMAN CREEK TREMONT CITY
FIGURE 30bZINC
SURFACE W A T E R S A M P L EOROU'NDWATER SAMPLEPOND SAMPLE
MAY 1985 SAMPLING PERIODCONCENTRATIONS IN mg/1
CHAMPAIGN COUNTY
Intermittent s t r e a m
TREMONT CITYCHAPMAN CREEK
FIGURE 31TOTAL ORGANIC CARBONS U R F A C E W A T E R S A M P L E
Q R O U N D W A T E R S A M P L E
POND SAMPLE CONCENTRATIONS IN ppm
MAY 1985 SAMPLING PERIOD
o

108
Summary of Results
The purpose of this snudy is to determine if them has been any
degradation to surface water or groundwater in the area surrounding the
disposal site, in comparison to background concentrations. The
concentrations and values from the analysis suggest certain notable
trends:
1. Samples from site 11, located a few hundred feet from the
southeast border of the disposal site, contain the highest•
concentrations of Mg, Ca, Ni, Fe, Zn, Pb, Ba and HC03
determined in this study, some considerably higher than
background concentrations. They also contain the highest IDS
and specific conductivity values and the lowest pH readings.
2. The hillside spring (site 9), is located north of site 11
along the east border of the disposal site. High
concentrations of Mg, NO-j-, SO^-, Cl-, Ni, K and Na are
contained in samples from this site. High TDS and specific
conductivity values are also present.
3. Samples from domestic wells at sites 17 and 16 contain
unusually high concentrations of certain constituents. Site
16 contains high concentrations of Fe, SiOo and Sr. Site 17
contains concentrations of Na, Cu, C1-, and NOo- well above
background values.
4. Surface water from Chapman Creek shows increases in
concentrations of Ca, Fe, K, Mg, Mn, Na, Ni, N03-, Si02,
SO,.-, specific conductivity and TDS at site 3. This is
evident only in the December 1984 sampling period.

II
1094
5. Samples from site CC, just west of the site's western border, ,8f
contain high concentrations of Fe, Mn, HCO-j-, and SO^- .7
Samples from site AA, the discharge pipe, contain high $
concentrations of IDS, SO^-, Mg and Na.
From these trends it is evident that many of the constituents
analyzed for are high in concentration only at sites surrounding the j
disposal site. J

110
Comparison of Fall versus Spring Analysis
Water samples from 20 different sites were analyzed in both sampling
periods to note any chemical differences. No major seasonal variations
occur in the groundwater samples. Surface water samples along Chapman
Creek from the December 1984 sampling period contain significant increases
in concentrations at site 3 of Ca, Fe, K, Mg, Mn, Na, Ni, N03-, Si02,
SO--, and increases in specific conductivity and total dissolved^ «
solids. These increases are not evident in the May 1985 sampling period.
Hem (1970) states that the solute concentration of stream water tends
to be inversely related to a stream's flow rate. Precipitation in
November and December of 1984 was 4.69 inches and 4.11 inches,
respectively, as measured in Springfield, with no major precipitation
events prior to the sampling period (Pastor, 1985). The precipitation in
May 1985 was 4.93 inches with major precipitation events just prior to the
sampling period. It is probable that the rainfall prior to May 1985
sampling period increased the overland runoff in the area. This increase
in runoff would cause a decrease in stream sample concentrations due to
dilution. The same effect would not be noticed in groundwater samples in
the same area due to the lag time between a precipitation event and its
infiltration into the aquifer system. This may explain the lower
concentrations in the stream samples of the May 1985 sampling period, most
notably at site 3, below the disposal site's discharge pipe.

IllChemical Speciation Using WATEQF
After all analyses were completed, the collected data was fed into the
computer program WATEQF (Plummer, L.N., et al., 1976). This program takes
the chemical analysis of major and important minor inorganic aqueous
species and the in situ measurements of temperature, dissolved oxygen, pH
and Eh and calculates the equilibrium distribution of each element and the
states of reaction of the water with solid and gaseous phases. WATEQF
accomplishes this by using analytical concentrations, the mass balance
equation, experimental solution equilibrium constants and measured pH.
Other calculations produced by using WATEQF include molal concentration
ratios, ion activity ratios, and cation-anion balances. This program can(
be very useful in determining which chemical processes are controlling »
rock-water systems (Truesdell, A.H. and B.F. Jones, 1974). ;
Most of the calculations which are produced by the use of WATEQF are \i
beyond the scope of this study. It is used in this study for determining
what species are saturated, undersaturated or at equilibrium in each
sample.
From the output of WATEQF, it is evident that most of the samples in
the study area are saturated with respect to calcite, dolomite, goethite,
amorphous ferric hydroxide, strontianite and witherite. Calcite and
dolomite are understandably in the saturated state due to the area's
carbonate bedrock. Goethite and amorphous ferric hydroxide most likely
originate from the glacial material, since goethite is not a common
constituent in carbonate terrains. Saturation of strontianite and
vitherite is =:ost likely due to high celestite concentrations in the
area's limestone.

112
Water Quality
The concern of citizens in the Tremont City area is directed to r.he
possible contamination of drinking water and stream water near the
disposal site. The EPA has set drinking water standards of recommended
limits and maximum permissible limits for a wide range of constituents.
The recommended limits are set for acceptable esthetic and taste
qualities in water and the maximum limits are set according to health
criteria (Table 5).
Several constituents analyzed in the study area show concentrations
above the EPA drinking water standards. The chromium concentration at
site 5 from the December sampling period has a concentration of 0.055
mg/1, slightly above the maximum permissible limit of 0.05 mg/1. This is
the only elevated chromium concentration.
Lead is found in concentration above the maximum permissible limit of
0.05 mg/1 at several sampling sites. In the December 1984 sampling
period, water from sites 11, 14, and 18 contain lead concentrations of
0.05 mg/1 or above. In the May, 1985 sampling period, many of the
sampling sites have water with elevated lead concentrations, the highest
being 0.1 mg/1 at sites 3 and 4.
The EPA limit for cadmium is 0.01 mg/1. Almost all the samples
contain detectable concentrations of Cd and some concentrations in the
May, 1985 sampling period are above or close to EPA limits. The samples
from sites 11 and 25 both contain .012 mg/1 cadmium, .002 mg/1 above EPA
limits. Other sanules are close to this

113
Table 5 Drinkiug Water Standards
R«cc.T)m«ndffdconcentration limit*
Constituent (mg/0
InorganicTotal dissolved solids 500Chloride (Cl) 150Sulfate (SO4
:") 250Nitrate (NO}) 45fIron (Fe) 0.3Manganese (Mn) 0.05Copper (Cu) 1.0Zinc (Zn) 5.0Boron (B) J.OHydrogen sulfide (H2S) 0.05
Maximum permissible concentration;Arsenic (As) 0.05Barium (Ba) 1.0Cadmium (Cd) 0.01Chromium (Crvl) 0.05Selenium 0.01Antimony (Sb) 0.01Lead \,?uj u.05Mercury (Hg) 0.002Silver (Ag) 0.05Fluoride (F) 1.4-2.4 §
OrganicCyanide 0.05Endrine 0.0002Linda ne 0.004Methoxychlor 0.1Toxaphene 0.0052,4-D 0.12,4,5-TP silvcx 0.01Phenols 0.001Carbon chloroform extract 0.2Synthetic detergents 0.5
SOURCIS: U.S. Environmental Protection Agency, 1975 and WorldHealth Organization, European Standards, 1970.
•Recommended concentration limits for these constituents are mainlyto provide acceptable esthetic and taste characteristics.
tLJmii for NO; expressed as N is IQmgJC according to U.S. andCar~idian standards; according to WHO European standards, it is11..1 mill as N and 50 mgjt as NO;.
Reference: Freeze and Cherry; 1979

114
Iron has a recommended limit of 0.3 mg/1 in drinking water because of
taste and laundry-staining properties at higher concentrations. Many
groundwater samples contain concentrations significantly higher than this
limit. Most notable is site 11, containing the highest iron concentration
in both sampling sets, 3.76 mg/1 iron.
Manganese is also found in concentrations above the recommended limit
of 0.05 mg/1 at several sampling sites from both periods. Sites 7 and CC
contain concentrations above 0.30 mg/1. Both of these sites are locatedI
near seeps along the border of the disposal site. In high concentrations,
manganese behaves like iron in that it can cause staining of laundry. No
other samples contain concentrations of constituents above US EPA limits.
However, samples from sites 9, 11, CC and 3 in proximity of the disposal
site contain concentrations of constitutents significantly above
background levels.
TOC concentrations from the May 1985 sampling period are highly
variable in the stream water samples but ground water samples indicate
high concentrations in samples from sites 25 and BB, containing 12.0 ppm
and 28.0 ppm, respectively. Site BB is located adjacent to the disposal
site's southern border. This suggests that the wells may contain high
concentrations of organic constituents, but further analyses are needed
for confirmation. No water quality standard is set for TOC at the present
time.
No drinking water standards have been set for many of the elements
analyzed. Different standards have been set for livestock and Irrigation
purposes, but these standards almost always are less stringent than the
drinking water standards.
c
115 »From the data collected, it appears that all the domestic well waters, •
with the exception of site 11, is safe to drink at the present time. It 1*
should be noted that this study does not take into account organic .»I
compounds which could be present in the samples. '
Environmental Impact of the Disposal Site
In order to evaluate the data, it is important to understand some of
the chemical properties of the elements in relation to their geologicalI
environments. The principal geochemical processes that occur in a
landfill environment are biological decay, ion exchange, sorption of
chemical constituents, dissolution and precipitation of inorganic
constituents, the generation and diffusion of gases, and the movement of ,
dissolved materials. Most of these processes cannot be addressed in this
study due to the limited information on flow patterns, recharge areas, and
the lack of data concerning organic constituents.
The disposal site on Snyder-Domer Road has been excavated into the
thick glacial materials which overlay the limestone bedrock. This glacial
material consists mostly of clay, with minor amounts of silt and
sand(Eagon, 1984a). It has been assumed that glacial till with high
concentrations of clay will create an impermeable barrier to leachate
migration, but this has not been proven or disproven (Kunkle and Shade,
1976). However, the presence of sand lenses within the glacial till may
provide avenues for landfill leachate migration (Clause, personal
communication, 1985; Eagon, 1984a and b).
The clayey till in which the site is located has the ability to adsorb
or scavenge certain elements, thus attenuating their concentrations in
water. Different elements are affected to various degrees in this way.

116
Heavy metals such as Pb, Cd, Zn, and Hg have a very strong tendency to
attenuate to clay surfaces. Si, Mg, Fe, and K have only a moderate
tendency to attenuation while Na and Cl have a very low tendency. Ca and
Mn are also known to have low attenuation tendencies. Ion exchange is
evident, from other studies, as a property of calcium which can cause
calcium to form a halo of high concentrations in ground water preceding a
leachate plume. This process involves the exchange of calcium bonded to
the clay particle surfaces to exchange with metal ions in the leachate,4
thus decreasing the metal concentration in ground water but increasing the
calcium concentration. Griffin and Shimp (1978) have found this process
to be highly dependent on the elements and the form of the elements
involved, the pH of the leachate, the absorption capacity of the area's
clay, and the ionic strengths of the leachate.
The hardness halo effect has been noted in several municipal and
sanitary landfills around the country (Griffin and Shimp, 1978). The halo
effect is observed as high concentrations of calcium from wells very close
to the landfills, with the calcium concentrations decreasing with distance
from the fills. This effect is observed at the disposal site in this
study. In the December 1984 sampling period, high concentrations of
calcium are observed at sampling site 9 and sampling site 11 in the ground
water samples. These samples are located along the eastern side of the
disposal site, the direction in which ground water is believed to be
flowing (Eagon, 1984a). Stream samples also indicate high concentrations
of calcium only near the disposal site. These are evidenced at sites 6,
7, 3, and 4. la the May 1985 sampling period, the streas sites do not
show high calcium concentrations but high concentrations are noted in
ground water samples from sites 9 and 11. Sample CC from the site's

117
western border also shows a high calcium concentration as compared to the
background stream samples. It should be noted that the sample at site CC
is taken from water which appears to be coming from seeps along the
western side of 'the disposal site. It is evident from this data that high
calcium occurs only around the disposal site. The hardness halo effect
may explain the low concentrations of many heavy metals in the disposal
site area and the high concentrations of calcium from samples in proximity
to the site. If ion exchange is occurring at the site, the clayi
underlying the landfill is not acting as an impermeable barrier as
previously presumed by Eagon (1984a and b).
The impact of leachate on ground water initiates some change in water
quality. In such cases, increases in alkalinity, total hardness, HCO^,
calcium, magnesium, sodium, potassium, chloride, and sulfate are often
found, as are high level of iron and ammonium nitrogen (Kunkle and Shade,
1976).
High concentrations of many of these constituents are contained in
samples from sites 11, 9, 3 and CC, from the disposal sites southern
borders. Alkalinity values from both sampling periods are highest in
ground water samples from sites 9 and 11 as are the concentrations of
HCO.j~. Samples from site 9 contain concentrations of Mg, CL", K and
SO^ above the background samples. Samples from site 11 contain
concentrations of Mg, Ca, Fe, TDS and specific conductivity values
significantly above those of background samples. In the December sampling
period, site 3's samples contain elevated concentrations of Ca, Fe, K, Mg,
Mn, Na, Ni, N03", 50 , TDS and specific conductivity. Seep sample
CC shows high concentrations of Ca, Mg, HCO-j and SO^.
118
These samples indicate that the disposal site has had an effect on the
waters in proximity to its borders. This may be due to leachate from the
disposal site. Another indicator of possible leachate migration is the
low pH at site 11, evident in both sampling periods. Since this well is
finished in the limestone (CaCOo) bedrock, the low pH values measured at
this site are not expected since the limestone would act as a neutralizing
agent to the water, thus raising the pH. A possible explanation for these
low pH values is chemical reactions from leachate migration have lowered
the pH.
Additional studies are needed to further access the impact of the
disposal site on the area's water. Further studies on the geology of the
area are essential to determine the extent of sand seams in the glacial
till. Chemical studies should include organic analyses. From the limited
information available regarding the contents of the disposal site, it
appears the organic analyses including volatile organic compounds and
PCB's are necessary. This would set a chemical baseline for further
organic analyses. Additional monitoring wells should be installed to
expand the disposal sites existing monitoring system. Some of these wells
should pentrate the limestone bedrock.

CONCLUSIONS
The groundwater samples from site 11, in proximity to the east side of
the disposal site, contain high concentrations of Mg, Ca, Ni, Fe, Zn, Pb,
Ba, HCO^, IDS, and values of specific conductivity. It is probable that
these high values are caused by constituents leaching from the disposal
site area, as background values are considerably lower than these
concentrations. If this is the case, it is likely that the glacial till
beneath the site is not acting as an impermeable barrier, because the well
at site 11 is set in the limestone bedrock.
Samples from the hillside spring, site 9, contain high concentrations
of Mg, N03, SO^, CL, Ni, K, and Na. Chloride and nitrate at this site
are much higher than most of the background samples with the exception of
site 17. Many of these constituents are indicative of landfill leachate
as noted in other studies (Kunkle and Shade, 1976, Griffen and Shimp,
1978, Cartwright, et al., 1977).
The sand seams observed in monitoring well logs from the disposal site
cannot be confirmed as discontinuous, and could be avenues for leachate
transport.
The groundwater samples in the study area exhibit unusually high
concentrations of strontium, most likely caused by the high celestite
concentrations in the area's limestone.
Leachate from the landfill is discharging into Chapman Creek in the
form of runoff water as evidenced at site 3.
119
120
Due to high concentrations of contaminants in samples from site 11,
the water from this well is deemed unsatisfactory for human consumption.
To adequately assess the impact of the disposal site on local ground
and surface waters, further studies should be implemented. These studies
should include analysis for organic pollutants of both surface waters and
groundwaters, and further geology investigations.

APPENDIX I
Well Logs
121

122
PLEASE USE PENCILOR TYPEWRITERDO NOT USE INK.
County K
WELL LOG AND DRILLING REPORTState of Ohio
DEPARTMENT OF NATURAL RESOURCESDivision of Water
Ji62 Wt Fim ATenoe
Columbia 12, Ohio
j^\ i i rN9 279978
f
Tnnm.hip J3————Section of Township.
Owner ree Z -Addrai
Location of property.
CONSTRUCTION DETAILS
Casing diameter O / ff I-«npth of casingth of screen
_^_
WELL LOG k
FormationsSandstone, shale, limestone,
(ravel and clay
^K^/'C^J.c/,.},
S ,)•» / J c/i .<2/t y
5 > •>» i - J. »i=»'iy-«- /"
^tx-t// CO--0/'/-'-/
__ f i -* . . ^'J
I/
From
0 Feet
^- o
J /
To
3~ £
0 V
BAILING OR PUMPING TEST
Pumping Rate ——— -G.P.M. Duration of test — K-hrs.
^tatie l»vil-depth to water /^ ' ft
Quality (clear, cloudy, taste, o^nr)
1
f +~ ' I /Purnp fT i*T^l^fd by /'I ^ *" ya t i^ ' -^* / j« '** * *" / y
SKETCH SHOWING LOCATION
Locate in reference to numberedState Highways, St. Intersections, County roads, etc.
N.
N
W.
•eX
See reverse side
**/-*
o_ \V^/ E.
)'
[or instructions
Date .
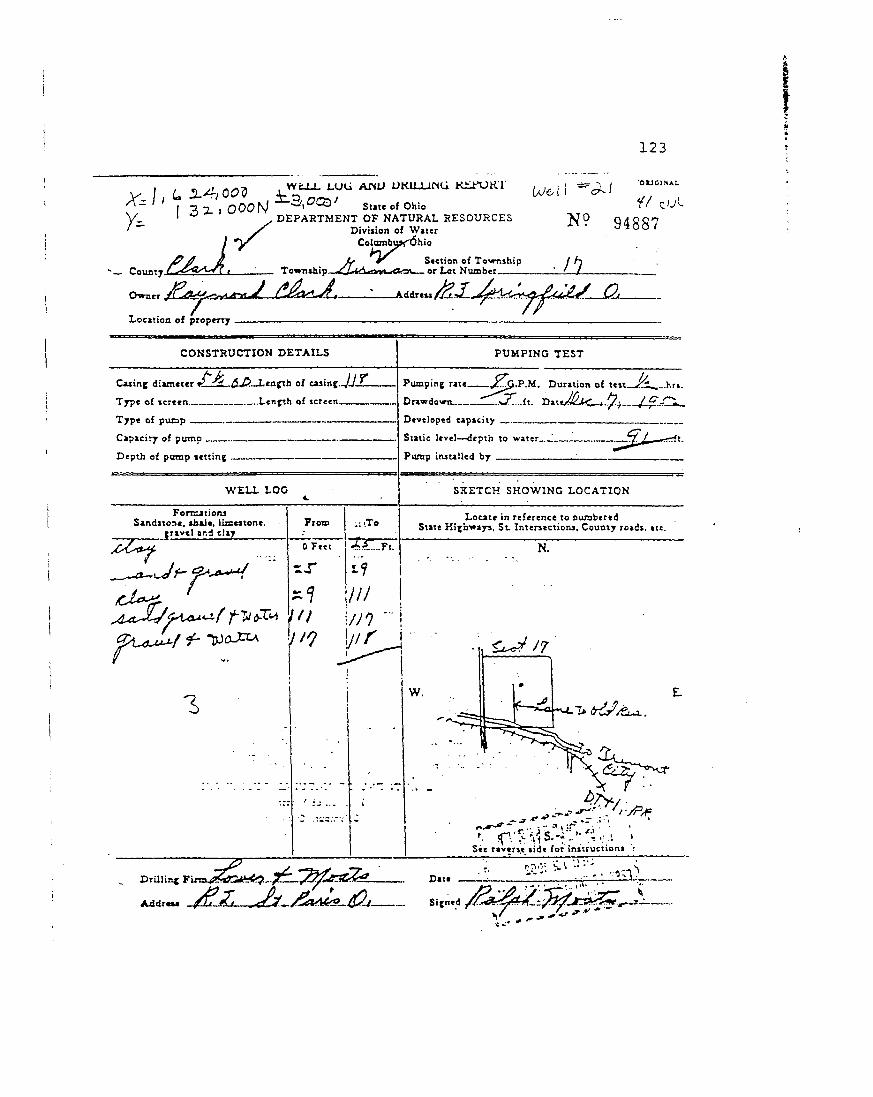
123
/ 3-^- GO'S , wtu- LU(-> AMD UKULLJMG Ki>TJRTX - * 1 . _„ ~ « ^ K l -E-^/,C'CQ/ State of Ohio
DEPARTMENT OF NATURAL RESOURCESDivision of Water
/ *y Colurobux'dhio0 tf /f jt' IT Section of Township^^gxVr, TownjJaio_^lZA' ' " '
i v^' if cN? 94S87
Number
Own
Location of property
Addreu
CONSTRUCTION DETAILS
AX- /i r"Casing diameter •? ^f /S/? -Ltnph of easing._/j_i ————
WELL LOG4.
FordationsSandstone, «baJe, limestone,
gravel and clay
^^ "
From
0 Feet
/ / /
:: '.To
if
PUMPING TEST
Pumping rate ——— p.P.M. Duration of tejt_.>;SL,_.hri.
Drawdown.- ~"!Sl.ft. Date/!^<<_,_^__/.^./IX.
SKETCH SHOWING LOCATION
Locate in reference to numberedState Highways, St. Intersections, County roads, etc.
N.
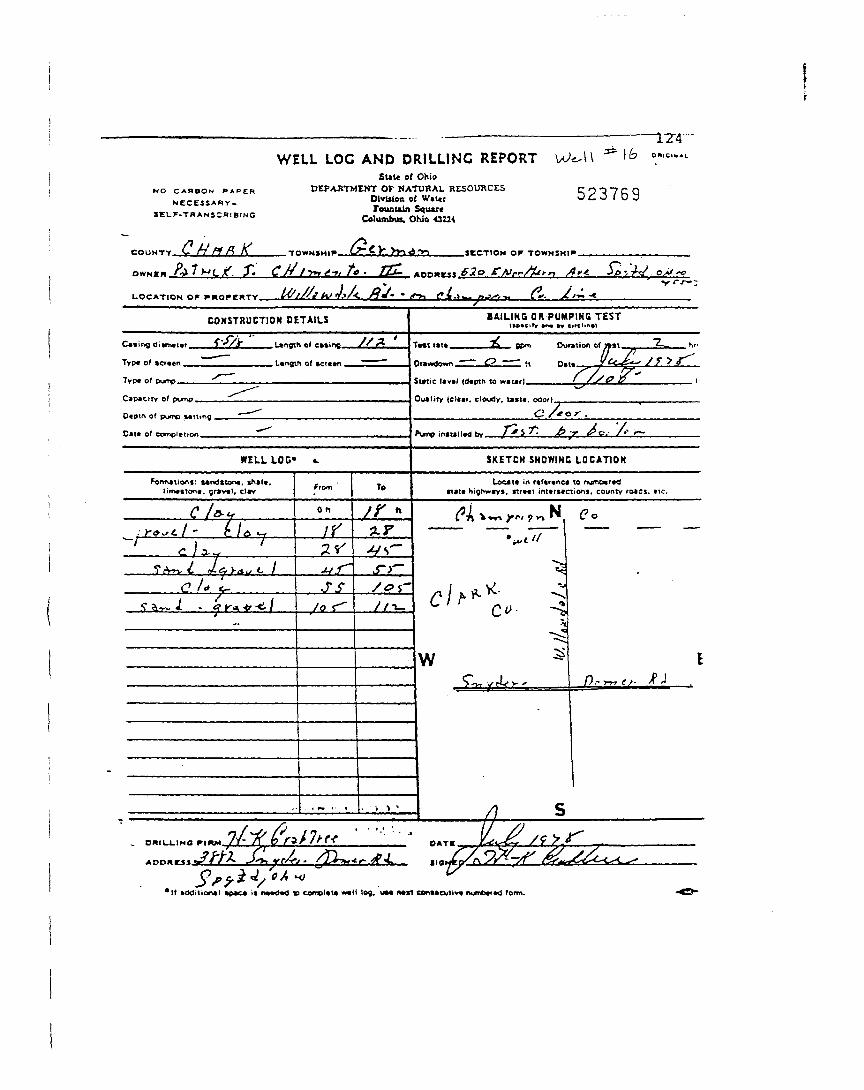
NO CABBON PAPERNECESSARY-
SELF-T«ANSCR.B.NG
WELL LOG AND DRILLING REPORT VJ^\\ ** \b
r- o -5 -7 r Q0 £ O / D 3
Suit of OhioDEPARTMENT OF NATURAL RESOURCE
Divfcion of W.urFountain Sauirc
Columbuj. OWo 43224
COUNTY V l ft P( A
*
J//f fc> f f f / < ft*'-*-* C^.t^fj^-^ C". />*•*.
CONSTRUCTION DETAILS
Caving ditmmtmr V^X^* Length ttl easing. lm /'^ lt ,
WELL LOG* ».
Formations: Mndsun*. irttl*.
^ /^:*•+*<./- (L!A^
1 ^ /iTrV^v <^ *L.>Al, C /
(?/«*!-< / 1$ a-r^ i - 4 r* •*••<!•)
From
0 h
/ C^
*7 ^^
vf^JS
e Q f*^
• • - - •
To
y/' h
JZ-f^/s—J-J—/&)-//t-
BAILING OR PUMPING TEST
»«l r*t» "^ Qfyn D\if»tton Bf y*' ^-^ hr-
S^7 £T*
SKETCH SHOWING LOCATION
Locjlt in rtftrcne* to numOtrtOflat* highwiyf . «tr»«t inttrscciions. counry roads, cic.
•4/t *' I
^
W ^ ^
/) SDHILJ-IHC
l ipac* if n»«J*d B campltu mil log, UM rwn eon«»ajtiv« numtwfxl form.

125
X* I, <= iy= } 5County
DO W7;.'-L LOG AND DRnT1NG REPORT[i'~, O00 ^tatt of Ohio ('vDEPARTMENT OF NATURAL RESOURCES
Division of WaterColumbus, Ohio
Section of Township______or Lot Number____
(X/C-H
hN? 135523
D. Leonard __Addre»a R- H. 3, Springfield, Ohio _____
Location of On Willow Dale Rd. '£ Ml. N of Snyder & Doaer Rd
CONSTRUCTION DETAILS
Casing diameter jy .'j — 0—0 — Length of casing^3-10 ——
Typ* of pump
WELL LOG
FormationsSandstone, lhaJe, limestone,
[ravel and clayRed Clay £ Eeai Sa^dDry Grsival
"~ Hard PanHock
1 ."" ' t •
From •
0 Feet203070
To
-20__Ft.307083^^
PUMPING TEST
Pumping rate^rf^***G.P.M. Duration of te»tl... ......... hrt_ . 14 1C-25-54
iDcvclopxl ciplcity4?0 (i?1 t> = — pr
41Stitic liv.l —— depth fr> «r>,fr ...•*• —— —— fr
SKETCH SHOWING LOCATION
Locate in reference to numberedState Highways, St. Intersections, County roads, etc.
N. ^>.• \ "\ _;.-
T° \VW. . « _ / £ „ . ; ' '^ E.
i __ __ __ .
' cf" J "^s.
See reverie side for instructions
Drilling Fi
Addrtu

* vy\ f 2_ 6 CCO ;"ELL— I / c "~ ' ^t •; j eo '
~'
LOG AND DRILLING REPORT
J2.%0
/
County.
Owner
suit of OhioDEPARTMENT OF NATURAL RESOURCES
Diviiioo of WaterColumbui, Ohio
I * A3/f 6
N9 '141257Section of Towmhip / >sor Lot Number I U
70*%*,
Location of T/
CONSTRUCTION DETAILS PUMPING TEST
Casing diameter ^-^^~ £\) 1 »-ph of casing..,//
Typ« of screen__________Length of screen————
Type of pump_________________:—————————————
Capacity of pump_______________________
Depth of pump letting____________________,
umping rate.
>rawdown.
Static level—depth to
Pump installed by__
WELL LOG «. SKETCH SHOWING LOCATION
FormationsSandstone, shale, limcitone,
(ravel and clayFrom To Locitt in reference to numbered
State Highways, St. Intersection!, County roids, etc.
0 Feet N.
s.Set reverse side for instructions
Addrea
Datt_
Signed__
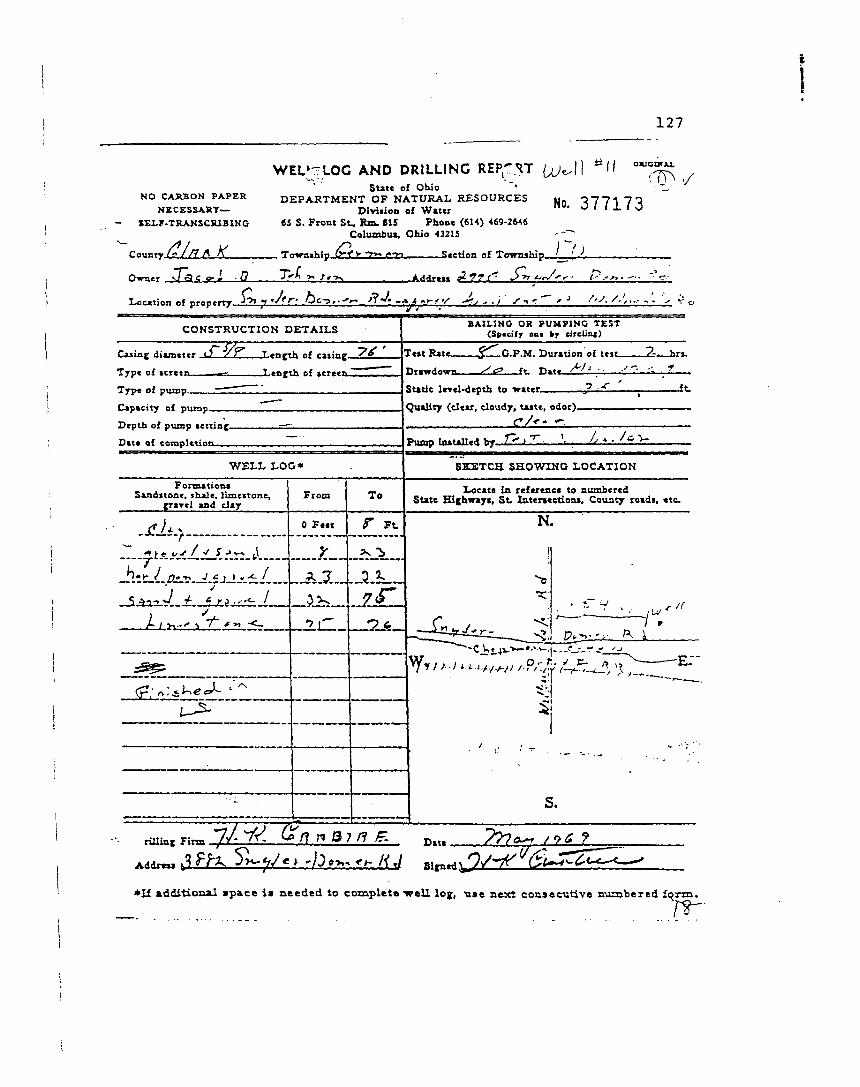
127
WEL'~LOG AND DRILLING REP^.VT Re-state of Ohio "'
NO CAABON PAPER DEPARTMENT OF NATURAL RESOURCES u- 977170NECESSARY— Divtaion of Water " ' ° ' ' •*- ' °
lEiy-TRANSCJUBING 65 S. Front St. Rm. 815 Phone (614) 469-2M6Columbua, Ohio 4321S .'-—
County b //7 A A_______ Townahip_U:t I M •!* I
Oira
fc/#A K
•Tae o.J
m of property
•5 T^-A v, /,->,
,./o~ £>«,..-,- .
y>* **^-i S»r^nn of Tmrnthi'n ' ' .'
A^rlr,,, e?-f7i': $•* t^r*''-r- !?.'*,.
ft-J* .A 4 «>-/ -X J-s ../' S*<:~~ '* S'S. /•'.
_.)
• t .' -. • \--
CONSTRUCTION DETAILS
i of caiin^ •7*'—— —
WELL LOG*
Formation!Saaditonc, shale, Jimeitone,
fravel and clay
J*^»
^~ *ttl „. / */ s*~ t(hj /_,.-, jcjt^i
J + ' <- 1JL i >i., i r * -n •<—
-S&-
-ja" ---1—
From
0 Feet
rA 7
:^i—————
To
<T Ft
^-v,M_ _ _ - _ — , - , - _
BAILING OR PUMPING TEST(Specify om by circling)
e»t Rate. .... $\. G.P.M. Duration of tr« . . .7-- .hr».
tatic Irrel-depth to water. _ — -J? .-'T ————————— ft
Pump IniUlltd by.,.I<lj7" -.2^ —— •* • ^ —————
SKETCH SHOWING LOCATION
Locate in reference to numberedState Highway*, St. Intenectionj, County roads, ttc.
N.
X
_^&^^__ *.^..... A/'"^~^~C k«i»_>— ••*•*-. -.-iLj-.r*^ ^j
^y//./ ..t-.^^y /-P/:/ / .1; ^"12-"
5
' ' ' — • - - . - .
s.fl 7 Date .
*if additional apace i* needed to complete -well log, use next consecutive numbered

._JL28
PLEASE USE PENCILOR TYPEWRITER
I DO NOT USE INK. |
WELL LOG AND DRILLING REPORTState of Ohio
DEPARTMENT OF NATURAL RESOURCESDivision of Water
1562 W. Pint ArenueColumbus, Ohio 43212
"XTO 350130
. Tawnship_z£U^"»^
--Section of Township-
.Address T 2. "b - _r_;/,
of 1Jy=/-*S
EPRING'IZID CH'O '*LT additiotuul s'pa.ce is needed to complete well log, use next consecutive numbered form.

REFERENCES . ;
American Public Health Association; 1976, Standard Methods for theExamination of Water and Wastewater, 14 Edition, ° 1976,Washington, DC 20036.
Cartwright, Griffin, A., and Gilkeson, Robert H. , 1977, Migration ofLandfill Leachate through Glacial Tills. Ground Water, v. 15, no.4.
CF/WATER, Newsletter, 1985. ,
Clause, Dorinda, 1985, Personal Communication.i
Contrino, Charles T., 1973, A Study of a Buried Valley in West CentralOhio Using Seismic Refraction and Two-Dimensional Gravity ModelStudies, Wright State University, M.S. Thesis.
Dreimanis, A. and Goldthwait, 1973, Wisconsin Glaciation in the Huron,Erie, and Ontario Lobes. Geological Society of America, Memoir136.
iEagon, Herbert B. 1984, Hydrogeologic Assessment Tremont City *
.Landfill, Tremont City, Ohio. Smith and Schackne, Dayton, Ohio.June. 1984 (a). ;
Eagon, Herbert B. 1984, Hydrogeologic Assessment of the Closed Barrel IFill, Tremont City, Ohio. Smith and Schackne, Dayton, Ohio.January, 1984 (b).
Fetter, C.W. Jr., 1980, Applied Hvdropeologv. ° 1980, Charles E.Merrill Publishing Company, Columbus, Ohio 43216.
Fuller M.L., and Clapp, F.G., 1912, The Underground waters ofSouthwestern Ohio: U.S. Geol. Survey Water-Supply Paper 259.
Griffen, R.A. and Shimp, N.F., 1978, Attenuation of Pollutants inMunicipal landfill Leachate by Clay Minerals. Illinois StateGeological Survey, EPA-600/2-78-157, 147 p.
Hem, J.D., 1970, Study and Interpretation of the ChemicalCharacteristics of Natural Water. Geological Survey Water SupplyPaper 1473.
129

130Kaser, P., 1962, Report to the Ohio Water Commission on the
Investigation of Ground Water Levels in the Vicinity of Eagle City,Clark County, Ohio Division of Water, 82 p.
Kunkle, G.R. and J.W. Shade, 1976, Monitoring Ground-Water Quality neara Sanitary Landfill. Ground Water, v. 14, no. 1.
Neese, Michael C., 1978, Delineation of the Bedrock Topography ofChampaign County, Ohio using the Gravity-Geologic Method. WrightState University, M.S. Thesis.
Norris, S.E., Cross, W.P., Goldthwait, R.P., and Sanderson, E.E., 1952The Water Resources of Clark County, Ohio. State of Ohio Divisionof Natural Resources, Bulletin 22, Columbus, Ohio 1952.
Ohio EPA, 1979, Personal letter to Mr. John Norman, from Thomas A.Winston. February 12, 1979.
Pastor, Keith, 1985, Personal Communication, Miami Conservatory NorthSpringfield Data Center.
Pirkle, E.G. and Yoho, W.H.; 1977. Natural Regions of the UnitedStates, c 1977, Kendall/Hunt Publishing Company, Dubuque, Iowa52001.
Plummer, N.L., Jones, B.F., and Truesdell, A.B., 1976, WATEQF. U.S.Geol. Survey WAter Resources Investigation, no. 76-13.
Richard, B.H., 1969, Gravity Anomalies in Parts of Clark and ChampaignCounties, Ohio: Geologic Society of America proceedings, Abs.
Spicer, H.C., 19A9, Electrical Resistivity of Bedrock in Clark County.U.S. Geological Survey.
Stout, W., and Versteeg, K., and Lamb, G.F., 1943, Geology of Water inOhio: Geologic Survey of Ohio, 4th ser., Bull. 44, 694 p.
Truesdell, A.H. and Jones, B.F.; 1974, WATEQF, A computer program forCalculating Chemical Equilibria of Natural Waters. Journal ofResearch, U.S.G.S. vol. 2, no. 2.
United State EPA, 1976, Quality Criteria for Water. Washington, DC.