Embed Size (px)
Citation preview


MASTERS THESIS
INVESTIGATION INTO DEVELOPMENT OF SAFETY LEVELS
ON NORWEGIAN INSTALLATIONS IN THE NORTH SEA POST-
1990
UiS
Faculty of Science and Technology
Department of Industrial Economics
Risk Management and Planning

Investigation into Development of Safety Levels on Norwegian Installations in the North Sea Post-1990
Annelise Baillie 2
CONTENTS
Section Page
Contents 1. ABSTRACT ................................................................................................... 4 2. INTRODUCTION ......................................................................................... 5
2.1. Overview of Topics ..................................................................................... 5 2.2. Structure of Report ...................................................................................... 5 2.3. Abbreviations .............................................................................................. 6
3. THEORETICAL BASIS ................................................................................ 8 3.1. The Risk Concept ........................................................................................ 8 3.2. Perspectives on Risk ................................................................................... 8 3.3. Calculation of Risk ...................................................................................... 9 3.4. Major Accidents ........................................................................................ 10 3.5. Risk Indicators .......................................................................................... 11 3.6. Literature Review of Previous Studies ...................................................... 12 3.7. Development of Legislation ...................................................................... 15
4. OVERVIEW OVER ACCIDENTS AND INCIDENTS – LAGGING INDICATORS ............................................................................................. 17
4.1. Chronological List of Fatal Accidents ...................................................... 17 4.1.1. Period 1996-2000 ............................................................................... 17 4.1.2. Period 2001-2005 ............................................................................... 19 4.1.3. Period 2006-2010 ............................................................................... 20 4.1.4. Total Number of Fatal Accidents ....................................................... 20
4.2. Accidents by Type (Fatal and Non-Fatal) ................................................. 21 4.2.1. Ignited and Non-Ignited Leaks – DFU 1 & 2 .................................... 21 4.2.2. Well Kicks/Loss of Well Control – DFU 3 ....................................... 25 4.2.3. Fire/Explosions – DFU 4 ................................................................... 29 4.2.4. Vessels on Collision Course – DFU 5 ............................................... 31 4.2.5. Drifting Object – DFU 6 .................................................................... 33 4.2.6. Collision with Field-Related Vessel – DFU 7 ................................... 34 4.2.7. Structural Damage to Platform/Stability – DFU 8 ............................. 36 4.2.8. Leaks from/Damage to Risers and Pipelines – DFU 9&10 ............... 38
5. SAFETY SYSTEM TESTS – LEADING INDICATORS .......................... 39 5.1. Introduction ............................................................................................... 39 5.2. Fire Detection ............................................................................................ 39 5.3. Gas Detection ............................................................................................ 44 5.4. Riser ESDV ............................................................................................... 48 5.5. Christmas Tree .......................................................................................... 52 5.6. Deluge ....................................................................................................... 56
6. RISK ANALYSES FOR SELECTED PLATFORMS AND COMPARISON WITH AVAILABLE DATA ........................................... 60
6.1. General ...................................................................................................... 60 6.2. Platform A ................................................................................................. 60 6.3. Platform B ................................................................................................. 62 6.4. Platform C ................................................................................................. 64

Investigation into Development of Safety Levels on Norwegian Installations in the North Sea Post-1990
Annelise Baillie 3
6.5. Platform D ................................................................................................. 68 6.6. Platform E ................................................................................................. 73 6.7. Platform F .................................................................................................. 74 6.8. Platform G ................................................................................................. 77 6.9. Platform H ................................................................................................. 79 6.10. FAR Values all Platforms ......................................................................... 82
7. TRENDS IN SAFETY LEVELS ................................................................. 84 7.1. Lagging Indicators – Installations Built Before and After 2000 ............... 84 7.2. Lagging Indicators – Installations Built Before and After 1992 ............... 89 7.3. Leading Indicators – Installations Built Before and After 2000 ............... 91
8. DISCUSSION ............................................................................................ 100 8.1. Introduction ............................................................................................. 100 8.2. Regulatory Framework ............................................................................ 101 8.3. Layout of Installations ............................................................................. 101 8.4. DFU1&2 – Hydrocarbon Leaks .............................................................. 102 8.5. Other Lagging Indicators ........................................................................ 108 8.6. Leading Indicators ................................................................................... 109 8.7. Final Discussion of Main Hypothesis ..................................................... 110
9. CONCLUSIONS ........................................................................................ 114 10. REFERENCES .......................................................................................... 115 11. APPENDICES ........................................................................................... 117
11.1. Appendix A: Assumptions for Risk Analysis of Platform A .................. 118 11.2. Appendix B: Assumptions for Risk Analysis of Platform B .................. 119 11.3. Appendix C: Assumptions for Risk Analysis of Platform C .................. 120 11.4. Appendix D: Assumptions for Risk Analysis of Platform D .................. 121 11.5. Appendix E: Assumptions for Risk Analysis of Platform E ................... 123 11.6. Appendix F: Assumptions for Risk Analysis of Platform F ................... 124 11.7. Appendix G: Assumptions for Risk Analysis of Platform G .................. 126 11.8. Appendix H: Assumptions for Risk Analysis of Platform H .................. 127 11.9. Appendix I: Table of FAR Values – Platforms A to H ........................... 129 11.10. Appendix J: Table of Annual Frequency of Accidents – Platform H ..... 130 11.11. Appendix K: Table of Annual Frequency of Accidents – Platform H .... 131 11.12. Appendix L: No. Of Installation Years – Only Installations Built up to and
incl. 1999 ............................................................................................... 132 11.13. Appendix M: No. Of Installation Years – Only Installations Built in and
after 2000 ............................................................................................... 133 11.14. Appendix N: No. Of Million Man-hours vs. No. Of Installation Years –
Only Installations Built in and after 2000 ............................................. 134

Investigation into Development of Safety Levels on Norwegian Installations in the North Sea Post-1990
Annelise Baillie 4
1. ABSTRACT
There have been no major fatal accidents in the Norwegian sector after 1985, and those which occurred before that are not considered very relevant to the current investigation, because circumstances and policies differed considerably from current practice. However, there have been numerous minor accidents, including occupational accidents, near-misses and dangerous occurrences, known as lagging indicators. Can we deduce that installations built in the last decade are significantly safer than those constructed prior to year 2000? In this report, our working hypothesis will be to attempt to prove that installations built in and after 2000 have significantly less dangerous occurrences (known as lagging indicators) and greater inherent barriers (known as leading indicators) against major accidents than those following earlier regulations. The RNNP database contains relatively systematic information on minor accidents and near-misses, from and including 1996, so it will be used as source for our investigation. There is no similar overview for events prior to 1996, as the data either does not exist, or only for a few incidents. For barrier data, systematic information is available from and including 2002. Statistics will be presented and discussed both chronologically, and by type of accident, for the lagging indicators; and by type only for the leading indicators, to determine actual trends in safety levels. The lagging indicator data has been normalised by number of installation years and by number of million man-hours. For the report, both risk analyses and experience data from the offshore business will be drawn upon to be able to compare the detailed plans prepared before start of production with the actual events and reality on the installations. The investigation will be carried out at sector level, not on the basis of each individual installation. However, I will be connecting the RNNP data with risk analyses for some selected installations. Helicopter accidents are excluded from the investigation, as it is a very different topic, and would constitute a thesis in itself. The data show inconclusive results. There are no significant differences between number of leaks of installations built before and after 2000, the most important lagging indicator, when the results are normalised. However, for leading indicators gas detection and ESDV riser, the differences are statistically significant once outliers are removed. Installations built in or after 2000 have fewer well-kicks, minor fires, field vessel collisions and structural damage, but the differences are not statistically significant.

Investigation into Development of Safety Levels on Norwegian Installations in the North Sea Post-1990
Annelise Baillie 5
2. INTRODUCTION
2.1. Overview of Topics
The topics covered in this report include the concept of risk, different perspectives on what risk actually is, calculation of risk, major accidents on the Norwegian Continental Shelf (NCS) and the lessons learnt from them, the concept of risk indicators, the Norwegian Risk Level Project ‘Risikonivå Norsk Petroleumsvirksomhet’ (RNNP), the concept of Defined Situations of Hazard and Danger (Definerte Fare- og Ulykkessituasjoner, or DFU’s), risk literature, risk management legislation, fatal accidents on the NCS since 1996, Major Lagging indicators, normalisation of results, Leading Indicators, Quantitative Risk Analyses, risk acceptance criteria, FAR Values for a variety of accident types (process, blow-out, ship collision, and occupational accidents), impairment of major safety functions, correlation of FAR values with lagging risk indicators, and comparison of risk levels on installations built before and after 2000. The Major Lagging Indicators covered in this report are ignited leaks, un-ignited leaks, well-kicks, minor fires, ships on collision course, drifting objects, filed vessel collisions, structural damage, leaks from risers and pipelines, and damage to risers and pipelines. The Leading Indicators covered in this report are fire detection, gas detection, ESDV riser, Christmas tree and deluge test failure rates.
2.2. Structure of Report
This report is structured in the following fashion: Section 3 is divided into 7 sub-sections. Section 3.1 defines the risk concept. Section 3.2 proves some different perspectives on risk from different view-points. Section 3.3 gives an introduction to simplified calculation of risk. Section 3.4 describes briefly the major accidents that have occurred on the NCS since the start of oil production. Section 3.5 explains the concept of risk indicators and lists the official DFU’s. Section 3.6 is a literature review of previous studies carried out into risk levels, and Section 3.7 givers an overview of the development in risk legislation. Section 4 is divided into 2 sub-sections. Section 4.1 gives the number of fatal accidents only, in a chronological order. Section 4.2 covers all the Major DFU’s sub-divided by type. This sub-section normalizes the number of DFU’s to compare the 3-period moving averages for installations built before and after 2000. Section 5 is divided into 6 sub-sections. Section 5.1 gives an introduction to leading indicators and their physical meaning. Sections 5.2 through to 5.6 give the failure rates by installation year, and average annual failure rates for fire
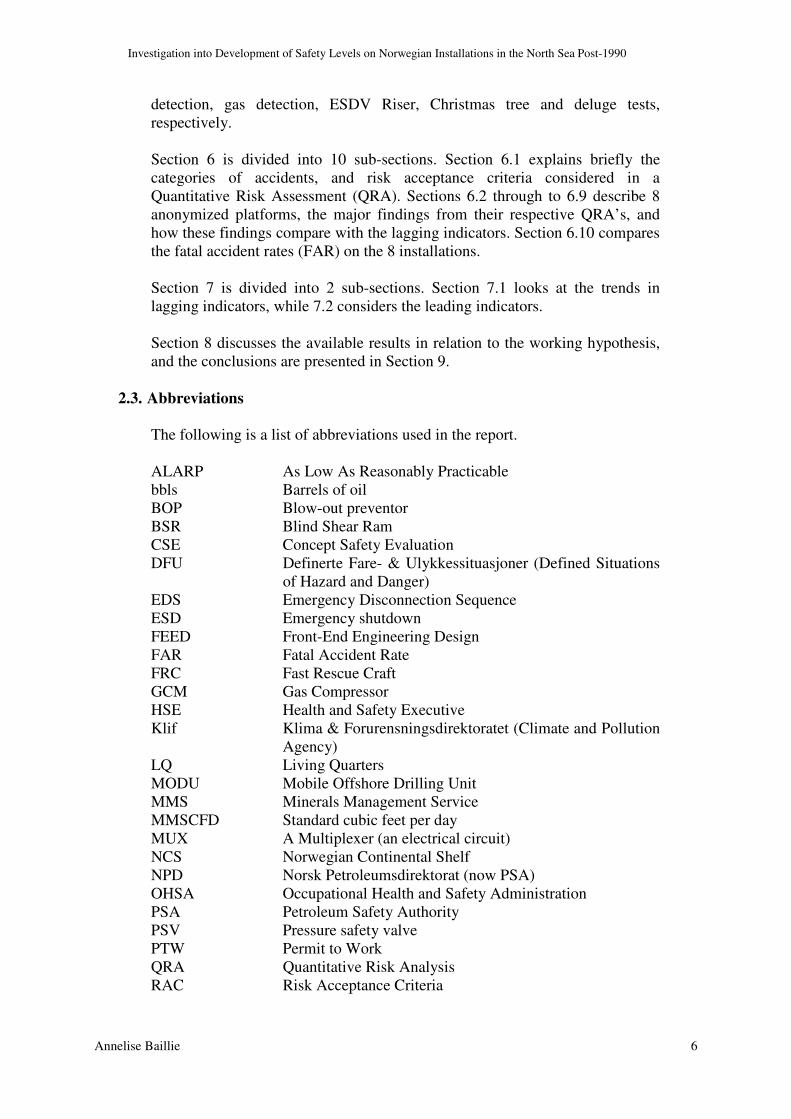
Investigation into Development of Safety Levels on Norwegian Installations in the North Sea Post-1990
Annelise Baillie 6
detection, gas detection, ESDV Riser, Christmas tree and deluge tests, respectively. Section 6 is divided into 10 sub-sections. Section 6.1 explains briefly the categories of accidents, and risk acceptance criteria considered in a Quantitative Risk Assessment (QRA). Sections 6.2 through to 6.9 describe 8 anonymized platforms, the major findings from their respective QRA’s, and how these findings compare with the lagging indicators. Section 6.10 compares the fatal accident rates (FAR) on the 8 installations. Section 7 is divided into 2 sub-sections. Section 7.1 looks at the trends in lagging indicators, while 7.2 considers the leading indicators. Section 8 discusses the available results in relation to the working hypothesis, and the conclusions are presented in Section 9.
2.3. Abbreviations
The following is a list of abbreviations used in the report. ALARP As Low As Reasonably Practicable bbls Barrels of oil BOP Blow-out preventor BSR Blind Shear Ram CSE Concept Safety Evaluation DFU Definerte Fare- & Ulykkessituasjoner (Defined Situations
of Hazard and Danger) EDS Emergency Disconnection Sequence ESD Emergency shutdown FEED Front-End Engineering Design FAR Fatal Accident Rate FRC Fast Rescue Craft GCM Gas Compressor HSE Health and Safety Executive Klif Klima & Forurensningsdirektoratet (Climate and Pollution
Agency) LQ Living Quarters MODU Mobile Offshore Drilling Unit MMS Minerals Management Service MMSCFD Standard cubic feet per day MUX A Multiplexer (an electrical circuit) NCS Norwegian Continental Shelf NPD Norsk Petroleumsdirektorat (now PSA) OHSA Occupational Health and Safety Administration PSA Petroleum Safety Authority PSV Pressure safety valve PTW Permit to Work QRA Quantitative Risk Analysis RAC Risk Acceptance Criteria

Investigation into Development of Safety Levels on Norwegian Installations in the North Sea Post-1990
Annelise Baillie 7
RNNP Risikonivå i Norsk Petroleumsvirksomhet (Risk Level in Norwegian Petroleum Industry)
SEPA Safety and Emergency Preparedness Analysis SMS Safety Management System TR Temporary Refuge TRA Total Risk Assessment TSR Temporary Safe Refuge

Investigation into Development of Safety Levels on Norwegian Installations in the North Sea Post-1990
Annelise Baillie 8
3. THEORETICAL BASIS
3.1. The Risk Concept
There have been many attempts to define what risk is and what it means. The word ‘risk’ derives from the early Italian ‘risicare’, which translates as ‘to dare’ (Aven, 2003), and from which we also get the Norwegian word ‘risikere’ with the same meaning. In Webster’s Dictionary (1989), we find several definitions of risk, some of which are: Expose to the chance of injury or loss A hazard or dangerous chance The hazard or chance of loss The degree of probability of such loss Risk is a way of expressing uncertainty related to future observable quantities.
3.2. Perspectives on Risk
There are several different perspectives on risk. The classical perspective on risk is that risk is a combination of the probability of an event occurring, and the direct expected consequences of that event, for example expected number of fatalities or expected material loss. This is a quantitative, statistical approach to risk which is predominantly used in engineering applications. There is a belief that a ‘true’ probability exists. This perspective is only broadly valid when there are large amounts of data. It is problematic, because it introduces fictional populations with fictional means and standard deviations, and gives uncertainty statements about averages, not observable quantities. The focus is in the wrong place, on these fictional numbers, rather than on real-life behaviour (Aven, 2003). Another perspective, as an alternative to the classical, is the Bayesian approach. In the Bayesian way of thinking, the probability of an event occurring is subjective, through the eyes of the assessor, based on his background knowledge. The probabilities and consequence calculations are updated when more data becomes available. The problem with this approach is that it does not distinguish sharply between probability and utility, as the assigned probability could potentially be coloured by the assessor’s preferences. In practice, there may be limited applicability to Bayesian updating, and the parametric analysis is often seen as an end-product of the statistical analysis (Aven, 2003). The economic perspective on risk is somewhat different, in that risk is viewed as a known probability, and uncertainty as an unknown one. This is an artificial distinction, as all probabilities are ultimately subjective. One of the problems with this perspective is trying to assign fictional and arbitrary monetary values to immaterial quantities, such as value of human lives or the environment, and a resultant over-focus on calculation of Expected Utility. Such calculation

Investigation into Development of Safety Levels on Norwegian Installations in the North Sea Post-1990
Annelise Baillie 9
cannot and should not replace proper management review and judgment (Aven, 2003). The social science view of the concept of risk is much broader. In this perspective, risk refers to the full range of beliefs that people have about hazardous events. It includes people’s perception of actual risk and the acceptability of such risk, even though it is known that lay people often over-estimate the risk of events and facilities that are geographically or physically in proximity to them, while under-estimating less visible or intangible risks. Such evaluations vary with the social, cultural and historical context. The problem with this approach is the lack of distinction between possible future events, and how the observer feels about them (Aven & Vinnem, 2007).
3.3. Calculation of Risk
Risk is often calculated on the basis of histories of previous accidents, frequencies, and lives lost. In fact, in many people’s minds, “risk is closely related to accident statistics” (Aven, 2003). It is common to produce tables and reports on the number of fatalities and injuries as a result of accidents, on an annual basis, in order to identify time trends. The RNNP is an excellent example of this. If the numbers do not vary greatly from year to year, such as fatal road accidents in a specific country, we have a good picture of overall risk for that country’s roads, and can predict annual number of fatalities for the total activity (not individuals) with a reasonable degree of certainty. Classical statistical hypothesis testing is often used for analysing accident data. The starting point is a null hypothesis, which means there is no trend (steady state, no worsening or improvement), and we test this against a significant worsening/improvement of the accident rate. It is common to use a 5% significance level to make an erroneous rejection of the null hypothesis. The drawback of this method is that a large amount of data to draw a definite conclusion, which is not always available. The statistics may not always show clear trends, and even when they do, they do not explain why there has been an improvement/worsening. Furthermore, the historical statistics may not give a representative picture of future risk, due to the introduction of new technology, methods or designs. One of the basic measures in risk calculation is the PLL (Potential Loss of Life) value. This denotes the Expected Number of Fatalities over a Year, and can be based on historical statistics as explained above. From this, one calculates the FAR (Fatal Accident Rate) as follows:
810•
=
nt
PLLFAR
Where: n persons are exposed to the risk for t hours. We can also calculate AIR (Average Individual Risk) as follows:

Investigation into Development of Safety Levels on Norwegian Installations in the North Sea Post-1990
Annelise Baillie 10
=
n
PLLAIR
Then we get 810•
=
t
AIRFAR
3.4. Major Accidents
The major accidents on the Norwegian Continental Shelf (NCS) have mercifully been few and far between. This is, on the one hand, fortunate in terms of lives preserved, but also makes it easy to forget the lessons learnt from those that have taken place, and may lead to complacency or carelessness. In a class of its own was the Alexander Kielland capsize on 27th March 1980. The flotel lost one of its five legs in severe gale force winds, suffered catastrophic failure of the main structure, and 123 lives were lost. The cause of the accident was that one of the bracing members broke off due to fatigue. With lack of suitable redundancy in the structure, the situation escalated and the whole platform suffered severe listing. In this case, all barriers failed (Vinnem, 2007). The high number of fatalities compared to any other incident on the NCS, combined with the fact that it was a structural failure, not a leak or explosion (like Piper Alpha in the U.K. sector), makes it very difficult to compare with other accidents. The accident was a driving force behind the development of free-fall life-boats (Vinnem, 2007). The Ekofisk B Blow-out on 23rd April 1977 was more of a classic blow-out case, on a typical steel jacket wellhead platform. The accident was caused by failure of well control barriers, specifically by the fact that the BOP was not in place, and could not be reassembled correctly in time. Despite the fact that 20000m3 of oil was spilt, it is interesting to note that this was a showcase example of an accident where no other barriers failed. There was no ignition, the evacuation was orderly and successful, and there were no fatalities (Vinnem, 2007). The West Vanguard Gas Blow-out on 6th October 1985 was a slightly more unusual form of blow-out. This was a shallow gas blow-out during exploration drilling in the Haltenbanken area, using a marine riser. Normally, such drilling through shallow zones is now carried out without marine risers. The resultant consequence scenario was a textbook example of all barriers (bar rescue) failing, including failure of well control, failure to prevent ignition, failure of gas diverter, and failure to prevent or contain the explosion. The ignition was believed to have been caused by a diesel generator. There was 1 fatality, probably blown overboard by the explosion, but the body was never found (Vinnem, 2007). The Ekofisk A riser rupture took place on 1st November 1975. A test riser on a steel jacket ruptured due to fatigue failure. The fatigue failure was caused by inadequate corrosion protection of the piece of pipe that had replaced in the

Investigation into Development of Safety Levels on Norwegian Installations in the North Sea Post-1990
Annelise Baillie 11
splash zone. Unfortunately, the leak occurred immediately below the platform Living Quarters. The leak was ignited, causing an explosion and subsequent fire. Some of the subsequent escalation barrier failures were deemed to have been caused by panic. The risk of panic has been subsequently much reduced, by considerable improvement in evacuation and training exercises. The Jotun Pipeline rupture was a slightly different type of accident, in that it was not in the vicinity of a platform, therefore there were no fatalities. There were two ruptures in a pipeline, approximately 10km from Jotun A on 20th August 2004, and the immediately attempt to close the valves failed due to a lack of suitable ROV resources. The rupture was caused by impact denting by fishing trawls. The only barrier failure was one of containment, and no other barriers failed. It is obvious from this list that using historical records of major accidents on the NCS has severe limitations, because there are so few. We do not have enough statistical material to warrant conclusion of any trends.
3.5. Risk Indicators
There are many risk indicators that can be, and are, used. It is common to use numbers of major hazardous situations such as major leaks, ignitions and fires as lagging risk indicators (‘lagging’ refers to events that have already occurred). Typically, industry also uses Lost Time Injuries per Million Man-hours and Personnel Injuries per Million Man-hours as risk indicators, both across their business as a whole, and broken down by business unit (Aven & Vinnem, 2007). The Petroleum Safety Authority (PSA) Risk Level Project, RNNP, is a systematic collection of risk indicators for the Norwegian Continental Shelf (NCS). This project uses a triangulation approach, recognising that no single indicators are in themselves capable of expressing all the aspects of risk in the Norwegian offshore industry (Aven & Vinnem, 2007). In addition to the above indicators, it also includes risk of occupation injury and illness. The following table from RNNP (Table 1, 2009) lists the defined situations of hazard (translated from Norwegian DFU).
DFU No.
DFU Description Data Sources
1 Non-Ignited hydrocarbon leaks HCLIP via data acquisition*
2 Ignited hydrocarbon leaks HCLIP via data acquisition*
3 Well kicks/loss of well control CDRS (PSA)
4 Fire/explosion in other areas Data acquisition*
5 Vessel on collision course Data acquisition*
6 Drifting object Data acquisition*
7 Collision with field-related vessel/installation/shuttle tanker
CODAM (PSA)
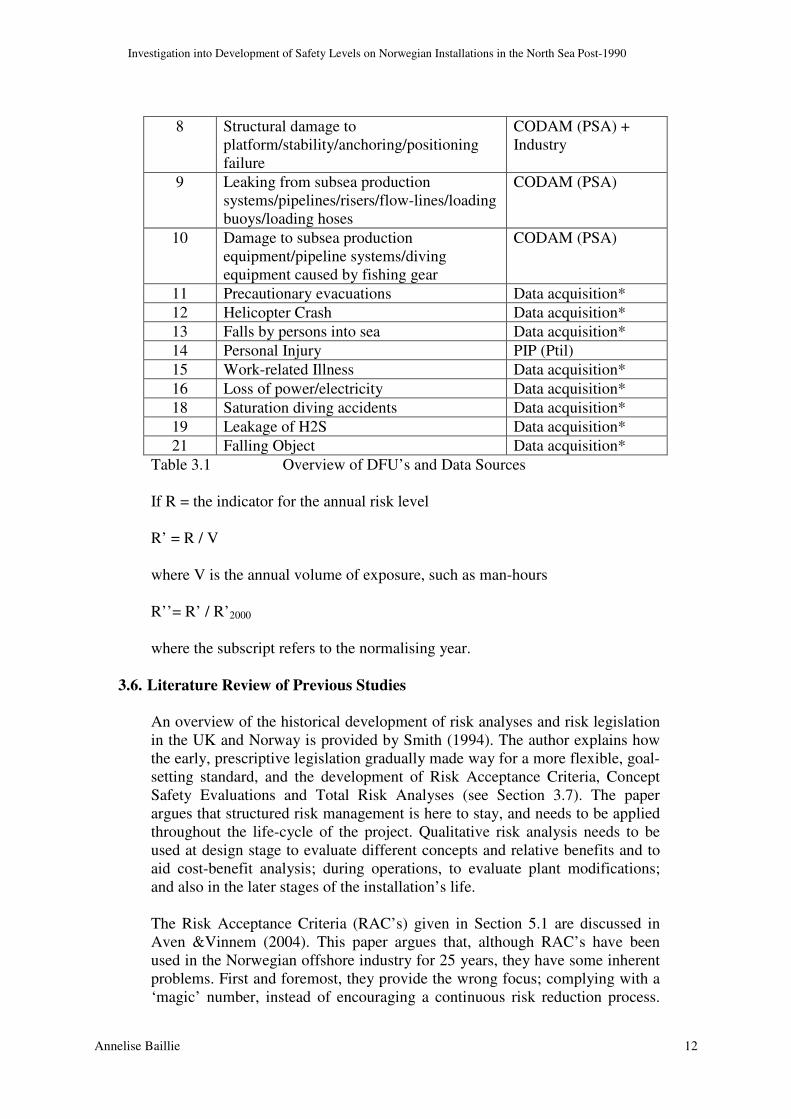
Investigation into Development of Safety Levels on Norwegian Installations in the North Sea Post-1990
Annelise Baillie 12
8 Structural damage to
platform/stability/anchoring/positioning failure
CODAM (PSA) + Industry
9 Leaking from subsea production systems/pipelines/risers/flow-lines/loading buoys/loading hoses
CODAM (PSA)
10 Damage to subsea production equipment/pipeline systems/diving equipment caused by fishing gear
CODAM (PSA)
11 Precautionary evacuations Data acquisition*
12 Helicopter Crash Data acquisition*
13 Falls by persons into sea Data acquisition*
14 Personal Injury PIP (Ptil)
15 Work-related Illness Data acquisition*
16 Loss of power/electricity Data acquisition*
18 Saturation diving accidents Data acquisition*
19 Leakage of H2S Data acquisition*
21 Falling Object Data acquisition*
Table 3.1 Overview of DFU’s and Data Sources
If R = the indicator for the annual risk level R’ = R / V where V is the annual volume of exposure, such as man-hours R’’= R’ / R’2000 where the subscript refers to the normalising year.
3.6. Literature Review of Previous Studies
An overview of the historical development of risk analyses and risk legislation in the UK and Norway is provided by Smith (1994). The author explains how the early, prescriptive legislation gradually made way for a more flexible, goal-setting standard, and the development of Risk Acceptance Criteria, Concept Safety Evaluations and Total Risk Analyses (see Section 3.7). The paper argues that structured risk management is here to stay, and needs to be applied throughout the life-cycle of the project. Qualitative risk analysis needs to be used at design stage to evaluate different concepts and relative benefits and to aid cost-benefit analysis; during operations, to evaluate plant modifications; and also in the later stages of the installation’s life. The Risk Acceptance Criteria (RAC’s) given in Section 5.1 are discussed in Aven &Vinnem (2004). This paper argues that, although RAC’s have been used in the Norwegian offshore industry for 25 years, they have some inherent problems. First and foremost, they provide the wrong focus; complying with a ‘magic’ number, instead of encouraging a continuous risk reduction process.

Investigation into Development of Safety Levels on Norwegian Installations in the North Sea Post-1990
Annelise Baillie 13
There is too much emphasis on them, so the risk analyses become mechanistic means of demonstrating ‘no risk’ instead of identifying risk reducing measures. We show in Sections 5.2-5.8 that this is indeed the case for many risk analyses. The standard Z-013 requires ALARP processes, but these are often perfunctory, or not carried out at all. The paper argues that RAC’s should be replaced by proper risk management, real evaluations of burdens and benefits, and a drive for risk reductions. Sections 5.2-5.8 demonstrate that industry is still currently far from complying with these recommendations. Tharaldsen, Olsen & Rundmo (2007) used the NORSCI questionnaire to measure safety climate and whether employee perceptions of safety had changed over time. To this end, they used two surveys, one in 2001 and one in 2003. The survey measured 5 dimensions: safety prioritization, safety management, safety vs. production, individual motivation, and system comprehension. The paper concluded that the safety climate improved from 2001 to 2003, but platform, work area, type of company and type of platform were significant differentiating variables. They identified a negative correlation between safety climate and accident rates, i.e., the poorer the safety climate, the more reported accidents, and vice versa. Høivik et al (2009) used the data from RNNP 2005 as well as a survey of those who attended offshore installations from December 2005 to February 2006, to attempt to determine whether company belonging or local working installation was most important for the safety climate, but did not specifically attempt to clarify if said safety climate had improved over time. They concluded that both company and local HSE work had importance, but the variances in safety climate were mostly caused by individual installations, so that the local workplace was more crucial. Tharaldsen, Mearns & Knudsen (2009) is an interesting paper on the interrelationship between safety and the cultural differences between British and Norwegian drilling employees, both working for the same company on the NCS and the UK Shelf. These cultural differences are not the subject of this investigation, but it includes some helpful self-reported accident and incident figures. Out of the persons surveyed, 34% had been involved in an incident (37% on the NCS). 12% had been involved in a near-miss (13% on the NCS) and 5% had suffered an injury not requiring medical attention (6% on the NCS). It is noteworthy that the NCS workers reported greater willingness to report near-misses. However, employees on both shelves reported greater positive focus on safety in the last few years, and increased prioritization of safety, though there is still under-reporting of lost-time accidents. Vinnem et al (2002) developed a systematic approach to use of risk indicators to monitor trends on a national level. By decomposing Heinrich’s Triangle into event based categories, including incidents and near-misses, they showed that it is possible to calculate expected number of fatalities per occurrence per plant, by assigning appropriate weight factors to seriousness of events. The approach requires defined and selected DFU’s, data about incidents and near-misses, data about barrier performance as well as qualitative evaluations. Normalization makes the approach more universal, but is not compulsory. The
Investigation into Development of Safety Levels on Norwegian Installations in the North Sea Post-1990
Annelise Baillie 14
advantage of this approach is that it gives increased focus on causes and conditions. It is evident from the RNNP publications that this approach has been adopted by the PSA for their annual reporting. The issue of risk indicators is developed further in Vinnem (2009), which proposes major hazard risk indicators for offshore installations. These are based on the RNNP, and include both leading (barrier performance) and lagging (event-based) indicators, as both are necessary. Leading indicators are based on effectiveness and number of serious failures of barriers such as fire detection, gas detection, safety valves and active fire protection. The paper argues that 3-year rolling averages should be used instead of annual figures, due to the low volume of faults in tests. The paper claims that major hazard risk indicators are required in order to maintain high awareness of the potential for such events, else they “lose focus and concentrate solely on prevention of occupation accidents”. As the list of fatal accidents in Section 4.1.1 shows, occupational accidents (along with lifting accidents, which is a form of occupational hazard) have been one of the leading causes of fatalities in petroleum-related activity in the past 15 years. We therefore do not necessarily
share the author’s view that such accidents are gaining focus and attention at the expense of major hazards, though it is right and proper to reduce both. The root causes of major hazards are further explored in Vinnem et al (2010). This paper is the most extensive study, so far, into discovering relationships that may shed light on root causes of major hazard precursors, as previous studies have proved inconclusive. This study used DFU1 data and barrier data from the period 2000-2008, and the offshore personnel questionnaire survey data from 2004, 2006 and 2008. This study found a correlation between high failure fraction of ESD valves with high frequency of leaks, but no other barriers were found to be significant. There was also a significant correlation between the safety climate and number of leaks over time. Age of installations was not found to be significant for leaks, a topic that is explored further in this investigation, and discussed in Sections 4.2.1 and 7. Additionally, the study noted that failure to follow procedures was the root cause in 5 out of 5 serious injury investigations, and found a borderline significant relationship between noise levels and leaks on installations. In Vinnem (2008) the author sought to determine if there has been a significant reduction in risk to personnel since 1997. Based on extensive statistics, the paper shows that risk levels decreased by about 40% from 1997 to 2007. It was more extensive for mobile installations (65%) than for production installations (25%). Fatality risk falls mainly into 3 categories for offshore personnel: occupational, major accidents and helicopter transport. In 1997, the relative contribution to fatality risk from these was about 40%, 30% and 30%, respectively for production installations. For mobile installations, the figures were 75%, 10% and 15%, respectively. In 2007, the relative contribution to fatality risk from occupational, major and helicopter accidents was about 30%, 30% and 40%, respectively for production installations. For mobile installations, the figures were 25%, 50% and 25%, respectively. In other words, the distribution was fairly unchanged for production installations, but significantly changed for mobile units. The main reason for this on mobile

Investigation into Development of Safety Levels on Norwegian Installations in the North Sea Post-1990
Annelise Baillie 15
units was an 85% reduction in contribution from occupational accidents, so that the relative contribution from major accidents has now strongly increased. As mobile installations are now much more common, their relative contribution to the risk picture has become correspondingly greater. An economic perspective on losses is provided by Kaiser (2006), which concentrates on regions rather than national continental shelves, and on financial rather than human losses. The paper is based on the Willis Energy Loss database which focuses on property-related losses rather than individual death or injury claims. This database uses a larger number of categories than the DFU’s defined in Section 3.5, for insurance purposes, including anchor/jacking trawl, capsize/collapse, corrosion, earthquake/tsunamis, heavy weather, blowout, collision, design failure, fire/explosion, ice/icebergs and several others. The NCS comes under the region Europe (which presumably also includes the UK, Denmark, and the Netherlands). The figures (up to 2004, for all) must be seen in this light. Total losses for Europe from 1972 to 2004 were 11.169M$, similar to North America. The largest number of incidents by loss category, were for Platforms (353), followed by Pipelines (259). The biggest cause of losses in this region were due to poor Design/workmanship (354 incidents) compared to Blowouts in North America (354). In contrast, losses due to blowout have been few in Europe – just 34 in the same period. Losses due to fire incidents are comparable between the two regions – 44 in Europe, against 54 in North America. This source unfortunately has two weaknesses. One is that none of the tables are differentiated into different time periods, so no trends can be identified. The other problem is that none of the data is normalized in any way – all figures are absolute. An examination of the complex relationship between behaviour, technology and organization-based safety is made in Ryggvik (2008), focusing primarily on the history of the interaction between these elements in the Norwegian petroleum offshore industry, but also giving considerable historical background analysis of the development of safety models in the US and Europe. The greatest weakness of this source is its lack of balance and impartiality. The work primarily voices the agenda and opinions of the Norwegian petroleum trade unions, and the author admits as much in the preface and introduction. The author is highly critical of Behaviour Based Safety (BBS) systems, and most of the work is dedicated to discrediting it. The conclusions are therefore entirely predictable. Ryggvik claims that BBS “represents a change in the safety work that may undermine central parts of what has been a relatively successful approach to safety and working environment in the Norwegian oil business” (translation), without giving a single concrete example that this has been the case. The author also names and shames foreign and Norwegian companies on the NCS that have adopted BBS systems to varying degree, which reduces this work’s claim to professional credibility.
3.7. Development of Legislation
In the 1970’s, Norwegian petroleum legislation was primarily “technically orientated”. It had “detailed and prescriptive requirements for both safety and technical solutions” (Aven & Vinnem, 2004). This was a rigid approach, which
Investigation into Development of Safety Levels on Norwegian Installations in the North Sea Post-1990
Annelise Baillie 16
did not encourage cost-effective or innovative solutions (Smith, 1994). The industry started using structured risk management in the late 1970’s. Then, in 1976, the NPD issued Regulations Concerning Safety Related to Production and Installation, which first had a requirement for qualitative risk evaluations (Smith, 1994). 1980 saw the introduction of NPD regulatory guidelines for so-called Concept Safety Evaluation (CSE) studies. These guidelines addressed the risk of impairment of safety functions (Smith, 1994) and introduced a new cut-off criterion of 1*10-4 as the maximum impairment frequency for nine types of accidents – that is to say, a maximum probability of occurrence of 1*10-4 per year. This new criterion helped to formalize preparation of risk analyses, and encouraged communication about risk and acceptable risk, but had the side-effect of putting too much emphasis on mechanically following rules instead of on risk reduction (Aven & Vinnem, 2004). Over time, the operators themselves extended the CSE’s into more comprehensive Total Risk Assessments (TRA’s). The TRA’s addressed more detailed safety systems than the CSE’s had done. The Piper Alpha disaster demonstrated to the operators that QRA’s needed to be used for overall risk, not just specific aspects of design (Smith, 1994). In 1985, safety regime responsibility was moved from authority control to internal control. NPD responsibility became limited to high-level control of operator documentation of the operators’ own safety management systems. In 1990, new NPD regulations came into force, regarding implementation and use of risk analyses. These required that the operators themselves define safety objectives and risk acceptance criteria (RAC’s). The regulations also explained the purpose of these safety objectives, and the need for an ALARP process. This means that the risk should be As Low as Reasonably Practicable (Aven & Vinnem, 2004). The regulations, in effect, required that operators use QRA as a tool, to manage safety systematically. New regulations on Emergency Preparedness came in 1992. In 2001, the new NPD Petroleum Management Regulations came into force. These marked a shift away from prescriptive ‘Ptil’ rules to functional requirements. The new approach is goal-setting, and therefore more flexible. The aim is to achieve cost-effective solutions without compromising safety. This is particularly important as the industry moves towards concurrent engineering (compressed design periods) (Smith, 1994). The regulations specified requirements that the operators had to formulate RAC’s both for major accidents and for environmental accidents. Furthermore, these RAC’s have to be used for evaluating the results of the company risk analysis for risk to personnel, risk of impairment of safety functions, and risk of environmental spills or pollution (Aven & Vinnem, 2004). A revised set of regulations came into force in 2011. These are outside the scope of this investigation.

Investigation into Development of Safety Levels on Norwegian Installations in the North Sea Post-1990
Annelise Baillie 17
4. OVERVIEW OVER ACCIDENTS AND INCIDENTS – LAGGING
INDICATORS
The purpose of this section is two-fold, to provide an overview over the fatal accidents that have occurred post-1995, and provide an overview of the total numbers of accidents in the same categories. The chronological list of fatal accidents in petroleum-related activities and associated maritime operations comprises those relating to structural/marine systems, helicopter, falls, diving, lifting, occupational accidents, fire and explosions, drilling operations and others. 4.1. Chronological List of Fatal Accidents
Note that there have been no fatalities in categories Diving, Fire and Explosions, Drilling Operations or Poisoning in the period considered.
4.1.1. Period 1996-2000
Table 4.1 shows the fatal accidents in the period 1996 to 2000, accident category, number of fatalities per event, and the DFU Number, if applicable. Note that both Occupational and Lifting accidents come under DFU 14 Personal Injury.
Date Description Accident
Category
No. of
Fatalities
DFU No. if
Applicable
03/01/96 Accident on standby vessel Normand Mjølne during lifting operation for the flotel Polydrown. A wave hit the deck and moved an improperly secured container which hit a man.
Lifting Operation
1 14
22/09/96 Fatal accident on Far Minara. Anchor handling vessel to LB 200 when laying pipeline Zeepipe II B. Anchor wire ripped.
Structural/ Marine Systems
1 14
14/10/96 Fatal accident on pipe-laying vessel LB 200. In bad weather, a piece of
Occupational 1 14

Investigation into Development of Safety Levels on Norwegian Installations in the North Sea Post-1990
Annelise Baillie 18
pipe rolled and hit a man who became squeezed between that and another piece of pipe.
08/09/97 A Super Puma helicopter crashed in the sea during transportation of personnel from Brønnøysund to the Norne field. Note, not included in this investigation, but included in this table for completeness.
Helicopter 12 12
24//02/99 Drilling deck worker hit by drilling pipe on Heidrun.
Occupational 1 14
24/12/00 Crane- and lifting operation on Oseberg Øst. A man was hit during a lift on the pipe deck. The lift was carried out in a blind zone that had not been ensured to empty of people.
Lifting 1 14
11/09/00 Deck worker on specialist vessel Maersk Seeker was hit by a chain that was connected to vessel. Died of his injuries. Work with anchor on Veslefrikk B.
Occupational 1 14
Table 4.1 Fatal Accidents Period 1996-2000 It is noteworthy that the helicopter accident pulls up the total number of fatalities for this period significantly. If it is ignored, the total is not significantly more than the next 5-year period.
Investigation into Development of Safety Levels on Norwegian Installations in the North Sea Post-1990
Annelise Baillie 19
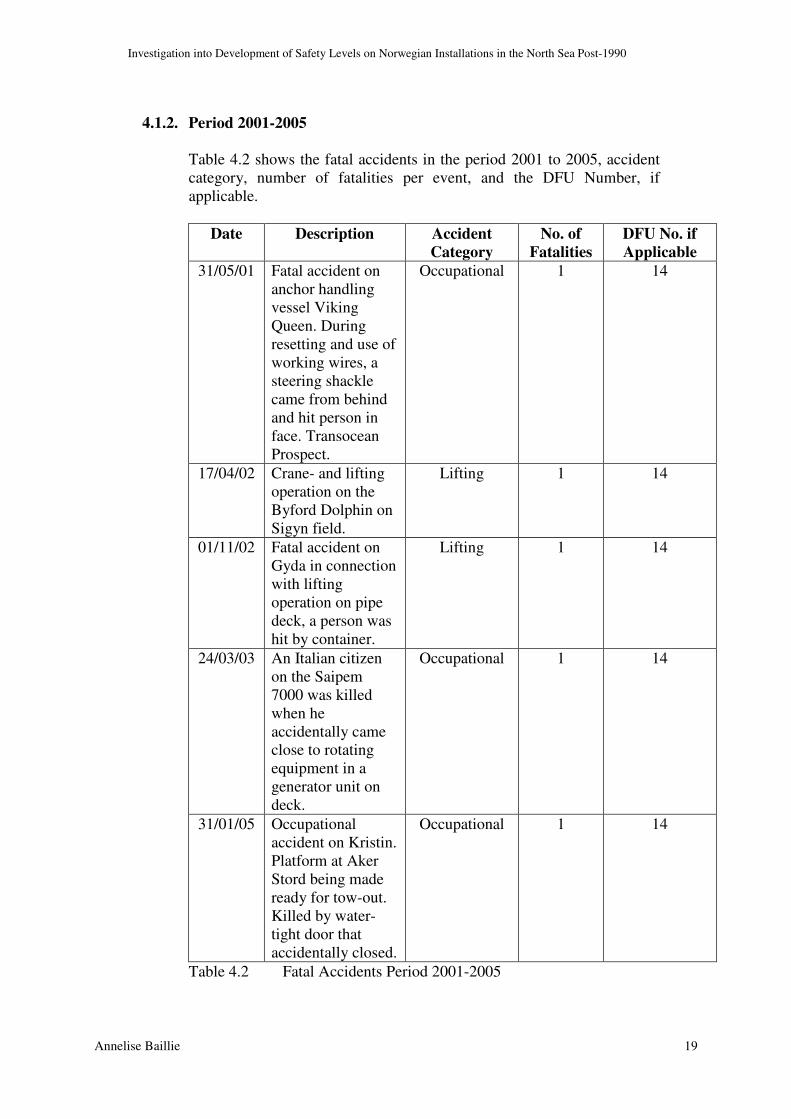
4.1.2. Period 2001-2005
Table 4.2 shows the fatal accidents in the period 2001 to 2005, accident category, number of fatalities per event, and the DFU Number, if applicable.
Date Description Accident
Category
No. of
Fatalities
DFU No. if
Applicable
31/05/01 Fatal accident on anchor handling vessel Viking Queen. During resetting and use of working wires, a steering shackle came from behind and hit person in face. Transocean Prospect.
Occupational 1 14
17/04/02 Crane- and lifting operation on the Byford Dolphin on Sigyn field.
Lifting 1 14
01/11/02 Fatal accident on Gyda in connection with lifting operation on pipe deck, a person was hit by container.
Lifting 1 14
24/03/03 An Italian citizen on the Saipem 7000 was killed when he accidentally came close to rotating equipment in a generator unit on deck.
Occupational 1 14
31/01/05 Occupational accident on Kristin. Platform at Aker Stord being made ready for tow-out. Killed by water-tight door that accidentally closed.
Occupational 1 14
Table 4.2 Fatal Accidents Period 2001-2005

Investigation into Development of Safety Levels on Norwegian Installations in the North Sea Post-1990
Annelise Baillie 20
4.1.3. Period 2006-2010
Table 4.3 shows the fatal accidents in the period 2001 to 2005, accident category, number of fatalities per event, and the DFU Number, if applicable.
Date
Description Accident
Category
No. of
Fatalities
DFU No. if
Applicable
12/08/07 Philippine sailor was killed in occupational accident on lifting vessel Saipem 7000 on Tordis field.
Occupational 1 13
07/05/09 25-year old man fell down 14m from scaffolding on Oseberg B. He was in the process of dismantling scaffolding. Died in hospital of injuries.
Fall 1 14
Table 4.3 Fatal Accidents Period 2006-2010
4.1.4. Total Number of Fatal Accidents
Table 4.4 shows the total number of fatalities for the 15-year period, per accident category.
Category 1996-2000 2001-2005 2006-2010 Total
Structural/Marine systems
1 0 0 1
Helicopter 12 0 0 12
Falls 0 0 1 1
Diving 0 0 0 0
Lifting 2 2 0 4
Occupational Accidents
3 3 1 7
Fire and explosions
0 0 0 0
Drilling Operations
0 0 0 0
Poisoning 0 0 0 0
Others 0 0 0 0
Total 18 5 2 25
Table 4.4 Total Number of Fatalities per 5-Year Period, by Category

Investigation into Development of Safety Levels on Norwegian Installations in the North Sea Post-1990
Annelise Baillie 21
It is clear from Table 4.4 that, even excepting the helicopter crash that caused 12 fatalities in 1997, there has been a steady fall in the number of fatalities per year. There have been no helicopter fatalities since then, marking it as a one-off accident. Apart from this accident, nearly all the fatalities in the 15-year period have been due to occupational or lifting accidents. For most practical purposes, lifting can also be considered an occupational hazard. Therefore, it is reasonable to deduce from these figures that the likelihood of being killed in an occupational accident on an installation is very much greater than the probability of being killed in a major accident.
4.2. Accidents by Type (Fatal and Non-Fatal)
In this section, the accident/incident classification defined in the RNNP is used. Each sub-section covers a separate DFU (See Table 3.1), except Section 4.2.1 which includes both DFU 1 and 2, and Section 4.2.8, which includes both DFU 9 and 10.
4.2.1. Ignited and Non-Ignited Leaks – DFU 1 & 2
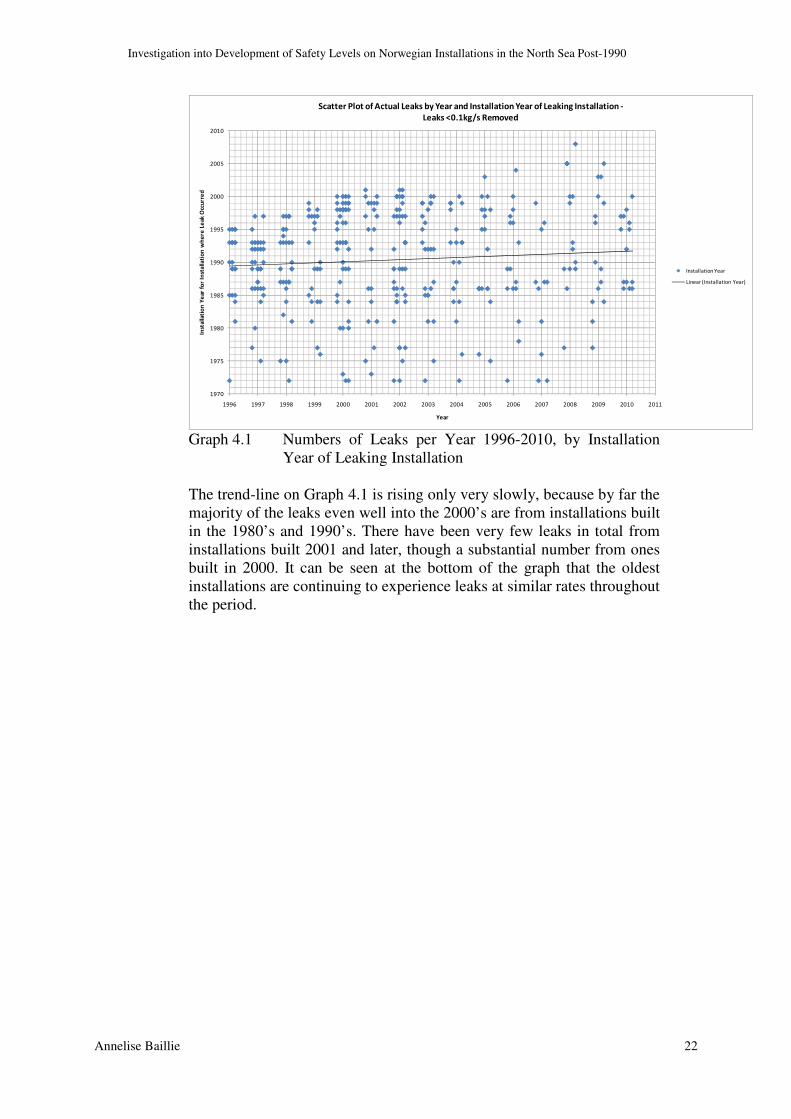
DFU 1 is non-ignited leaks and DFU 2 is ignited leaks. There have been no ignited leaks since RNNP records began in 1996. Therefore, Graph 4.1, which is a representation of the recorded leaks on installations on the NCS from 1996 up to 2010, effectively only shows DFU 1 events. Each point represents one leak; hence there have normally been in excess of 10 leaks per year. Leaks <0.1kg/s have been removed from the data, because prior to 2001, large numbers of such leaks were recorded, while after this, very few were recorded, so the available data is inconsistent. It is also considered reasonable to remove these data, because the ignition probability of so small leaks is extremely low. The y-axis shows the Installation Year of the installation on which a leak was recorded. To avoid many dots on the same point (due to the fact that one installation may have several leaks in the same year, and several installations may have been built in the same year), ‘false’ x-values (Year) have been employed, with each Year±0.1 and ±0.2.
Investigation into Development of Safety Levels on Norwegian Installations in the North Sea Post-1990
Annelise Baillie 22
1970
1975
1980
1985
1990
1995
2000
2005
2010
1996 1997 1998 1999 2000 2001 2002 2003 2004 2005 2006 2007 2008 2009 2010 2011
Inst
alla
tio
n Y
ear
fo
r In
sta
llati
on
wh
ere
Le
ak O
ccu
rre
d
Year
Scatter Plot of Actual Leaks by Year and Installation Year of Leaking Installation -
Leaks <0.1kg/s Removed
Installation Year
Linear (Installation Year)
Graph 4.1 Numbers of Leaks per Year 1996-2010, by Installation
Year of Leaking Installation The trend-line on Graph 4.1 is rising only very slowly, because by far the majority of the leaks even well into the 2000’s are from installations built in the 1980’s and 1990’s. There have been very few leaks in total from installations built 2001 and later, though a substantial number from ones built in 2000. It can be seen at the bottom of the graph that the oldest installations are continuing to experience leaks at similar rates throughout the period.

Investigation into Development of Safety Levels on Norwegian Installations in the North Sea Post-1990
Annelise Baillie 23
Graph 4.2 shows the number of leaks per year greater than 0.1kg/s, for installations built before (blue dots) and after 2000 (red dots). They have been normalized by number of million man-hours (approximate), which is only available in full from 2002. The red and blue lines show the 3-period Moving Averages.
0
0,5
1
1,5
2
2,5
3
2002 2003 2004 2005 2006 2007 2008 2009 2010
No
. O
f L
ea
ks
pe
r Y
ea
r /
No
. O
f M
illi
on
Ma
n-h
ou
rs
Year
No. Of Leaks per Year Normalised by No. Of Million Man-hours -
Installations Built Before and After 2000
No. Of Leaks per Year / No. Of
Mill ion Man-hours - Installations
Built in or After 2000
No. Of Leaks per Year / No. Of
Mill ion Man-hours - Installations
Built Before 2000
3 Period Moving Average -
Installations Built in or After 2000
3 Period Moving Average -
Installations Built Before 2000
Graph 4.2 Number of Leaks per Year 1996-2010, Normalised by No.
of Million Man-hours – Installations Built Before (blue) and After 2000 (red)
As Graph 4.2 shows, normalizing by number of Million Man-hours gives a very different picture from Graph 4.1. The low number of Man-hours in the early 2000’s for post-2000 installations somewhat skews the results, so that the normalized number of leaks from these installations exceeded those from pre-2000 installations until 2003. Since then, the differences between the 3-period moving averages for the 2 groups have been small. For both groups, there was a reduction in the normalized number of leaks to about 0.2 around 2007. However, both have been increasing in the subsequent 3 years.
Investigation into Development of Safety Levels on Norwegian Installations in the North Sea Post-1990
Annelise Baillie 24
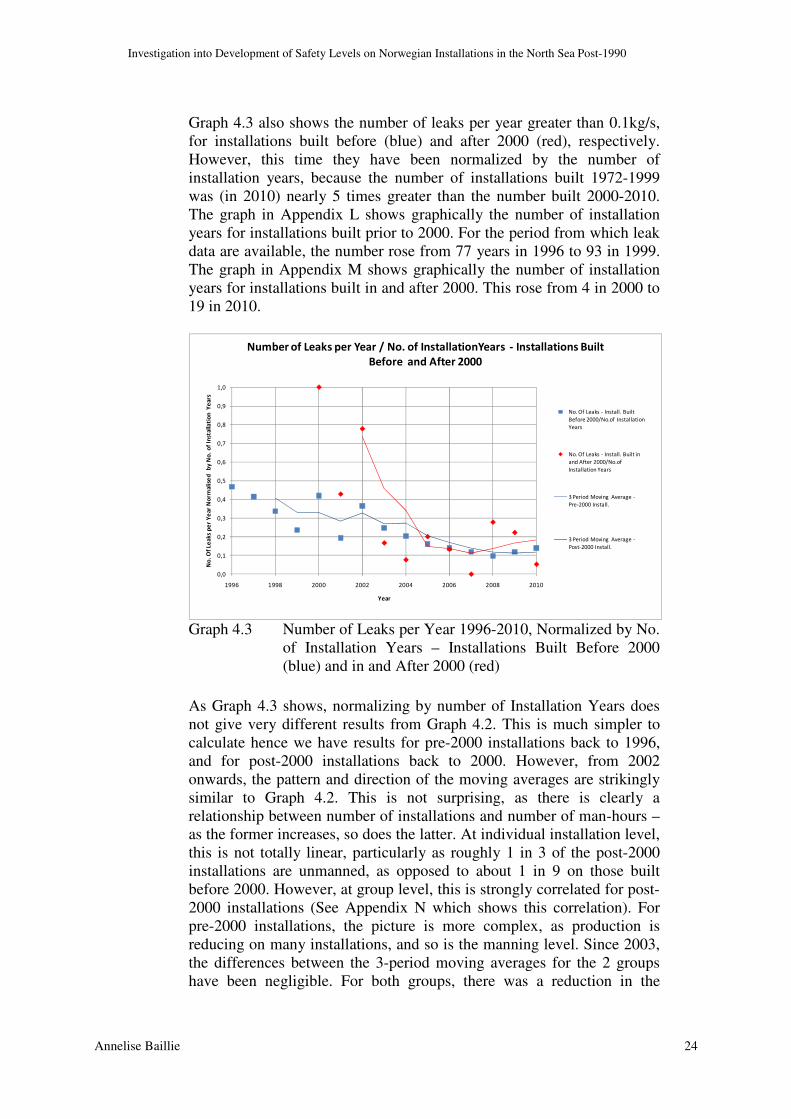
Graph 4.3 also shows the number of leaks per year greater than 0.1kg/s, for installations built before (blue) and after 2000 (red), respectively. However, this time they have been normalized by the number of installation years, because the number of installations built 1972-1999 was (in 2010) nearly 5 times greater than the number built 2000-2010. The graph in Appendix L shows graphically the number of installation years for installations built prior to 2000. For the period from which leak data are available, the number rose from 77 years in 1996 to 93 in 1999. The graph in Appendix M shows graphically the number of installation years for installations built in and after 2000. This rose from 4 in 2000 to 19 in 2010.
0,0
0,1
0,2
0,3
0,4
0,5
0,6
0,7
0,8
0,9
1,0
1996 1998 2000 2002 2004 2006 2008 2010
No
. O
f L
ea
ks
pe
r Y
ea
r N
orm
ali
sed
b
y N
o.
of
Inst
all
ati
on
Ye
ars
Year
Number of Leaks per Year / No. of InstallationYears - Installations Built
Before and After 2000
No. Of Leaks - Install. Built
Before 2000/No.of Installation
Years
No. Of Leaks - Install. Built in
and After 2000/No.of
Installation Years
3 Period Moving Average -
Pre-2000 Install.
3 Period Moving Average -
Post-2000 Install.
Graph 4.3 Number of Leaks per Year 1996-2010, Normalized by No.
of Installation Years – Installations Built Before 2000 (blue) and in and After 2000 (red)
As Graph 4.3 shows, normalizing by number of Installation Years does not give very different results from Graph 4.2. This is much simpler to calculate hence we have results for pre-2000 installations back to 1996, and for post-2000 installations back to 2000. However, from 2002 onwards, the pattern and direction of the moving averages are strikingly similar to Graph 4.2. This is not surprising, as there is clearly a relationship between number of installations and number of man-hours – as the former increases, so does the latter. At individual installation level, this is not totally linear, particularly as roughly 1 in 3 of the post-2000 installations are unmanned, as opposed to about 1 in 9 on those built before 2000. However, at group level, this is strongly correlated for post-2000 installations (See Appendix N which shows this correlation). For pre-2000 installations, the picture is more complex, as production is reducing on many installations, and so is the manning level. Since 2003, the differences between the 3-period moving averages for the 2 groups have been negligible. For both groups, there was a reduction in the

Investigation into Development of Safety Levels on Norwegian Installations in the North Sea Post-1990
Annelise Baillie 25
normalized number of leaks to about 0.1 around 2007. However, both have increased slightly towards 2010.
4.2.2. Well Kicks/Loss of Well Control – DFU 3
DFU 3 events are well-kicks and loss of well control. Graph 4.4 is a representation of all the recorded well-kicks on production installations (mobile rigs are excluded, because they have been re-used in many different locations) on the NCS from the start of the RNNP records in 1996 up to 2009. Each point is represents one well-kick hence there have normally been in excess of 5 well-kicks per year. Otherwise, the graph is similar to Graph 4.1.
1970
1975
1980
1985
1990
1995
2000
2005
2010
1994 1995 1996 1997 1998 1999 2000 2001 2002 2003 2004 2005 2006 2007 2008 2009 2010
Inst
alla
tio
n Y
ear
Year
Wellkicks by Year and Installation Year - Production Installations Only
Installation Year
Lineær (Installation Year)
Graph 4.4 Well-kicks per Year 1996-2009, by Installation Year of
Installation with Well-kick The trend-line on Graph 4.4 is rising much more slowly than one might expect. The average installation year for installation experiencing well-kick has barely increased 3 years in the last 15 years, because there have been less than 10 well-kicks in total on installations built after 2000. In 7 out of the last 11 years, there have been no well-kicks on post-2000 installations at all. It can be seen that the installations built in the late 1980’s and late 1990’s are continuing to experience well-kicks at similar rates throughout the period. The wide spread of installation years of the recorded well-kicks is reflected in the very low R2-value (0.01), emphasizing the random nature of the observed data.

Investigation into Development of Safety Levels on Norwegian Installations in the North Sea Post-1990
Annelise Baillie 26
The low number of well-kicks on installations built after 2000 can be attributed to strongly decreasing use of production installations for production drilling in general and increasing use of mobile rigs instead. Graph 4.5 shows the number of well-kicks per year on production installations compared to drilling rigs.
0
5
10
15
20
25
1 9
96
1 9
97
1 9
98
1 9
99
2 0
00
2 0
01
2 0
02
2 0
03
2 0
04
2 0
05
2 0
06
2 0
07
2 0
08
2 0
09
2 0
10
No
. Of
Wel
lkic
ks
per
Ye
ar
Year
No. Of Wellkicks per Year - Production Installations and Mobile Rigs
Tota l Wellkicks
Production Installations
Tota l Wellkicks Rigs
3 Peri od Movi ng Average
Prod. Inst.
3 Peri od Movi ng Average
Ri gs
Graph 4.5 Number of Well-kicks per Year 1996-2010, by Installation
Type The number of well-kicks on production installations has been significantly reduced over the last decade, from over 20 in 2002-2003 to 5 in 2007, though there has been no further reduction since. During that time, there has been a corresponding increase in well-kicks on mobile rigs. On rigs, the number of well-kicks per year was in 2010 up at the same levels as on production installation in the early 2000’s, and the 3-period moving average was showing a clear upward trend.

Investigation into Development of Safety Levels on Norwegian Installations in the North Sea Post-1990
Annelise Baillie 27
Graph 4.6 shows the percentage of well-kicks on mobile rigs per year during exploration drilling and production drilling.
0 %
10 %
20 %
30 %
40 %
50 %
60 %
70 %
80 %
90 %
100 %
19961997199819992000200120022003200420052006200720082009% o
f W
ell
kick
s o
ccu
rrin
g d
uri
ng
Ex
plo
rati
on
Dri
llin
g a
nd
Pro
du
ctio
n D
rill
ing
Year
% of Wellkicks on Mobile Rigs During Exploration Drilling and
Production Drilling
Wellkicks during
Production
Dril ling (P)
Wellkicks during
Exploration
Dril ling (L)
Graph 4.6 % of Well-kicks per Year 1996-2009, Occurring during
Production Drilling (red) and Exploration Drilling (blue) By comparing Graph 4.5 with Graph 4.6, it becomes clear that the reductions from 1999 to 2001, and again from 2003 to 2007 in the number of well-kicks on production platforms corresponds to increasing percentage of well kicks during production drilling on mobile rigs. The curves mirror each other well. In the years 2002 and 2009, the numbers of well kicks on production platforms were high, while the percentages of well kicks during production drilling on rigs were comparatively low. This shows that the increasing use of mobile rigs for production drilling is transferring the risk away from production installations, but the overall risk is not decreasing.
Investigation into Development of Safety Levels on Norwegian Installations in the North Sea Post-1990
Annelise Baillie 28
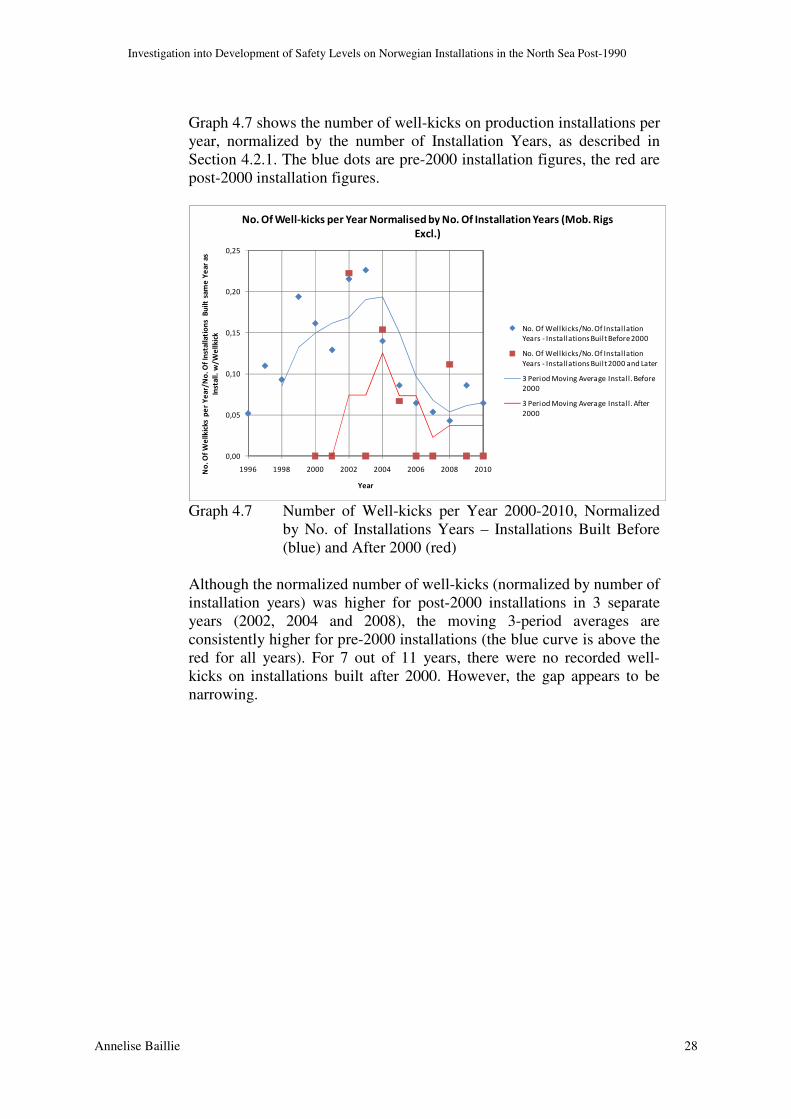
Graph 4.7 shows the number of well-kicks on production installations per year, normalized by the number of Installation Years, as described in Section 4.2.1. The blue dots are pre-2000 installation figures, the red are post-2000 installation figures.
0,00
0,05
0,10
0,15
0,20
0,25
1996 1998 2000 2002 2004 2006 2008 2010No
. O
f W
ell
kic
ks
pe
r Y
ea
r/N
o.
Of
Inst
all
ati
on
s B
uil
t sa
me
Ye
ar
as
Inst
all
. w
/W
ell
kic
k
Year
No. Of Well-kicks per Year Normalised by No. Of Installation Years (Mob. Rigs
Excl.)
No. Of Wellkicks/No. Of Installation
Years - Installations Built Before 2000
No. Of Wellkicks/No. Of Installation
Years - Installations Built 2000 and Later
3 Period Moving Average Instal l. Before
2000
3 Period Moving Average Instal l. After
2000
Graph 4.7 Number of Well-kicks per Year 2000-2010, Normalized
by No. of Installations Years – Installations Built Before (blue) and After 2000 (red)
Although the normalized number of well-kicks (normalized by number of installation years) was higher for post-2000 installations in 3 separate years (2002, 2004 and 2008), the moving 3-period averages are consistently higher for pre-2000 installations (the blue curve is above the red for all years). For 7 out of 11 years, there were no recorded well-kicks on installations built after 2000. However, the gap appears to be narrowing.

Investigation into Development of Safety Levels on Norwegian Installations in the North Sea Post-1990
Annelise Baillie 29
4.2.3. Fire/Explosions – DFU 4
DFU 4 events are minor fires and explosions from other causes than hydrocarbon leaks. Graph 4.8 is a representation of all the recorded fires and explosions on production installations (mobile rigs are excluded) on the NCS from the start of the RNNP records in 1996 up to 2009. Each point represents one fire, hence there have normally been about 3-4 fires per year. Otherwise, the graph is similar to Graph 4.1.
y = 0,1074x + 1776,7
R² = 0,0028
1970
1975
1980
1985
1990
1995
2000
2005
2010
19
94
19
96
19
98
20
00
20
02
20
04
20
06
20
08
20
10
Inst
all
ati
on
Ye
ar
Year
Scatter Plot of Fires/Explosions by Year and Installation Year
Instal lation Year
Lineær (Instal lation Year)
Graph 4.8 Minor Fires/Explosions per Year 1996-2009, by
Installation Year of Installation with Fire/Explosion It can be noted that no fires or explosions have been recorded at all on installations built after 2000. Most of these events took place on installations built in the 1990’s. Although the data material for this DFU is fairly small (about 50 in total, over 15 years), Graph 4.8 shows a clear step change after 2000. What is also notable is the small number of fires on installations built in the 1970’s. It is possible these experienced more fires in their early life, before formal records began. Over time, fire protection may have been retrofitted to these installations, so that their current barriers against fire are better. The wide spread of installation years of the recorded fires is reflected in the very low R2-value (0.003), emphasizing the random nature of the observed data.
Investigation into Development of Safety Levels on Norwegian Installations in the North Sea Post-1990
Annelise Baillie 30
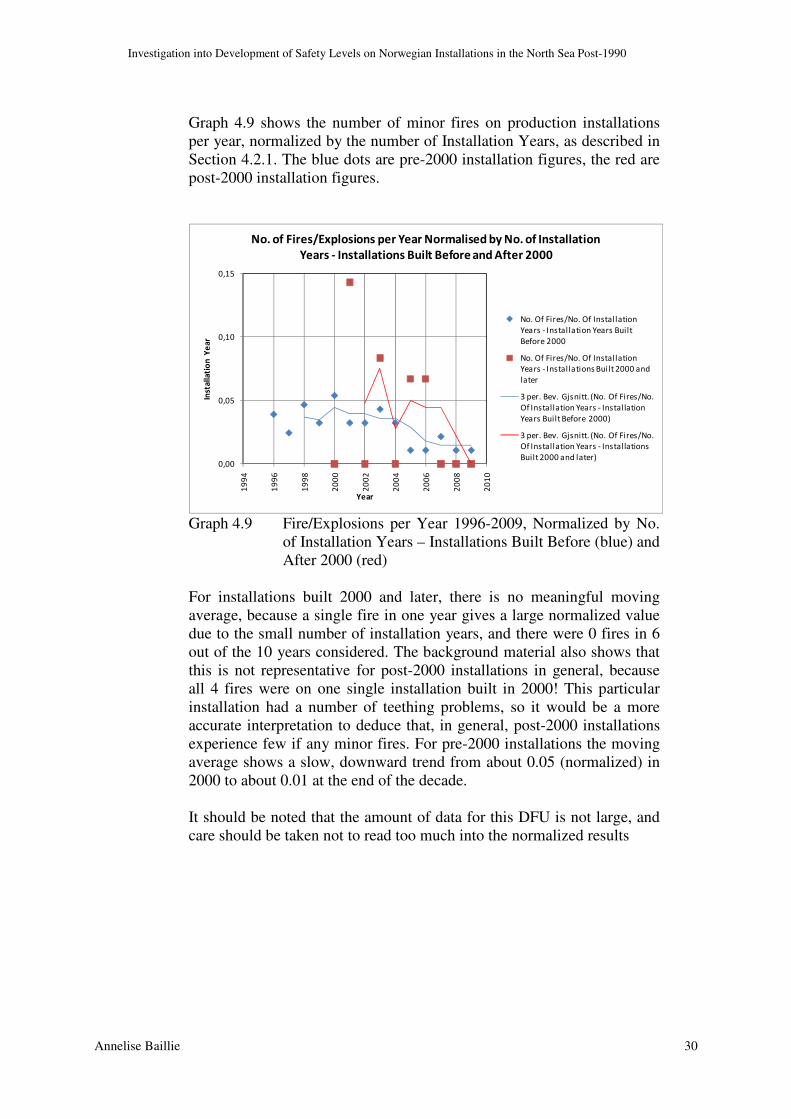
Graph 4.9 shows the number of minor fires on production installations per year, normalized by the number of Installation Years, as described in Section 4.2.1. The blue dots are pre-2000 installation figures, the red are post-2000 installation figures.
0,00
0,05
0,10
0,15
19
94
19
96
19
98
20
00
20
02
20
04
20
06
20
08
20
10
Inst
all
ati
on
Ye
ar
Year
No. of Fires/Explosions per Year Normalised by No. of Installation
Years - Installations Built Before and After 2000
No. Of Fires/No. Of Installation
Years - Installation Years Built
Before 2000
No. Of Fires/No. Of Installation
Years - Installations Built 2000 and
later
3 per. Bev. Gjsnitt. (No. Of Fires/No.
Of Installation Years - Installation
Years Built Before 2000)
3 per. Bev. Gjsnitt. (No. Of Fires/No.
Of Installation Years - Installations
Built 2000 and later)
Graph 4.9 Fire/Explosions per Year 1996-2009, Normalized by No.
of Installation Years – Installations Built Before (blue) and After 2000 (red)
For installations built 2000 and later, there is no meaningful moving average, because a single fire in one year gives a large normalized value due to the small number of installation years, and there were 0 fires in 6 out of the 10 years considered. The background material also shows that this is not representative for post-2000 installations in general, because all 4 fires were on one single installation built in 2000! This particular installation had a number of teething problems, so it would be a more accurate interpretation to deduce that, in general, post-2000 installations experience few if any minor fires. For pre-2000 installations the moving average shows a slow, downward trend from about 0.05 (normalized) in 2000 to about 0.01 at the end of the decade. It should be noted that the amount of data for this DFU is not large, and care should be taken not to read too much into the normalized results

Investigation into Development of Safety Levels on Norwegian Installations in the North Sea Post-1990
Annelise Baillie 31
4.2.4. Vessels on Collision Course – DFU 5
DFU 5 is vessels on collision course. Graph 4.10 is a representation of all the recorded vessels on collision course with production installations (mobile rigs are excluded) on the NCS from the start of the RNNP records in 1996 up to 2009. Each point represents one event. Otherwise, the graph is similar to Graph 4.1. The background material for this DFU shows that unmanned installations are over-represented in this category, regardless of age.
y = -0,1341x + 2263
R² = 0,0023
1970
1975
1980
1985
1990
1995
2000
2005
2010
1996 1998 2000 2002 2004 2006 2008 2010
Inst
all
ati
on
Ye
ar
of
Inst
all
ati
on
su
bje
ct t
o S
hip
on
Co
llisi
on
Co
urs
e
Year
Ship on Collision Course Events, by Year and Installation Year of Installation
(Mobile Rigs Not Incl.)
Instal lation Year
Lineær (Installation Year)
Graph 4.10 Ships on Collision Course Events per Year 1996-2009, by
Installation Year of Installation subject to Ship on Collision Course
As expected, there is no appreciable difference in density of ships on collision course events between installations built before and after 2000. This is reasonable, as the installation management is not responsible for such events, and cannot do much to prevent them, other than alert ship navigators to their presence. However, there have been a steadily increasing number of such events (from 1 or 2 a year in the late 1990’s to about 10-12 in the late 2000’s), partly due to greatly increasing ship traffic, and also due to dramatically better reporting. In fact, until around 2002, it is known that DFU 5 events were greatly under-reported, as the following figure from RNNP indicates:

Investigation into Development of Safety Levels on Norwegian Installations in the North Sea Post-1990
Annelise Baillie 32
0
5
10
15
20
25
30
35
40
45
50
1996 1997 1998 1999 2000 2001 2002 2003 2004 2005 2006 2007 2008 2009 2010
No
. o
f P
ass
ing
Sh
ips
on
Co
llis
ion
Co
urs
e p
er
Ye
ar
Year
Recorded No. of Passing Ships on Collision Course 1996-2010
MODU
NUI
Complex
FPU
Fixed production
Graph 4.11 No. of Recorded Ships on Collision Course Events from
1996 to 2010 In contrast to the scatter plots for the other DFU’s, Graph 4.10 actually shows a negative slope, even though it is small. The reason for this is that even some of the oldest installations (particularly those from the late 1970’s and 1980’s) are experiencing more and more ships on collision course, despite the fact that their presence has been known for more than 20 years, 30 in some cases. The plot itself is more fan-shaped than truly random, meaning that the installations subject to DFU 5 are both getting younger (from about 1998) and older (from about 2002). Due to previous under-reporting, this pattern is believed to be coincidence. The variance in installation years is in fact increasing instead of staying constant. The wide spread of installation years of the recorded well-kicks is reflected in the very low R2-value (0.002), emphasizing the random nature of the observed data.

Investigation into Development of Safety Levels on Norwegian Installations in the North Sea Post-1990
Annelise Baillie 33
4.2.5. Drifting Object – DFU 6
DFU 6 is drifting objects. Graph 4.12 shows the DFU 6 events by Year of Event and Installation Year of the installation concerned, for the period since records began in 1996 until 2009. Note that only events on production installations have been included. Events on mobile rigs have been excluded, because these are usually moved around and re-used in different locations.
y = 1,5381x - 1089,3
R² = 0,3795
1970
1975
1980
1985
1990
1995
2000
2005
2010
1996 1997 1998 1999 2000 2001 2002 2003 2004 2005 2006 2007 2008 2009 2010
Inst
all
ati
on
Ye
ar
of
Inst
all
atio
n
tow
ard
s w
hic
h O
bje
ct D
rift
ed
Year
Scatter Plot of Drifting Object Events by Year and Installation Year of Installtion in Object's Path
Instal lation Year
Lineær (Instal lation Year)
Graph 4.12 Drifting Object Events per Year 1996-2009, by
Installation Year of Installation subject to Drifting Object
There is no real difference in density of drifting object events between installations built before and after 2000, though there have only been 2 such events on post-2000 installations, in 2004 and 2005. This is reasonable, as the installation management is not responsible for such events, and cannot do much to prevent them, other than alert ship navigators to their presence. There is no real evidence that the number of such events is increasing, but it is not decreasing either. From 2001 to 2003, there were no such events. Over the last 5 years, there have tended to be about one a year near production installations. Compared to the scatter plots for the other DFU’s, Graph 4.12 shows a surprising degree of fit to the trend-line. The R2-value of 0.38 is not a good fit from a statistical point of view, but it is very much higher than the values found for DFU’s 1&2, 3, 4 and 5. This could have the physical interpretation that an installation tends to be more vulnerable to drifting

Investigation into Development of Safety Levels on Norwegian Installations in the North Sea Post-1990
Annelise Baillie 34
objects early in its life, before its position is well-known. In the last 10 years, there have been no such events near installations built in the 1970’s or 80’s at all.
4.2.6. Collision with Field-Related Vessel – DFU 7
DFU 7 is collisions with field-related vessels. Graph 4.13 shows the DFU 7 events by Year of Event and Installation Year of the installation hit by vessel. It can be noted that records of this DFU go back to 1982, not just to 1996 like most of the other DFU’s. Note that only events on production installations have been included. Events on mobile rigs have been excluded.
y = 0,5125x + 961,49
R² = 0,1592
1970
1975
1980
1985
1990
1995
2000
2005
2010
1980 1985 1990 1995 2000 2005 2010
Inst
all
ati
on
Ye
ar
of
Inst
all
ati
on
h
it b
y F
ield
Ve
sse
l
Year
Scatter Plot of Field Vessel Collisions by Year and Installation Year - Mobile Rigs Excl.
Instal lation Year
Lineær (Installation Year)
Graph 4.13 Field-related Vessel Collision Events per Year 1982-2009,
by Installation Year of Installation subject to Drifting Object
There is a real difference in density of field vessel collision events between installations built before and after 2000. In total there have only been 3 such events on installations built after 2000; 2 in 2005 and 1 in 2007. The plot is more fan-shaped than truly random. As new installations were built in the 1980’s and ‘90’s, collisions took place with these, while the existing ones continued to experience collisions at similar rates well into the 2000’s. What is perhaps most concerning is that even some of the oldest installations (particularly those from the early 1970’s) are experiencing similar rates of field vessel collisions, despite the fact that
Investigation into Development of Safety Levels on Norwegian Installations in the North Sea Post-1990
Annelise Baillie 35
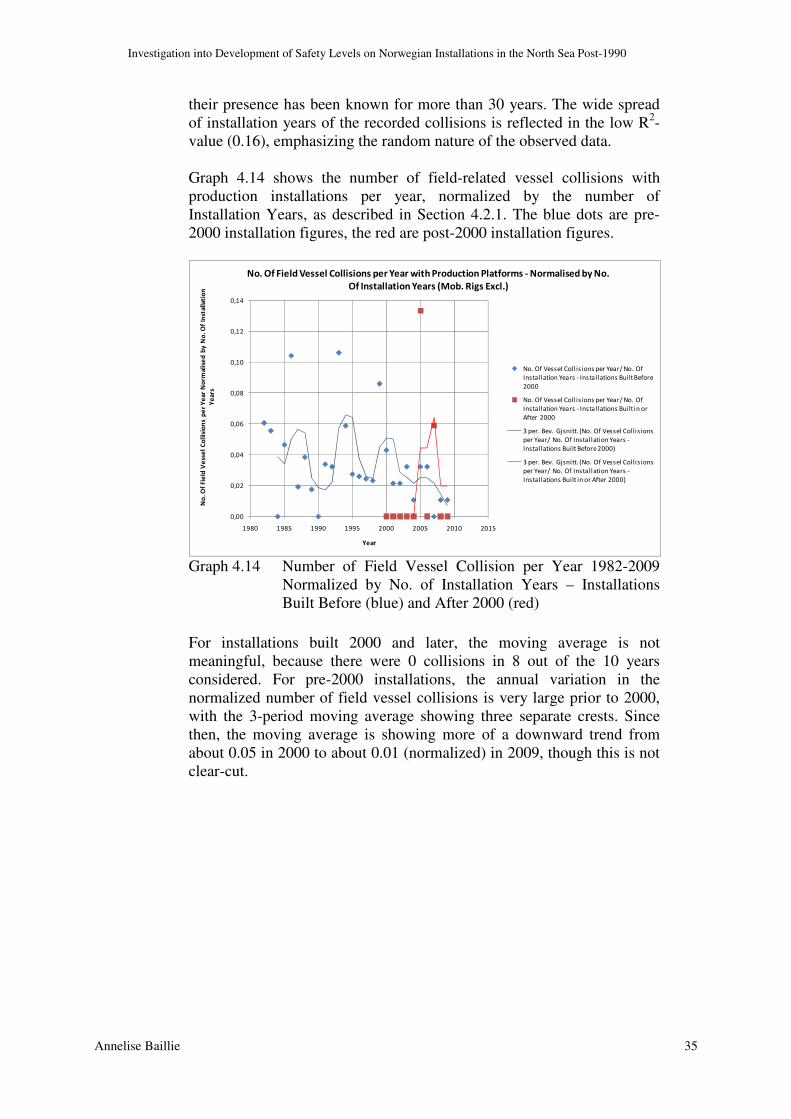
their presence has been known for more than 30 years. The wide spread of installation years of the recorded collisions is reflected in the low R2-value (0.16), emphasizing the random nature of the observed data. Graph 4.14 shows the number of field-related vessel collisions with production installations per year, normalized by the number of Installation Years, as described in Section 4.2.1. The blue dots are pre-2000 installation figures, the red are post-2000 installation figures.
0,00
0,02
0,04
0,06
0,08
0,10
0,12
0,14
1980 1985 1990 1995 2000 2005 2010 2015
No
. Of
Fie
ld V
ess
el
Co
llis
ion
s p
er
Ye
ar
No
rmal
ise
d b
y N
o.
Of
Inst
alla
tio
n
Ye
ars
Year
No. Of Field Vessel Collisions per Year with Production Platforms - Normalised by No.
Of Installation Years (Mob. Rigs Excl.)
No. Of Vessel Coll isions per Year/ No. Of
Installation Years - Installations Built Before
2000
No. Of Vessel Coll isions per Year/ No. Of
Installation Years - Installations Built in or
After 2000
3 per. Bev. Gjsnitt. (No. Of Vessel Collisions
per Year/ No. Of Installation Years -
Installations Built Before 2000)
3 per. Bev. Gjsnitt. (No. Of Vessel Collisions
per Year/ No. Of Installation Years -
Installations Built in or After 2000)
Graph 4.14 Number of Field Vessel Collision per Year 1982-2009
Normalized by No. of Installation Years – Installations Built Before (blue) and After 2000 (red)
For installations built 2000 and later, the moving average is not meaningful, because there were 0 collisions in 8 out of the 10 years considered. For pre-2000 installations, the annual variation in the normalized number of field vessel collisions is very large prior to 2000, with the 3-period moving average showing three separate crests. Since then, the moving average is showing more of a downward trend from about 0.05 in 2000 to about 0.01 (normalized) in 2009, though this is not clear-cut.

Investigation into Development of Safety Levels on Norwegian Installations in the North Sea Post-1990
Annelise Baillie 36
4.2.7. Structural Damage to Platform/Stability – DFU 8
DFU 8 events include structural damage and stability problems. Graph 4.15 shows the DFU 8 events by Year of Event and Installation Year of the installation concerned. It can be noted that records of this DFU goes back to 1990. Note that only events on production installations have been included. Events on mobile rigs have been excluded.
y = 1,1286x - 269,75
R² = 0,4153
1970
1975
1980
1985
1990
1995
2000
2005
2010
1990 1991 1992 1993 1994 1995 1996 1997 1998 1999 2000 2001 2002 2003 2004 2005 2006 2007 2008 2009 2010 2011
Inst
all
ati
on
Ye
ar
of
Inst
all
ati
on
w
/S
tru
ctu
ral
Da
ma
ge
Year
Scatter Plot of Structural Damage/Stability Problems by Year and Installation Year
Instal lation Year
Lineær (Instal lation Year)
Graph 4.15 Structural Damage/Stability Problems Events per Year
1990-2009, by Installation Year of Installation subject to Event
There is a large difference in density of structural damage/stability problem events between installations built before and after 2000. In fact there has only been one such event on a post-2000 installation, and this took place in 2003. There is no real evidence that the number of such events is increasing, but it is not decreasing either. Over the last ten years, there have tended to be 1 or 2 a year on production installations. Compared to the scatter plots for the other DFU’s, Graph 4.15 shows a surprising degree of fit to the trend-line. The R2-value of 0.41 is not a good fit from a statistical point of view, but it is very much higher than the values found for DFU’s 1&2, 3, 4 and 5. This indicates a smaller spread of data and hence lower variance of installation years. Most of the installations that have suffered a DFU 8 event have been more than 6 years old at the time but less than 18, with an average of 12. This indicates fatigue issues as a contributing factor. In the last 10 years, there

Investigation into Development of Safety Levels on Norwegian Installations in the North Sea Post-1990
Annelise Baillie 37
has only been 1 event on an installation built in the 1970’s, and the majority has been on ones built in the 1990’s. Graph 4.16 shows the number of structural damage/stability events on production installations per year, normalized by the number of Installation Years, as described in Section 4.2.1. The blue dots are pre-2000 installation figures.
0
0,02
0,04
0,06
0,08
0,1
0,12
0,14
0,16
1990 1995 2000 2005 2010
No
. O
f S
tru
ctu
ral
Da
ma
ge
Ev
en
ts p
er
Ye
ar
No
rma
lise
d b
y N
o.
Of
Inst
all
ati
on
Ye
ars
Year
No. Of Struct. Damage Events per Year / Installation Years
No. Of Struct. Damage
Events per Year /
Installation Years
3 per. Mov. Avg. (No. Of
Struct. Damage Events
per Year / Installation
Years)
Graph 4.16 Structural Damage/Stability Problems Events per Year
1990-2009 for Installations built before 2000, Normalized by No. of by Installation Years
As there has only been 1 single structural damage event to an installation built after 2000 (in 2003), this has been omitted from the graph, as it would not be meaningful. For the ones built before 2000, the 3-period moving average showed a clear downward trend from about 0.12 (normalized) in 1990 until around 1995, when it was about 0.02. Since then, it has remained almost flat, even tending towards going up slightly since 2000. However, due to the low number of data, care should be taken not to read too much into this graph.

Investigation into Development of Safety Levels on Norwegian Installations in the North Sea Post-1990
Annelise Baillie 38
4.2.8. Leaks from/Damage to Risers and Pipelines – DFU 9&10
DFU 9 events are leaks from subsea production systems such as pipelines and risers, while DFU 10 is damage to such systems. Graph 4.17 shows the DFU 9&10 events by Year of Event and Installation Year of the installation concerned. Note that only events on production installations have been included. Events on mobile rigs have been excluded.
R² = 0,0336
1970
1975
1980
1985
1990
1995
2000
2005
2010
1994 1996 1998 2000 2002 2004 2006 2008 2010
Inst
all
ati
on
Ye
ar
of
Inst
all
ati
on
w
ith
Ris
er/
Pip
eli
ne
ev
en
t
Year
Scatter Plot of Riser/Pipeline Leaks/Damage Events by Year and Installation Year
Installation Year
Lineær (Installation Year)
Graph 4.17 Leaks from and Damage to Subsea Systems per Year
1996-2009, by Installation Year of Installation subject to Event
Graph 4.17 shows no appreciable difference between installations built before and after 2000. However, most of these events have been on installations built in the 1990’s. The data material is too small to identify any clear patterns, so no plot has been included of normalized data for this DFU. The number of events also varies considerably from year to year, from about 2 up to 6.

Investigation into Development of Safety Levels on Norwegian Installations in the North Sea Post-1990
Annelise Baillie 39
5. SAFETY SYSTEM TESTS – LEADING INDICATORS
5.1. Introduction
Leading Indicators comprise failure rates for barrier data on a range of barriers, including fire detection, gas detection, riser ESDV tests, leak tests, closure tests, BOP tests, Christmas tree, deluge valve and fire pump start tests. Vinnem et al (2010) explained that the RNNP has collected barrier data for major hazards since 2002, but the “data collection was not fully representative in 2002”. For this investigation, the failure rate statistics for fire detection, gas detection, ESDV riser, Christmas tree and deluge tests have been chosen as the highest priority tests. As the graphs in the following sections (5.2 – 5.6) show, the average failure rates for the year 2002 do not deviate greatly from the subsequent years, and have therefore been included. Vinnem et al (2010) only included data up to and including 2008, while the following sections also include data for 2009 and 2010, so the averages deviate slightly from the results in that paper, but not significantly.
5.2. Fire Detection
Fire detection systems have been tested since 2002, but not on all installations. Over the last decade, this test has been carried out on more and more installations, so that, by 2009, most of the installations on the NCS were being tested annually.

Investigation into Development of Safety Levels on Norwegian Installations in the North Sea Post-1990
Annelise Baillie 40
Graph 5.1a shows the fire detection failure rates as a function of installation year, for all the tests carried out from 2002 to 2010.
R² = 0,0037
R² = 0,0085y = 0,0049
y = 0,00390,0000
0,0100
0,0200
0,0300
0,0400
0,0500
0,0600
0,0700
0,0800
1970 1975 1980 1985 1990 1995 2000 2005 2010
Fire
De
tect
ion
Fai
lure
Ra
tes
Year
Fire Detection Failure Rates as a Function of Installation Year -
All Installations (Tests 2002-2010)
Fai lure Rate Fire Det - Instal lations Built Before
2000
Fai lure Rate Fire Det - Instal lations Built in or
After 2000
Average Fai lure Rate - Installations Built Before
2000
Average Fai lure Rate - Installations Built in or
After 2000
Lineær (Fai lure Rate Fire Det - Installations
Built Before 2000)
Lineær (Fai lure Rate Fire Det - Installations
Built in or After 2000)
Lineær (Average Failure Rate - Instal lations
Built Before 2000)
Lineær (Average Failure Rate - Instal lations
Built in or After 2000)
Graph 5.1a Fire Detection Failure Rates for Tests 2002-2010, by Installation
Year of Installation subject to Testing On Graph 5.1a, the blue dots show failure rates for pre-2000 installations, and the green dots show the failure rates for post-2000 installations. The red horizontal line shows the Average Failure Rate for pre-2000 installations, and the black horizontal line shows the Average Failure Rate for post-2000 installations. The sloping blue line is the trend-line for pre-2000 installations, and this has a very low R2-value of 0.003. The green sloping line, which is rising sharply, is the linear trend-line for the post-2000 installations. It has an R2-value of 0.009, and is quite strongly affected by the high failure rates of two particular installations, one built in 2001 and one in 2008, as the figure indicates. The averages are 0.05 for pre-2000 installations, versus 0.038 for post-2000 installations, a difference of 20%. For this graph, and also for graphs 5.3, 5.5, 5.7 and 5.9 the R2-values are very low due to both the large variations within each installation year, and over the whole period.

Investigation into Development of Safety Levels on Norwegian Installations in the North Sea Post-1990
Annelise Baillie 41
Graph 5.1b is the same as 5.1a, but with the outlier >0.06 removed.
R² = 0,0037
R² = 0,0535y = 0,0049
y = 0,00310,0000
0,0100
0,0200
0,0300
0,0400
0,0500
0,0600
1970 1975 1980 1985 1990 1995 2000 2005 2010
Fir
e D
ete
ctio
n F
ail
ure
Ra
tes
Year
Fire Detection Failure Rates as a Function of Installation Year -
All Installations (Tests 2002-2010)
Failure Rate Fire Det - Installations Built Before
2000
Failure Rate Fire Det - Installations Built in or
After 2000
Average Failure Rate - Installations Built Before
2000
Average Failure Rate - Installations Built in or
After 2000
Lineær (Failure Rate Fire Det - Instal lations
Bui lt Before 2000)
Lineær (Failure Rate Fire Det - Instal lations
Bui lt in or After 2000)
Lineær (Average Failure Rate - Instal lations
Bui lt Before 2000)
Lineær (Average Failure Rate - Instal lations
Bui lt in or After 2000)
Graph 5.1b Fire Detection Failure Rates for Tests 2002-2010, by Installation
Year of Installation subject to Testing – Outlier >0.06 removed Graph 5.1b has 1 outlier removed (from an installation built in 2001), with a failure rate in excess of 0.06. This changes the picture considerably for the post-2000 installations, reducing the average failure rate for these from 0.0038 to 0.0031, an 18% reduction.

Investigation into Development of Safety Levels on Norwegian Installations in the North Sea Post-1990
Annelise Baillie 42
Graph 5.2a shows the average annual fire detection failure rates for installations built before and after 2000, for all the tests carried out from 2002 to 2010.
0,0000
0,0020
0,0040
0,0060
0,0080
0,0100
0,0120
2002 2003 2004 2005 2006 2007 2008 2009 2010
Av
era
ge
An
nu
al F
ailu
re R
ate
s Fi
re D
ete
ctio
n T
est
s
Year
Annual Average Fire Detection Tests Failure Rate for Installations Built
Before and After 2000
Average Fai lure Rate per Installation per
Year - Instal lations Built Before 2000
Average Fai lure Rate per Installation per
Year - Instal lations Built in or After 2000
3 Period Moving Average Instal lations
Bui lt Before 2000
3 Period Moving Average Instal lations
Bui lt in or After 2000
Graph 5.2a Average Annual Fire Detection Failure Rates for Tests 2002-
2010, for Installations Built Before 2000 (blue) and After (red) On Graph 5.2a, the blue columns show the average annual failure rates for pre-2000 installations, and the red columns show the post-2000 installations. The red line shows the 3- Period Moving Average for pre-2000 installations, and the blue line shows the same for the post-2000 installations. For all years, except 2007 and 2008, the average annual failure rate is greater for installations built before 2000, than for the ones built later. 2008 is very dominated by the failure rate on one single post-2000 installation, and cannot be considered representative for the group as a whole. However, the moving averages cross around 2007, which indicate that the gap between the two groups may be narrowing.
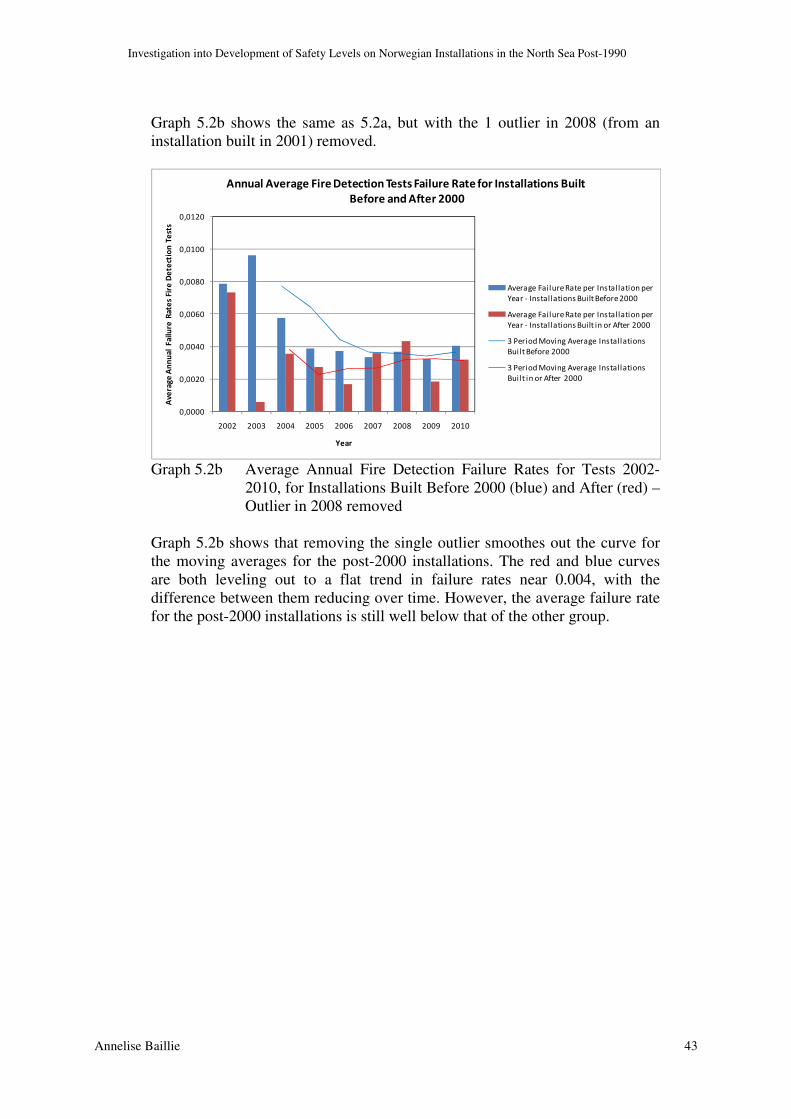
Investigation into Development of Safety Levels on Norwegian Installations in the North Sea Post-1990
Annelise Baillie 43
Graph 5.2b shows the same as 5.2a, but with the 1 outlier in 2008 (from an installation built in 2001) removed.
0,0000
0,0020
0,0040
0,0060
0,0080
0,0100
0,0120
2002 2003 2004 2005 2006 2007 2008 2009 2010
Ave
rag
e A
nn
ua
l F
ail
ure
Ra
tes
Fire
De
tect
ion
Te
sts
Year
Annual Average Fire Detection Tests Failure Rate for Installations Built
Before and After 2000
Average Failure Rate per Instal lation per
Year - Instal lations Built Before 2000
Average Failure Rate per Instal lation per
Year - Instal lations Built in or After 2000
3 Period Moving Average Installations
Built Before 2000
3 Period Moving Average Installations
Built in or After 2000
Graph 5.2b Average Annual Fire Detection Failure Rates for Tests 2002-
2010, for Installations Built Before 2000 (blue) and After (red) – Outlier in 2008 removed
Graph 5.2b shows that removing the single outlier smoothes out the curve for the moving averages for the post-2000 installations. The red and blue curves are both leveling out to a flat trend in failure rates near 0.004, with the difference between them reducing over time. However, the average failure rate for the post-2000 installations is still well below that of the other group.

Investigation into Development of Safety Levels on Norwegian Installations in the North Sea Post-1990
Annelise Baillie 44
5.3. Gas Detection
Gas detection systems have been tested since 2002, but not on all installations. Over the last decade, this test has been carried out on more and more installations, so that, by 2010, most of the installations on the NCS were being tested annually. Graph 5.3a shows the gas detection failure rates as a function of installation year, for all the tests carried out from 2002 to 2010.
R² = 0,0094
R² = 0,0069y = 0,0097
y = 0,01020,0000
0,0500
0,1000
0,1500
0,2000
0,2500
1970 1975 1980 1985 1990 1995 2000 2005 2010
Ga
s D
ete
ctio
n F
ailu
re R
ate
s
Year
Gas Detection Failure Rates as a Function of Installation Year -
All Installations (Tests 2002-2010)
Failure Rate Gas
Detection - Instal lations
Built Before 2000Failure Rate Gas
Detection - Instal lations
Built in or After 2000Average Fai lure Rate -
Installations Built Before
2000Average Fai lure Rate -
Installations Built in or
After 2000Lineær (Fai lure Rate Gas
Detection - Instal lations
Built Before 2000)Lineær (Fai lure Rate Gas
Detection - Instal lations
Built in or After 2000)Lineær (Average Failure
Rate - Installations Built
Before 2000)
Graph 5.3a Gas Detection Failure Rates for Tests 2002-2010, by Installation
Year of Installation subject to Testing On Graph 5.3a, the blue dots show failure rates for pre-2000 installations, and the green dots show the failure rates for post-2000 installations. The red horizontal line shows the Average Failure Rate for pre-2000 installations, and the black horizontal line shows the Average Failure Rate for post-2000 installations. The sloping blue line is the trend-line for pre-2000 installations, and this has a very low R2-value of 0.009. The green sloping line, which is rising sharply, is the linear trend-line for the post-2000 installations. It has an R2-value of 0.007, and is quite strongly affected by the high failure rates of a few installations, built in 2001 and 2008, as the figure indicates. The average is approximately 0.01 for both pre- and post-2000 installations, with no discernible difference.
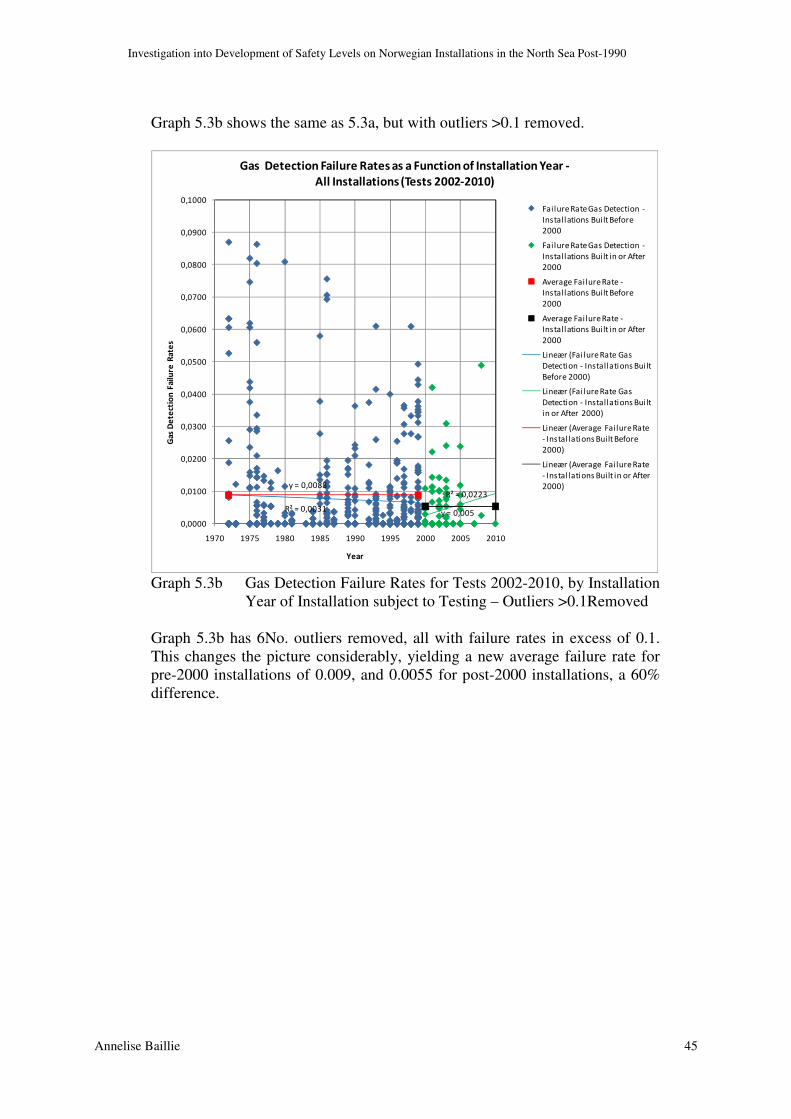
Investigation into Development of Safety Levels on Norwegian Installations in the North Sea Post-1990
Annelise Baillie 45
Graph 5.3b shows the same as 5.3a, but with outliers >0.1 removed.
R² = 0,0031
R² = 0,0223y = 0,0088
y = 0,005
0,0000
0,0100
0,0200
0,0300
0,0400
0,0500
0,0600
0,0700
0,0800
0,0900
0,1000
1970 1975 1980 1985 1990 1995 2000 2005 2010
Gas
De
tect
ion
Fa
ilure
Ra
tes
Year
Gas Detection Failure Rates as a Function of Installation Year -
All Installations (Tests 2002-2010)
Failure Rate Gas Detection -
Installations Built Before
2000
Failure Rate Gas Detection -
Installations Built in or After
2000
Average Failure Rate -
Installations Built Before
2000
Average Failure Rate -
Installations Built in or After
2000
Lineær (Failure Rate Gas
Detection - Installations Built
Before 2000)
Lineær (Failure Rate Gas
Detection - Installations Built
in or After 2000)
Lineær (Average Failure Rate
- Installations Built Before
2000)
Lineær (Average Failure Rate
- Installations Built in or After
2000)
Graph 5.3b Gas Detection Failure Rates for Tests 2002-2010, by Installation
Year of Installation subject to Testing – Outliers >0.1Removed Graph 5.3b has 6No. outliers removed, all with failure rates in excess of 0.1. This changes the picture considerably, yielding a new average failure rate for pre-2000 installations of 0.009, and 0.0055 for post-2000 installations, a 60% difference.

Investigation into Development of Safety Levels on Norwegian Installations in the North Sea Post-1990
Annelise Baillie 46
Graph 5.4a shows the average annual gas detection failure rates for installations built before and after 2000, for all the tests carried out from 2002 to 2010.
0,0000
0,0050
0,0100
0,0150
0,0200
0,0250
0,0300
2002 2003 2004 2005 2006 2007 2008 2009 2010
Av
era
ge
An
nu
al
Fa
ilu
re R
ate
s G
as
De
tect
ion
Te
sts
Year
Average Annual Gas Detection Tests Failure Rate for Installations Built
Before and After 2000
Average Failure Rate per Installation
per Year - Installations Built Before
2000
Average Failure Rate per Installation
per Year - Installations Built in or After
2000
3 Period Moving Average Installations
Bui lt Before 2000
3 Period Moving Average Installations
Bui lt in or After 2000
Graph 5.4a Average Annual Gas Detection Failure Rates for Tests 2002-
2010, for Installations Built Before 2000 (blue) and After (red) On Graph 5.4, the blue columns show the average annual failure rates for pre-2000 installations, and the red columns show the post-2000 installations. The blue line shows the 3- Period Moving Average for pre-2000 installations, and the red line shows the same for the post-2000 installations. The average annual failure rate is greater for installations built before 2000 for the first half of the decade. The moving averages cross around 2006, marking a turning point. In 2007 and 2008, average failure rates were higher for post-2000 installations (in fact so high that they pull up the post-2000 installation average disproportionately), but they have since fallen sharply, so that the gap between the moving averages is narrowing again.

Investigation into Development of Safety Levels on Norwegian Installations in the North Sea Post-1990
Annelise Baillie 47
Graph 5.4b shows the same as Graph 5.4a, but with outliers with failure rates >0.1 removed.
0,0000
0,0050
0,0100
0,0150
0,0200
2002 2003 2004 2005 2006 2007 2008 2009 2010
Av
era
ge
An
nu
al
Fa
ilu
re R
ate
s G
as
De
tect
ion
Te
sts
Year
Average Annual Gas Detection Tests Failure Rate for Installations Built
Before and After 2000
Average Fai lure Rate per Instal lation
per Year - Instal lations Built Before
2000
Average Fai lure Rate per Instal lation
per Year - Instal lations Built in or After
2000
3 Period Moving Average Instal lations
Bui lt Before 2000
3 Period Moving Average Instal lations
Bui lt in or After 2000
Graph 5.4b Average Annual Gas Detection Failure Rates for Tests 2002-
2010, for Installations Built Before 2000 (blue) and After (red) – Outliers >0.1 Removed
Graph 5.4b is the same as Graph 5.4a, but with the 6 outliers removed, 3 from post-2000 installations, and 3 from pre-2000 installations. The 3 data from post-2000 installations are from one built in 2001 and one in 2008. All 3 data from pre-2000 installations are from ones built in 1976. This changes the picture considerably, revealing the underlying trends that show a much clearer difference between pre- and post-2000 installations. Both moving averages are showing a definite downward trend, but the blue curve (installations built before 2000) is above the red for all years, with a difference of minimum 0.02.
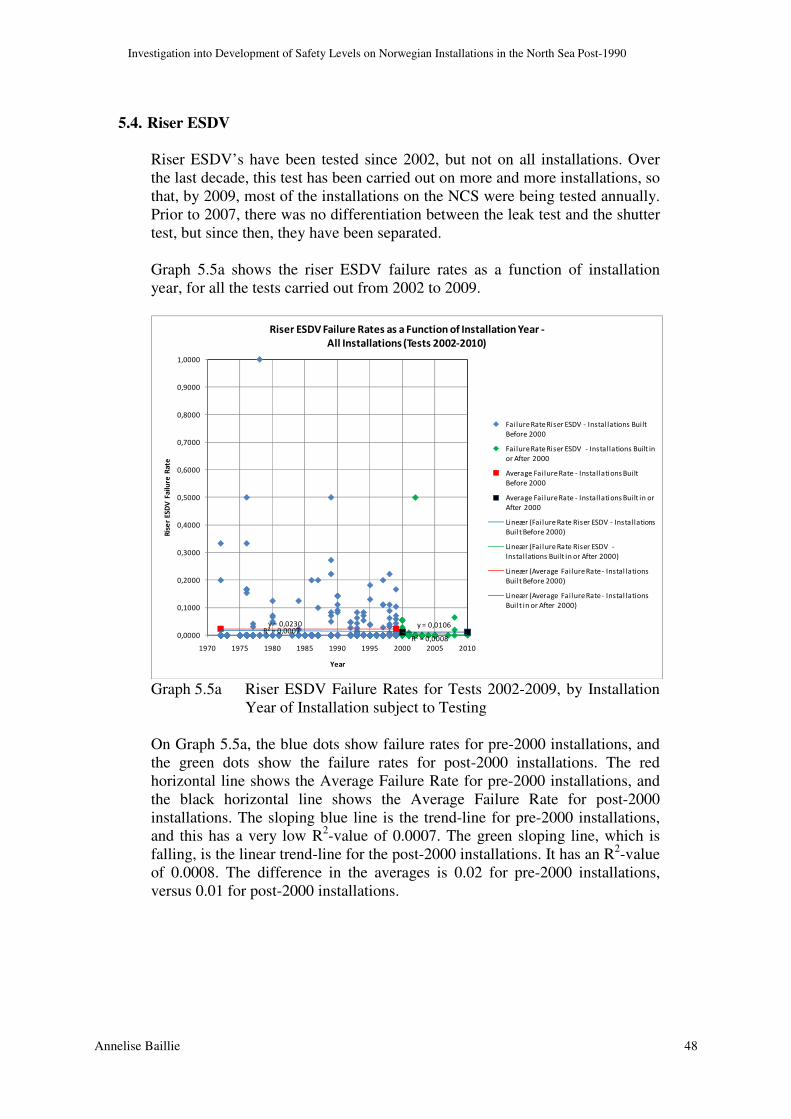
Investigation into Development of Safety Levels on Norwegian Installations in the North Sea Post-1990
Annelise Baillie 48
5.4. Riser ESDV
Riser ESDV’s have been tested since 2002, but not on all installations. Over the last decade, this test has been carried out on more and more installations, so that, by 2009, most of the installations on the NCS were being tested annually. Prior to 2007, there was no differentiation between the leak test and the shutter test, but since then, they have been separated. Graph 5.5a shows the riser ESDV failure rates as a function of installation year, for all the tests carried out from 2002 to 2009.
R² = 0,0007R² = 0,0008
y = 0,0230 y = 0,0106
0,0000
0,1000
0,2000
0,3000
0,4000
0,5000
0,6000
0,7000
0,8000
0,9000
1,0000
1970 1975 1980 1985 1990 1995 2000 2005 2010
Ris
er
ES
DV
Fa
ilu
re R
ate
Year
Riser ESDV Failure Rates as a Function of Installation Year -
All Installations (Tests 2002-2010)
Failure Rate Riser ESDV - Instal lations Built
Before 2000
Failure Rate Riser ESDV - Installations Built in
or After 2000
Average Failure Rate - Installations Built
Before 2000
Average Failure Rate - Installations Built in or
After 2000
Lineær (Failure Rate Riser ESDV - Installations
Bui lt Before 2000)
Lineær (Failure Rate Riser ESDV -
Installations Bui lt in or After 2000)
Lineær (Average Failure Rate - Instal lations
Bui lt Before 2000)
Lineær (Average Failure Rate - Instal lations
Bui lt in or After 2000)
Graph 5.5a Riser ESDV Failure Rates for Tests 2002-2009, by Installation
Year of Installation subject to Testing On Graph 5.5a, the blue dots show failure rates for pre-2000 installations, and the green dots show the failure rates for post-2000 installations. The red horizontal line shows the Average Failure Rate for pre-2000 installations, and the black horizontal line shows the Average Failure Rate for post-2000 installations. The sloping blue line is the trend-line for pre-2000 installations, and this has a very low R2-value of 0.0007. The green sloping line, which is falling, is the linear trend-line for the post-2000 installations. It has an R2-value of 0.0008. The difference in the averages is 0.02 for pre-2000 installations, versus 0.01 for post-2000 installations.

Investigation into Development of Safety Levels on Norwegian Installations in the North Sea Post-1990
Annelise Baillie 49
Graph 5.5b shows the same as 5.5a, but without 4No. outliers removed, the one with failure rate 1.0 (test on an installation built in 1978), and the 3 with failure rate 0.5 (tests on one installation built in 1976, one in 1989 and one in 2002).
R² = 0,0006
R² = 0,001
y = 0,0041
y = 0,0178
0,0000
0,0500
0,1000
0,1500
0,2000
0,2500
0,3000
0,3500
1970 1975 1980 1985 1990 1995 2000 2005 2010
Ris
er
ESD
V F
ail
ure
Rat
e
Year
Riser ESDV Failure Rates as a Function of Installation Year -
All Installations (Tests 2002-2010)
Failure Rate Riser ESDV - Installations Built
Before 2000
Failure Rate Riser ESDV - Installations Built in
or After 2000
Average Failure Rate - Installations Built in or
After 2000
Average Failure Rate - Installations Built
Before 2000
Lineær (Failure Rate Riser ESDV - Installations
Built Before 2000)
Lineær (Failure Rate Riser ESDV -
Installations Built in or After 2000)
Lineær (Average Failure Rate - Installations
Built in or After 2000)
Lineær (Average Failure Rate - Installations
Built Before 2000)
Graph 5.5b Riser ESDV Failure Rates for Tests 2002-2009, by Installation
Year of Installation subject to Testing – Outliers >0.4 removed Graph 5.5b has 4No. outliers removed, all with failure rates in excess of 0.4. This changes the picture considerably, yielding a new average failure rate for pre-2000 installations of 0.018, and 0.004 for post-2000 installations, a 350% difference!

Investigation into Development of Safety Levels on Norwegian Installations in the North Sea Post-1990
Annelise Baillie 50
Graph 5.6a shows the average annual riser ESDV failure rates for installations built before and after 2000, for all the tests carried out from 2002 to 2009.
0,0000
0,0100
0,0200
0,0300
0,0400
0,0500
0,0600
2002 2003 2004 2005 2006 2007 2008 2009 2010
Av
era
ge
An
nu
al
Fa
ilu
re R
ate
s E
SD
V R
ise
r T
est
s
Year
Average Annual ESDV Riser Tests Failure Rate for Installations Built Before
and After 2000
Average Annual Fai lure Rate ESDV
Riser - Installations Bui lt Before 2000
Average Annual Fai lure Rate ESDV
Riser - Installations Bui lt in or After
2000
3 per. Bev. Gjsnitt. (Average Annual
Failure Rate ESDV Riser - Instal lations
Built Before 2000)
3 per. Bev. Gjsnitt. (Average Annual
Failure Rate ESDV Riser - Instal lations
Built in or After 2000)
Graph 5.6a Average Annual Riser ESDV Failure Rates for Tests 2002-2009,
for Installations Built Before 2000 (blue) and After (red) On Graph 5.6a, the blue columns show the average annual failure rates for pre-2000 installations, and the red columns show the post-2000 installations. The blue line shows the 3- Period Moving Average for pre-2000 installations, and the red line shows the same for the post-2000 installations. 2007 is strongly dominated by a single installation where there was 1 failure in 2 tests, resulting in a failure rate of 0.5 on this installation for the year. It therefore cannot be considered representative for the group. If it is excluded, it is clear that average annual failure rates on post-2000 installations are generally less than half of those on pre-2000 installations.

Investigation into Development of Safety Levels on Norwegian Installations in the North Sea Post-1990
Annelise Baillie 51
Graph 5.6b shows the same as 5.6a, but with the 4No. outliers removed with failure rates >0.4.
0,0000
0,0100
0,0200
0,0300
0,0400
0,0500
2002 2003 2004 2005 2006 2007 2008 2009 2010Av
era
ge
An
nu
al
Fa
ilu
re R
ate
s E
SD
V R
ise
r T
est
s
Year
Average Annual ESDV Riser Tests Failure Rate for Installations Built Before
and After 2000
Average Annual Failure Rate ESDV
Riser - Installations Built Before 2000
Average Annual Failure Rate ESDV
Riser - Installations Built in or After
2000
3 per. Bev. Gjsnitt. (Average Annual
Fai lure Rate ESDV Riser - Installations
Built Before 2000)
3 per. Bev. Gjsnitt. (Average Annual
Fai lure Rate ESDV Riser - Installations
Built in or After 2000)
Graph 5.6b Average Annual Riser ESDV Failure Rates for Tests 2002-2009,
for Installations Built Before 2000 (blue) and After (red) – Outliers >0.4 removed
Graph 5.6b is the same as Graph 5.6a, but with the 4 outliers removed, 3 from pre-2000 installations, and 1 from pre-2000 installations. The 3 data from pre-2000 installations are from ones built in 1976, 1978 and 1989; and the one from post-2000 installations is from an installation built in 2002. This changes the picture considerably, revealing the underlying trends that show a much clearer difference between pre- and post-2000 installations. Both moving averages showed a definite downward trend towards 2008, but are now on the way up again. The blue curve (installations built before 2000) is above the red for all years, with a difference of minimum 0.01.

Investigation into Development of Safety Levels on Norwegian Installations in the North Sea Post-1990
Annelise Baillie 52
5.5. Christmas Tree
Christmas Trees have been tested since 2002, but not on all installations. Over the last decade, this test has been carried out on more and more installations, so that, by 2009, most of the installations on the NCS were being tested annually. Graph 5.7a shows the Christmas Tree failure rates as a function of installation year, for all the tests carried out from 2002 to 2010.
R² = 0,0022 R² = 0,0029
y = 0,0116 y = 0,009
0
0,05
0,1
0,15
0,2
0,25
1970 1975 1980 1985 1990 1995 2000 2005 2010
Ch
rist
ma
s T
ree
Fa
ilu
re R
ate
s
Installation Year
Christmas Tree Failure Rates as a Function of Installation Year -
All Installations (Tests 2002-2010)
Fai lure Rate Christmas Tree - Installations Built
Before 2000
Fai lure Rate Christmas Tree - Installations Built in
or After 2000
Average Failure Rate - Installations Bui lt Before
2000
Average Failure Rate - Installations Bui lt in or
After 2000
Lineær (Fai lure Rate Christmas Tree -
Instal lations Built Before 2000)
Lineær (Fai lure Rate Christmas Tree -
Instal lations Built in or After 2000)
Lineær (Average Failure Rate - Installations Built
Before 2000)
Lineær (Average Failure Rate - Installations Built
in or After 2000)
Graph 5.7a Christmas Tree Test Failure Rates for Tests 2002-2010, by
Installation Year of Installation subject to Testing On Graph 5.7, the blue dots show failure rates for pre-2000 installations, and the green dots show the failure rates for post-2000 installations. The red horizontal line shows the Average Failure Rate for pre-2000 installations, and the black horizontal line shows the Average Failure Rate for post-2000 installations. The downwards sloping blue line is the trend-line for pre-2000 installations, and this has a very low R2-value of 0.002. The downwards sloping green line is the linear trend-line for the post-2000 installations. It has an R2-value of 0.003. The difference in the averages is 0.012 for pre-2000 installations, versus 0.009 for post-2000 installations. This 25% difference is not statistically significant, when the large standard deviations for both groups is taken into account-

Investigation into Development of Safety Levels on Norwegian Installations in the North Sea Post-1990
Annelise Baillie 53
Graph 5.7b shows the same as 5.7a, but with outliers with failure rates >0.15 removed.
R² = 0,0079 R² = 0,0029
y = 0,0103 y = 0,009
0
0,02
0,04
0,06
0,08
0,1
0,12
0,14
1970 1975 1980 1985 1990 1995 2000 2005 2010
Ch
rist
ma
s T
ree
Fa
ilu
re R
ate
s
Installation Year
Christmas Tree Failure Rates as a Function of Installation Year -
All Installations (Tests 2002-2010)
Failure Rate Christmas Tree - Instal lations Built
Before 2000
Failure Rate Christmas Tree - Instal lations Built in
or After 2000
Average Fai lure Rate - Instal lations Built Before
2000
Average Fai lure Rate - Instal lations Built in or
After 2000
Lineær (Failure Rate Christmas Tree -
Installations Built Before 2000)
Lineær (Failure Rate Christmas Tree -
Installations Built in or After 2000)
Lineær (Average Failure Rate - Installations Built
Before 2000)
Lineær (Average Failure Rate - Installations Built
in or After 2000)
Graph 5.7b Christmas Tree Test Failure Rates for Tests 2002-2010, by
Installation Year of Installation subject to Testing - Outliers >0.15 Removed
Graph 5.7b has 2No. outliers removed, both with failure rates in excess of 0.15, and both from installations built in 1993 (pre-2000). This changes the picture marginally, yielding a new average failure rate for pre-2000 installations of 0.010, while it remains unchanged for post-2000 installations at 0.009, reducing the 25% difference to only 10%.

Investigation into Development of Safety Levels on Norwegian Installations in the North Sea Post-1990
Annelise Baillie 54
Graph 5.8a shows the average annual Christmas Tree test failure rates for installations built before and after 2000, for all the tests carried out from 2002 to 2010.
0,0000
0,0050
0,0100
0,0150
0,0200
0,0250
2002 2003 2004 2005 2006 2007 2008 2009 2010
Av
era
ge
An
nu
al
Fa
ilu
re R
ate
s C
hri
stm
as
Tre
e T
est
Year
Annual Average Christmas Tree Failure Rate for Installations Built
Before and After 2000
Average Fai lure Rate per Instal lation
per Year - Installations Built Before
2000
Average Fai lure Rate per Instal lation
per Year - Installations Built in or After
2000
3 per. Bev. Gjsnitt. (Average Failure
Rate per Installation per Year -
Instal lations Built Before 2000)
3 per. Bev. Gjsnitt. (Average Failure
Rate per Installation per Year -
Instal lations Built in or After 2000)
Graph 5.8a Average Annual Christmas Tree Failure Rates for Tests 2002-
2010, for Installations Built Before 2000 (blue) and After (red) On Graph 5.8a, the blue columns show the average annual failure rates for pre-2000 installations, and the red columns show the post-2000 installations. The blue line shows the 3- Period Moving Average for pre-2000 installations, and the red line shows the same for the post-2000 installations. In the first half of the decade, annual average failure rates were higher on pre-2000 installations, but in the second half, the situation was reversed. The moving averages cross around 2008, which indicate that the gap between the two groups may be narrowing, and that failure rates on pre-2000 installations is falling, but the situation may be worsening in the other group.
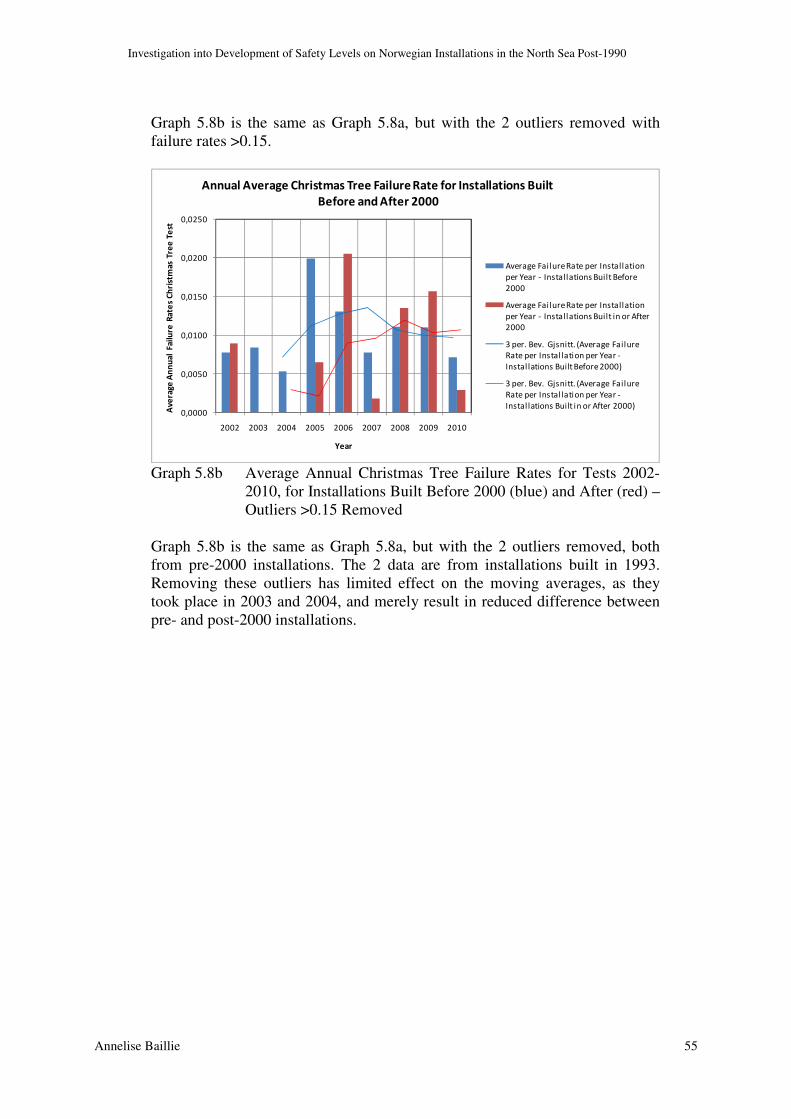
Investigation into Development of Safety Levels on Norwegian Installations in the North Sea Post-1990
Annelise Baillie 55
Graph 5.8b is the same as Graph 5.8a, but with the 2 outliers removed with failure rates >0.15.
0,0000
0,0050
0,0100
0,0150
0,0200
0,0250
2002 2003 2004 2005 2006 2007 2008 2009 2010
Av
era
ge
An
nu
al
Fa
ilu
re R
ate
s C
hri
stm
as
Tre
e T
est
Year
Annual Average Christmas Tree Failure Rate for Installations Built
Before and After 2000
Average Fai lure Rate per Installation
per Year - Installations Built Before
2000
Average Fai lure Rate per Installation
per Year - Installations Built in or After
2000
3 per. Bev. Gjsnitt. (Average Failure
Rate per Instal lation per Year -
Instal lations Built Before 2000)
3 per. Bev. Gjsnitt. (Average Failure
Rate per Instal lation per Year -
Instal lations Built in or After 2000)
Graph 5.8b Average Annual Christmas Tree Failure Rates for Tests 2002-
2010, for Installations Built Before 2000 (blue) and After (red) – Outliers >0.15 Removed
Graph 5.8b is the same as Graph 5.8a, but with the 2 outliers removed, both from pre-2000 installations. The 2 data are from installations built in 1993. Removing these outliers has limited effect on the moving averages, as they took place in 2003 and 2004, and merely result in reduced difference between pre- and post-2000 installations.

Investigation into Development of Safety Levels on Norwegian Installations in the North Sea Post-1990
Annelise Baillie 56
5.6. Deluge
Deluge systems have been tested since 2002, but not on all installations. Graph 5.9a shows the deluge test failure rates as a function of installation year, for all the tests carried out from 2002 to 2010.
R² = 0,0009
y = 0,0121
R² = 0,0122
y = 0,0056
0,0000
0,1000
0,2000
0,3000
0,4000
0,5000
0,6000
0,7000
0,8000
0,9000
1,0000
1970 1975 1980 1985 1990 1995 2000 2005 2010
De
lug
e F
ailu
re R
ate
s
Year
Deluge Failure Rates as a Function of Installation Year -
All Installations (Tests 2002-2010)
Failure Rate Deluge -
Installations Built Before 2000
Average Failure Rate -
Installations Built Before 2000
Failure Rate Deluge -
Installations Built in or After
2000
Average Failure Rate -
Installations Built in or After
2000
Linear (Failure Rate Deluge -
Installations Built Before 2000)
Linear (Average Failure Rate -
Installations Built Before 2000)
Linear (Failure Rate Deluge -
Installations Built in or After
2000)
Linear (Average Failure Rate -
Installations Built in or After
2000)
Graph 5.9a Deluge Test Failure Rates for Tests 2002-2010, by Installation
Year of Installation subject to Testing On Graph 5.9a, the blue dots show failure rates for pre-2000 installations, and the green dots show the failure rates for post-2000 installations. The red horizontal line shows the Average Failure Rate for pre-2000 installations, and the black horizontal line shows the Average Failure Rate for post-2000 installations. The upwards sloping blue line is the trend-line for pre-2000 installations, and this has a very low R2-value of 0.001. The green sloping line, which is falling, is the linear trend-line for the post-2000 installations. It has an R2-value of 0.01. The average failure rate for pre-2000 installations is 0.012, double the average (0.006) for post-2000 installations.

Investigation into Development of Safety Levels on Norwegian Installations in the North Sea Post-1990
Annelise Baillie 57
Graph 5.9b shows the same as Graph 5.9a, but with the 5No. outliers with failure rates >0.2 removed.
R² = 9E-05
y = 0,0101
R² = 0,0111
y = 0,0022
0,0000
0,0200
0,0400
0,0600
0,0800
0,1000
0,1200
0,1400
0,1600
0,1800
0,2000
1970 1975 1980 1985 1990 1995 2000 2005 2010
De
lug
e F
ail
ure
Ra
tes
Year
Deluge Failure Rates as a Function of Installation Year -
All Installations (Tests 2002-2010)
Failure Rate Deluge -
Installations Built Before 2000
Average Failure Rate -
Installations Built Before 2000
Failure Rate Deluge -
Installations Built in or After
2000
Average Failure Rate -
Installations Built in or After
2000
Linear (Failure Rate Deluge -
Installations Built Before 2000)
Linear (Average Failure Rate -
Installations Built Before 2000)
Linear (Failure Rate Deluge -
Installations Built in or After
2000)
Linear (Average Failure Rate -
Installations Built in or After
2000)
Graph 5.9b Deluge Test Failure Rates for Tests 2002-2010, by Installation
Year of Installation subject to Testing - Outliers >0.2 Removed Graph 5.9b has 5No. outliers removed, all with failure rates in excess of 0.2. These include 1 from a post-2000 installation (built in 2001), and 4 from pre-2000 installations (2 built in 1986, one in 1996 and 1 in 1999). This changes the picture considerably, yielding a new average failure rate for pre-2000 installations of 0.010, and 0.0022 for post-2000 installations, increasing the difference between them from a factor of 2 to a factor of nearly 5!

Investigation into Development of Safety Levels on Norwegian Installations in the North Sea Post-1990
Annelise Baillie 58
Graph 5.10a shows the average annual deluge test failure rates for installations built before and after 2000, for all the tests carried out from 2002 to 2010.
0,0000
0,0050
0,0100
0,0150
0,0200
0,0250
0,0300
2002 2003 2004 2005 2006 2007 2008 2009 2010
Av
era
ge
An
nu
al
Fa
ilu
re R
ate
s D
elu
ge
Te
sts
Year
Annual Average Deluge Failure Rate for Installations Built
Before and After 2000
Average Failure Rate per Installation per
Year - Installations Built Before 2000
Average Failure Rate per Installation per
Year - Installations Built in or After 2000
3 per. Mov. Avg. (Average Failure Rate per
Installation per Year - Installations Built
Before 2000)
3 per. Mov. Avg. (Average Failure Rate per
Installation per Year - Installations Built in
or After 2000)
Graph 5.10a Average Annual Deluge Test Failure Rates for Tests 2002-2010,
for Installations Built Before 2000 (blue) and After (red) On Graph 5.10a, the blue columns show the average annual failure rates for pre-2000 installations, and the red columns show the post-2000 installations. The blue line shows the 3- Period Moving Average for pre-2000 installations, and the red line shows the same for the post-2000 installations. For 6 out of the 9 years considered, the failure rate was zero (0) for the post-2000 installations because all the tests had zero failures, resulting in an average failure rate of 0.006, while it averaged 0.012 for pre-2000 installations. Apart from 2002 and 2008, pre-2000 installations show consistently higher average deluge failure rates than the ones built later. The moving averages show the same, though the gap appears to be narrowing in the second half of the decade.

Investigation into Development of Safety Levels on Norwegian Installations in the North Sea Post-1990
Annelise Baillie 59
Graph 5.10b shows the same as 5.10a, but with the 5 outliers with failure rates >0.2 removed.
0,0000
0,0050
0,0100
0,0150
0,0200
0,0250
2002 2003 2004 2005 2006 2007 2008 2009 2010
Av
era
ge
An
nu
al
Fa
ilure
Ra
tes
De
lug
e T
est
s
Year
Annual Average Deluge Failure Rate for Installations Built
Before and After 2000
Average Failure Rate per Installation per
Year - Installations Built Before 2000
Average Failure Rate per Installation per
Year - Installations Built in or After 2000
3 per. Mov. Avg. (Average Failure Rate per
Installation per Year - Installations Built
Before 2000)
3 per. Mov. Avg. (Average Failure Rate per
Installation per Year - Installations Built in
or After 2000)
Graph 5.10b Average Annual Deluge Test Failure Rates for Tests 2002-2010,
for Installations Built Before 2000 (blue) and After (red) - Outliers >0.2 Removed
Graph 5.10b is the same as Graph 5.10a, but with the 5 outliers removed. Removing these outliers has a huge effect on the moving averages. The underlying trends are shown to be clearly downward for both pre- and post-2000 installations, while also demonstrating a minimum difference between the failure rates of the 2 groups, at all times, of at least 0.005.
Investigation into Development of Safety Levels on Norwegian Installations in the North Sea Post-1990
Annelise Baillie 60
6. RISK ANALYSES FOR SELECTED PLATFORMS AND COMPARISON
WITH AVAILABLE DATA
6.1. General
In general, for all installations, the major accident categories are: - Fire/Explosion - Blowout - Collision - Falling Loads - Extreme Natural Loads - Loss of Stability The criterion, given in the NPD regulatory guidelines (1980), is that the total probability for all events in each of the above categories that can lead to:
• Escalation of fire/explosion
• Loss of safety critical functions
• Loss of escape routes
• Loss of safe refuge
• Loss of means of evacuation must not exceed 1*10-4 per year. The FAR value is based on the installation’s PLL, which is the sum of Immediate Fatalities, Fatalities during Escape, and Fatalities during Evacuation. Industry practice (including Statoil guidelines) is to allow a maximum average FAR value of 10 for all personnel on an installation.
6.2. Platform A
Platform A is an FPSO north of the 62nd Parallel whose Detailed Design is underway but not complete. It comprises 8 integrated subsea templates with 22 wellheads, cables and associated risers tied back to the FPSO. The field includes two main reservoirs, with oil and an overlying gas cap. The reservoir pressure is low. The FPSO, located in water depths up to 390m, is expected to produce crude oil and rich gas. The oil layer is located 1000m below sea level. The FPSO will have its own stand-by vessel, and will be supplied with electricity from shore. The quantitative risk analysis (QRA) for this installation dates from 2010, and was issued for FEED (Front-End Engineering Design) verification. Risk to Personnel, risk of Impairment of Safety Functions and risk to Environment was considered, but not risk of Material Loss. The assumptions used in this risk analysis are summarised in Appendix A. Maximum number of personnel has been assumed to be 40, including 29 in Living Quarters (LQ) and 5 in Process. This QRA considers both Design Phase and Operational Phase. In contrast to some other risk analyses (such as platforms E and G), this QRA includes the

Investigation into Development of Safety Levels on Norwegian Installations in the North Sea Post-1990
Annelise Baillie 61
transportation time in the exposed hours, so that helicopter transport risk is included in the FAR. It is therefore not directly comparable. A full formal ALARP process has not been carried out, but identified recommendations for ALARP and further work have been listed, due to exceedance of risk criteria for some of the safety functions. The proposed measures were to:
• Reconsider the tank explosion frequency with a view to reducing conservatism in calculation, to reduce theoretical risk of tank explosions
• Investigate the pressure build-up at blast barriers and model in more detail to reduce conservatism in risk calculation
• Provide a primary escape way from central shaft to elevation 49+000
• Provide a protected entrance from riser area to the stair up to process area
• Carry out gas dispersion and explosion analyses using FLACS for main deck to reduce conservatism in estimates of explosion risk
• Relocate K.O. drum or provide protection structure over it, due to medium risk of impact to flare system from ship collision. Risk does not exceed criteria, but is in ALARP region.
It is not clear if these measures have been carried out. No sensitivity analyses appear to have been carried out on the assumptions made.
For personnel risk, a resultant FAR value of average 4.12 is calculated, which compares favourably with the criterion of maximum 10. This breaks down as 1.4 for Administration and Catering staff, 5.6 for Maintenance staff, and 3.3 for Process staff. There have (obviously) been no fatal accidents on this installation as it has not yet been built. The analysis concludes that the greatest risk is process leaks in the Process area, with a FAR of over 16. Total FAR for Process area, for all types of accidents is just over 20. Average FAR for whole installation is calculated as 6.1, but it is unclear why this is higher than the 4.12 for Personnel Risk. The calculated frequency of fires leading to impairment of escape routes, and frequency of explosions leading to impairment of any main safety function exceed the 1.0*10-4 criterion (2.9, and 2.6, respectively, both *10-4). As the installation has not been built, there have been no leaks from it. The appendix to the report, listing calculated leak rates, is missing from the available risk analysis. The FAR value for occupational accidents has been calculated as 1.7. Attachments are included in the appendices to the report, describing the modelling and calculations in detail, but most of the attachments were unavailable.

Investigation into Development of Safety Levels on Norwegian Installations in the North Sea Post-1990
Annelise Baillie 62
6.3. Platform B
Platform B is a Condeep concrete platform with three concrete legs. Production from this installation started at the end of the 1970’s, and it is now in the later phase of its life. The installation stands in 145m water depth, and includes Living Quarters and 40 platform wells. It has a lifeboat capacity of 150%, 2 hours fire protection of main structure, and fire walls between modules rated at 2 hours. The total risk analysis (TRA) for this installation dates from 2005, long after production start, and was intended to not only document the current as-built risk situation (rather than initial concept), but also show the risk picture for the installation phase for new process equipment for gas lift (2006-09) and the later phase of the installation’s life. Therefore, the risk analysis is divided into 3 parts, with results for these 3 phases presented separately. Risk to Personnel, Loss of Safety Functions, Economic Loss and Environment was considered. The assumptions used in this risk analysis are summarised in Appendix B. As stated in Appendix B, manning level on the platform has been assumed to be 204 in the current (2004-05) phase, 225 in 2006-07, 175 in 2008-09, and only 47 in the late phase (2010 and beyond). This TRA includes the transportation time in the exposed hours, so that helicopter transport risk is included in the FAR. It is therefore not directly comparable with risk analyses that do not include this. A formal ALARP process does not appear to have been carried out, but a number of risk reducing measures were proposed in the risk analysis, due to exceedance of risk criterion for several safety functions. The recommendations were to:
• Introduce measures to prevent loss of integrity of derrick in case of an explosion in area interface M6/CD6
• Install line detectors to improve gas detection
• Introduce routines for internal inspection of riser condition to prevent fractures and leaks
• Introduce measures to facilitate automatic cut-off of ignition sources from drilling deck in well control situations
• Establish better and more accurate lifting drawings to show maximum weight/height of lifts in the various areas
• Investigate H2S content in ballast water
• Review the H2S risk at leakage points
• Install passive fire protection on new process equipment, and on existing equipment with which it will come into contact
• Reduce number of personnel in process areas to a minimum
• Reduce the amount of hot works in the process areas to a minimum
• Improve signage of escape routes
• Establish effective routines for maintenance in later phase
It is not clear if these measures have been carried out.

Investigation into Development of Safety Levels on Norwegian Installations in the North Sea Post-1990
Annelise Baillie 63
No sensitivity analyses appear to have been carried out.
For personnel risk, a resultant FAR value of average 6.1 is calculated, which compares favourably with the criterion of maximum 10. Differentiation has been made between different personnel groups, with a maximum 8.7 (which is close to the limit) for modification personnel and 8.1 for deck operators. FAR has also been calculated for all the different areas, the highest being 16 on Module Deck M4, and 14.7 both in cellar deck units CD1A and CD1B. There have been no fatal accidents on this installation since RNNP records began in 1996. There were 5 fatalities during a fire in 1978 and 1 fatality in an occupational accident in 1985. The analysis concludes that the greatest risk is process accidents (greatest contributor to FAR, with 49%), primarily from ignited hydrocarbon leakages from process equipment. The greatest contribution to this risk is from fires and explosions in modules M4 and CD6/M6. The calculated frequency of escalation of accident from process area to any other main area, escalation of accident from drilling/well area to any other main area, and escalation of fire in any area to any other main area, all exceed the 1.0*10-4 criterion (21.0, 13.0, and 9.0, respectively, all *10-4). The frequency of impairment of escape routes is also high, exceeding the criterion for both fire and explosion separately (1.05, and 1.47, respectively, both *10-4), hence also combined. There have been 16 reported leaks from this installation since the RNNP records began in 1996, which is probably only a fraction of the total since its start of production in the 1970’s, but 9 of these leaks were smaller than 0.1kg/s. There were 3 in 1996 (all <0.1kg/s), 4 in 1997(all <0.1kg/s), 2 in 1999, 1 in 2000 (<0.1kg/s), 1 in 2001, 3 in 2002, 1 in 2008 and 1 in 2009. Graph 6.1 shows the annual variation in leaks.
0
2
4
6
8
10
12
19
96
19
97
19
98
19
99
20
00
20
01
20
02
20
03
20
04
20
05
20
06
20
07
20
08
20
09
No
. O
f L
ea
ks
pe
r Y
ea
r
Year
No. Of Leaks per Year - Platform B
No. Of Leaks per Year
3 Periods Moving Average
Graph 6.1 Numbers of Leaks per Year 1996-2009, and 3-Year Moving
Average for Platform B

Investigation into Development of Safety Levels on Norwegian Installations in the North Sea Post-1990
Annelise Baillie 64
The QRA estimated leakage frequency for leaks in the process area > 0.1kg/s per year is 1.16 up to 2005, followed by 1.31 in 2006-09, followed by 1.22 thereafter. The average number of leaks greater than 0.1kg/s is about 0.7/year for the past 11 years. However, it would appear that, after a long positive period with no leaks, there has been a negative upward trend since 2008. For leaks in pipes and risers, no estimate is given for frequency, though a FAR-value is calculated as 0.41. The frequency for ignition of such leaks has been calculated as 1.16*10-4. There has been one such leak, from a loading hose, in 2007, but it was not ignited. FAR value from collisions is calculated as only 0.03, but does not differentiate between ship collisions, collisions with field-related vessels and collisions with drifting objects. In the period since 1996, there was 1 ship on collision course (2005), and the installation was hit by a supply vessel due to human error in 2000. None caused fatalities. The FAR value for occupational accidents has been calculated as 0.67 per 108
man-hours = 1 per 1.49*108 hours, while the approximate number of man-hours on this installation would be about 200*33*365*24 = 0.58*108 hours. In fact, there has been 1 fatal occupational accident on this installation, when a person was hit by a component which came loose from a motor in 1985, but none since, which would give an actual FAR of 2.6. . There were attachments included in the appendices to the original report, describing the modelling and calculations in detail, but these are missing from the electronic version.
6.4. Platform C
Platform C is a Condeep concrete platform with 4 legs and 24 concrete cells. Production from this installation started in the mid-1980’s and it is now in the later phase of its life. The installation stands in 140m water depth, and includes Drilling, Production and Living Quarters. The height of the installation is 290m. The topside comprises a cellar deck with open frame modules on top. It has 2 hours fire protection of main structure, and the fire wall between the cellar deck and main deck is also rated at 2 hours.
The total risk analysis (TRA) for this installation dates from 2005, long after production start, and was intended to not only document the current as-built risk situation (rather than initial concept), but also show the risk picture for the installation phase for new process equipment for gas lift (2006-09) and the later phase of the installation’s life. Therefore, the risk analysis is divided into 3 parts, with results for these 3 phases presented separately. Risk to Personnel, Loss of Safety Functions, Economic Loss and Environment was considered. The assumptions used in this risk analysis are summarised in Appendix C. As stated in Appendix C, manning level on the platform has been assumed to be 253 in the current (2004-05) phase, 275 in 2006-07, 250 in 2008-09, and only 77 in the late phase (2010 and beyond). This TRA includes the transportation time in the exposed hours, so that helicopter transport risk is included in the
Investigation into Development of Safety Levels on Norwegian Installations in the North Sea Post-1990
Annelise Baillie 65
FAR. It is therefore not directly comparable with risk analyses that do not contain this element. A formal ALARP process does not appear to have been carried out, but a large number of risk reducing measures were proposed in the risk analysis, due to exceedance of risk criterion for several safety functions. The recommendations were to: All Phases:
• Open up weather cladding in the well and manifold area in order to reduce frequency of strong explosions on cellar deck and modular deck
• Follow up measures to improve gas detection system
• Introduce deluge at gas detection to reduce frequency of strong explosions
• Introduce automatic pressure relief to reduce likelihood of explosion and escalation of fire
• Consider upgrading control room
• Install passive fire protection on critical equipment, such as thin-walled equipment
• Introduce routines for internal inspection of riser condition to prevent fractures and leaks
• Lift heavy units with crane on South side, to avoid dropping objects onto pipeline
• Establish better and more accurate lifting drawings to show maximum weight/height of lifts in the various areas
• Review lifting procedures with a view to reducing risk attached to lifts over pressurised equipment in M10 module
• Review capacity of load-bearing structure for the modular deck, in relation to strong explosions on the cellar deck
• Investigate H2S content in ballast water
• Review the H2S risk at leakage points
Installation Phase:
• Reduce number of personnel in process areas to a minimum
• Reduce the amount of hot works in the process areas to a minimum
• Improve signage of escape routes
Late Phase:
• Remove equipment no longer in use
• Establish effective routines for maintenance in later phase It is not clear if these measures have been carried out. Some sensitivity analyses appear to have been carried out, as the risk analysis states that opening weather cladding in the well and manifold area is calculated to reduce the frequency of strong explosions by 45% on the cellar deck, and by 59% on the modular deck. It also states that introducing deluge at gas detection can reduce frequency of strong explosions on the cellar deck by 30%.

Investigation into Development of Safety Levels on Norwegian Installations in the North Sea Post-1990
Annelise Baillie 66
For personnel risk, a resultant FAR value of average 8.5 is calculated, which compared favourably with the criterion of maximum 10. Differentiation has been applied for different personnel groups, and for the 3 different phases, with a maximum of 12.7 for deck operators (late phase) and 10.1 for deck operators (2004) (both of which exceed the limit). Maximum FAR for deck/crane operators is 7.9, while it is maximum 10.6 for modification operators (2004 only), 7.8 for drilling operators, and 5.4 for admin staff. FAR has been calculated for the different areas, but the list of this is in an appendix which is not included. Only a sketch of the decks is included, which shows that FAR is less than 25 for all areas, but exceeds 15 on a small but unnamed part of the modular deck, and modules C01-C08 of the cellar deck. There have been no fatal accidents on this installation since RNNP records began in 1996. There was 1 occupational fatality (fall from height) in 1983, but as this was during construction and before tow-out, it will not be counted. There was also an occupational accident in 1989 when 1 person fell into the sea and drowned (DFU13). The analysis concludes that the greatest risk is process accidents (greatest contributor to FAR, with 50%), primarily from ignited hydrocarbon leakages from process equipment. The calculated frequency of escalation of smoke/fire from process area to any other main area, escalation of smoke/fire from drilling/well area to any other main area, escalation of explosion in process area to any other main area, and escalation of explosion from drilling/well area to any other main area, all exceed the 1.0*10-4 criterion (22.0, 5.0, 10.0 and 6.0, respectively, all *10-4). The frequency of impairment of escape routes is also high, exceeding the criterion for both 2004 and installation phase (1.85, and 1.98, respectively, both *10-4). There have been 39 reported leaks from this installation since the RNNP records began in 1996, which is probably only a fraction of the total since its start of production in the 1980’s, but 21 of these leaks were smaller than 0.1kg/s. Graph 6.2 shows the variation in number of leaks per year since 1996, which includes all leaks. The background material shows that most of the leaks in the last 10 years have been larger than 0.1kg/s, which is negative. The average number of leaks has been 2.8 per year overall, but about 1.4 in the last 10 years. However, it would appear that, after a long positive period with no leaks, there has been a negative upward trend since 2009.
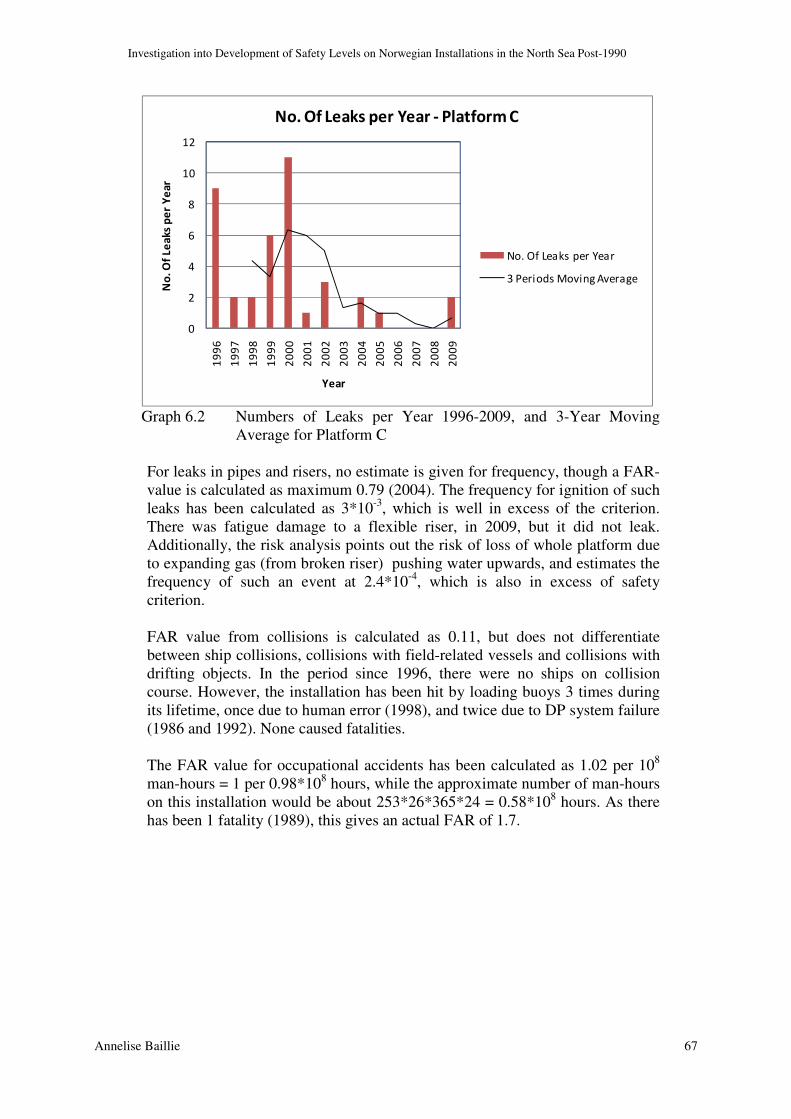
Investigation into Development of Safety Levels on Norwegian Installations in the North Sea Post-1990
Annelise Baillie 67
0
2
4
6
8
10
12
19
96
19
97
19
98
19
99
20
00
20
01
20
02
20
03
20
04
20
05
20
06
20
07
20
08
20
09
No
. O
f L
ea
ks
pe
r Y
ea
r
Year
No. Of Leaks per Year - Platform C
No. Of Leaks per Year
3 Periods Moving Average
Graph 6.2 Numbers of Leaks per Year 1996-2009, and 3-Year Moving
Average for Platform C For leaks in pipes and risers, no estimate is given for frequency, though a FAR-value is calculated as maximum 0.79 (2004). The frequency for ignition of such leaks has been calculated as 3*10-3, which is well in excess of the criterion. There was fatigue damage to a flexible riser, in 2009, but it did not leak. Additionally, the risk analysis points out the risk of loss of whole platform due to expanding gas (from broken riser) pushing water upwards, and estimates the frequency of such an event at 2.4*10-4, which is also in excess of safety criterion. FAR value from collisions is calculated as 0.11, but does not differentiate between ship collisions, collisions with field-related vessels and collisions with drifting objects. In the period since 1996, there were no ships on collision course. However, the installation has been hit by loading buoys 3 times during its lifetime, once due to human error (1998), and twice due to DP system failure (1986 and 1992). None caused fatalities. The FAR value for occupational accidents has been calculated as 1.02 per 108
man-hours = 1 per 0.98*108 hours, while the approximate number of man-hours on this installation would be about 253*26*365*24 = 0.58*108 hours. As there has been 1 fatality (1989), this gives an actual FAR of 1.7.

Investigation into Development of Safety Levels on Norwegian Installations in the North Sea Post-1990
Annelise Baillie 68
6.5. Platform D
Platform D is an unmanned wellhead platform in the North Sea, comprising a tripod steel substructure and topside. Production from this installation started in the early 2000’s. From a sandstone reservoir at 4200m depth, the installation produces oil, NGL and gas. Gas injection is used as a drive mechanism. The installation stands in 68m water depth, and it has 4 wells and 6 well slots. It is normally unmanned, but has overnight accommodation for 12 persons. The installation is remotely controlled from an adjacent field.
The available risk analysis for this installation dates from 2004, though the original Quantitative Risk Analysis (QRA), to which it refers, was first published in 2000. Strictly speaking, this is not a full risk analysis, but merely a memo that constitutes an update to the original QRA. The update concerns the risk implications of installing a Multi-Phase Pump (MPP) on the installation. No information is given regarding which software was used to model and calculate the risk, referring to the original report (unavailable). Only risk to Personnel appears to have been considered. The lists of assumptions used in this risk analysis are shown on very detailed data sheets attached to the report, and these assumptions are summarised in Appendix D. No sensitivity analyses on the assumptions have been carried out. Two separate phases have been considered, the so-called SIMOPS Phase and the Stand-alone Phase. In the SIMOPS Phase, there will be simultaneous drilling and production on the installation. The Stand-alone Phase represents a typical year of general maintenance and well intervention tasks. The SIMOPS Phase is divided into 2 sub-phases: the SIMOPS-Inst. MPP Phase and the SIMOPS-Ops. MPP Phase, lasting 6 and 3 months, respectively. The results for these 3 phases are presented separately. Description of personnel risk in this risk analysis is substantially different from the ones for platforms A, B, C, E, F and G, in that it focuses only on Individual Risk (AIR) instead of FAR values. Hence, no manning levels are given, though the data sheets state that there will be maximum 10 persons per shift. This memo gives separate AIR values for the two phases, and counts the exposed hours as the total time spent on the installation. Transportation time is included for the Stand-alone Phase, but only for the Maintenance Crew in the SIMOPS-Ops MPP phase. It is not clear why Helicopter transport has not been included for the Drilling/SIMOPS Crew in the SIMOPS-Ops MPP phase, which makes it more difficult to compare the figures. From the given IR values, FAR values have been calculated based on the given number of hours per crew per phase and are shown in Tables 6.1 and 6.2.
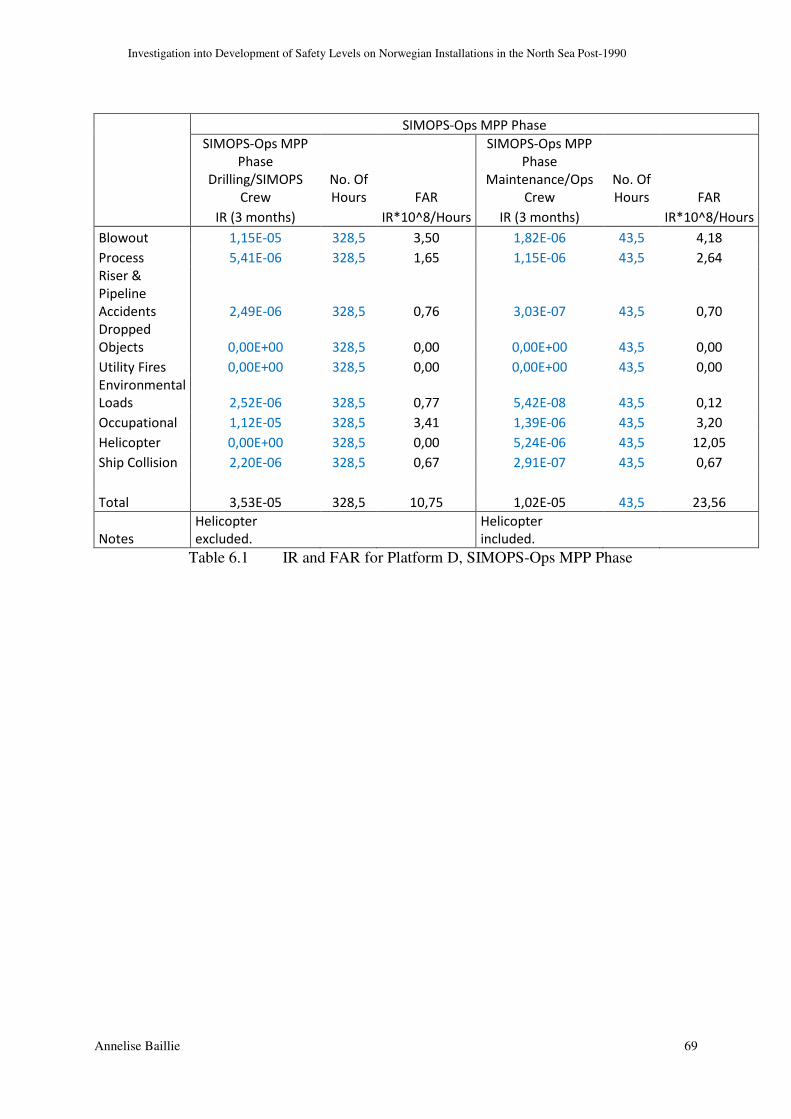
Investigation into Development of Safety Levels on Norwegian Installations in the North Sea Post-1990
Annelise Baillie 69
SIMOPS-Ops MPP Phase
SIMOPS-Ops MPP
Phase
Drilling/SIMOPS
Crew
No. Of
Hours FAR
SIMOPS-Ops MPP
Phase
Maintenance/Ops
Crew
No. Of
Hours FAR
IR (3 months) IR*10^8/Hours IR (3 months) IR*10^8/Hours
Blowout 1,15E-05 328,5 3,50 1,82E-06 43,5 4,18
Process 5,41E-06 328,5 1,65 1,15E-06 43,5 2,64
Riser &
Pipeline
Accidents 2,49E-06 328,5 0,76 3,03E-07 43,5 0,70
Dropped
Objects 0,00E+00 328,5 0,00 0,00E+00 43,5 0,00
Utility Fires 0,00E+00 328,5 0,00 0,00E+00 43,5 0,00
Environmental
Loads 2,52E-06 328,5 0,77 5,42E-08 43,5 0,12
Occupational 1,12E-05 328,5 3,41 1,39E-06 43,5 3,20
Helicopter 0,00E+00 328,5 0,00 5,24E-06 43,5 12,05
Ship Collision 2,20E-06 328,5 0,67 2,91E-07 43,5 0,67
Total 3,53E-05 328,5 10,75 1,02E-05 43,5 23,56
Notes
Helicopter
excluded.
Helicopter
included.
Table 6.1 IR and FAR for Platform D, SIMOPS-Ops MPP Phase

Investigation into Development of Safety Levels on Norwegian Installations in the North Sea Post-1990
Annelise Baillie 70
Stand-alone Phase
Stand-alone Phase
Maintenance/Ops
Crew
No. Of
Hours FAR
Stand-alone Phase
Well Intervention
Crew
No. Of
Hours FAR
IR (per year) IR*10^8/Hours IR (per year) IR*10^8/Hours
Blowout 2,29E-07 175 0,13 6,87E-05 306 22,45
Process 5,93E-06 175 3,39 7,38E-06 306 2,41
Riser &
Pipeline
Accidents 1,21E-06 175 0,69 1,95E-06 306 0,64
Dropped
Objects 0,00E+00 175 0,00 0,00E+00 306 0,00
Utility Fires 0,00E+00 175 0,00 0,00E+00 306 0,00
Environmental
Loads 2,18E-07 175 0,12 3,81E-07 306 0,12
Occupational 5,60E-06 175 3,20 1,04E-05 306 3,40
Helicopter 2,10E-05 175 12,00 3,63E-05 306 11,86
Ship Collision 1,17E-06 175 0,67 2,05E-06 306 0,67
Total 3,54E-05 175 20,20 1,27E-04 306 41,56
Notes Helicopter included. Helicopter included.
Table 6.2 IR and FAR for Platform D, Stand-alone Phase

Investigation into Development of Safety Levels on Norwegian Installations in the North Sea Post-1990
Annelise Baillie 71
Graph 6.3 shows the FAR Values for Platform D by crew, by type of accident, and by phase.
0,0
5,0
10,0
15,0
20,0
25,0
30,0
35,0
40,0
45,0
SIM
OP
S-O
ps
MP
P P
ha
se
Dri
llin
g/S
IMO
PS
Cre
w
SIM
OP
S-O
ps
MP
P P
ha
se
Ma
inte
na
nce
/Op
s C
rew
Sta
nd
-alo
ne
Ph
as
e
Ma
inte
na
nc
e/O
ps
Cre
w
Sta
nd
-alo
ne
Ph
as
e
We
ll
Inte
rve
nti
on
Cre
w
FA
R-v
alu
es
Phase and Crew
FAR-values for the 2 different Crews for the 2 Phases
Ship Coll ision
Helicopter
Occupational
Environmental Loads
Util ity Fires
Dropped Objects
Riser & Pipeline Accidents
Process
Blowout
Graph 6.3 FAR Values for Platforms D for both Phases for the different
crews for all Accident Types No resultant average FAR value is calculated, but it is obvious from Graph 6.3 that the average for the SIMOPS MPP Phase is in excess of 15 and about 30 for the Stand-alone Phase. Differentiation has been applied for different personnel groups, and for the 2 different phases, with a maximum of 42 for the Well Intervention Crew (Stand-alone Phase) and 23 for Maintenance Crew (SIMOPS MPP Phase) (both of which exceed the limit). However, it should be noted that helicopter risk, which is outside the scope of this investigation, contributes more than 50% of the total for the Maintenance Crew in both phases and nearly a third of the total for the Well Intervention Crew in the Stand-alone Phase, with a FAR of about 12 for all these 3 cases. Differentiation by area of platform has not been applied in the memo. There have been no fatal accidents on this installation since its inception. Helicopter risk aside, the analysis concludes that the greatest risk to personnel is process accidents for the Maintenance Crew in the Stand-alone Phase, and blowouts for the other three groups (greatest contributor to IR), the latter primarily from fires resulting from blowouts from producing wells. The calculated frequency of impairment of main safety functions marginally

Investigation into Development of Safety Levels on Norwegian Installations in the North Sea Post-1990
Annelise Baillie 72
exceeds the 1.0*10-4 criterion for a large number of scenarios. Ship Collision has an impairment frequency of 1.42*10-4 for loss of escape ways, for loss of evacuation, and for loss of main structure, for both the SIMOPS Phase and the Stand-alone Phase. Additionally, the frequency of impairment of escape ways from blowouts and process accidents during the SIMOPS Phase (1.86 and 1.61, respectively, both *10-4), and from process accidents during the Stand-alone Phase (1.7*10-4) all exceed the criterion. There have been no reported leaks from this installation since its inception. Given its age, this is not surprising, as Graph 4.1 showed very few leaks in total from installations from the period when Platform D was built. For leaks in pipes and risers, no estimate is given for frequency, though small IR-values are given in the order of 1*10-7 – 1*10-6. There was a crack in a flexible riser, in 2004, but the resultant leak was minor. FAR value from collisions is calculated as 0.67, but does not differentiate between ship collisions, collisions with field-related vessels and collisions with drifting objects. This is quite high compared to the other installations considered (see Graph 6.7), and is to some extent verified by the facts. Although none of the incidents caused damage, let alone fatalities, in the period since the platform’s installation, there have been no less than 12 ships on collision course (which is more than twice the average in this sample of 8 installations), shown in Graph 6.4. This amounts to more than 1 a year, and in 2007 alone, there were 4 such events. It suggests that this installation is very exposed, and that more effort should be made to make shipping aware of its presence.
0
1
2
3
4
20
01
20
02
20
03
20
04
20
05
20
06
20
07
20
08
20
09
No
. Of
Ship
s o
n C
olli
sio
n C
ou
rse
pe
r Y
ea
r
Year
No. of Ships on Collision Course per Year - Platform D
No. Per Year
3 per. Bev. Gjsni tt. (No. Per Year)
Graph 6.4 No. of Ships on Collision Course per Year – Platform D However, the installation has been hit by a supply vessel once during its lifetime, in 2005, due to careless manoeuvring. None of these incidents caused fatalities.
Investigation into Development of Safety Levels on Norwegian Installations in the North Sea Post-1990
Annelise Baillie 73
The FAR value for occupational accidents has been calculated as approximately 3.3 per 108 man-hours (which is high compared to the other platforms in this sample – see Graph 5.4) = 1 per 0.3*108 hours, while the approximate number of man-hours on this installation would be about 0.2*10*10*365*24 = 0.0018*108 hours (0.2 = 20% is the approximate amount of time a person spends on this platform compared to total time offshore). As this platform is normally unmanned, the field is likely to be closed long before it accumulates enough hours for a fatality to be statistically expected.
6.6. Platform E
Platform E is a manned floating production and storage (FPSO) vessel in the Norwegian Sea, comprising a cylindrical turret moored to the sea-bed and processing plant on deck of the weather-vaning vessel. Production from this installation started in the 1990’s. From a reservoir at 2525m depth, at near hydrostatic pressure, the installation produces oil, while water injection is used as a drive mechanism. The installation is located in 380m water depth, and it has 6 subsea wellhead templates. The total risk analysis (TRA) for this installation dates from 2000, though the Concept Risk Analysis was first published in 1996. The software OHRAT (Offshore Hazard and Risk Analysis Toolkit) was used, and risk to Personnel, Material Loss and Environment was considered. The assumptions used in this risk analysis are summarised in Appendix E. The description of assumptions is very brief and incomplete, as the TRA refers to the SID database. No attempt is made in the TRA to justify the assumptions listed. No sensitivity analyses on the assumptions are carried out. A maximum number of personnel of 120 persons are assumed for maximum risk, while a minimum number of 34 are assumed for emergency preparedness. This TRA only focuses on the operational phase, and counts the exposed hours as the total time spent on the installation. Transportation time is not included. For personnel risk, a resultant FAR value of 5.1 is calculated, and this compares favourably with the criteria of maximum 10 (There appears to be an inconsistency, as the results chapter says 5.1, while a different chapter gives 5.8). No differentiation has been made between different personnel groups. There have been no fatal accidents on this installation since its inception, which can be (over-)estimated as 13*365*24*120 = 0.13*108 hours (alternatively under-predicted as 13*365*24*34 = 0.04*108). The installation has therefore not accumulated enough working hours before a fatality can be statistically expected (which assumes that there is only 1 fatality per fatal accident, which may not necessarily be true). No ALARP process appears to have been carried out, though a Cost/Benefit Analysis was carried out for Risk of Material Losses. The analysis concludes that the greatest risk is for large leaks (>15kg), and that there is a high probability of ignition if leak occurs in compression area. This has fortunately proved not to be the case. There has only been 1 leak of this order of magnitude (22kg/s), which occurred in 2002, and was not ignited. The

Investigation into Development of Safety Levels on Norwegian Installations in the North Sea Post-1990
Annelise Baillie 74
estimated leakage frequency for leaks in the process area > 0.1kg/s per year is 1.1. There were 4 leaks in 2002 (none ignited), and none in any other year, which renders it somewhat meaningless to discuss annual averages. However, over 13 years, this gives an averaged frequency of 0.3 per year. For leaks in pipes and risers, the estimated frequency is 0.2/year (1 every 5 years) and 0.04/year (1 every 25 years), respectively. There have been no such leaks. The FAR value for occupational accidents has been calculated as 1.2, but there have been no fatal occupational accidents, nor would we expect so after only 0.13*108 hours. There is a clear inconsistency in the risk analysis, in that the bar chart for loss of safety functions does NOT add up the probabilities of failure for all event categories in order to comply with the criterion given in 5.1. The different types of events (Process Accidents, Riser Accidents and Other) are given separately for each safety function. Hence, it appears that Impairment of Escape Route passes the criterion, when in fact it does not: Process: 0.7*10-4 Riser: 0.0*10-4 Other: 0.6*10-4 Total: 1.3*10-4 > criterion None of the attachments, describing the modelling and calculations was available.
6.7. Platform F
Platform F is concrete platform in the North Sea, of the Condeep variety, comprising production, accommodation and processing facilities. Production from this installation started in the mid-1990’s. The installation produces oil, gas and condensate. CO2 injection is used as a drive mechanism. The installation is 210m high, and can accommodate 160 people. There is a gas process plant on the installation.
The total risk analysis (TRA) for this installation dates from 1995, shortly after production start, and was intended to not only document the current as-built risk situation (rather than initial concept), but also show the risk picture for the various intended phases of the installation’s life. Therefore, the risk analysis is divided into 2 parts, with results for these 2 phases presented separately. Risk to Personnel, Material Loss and Environment was considered. The assumptions used in this risk analysis are summarised in Appendix F. As stated in Appendix F, manning level on the platform has been assumed to be 219 in the drilling/production phase (called Phase 1 & 2), and 133 in the normal production phase (called Phases 3, 4 & 5). This TRA does not include the transportation time in the exposed hours, so that helicopter transport risk is not included in the FAR. It is therefore not directly comparable with risk analyses that include this element.

Investigation into Development of Safety Levels on Norwegian Installations in the North Sea Post-1990
Annelise Baillie 75
A formal ALARP process does not appear to have been carried out. The risk analysis does not give formal recommendations for risk reducing measures, but some points entitled “important safety factors” (free translation). These points were: All Phases:
• Report all incidents and near-misses
• Analyse the data material and use to plan inspection and maintenance
• Develop a good maintenance program for the gas separation area, wellhead area and electrical equipment in particular
• Reduce manning in exposed areas to the minimum required
• Plan to carry out simultaneous activities where possible, if this does not increase leak frequency
• Consider using mobile gas detectors with a stronger sound signal, or with a light signal
• Review locations of mobile gas detectors
• If hot works becomes necessary, use a mobile overpressurised welding tent to cover hot works activity
• If hot works becomes necessary, consider connecting cutting torch to ESD system
It is not clear if these measures have been carried out. Some sensitivity analyses appear to have been carried out, as the risk analysis states that the collision frequency is 30-40% higher if the assumption that ships set their sight on the safety zone perimeter (not the platform) does not hold true. It also states that the reduction factors for ignition probability from hot works and electrical equipment (0.5 and 0.3, respectively) reduce number of fires by 30-40%. It also refers to a separate report, which found that if hot works was assumed to take place on platform, FAR values from ignited leaks would double.
For personnel risk, a resultant FAR value of average 5.6 is calculated, which compares favourably with the criterion of maximum 10. Differentiation has been applied for the 2 different phases, but not for different personnel, with a maximum of 5.7 for normal production phase and 5.5 for drilling phase. FAR has not been explicitly calculated for the different areas, but a list of their % relative contributions is included. There have been no fatal accidents on this installation since its inception. The analysis concludes that the greatest risk is process accidents (greatest contributor to FAR, with 58% in drilling phase and 70% in normal production phase), primarily from ignited hydrocarbon leakages from process equipment. Disappointingly, this risk analysis does not calculate impairment of safety functions, only frequency of material loss, even though this was already a requirement at the time this analysis was written. Risk of loss of 1 area from process leaks and risk of loss of more than 1 area both exceed the 1.0*10-4 criterion (83 and 8.3, respectively, both *10-4).

Investigation into Development of Safety Levels on Norwegian Installations in the North Sea Post-1990
Annelise Baillie 76
There have been 33 reported leaks from this installation since the RNNP records began in 1996, which, given its age, is probably the majority of the total, and only 6 of these leaks were smaller than 0.1kg/s. Graph 6.5 shows the variation in number of leaks per year since 1996, which includes all leaks. The background material shows that most of the leaks in the last 10 years have been larger than 0.1kg/s, which is negative. The average number of leaks has been 2.3 per year overall, which is about half of that predicted in the risk analysis which was 4.4 (see Appendix F) but about 1.3 in the last 10 years. However, it would appear that, after a long positive period with no leaks, there has been a negative trend since 2008.
0
2
4
6
8
10
12
19
96
19
97
19
98
19
99
20
00
20
01
20
02
20
03
20
04
20
05
20
06
20
07
20
08
20
09
No
. O
f L
ea
ks
pe
r Y
ea
r
Year
No. Of Leaks per Year - Platform F
No. Of Leaks per Year
3 Periods Moving Average
Graph 6.5 Numbers of Leaks per Year 1996-2009, and 3-Year Moving
Average for Platform F
By comparing Graph 6.5 to 6.2 (for Platform C), we see broadly similar patterns of leak frequency over time, even though there is about ten years age difference between them. The magnitude of leaks per year in the mid-1990’s was nearly 10 for both, and both installations had another top year for leaks in 2000. Like Platform C, Platform F experienced a sharp reduction in the number of leaks in the early 2000’s and in fact had several years without any leaks at all, only for the positive trend to appear to have turned at the end of the decade.
For leaks in pipes and risers, no estimate is given for frequency, though a FAR-value is calculated as maximum 0.1. There have been no such leaks. FAR value from collisions is calculated as 0.1, but does not differentiate between ship collisions, collisions with field-related vessels and collisions with drifting objects. In the period since 1996, there have been 5 ships on collision course, in 1998, 2002, 2004 and 2005 (2) but none of the incidents caused damage, let alone fatalities. This amounts to about 1 every third year, which is about average for the sample of 8 installations considered. However, several of these incidents were within 1n.m. of the installation, in fact one as close as
Investigation into Development of Safety Levels on Norwegian Installations in the North Sea Post-1990
Annelise Baillie 77
0.1n.m, which was just minutes away from collision. This is curiously at odds with the assumption in the risk analysis that the surveillance system will give warning a whole hour before collision (see Appendix F). The FAR value for occupational accidents has been calculated as 1.5 per 108
man-hours = 1 per 0.67*108 hours, while the approximate number of man-hours on this installation would be about 150*17*365*24 = 0.22*108 hours.
6.8. Platform G
Platform G is a manned complex of 2 riser platforms in the North Sea, which are linked by a bridge. The platform type is steel jackets, on steel bucket foundations. Production from this installation started in the mid-1990’s. The installation stands in 70m water depth, and it has 7 risers. There is a gas process plant on the installation.
The total risk analysis (TRA) for this installation dates from 1998, considerably after production start, and was intended to document the as-built risk situation rather than initial concept. Therefore, the risk analysis states that it includes the effect of various risk reducing measures over the years. Risk to Personnel, Material Loss and Environment was considered. The assumptions used in this risk analysis are summarised in Appendix G. It is not clear from the risk analysis what maximum number of personnel has been assumed, as this is not stated in report. This TRA only focuses on the operational, as-built phase, and counts the exposed hours as the total time spent on the installation. Transportation time is not included. A formal ALARP process does not appear to have been carried out, but a number of risk reducing measures were proposed in the risk analysis, due to exceedance of risk criterion for several safety functions, and a Cost/Benefit Analysis was carried out for Risk of Material Losses. The proposed measures were to:
• Offload pressure from the bypass-system when the system is not in use, to reduce number of leaks and frequencies of ignited
• Move ESD accumulators to safe area
• Passively fire-protect hydraulic pipes in critical areas
• Activate fire-water upon gas detection
• Carry out new explosion analyses using FLACS to reduce conservatism in estimates of explosion risk
It is not clear if these measures have been carried out. Sensitivity analyses have been carried out to measure effects of some modifications to installations, but not on assumptions themselves:
• Effect on FAR values and safety functions from new control vents and flowmeters
• Effect on risk contribution from leaks, due to reduction in dimension of pressure indicators from ¾” and 3/8” to 0.06”

Investigation into Development of Safety Levels on Norwegian Installations in the North Sea Post-1990
Annelise Baillie 78
• Effect of built-in pressure gauges on bridge between installations to measure explosion pressure
For personnel risk, a resultant FAR value of average 4.4 (not including helicopter accidents, which accounts for another 1.4, giving a total of 5.8) is calculated, which compares favourably with the criterion of maximum 10. However, one of the two platforms is unmanned, and has a FAR of 3.5, while the other has a FAR of 11.1 which clearly exceeds the criteria. No other differentiation has been made between different personnel groups. There have been no fatal accidents on this installation since its inception. The analysis concludes that the greatest risk is process accidents (greatest contributor to FAR, with 78%), primarily from immediate fatalities in non-escalating fires in the process area, and from riser explosions. The calculated frequency of process accidents leading to loss of escape routes, frequency of process accidents leading to loss of structural integrity, frequency of ship collisions leading to loss of structural integrity, and frequency of process accidents leading to loss of life boat stations, all exceed the 1.0*10-4 criterion (4.0, 3.5, 3.6 and 4.0, respectively, all *10-4). There have been no reported leaks from this installation, which gives a leak frequency of 0 for both platforms. By comparison with Graph 4.1, this is somewhat unusual for an installation of this age. The estimated leakage frequency for leaks in the process area > 0.1kg/s per year is 0.4 for one of the platforms, and 0.3 for the other. For leaks in pipes and risers, no estimate is given for frequency, though a FAR-value is calculated as 0.3, and frequencies for impairment of safety functions are close to the criterion for loss of escape routes and loss of lifeboat function (0.8 *10-4 for both). There have been no such leaks. It is noteworthy that FAR value from ship collisions is calculated as only 0.02, giving a negligible contribution to the total, and the risk analysis specifically states that this contribution has been reduced compared to previous analyses (not available). However, there have been no less than 5 DFU’s (near-misses) in this category – 1 in the years 2004, 2006 and 2007, and 2 in 2005. It raises questions over the analysis’ ability to accurately reflect the true risk of ship collisions, even though in each case, standby-vessels cut off the offending vessels more than 1 n.m. before collision. The FAR value for occupational accidents has been calculated as 0.28, but there have been no fatal occupational accidents on this installation, nor would we expect so. Attachments are included in the appendices to the report, describing the modelling and calculations in detail.
Investigation into Development of Safety Levels on Norwegian Installations in the North Sea Post-1990
Annelise Baillie 79
6.9. Platform H
Platform H is a manned conventional fixed steel jacket platform in the North Sea, comprising a 17500T steel jacket substructure and 22500T topside. Production from this installation started in the early 2000’s. From a sandstone reservoir at 1700m depth, the installation produces oil only. Natural gas injection is used as a drive mechanism. The installation stands in 127m water depth, and it has 40 well slots. It comprises drilling, production, processing and living quarter facilities, and sleeps 130 persons. The available risk analysis for this installation dates from 2001, when the project was at the detailed engineering stage. Strictly speaking, this is not a full risk analysis, but a Safety and Emergency Preparedness Analysis (SEPA). No information is given regarding which software was used to model and calculate the risk, referring to the appendices (unavailable). Risk to Personnel, Impairment of Safety Functions, and Explosion Risk have been considered, but not Material Loss or Environmental Risk. The assumptions used in this risk analysis are summarised in Appendix H.
A formal ALARP process has not been carried out, as the risk analysis states that this “is also in line with the [operator] Risk Acceptance Criteria that states that ALARP measures shall be considered if the risk level exceeds 75% of the maximum allowable level. Both the Personnel Risk, the risk for Loss of Safety Function and the Explosion Risk are below this level”. Two points can be made here. Firstly, the risk level is only less than 75% of risk acceptance criteria because these are set higher than the standard 1.0*10-4 criterion. Had this criterion been used, risk reducing measures would have had to be introduced for the risk of loss of escape-ways from Utility Area. Secondly, this policy does not appear to be in accordance with either the letter or the spirit of the NORSOK Standard Z-013, which calls for risk-reducing measures unless they are grossly
disproportionate to cost, so an arbitrary percentage of the RAC’s is irrelevant. However, some risk reducing measures were proposed in the risk analysis. These were to:
• Due to removing standby vessel, introduce necessary compensating operational measures to achieve an acceptable level of emergency preparedness
• Establish guidelines for how to transport personnel launched in lifeboats, from lifeboats to shore in a safe manner
• Evaluate and assess procedures and measures to confirm that blow-down can be performed within 5mins after PA message
• Consider risk reducing measures to reduce the amount of work over open sea to a minimum
• Verify that there is VHF coverage in the area for onshore traffic control centre to establish contact with vessel on collision course
• Make agreement with neighbouring installation’s operator to use their SBV in emergency event
• Establish procedures for handling risk of collision and evacuation.

Investigation into Development of Safety Levels on Norwegian Installations in the North Sea Post-1990
Annelise Baillie 80
It is not clear if these measures have been carried out. No sensitivity analyses on the assumptions appear to have been carried out. Description of personnel risk in this risk analysis is substantially different from the ones for all the other platforms, in that it focuses only on f-N curves (see Graph 6.6 below), and no FAR values have been calculated. The manning level is given as 130. One great weakness of the f-N curve given is that it does not give values for accidents with only 1 fatality, i.e. occupational accidents, and such accidents do not appear to have been considered at all. Transportation time is not included.
0,00E+00
2,00E-04
4,00E-04
6,00E-04
8,00E-04
1,00E-03
1,20E-03
1,40E-03
2
3-5
6-2
0
21
-50
51
-10
0
>1
00
An
nu
al F
req
ue
ncy
of
Acc
ide
nt
No. of Fatalities
Annual Frequency of Accidents with Resulting No. of
Fatalities
Helicopter
Dropped Objects
Coll ision
Shale Shaker
Riser
Process
Well Leak
Blowout
Graph 6.6 Annual Frequency for Accidents with Resulting No. of Fatalities
for Platform H Based on Table 2.2 and Figure 2.7 in Vinnem (2007), we can however make an estimate of maximum and minimum total FAR-value for the platform, by assuming that the annual frequency of an accident with 1 fatality will very likely not be greater than 0.1 (total for all types of accidents), and not less than 0.01. The geometric mean of 1 is equal to 1. In Appendix J, this gives a maximum PLL contribution from accidents with 1 fatality of 0.1 and minimum 0.01 (See Appendix J, line marked Total). Adding this to the other totals, gives a Maximum Total PLL of 0.111 and Minimum 0.021 (Appendix K). If the exposure hours are 8760hours and the manning is 130, this gives a Maximum Total FAR of 9.7 and Minimum Total FAR of 1.8. Comparing with the other

Investigation into Development of Safety Levels on Norwegian Installations in the North Sea Post-1990
Annelise Baillie 81
platforms (Graph 5.7), these appear to be reasonable boundary conditions, and the correct FAR is probably around half-way between these two figures.
Differentiation has not been applied for different personnel groups or for different areas of the platform. There have been no fatal accidents on this installation since its inception. The analysis concludes that the greatest risk to personnel is blow-out accidents, closely followed by process accidents, and accidents where personnel on platform are hit by helicopter. Curiously, this risk analysis does not abide by the 1.0*10-4 criterion given in the standards, but sets its own (operator) acceptance criteria that, for several cases, exceed this criterion by a considerable margin. It is therefore perhaps not surprising that the findings from the risk analysis fall below the acceptance criteria. The calculated frequency of impairment of evacuation possibility is 1.0*10-5 for Drilling Area (criterion 1.8*10-4), 6.7*10-5 for Process Area (criterion 5.0*10-4), 9.8*10-5 for Utility Area (criterion 2.4*10-
4) and 3.1*10-5 for LQ Area (criterion 1.0*10-4). Additionally, the frequency of impairment of explosion barriers has been calculated. For these scenarios, the normal criterion of 1.0 *10-4 has been applied, and the annual frequency of impairment of explosion barriers in all areas is below the criterion. There has been only 1 reported leak from this installation, in 2009, which makes it meaningless to calculate any leak frequency. Given its age, this is not surprising, as Graph 4.1 showed very few leaks in total from installations from the period when Platform H was built.
For leaks in pipes and risers, no estimate is given for frequency. There have been no such leaks. FAR value from collisions is not calculated and does not differentiate between ship collisions, collisions with field-related vessels and collisions with drifting objects. Although none of the incidents caused damage, let alone fatalities, in the period since the platform’s installation, there have been 4 ships on collision course, 2 in 2007 and 2 in 2008. The installation has also been hit by supply vessels twice during its lifetime, once in 2005, and once in 2007. None of these incidents caused fatalities.

Investigation into Development of Safety Levels on Norwegian Installations in the North Sea Post-1990
Annelise Baillie 82
6.10. FAR Values all Platforms
Graph 6.7 below shows the FAR values for all accident types for Platforms A through to G. Values for Platform H were not available.
0,00
5,00
10,00
15,00
20,00
25,00
Platform A Platform B Platform C Platform D Platform E Platform F Platform G Platform H
FA
R V
alu
es
by
Ty
pe
of
Acc
ide
nt
Installations
FAR Values for Platforms A to G (H not available)
Earthquake
Structural Failure
Ship Collision
Occupational
Helicopter
Environmental/Weather
Util ity Fires/Explosions
Dropped Objects
Riser & Pipeline Accidents
Blowout
Process
Graph 6.7 FAR Values for Platforms A to G (H not available) for all
Accident Types Graph 6.7 shows that the average total FAR for these platforms, which can be considered a fairly representative sample, is approximately 6, which is considerably below the maximum 10 set in most company standards. The total FAR for Platform D exceeds 20, but this seems far from representative. The Risk Analysis available for this platform is for a modification, not the original, which may have some bearing on the results. Furthermore, the RA only gives Individual Risk (IR), which has been converted to FAR in tables 5.1 and 5.2 above. The number of hours spent on the platform is less than 400 hours, which would explain the high FAR values. FAR values for Platform H were not available, and could not be calculated due to lack of data. The figures in red in the table in Appendix I are those where no figures were given in the risk analysis. These have been set to zero, except for Platform E. The risk analysis for Platform E gives a FAR of 0.4 for “Other”, without stating what this includes. To obtain a total FAR of 5.1, as the analysis states, an informal method has been used - small nominal values (0.1 or less) have been inserted into categories Blowout, Utility Fires/Explosions, Environmental/Weather, Ship Collisions and Structural Failure, to account for these in the graph. Individually, these values may be incorrect, but in total, they add up to 0.4.
The greatest contribution to FAR is Process for all Platforms. For six of the installations, Process accounts for 50% or more of total FAR, which reinforces the belief that these accidents (leaks) is the primary cause of major hazards. Reducing the number of leaks has the direct effect of reducing the frequency of ignitions, explosions and hence fatality risk.

Investigation into Development of Safety Levels on Norwegian Installations in the North Sea Post-1990
Annelise Baillie 83
Graph 6.8 plots the Process FAR Value along the x-axis, against the Average Number of Leaks per year from each installation (except H). Note that Platforms D and G have equal Process FAR value (3.4) and 0 leaks each, so they fall on the same point.
A
B
C
D
E
F
E0
0,2
0,4
0,6
0,8
1
1,2
1,4
1,6
1,8
2
0,00 1,00 2,00 3,00 4,00 5,00 6,00
No
. O
f D
FU
1&
2 p
er
Ye
ar
>0
.1k
g/
s
FAR Value Process (QRA)
No. Of DFU1's per Year > 0.1kg/s - calculated from 1996 or Start of
Production, whichever more recent
No. Of DFU1's per Year > 0.1kg/s
Graph 6.8 Average No. of Leaks per Year (>0.1kg/s) plotted against the
FAR Values for Platforms A to G (H not available) for Process Graph 6.8 divides neatly into 4 areas – Low FAR (below 3) Low Leak Frequency (below 1/year), Low FAR High Frequency, High FAR High Frequency and High FAR Low Frequency. None of the installations in the sample have low Process FAR but high Leak Frequency. Only Platform A falls into Low FAR Low Leak Frequency, and this is only because it has not yet been built, so it must be disregarded. Platform H (post-2000) has no given FAR values, so could not be plotted, but leak frequency is 0.1/year, so we could probably expect it to fall in area Low FAR Low Frequency. Platforms C and F (both pre-2000) have high FAR and High Leak Frequency. Platforms D, G and B (all pre-2000) all have High FAR but Low Leak Frequency. The variation in contribution from Blowout can, at least in part, be explained by reservoir conditions – it is very small for installations where the reservoir pressure is so low that injection is required to push up the hydrocarbons into the wells. The contribution from Occupational Accidents varies considerably, and much more than one might expect. On Platform D, this is very high. This could partly be due to the low number of exposure hours compared to the other installations, but it is also suspected that there may possibly be calculation errors in the original QRA.
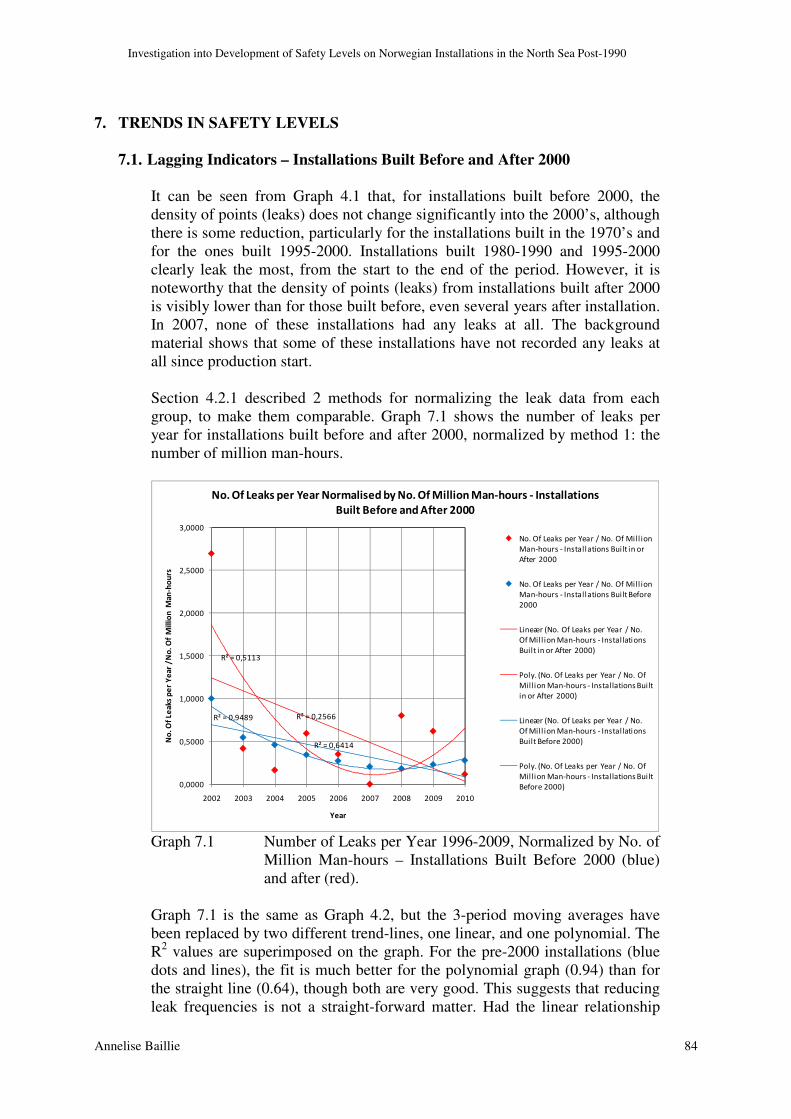
Investigation into Development of Safety Levels on Norwegian Installations in the North Sea Post-1990
Annelise Baillie 84
7. TRENDS IN SAFETY LEVELS
7.1. Lagging Indicators – Installations Built Before and After 2000
It can be seen from Graph 4.1 that, for installations built before 2000, the density of points (leaks) does not change significantly into the 2000’s, although there is some reduction, particularly for the installations built in the 1970’s and for the ones built 1995-2000. Installations built 1980-1990 and 1995-2000 clearly leak the most, from the start to the end of the period. However, it is noteworthy that the density of points (leaks) from installations built after 2000 is visibly lower than for those built before, even several years after installation. In 2007, none of these installations had any leaks at all. The background material shows that some of these installations have not recorded any leaks at all since production start. Section 4.2.1 described 2 methods for normalizing the leak data from each group, to make them comparable. Graph 7.1 shows the number of leaks per year for installations built before and after 2000, normalized by method 1: the number of million man-hours.
R² = 0,2566
R² = 0,5113
R² = 0,6414
R² = 0,9489
0,0000
0,5000
1,0000
1,5000
2,0000
2,5000
3,0000
2002 2003 2004 2005 2006 2007 2008 2009 2010
No
. O
f L
ea
ks
pe
r Y
ea
r /
No
. O
f M
illi
on
Ma
n-h
ou
rs
Year
No. Of Leaks per Year Normalised by No. Of Million Man-hours - Installations
Built Before and After 2000
No. Of Leaks per Year / No. Of Mill ion
Man-hours - Installations Bui lt in or
After 2000
No. Of Leaks per Year / No. Of Mill ion
Man-hours - Installations Bui lt Before
2000
Lineær (No. Of Leaks per Year / No.
Of Mill ion Man-hours - Instal lations
Built in or After 2000)
Poly. (No. Of Leaks per Year / No. Of
Million Man-hours - Installations Built
in or After 2000)
Lineær (No. Of Leaks per Year / No.
Of Mill ion Man-hours - Instal lations
Built Before 2000)
Poly. (No. Of Leaks per Year / No. Of
Million Man-hours - Installations Built
Before 2000)
Graph 7.1 Number of Leaks per Year 1996-2009, Normalized by No. of
Million Man-hours – Installations Built Before 2000 (blue) and after (red).
Graph 7.1 is the same as Graph 4.2, but the 3-period moving averages have been replaced by two different trend-lines, one linear, and one polynomial. The R2 values are superimposed on the graph. For the pre-2000 installations (blue dots and lines), the fit is much better for the polynomial graph (0.94) than for the straight line (0.64), though both are very good. This suggests that reducing leak frequencies is not a straight-forward matter. Had the linear relationship

Investigation into Development of Safety Levels on Norwegian Installations in the North Sea Post-1990
Annelise Baillie 85
been the best fit, one might have expected 0 leaks by about 2012, which is clearly unrealistic. The good fit to the polynomial line rather suggests that the number of (normalized) leaks for pre-2000 installations reached a minimum around 2007 with a current upwards trend, and that 0 normalized leaks may be near-unachievable. The R2 value for the straight red line is a poor 0.26 and it is a better 0.51 for the 2nd-Order regression line. These also suggest that the number of (normalized) leaks for post-2000 installations reached a minimum around 2007 with a current upwards trend, and that 0 normalized leaks may be near-unachievable on these, too. These trend-lines do not indicate lower numbers of leaks on post-2000 installations, when normalized by the number of million man-hours. In fact, they were higher for 5 out of the 9 years considered (2002-2010), though the difference has been very small since 2005.
Graph 7.2 shows the number of leaks per year for installations built before and after 2000, normalized by the number of installation years.
R² = 0,4908
R² = 0,7115
R² = 0,7556
R² = 0,8006
0,0
0,1
0,2
0,3
0,4
0,5
0,6
0,7
0,8
0,9
1,0
1996 1998 2000 2002 2004 2006 2008 2010
No
. O
f L
ea
ks
pe
r Y
ear
No
rma
lise
d
by
No
. o
f In
sta
llat
ion
Ye
ars
Year
Number of Leaks per Year / No. of InstallationYears - Installations Built
Before and After 2000
No. Of Leaks - Install. Built in a nd
After 2000/No.of Ins tallation Years
No. Of Leaks - Install. Built Before
2000/No.of Ins tallation Years
Lineær (No. Of Leaks - Install. Built
in and After 2000/No.of Installation
Years )
Poly. (No. Of Leaks - Install. Built in
and After 2000/No.of Installation
Years )
Lineær (No. Of Leaks - Install. Built
Before 2000/No.of Installation
Years )
Eks pon. (No. Of Leaks - Install. Built
Before 2000/No.of Installation
Years )
Graph 7.2 Number of Leaks >0.1kg/s per Year 1996-2009, Normalized
by No. of Installation Years – Installations Built Before 2000 (blue) and after (red).
Graph 7.2 is the same as Graph 4.3, but the 3-period moving averages have been replaced by two different trend-lines, one linear for each group, and a 2nd-Order polynomial for the post-2000 installations, and an inverse exponential line for the pre-2000 installations. The R2 values are superimposed on the graph. The R2 value for the straight blue line is 0.76, which is very good, but the inverse exponential fit is even better, at 0.8. The trend for leaks from pre-2000 installations is therefore clearly downward, but its current slope is approaching zero, indicating that further reductions may be extremely difficult. The R2 value for the straight red line is just 0.49, but the 2nd-Order polynomial fit is much better, at 0.71. The trend for leaks from post-2000 installations

Investigation into Development of Safety Levels on Norwegian Installations in the North Sea Post-1990
Annelise Baillie 86
therefore appears to indicate a lowest point in 2007, followed by subsequent increases. These trend-lines do not indicate lower numbers of leaks on post-2000 installations, when normalized by the number of installation years. In fact, they were higher for 6 out of the 11 years considered (2000-2010), though the difference has been very small since 2003.
Graph 7.3 shows the number of well-kicks per year for installations built before and after 2000, normalized by the number of installation years.
R² = 0,4747
R² = 0,1418
0,00
0,05
0,10
0,15
0,20
0,25
1996 1998 2000 2002 2004 2006 2008 2010
No
. O
f W
ell
kic
ks p
er
Ye
ar/
No
. O
f In
sta
llat
ion
s B
uilt
sam
e Y
ea
r as
Inst
all
. w
/W
ell
kick
Year
No. Of Well-kicks per Year Normalised by No. Of Installation Years (Mob. Rigs
Excl.)
No. Of Wellkicks/No. Of Instal lation
Years - Instal lations Bui lt Before 2000
No. Of Wellkicks/No. Of Instal lation
Years - Instal lations Bui lt 2000 and Later
Poly. (No. Of Wellkicks/No. Of
Installation Years - Installations Built
Before 2000)
Poly. (No. Of Wellkicks/No. Of
Installation Years - Installations Built
2000 and Later)
Graph 7.3 Number of Well-kicks per Year 1996-2009 Normalized by
No. of Installation Years – Installations Built Before (blue) and after 2000 (red)
Although the normalized number of well-kicks (normalized by number of installation years) was higher for post-2000 installations in 3 separate years (2002, 2004 and 2008), the fitted trend-lines (2-order polynomial curves for both sets of data) are consistently higher for pre-2000 installations (the blue curve is above the red for all years), but the fit is very poor (R2 of just 0.1) for the post-2000 installations, because the number of well-kicks was 0 for 6 out of the 10 years. As explained in Section 4.2.2, part of the reason for the low number of well-kicks on production installations built later than 2000, is the increasing using of mobile rigs for production drilling, which has led to increasing numbers of well-kicks on these rigs instead. However, the gap is clearly narrowing. For the pre-2000 installations, the fit is 47%, and the number of normalized well-kicks is clearly on a downward trend, although there was an increase in 2009-2010.
Graph 7.4 shows the number of fire/explosions per year for installations built before and after 2000, normalized by the number of installation years.

Investigation into Development of Safety Levels on Norwegian Installations in the North Sea Post-1990
Annelise Baillie 87
R² = 0,4959
R² = 0,593
R² = 0,1257
R² = 0,1860,00
0,05
0,10
0,15
19
94
19
96
19
98
20
00
20
02
20
04
20
06
20
08
20
10
Inst
alla
tio
n Y
ea
r
Year
No. of Fires/Explosions per Year Normalised by No. of Installation
YearsNo. Of Fires/No. Of Installation
Years - Installation Years Bui lt
Before 2000
No. Of Fires/No. Of Installation
Years - Installations Built 2000 and
later
Lineær (No. Of Fires/No. Of
Installation Years - Instal lation
Years Built Before 2000)
Poly. (No. Of Fires/No. Of
Installation Years - Instal lation
Years Built Before 2000)
Lineær (No. Of Fires/No. Of
Installation Years - Instal lations
Bui lt 2000 and later)
Poly. (No. Of Fires/No. Of
Installation Years - Instal lations
Bui lt 2000 and later)
Graph 7.4 Number of Fires per Year 1996-2009 Normalized by No. of
Installation Years – Installations Built Before (blue) and after 2000 (red)
Graph 7.4 shows that the normalized number of fires was higher for post-2000 installations in 4 separate years. Linear and 2-order polynomial curves have been fitted to both sets of data. The fitted trend-lines are consistently higher for post-2000 installations (the red curve is above the blue for all years, except 2009) but the fit is very poor (R2 of just 0.1 for both straight line and polynomial), because the actual number of fires was 0 for 6 out of the 10 years considered. However, all the 4 fires on post-2000 installations occurred on one single installation, so the red curve is simply not representative for this group in general. The gap between the two groups appears to be narrowing, as all the lines are meeting around a point in year 2008. For the pre-2000 installations, the fit is 50% for the straight blue line and 59% for the polynomial blue line, indicating a clear downward trend towards zero fires in the near future. No division into pre- and post-2000 installations have been carried out for ships on collision course, nor have these been normalized, as this is an external factor over which installation management has little control. It is therefore reasonable to assume that age of installation is not a relevant factor. Graph 4.9 showed clearly that there has been a steady increase in the number of ships on collision course since 1996. No division into pre- and post-2000 installations have been carried out for drifting objects, either, nor have these been normalized, as this is also an external factor over which installation management has little control. It is also a fairly rare event, at about 1 a year. It is therefore reasonable to assume that age of installation is not a relevant factor. Graph 4.10 showed that the number of drifting object events have stayed at a steady, low number since 1996.

Investigation into Development of Safety Levels on Norwegian Installations in the North Sea Post-1990
Annelise Baillie 88
Graph 7.5 shows the number of field vessel collisions per year for installations built before and after 2000, normalized by the number of installation years.
R² = 0,1114
R² = 0,1346
0,00
0,02
0,04
0,06
0,08
0,10
0,12
0,14
1980 1985 1990 1995 2000 2005 2010 2015
No
. O
f F
ield
Ve
sse
l C
oll
isio
ns
pe
r Y
ea
r N
orm
ali
sed
by
No
. O
f In
sta
lla
tio
n
Ye
ars
Year
No. Of Field Vessel Collisions per Year with Production Platforms - Normalised by
No. Of Installation Years (Mob. Rigs Excl.)
No. Of Vessel Coll is ions per Year/ No. Of
Instal lation Years - Instal lations Bui lt Before
2000
No. Of Vessel Coll is ions per Year/ No. Of
Instal lation Years - Instal lations Bui lt in or
After 2000
Lineær (No. Of Vessel Coll isions per Year/
No. Of Instal lation Years - Installations Built
Before 2000)
Poly. (No. Of Vessel Col lisions per Year/ No.
Of Instal lation Years - Installations Built
Before 2000)
Graph 7.5 Number of Field Vessel Collision per Year 1996-2009
Normalized by No. of Installation Years – Installations Built Before (blue) and after 2000 (red)
The normalized number of field vessel collisions was higher for post-2000 installations in just 2 separate years. However, for 8 out of the last 10 years, there were no field vessel collisions at all with production platforms built 2000 or later, which renders meaningless any attempt to establish a trend for these installations (hence no trend-line shown). For installations built before 2000, the annual variation prior to year 2000 was so large that it is difficult to establish any definite trend. The very low R2 values for both the blue straight line (0.11) and the blue 2nd Order polynomial (0.13) is in part due to spikes in the data – 1986, 1993 and 1999 saw particularly high numbers of field vessel collisions with production platforms. Since 2000, however, there appears to have been more of a downward trend, with the average absolute number of events per year being around 2. Overall, the importance of age of installation in relation to DFU7 is considered to be low, as these events are caused by an external factor, i.e. the vessel in question. The collisions can usually be attributed to one of three primary causes: human error, mechanical error or manoeuvring error. The background material shows that these three causes are roughly evenly distributed. Graph 7.6 shows the number of structural damage/stability problem events per year for installations built before and after 2000, normalized by the number of installation years.

Investigation into Development of Safety Levels on Norwegian Installations in the North Sea Post-1990
Annelise Baillie 89
R² = 0,3877
R² = 0,5562
0
0,02
0,04
0,06
0,08
0,1
0,12
0,14
0,16
1990 1995 2000 2005 2010
No
. Of
Str
uct
ura
l D
am
ag
e E
ve
nts
pe
r Y
ea
r
No
rma
lise
d b
y N
o.
Of
Inst
all
ati
on
Y
ears
Year
No. Of Struct. Damage Events per Year / Installation Years
No. Of Struct. Damage
Events per Year /
Instal lation Years
Lineær (No. Of Struct.
Damage Events per
Year / Installation
Years)
Poly. (No. Of Struct.
Damage Events per
Year / Installation
Years)
Graph 7.6 Number of Structural Damage events per Year 1990-2009
Normalized by No. of Installation Years – Installations Built Before 2000
As there has only been 1 single structural damage event to an installation built after 2000 (in 2003), this has not been shown on the graph, as it would not be meaningful. For the installations built before 2000, the picture is not clear-cut. There was a large reduction in such events in the mid- to late-1990’s, but the trend since 1995 is relatively flat. Since 2001, there have normally been around 2 events a year. The fit to the linear trend-line is poor (R2 of 0.36), while the fit to the 2nd Order polynomial trend-line is rather better (0.56). However, neither of them capture the annual variation well, nor the fact that the annual average has stayed steady since 2005. Unfortunately, there are too few of these events per year to draw definite conclusions. As Graph 4.13 indicated a ‘time lag’ from production start until structural damage event of 6-18 years, it may be another 5-10 years before we start to see fatigue-related structural damage events on production installations built 2000 and later. However, there have also been some examples of construction errors which may give rapid degradation.
7.2. Lagging Indicators – Installations Built Before and After 1992
In 1992, 14 new thematic regulations were introduced. As an experiment, we have compared the number of leaks per year, normalized by the number of installation years before and after 1992, in order to compare with the results from installations built before and after 2000. Graph 7.7 shows the normalized number of leaks on installations built before and after 1992, normalized by the number of installation years before and after that year.
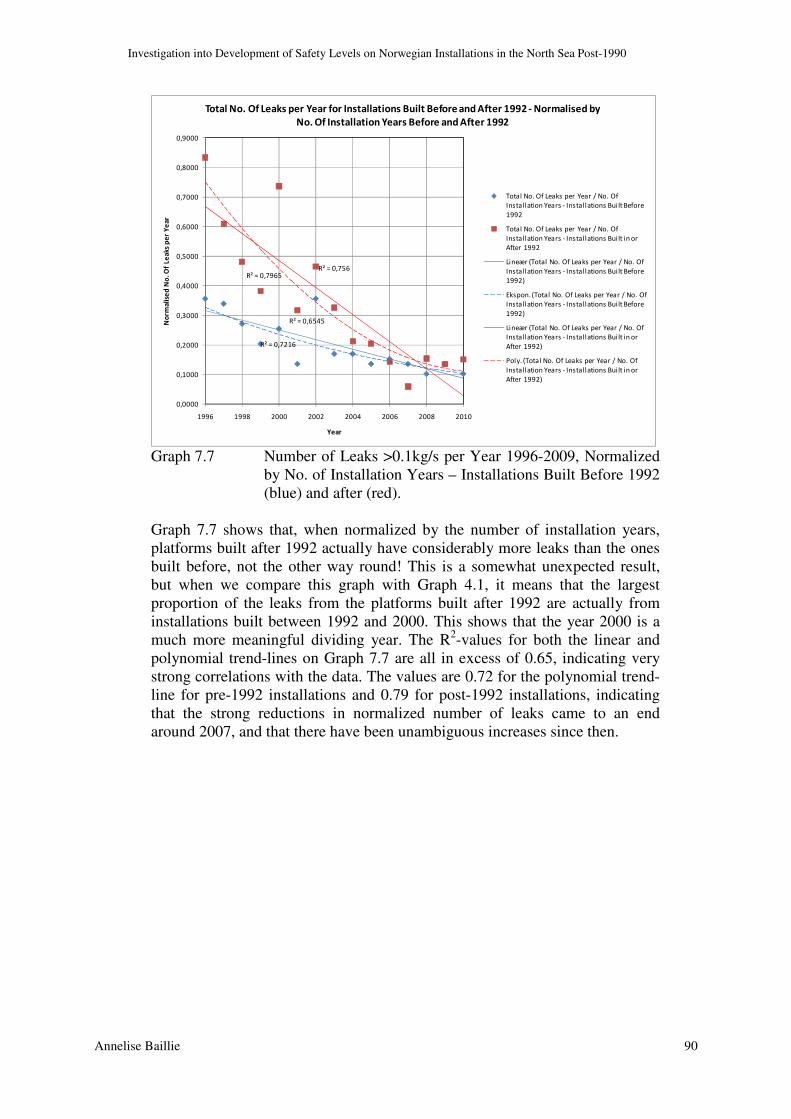
Investigation into Development of Safety Levels on Norwegian Installations in the North Sea Post-1990
Annelise Baillie 90
R² = 0,6545
R² = 0,7216
R² = 0,756R² = 0,7965
0,0000
0,1000
0,2000
0,3000
0,4000
0,5000
0,6000
0,7000
0,8000
0,9000
1996 1998 2000 2002 2004 2006 2008 2010
No
rma
lise
d N
o.
Of
Le
ak
s p
er
Ye
ar
Year
Total No. Of Leaks per Year for Installations Built Before and After 1992 - Normalised by
No. Of Installation Years Before and After 1992
Total No. Of Leaks per Year / No. Of
Installation Years - Installations Built Before
1992
Total No. Of Leaks per Year / No. Of
Installation Years - Installations Built in or
After 1992
Lineær (Total No. Of Leaks per Year / No. Of
Installation Years - Installations Built Before
1992)
Ekspon. (Total No. Of Leaks per Year / No. Of
Installation Years - Installations Built Before
1992)
Lineær (Total No. Of Leaks per Year / No. Of
Installation Years - Installations Built in or
After 1992)
Poly. (Total No. Of Leaks per Year / No. Of
Installation Years - Installations Built in or
After 1992)
Graph 7.7 Number of Leaks >0.1kg/s per Year 1996-2009, Normalized
by No. of Installation Years – Installations Built Before 1992 (blue) and after (red).
Graph 7.7 shows that, when normalized by the number of installation years, platforms built after 1992 actually have considerably more leaks than the ones built before, not the other way round! This is a somewhat unexpected result, but when we compare this graph with Graph 4.1, it means that the largest proportion of the leaks from the platforms built after 1992 are actually from installations built between 1992 and 2000. This shows that the year 2000 is a much more meaningful dividing year. The R2-values for both the linear and polynomial trend-lines on Graph 7.7 are all in excess of 0.65, indicating very strong correlations with the data. The values are 0.72 for the polynomial trend-line for pre-1992 installations and 0.79 for post-1992 installations, indicating that the strong reductions in normalized number of leaks came to an end around 2007, and that there have been unambiguous increases since then.
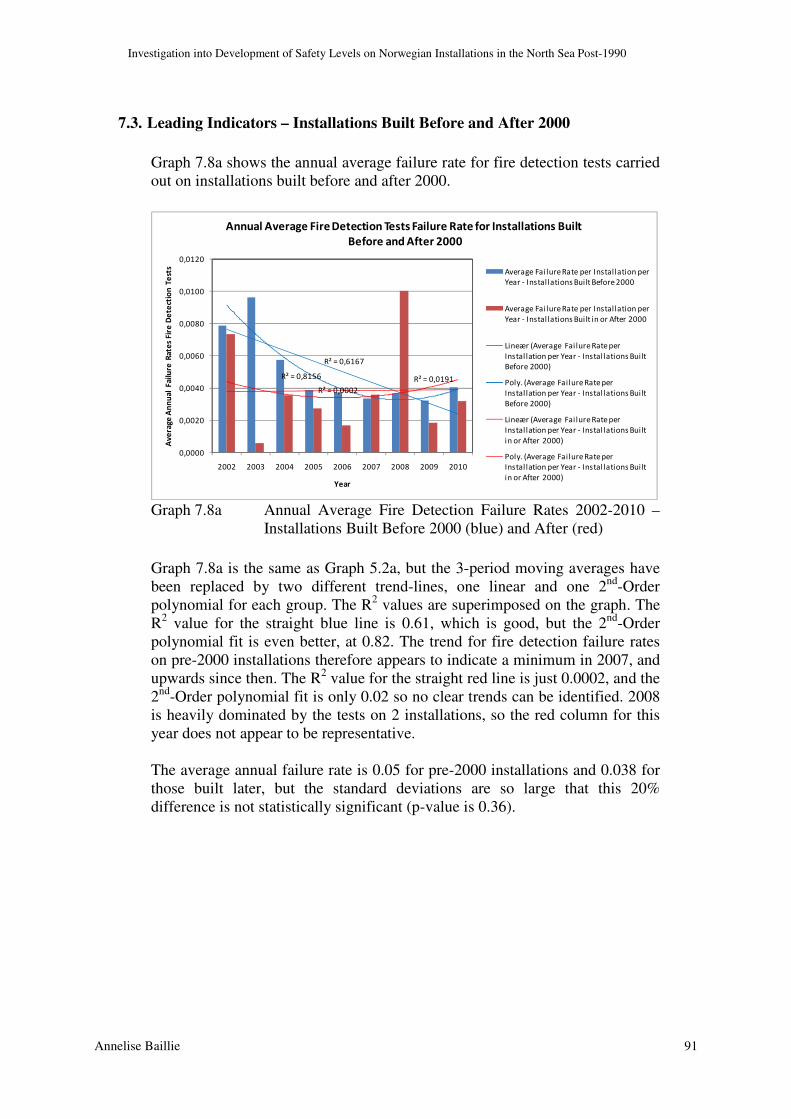
Investigation into Development of Safety Levels on Norwegian Installations in the North Sea Post-1990
Annelise Baillie 91
7.3. Leading Indicators – Installations Built Before and After 2000
Graph 7.8a shows the annual average failure rate for fire detection tests carried out on installations built before and after 2000.
R² = 0,6167
R² = 0,8156
R² = 0,0002
R² = 0,0191
0,0000
0,0020
0,0040
0,0060
0,0080
0,0100
0,0120
2002 2003 2004 2005 2006 2007 2008 2009 2010
Av
era
ge A
nn
ual
Fai
lure
Ra
tes
Fir
e D
ete
ctio
n T
est
s
Year
Annual Average Fire Detection Tests Failure Rate for Installations Built
Before and After 2000
Average Fai lure Rate per Instal lation per
Year - Instal lations Bui lt Before 2000
Average Fai lure Rate per Instal lation per
Year - Instal lations Bui lt in or After 2000
Lineær (Average Fai lure Rate per
Instal lation per Year - Instal lations Bui lt
Before 2000)
Poly. (Average Fai lure Rate per
Instal lation per Year - Instal lations Bui lt
Before 2000)
Lineær (Average Fai lure Rate per
Instal lation per Year - Instal lations Bui lt
in or After 2000)
Poly. (Average Fai lure Rate per
Instal lation per Year - Instal lations Bui lt
in or After 2000)
Graph 7.8a Annual Average Fire Detection Failure Rates 2002-2010 –
Installations Built Before 2000 (blue) and After (red)
Graph 7.8a is the same as Graph 5.2a, but the 3-period moving averages have been replaced by two different trend-lines, one linear and one 2nd-Order polynomial for each group. The R2 values are superimposed on the graph. The R2 value for the straight blue line is 0.61, which is good, but the 2nd-Order polynomial fit is even better, at 0.82. The trend for fire detection failure rates on pre-2000 installations therefore appears to indicate a minimum in 2007, and upwards since then. The R2 value for the straight red line is just 0.0002, and the 2nd-Order polynomial fit is only 0.02 so no clear trends can be identified. 2008 is heavily dominated by the tests on 2 installations, so the red column for this year does not appear to be representative. The average annual failure rate is 0.05 for pre-2000 installations and 0.038 for those built later, but the standard deviations are so large that this 20% difference is not statistically significant (p-value is 0.36).

Investigation into Development of Safety Levels on Norwegian Installations in the North Sea Post-1990
Annelise Baillie 92
Graph 7.8b shows the same as Graph 7.7a, but with the single outlier in 2008 removed.
R² = 0,6167
R² = 0,8156
R² = 0,0606
R² = 0,1981
0,0000
0,0020
0,0040
0,0060
0,0080
0,0100
0,0120
2002 2003 2004 2005 2006 2007 2008 2009 2010
Ave
rag
e A
nn
ua
l F
ail
ure
Ra
tes
Fire
De
tect
ion
Te
sts
Year
Annual Average Fire Detection Tests Failure Rate for Installations Built
Before and After 2000
Average Failure Rate per Instal lation per
Year - Instal lations Built Before 2000
Average Failure Rate per Instal lation per
Year - Instal lations Built in or After 2000
Lineær (Average Fai lure Rate per
Instal lation per Year - Installations Bui lt
Before 2000)
Poly. (Average Failure Rate per
Instal lation per Year - Installations Bui lt
Before 2000)
Lineær (Average Fai lure Rate per
Instal lation per Year - Installations Bui lt
in or After 2000)
Poly. (Average Failure Rate per
Instal lation per Year - Installations Bui lt
in or After 2000)
Graph 7.8b Average Annual Fire Detection Failure Rates for Tests 2002-
2010, for Installations Built Before 2000 (blue) and after (red) – Outlier in 2008 removed
Graph 7.8b shows that removing the single outlier increases the R2-value for the linear trend-line for the post-2000 installations from 0.002 to 0.06, and the polynomial from 0.02 to 0.2. The red and blue curves both appear to be increasing slightly at the end of the decade, with the difference between them reducing over time. There is no indication of a consistently downward trend for either group in the last 4 years. The new average failure rate for the post-2000 installations is 0.0032. The difference between the averages for the two groups is still not statistically significant at 5% level, but the p-value reduces to 0.08, so the difference between pre- and post-2000 installations becomes significant at 8% level, which is acceptable for practical purposes.

Investigation into Development of Safety Levels on Norwegian Installations in the North Sea Post-1990
Annelise Baillie 93
Graph 7.9a shows the annual average failure rate for gas detection tests carried out on installations built before and after 2000.
R² = 0,5931
R² = 0,6708
R² = 0,0298
R² = 0,249
0,0000
0,0050
0,0100
0,0150
0,0200
0,0250
0,0300
2002 2003 2004 2005 2006 2007 2008 2009 2010
Av
era
ge
An
nu
al
Fa
ilu
re R
ate
s G
as
De
tect
ion
Te
sts
Year
Average Annual Gas Detection Tests Failure Rate for Installations Built
Before and After 2000
Average Fai lure Rate per Instal lation
per Year - Instal lations Built Before
2000
Average Fai lure Rate per Instal lation
per Year - Instal lations Built in or After
2000
Lineær (Average Failure Rate per
Installation per Year - Installations
Bui lt Before 2000)
Poly. (Average Failure Rate per
Installation per Year - Installations
Bui lt Before 2000)
Lineær (Average Failure Rate per
Installation per Year - Installations
Bui lt in or After 2000)
Poly. (Average Failure Rate per
Installation per Year - Installations
Bui lt in or After 2000)
Graph 7.9a Annual Average Gas Detection Failure Rates 2002-2010 –
Installations Built Before 2000 (blue) and After (red)
Graph 7.9a is the same as Graph 5.4a, but the 3-period moving averages have been replaced by two different trend-lines, one linear and one 2nd-Order polynomial for each group. The R2 values are superimposed on the graph. The R2 value for the straight blue line is 0.59, which is good, but the 2nd-Order polynomial fit is even better, at 0.67. The trend for gas detection failure rates on pre-2000 installations therefore appears to indicate a minimum in 2010. It remains to be seen if future years show further reduction or an upward trend. The R2 value for the straight red line is just 0.03, and the 2nd-Order polynomial fit is only 0.25 so it is difficult to identify a trend for the post-2000 installations. 2007 and 2008 saw high average failure rates on these installations, but there has been a sharp decrease since then. The average annual failure rate is 0.0098 for pre-2000 installations and 0.0094 for those built later, so there is no discernable difference.
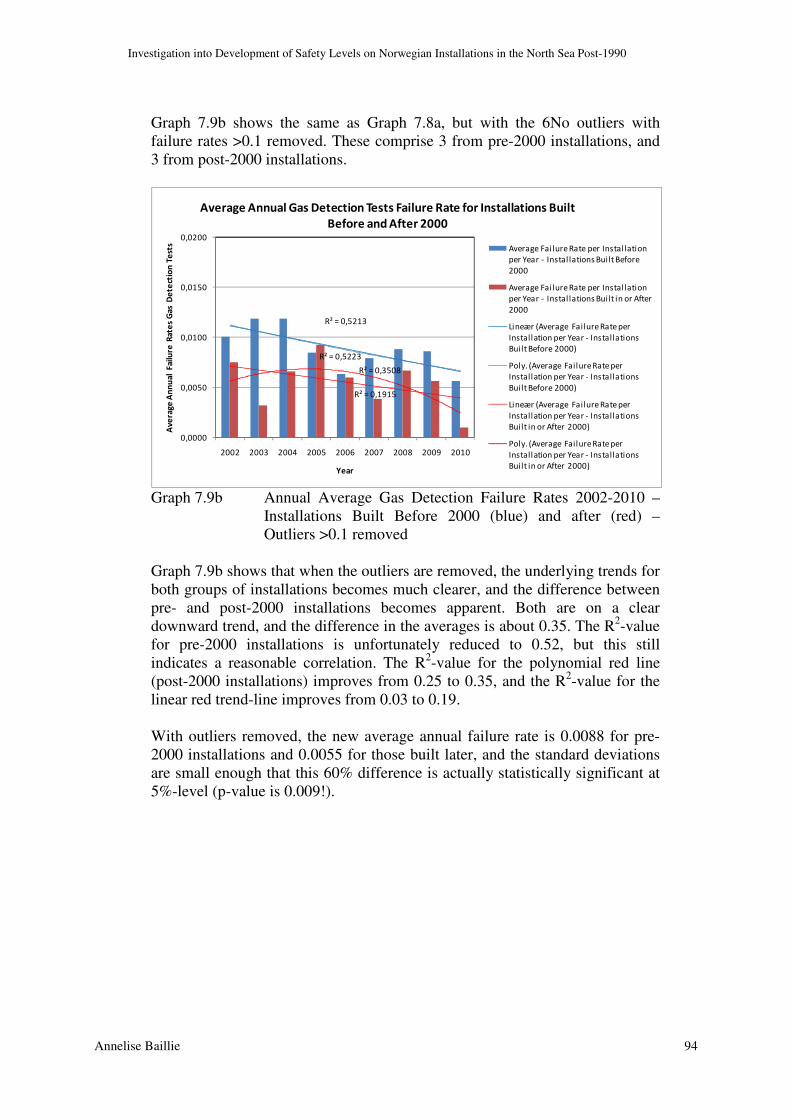
Investigation into Development of Safety Levels on Norwegian Installations in the North Sea Post-1990
Annelise Baillie 94
Graph 7.9b shows the same as Graph 7.8a, but with the 6No outliers with failure rates >0.1 removed. These comprise 3 from pre-2000 installations, and 3 from post-2000 installations.
R² = 0,5213
R² = 0,5223
R² = 0,1915
R² = 0,3508
0,0000
0,0050
0,0100
0,0150
0,0200
2002 2003 2004 2005 2006 2007 2008 2009 2010
Av
era
ge
An
nu
al
Fa
ilu
re R
ate
s G
as
De
tect
ion
Te
sts
Year
Average Annual Gas Detection Tests Failure Rate for Installations Built
Before and After 2000
Average Fai lure Rate per Instal lation
per Year - Instal lations Built Before
2000
Average Fai lure Rate per Instal lation
per Year - Instal lations Built in or After
2000
Lineær (Average Failure Rate per
Installation per Year - Installations
Bui lt Before 2000)
Poly. (Average Failure Rate per
Installation per Year - Installations
Bui lt Before 2000)
Lineær (Average Failure Rate per
Installation per Year - Installations
Bui lt in or After 2000)
Poly. (Average Failure Rate per
Installation per Year - Installations
Bui lt in or After 2000)
Graph 7.9b Annual Average Gas Detection Failure Rates 2002-2010 –
Installations Built Before 2000 (blue) and after (red) – Outliers >0.1 removed
Graph 7.9b shows that when the outliers are removed, the underlying trends for both groups of installations becomes much clearer, and the difference between pre- and post-2000 installations becomes apparent. Both are on a clear downward trend, and the difference in the averages is about 0.35. The R2-value for pre-2000 installations is unfortunately reduced to 0.52, but this still indicates a reasonable correlation. The R2-value for the polynomial red line (post-2000 installations) improves from 0.25 to 0.35, and the R2-value for the linear red trend-line improves from 0.03 to 0.19. With outliers removed, the new average annual failure rate is 0.0088 for pre-2000 installations and 0.0055 for those built later, and the standard deviations are small enough that this 60% difference is actually statistically significant at 5%-level (p-value is 0.009!).
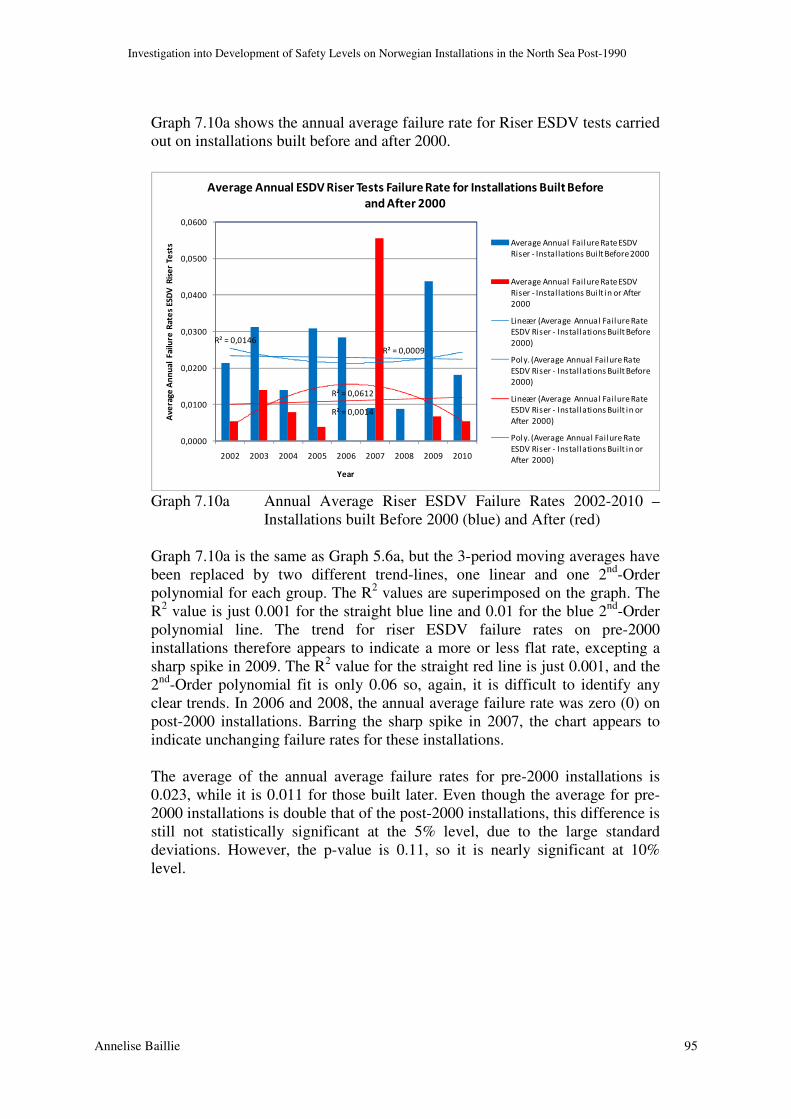
Investigation into Development of Safety Levels on Norwegian Installations in the North Sea Post-1990
Annelise Baillie 95
Graph 7.10a shows the annual average failure rate for Riser ESDV tests carried out on installations built before and after 2000.
R² = 0,0009
R² = 0,0146
R² = 0,0014
R² = 0,0612
0,0000
0,0100
0,0200
0,0300
0,0400
0,0500
0,0600
2002 2003 2004 2005 2006 2007 2008 2009 2010
Av
era
ge
An
nu
al
Fa
ilu
re R
ate
s E
SD
V R
ise
r T
est
s
Year
Average Annual ESDV Riser Tests Failure Rate for Installations Built Before
and After 2000
Average Annual Failure Rate ESDV
Riser - Instal lations Bui lt Before 2000
Average Annual Failure Rate ESDV
Riser - Instal lations Bui lt in or After
2000
Lineær (Average Annual Failure Rate
ESDV Riser - Installations Built Before
2000)
Poly. (Average Annual Fai lure Rate
ESDV Riser - Installations Built Before
2000)
Lineær (Average Annual Failure Rate
ESDV Riser - Installations Built in or
After 2000)
Poly. (Average Annual Fai lure Rate
ESDV Riser - Installations Built in or
After 2000)
Graph 7.10a Annual Average Riser ESDV Failure Rates 2002-2010 –
Installations built Before 2000 (blue) and After (red) Graph 7.10a is the same as Graph 5.6a, but the 3-period moving averages have been replaced by two different trend-lines, one linear and one 2nd-Order polynomial for each group. The R2 values are superimposed on the graph. The R2 value is just 0.001 for the straight blue line and 0.01 for the blue 2nd-Order polynomial line. The trend for riser ESDV failure rates on pre-2000 installations therefore appears to indicate a more or less flat rate, excepting a sharp spike in 2009. The R2 value for the straight red line is just 0.001, and the 2nd-Order polynomial fit is only 0.06 so, again, it is difficult to identify any clear trends. In 2006 and 2008, the annual average failure rate was zero (0) on post-2000 installations. Barring the sharp spike in 2007, the chart appears to indicate unchanging failure rates for these installations. The average of the annual average failure rates for pre-2000 installations is 0.023, while it is 0.011 for those built later. Even though the average for pre-2000 installations is double that of the post-2000 installations, this difference is still not statistically significant at the 5% level, due to the large standard deviations. However, the p-value is 0.11, so it is nearly significant at 10% level.

Investigation into Development of Safety Levels on Norwegian Installations in the North Sea Post-1990
Annelise Baillie 96
Graph 7.10b shows the same as 7.9a, but with 4 outliers removed: three with failure rates of 0.5 (one installation built in 1976, one in 1989, and one in 2002); and one in 2009 from an installation built in 1978 (failing 1 in 1 test).
R² = 4E-05
R² = 0,0159
R² = 0,1712
R² = 0,3876
0,0000
0,0100
0,0200
0,0300
0,0400
0,0500
2002 2003 2004 2005 2006 2007 2008 2009 2010
Av
era
ge
An
nu
al
Fa
ilu
re R
ate
s E
SDV
Ris
er
Test
s
Year
Average Annual ESDV Riser Tests Failure Rate for Installations Built Before
and After 2000
Average Annual Failure Rate ESDV
Riser - Instal lations Built Before 2000
Average Annual Failure Rate ESDV
Riser - Instal lations Built in or After
2000
Lineær (Average Annual Failure Rate
ESDV Riser - Installations Bui lt Before
2000)
Poly. (Average Annual Fai lure Rate
ESDV Riser - Installations Bui lt Before
2000)
Lineær (Average Annual Failure Rate
ESDV Riser - Installations Bui lt in or
After 2000)
Poly. (Average Annual Fai lure Rate
ESDV Riser - Installations Bui lt in or
After 2000)
Graph 7.10b Annual Average Riser ESDV Failure Rates 2002-2010 –
Installations built Before 2000 (blue) and After (red) – Outliers 0.5 or greater removed
Graph 7.10b shows that when the 4 outliers are removed, the underlying trend for post-2000 installations becomes much clearer (several years with zero failure rate, followed by increases in the last 2 years), and the difference between pre- and post-2000 installations becomes even more apparent. For pre-2000 installations, there is no real downward trend and the difference in the averages is 0.015. The R2-value for pre-2000 installations reduces to practically 0. The R2-value for the polynomial red line (post-2000 installations) increases from 0.06 to 0.38, but this is still not a good correlation. With outliers removed, the new average annual failure rate is 0.018 for pre-2000 installations and 0.005 for those built later, and the standard deviations are small enough that this 270% difference is statistically significant at 5%-level (p-value is 0.002!).

Investigation into Development of Safety Levels on Norwegian Installations in the North Sea Post-1990
Annelise Baillie 97
Graph 7.11 shows the annual average failure rate for Christmas Tree tests carried out on installations built before and after 2000.
R² = 0,101 R² = 0,3796
R² = 0,0779
R² = 0,1173
0,0000
0,0050
0,0100
0,0150
0,0200
0,0250
2002 2003 2004 2005 2006 2007 2008 2009 2010
Av
era
ge
An
nu
al
Fa
ilu
re R
ate
s C
hri
stm
as
Tre
e T
est
Year
Annual Average Christmas Tree Failure Rate for Installations Built
Before and After 2000
Average Fai lure Rate per Installation
per Year - Instal lations Built Before
2000
Average Fai lure Rate per Installation
per Year - Instal lations Built in or After
2000
Lineær (Average Failure Rate per
Installation per Year - Instal lations
Built Before 2000)
Poly. (Average Failure Rate per
Installation per Year - Instal lations
Built Before 2000)
Lineær (Average Failure Rate per
Installation per Year - Instal lations
Built in or After 2000)
Graph 7.11 Annual Average Christmas tree Failure Rates 2002-2010 –
Installations Built Before 2000 (blue) and After (red) Graph 7.11 is the same as Graph 5.8a, but the 3-period moving averages have been replaced by two different trend-lines, one linear and one 2nd-Order polynomial for each group. The R2 values are superimposed on the graph. The R2 value for the straight blue line is just 0.10, which is very poor, but the 2nd-Order polynomial fit is a bit better, at 0.38. The trend for gas detection failure rates on pre-2000 installations therefore appears to indicate a maximum in 2005, with relatively consistent decreases since then. The R2 value for the straight red line is just 0.08, and the 2nd-Order polynomial fit is only 0.11 so it is difficult to identify any clear trends. 2008 and 2009 saw high average failure rates on post-2000 installations, but there was a sharp decrease in 2010. It therefore remains to be seen if future years show further reduction or an upward trend. The average annual failure rate is 0.0116 for pre-2000 installations and 0.0078 for those built later, but the standard deviations are so large that this 50% difference is not statistically significant at 5%-level (p-value is 0.21). Removing the outliers >0.15 has only marginal effects on the trends for Christmas Tree failure rates, as there were only 2 outliers, both from pre-2000 installations, and they took place in 2003 and 2004. The effect is to reduce the average for pre-2000 installations to 0.0102, which reduces the difference between the averages to 30%. The R2-values for both blue (pre-2000 installations) are reduced, so the fit is reduced, and the linear blue line flattens, indicating less of a downward trend. With outliers removed, the new average annual failure rate is 0.0102 for pre-2000 installations and 0.0078 for those built later, but the standard deviations
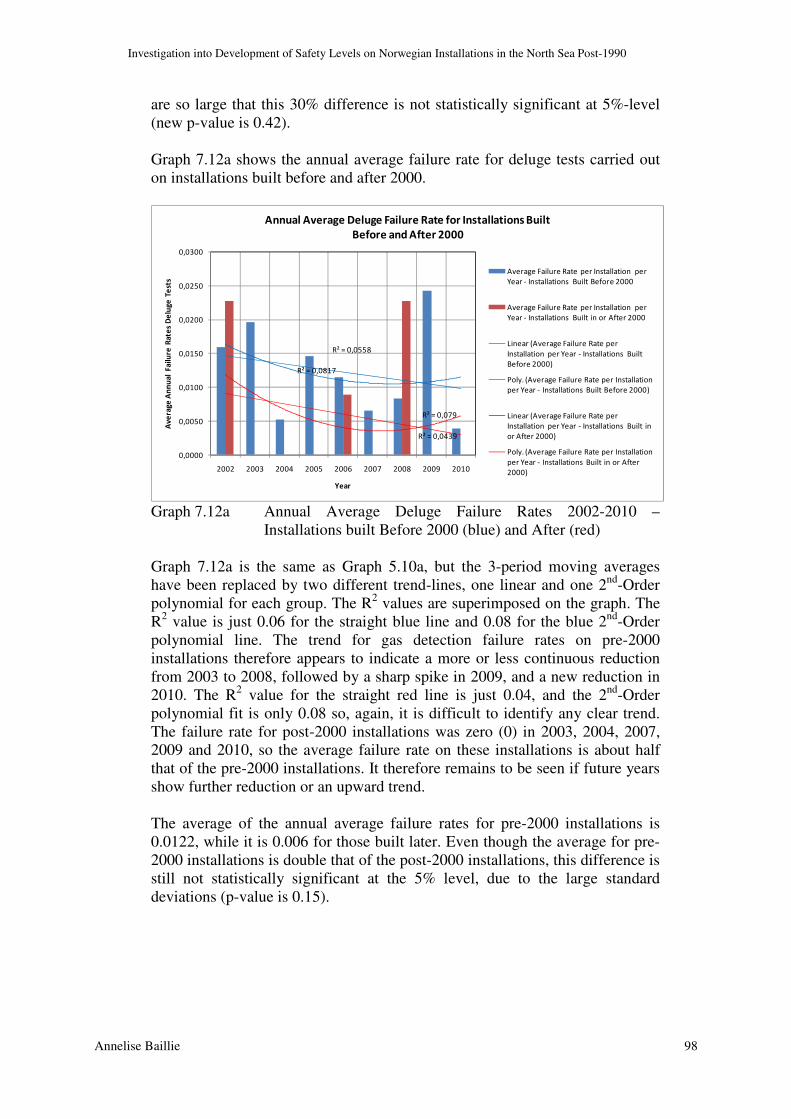
Investigation into Development of Safety Levels on Norwegian Installations in the North Sea Post-1990
Annelise Baillie 98
are so large that this 30% difference is not statistically significant at 5%-level (new p-value is 0.42). Graph 7.12a shows the annual average failure rate for deluge tests carried out on installations built before and after 2000.
R² = 0,0558
R² = 0,0817
R² = 0,0439
R² = 0,079
0,0000
0,0050
0,0100
0,0150
0,0200
0,0250
0,0300
2002 2003 2004 2005 2006 2007 2008 2009 2010
Av
era
ge
An
nu
al
Fa
ilu
re R
ate
s D
elu
ge
Te
sts
Year
Annual Average Deluge Failure Rate for Installations Built
Before and After 2000
Average Failure Rate per Installation per
Year - Installations Built Before 2000
Average Failure Rate per Installation per
Year - Installations Built in or After 2000
Linear (Average Failure Rate per
Installation per Year - Installations Built
Before 2000)
Poly. (Average Failure Rate per Installation
per Year - Installations Built Before 2000)
Linear (Average Failure Rate per
Installation per Year - Installations Built in
or After 2000)
Poly. (Average Failure Rate per Installation
per Year - Installations Built in or After
2000)
Graph 7.12a Annual Average Deluge Failure Rates 2002-2010 –
Installations built Before 2000 (blue) and After (red) Graph 7.12a is the same as Graph 5.10a, but the 3-period moving averages have been replaced by two different trend-lines, one linear and one 2nd-Order polynomial for each group. The R2 values are superimposed on the graph. The R2 value is just 0.06 for the straight blue line and 0.08 for the blue 2nd-Order polynomial line. The trend for gas detection failure rates on pre-2000 installations therefore appears to indicate a more or less continuous reduction from 2003 to 2008, followed by a sharp spike in 2009, and a new reduction in 2010. The R2 value for the straight red line is just 0.04, and the 2nd-Order polynomial fit is only 0.08 so, again, it is difficult to identify any clear trend. The failure rate for post-2000 installations was zero (0) in 2003, 2004, 2007, 2009 and 2010, so the average failure rate on these installations is about half that of the pre-2000 installations. It therefore remains to be seen if future years show further reduction or an upward trend. The average of the annual average failure rates for pre-2000 installations is 0.0122, while it is 0.006 for those built later. Even though the average for pre-2000 installations is double that of the post-2000 installations, this difference is still not statistically significant at the 5% level, due to the large standard deviations (p-value is 0.15).

Investigation into Development of Safety Levels on Norwegian Installations in the North Sea Post-1990
Annelise Baillie 99
Graph 7.12b shows the same as 7.11a, but with the 5 outliers with failure rates >0.2 removed.
R² = 0,6014
R² = 0,7129
R² = 0,2841R² = 0,44
0,0000
0,0050
0,0100
0,0150
0,0200
0,0250
2002 2003 2004 2005 2006 2007 2008 2009 2010
Av
era
ge
An
nu
al
Fa
ilure
Ra
tes
De
lug
e T
est
s
Year
Annual Average Deluge Failure Rate for Installations Built
Before and After 2000
Average Failure Rate per Installation per
Year - Installations Built Before 2000
Average Failure Rate per Installation per
Year - Installations Built in or After 2000
Linear (Average Failure Rate per
Installation per Year - Installations Built
Before 2000)
Poly. (Average Failure Rate per Installation
per Year - Installations Built Before 2000)
Linear (Average Failure Rate per
Installation per Year - Installations Built in
or After 2000)
Poly. (Average Failure Rate per Installation
per Year - Installations Built in or After
2000)
Graph 7.12b Average Annual Deluge Test Failure Rates for Tests 2002-2010,
for Installations Built Before 2000 (blue) and after (red) - Outliers >0.2 Removed
Graph 7.12b is the same as Graph 5.10a, but with the 5 outliers removed. Removing these outliers has a huge effect on the trend-lines and correlation. The underlying trends are shown to be clearly downward for both pre- and post-2000 installation. The R2-value for the blue linear trend-line (pre-2000 installations) improves from 0.06 to 0.6, a 10-fold increase, and the R2-value for the blue polynomial line improves from 0.08 to 0.71, which shows that the real trend for these installations has been a strong reduction until about 2006, followed by a flattening-out. The R2-value for the red linear trend-line (pre-2000 installations) improves from 0.04 to 0.28, a 7-fold increase, and the R2-value for the red polynomial line improves from 0.08 to 0.44, which shows that the real trend for these installations has been a strong reduction over the decade, with several years having a zero failure rate on deluge tests. The new average of the annual average failure rates for pre-2000 installations is 0.008, while it is 0.0035 for those built later. Even though the average for pre-2000 installations is double that of the post-2000 installations, this difference is still not statistically significant at the 5% level, due to the large standard deviations (p-value is 0.17).

Investigation into Development of Safety Levels on Norwegian Installations in the North Sea Post-1990
Annelise Baillie 100
8. DISCUSSION
8.1. Introduction
The working hypothesis given in the Abstract (see Section 1) was the contention that installations built after the new regulations came in 2000, are inherently safer than the ones built before. This requires us to examine the concept of ‘safe’. What makes an installation safe, and which parameters make one installation safer than another one? Hydrocarbon leaks is one obvious parameter for determining the ‘safeness’ of a platform, and this is further discussed in detail in Section 8.4. The criticality of leaks is related to their risk of ignition. Ignition can have serious consequences, including smoke development, fire and explosions, endangering many lives and the installation itself. Therefore, we consider high numbers of leaks on an installation to denote lower levels of safety. The ideal is zero leaks, as the likelihood of ignition without leaks is effectively negligible. Leaks alone do not determine how safe an installation is. The layout of the platform is also important. If a leak is ignited, the layout has a huge influence on the likelihood, severity and chronology of the consequences. This is discussed further in Section 8.3. As we have shown in Sections 4, 6 and 7, there are other lagging indicators that affect the safety of an installation, and they are further discussed in detail in Section 8.5. Well-kicks, fires and explosions due to other causes than leaks (including poor maintenance), field vessel collisions and structural damage and fatigue all contribute to the safety, or lack thereof, of an installation, but the actual number of fatalities caused by these events has been zero in the past 15 years, and their total contribution to risk can therefore be considered small by comparison. The third main safety parameter is barriers. By barriers we mean technical, organizational and human factors and interfaces that prevent or reduce the probability of dangerous occurrences, prevent escalation of events once dangerous occurrence has taken place, or reduce number of fatalities. Barrier systems that function as intended contribute positively to safety. Conversely, barrier systems with high failure rates indicate unreliability, which is associated with lower levels of safety on an installation. This has been examined in detail in Section 5, and the main results are discussed further in Section 8.6. The fourth parameter that greatly affects safety is the reservoir conditions, which is outside the scope of this investigation. It is also a factor over which the operators do not have any control per se, but do have to consider in their design, and manage accordingly. Reservoirs with high initial pressure require process equipment that also has to operate at high pressures, with consequently greater risk of well-kicks. Conversely, low-pressure reservoirs have much lower risk of well-kicks.

Investigation into Development of Safety Levels on Norwegian Installations in the North Sea Post-1990
Annelise Baillie 101
The fifth parameter that affects safety is the regulatory framework, and working environment. This is discussed further in Section 8.2 Section 8.7 discusses all these main parameters in relation to the main hypothesis.
8.2. Regulatory Framework
The Framework Regulations govern the overall management of safety on the NCS, with reference to other laws and regulations. These regulations govern all aspects of Health & Safety, including major hazard risk (primarily related to prevention of fire and explosions), working environment, occupational health, and control of dangerous substances. The other laws and regulations referenced are to the Health Personnel Act, the Patients’ Rights Act, the Health and Social Preparedness Act, the Medicines Act, the Working Environment Act, the Petroleum Act, the Fire and Explosion Protection Act, and the Pollution Act. These acts and regulations are maintained and upheld by the PSA (Petroleum Safety Authority), KLIF (in English: Climate and Pollution Agency) and Helsetilsynet (in English: Norwegian Board of Health Supervision). (The local Health Board in Rogaland county has delegated authority from the Norwegian Board of Health Supervision for health on installation on the NCS.) This investigation has concentrated on safety related to major hazard risk, with particular emphasis on leaks, fires and explosions. Working environment, health and dangerous substances were outside its scope, but clearly also have a bearing on actual and perceived levels of safety. As the following sections show, it has been proven difficult to prove that the new regulations of 2000 have had a decisive influence on the safety with regards to reducing major hazard risk. However, it could still be argued that they have been influential on working environment, pollution risk and health. This is discussed further in Section 8.7.
8.3. Layout of Installations
The location and direction of corridors affect the direction and development of smoke and gas clouds. The prevailing wind direction affects the movement of smoke and gas clouds, and the location of ignition in relation to accommodation area affects the probability of fatalities due to smoke inhalation. However, there have been no ignited leaks on the NCS in the last 19 years, which makes it impossible to statistically assess the contribution to safety from this parameter, for the time period that this investigation covers. As an example, Platform B, from the 1980’s, is a badly laid-out installation, from a modern, more safety-conscious, point of view. The process equipment is spread over the whole installation, with scant regard for the need to keep it in one place, well away from the accommodation area. This was partially the undoing of the Piper Alpha platform in 1989 – once a leak was ignited and caused a fire, the smoke seeped into the accommodation block that was in too close proximity to the leak location.

Investigation into Development of Safety Levels on Norwegian Installations in the North Sea Post-1990
Annelise Baillie 102
Platform C is in many regards similar to Platform B, in terms of type of construction, but built nearly 10 years later. It is more logically laid out, partly due to pressure from the regulating authorities, making the layout safer, which is reflected in its lower FAR value for Process, but, formally speaking, this was long before the new regulations came in 1992. A modern installation, from the late 1990’s, such as Platform E, has the accommodation area in the bow, and the process equipment in the stern, down-wind, so that if there is any smoke, it will be blown away from the accommodation. This contributes to its even lower FAR value. A brand new platform such as Platform A, with the most modern equipment, has the lowest FAR value for Process.
8.4. DFU1&2 – Hydrocarbon Leaks
Graph 8.1 shows the average number of leaks per year for installations built before and after 2000, using 3 methods of comparing: absolute values, normalized by number of million man-hours (the averages from Graph 7.1), and normalized by number of installation years (the averages from Graph 7.2). Note that the averages normalized by man-hours are for the period 2002-2010, as data is not available from before then, while the other columns are for the period 1996-2010.

Investigation into Development of Safety Levels on Norwegian Installations in the North Sea Post-1990
Annelise Baillie 103
0,00
5,00
10,00
15,00
20,00
25,00
No. Of DFU1's per
Year - Absolute
No. Of DFU1's per
Year - Normalised by
No. Of Million Man-
hours
No. Of DFU1's per
Year - Normalised by
No. Of Installation
Years
Av
era
ge
No
. O
f L
ea
ks
pe
r Y
ea
r
Method of Comparing No. Of Leaks
Average No. Of Leaks per Year (1996-2010) for pre-and
post-2000 Installations,
3 Methods of Comparing
Installations Built
in and After
2000 - Average
Installations Built
Before 2000 -
Average
Graph 8.1 No. of Leaks per Year 1996-2010, Absolute Values and
Normalized – Installations Built Before (blue) and after 2000 (red)
Graph 8.1 shows clearly that the method of comparison, and the method of normalization strongly affects the results, to the degree that this determines the answer to the key question: whether or not post-2000 installations have fewer leaks, and can therefore be considered safer than the ones built before. Using absolute values, the number of leaks on pre-2000 installations is nearly 10 times higher, which is clearly statistically significant. However, normalized by the number of million man-hours, the situation is reversed: the number of normalized leaks on post-2000 installations is actually 64% higher than on pre-2000 installations (0.64 vs. 0.39), but this is not statistically significant at the 5% level (p-value of 0.20) because the standard deviation is comparatively large. If normalized by the number of installation years, the number of leaks on post-2000 installations is marginally higher, at 0.3 compared to 0.24 (25% difference) but this is not statistically significant either (p-value of 0.28).

Investigation into Development of Safety Levels on Norwegian Installations in the North Sea Post-1990
Annelise Baillie 104
Since 2001, leaks have been classified into 6 categories, where A is Technical Causes, B and C are Manual Interventions, D is Process, E is Design Failures and F is External. This classification is carried out following a submission of an investigation report by the operator. As reports are not written or not available for many leaks, the known number of leaks with classification is less than the total number of leaks. Checks on the background data have shown that the discrepancies are largest for the early part of the 2000’s, reducing to less than 5 per year in the second half of the decade. As the absolute number of leaks per year for pre-2000 installations is 10-20, the discrepancies are considered small enough to be negligible, when the leak numbers are normalized by the number of installation years. This is not the case for post-2000 installations, because the absolute number of leaks is typically <5 a year and the number of normalizing installation years is low. For example, 2 missing data out of 3 leaks from post-2000 installations in 2005 amounts to 67% of the data missing, while 1 missing data out of 3 leaks in 2001 amounts to 33% of the data missing. In total, there were 28 leaks from post-2000 installations in the period 2001-2010, and 5 of these entries are missing from the classification list. Graph 8.2 shows the % distribution of causes of leaks on installations built before and after 2000.
0 %
10 %
20 %
30 %
40 %
50 %
60 %
70 %
80 %
90 %
100 %
Installations Built Before 2000 Installations Built in or After 2000
% D
istr
ibu
tio
n o
f L
ea
ks
by
IE
% Distribution of Leaks by Initiating Events A-F
- Installations Built Before and After 2000
F - External
E - Design Failures
D - Process
C . Manual
Interventions Imm.
B - Manual
Interventions
A - Technical
Graph 8.2 % of Leaks Caused by Initiating Events A – F. Total for
Period 2001-2010 – Installations Built Before (left) and After 2000 (right)
It would be tempting to assume that a greater percentage of the leaks on post-2000 installations are caused by manual interventions (Initiating Event Causes B and C) than on pre-2000 installations where technical issues might be assumed to dominate. However, Graph 8.2 shows that, as a % of the total,

Investigation into Development of Safety Levels on Norwegian Installations in the North Sea Post-1990
Annelise Baillie 105
installations built before 2000 actually have more leaks caused by manual interventions (B and C) than those built after (60%, as opposed to 50%). This may be attributable to the fact that the average age of personnel on older installations is higher than on the newer ones. Younger personnel, fresh out of technical college, are perhaps more likely to ‘go by the book’ and follow rules to the letter, than more experienced personnel who have carried out the same tasks for years or even decades, and may therefore be more prone to take short-cuts. Another reason is believed to be the fact that many older installations have been subject to extensive re-design and modifications since production start. Too often, such modifications are carried out without adequate tagging of machinery and the new technical/human interfaces, resulting in poor access, confusion and mistakes. For both groups, the proportion caused by Technical Causes (A) is just over 20%, so the post-2000 installations do not appear to have any real advantage. It might also have been natural to assume that post-2000 installations have fewer leaks caused by design failures (E), but this is clearly not the case, either. In fact, it is close to double (22%) the proportion for pre-2000 installations (13%). It is thought that one of the possible reasons for this discrepancy is that the installations built in the 1970’s and ‘80’s were built with much greater design margins. Based on the % distribution of leaks in Graph 8.2 for post-2000 installations, it has been considered reasonable to assume that the 5 missing data divide into 1 from Cause A, 2 from B, 1 from C, and 1 from E. This assumption makes the smallest overall changes to individual percentages. However, without knowing in which year each cause took place, it is not possible to adjust graphs 8.3 and 8.4 to suit, which show the annual variation in normalized number of leaks from Causes B+C and A, respectively. The concern is that, if installations built after 2000 are viewed as inherently safer, in terms of technical barriers, by the people working on them, a culture of complacency may take root, and carelessness may result in connection with manual interventions.

Investigation into Development of Safety Levels on Norwegian Installations in the North Sea Post-1990
Annelise Baillie 106
Graph 8.3 shows the average number of leaks caused by Manual Interventions (Causes B and C) per year for installations built before and after 2000, normalized by number of installation years. This does not include the missing 5 data for post-2000 installations, which would increase the average (horizontal red line) marginally.
R² = 0,1484
R² = 0,1409
0,00
0,02
0,04
0,06
0,08
0,10
0,12
0,14
0,16
0,18
0,20
2001 2002 2003 2004 2005 2006 2007 2008 2009 2010
Le
ak
s R
esu
ltin
g f
rom
Ma
nu
al
Inte
rve
nti
on
s (B
+C
) N
orm
ali
sed
by
No
. o
f
Inst
all
ati
on
Ye
ars
Year
Normalised No. of Leaks per Year Caused by Manual Interventions (Causes B+C) ,
Normalised by No. of Installation Years
(B+C) per Year - Installations Built
Before 2000 /No. Of Installation
Years
(B+C) per Year - Installations Built
in or After 2000 /No. Of
Installation Years
Average (B+C) per Year -
Installations Built Before 2000
/No. Of Installation Years
Average (B+C) per Year -
Installations Built in or After 2000
/No. Of Installation Years
Lineær ((B+C) per Year -
Installations Built Before 2000
/No. Of Installation Years)
Lineær ((B+C) per Year -
Installations Built in or After 2000
/No. Of Installation Years)
0,333
Graph 8.3 No. of Leaks Caused by Manual Interventions (Types B+C)
per Year 2001-2010 Normalized by No. of Installation Years – Installations Built Before (blue) and after 2000 (red)
As Graph 8.3 shows, normalized by the number of installation years, the difference between the averages of the two groups over the 10 years considered (the horizontal blue line and the horizontal red line) is so small as to be negligible. The annual variation for both sets of installations is so large that the R2-value for both linear trend-lines (the sloping red and blue lines) is only about 0.14. The slope for the blue line is very small, suggesting that the normalized number of B and C leaks for pre-2000 installations is hardly reducing with time. This is somewhat concerning, as it suggests that expected learning from past mistakes is either not taking place or at too low a rate. The reduction is considerably more marked for post-2000 installations.

Investigation into Development of Safety Levels on Norwegian Installations in the North Sea Post-1990
Annelise Baillie 107
Graph 8.4 shows the annual number of leaks caused by Technical Causes (Cause A) per year for installations built before and after 2000, normalized by number of installation years. This does not include the missing 5 data for post-2000 installations, which would increase the average (horizontal dotted red line) marginally.
R² = 0,2969
R² = 0,2233
0,0000
0,0250
0,0500
0,0750
0,1000
0,1250
0,1500
0,1750
0,2000
0,2250
2001 2002 2003 2004 2005 2006 2007 2008 2009 2010
No
. O
f L
ea
ks
pe
r Y
ea
r C
au
se A
/ N
o.
Of
Inst
all
ati
on
Y
ea
rs
Year
No. Of Leaks from Cause A (Technical) from Installations Built Before and After 2000, Normalised by
No. Of Installation Years
Cause A Leaks per Year -
Instal lations Built Before 2000
/No. Of Installation Years
Cause A Leaks per Year -
Instal lations Built in or After
2000 /No. Of Instal lation Years
Average No. Cause A Leaks per
Year - Instal lations Built in or
After 2000 /No. Of Instal lation
Years
Average No. Cause A Leaks per
Year - Instal lations Built Before
2000 /No. Of Instal lation Years
Linear Trend-l ine (Cause A Leaks
per Year - Instal lations Built
Before 2000/No. of Instal lation
Years)
Linear Trend-l ine (Cause A Leaks
per Year - Instal lations Built in or
After 2000/No. of Instal lation
Years)
Graph 8.4 No. of Leaks Caused by Initiating Event A (Technical
Causes), Normalized by No. of Installation Years for Period 2001-2010 – Installations Built Before (blue) and After 2000 (red)
Graph 8.2 indicated that approximately 22% of leaks on post-2000 installations were caused by Technical Causes (A) in the 10-year period considered. However this figure is somewhat misleading, because the number of such leaks was high in the early 2000’s due to a number of teething problems on one particular installation, but there has been a strong downward trend, as the red sloping line on Graph 7.4 shows. The red sloping line shows the linear trend-line for the post-2000 installations, while the blue sloping line shows the linear trend-line for the pre-2000 installations. The two horizontal dotted lines show the average number of normalized leaks from Cause A for the pre-2000 (blue) and post-2000 (red) installations. In 7 out of the last 10 years, there was no Cause A leaks on post-2000 installations, unless 1 of the missing 5 data was a Cause A. There has also been a downward trend in Cause A leaks on pre-2000 installations (blue trend-line), but this is less marked. The R2-values for both trend-lines are less than 0.3, which classifies them as rather poor. When determining whether post-2000 installations are safer, an investigation has been made into whether there is any correlation between the FAR value for Process Accidents given in the QRA’s and the actual number of leaks per year.

Investigation into Development of Safety Levels on Norwegian Installations in the North Sea Post-1990
Annelise Baillie 108
Graph 8.5 shows the average number of leaks per year for the 8 installations described in Section 5. For those built before 1996, the total number of leaks up to 2010 are those from 1996-2010 divided by 15. For those built later, the number of leaks is divided by number of production years.
A
B
C
D
E
F
E
R² = 0,05
R² = 0,1121
0
0,2
0,4
0,6
0,8
1
1,2
1,4
1,6
1,8
2
0,00 1,00 2,00 3,00 4,00 5,00 6,00
No
. O
f D
FU
1&
2 p
er
Ye
ar
>0
.1k
g/
s
FAR Value Process (QRA)
No. Of DFU1's per Year > 0.1kg/s - calculated from 1996 or Start of
Production, whichever more recent
No. Of DFU1's per Year > 0.1kg/s
Lineær (No. Of DFU1's per Year >
0.1kg/s)
Poly. (No. Of DFU1's per Year >
0.1kg/s)
Graph 8.5 Average No. of Leaks per Year 1996/Production start-2010
for Installations A – G (H excluded due to lack of FAR Values)
If the sample of installations in Section 5 is representative, there appears to be little correlation between calculated Process FAR value and average number of DFU 1&2 per year. In particular, Platform F is something of an anomaly, with similar FAR to E and D, but 6 times the number of leaks! The R2 values for both the fitted straight line (0.05) and the 2nd Order polynomial (0.11) are very low, due to the large variation in results. However, from the slope and direction of the straight line, Graph 8.5 indicates a very slight tendency to increasing average number of leaks per year with increasing FAR for Process.
8.5. Other Lagging Indicators
For the other lagging indicators, Section 7.1 shows a mixed picture. In terms of well-kicks (DFU 3), fires (DFU 4), field vessel collisions (DFU 7) and structural damage (DFU 8) Graphs 7.3 - 7.6 all indicate that post-2000 installations have fewer of these events than pre-2000 installations. Overall (with few exceptions), this is true both in absolute terms, and normalized by the number of installation years. However, the low number of well-kicks on post-2000 production installations (0 in 7 out of 11 years considered, as shown on Graph 7.3) is balanced by increasing numbers on mobile rigs (Graph 4.5), so that the overall risk of well-kicks is not reduced. Graph 4.6 further demonstrated that there is an increased tendency to well-kicks during production drilling when mobile rigs are used for this rather than production platforms. Hence mobile rigs are being increasingly

Investigation into Development of Safety Levels on Norwegian Installations in the North Sea Post-1990
Annelise Baillie 109
used to transfer the risk of well-kicks away from the newer production installations. With regards to minor fires (DFU 4), one post-2000 installation had an abnormally high number of these, resulting in the high normalized values for the red points on Graph 7.4. This questions the general assumption that these installations are inherently safer, although it is known that this particular installation had a large number of teething problems. Overall, it does not appear to be representative. For ships on collision course (DFU 5), no correlation was expected to be found between age of installation and event frequency, and this was proven correct. For drifting objects (DFU 6), and damage to risers/pipelines (DFU’s 9 and 10), the number of events both per year and in total is too small to draw any definite conclusions, but the existing data for these DFU’s do not indicate that post-2000 installations are any safer.
8.6. Leading Indicators
In terms of leading indicators, Section 7.2 and Graph 8.6 also show a mixed picture.
0,0000
0,0050
0,0100
0,0150
0,0200
0,0250
Ga
s D
ete
cti
on
Ga
s D
ete
cti
on
wit
ho
ut
Ou
tlie
rs
ES
DV
Ris
er
ESD
V R
ise
r w
ith
ou
t O
utl
iers
Ch
ris
tma
s T
ree
Ch
rist
ma
s T
ree
wit
ho
ut
Ou
tlie
rs
Del
ug
e
Del
ug
e w
ith
ou
t O
utl
iers
Fir
e D
ete
ctio
n
Fir
e D
ete
cti
on
wit
ho
ut
Ou
tlie
rs
Av
era
ge
Fai
lure
Rat
e
Leading Indicator
Failure Rate for 5 Leading Indicators, Averaged over Period 2002-2010, With and Without
Outliers
Installations Built
Before 2000 - Average
Installations Built in
and After 2000 -
Average
Graph 8.6 Average Failure Rate Leading Indicators – Period 2002-2010
– for Installations Built Before 2000 (blue) and after (red) The average failure rates for Fire Detection, Gas Detection and Christmas tree tests show only marginal differences between pre- and post-2000 installations, which are not statistically significant. For Riser ESDV and Deluge tests, the average failure rates for post-2000 installations are about half that of the installations built before 2000, but these are still not statistically significant. The differences between pre- and post-2000 installations are statistically significant at 5% level for Gas Detection without Outliers (outliers with failure

Investigation into Development of Safety Levels on Norwegian Installations in the North Sea Post-1990
Annelise Baillie 110
rates >0.1 removed) and ESDV Riser without Outliers (outliers with failure rates >0.4 removed). The differences between pre- and post-2000 installations are statistically significant at 8% level for Fire Detection without Outliers (outliers with failure rates >0.06 removed), and at 11% level for ESDV Riser (no outliers removed).
8.7. Final Discussion of Main Hypothesis
As the previous sections have shown, using classical hypothesis testing to test whether post-2000 installations are safer than those built before is not a straight-forward matter, and may even have limited value, for two reasons. The first is that such testing requires almost limitless amount of data, which real oil and gas installations in the real world do not have. The second is that classical hypothesis testing assumes that there is a true, real level of risk that we are trying to ascertain. In practice, and as Bayesian theory advocates, the level of risk, if this can indeed be measured by the lagging and leading indicators, is changing continuously, and actually varies considerably from year to year. There may be a true risk in any one year, but this is still no more than a snap-shot in time. Average values have been calculated for leaks and the selected barrier failure rates, but, as we have seen, these averages do not capture well either the annual variations, or the major trends. Incident data were generally (with some exceptions) available for a 15-year period. There are so many leaks and well-kicks per year that the total volume of leak and well-kick data can be considered to be adequate for classical statistical analyses to be carried out, and the results can be considered fairly reliable. However, the volume per year, and in total, is low for several of the other lagging indicators, particularly fires, drifting objects, field vessel collisions, and incidents of structural damage, so fewer statistical analyses have been carried out on these, and it would be prudent not to draw firm conclusions about safety levels from them. In particular, the data on fires on post-2000 installations was shown in Section 4 to be unrepresentative, as all 4 of such fires were from a single installation. Barrier data were only available for a 9-year period. In the view of the authors, the volume of barrier data is large enough to be adequate for pre-2000 installations, but is probably too small for the post-2000 installations (since there are so few of them) to make definite judgments about averages and trends for this group. However, it would have been desirable to have data for both for a longer period, such as 20 years. In addition, this investigation has not covered personal injuries, as we have not had access to the data on injuries per million man-hours. This is another important aspect of safety, which could have been useful to have available, as it would have nuanced the picture. Although some of the lagging and leading indicators give strong evidence in favour of post-2000 installations being safer, this is by no means the case for all indicators, so it is not possible to prove the hypothesis. This may mean that the regulatory framework has not had a decisive influence on all aspects of safety. Indeed, it is possible that the work on the PSA, in terms of follow-up, guidance, reporting and high-level instructions, has had more influence than
Investigation into Development of Safety Levels on Norwegian Installations in the North Sea Post-1990
Annelise Baillie 111
the regulations themselves. The annual RNNP reports have given the industry a better overview over the safety issues and challenges, and perhaps more incentive to reduce leaks, well-kicks and other lagging indicators. In this respect, the reports have been a driving force for positive change. Additionally, the PSA functions as an approval body. There have been instances where platform concepts copied from existing platforms that have been submitted for approval and have been rejected because the existing ones had weaknesses. By forcing through re-designs, the PSA has compelled the industry to consider and submit new concepts with better and safer layouts. However, as stated in Section 8.2, there have been no ignited leaks on installations on the NCS since 1992. In the British sector, there is approximately 1 ignited leak every other year, but the volume of leaks is much lower. If there had been a similar number of ignited leaks on Norwegian installations in the period this investigation considers, we would have had smoke development, and it may have been possible to make an assessment of whether better layout on newer platforms has improved safety levels.
Section 4.1 showed that, barring the Brønnøysund helicopter accident in 1997, the vast majority of fatal accidents on the NCS in the last 15 years have been occupational accidents, or lifting accidents (which can be considered a form of occupational hazard). It is probably for this reason that the major trend among the operators has been to focus on education and training of staff in order to reduce such fatalities and injuries, and improve working environment. Less effort, at least from the point of view of the regulating authorities, has been made on improving the technical aspects of the installations and the user interfaces. However, this investigation has concentrated on major hazard risks, and occupational accidents were strictly speaking, outside its scope. This training, and Behaviour Based Safety-schemes alone, could account for some of the downward trends in leaks, other DFU’s and some of the leading indicators. As some of these trends have been shown to have turned back upwards in the past 3 years, it could indicate that such schemes have short-lived effect. It is also possible that the merger in 2007 between two major operators on the NCS, having different organizational cultures and structures, may have contributed negatively to the levels of safety in terms of lagging indicators, particularly the number of leaks and well-kicks as both have increased from 2007 to 2010. It is, however, noteworthy that the last major accident with fatalities on the NCS was in 1985. Since then, the only fatalities have been from occupational accidents. This implies that a large number of old (in this sense, 30-40 years) installations have operated without major accidents for 25 years even though the statistics would suggest that they have more dangerous occurrences than the newest ones. This fact also suggests that improvements in education, training and working environment have had a greater influence than the regulations. In order to verify this, a check has been made on the number of normalized leaks per year on platforms built before and after 1992, when 14 new regulations were introduced. Graph 7.7 in Section 7 showed that both groups of platforms have shown marked reductions since 1996, notwithstanding the small increases again in

Investigation into Development of Safety Levels on Norwegian Installations in the North Sea Post-1990
Annelise Baillie 112
2007-2010, but the reduction is far more consistent for the installations built before 1992. This indicates that concerted effort has been made over the last 10-15 years, but the reductions have ceased, which appear to coincide with the aforementioned merger. Graph 8.7 shows the average number of leaks per year for installations built before and after 1992, using the same 3 methods of comparing as in Section 8.3 for installations built before and after 2000: absolute values, normalized by number of million man-hours (the averages from spreadsheet - not included), and normalized by number of installation years (the averages from Graph 7.7). Note that the averages normalized by man-hours are for the period 2002-2010, as data is not available from before then, while the other columns are for the period 1996-2010.
0,00
2,00
4,00
6,00
8,00
10,00
12,00
14,00
No. Of DFU1's per
Year - Absolute
No. Of DFU1's per
Year - Normalised by
No. Of Mill ion Man-
hours
No. Of DFU1's per
Year - Normalised by
No. Of Installation
Years
Av
era
ge
No
. O
f Le
aks
pe
r Y
ea
r
Method of Comparing No. Of Leaks
Average No. Of Leaks per Year (1996-2010) for
pre-and post-1992 Installations,
3 Methods of Comparing
Instal lations
Bui lt in and
After 1992 -
Average
Instal lations
Bui lt Before
1992 -
Average
Graph 8.7 No. of Leaks per Year 1996-2010, Absolute Values and
Normalized – Installations Built Before (blue) and after 1992 (red)
Graph 8.7 shows that the method of comparison, and the method of normalization, changes the results significantly, when the dividing year is 1992. It shows that installations built after 1992 do not have fewer leaks than those built before. In fact the figure suggests the opposite, although the differences are only marginal. Using absolute values, the number of leaks on
Investigation into Development of Safety Levels on Norwegian Installations in the North Sea Post-1990
Annelise Baillie 113
post-1992 installations is very slightly higher (12.2 vs. 11.9), which is clearly not statistically significant (p-value of 0.63). Normalized by the number of million man-hours, the situation is the same: the number of normalized leaks on post-1992 installations is actually 41% higher than on pre-1992 installations (0.49 vs. 0.36), but this is not statistically significant at the 5% level either (p-value of 0.42) because the standard deviations are comparatively large. If normalized by the number of installation years, the number of leaks on post-1992 installations is also higher, at 0.35 compared to 0.20 (75% difference) but this is not statistically significant either (p-value of 0.11). Graphs 7.7 and 8.7 show that, when normalized by the number of installation years, platforms built after 1992 actually have more leaks than the ones built before, even in absolute terms. By comparison, graph 8.1 showed that installations built after 2000 have much fewer leaks in absolute terms, and only marginally more leaks when normalized, than the ones built before. This is a somewhat unexpected result, but the physical interpretation of this is that in reality, the largest proportion of the leaks from the platforms built after 1992 are actually from installations built between 1992 and 2000. This is clearly verified by Graph 4.1, and confirms that the year 2000 is a much more meaningful dividing year.
Investigation into Development of Safety Levels on Norwegian Installations in the North Sea Post-1990
Annelise Baillie 114
9. CONCLUSIONS
This investigation has attempted to employ classical hypothesis testing to test whether installations built in or after 2000 are safer than those built before that, under different regulations. To this end, statistics on lagging indicators (accidents and incidents), normalized by number of installation years, and on the most important leading indicators (barrier test failure rates) have been presented and discussed, in terms of the obvious trends, and the differences between the two groups of data. The most important major hazard risk lagging indicator is hydrocarbon leaks, because it has the greatest potential for serious consequences with several fatalities, including major fires and explosion. This study has not found any statistically significant differences between pre- and post-200 installations, when the results are normalized by the number of installation years or by million man-hours. In fact, the figures are marginally higher for post-2000 installations. There was a strong reduction in the normalized number of leaks from 1996 until about 2007, but there has been an increase in the past 3 years. For other lagging indicators, the investigation has shown that post-2000 installations, overall, have fewer well-kicks, minor fires, field vessel collisions and structural damage events. There is insufficient data to determine if they experience less drifting objects or have fewer leaks from or damage to risers and pipelines. For ships on collision course, there is, not unexpectedly, no difference between the two groups. Normalized by the number of installation years, the last 15 years has seen a downward trend in the number of well-kicks on production installations, minor fires and field vessel collisions, but not for ships on collision course or structural damage. For barrier test failure rate data (leading indicators), the investigation has proved statistically significant differences between pre- and post-2000 installations for gas detection and ESDV riser, when certain outliers have been removed. For fire detection, Christmas tree and deluge tests, the differences between the two groups are substantial, but not statistically significant. For gas detection and deluge tests, the failure rates for both groups are on a clear downward trend, but this is not the case for fire detection (where the positive downward trend turned around 2007), or for Christmas tree or ESDV riser tests, where the failure rates have remained largely unchanged. In conclusion, it has not been possible to prove that post-2000 installations are significantly safer than those built before, even though some indicators point that way.

Investigation into Development of Safety Levels on Norwegian Installations in the North Sea Post-1990
Annelise Baillie 115
10. REFERENCES
1. Vinnem, J.E., 2007. Offshore Risk Assessment. 2nd Ed. The Netherlands:
Springer Academic Publishers. 2. Aven, T., 2003. Foundations of Risk Analysis. Chichester: John Wiley & Sons. 3. Petroleumstilsynet, 2010. RNNP Sammendragsrapport 2009, Stavanger:
Petroleumstilsynet. 4. Tharaldsen, J.E., Olsen, E., Rundmo, T., 2007. A Longitudinal Study of Safety
Climate on the Norwegian Continental Shelf. Safety Science [e-journal] 46 (427-439) Available through: ScienceDirect database [Accessed 20-12-10].
5. Vinnem, J.E., Aven, T., 2004. On the Use of Risk Acceptance Criteria in the Offshore Oil and Gas Industry. Reliability Engineering and System Safety [e-journal] 90 (15-24) Available through: ScienceDirect database [Accessed 20-12-10].
6. Høivik, D., Tharaldsen, J.E., Baste, V., Moen, B.E., 2009. What is most Important for Safety Climate: The Company Belonging or the Local Working Environment? – A Study from the Norwegian Offshore Industry. Safety Science [e-journal] 47 (1324-1331) Available through: ScienceDirect database [Accessed 20-12-10].
7. Tharaldsen, J.E., Mearns, K.J., Knudsen, K., 2009. Perspectives on Safety: The Impact of Group Membership, Work Factors and Trust on Safety Performance in the UK and Norwegian Drilling Company Employees. Safety Science [e-journal] 48 (1062-1072) Available through: ScienceDirect database [Accessed 20-12-10].
8. Vinnem, J.E., Tveit, O.J., Aven, T., Ravnås, E., 2002. Use of Risk Indicators to Monitor Trends in Major Hazard Risk on a National Level. In: ESREL
(European Safety and Reliability) Conference Proceedings. France 2002.
9. Confidential Risk Analyses for anonymized platforms, with kind permission from Petroleumstilsynet (the Norwegian Petroleum Safety Authority).
10. Vinnem, J.E., 2009. Risk Indicators for Major Hazards on Offshore Installations. Safety Science [e-journal] 48 (770-787) Available through: ScienceDirect database [Accessed 04-01-11].
11. Vinnem, J.E., 2008. On the Risk to Personnel. In: PSAM (Probabilistic Safety Assessment & Management) 9th
Conference. Hong Kong May 2008. 12. Kaiser, M.J., 2006. World Offshore Energy Loss Statistics. Energy Policy [e-
journal] 35 (3496-3525) Available through: Elsevier.com/locate/enpol [Accessed 06-01-11].
13. Smith, E.J., 1995. Risk Management in the North Sea Offshore Industry: History, Status and Challenges. Safety Science [e-journal] Available through: ScienceDirect database [Accessed 08-01-11].
14. Ryggvik, H., 2008. Adferd, teknologi og system – en sikkerhetshistorie. 1st Ed. Trondheim: Tapir Akademisk Forlag.
15. Vinnem, J.E., Hestad, J.A., Kvaløy, J.T., Skogdalen, J.E., 2010. Analysis of Root Causes of Major Hazard Precursors (hydrocarbon leaks) in the Norwegian offshore petroleum industry. Reliability Engineering and System Safety [e-journal] 95 (1142-1153) Available through: ScienceDirect database [Accessed 20-01-11].
16. Wikipedia, 2010. Katastrofer og store ulykker I norsk petroleumsvirksomhet. [online] Available at: http://no.wikipedia.org/wiki/Katastrofer_og_store_ulykker_i_norsk_petroleumsvirksomhet [Accessed 09-03-11].

Investigation into Development of Safety Levels on Norwegian Installations in the North Sea Post-1990
Annelise Baillie 116
17. Standard Norge, 2009. Z-013 (Draft). Risk and Emergency Preparedness
Assessment. Rev. 3, December 2009. Oslo: Norwegian Technology Centre.
Investigation into Development of Safety Levels on Norwegian Installations in the North Sea Post-1990
Annelise Baillie 117
11. APPENDICES

Investigation into Development of Safety Levels on Norwegian Installations in the North Sea Post-1990
Annelise Baillie 118
11.1. Appendix A: Assumptions for Risk Analysis of Platform A
• Explosion analysis based on separate document (not included)
• Personnel distribution per are based on separate document (not included)
• Two future modules with process equipment, allowed for in QRA and included in calculations
• Risk calculations for vessel collisions and offloading based on separate reports by two separate consultants (not included)
• Assumed 104 supply vessel visits per year
• Assumed approach speed 16 knots
• Assumed 6500t supply vessel displacement
• 1 dedicated stand-by vessel available
• Assumed 55 shuttle tanker visits per year
• Dispersion analysis based on separate document for explosion assessment (not included)
• Geometry model based on PDMS model
• Winterization shield based on drawings
• Gas composition: 80% methane, 15% propane, 2% butane and 3% CO
• Two leak rates used in simulation: 20kg/s and 50kg/s
• Process assumed depressurised to 6.9barg within 15minutes
• Assumed 3minutes blowdown delay
• No hotworks on installation
• Routing of crude from pumps to main deck will be within cargo tanks, not through central shaft
• One gas detector per 20m2 deck area
• 2 production import flexible risers
• 2 future production import flexible risers
• 1 gas injection flexible riser
• 1 future gas injection flexible riser
• Leak sources are flanges, process piping and ESD valves
• All leaks in riser are assumed to be fed by risers
• Maximum 4 lifts per year greater than 17tonnes
• Only 1 platform crane operating at any one time
• Restricted lifting over utility riser sector
• No lifting over production riser sector

Investigation into Development of Safety Levels on Norwegian Installations in the North Sea Post-1990
Annelise Baillie 119
11.2. Appendix B: Assumptions for Risk Analysis of Platform B
• Assumptions listed in an attachment (not included in risk analysis):
• Design assumptions: � Explosion barriers � ventilation
• Technical assumptions: � Process data � Blowout rates
• Operational assumptions: � Drilling and well operations � Helicopter traffic � Reliability of safety critical systems � Lifting patterns and activity level
• Analytical assumptions: � Presence of personnel at accidents � How efficiently personnel will evacuate in the event of an
emergency � Frequency of process leaks based on experience data from this
installation and also data from British sector, which in total over-estimates future leak frequencies
• Manning level: � 204 in 2004 � 225 in 2006-7 � 175 in 2008-9 � 47 in later phase
• Leak frequency of: � 1.16/year in 2004 � 1.31/year in installation phase � 1.22/year in later phase
• Mechanical ventilation
• Frequency of ignited leakage 0.015/year
• Manual reaction time of 5 minutes.
Investigation into Development of Safety Levels on Norwegian Installations in the North Sea Post-1990
Annelise Baillie 120
11.3. Appendix C: Assumptions for Risk Analysis of Platform C
• Assumptions listed in an attachment (not included in risk analysis):
• Design assumptions: � Explosion barriers � ventilation
• Technical assumptions: � Process data � Blowout rates
• Operational assumptions: � Drilling and well operations � Helicopter traffic � Reliability of safety critical systems � Lifting patterns and activity level
• Analytical assumptions: � Presence of personnel at accidents � How efficiently personnel will evacuate in the event of an
emergency � Frequency of process leaks based on experience data from this
installation and also data from British sector, which in total over-estimates future leak frequencies
• Manning level: � 253 in 2004 � 275 in 2006-7 � 250 in 2008-9 � 77 in later phase
• Leak frequency of: � 1.59/year in 2004 � 1.85/year in installation phase � 1.79/year in later phase
• Mechanical ventilation
• Frequency of ignited process leakage 0.5% of all leaks
• Manual reaction time of 5 minutes
• Frequency of ignited riser leakage 3*10-3/year

Investigation into Development of Safety Levels on Norwegian Installations in the North Sea Post-1990
Annelise Baillie 121
11.4. Appendix D: Assumptions for Risk Analysis of Platform D
• Assumptions listed as data sheets in an attachment ( included in risk analysis)
• Blowouts divided into 2 categories as per SINTEF Offshore Blowout Database: � Blowouts – release rate 50% of max. rate � Well leaks - release rate 10% of max. rate
• Pre-warning probability for blowouts: � 0.9 for Drilling � 0.2 for Production
• Maximum blowout rates: � 60kg/s for Oil � 19kg/s for Gas
• Adjustment factors >1 have been applied to blowout frequencies due to relatively high pressure in the reservoir
• SIMOPS Phase divided into 2: � SIMOPS –Inst. MPP – 6 months � SIMOPS –Ops. MPP – 3 months
• Stand-alone Phase: � 6 wells producing per year � 3 wireline operations per year � 3 coiled tubing operations per year
• Hot Work Activity: � SIMOPS –Inst. MPP – only during shutdown of platform � SIMOPS –Ops. MPP – approximately 16 hours per year
• Sources of Ignition (Rotating Equipment): � 1 sea water pump � 2 drain pumps � 1 MPP � 1 power pack � 2 electrical pumps
• 15min helicopter trip from adjacent LQ platform: � 15 visits per year Maintenance/Operations Crew � 26 visits per year Well Interventions Crew
• Presence of shallow gas considered to be unlikely based on results from the drilling of several wells in the area
• Manning SIMOPS Phase: � 328.5 hours per year per person – Drilling � 43.5 hours per year per person – Maintenance
• Manning Stand-alone Phase: � 175 hours per year per person – Maintenance � 306 hours per year per person – Well Intervention
• Distribution of personnel (in table)
• Lifting Activity: � Crane not used during SIMOPS –Ops. MPP Phase � Use of offshore 50T pedestal crane during Stand-alone Phase
• Evacuation:
Investigation into Development of Safety Levels on Norwegian Installations in the North Sea Post-1990
Annelise Baillie 122
� SIMOPS Phase – evacuation will be over to the jack-up rig � Stand-alone Phase - evacuation will be by helicopter for non-
HC events, and by free-fall lifeboats for HC events
• The jacket structure can withstand an impact energy of 9MJ.
• There will be, on average, 23,6 supply boat visits per year
• Failure on demand probability is 1.2% per ESD valve
• Time delay from automatic gas detection to initiation of ESD valves – 60s
• Time delay from manual gas detection to manual initiation of ESD valves – 5mins.

Investigation into Development of Safety Levels on Norwegian Installations in the North Sea Post-1990
Annelise Baillie 123
11.5. Appendix E: Assumptions for Risk Analysis of Platform E
• Distribution of personnel (in table)
• Passive Fire protection assumed on load-bearing structural members (dimensions not given)
• Deluge system assumed on all tanks with >5 tonnes of hydrocarbons
• Process segmentation is assumed in an accident so that process plant is divided into smaller enclosed volumes with hydrocarbons, to reduce duration of possible leak. Risk analysis only considers ESD vents during emergency shutdown
• Early detection and isolation of ignition source. It is assumed that on average, 50% of all ignition sources will be isolated before exposure to ignitable concentrations of HC gas.
• Ignition is assumed to be caused by gas turbines
• Distribution of leakage frequency along riser (distribution not given)
• Approximately 80% of leaks are expected to occur in process area and 20% in turret area.

Investigation into Development of Safety Levels on Norwegian Installations in the North Sea Post-1990
Annelise Baillie 124
11.6. Appendix F: Assumptions for Risk Analysis of Platform F
• Supply ships have sight on outer perimeter of safety zone, not on the
platform itself
• Procedures will be established to ensure that shuttle traffic by tankers increase their passing distance from the platform
• Process equipment can withstand explosion pressure of 0.25 bar
• 70% of leaks will occur during maintenance
• Human error is a large contributor to leak frequency
• A rate of 76 kg/s is assumed for reservoir blowouts
• A rate of 65 kg/s is assumed for shallow gas blowouts
• 95% of blowouts occur in well area, 5% on the sea-bed
• One of the concrete legs will collapse if subjected to collision energy greater than 200MJ
• NAS segmenting based on process shutdown and emergency shutdown philosophy
• Big fires (leaks in excess of 50 kg/s) will not cause major damage to load-bearing structure due to fire protection of critical elements
• 3m falling height for calculation of dropped objects energy, 10m for a crane boom
• For hot-works, 50% of potential ignition sources will be isolated before exposure to gas (reduction factor of 0.5)
• For electrical works, 70% of potential ignition sources will be isolated before exposure to gas (reduction factor of 0.3)
• Manning level: � 219 in Phases 1/2 � 133 in Phases 3/4/5
• Leak frequency of 4.4/year
• Crane in use 2830 times a year
• Crane ignition probability of 0.2, given gas exposure
• Traffic surveillance system gives reliable warning of ships on collision course 1 hour before expected collision time
• No hot works carried out on platform (this assumption seems to be in conflict with earlier assumption)
• 4 life-boats available + 1 reserve
• Test separator always pressurized
• Lifts not permitted over Power Generator Module
• All ESD’s will shut within 30s from signal
• Drainage system not designed to handle accidental spills of hydrocarbons
• Manual blow-down time after 10 mins for small/medium leaks
• Manual blow-down time after 1 min for large leaks
• All process equipment is passively fire-protected
• Cables through fire-walls do not weaken fire-wall
• Phases 1 and 2 Only: � Crane 1 does 4250 lifts per year

Investigation into Development of Safety Levels on Norwegian Installations in the North Sea Post-1990
Annelise Baillie 125
� Crane 2 does 4250 lifts per year � Crane 3 does 1870 lifts per year
• Phases 3, 4 and 5 Only: � Crane 1 does 3400 lifts per year � Crane 2 does 3400 lifts per year � Crane 3 does 1700 lifts per year

Investigation into Development of Safety Levels on Norwegian Installations in the North Sea Post-1990
Annelise Baillie 126
11.7. Appendix G: Assumptions for Risk Analysis of Platform G
• Plated deck in riser area of both platforms
• Risers have passive fire protection above deck level
• Accumulators have passive fire protection on one platform but not the other
• Main load bearing structure has 2hour passive fire protection
• No passive fire protection on jacket structure
• All vents assumed welded
• Both platforms have cold flares
• Fire walls will withstand explosion pressures of the order of 0.1 barg
• Jacket structure is designed to withstand collision impact up to 14MJ
• Process decks can withstand a container falling up to 5m (fall energy up to 490kJ)
• Time to automatic shutdown – 45s
• Time to release of manual blow-down – 3mins.
• Pigging assumed to take place once per year

Investigation into Development of Safety Levels on Norwegian Installations in the North Sea Post-1990
Annelise Baillie 127
11.8. Appendix H: Assumptions for Risk Analysis of Platform H
• Manning Level will be 130 people.
• Plated deck in the following areas: o C21 Cellar Deck o C23 Lower Deck o C26 Weather Deck o C31 Cellar Deck o D10 Drilling Module o Well Intervention Area
• Grated deck in the following areas: o C22 Mezzanine Deck o C23 Mezzanine Deck o C24 Intermediate Deck o C25 Upper Deck o C32 Mezzanine Deck
• Oil booster pumps have a 3x50% configuration
• Export pumps have a 3x50% configuration
• Test Separator is in operation 100% of time
• 50% of production wells are routed to HP manifold
• 50% of production wells are routed to LP manifold
• Personnel are killed when exposed to 37.5kW/m3 or 0.2 barg
• Personnel not already in are will not enter an area where there is oil or gas release
• Lower stair towers on south side are shielded from the heat radiation
• Escape-ways are impaired when exposed to 1% smoke concentration
• No standby vessel available, but ARPA radar installed on platform
• 7 helicopter landings per week
• 4 supply vessel visits per week
• The jacket is designed to lose 1 jacket leg, including all bracings, without collapsing
• Hatches in well intervention deck are bolted so that deck and hatches can withstand design explosion load
• 2006 is used as base year, with 26 live oil producers, and 3 live gas producers
• No equipment for processing HC will be placed above the weather deck
• Lay-down areas north and south of the process are assumed not to be used as a storage area
• Central vertical escape route allowing escape from all areas in Area 1
• Each platform leg can withstand impact up to 40MJ without critical damage
• Crane Lifts: o 600 lifts of pipes per year o 1150 lifts of box-shaped objects per year o 171 lifts of compact objects per year

Investigation into Development of Safety Levels on Norwegian Installations in the North Sea Post-1990
Annelise Baillie 128
o 2000 other lifts per year
• Passive fire protection of main load-bearing structure at T900 and underside of D11
• No hot work in classified areas
• 2 mins from leak detection to SSIV closing

Investigation into Development of Safety Levels on Norwegian Installations in the North Sea Post-1990
Annelise Baillie 129
11.9. Appendix I: Table of FAR Values – Platforms A to H
FAR Values Platform A Platform B Platform C Platform D Platform E Platform F Platform G Platform H
Late Phase
(max values)
Normal Phase
(max values)
Stand Alone Phase
IR (Maint.Crew)
FAR Production Phase
Process 2,13 5,40 4,42 5,93E-06 3,39 3,40 3,20 3,40
Blowout 0,63 0,06 0,19 2,29E-07 0,13 0,05 0,70 0,00
Riser & Pipeline
Accidents
0,04 0,43 0,79
1,21E-06 0,69
0,10
0,10
0,30
Dropped Objects 0,07 0,00 0,03 0,00E+00 0,00 0,00 0,10 0,20
Utility
Fires/Explosions
0,00 0,00 0,00
0,00E+00 0,00
0,10
0,00
0,00
Environmental/
Weather
0,11 0,11 0,11
2,18E-07 0,12
0,10
0,00
0,10
Occupational 0,46 0,64 1,02 5,60E-06 3,20 1,20 1,50 0,30
Helicopter 0,45 1,70 1,70 2,10E-05 12,00 0,00 0,00 1,40
Ship Collision 0,01 0,03 0,11 1,17E-06 0,67 0,10 0,10 0,01
Structural Failure 0,22 0,00 0,00 0,00 0,05 0,00 0,00
Earthquake 0,00 0,11 0,11 0,00 0,00 0,00 0,10
Total 4,12 8,48 8,48 20,20 5,10 5,70 5,81 0,00
Figures for Platform H not
available.

Investigation into Development of Safety Levels on Norwegian Installations in the North Sea Post-1990
Annelise Baillie 130
11.10. Appendix J: Table of Annual Frequency of Accidents – Platform H
Annual Frequency for Accident with Resulting Number of Fatalities
ACCIDENT 1 1 2 3-5 6-20 21-50 51-100 >100 TOTAL
Maximum Minimum
Blowout 0,00E+00 7,20E-04 1,30E-07 3,40E-06 5,80E-07 1,00E-06 7,25E-04
Well Leak 0,00E+00 1,50E-04 0,00E+00 5,90E-06 0,00E+00 0,00E+00 1,56E-04
Process 2,80E-04 2,50E-04 3,30E-05 2,40E-05 0,00E+00 0,00E+00 5,87E-04
Riser 0,00E+00 1,90E-08 0,00E+00 0,00E+00 1,50E-06 1,10E-07 1,63E-06
Shale Shaker 3,30E-04 0,00E+00 0,00E+00 0,00E+00 0,00E+00 0,00E+00 3,30E-04
Collision 1,70E-04 0,00E+00 0,00E+00 4,40E-05 1,10E-05 0,00E+00 2,25E-04
Dropped Objects 0,00E+00 0,00E+00 0,00E+00 0,00E+00 0,00E+00 0,00E+00 0,00E+00
Helicopter 5,40E-04 0,00E+00 0,00E+00 0,00E+00 0,00E+00 0,00E+00 5,40E-04
(personnel onboard
platform only)
Total 1,00E-01 1,00E-02 1,32E-03 1,12E-03 3,31E-05 7,73E-05 1,31E-05 1,11E-06 2,56E-03
Accumulated 1,03E-01 1,26E-02 2,56E-03 1,24E-03 1,25E-04 9,15E-05 1,42E-05 1,11E-06
Acceptance Criteria 5,70E-03 2,90E-03 8,80E-04 3,20E-04 1,50E-04 9,80E-05

Investigation into Development of Safety Levels on Norwegian Installations in the North Sea Post-1990
Annelise Baillie 131
11.11. Appendix K: Table of Annual Frequency of Accidents – Platform H
Geometric Means PLL Contribution
1 2 3-5 6-20 21-50 51-100
100-
200 1 1 2 3-5 6-20 21-50 51-100 >100 TOTAL TOTAL
Maximum Minimum Maximum Minimum
1,00 2,00 3,87 10,95 32,40 71,41 141,42 0,000000 0,002789 0,000001 0,000110 0,000041 0,000141 0,0031 0,0031
1,00 2,00 3,87 10,95 32,40 71,41 141,42 0,000000 0,000581 0,000000 0,000191 0,000000 0,000000 0,0008 0,0008
1,00 2,00 3,87 10,95 32,40 71,41 141,42 0,000560 0,000968 0,000361 0,000778 0,000000 0,000000 0,0027 0,0027
1,00 2,00 3,87 10,95 32,40 71,41 141,42 0,000000 0,000000 0,000000 0,000000 0,000107 0,000016 0,0001 0,0001
1,00 2,00 3,87 10,95 32,40 71,41 141,42 0,000660 0,000000 0,000000 0,000000 0,000000 0,000000 0,0007 0,0007
1,00 2,00 3,87 10,95 32,40 71,41 141,42 0,000340 0,000000 0,000000 0,001426 0,000786 0,000000 0,0026 0,0026
1,00 2,00 3,87 10,95 32,40 71,41 141,42 0,000000 0,000000 0,000000 0,000000 0,000000 0,000000 0,0000 0,0000
1,00 2,00 3,87 10,95 32,40 71,41 141,42 0,001080 0,000000 0,000000 0,000000 0,000000 0,000000 0,0011 0,0011
1,00E-01 1,00E-02 2,64E-03 4,34E-03 3,63E-04 2,50E-03 9,34E-04 1,57E-04 0,1109 0,0209

Investigation into Development of Safety Levels on Norwegian Installations in the North Sea Post-1990
Annelise Baillie 132
11.12. Appendix L: No. Of Installation Years – Only Installations Built up to and incl. 1999
0
10
20
30
40
50
60
70
80
90
100
19
72
19
74
19
76
19
78
19
80
19
82
19
84
19
86
19
88
19
90
19
92
19
94
19
96
19
98
20
00
20
02
20
04
20
06
20
08
20
10
Acc
um
ula
ted
In
sta
llat
ion
Ye
ars
Year
Accumulated Installation Years at end of Year - Installations Built up to 1999 (Inst. Built 2000 and later not incl.)
Sum Installation Years
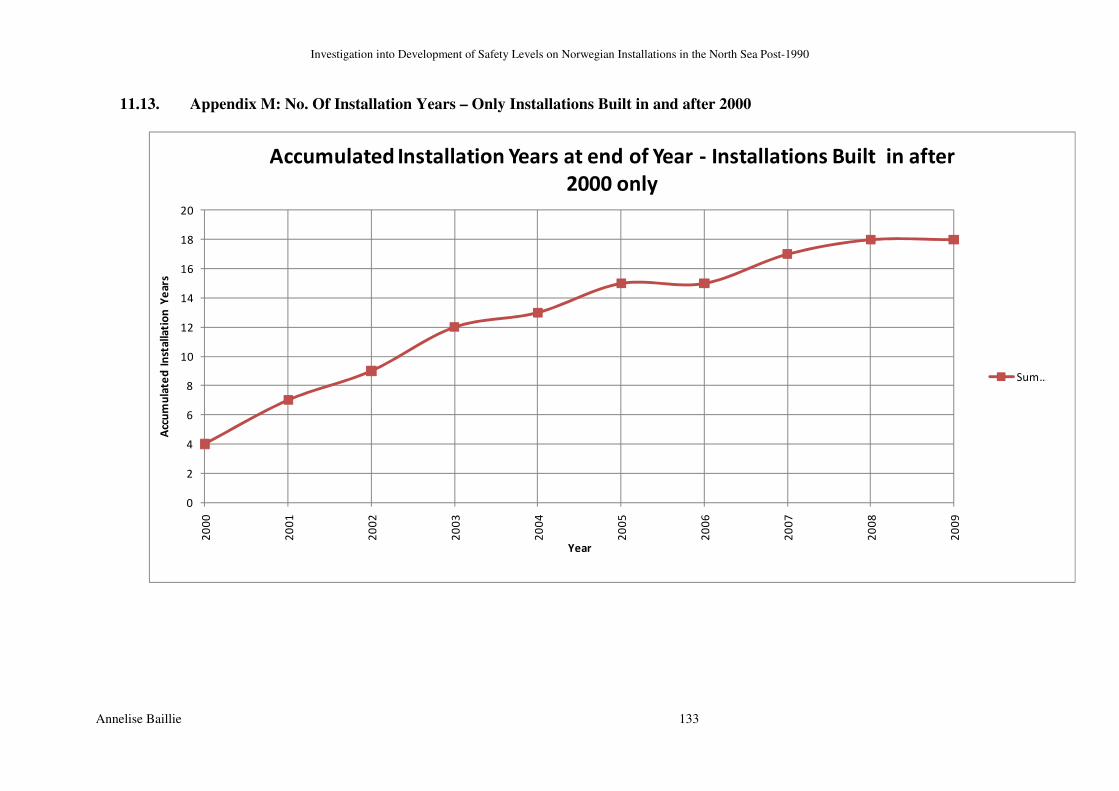
Investigation into Development of Safety Levels on Norwegian Installations in the North Sea Post-1990
Annelise Baillie 133
11.13. Appendix M: No. Of Installation Years – Only Installations Built in and after 2000
0
2
4
6
8
10
12
14
16
18
202
00
0
20
01
20
02
20
03
20
04
20
05
20
06
20
07
20
08
20
09
Acc
um
ula
ted
In
sta
lla
tio
n Y
ea
rs
Year
Accumulated Installation Years at end of Year - Installations Built in after
2000 only
Sum …
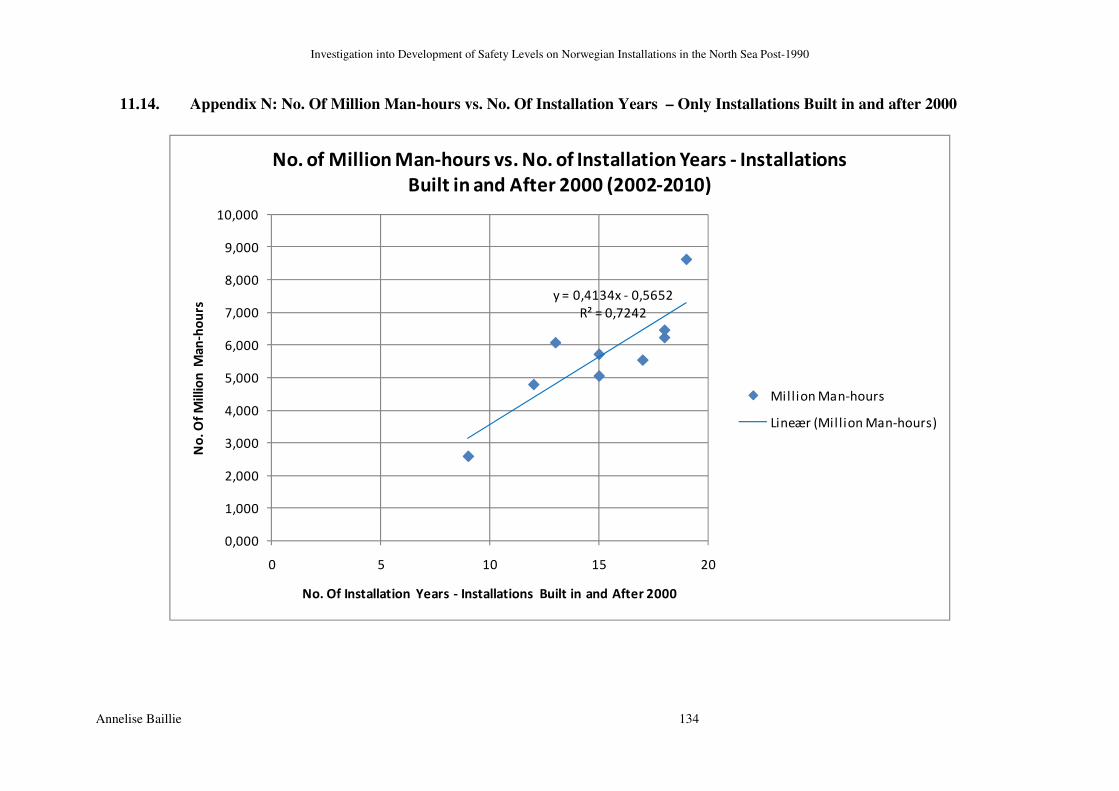
Investigation into Development of Safety Levels on Norwegian Installations in the North Sea Post-1990
Annelise Baillie 134
11.14. Appendix N: No. Of Million Man-hours vs. No. Of Installation Years – Only Installations Built in and after 2000
y = 0,4134x - 0,5652
R² = 0,7242
0,000
1,000
2,000
3,000
4,000
5,000
6,000
7,000
8,000
9,000
10,000
0 5 10 15 20
No
. O
f M
illi
on
Ma
n-h
ou
rs
No. Of Installation Years - Installations Built in and After 2000
No. of Million Man-hours vs. No. of Installation Years - Installations
Built in and After 2000 (2002-2010)
Million Man-hours
Lineær (Million Man-hours)


![Masters Thesis[1]](https://img.pdfslide.us/doc/110x75/5434f4fb219acd5e1a8b5b85/masters-thesis1.jpg)