Embed Size (px)
Citation preview

Calhoun: The NPS Institutional Archive
Theses and Dissertations Thesis Collection
1993
Evaluation of surface friction guidelines for
Washington State highways.
Corsello, Patricia.
http://hdl.handle.net/10945/24161


OUDLEY KNOX LIBRARYNAVAL POSTGRADUATE SCHOOlMONTEREY CA 93943-5101


Final Report
Agreement T9233, Task 1, Subtask 8
TRAC Special Projects
EVALUATION OF SURFACE FRICTIONGUIDELINES FOR WASHINGTON
STATE HIGHWAYS
by
Patricia Corsello
LT, CEC, USNUniversity of Washington
Washington State Transportation Center (TRAC)University of Washington, JD-10
The University District Building, Suite 535
1107N.E.45thSt.Seattle, Washington 98105-4631
Washington State Department of Transportation
Technical MonitorNewt Jackson
Pavement and Soils Engineer, WSDOT
Prepared for
Washington State Transportation CommissionDepartment of Transportation
October 1993

DUDtiY KNOX LIBRARY
NAVAL POSTGRADUATE SCHOOl
MGNTiflgY CA 93943-5101
ABSTRACT
The Washington State Department of Transportation (WSDOT) determines wet-
pavement surface friction characteristics by conducting skid-tests in accordance with
American Society for Testing and Materials (ASTM) Method E-274. The results of the
skid-tests, Friction Number (FN), are used as one of several variables in programming
safety improvements.
This report examines literature from the United States and abroad on friction
number guidelines for highways. On the basis of an analysis of the literature, a revised
friction number guideline was developed. The new guideline is consistent with other
highway departments that have recently reviewed their minimum friction number
guidelines. Most importantly, the new guideline provides WSDOT pavement engineers
with a realistic parameter for assessment of highway pavements.

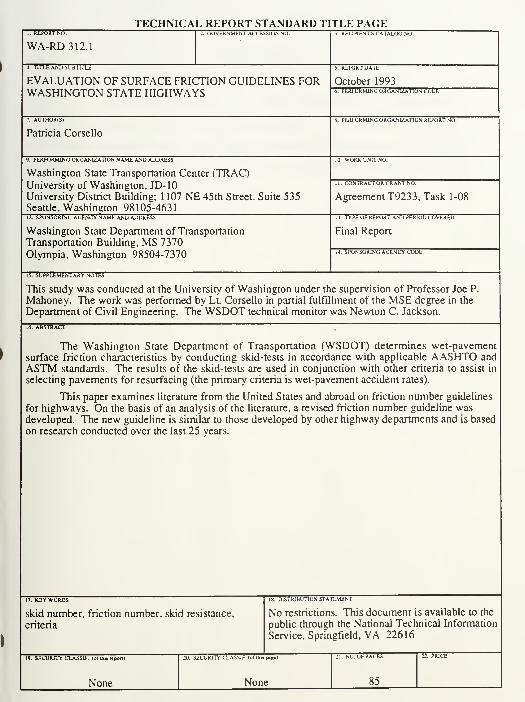
TECHNICAL REPORT STANDARD TITLE PAGEI. REPORT NO.
WA-RD 312.1
:. GOVERNMENT ACCESSION I RECIPIENTS CATALOG NO
4. TITLE ANT) SUBTITLE
EVALUATION OF SURFACE FRICTION GUIDELINES FORWASHINGTON STATE HIGHWAYS
5 REPORT DATE
October 1993PERFORMING ORGANIZATION CODE
7. AUTHOR(S)
Patricia Corsello
PERFORMING ORGANIZATION REPORT NO.
PERfORMTNG ORGANIZATION NAME AND ADDRESS 10. WORK UNIT NO.
Washington State Transportation Center (TRAC)University of Washington, JD-10University District Building; 1 107 NE 45th Street, Suite 535Seattle, Washington 98105-4631
CONTRACT OR GRANT NO
Agreement T9233, Task 1-08
I J. TYPE OF REPORT AND PERIOD COVERED12. SPONSORTNG AGENCY NAME AND ADDRESS
Washington State Department of Transportation
Transportation Building, MS 7370Olympia, Washington 98504-7370
Final Report
SPONSORING AGENCY CODE
IS. SUPPLEMENTARY NOTES
This study was conducted at the University of Washington under the supervision of Professor Joe P.
Mahoney. The work was performed by Lt, Corsello in partial fulfillment of the MSE degree in the
Department of Civil Engineering. The WSDOT technical monitor was Newton C. Jackson.
16. ABSTRACT
The Washington State Department of Transportation (WSDOT) determines wet-pavementsurface friction characteristics by conducting skid-tests in accordance with applicable AASHTO and
ASTM standards. The results of the skid-tests are used in conjunction with other criteria to assist in
selecting pavements for resurfacing (the primary criteria is wet-pavement accident rates).
This paper examines literature from the United States and abroad on friction number guidelines
for highways. On the basis of an analysis of the literature, a revised friction number guideline wasdeveloped. The new guideline is similar to those developed by other highway departments and is based
on research conducted over the last 25 years.
17. KEYWORDS
skid number, friction number, skid resistance,
criteria
18. DISTRIBUTION STATEMENT
No restrictions. This document is available to the
public through the National Technical Information
Service, Springfield, VA 22616
19. SECURITY CLASSIF. (of lha report)
None
20. SECURITY CLASSIF. (of thu|
None
NO. OF PAGES
85

DISCLAIMER
The contents of this report reflect the views of the author, who is responsible for
the facts and the accuracy of the data presented herein. The contents do not necessarily
reflect the official views or policies of the Washington State Transportation Commission,
Department of Transportation, or the University of Washington. This report does not
constitute a standard, specification, or regulation.

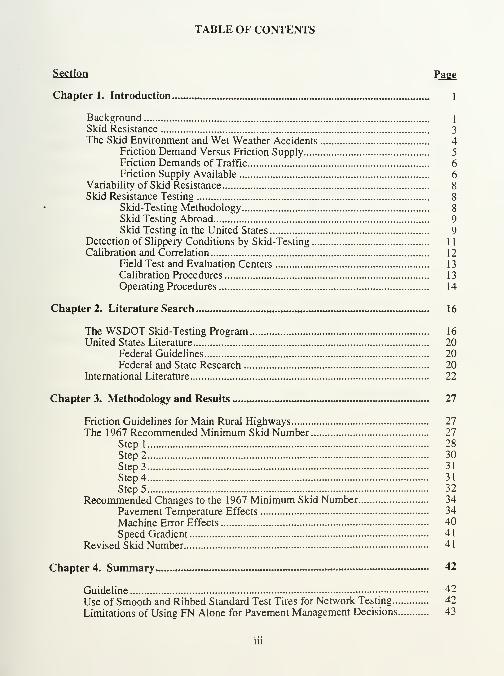
TABLE OF CONTENTS
Section Page
Chapter 1. Introduction 1
Background 1
Skid Resistance 3
The Skid Environment and Wet Weather Accidents 4Friction Demand Versus Friction Supply 5
Friction Demands of Traffic 6Friction Supply Available 6
Variability of Skid Resistance 8
Skid Resistance Testing 8
Skid-Testing Methodology 8
Skid Testing Abroad 9Skid Testing in the United States 9
Detection of Slippery Conditions by Skid-Testing 1
1
Calibration and Correlation 12
Field Test and Evaluation Centers 13
Calibration Procedures 13
Operating Procedures 14
Chapter 2. Literature Search 16
The WSDOT Skid-Testing Program 16
United States Literature 20Federal Guidelines 20Federal and State Research 20
International Literature 22
Chapter 3. Methodology and Results 27
Friction Guidelines for Main Rural Highways 27
The 1967 Recommended Minimum Skid Number 27
Step 1 28
Step 2 30
Step 3 31
Step 4 31
Step 5 32
Recommended Changes to the 1967 Minimum Skid Number 34
Pavement Temperature Effects 34
Machine Error Effects 40
Speed Gradient 41
Revised Skid Number 41
Chapter 4. Summary 42
Guideline 42
Use of Smooth and Ribbed Standard Test Tires for Network Testing 42
Limitations of Using FN Alone for Pavement Management Decisions 43

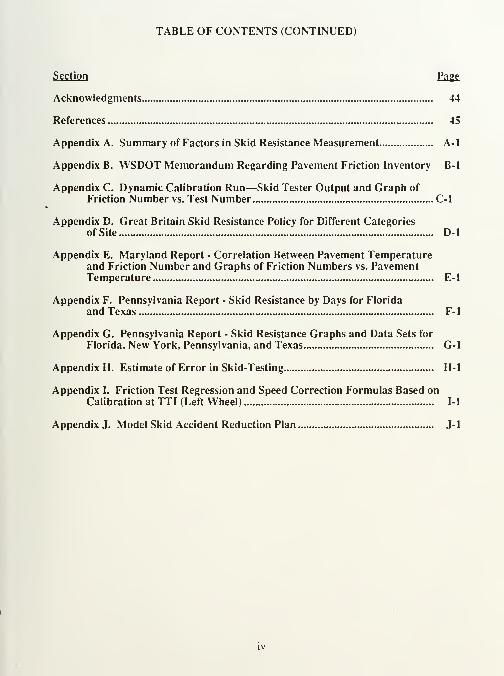
TABLE OF CONTENTS (CONTINUED)
Section Page
Acknowledgments 44
References 45
Appendix A. Summary of Factors in Skid Resistance Measurement A-l
Appendix B. WSDOT Memorandum Regarding Pavement Friction Inventory B-l
Appendix C. Dynamic Calibration Run—Skid Tester Output and Graph of
Friction Number vs. Test Number C-l
Appendix D. Great Britain Skid Resistance Policy for Different Categoriesof Site D-
1
Appendix E. Maryland Report - Correlation Between Pavement Temperatureand Friction Number and Graphs of Friction Numbers vs. PavementTemperature E-l
Appendix F. Pennsylvania Report - Skid Resistance by Days for Florida
and Texas F-l
Appendix G. Pennsylvania Report - Skid Resistance Graphs and Data Sets for
Florida, New York, Pennsylvania, and Texas G-l
Appendix H. Estimate of Error in Skid-Testing H-l
Appendix I. Friction Test Regression and Speed Correction Formulas Based onCalibration at TTI (Left Wheel) 1-1
Appendix J. Model Skid Accident Reduction Plan J-l
IV

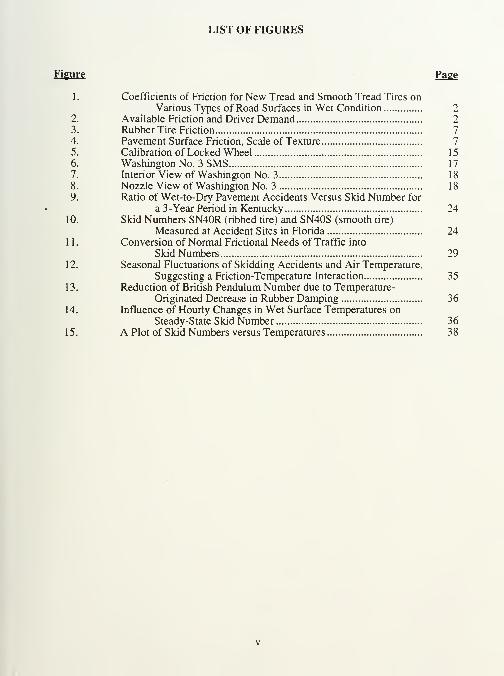
LIST OF FIGURES
Figure Page
1
.
Coefficients of Friction for New Tread and Smooth Tread Tires onVarious Types of Road Surfaces in Wet Condition 2
2. Available Friction and Driver Demand 2
3. Rubber Tire Friction 7
4. Pavement Surface Friction, Scale of Texture 7
5. Calibration of Locked Wheel 15
6. Washington No. 3 SMS 17
7. Interior View of Washington No. 3 18
8. Nozzle View of Washington No. 3 18
9. Ratio of Wet-to-Dry Pavement Accidents Versus Skid Number for
a 3-Year Period in Kentucky 2410. Skid Numbers SN40R (ribbed tire) and SN40S (smooth tire)
Measured at Accident Sites in Florida 241 1
.
Conversion of Normal Frictional Needs of Traffic into
Skid Numbers 2912. Seasonal Fluctuations of Skidding Accidents and Air Temperature,
Suggesting a Friction-Temperature Interaction 3513. Reduction of British Pendulum Number due to Temperature-
Originated Decrease in Rubber Damping 3614. Influence of Hourly Changes in Wet Surface Temperatures on
Steady-State Skid Number 3615. A Plot of Skid Numbers versus Temperatures 38


LIST OF TABLES
Table Page
1. The Factors of Skid Resistance 5
2. Summary of Friction Guidelines for State Highway Departments... 23
3. Conversion of Friction Numbers that Satisfy the Normal Need of
Traffic into Skid Numbers 294. Recommended Minimum Interim Skid Numbers 33

CHAPTER 1
INTRODUCTION
BACKGROUND
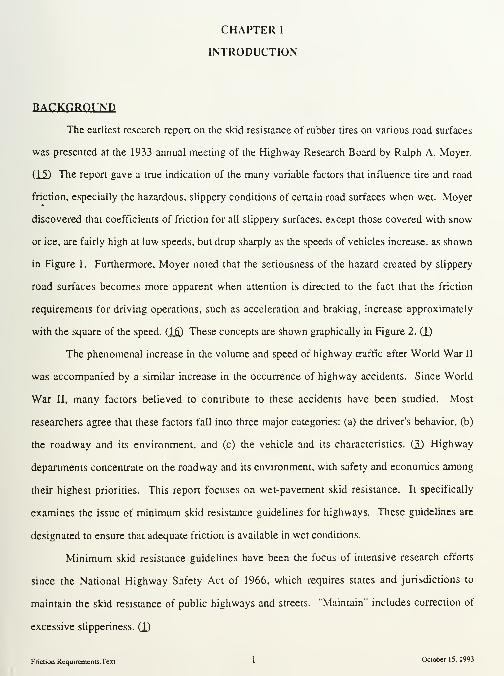
The earliest research report on the skid resistance of rubber tires on various road surfaces
was presented at the 1933 annual meeting of the Highway Research Board by Ralph A. Moyer.
(\5) The report gave a true indication of the many variable factors that influence tire and road
friction, especially the hazardous, slippery conditions of certain road surfaces when wet. Moyer
discovered that coefficients of friction for all slippery surfaces, except those covered with snow
or ice, are fairly high at low speeds, but drop sharply as the speeds of vehicles increase, as shown
in Figure 1. Furthermore, Moyer noted that the seriousness of the hazard created by slippery
road surfaces becomes more apparent when attention is directed to the fact that the friction
requirements for driving operations, such as acceleration and braking, increase approximately
with the square of the speed. (16) These concepts are shown graphically in Figure 2. (1)
The phenomenal increase in the volume and speed of highway traffic after World War II
was accompanied by a similar increase in the occurrence of highway accidents. Since World
War II, many factors believed to contribute to these accidents have been studied. Most
researchers agree that these factors fall into three major categories: (a) the driver's behavior, (b)
the roadway and its environment, and (c) the vehicle and its characteristics. Q) Highway
departments concentrate on the roadway and its environment, with safety and economics among
their highest priorities. This report focuses on wet-pavement skid resistance. It specifically
examines the issue of minimum skid resistance guidelines for highways. These guidelines are
designated to ensure that adequate friction is available in wet conditions.
Minimum skid resistance guidelines have been the focus of intensive research efforts
since the National Highway Safety Act of 1966, which requires states and jurisdictions to
maintain the skid resistance of public highways and streets. "Maintain" includes correction of
excessive slipperiness. (1)
Friction Requirements/Text 1 October 15. 1993

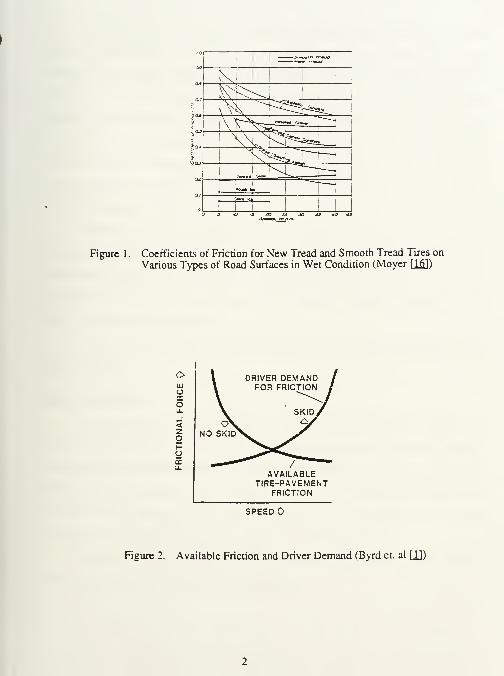
Figure 1. Coefficients of Friction for New Tread and Smooth Tread Tires on
Various Types of Road Surfaces in Wet Condition (Moyer [\&\)
o DRIVER DEMAND i
LU FOR FRICTION i
oLi. skid/-1< <^ cyz NO SKID^
HOcca.
AVAILABLETIRE-PAVEMENT
FRICTION
SPEED t>
Figure 2. Available Friction and Driver Demand (Byrd et. al (JJ)

In the mid-1960s, Kummer and Meyer ( 12) performed a landmark study to determine
factional requirements for main rural highways. The study was published in 1967 by the
Highway Research Board (HRB) as National Cooperative Highway Research Program (NCHRP)
Report 37. The report recommended a minimum skid number of 37 for the national road
network, as measured with a skid trailer in accordance with ASTM Method E-274. The HRB
emphasized that the recommended skid number was minimum and tentative and that specific
factional requirements needed to be determined for each given set of road, vehicle, operator, and
weather conditions. The HRB suggested continued research to develop a more refined skid
resistance requirement. (12)
Since 1967, researchers have made significant progress in field and laboratory methods of
measuring road surface friction, comparison and correlation of the different measuring methods,
relationships of road surface properties to skidding accidents, and several other aspects of the
tire-pavement interaction. This report adjusts the skid number recommended by HRB in 1967 to
reflect these research developments.
Before analyzing specific adjustments to the minimum skid number, basic principles are
briefly discussed.
SKTD RESISTANCE
When a pavement is wet, quick braking or turning maneuvers may cause a vehicle's tires
to slide because of the lower friction between the tires and the pavement In this report "friction"
is understood to be the force developed at the tire-pavement interface that prevents the tires from
sliding on pavement surfaces under fast braking or cornering. The term "skid resistance" has
also been used to describe this tire-pavement interaction. The two terms (friction and skid
resistance) are used interchangeably in this report, as they are in the literature.
Skid resistance can be stated several ways: coefficient of friction (|i), Friction Number
(FN), or Skid Number (SN). Each is defined as follows:

a. Coefficient of Friction ( \x)
F^
=L
F = frictional resistance to motion in the plane of interface.
L = load perpendicular to the interface.
b. Skid Number (SN)
SN = 100(H) = 100(£)
F = measured friction obtained with a locked-wheel standardized tire at a
constant speed (usually 40 mph) along an artificially wetted pavement(in accordance with ASTM E-274 or AASHTO T-242).
L = vertical load on a locked wheel.
c. Friction Number (FN)
FN = defined by NCHRP Report 37 as the critical coefficient of friction whichthe tire develops before skidding occurs.
Note: It is often used interchangeably with SN in other literature to represent
the measured value of skid resistance.
It is important to note that a pavement is not given a certain coefficient of friction because
friction involves two bodies, the pavement and the tire. Each is extremely variable because of
factors such as pavement wetness and vehicle speed. (JL)
THE SKID ENVIRONMENT AND WET WEATHER ACCIDENTS
As already stated, the factors that contribute to highway skidding accidents fall into three
major categories, known as the three components of skidding accidents:
• The Driver— driving habits and capabilities
The Pavement— surface characteristics
The Vehicle— tires and suspension
The external environment, mainly wet weather, can affect each of these components
either directly or indirectly. For instance, rainfall affects the friction available from the pavement
surface: the tire tread affects the capacity of the tire to remove water at the tire-pavement

interface; and wet roads can produce headlight reflection and spray, which can reduce the driver s
perceptual vision and sight distance. Wet conditions produce low and variable friction values.
Under dry conditions, skid resistance is good and uniform values are obtained for a wide range of
surfaces. Therefore, pavement engineers concentrate their efforts regarding skidding accidents to
wet conditions.
The occurrence or avoidance of a skidding accident is a function of the three interrelated
components. A deficiency in any one of these components, that is, the driver, the pavement, or
the vehicle, can be the cause of a skidding accident. (JJ
Pavement engineers strive to understand the factors involved in skid resistance and their
interrelationships. This is an extremely complex subject, and, therefore, is often outlined in
terms of friction demand and supply.
Friction Demand Versus Friction Supply
Skid resistance can be thought of in terms of the margin of safety between the friction
supply available and the friction demand generated at any particular time and for a particular
driving maneuver. The basic skid resistance equation is as follows: skid resistance equals
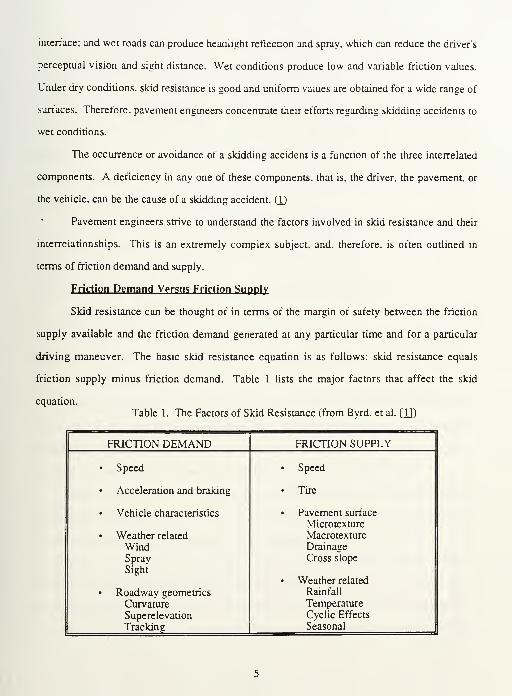
friction supply minus friction demand. Table 1 lists the major factors that affect the skid
equation.
Table 1. The Factors of Skid Resistance (from Byrd, et al. [JL])
FRICTION DEMAND FRICTION SUPPLY
Speed
• Acceleration and braking
Vehicle characteristics
• Weather related
WindSpray
Sight
Roadway geometries
Curvature
Superelevation
Tracking
Speed
• Tire
Pavement surface
Microtexture
Macrotexture
Drainage
Cross slope
• Weather related
Rainfall
Temperature
Cyclic Effects
Seasonal

Note that certain factors affect both demand and supply and can therefore have a
significant influence on skid resistance. Obvious examples are speed and weather related
factors. (1)
Friction Demands of Traffic
For a vehicle to follow a desired course the tires must be capable of developing definite
friction factors. Friction factors vary with speed, tire type, weather conditions, roadway
geometries and, most importantly, with the maneuvers that drivers impose on their vehicles
(changes in direction and rate of acceleration).
The large dependence of available friction on speed arises from the fact that on wet
pavements the tire-pavement contact area is determined by the efficiency with which the tire can
expel water from that area. Water viscosity and other effects cause this efficiency to degrade at
higher speeds—consequently, the tire is unable to maintain a dry contact area. CD
Friction Supply Available
Whether enough friction is produced in the tire-pavement interface under certain
conditions, for example, high speed, depends on the properties of the tire, the pavement surface,
and weather related factors.
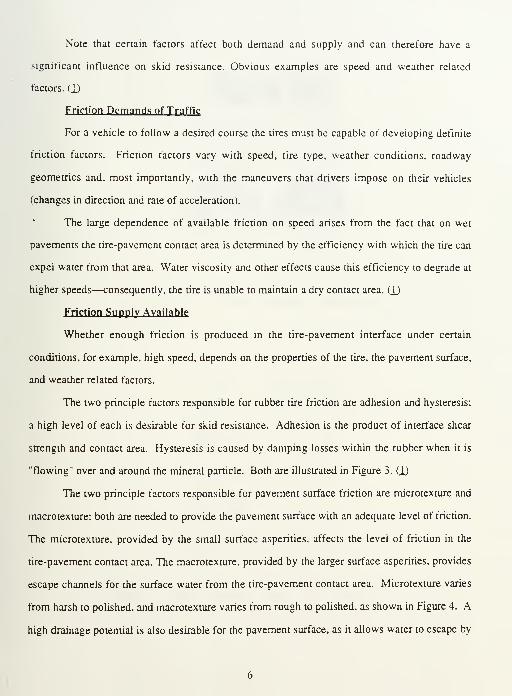
The two principle factors responsible for rubber tire friction are adhesion and hysteresis;
a high level of each is desirable for skid resistance. Adhesion is the product of interface shear
strength and contact area. Hysteresis is caused by damping losses within the rubber when it is
"flowing" over and around the mineral particle. Both are illustrated in Figure 3. (JO
The two principle factors responsible for pavement surface friction are microtexture and
macrotexture; both are needed to provide the pavement surface with an adequate level of friction.
The microtexture, provided by the small surface asperities, affects the level of friction in the
tire-pavement contact area. The macrotexture. provided by the larger surface asperities, provides
escape channels for the surface water from the tire-pavement contact area. Microtexture varies
from harsh to polished, and macrotexture varies from rough to polished, as shown in Figure 4. A
high drainage potential is also desirable for the pavement surface, as it allows water to escape by

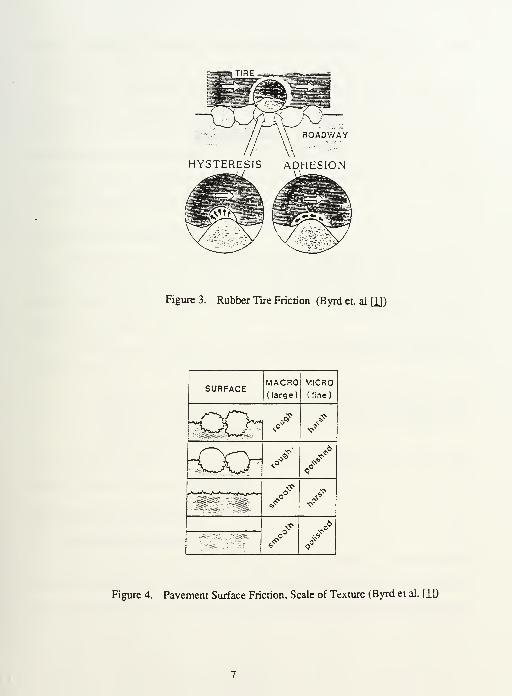
Figure 3. Rubber Tire Friction (Byrd et. ai QJ)
SURFACEMACRO(large)
MICRO
(fine)
^k^Jy • J?
~GG" / /""'"'"'r: '%!§ /
/ /H.':~y,., /:M%,
Figure 4. Pavement Surface Friction, Scale of Texture (Byrd et al. UJ)

gravity; this potential reduces the water film thickness at the interface and increases available
friction. (JJ
Weather related factors are key to the amount of available friction. Again, in dry
conditions friction is generally not a concern. Available friction is known to vary with season.
Normally, available friction is relatively low in summer and fall because of contamination (oil
and dirt) buildup in pavement asperities; it is relatively high in winter and spring because rainfall
cleans the contamination from the asperities. (1) A drop in available friction often occurs when
it rains following a period of dry days.
VARIABILITY OF SKID RESISTANCE
Identifying the major factors of skid resistance highlights an important point—
a
significant number of wet weather accidents are related to factors other than a slick pavement.
Because of the number of contributing factors, wet-pavement skid resistance is said to have a
large degree of variability. (1)
Wet-pavement skid resistance is a major concern of highway departments. However, it is
a relatively small factor in relation to all accidents:
Reported studies have indicated that most accidents, perhaps more than 80
percent, may be attributed to human factors, and only 3 to 5 percent may be
attributed to vehicular characteristics or failures, with the exception of tire
condition. The remaining 10 to 15 percent of accidents may be related to the
roadway and its environment. Q)
To prevent skidding accidents, most states have initiated skid resistance programs that include
means of measuring wet-pavement skid resistance.
SKID RESISTANCE TESTING
Skid-Testing Methodology
Since the origin of testing in the 1930s, two major methods of skid-testing have
developed around the world. Although a number of devices are available for performing the
tests, common methods measure either the braking-force coefficient (BFC) or the sideways-force

coefficient (SFC). The United States uses the braking-force coefficient method, whereas Europe
and many other pans of the world use the sideways-force coefficient method.
The BFC is a calculation of the braking force divided by the vertical force, measured
when the vehicle is braking in a straight line and the tire is actually skidding. The SFC describes
the sideways force divided by the vertical force, measured when the vehicle is braking in a turn
and the tire is actually skidding. Measured BFC values are usually somewhat lower than SFC
values.
Skid-Testing Abroad
In Europe and other pans of the world, the skid resistance is measured by a machine
appropriately refened to as the Sideways-Force Coefficient Routine Investigation Machine
(SCRIM). SCRIM is based on the contention that the critical maneuver related to skidding is
cornering. The test wheel is set at a 20-degree angle in relation to the direction of travel, and the
sideways force acting normally to the plane of the wheel is measured. The sideways-force
coefficient is then defined as the ratio of the sideways force to the vertical load. The vehicle uses
a smooth tire in its measurements. The test wheel has its own deadweight, spring, and shock
absorber to give a known static reaction between the tire and road. In the hub is an electrical
load cell to provide the sideways-force input to the recording system. A speed input is provided
from the vehicle transmission system. (1)
Skid-Testing in the United States
Skid-testing in the United States is almost universally conducted in accordance with
ASTM Method E-274 (AASHTO T-242). This method uses a locked-wheel braking mechanism
to measure the braking-force coefficient. The measurement represents a steady state friction
force on a locked test wheel as the tire is dragged over a wetted pavement surface under constant
speed. The locked test wheel's major plane is parallel to its direction of motion and
perpendicular to the pavement.
The vast majority of skid measurement systems consist of a towing vehicle and a two-
wheel trailer. Most commonly, the left wheel is locked during testing. The skid measurement

system must have the following: (a) a transducer associated with each test wheel that senses the
force developed between the sliding wheel and the pavement during testing, (b) electronic signal
conditioning equipment to receive the transducer output signal and modify it as required, and (c)
suitable analog and/or digital readout equipment to record either the magnitude of the developed
force or the calculated value of the resulting Skid Number (SN).
The system must include a means to transport a supply of water — usually 200 to 500
gallons — and the necessary apparatus to deliver approximately 4 gallons of water per minute,
per wetted inch of pavement at 40 mph within specified limits in front of the test wheel. The
system must be able to measure the speed at which the test is conducted.
A standard tire is used in the test so that the skid resistance of different pavements can be
compared. The standardized skid-test tire, a tubeless, bias-ply G78xl5 tire with seven
circumferential grooves, is defined by ASTM E-501 (AASHTO M-261). The standard rigidly
prescribes the rubber composition. Thus, the tire type and design are eliminated as variables in
the measurement of pavement skid resistance.
To take a measurement, the trailer is towed at a speed of 40 mph over the dry pavement,
while water is applied in front of the test wheel. The test wheel is then locked up by a suitable
brake. After the test wheel has been sliding on the pavement for a certain distance, the force that
the friction in the tire contact patch produces and transmits as torque on the test wheel is
measured and recorded for a specified length of time. The result of such a test is reported as the
Skid Number (SN).
It is essential that operators adhere to this standardized procedure. Although
measurements are essentially fixed, as far as skid resistance is concerned, surface characteristics
change with time and are frequently far from uniform. Unless the test is repeated and
measurements made in an identical manner, the operators may conclude that changes occurred
when they really did not and distort the magnitude of real changes, (I)
The possibility of some uncertainty in the measurements remains. Seasonal variations
exist, as shown by several studies. In addition, temperature effects exist because of tire friction's
10

dependence on temperature. Operators must also consider a complicated interplay that involves
air, pavement, and water temperatures, as well as the heating of the tire structure by flexing and
the heating of the tire tread by friction. (JJ No universally accepted method of correcting skid
number for temperature exists yet; however, researchers are finding that the effect of reasonable
air temperatures (25°F-70°F) on pavement surface friction is insignificant.
There are other potential sources of error. Some sources affect the repeatability of a test
made with the same tester, while others cause different testers to produce different results on the
same surface under the same conditions. A potentially large source of error is position of the
wheel in the wheelpath.
However, these imperfections do not diminish the usefulness of ASTM E-274 for most
purposes, such as (a) determining whether pavement friction could be a governing factor at
highway accident locations, (b) making surveys of a road system for the purpose of identifying
low friction sections and setting priorities for remedial programs, and (c) determining the relative
in-service skid number of different types of construction, aggregates, and surface treatments.
Difficulties arise only when high precision is needed, as when engineers must determine whether
a particular surface meets a mandated level of skid resistance. (1)
DETECTION OF SLIPPERY CONDITIONS BY SKID-TESTING
Skid-testing may be performed for a wide variety of reasons; however, the primary reason
is to detect low friction pavements that may be corrected to prevent accidents. For researchers to
use the skid-test equipment to detect slippery pavement conditions, the term "slippery" must be
translated into skid numbers. For skid-testing to be used as an effective tool, decisions have to
be made, at least within a transportation department, as to acceptable or reasonable skid numbers.
This decision making becomes further complicated when variation in friction demand is taken
into consideration, as discussed in a previous section. (JJ
Many states have developed their own ranges of skid resistance values. The ranges may
vary by classification of road, by traffic volume, or by any other valid reason. Many other states
11

use the skid values from NCHRP Report 37 (1967), which recommends a minimum skid number
of 37 for highways. (V)
CALIBRATION AND CORRELATION
As with any other measurement, skid resistance measurements are of limited value, or
may even be totally useless, unless the measuring system obtains data that fall within acceptable
limits of accuracy and precision. Accuracy refers to the measurement's degree of agreement with
an accepted reference level. Precision refers to the degree of agreement among repeat
measurements. To ensure accuracy and precision the system must be calibrated periodically.
Because skid resistance is a performance measure, that is, the force required to drag a
specified tire over a wetted pavement under specified conditions, no absolute standard exists to
which the measured values may be compared or related. To address this problem, correlation
studies were conducted in which the results, obtained with different skid resistance testers, were
compared with each other. These correlation studies resulted in significant improvements in the
accuracy and precision of skid resistance measurements.
However, the correlation studies did not solve the problem. When different skid-testers
were correlated, the mean of the results of all testers was used as a reference level. This method
proved to be unsatisfactory because in all correlation studies the difference among the
measurements of several testers, under presumably identical conditions, was found to be
statistically significant. This meant that systematic errors were much larger than random ones.
The method of applying the water in front of the test tire is an example of a systematic error,
while placement in the wheel track is an example of a random error.
NCHRP Report 151 (12) summarized the factors in skid resistance measurement in terms
of the type and magnitude of error that each factor introduces. The summary is provided in
Appendix A. Report 151, in conjunction with more recent findings on error, has been used to
upgrade ASTM E-274; in particular the report specified the limits within which tester
components and instruments must perform. These limits are compromises between what is
12

permissible and what is practical. Every operator must periodically calibrate the tester to assure
that it conforms to the requirements of ASTM E-274. (JJ
Field Test and Evaluation Centers
To aid users of skid resistance testers and to assure that reported skid numbers were
related to a common basis, Field Test and Evaluation Centers (FT & EC) were established at the
Texas Transportation Institute (College Station, Texas) and Ohio State University (East Liberty,
Ohio). At the centers, skid-testers are dynamically calibrated, correlated, and evaluated while
operating personnel are instructed on proper test procedures.
Researchers at the centers calibrate a user's tester against a standard tester. The standard
tester is in turn calibrated against a primary reference tester maintained by the National Bureau
of Standards.
"Standard surfaces" are used for the calibration runs, which span the range of skid
resistance values that are typically encountered in fieldwork. The surfaces are subjected to use
and weather skid resistance variations similar to those experienced by highway pavements.
Because the surfaces are subjected to such conditions, researchers cannot calibrate a tester
directly on them by running a series of skid-tests and making appropriate adjustments until the
mean of the measured values agrees with the skid resistance of the standard test surfaces.
Instead, correlation tests with the secondary tester are made. (1)
Calibration Procedures
There is no way to predict how long a tester will stay calibrated. For practical and
economic reasons a tester may be taken to a field test and evaluation center only occasionally;
tester checks are recommended once every two years. Hence, the user must recalibrate and
maintain the tester between visits to a national center. As a minimum, the following items
require attention:
Speed Measurement — The skid resistance of common pavements is a strong
function of speed. It is therefore essential that test speeds are accurately
measured.
13

Water Application — The water application process involves the properfunctioning of the water nozzle and its correct positioning. In addition, the
discharge rate of the nozzle must be within specifications.
• Wheel Load — As long as no changes have been made on the trailer, the wheelload may be assumed to be unchanged.
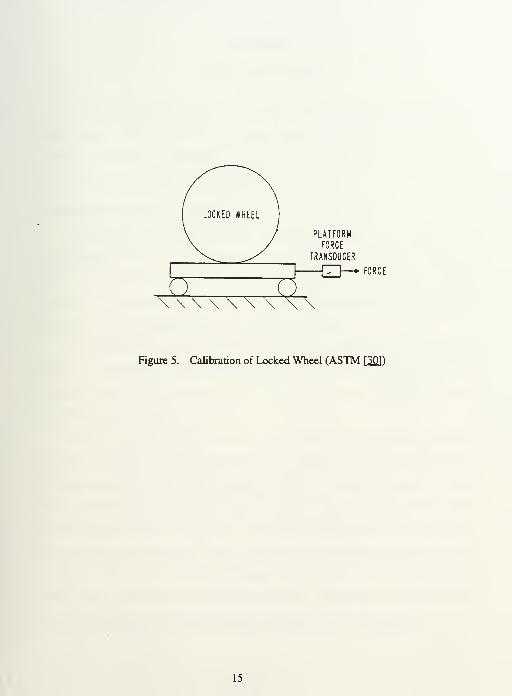
Skid Resistance — A static calibration of the wheel force is performed to simulate
the traction force between the tire and the pavement. The calibration systemconsists of a calibration platform, a horizontal drive mechanism, and a force
transducer. The calibration platform consists of a bearing that is frictionless in all
directions of the horizontal plane; the horizontal plane supports a rigid plate with
a high friction surface. With the test wheel placed on the calibration platform, a
tractive force is applied to the platform by a horizontal drive mechanism (see
Figure 5). The applied force is measured by a force transducer and compared to
the test wheel transducer output. The force is applied in 100 lbf increments up to
80 percent of the wheel load or until the plate starts to slip under the tire,
whichever occurs first. At each increment, the indicators of the platform
transducer and the test wheel transducer are allowed to come to rest and force
readings are recorded. The recommended accuracy is 1 percent or better.
Mechanical or electronic adjustments are made until the force readings are equal.
Alternatively, calibration curves or tables may be prepared to be used as
corrections to measured results. This calibration procedure is performed in
accordance with ASTM Method E-556 (AASHTO Method T-282) and ASTMMethod F-377. (29, 2Q)
• Test Tires — Although test tires in the past have shown remarkable uniformity,
this uniformity cannot be assumed to be true—especially if a tire has been stored
or has seen considerable use. The break-in and conditioning procedures
prescribed by ASTM E-501 should be followed meticulously. Because inflation
pressure is an important variable, it should be measured with a calibrated gauge.
General — All components and functions that have any effect on the validity of
the measured skid resistance values should be checked and corrected as needed.
This may include the cycle timer, brake system performance, and wheelbalance. (1)
Operating Procedures
Operating and data evaluation procedures must also conform to certain limits and
standards. The ASTM E-274 method provides some guidance in performing these procedures;
however, to a large extent, operator performance is a matter of skill, experience, and an
understanding of the skid resistance measuring process. Q)
14

PLATFORM
FORCE
TRANSDUCER
—T7~T—» FORCE
Figure 5. Calibration of Locked Wheel (ASTM W)
15

CHAPTER 2
LITERATURE SEARCH
A literature search was conducted for research reports pertinent to this paper and for
written guidelines on the WSDOT's skid resistance program. Although a substantial amount of
literature was available on pavement skid resistance, only a portion of it was useful for the
examination of minimum skid resistance guidelines.
THE WSDOT SKTD-TESTTNG PROGRAM
The current WSDOT guideline for skid resistance is based, in part, on NCHRP Report 37,
which designates SN = 37 as the recommended minimum skid number (tentative and interim) for
highways. The WSDOT guideline agrees with a 1986 report by Wambolt, et al. that states,
"Based on the experience from many states, it is generally agreed that a skid number of 35 or
greater gives adequate skid resistance under most conditions." (21)
The WSDOT skid-testing program meets the national standards (ASTM) for testing and
calibration. The WSDOT skid-test equipment, calibration, and data storage techniques are
discussed in this section. In addition, the FN inventory and its role in the WSDOT Pavement
Management System database are addressed.
WSDOT has been involved in pavement friction testing with locked-wheel equipment
since 1968. The WSDOT Materials Laboratory, Special Projects Section, is responsible for the
skid-testing program. The intent of the program is to point out those areas that have a potential
problem regarding skidding accidents. WSDOT operates one Cox & Sons Model CS 9000
Locked-Wheel Skid-Tester, in accordance with ASTM Method E-274(80), and uses a ribbed test
tire, in accordance with ASTM E-501. (2£) A picture of the WSDOT skid measurement system
is provided in Figure 6, an interior view in Figure 7, and a nozzle view in Figure 8. (21) The
WSDOT is due to receive a new test trailer in late 1993. The new trailer will meet ASTM E-
274(90) and will introduce many improvements, including more accurate calibration.
16

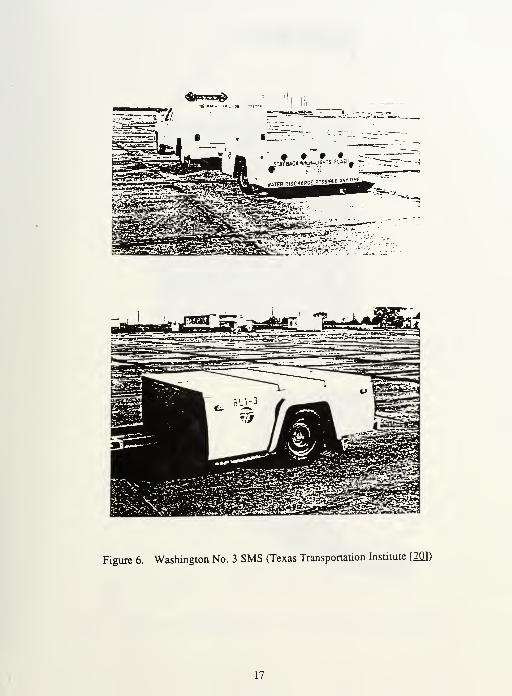
Figure 6. Washington No. 3 SMS (Texas Transportation Institute [2Q])
17

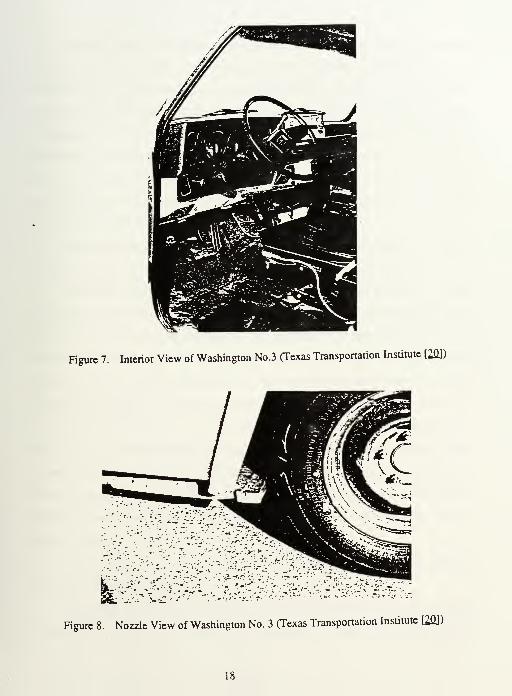
Figure 7. Interior View of Washington No.3 (Texas Transportation Institute [2Q])
Figure 8. Nozzle View of Washington No. 3 (Texas Transportation Institute [20])
18

The Washington State highway system comprises 7,000 centeriine miles. (24) The entire
system is tested every 2 years. The highway system is divided into six districts: each year the
highways in three of the six districts are tested for skid resistance. Districts 1, 3, and 5 are tested
during even-numbered years, and Districts 2, 4, and 6 are tested during odd-numbered years.
The pavement in the left wheel track of the slow lane is tested and recorded at each milepost, in
each direction on multilane highways and one direction on two lane highways. The length of the
test is 117 ft and takes 2 seconds at the standard test speed of 40 mph. (27) Skid resistance
generally does not change drastically over a 1-mile section of highway; therefore, this is a viable
method for testing the whole road network.
Newly paved sections of highway are friction tested as soon as possible after completion.
All lanes are tested in both directions, with a minimum of eight tests per project. ( 2£)
The friction number is recorded at each milepost. The skid-tester generates a computer
output of the measured friction numbers. The results are tabulated by highway, milepost to the
0.01 of a mile, direction of travel, lane, surface type, and speed. The skid numbers are corrected
to a national standard for friction measurements, to which the WSDOT skid-tester has been
calibrated. If the test speed was other than 40 mph, the tests are also corrected to a friction
number at 40 mph. (27J This output is combined into a yearly pavement friction inventory. The
district managers receive their portion of the inventory and are advised to take action on those
roads that have a recorded friction number of less than 35. This guideline to report pavement
friction numbers of less than 35 accompanies the inventory in the form of a memorandum to the
district managers, as shown in Appendix B. (26) The friction numbers are also entered into the
WSDOT Pavement Management System, which compiles data for each milepost in the state
highway system.
For continuity of the test results, no testing is performed during freezing weather
conditions or during heavy rainfall.
The WSDOT skid-testing equipment is calibrated once every 2 years at the Texas
Transportation Institute. In the interim, the equipment is calibrated both statically and
19

dynamically by WSDOT personnel. Because skid-testers operate at relatively high speeds, the
ultimate calibration is a "dynamic" test conducted on a surface of known and near constant
friction properties. The WSDOT skid trailer undergoes this dynamic test an average of once a
month at three specified pavement sections near the WSDOT Materials Laboratory in Olympia,
Washington. Two of the dynamic test sites are asphalt concrete pavements (ACP), SR101 MP
365.00 and SR5 MP 92.00. The third site. SR5 MP 111.00, is a portland cement concrete
pavement (PCCP). At each site 10 tests are run at intervals of 0.10 mile for 1 mile. The results
are generated and later plotted, as shown in Appendix C. After each testing cycle, the results are
Compared to previous cycle results for the corresponding pavement in order to ensure the skid-
test equipment is operating consistently during similar environmental conditions. Precipitation
data from the Olympia weather station are also plotted and used along with the friction number
data to evaluate tester performance. The next best alternative to the dynamic test is a "static"
test, which WSDOT also performs once per month. This "static" test is usually performed on the
same day as the dynamic test. The WSDOT follows the standard procedures for conducting the
static tests (see Calibration Procedures section, Chapter 1, for details).
UNITED STATES LITERATURE
Federal Guidelines
The primary sources for the national position on skid resistance guidelines are the
National Cooperative Highway Research Program (NCHRP) Reports. The NCHRP Report 37
(1967) set SN = 37 as the minimum, tentative, and interim skid resistance requirement for the
national road network. ( 12) The NCHRP Report 151 (1974) investigated locked-wheel
pavement skid-tester correlation and calibration techniques and acceptable windows of error.
( 13) The NCHRP Report 154 (1974) set tentative minimum skid resistance requirements at
intersections. (4)
Federal and State Research
The NCHRP Synthesis of Highway Practice 14 (1972) assembled information on skid
resistance from many highway departments and agencies. (£) The NCHRP Synthesis of
20

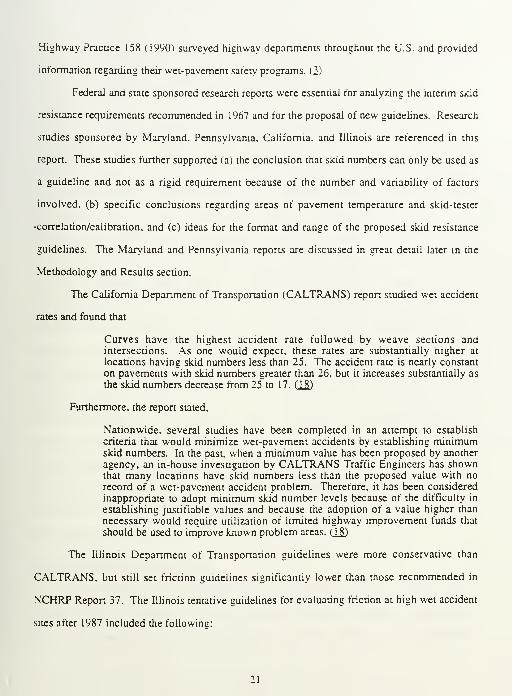
Highway Practice 158 (1990) surveyed highway departments throughout the U.S. and provided
information regarding their wet-pavement safety programs. (3)
Federal and state sponsored research reports were essential for analyzing the interim skid
resistance requirements recommended in 1967 and for the proposal of new guidelines. Research
studies sponsored by Maryland, Pennsylvania. California, and Illinois are referenced in this
report. These studies further supported (a) the conclusion that skid numbers can only be used as
a guideline and not as a rigid requirement because of the number and vanability of factors
involved, (b) specific conclusions regarding areas of pavement temperature and skid-tester
•correlation/calibration, and (c) ideas for the format and range of the proposed skid resistance
guidelines. The Maryland and Pennsylvania reports are discussed in great detail later in the
Methodology and Results section.
The California Department of Transportation (CALTRANS) report studied wet accident
rates and found that
Curves have the highest accident rate followed by weave sections andintersections. As one would expect, these rates are substantially higher at
locations having skid numbers less than 25. The accident rate is nearly constant
on pavements with skid numbers greater than 26, but it increases substantially as
the skid numbers decrease from 25 to 17. (18)
Furthermore, the report stated.
Nationwide, several studies have been completed in an attempt to establish
criteria that would minimize wet-pavement accidents by establishing minimumskid numbers. In the past, when a minimum value has been proposed by another
agency, an in-house investigation by CALTRANS Traffic Engineers has shownthat many locations have skid numbers less than the proposed value with no
record of a wet-pavement accident problem. Therefore, it has been considered
inappropriate to adopt minimum skid number levels because of the difficulty in
establishing justifiable values and because the adoption of a value higher than
necessary would require utilization of limited highway improvement funds that
should be used to improve known problem areas. (18)
The Illinois Department of Transportation guidelines were more conservative than
CALTRANS. but still set friction guidelines significantly lower than those recommended in
NCHRP Report 37. The Illinois tentative guidelines for evaluating friction at high wet accident
sites after 1987 included the following:

(a) if the FN is less than or equal to 30. friction is probably a factor contributing to
wet-pavement accidents.
(b) if the FN is greater than 31 but less than 35, uncertainty exists as to whetherpavement friction is the primary factor, and
(c) if the FN is greater than or equai to 36. some condition other than pavementfriction is probably the primary factor causing wet-pavement accidents. (6)
Practically every state has a skid-testing program. Each program was summarized in
NCHRP Synthesis of Highway Practice 158 (1991). The states were asked to report their criteria
for evaluating skid-tests; state answers ranged from NCHRP Report 37's recommended minimum
skid number of 37 to a variety of acceptable, marginal, and unacceptable skid numbers. The
state guidelines similar to those recommended in this paper are provided in Table 2. Q)
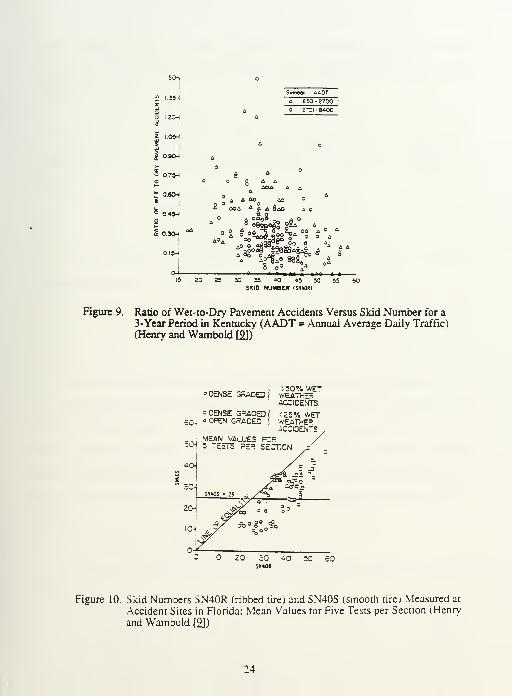
Most of the recent literature on skid-testing encouraged highway departments to use the
smooth tire procedure (ASTM E-524 or AASHTO M-286) for routine measurement. The
literature suggested that if only one tire is to be used, it ought to be the smooth tire; this is
because the smooth tire is equally sensitive to micro- and macro-texture, whereas the ribbed tire
responds primarily to the microtexture. Furthermore, early attempts to relate accident data to
skid resistance measured with a ribbed tire were frustrating. Figure 9 shows that there is a
minimal correlation between the measure of wet-pavement safety and the skid number when
measurements are made with the ribbed tire. Figure 10 compares the measured skid number with
a ribbed tire (SN40R) to that of a smooth tire (SN40SJ- One notices that the level on the vertical
axis that separates most of the high wet accident rate sites from the low wet accident rate sites
is 25. On the other hand, no obvious value on the horizontal axis separates the high- and low-
accident sites. This absence of a value results in an "unclear" level of SN40R lhat separates the
high- and low-accident sites. (&)
INTERNATIONAL LITERATURE
The international arena, particularly Great Britain and Italy, provide a comparison of skid
resistance ranges. The standard in Italy for minimum highway skid resistance is surprisingly
similar to the results in this report. The Great Britain standard, on the other hand, is somewhat
22

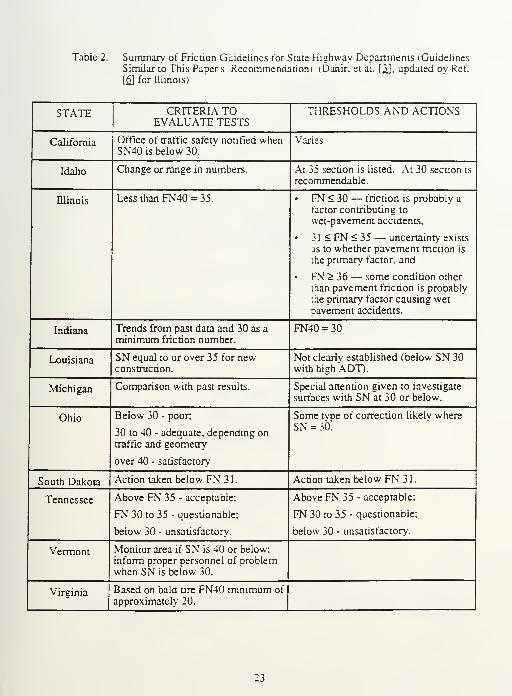
Table 2. Summary of Friction Guidelines tor State Highway Departments (Guidelines
Similar to This Papers Recommendation) (Dahir, et al. [3J, updated by Ref.
[6] for Illinois)
STATE CRITERIA TOEVALUATE TESTS
THRESHOLDS AND ACTIONS
California Office of traffic safety notified whenSN40 is below 30.
Vanes
Idaho Change or range in numbers. At 35 section is listed. At 30 section is
recommendable.
Illinois Less than FN40 = 35. • FN < 30— friction is probably a
factor contributing to
wet-pavement accidents,
• 31 < FN < 35 — uncertainty exists
as to whether pavement friction is
the primary factor, and
• FN > 36— some condition other
than pavement friction is probably
the primary factor causing wetpavement accidents.
Indiana Trends from past data and 30 as a
minimum friction number.FN40 = 30
Louisiana SN equal to or over 35 for newconstruction.
Not clearly established (below SN 30with high ADT).
Michigan Comparison with past results. Special attention given to investigate
surfaces with SN at 30 or below.
Ohio Below 30 - poor:
30 to 40 - adequate, depending on
traffic and geometry
over 40 - satisfactory
Some tvpe of correction likelv where
SN = 30.
South Dakota Action taken below FN 31. Action taken below FN 31.
Tennessee Above FN 35 - acceptable;
FN 30 to 35 - questionable:
below 30 - unsatisfactory.
Above FN 35 - acceptable:
FN 30 to 35 - questionable:
below 30 - unsatisfactory.
Vermont Monitor area if SN is 40 or below;
inform proper personnel of problemwhen SN is below 30.
Virginia Based on bald tire FN40 minimum of
approximately 20.
23

50^
Symeoi WOTA 650 -2700 1
270 -6400 1
1.20-
I.OW*
OSO^ a.
0.75-'
. « •g A A
0£Oh
2 OOA 4 «4 6ao a
a OOqS a043*
0.30H.
0.13-1
0-
A1 To "^ °*
20 253055^0 45 505360SKID NUMBER (SNUOR)
Figure 9. Ratio of Wet-to-Dry Pavement Accidents Versus Skid Number for a
3-Year Period in Kentucky (AADT = Annual Average Daily Traffic)
(Henry and Wambold [£])
>50% WFTo DENSE GRADED WEATFE3
ACCIDENTS
aOENSE GRADED/ <25% WETSO-. ' OPEN GRADED I WEATHER
ACCIOENTSMEAN VALUES FOR
=01 5 TESTS FER SECTION
Figure 10. Skid Numbers SN40R (ribbed tire) and SN40S (smooth tire) Measured at
Accident Sites in Florida; Mean Values for Five Tests per Section (Henrv
and Wambold [£])
24

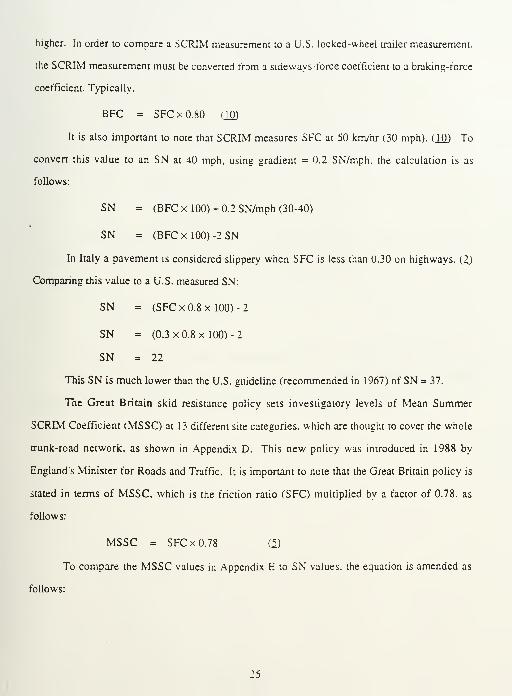
higher. In order to compare a SCRIM measurement to a U.S. locked-wheei trailer measurement.
the SCRIM measurement must be converted from a sideways-force coefficient to a braking-force
coefficient. Typically,
BFC = SFCx0.80 QO)
It is also important to note that SCRIM measures SFC at 50 knvhr (30 mph). (JjQ) To
convert this value to an SN at 40 mph, using gradient = 0.2 SN/mph. the calculation is as
follows:
SN = (BFC x 100) + 0.2 SN/mph (30-40)
SN = (BFC x 100) -2 SN
In Italy a pavement is considered slippery when SFC is less than 0.30 on highways. (2)
Comparing this value to a U.S. measured SN:
SN = (SFC x 0.8x100) -2
SN = (0.3 x 0.8 x 100) -2
SN = 22
This SN is much lower than the U.S. guideline (recommended in 1967) of SN = 37.
The Great Britain skid resistance policy sets investigatory levels of Mean Summer
SCRIM Coefficient (MSSC) at 13 different site categories, which are thought to cover the whole
trunk-road network, as shown in Appendix D. This new policy was introduced in 1988 by
England's Minister for Roads and Traffic. It is important to note that the Great Britain policy is
stated in terms of MSSC, which is the friction ratio (SFC) multiplied by a factor of 0.78, as
follows:
MSSC = SFC x 0.78 (5)
To compare the MSSC values in Appendix E to SN values, the equation is amended as
follows:

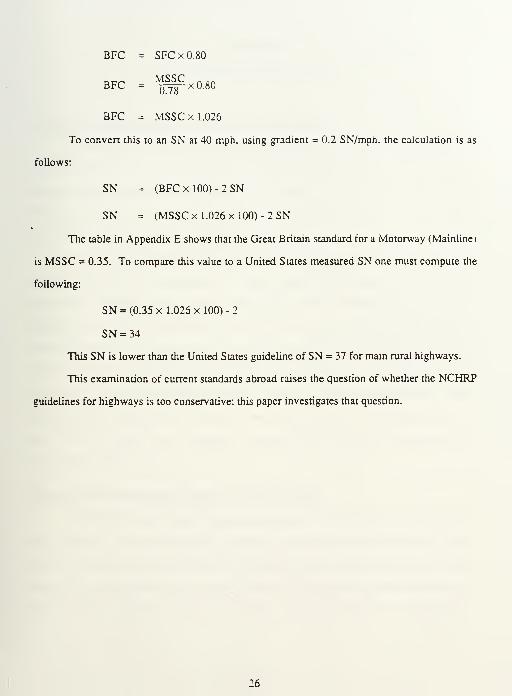
BFC = SFCxO.80
BFC = If^O-SO
BFC = MSSCx 1.026
To convert this to an SN at 40 mph, using gradient = 0.2 SN/mph, the calculation is as
follows:
SN = (BFC x 100) - 2 SN
SN = (MSSCxl.026xl00)-2SN
The table in Appendix E shows that the Great Britain standard for a Motorway (Mainline
)
is MSSC = 0.35. To compare this value to a United States measured SN one must compute the
following:
SN = (0.35x1.026x100) -2
SN=34
This SN is lower than the United States guideline of SN = 37 for main rural highways.
This examination of current standards abroad raises the question of whether the NCHRP
guidelines for highways is too conservative; this paper investigates that question.
26

CHAPTER 3
METHODOLOGY AND RESULTS
FRICTION GUIDELINES FOR MAIN RURAL HIGHWAYS
It is important to recognize that the skid resistance value of SN = 37 recommended in
NCHRP Report 37 is not a standard and is based on 1967 knowledge. Various jurisdictions have
adopted or prescribed minimum skid resistance values based on their own considerations. These
considerations have included intuition and experience. Sometimes jurisdictions have included
provisions for higher SN values at specified locations. Q)
In their report (NCHRP Report 37), Kummer and Meyer developed the minimum skid
resistance requirements by establishing friction factors based on traffic needs. They then tackled
the problem of defining minimum skid resistance requirements. The next section provides a
detailed review of their methodology, followed by an application of up-to-date changes to
determine the effect of temperature and calibration accuracy on skid resistance values. The
purpose of updating the skid resistance guideline is to prevent the use of an excessively high
minimum SN. An artificially high SN increases the total cost of skid-proofing a highway system
without providing a significant benefit to traffic and accident prevention. The NCHRP Report 37
states, "In the author's view excessive minimum skid resistance requirements are
self-defeating." (12)
THE 1967 RECOMMENDED MINIMUM SKID NUMBER
The NCHRP Report 37 showed that a friction number of 40 satisfied the normal frictional
needs of traffic on main rural highways, and, hence, on any road that carried traffic at lower
speeds. Skidding accident studies and a comparison of driver deceleration patterns during
braking and cornering proved that a friction number of 40 satisfied the frictional needs of all
normal vehicle maneuvers during acceleration, driving, cornering, and deceleration.
27

Furthermore, the studies showed that a friction number of 40 did this over a wide speed range
(except toward the end of braking maneuvers that lead to a full stop).
Under ideal conditions—that is, in the absence of other friction components (laterally
during acceleration and braking, and fore and aft during cornering) and wheel load fluctuations
(caused either by tire runout, wheel imbalance, or pavement irregularities)—a friction number of
40 would satisfy the normal frictionai needs of traffic. However, in actual conditions, a higher
friction number is needed to account for other friction components and wheel load fluctuations
that are present in all driving.
To convert friction numbers that satisfy the normal needs of traffic into skid numbers.
Kummer and Meyer made reasonable allowances for the following:
a. other friction components ,
b. wheel load fluctuations,
c. K-factors,
d. wet pavement temperature, ande. machine error of present skid trailers.
Accordingly, they had five steps in the conversion process. Each step was broken down
into lines, as summarized in Table 3 and Figure 11. These steps are examined for opportunities
to adjust variables and thus produce a new skid number. It is helpful to follow Table 3 as the
steps are reviewed.
Step 1
The minimum required resultant friction number, FN , is determined. The FN assures
the availability of friction for the principal vehicle maneuver under ideal conditions (FNo), and
also allows for an additional friction component in the fore and aft or the lateral direction.
Line 1: FN = 40 is the minimum friction number for the speed range 40 mph to
80 mph; this number was established by a driver behavior study. The FN
increases linearly to FN = 50 at mph because of the higher decelerations
required at the end of a stop.
28

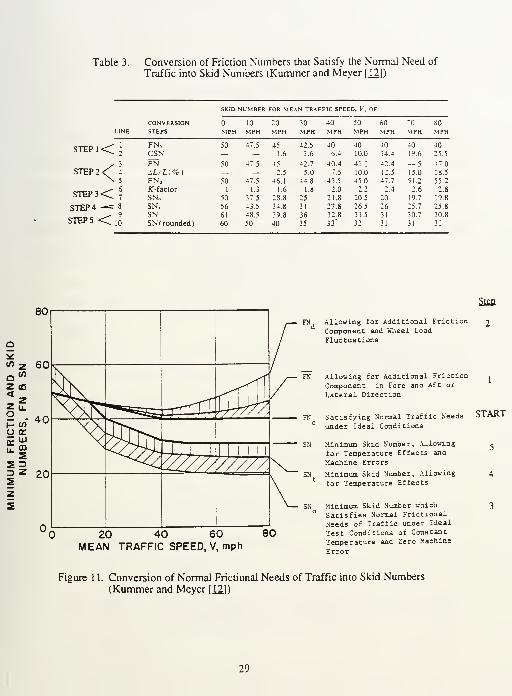
Table 3. Conversion of Friction Numbers that Satisfy the Normal Need of
Traffic into Skid Numbers (Kummer and Meyer [12])
CONVERSIONLINE STEPS
STEP 1 <<J
STEP2<^ 4
STEP3< 6
7
STEP4 -= 8
STEP 5 <io
FN„CSNFN\L/L(%)FN.K-factor
SN«SN,SNSN( rounded)
SKID NUMBER FOR MEAN TRAFFIC SPEED, V , OF
10 20
MPH MPH MPH30
MPH40
MPH50 60 "0
MPH MPH
47.5
47.5
1.3
37.5
43.5
48.5
45
1.6
45
2.5
46.1
1.6
23.8
34.8
39.8
40
42.5
3.6
42.7
5.0
44.8
1.8
25
31
36
35
406.4
40.4
7.5
43.5
2.0
21.8
27.8
32.833~
40
10.0
41.1
10.0
45.0
20.5
26.5
31.5
40
14.4
42.4
12.5
47.7
2.4
20
26
31
31
PH
40
19.6
44.5
15.0
51.2
2.6
19.7
25.7
30.7
31
80
MPH
40
25.5
47.0
18.5
55.2
2.8
19.8
25.8
30.8
31
Step
20 40 60MEAN TRAFFIC SPEED, V, mph
80
FN, Allowing for Additional Friction
Component and Wheel Load
Fluctuations
FN Allowing for Additional Friction
Component in Fore and Aft or
Lateral Direction
FN Satisfying Normal Traffic Needs
under Ideal Conditions
SN Minimum Skid Number, Allowing
for Temperature Effects and
Machine Errors
SN Minimum Skid Number, Allowing
for Temperature Effects
Minimum Skid Number which
Satisfies Normal Frictional
Needs of Traffic unaer Ideal
Test Conditions of Constant
Temperature and Zero Machine
Error
START
Figure 1 1. Conversion of Normal Frictional Needs of Traffic into Skid Numbers(Kummer and Meyer 1121 )
29

where CSN =
C
Line 2: CSN = CxV^
cornering slip number,
steering correction constant = ^ttt , and
V = speed.
The cornering slip number (CSN) factor is applied to account for the lateral friction
component due to steering corrections made by the driver. The corrections are deviations from
the driver's intended path and may be caused by road crown, inattention, and cross winds, to
name a few. The researchers measured the vehicle's lateral decelerations that resulted from
driving and braking on a straight course. A cornering slip number of up to 10 at 50 mph, which
increases to a maximum of 20 at 70 mph, was also measured.
FN =
FN =
V(FN )2 + (CSN)2
resultant friction number.
Line 3:
where
Step 2
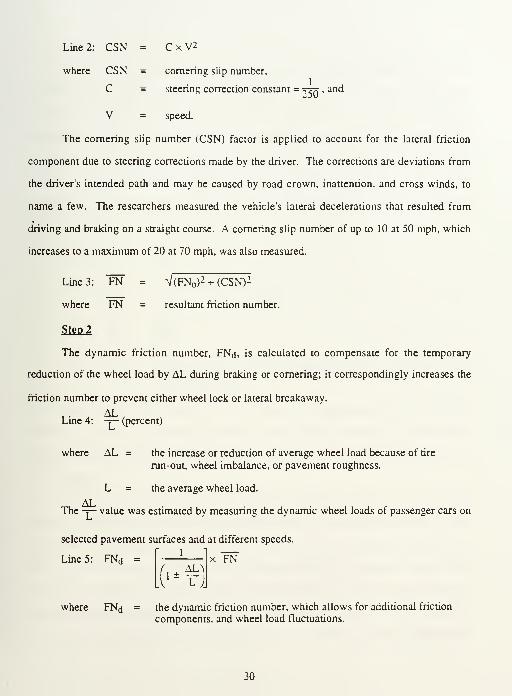
The dynamic friction number, FNd, is calculated to compensate for the temporary
reduction of the wheel load by AL during braking or cornering; it correspondingly increases the
friction number to prevent either wheel lock or lateral breakaway.
ALLine 4: -y— (percent)
where AL =
L =
AL
the increase or reduction of average wheel load because of tire
run-out, wheel imbalance, or pavement roughness.
the average wheel load.
The -j- value was estimated by measuring the dynamic wheel loads of passenger cars on
selected pavement surfaces and at different speeds.
1
Line 5: FNd =
where FNd
1±AL
x FN
the dynamic friction number, which allows for additional friction
components, and wheel load fluctuations.
30

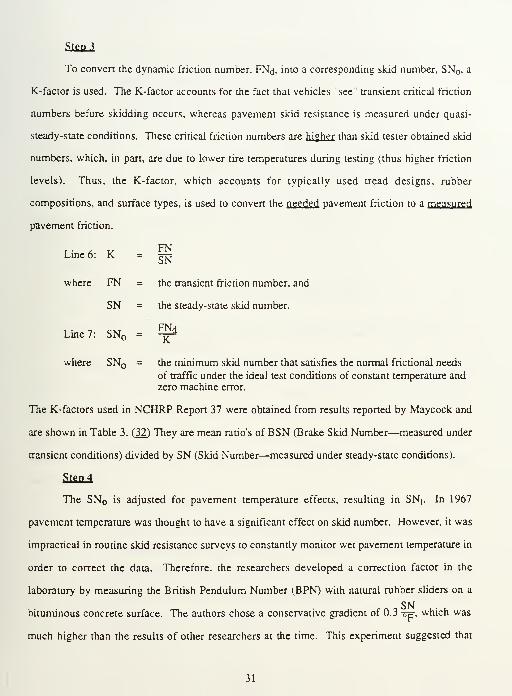
Step 3
To convert the dynamic friction number, FNd, into a corresponding skid number, SN , a
K-factor is used. The K-factor accounts for the fact that vehicles "see" transient critical friction
numbers before skidding occurs, whereas pavement skid resistance is measured under quasi-
steady-state conditions. These critical friction numbers are hi gher than skid tester obtained skid
numbers, which, in part, are due to lower tire temperatures during testing (thus higher friction
levels). Thus, the K-factor, which accounts for typically used tread designs, rubber
compositions, and surface types, is used to convert the needed pavement friction to a measured
pavement friction.
Line 6: K
where FN = the transient friction number, and
SN = the steady-state skid number.
FNSN
Line 7: SN =FNdK
where SN = the minimum skid number that satisfies the normal frictional needs
of traffic under the ideal test conditions of constant temperature andzero machine error.
The K-factors used in NCHRP Report 37 were obtained from results reported by Maycock and
are shown in Table 3. (32) They are mean ratio's of BSN (Brake Skid Number—measured under
transient conditions) divided by SN (Skid Number—measured under steady-state conditions).
Step 4
The SN is adjusted for pavement temperature effects, resulting in SNt
. In 1967
pavement temperature was thought to have a significant effect on skid number. However, it was
impractical in routine skid resistance surveys to constantly monitor wet pavement temperature in
order to correct the data. Therefore, the researchers developed a correction factor in the
laboratory by measuring the British Pendulum Number (BPN) with natural rubber sliders on a
SNbituminous concrete surface. The authors chose a conservative gradient of 0.3 -op which was
much higher than the results of other researchers at the time. This experiment suggested that
31

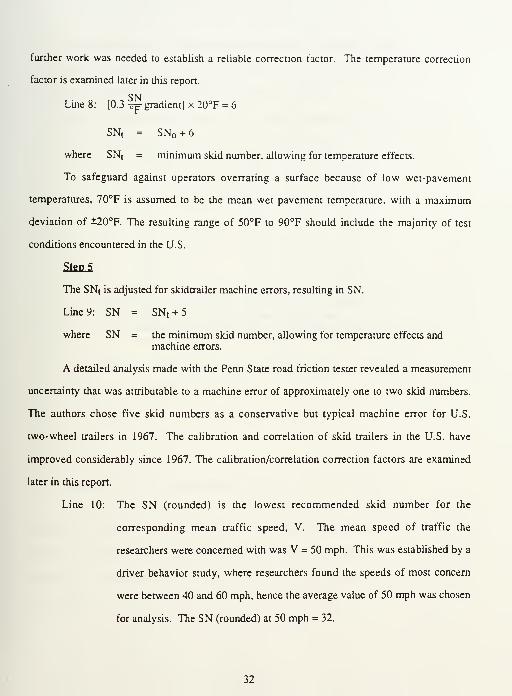
further work was needed to establish a reliable correction factor. The temperature correction
factor is examined later in this report.
SNLine 8: [0.3^ gradient] x 20°F = 6
SNt
= SN + 6
where SNt = minimum skid number, allowing for temperature effects.
To safeguard against operators overrating a surface because of low wet-pavement
temperatures, 70°F is assumed to be the mean wet pavement temperature, with a maximum
deviation of ±20°F. The resulting range of 50°F to 90°F should include the majority of test
conditions encountered in the U.S.
Step 5
The SNt is adjusted for skidtrailer machine errors, resulting in SN.
Line 9: SN = SNt+ 5
where SN = the minimum skid number, allowing for temperature effects andmachine errors.
A detailed analysis made with the Penn State road friction tester revealed a measurement
uncertainty that was attributable to a machine error of approximately one to two skid numbers.
The authors chose five skid numbers as a conservative but typical machine error for U.S.
two-wheel trailers in 1967. The calibration and correlation of skid trailers in the U.S. have
improved considerably since 1967. The calibration/correlation correction factors are examined
later in this report.
Line 10: The SN (rounded) is the lowest recommended skid number for the
corresponding mean traffic speed, V. The mean speed of traffic the
researchers were concerned with was V = 50 mph. This was established by a
driver behavior study, where researchers found the speeds of most concern
were between 40 and 60 mph, hence the average value of 50 mph was chosen
for analysis. The SN (rounded) at 50 mph = 32.
32

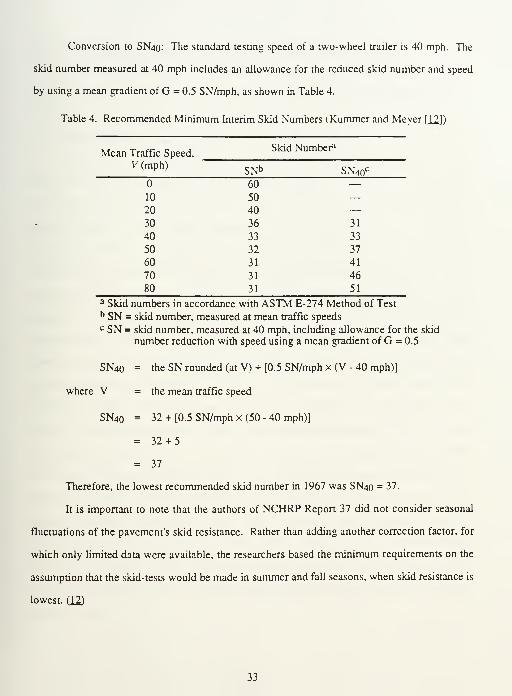
Conversion to SN40: The standard testing speed of a two-wheel trailer is 40 mph. The
skid number measured at 40 mph includes an allowance for the reduced skid number and speed
by using a mean gradient of G = 0.5 SN/mph, as shown in Table 4.
Table 4. Recommended Minimum Interim Skid Numbers (Kummer and Meyer [12])
Mean Traffic Speed,Skid Number1
V (mph)SNb SN4n
c
60 —10 50 —20 40 —30 36 31
40 33 33
50 32 37
60 31 41
70 31 46
80 31 51
a Skid numbers in accordance with ASTM E-274 Method of Testb SN = skid number, measured at mean traffic speedsc SN = skid number, measured at 40 mph, including allowance for the skid
number reduction with speed using a mean gradient of G = 0.5
SN40 = the SN rounded (at V) + [0.5 SN/mph x (V - 40 mph)]
where V = the mean traffic speed
SN40 = 32 + [0.5 SN/mph x (50 - 40 mph)]
= 32 + 5
= 37
Therefore, the lowest recommended skid number in 1967 was SN40 = 37.
It is important to note that the authors of NCHRP Report 37 did not consider seasonal
fluctuations of the pavement's skid resistance. Rather than adding another correction factor, for
which only limited data were available, the researchers based the minimum requirements on the
assumption that the skid-tests would be made in summer and fall seasons, when skid resistance is
lowest. Q2)
33

RECOMMENDED CHANGES TO THF 1967 MINIMUM SKID NUMBER
Adjustments were applied to the previously derived minimum skid number to reflect
current knowledge. These adjustments specifically addressed step 4, pavement temperature
effects, step 5, machine errors, and lastly, speed gradient.
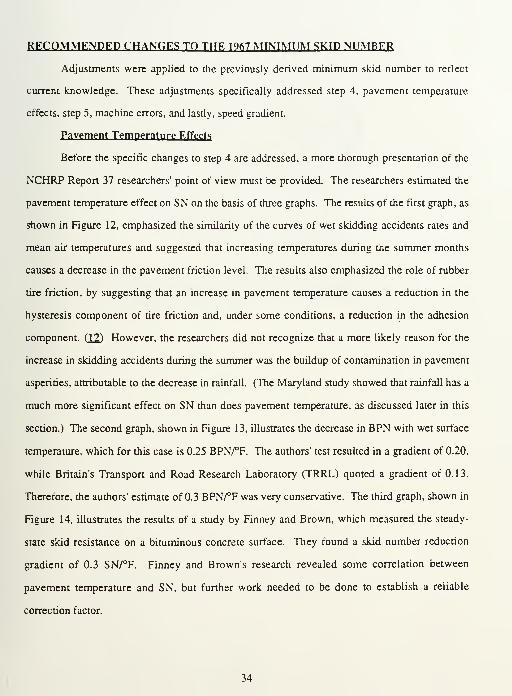
Pavement Temperature Effects
Before the specific changes to step 4 are addressed, a more thorough presentation of the
NCHRP Report 37 researchers' point of view must be provided. The researchers estimated the
pavement temperature effect on SN on the basis of three graphs. The results of the first graph, as
shown in Figure 12, emphasized the similarity of the curves of wet skidding accidents rates and
mean air temperatures and suggested that increasing temperatures during the summer months
causes a decrease in the pavement friction level. The results also emphasized the role of rubber
tire friction, by suggesting that an increase in pavement temperature causes a reduction in the
hysteresis component of tire friction and, under some conditions, a reduction in the adhesion
component. (12^ However, the researchers did not recognize that a more likely reason for the
increase in skidding accidents during the summer was the buildup of contamination in pavement
asperities, attributable to the decrease in rainfall. (The Maryland study showed that rainfall has a
much more significant effect on SN than does pavement temperature, as discussed later in this
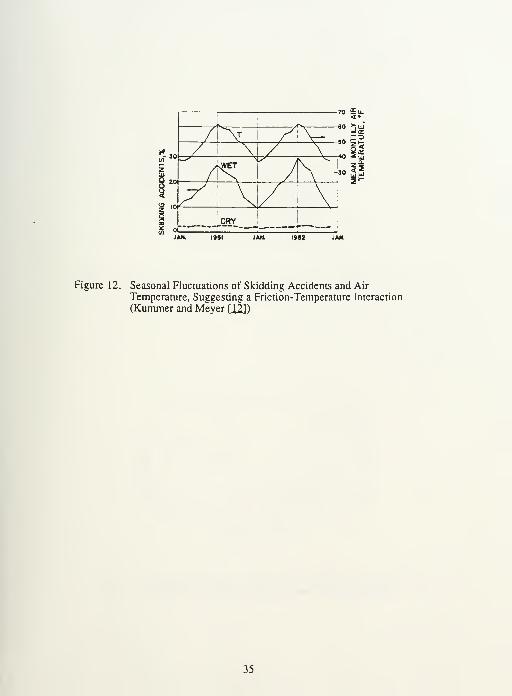
section.) The second graph, shown in Figure 13, illustrates the decrease in BPN with wet surface
temperature, which for this case is 0.25 BPN/°F. The authors' test resulted in a gradient of 0.20,
while Britain's Transport and Road Research Laboratory (TRRL) quoted a gradient of 0.13.
Therefore, the authors' estimate of 0.3 BPN/°F was very conservative. The third graph, shown in
Figure 14, illustrates the results of a study by Finney and Brown, which measured the steady-
state skid resistance on a bituminous concrete surface. They found a skid number reduction
gradient of 0.3 SN/°F. Finney and Brown's research revealed some correlation between
pavement temperature and SN, but further work needed to be done to establish a reliable
correction factor.
34

7*^ '
-/Tn/ \ /w \
X 1
V/ \! DRY
'II40 2£
so <£
Figure 12. Seasonal Fluctuations of Skidding Accidents and Air
Temperature, Suggesting a Friction-Temperature Interaction
(Kummer and Meyer [121 )
35

80
<r
en cd
E 1 60
CDazLU0.
40.
U/T^Tr?
CEMENT CONCRETENATURAL RUBBER
50 70
WET SURFACE TEMPERATURE, T, »F
90
Figure 13. Reduction of British Pendulum Number due to Temperature-Originated
Decrease in Rubber Damping (Kummer and Meyer Q2])
40
to 30
20
10
-PM-
BITUMINOUS CONCRETEV»40mph —M 50
I I
AM-
9 15 9 1
TIME OF TEST, hrt
Figure 14. Influence of Hourly Changes in Wet Surface Temperatures on
Steady-State Skid Number (Kummer and Meyer [J2])
36

Recent research reveals that SN corrections for pavement temperature are not necessary.
Even in 1967, researchers were not sure how much pavement temperature affected SN. The
authors of NCHRP Report 37 stated, "Although it can safely be stated that the slip and skid
resistance of a tire-pavement combination will, as a rule decrease with higher temperatures, it is
as yet impossible to reliably predict the reduction." Consequently, the researchers made a
conservative correction to the SN that was based on the knowledge they had at that time. Q2)
Although it has long been recognized that skid resistance measurements exhibit short-
term variations because of pavement temperature effects (skid resistance generally decreases as
the temperature increases), the degree of the effects is debated. The NCHRP Report 37
suggested a SN/°F gradient of 0.3; however, more recent reports have suggested a much lower
gradient, which incidentally has a negligible effect on the final skid number. In NCHRP
Report 151 (1974) researchers concluded from tests that temperature effects are very small and
are often overshadowed by the data spread because of other causes. Researchers also found that
correction factors vary with pavement type. Furthermore, to determine temperature correction
factors, a single skid-tester should be used in a large number of repeat tests. The tests should be
carried out over a large temperature range and within a short period. Unless the data spread from
other sources can be kept to a minimum, temperature corrections need not be considered.
Specifically, the report concluded the following:
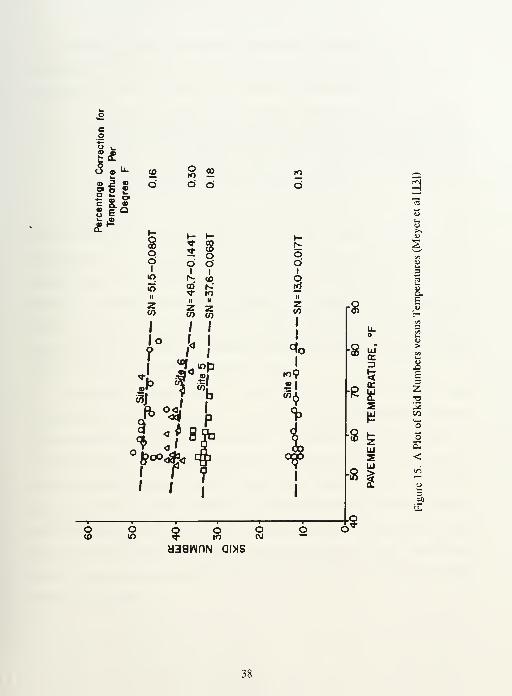
1. Temperature correction factors are small, on the order of 2 percent per 10°F (see
Figure 15). In comparison to the previously mentioned gradient, which resulted
in a correction of 6 SN, this gradient yields a correction of 0.04 SN, as follows:
[0.02 SN/10°F gradient] x 20°F = 0.04 SN
This is clearly an insignificant correction.
2. Because of the slight effect of temperature on skid resistance, correction should be
attempted only if both skid resistance and temperature measurements are
sufficiently reliable. (13)
37

.8
co
1 -
I*
si !2 i *eg®« c Qo 5:
ro —O d
?
uu
r8
•8
15 |
Hi
•8
8
:?
d38WflN GIXS
38

Researchers have also concluded from recent studies that pavement temperature does not
appreciably affect skid resistance. The Maryland Department of Transportation sponsored a
research study in 1986 to investigate seasonal variations of friction numbers. It concluded.
Researchers are divided when it comes to conclusions relative to the effects of
pavement temperature on friction numbers. Graphs of the data derived from this
study [as shown in Appendix E] leave little doubt as to where Maryland will stand
on this issue. As can be seen, there is no discernible relationship between the twoparameters. Collaboration of this can be obtained by scrutinizing the data
resulting from regression analyses [as shown in Appendix E]. Not only are the
coefficients virtually zero, but the slopes of the lines show that friction numbersare not effected [sic] by the pavement temperature. (14)
Researchers agree that in both northern and southern states, short-term variations in skid
resistance appear to be the result of variations in local weather conditions, specifically rainfall
and temperature. In 1989, rainfall was shown to have a more pronounced effect on skid
resistance than pavement temperature in a research report by the Pennsylvania Transportation
Institute, in coordination with the Federal Highway Administration. The report stated, "It is
evident in a series of measurements from Florida that SN40 decreases to a minimum value by
about midyear and then increases, as contrasted with Texas during a dry year, when there is very
little, if any, time-of-year effect [see Appendix F]." (22)
The effect of pavement temperature on skid number can be further analyzed by a model
developed by the Pennsylvania researchers. The researchers developed and validated procedures
for normalizing pavement friction measurements for seasonal and short-term variations. A
generalized predictor model was developed from the statistical analysis of skid resistance
measurements taken frequently during the season in three geographic areas. With realistic
temperature variations, this model resulted in only slight and inconsistent variations of SN40 with
pavement temperature. This slight variation was evident from graphs of the data from Florida,
New York, Pennsylvania, and San Angelo, Texas (see Appendix F). (22J Therefore, this
research supports the conclusion that pavement temperature does not significantly affect
pavement skid resistance.
39

A statement by Kennedy, et al. from Britain, partially supports the position that a
temperature correction factor is not necessary for skid-testing in the U.S. (in accordance with
ASTM Method E-274). Kennedy stated.
Increasing the (pavement) temperature reduces SFC by about 0.003 units per °Cbut surfacings with a higher coefficient of friction tend to suffer a greater
reduction. The effect is not particularly significant over the normal working rangeof temperatures in a particular area, but can be significant when equipment with
noncontinuous types of operation is used; systems with continuous measurementof skid resistance need only to ensure that equilibrium working temperatures havebeen reached, normally by testing for about 500 m (1640 ft), prior to recording onthe survey lengths. (10)
The testing method in the U.S. is not continuous; however, because the locked test wheel
is allowed to slide on the pavement for a certain distance to permit the temperature in the contact
area to stabilize, it could be argued that equilibrium temperatures are reached and a correction
factor is not necessary.
Furthermore, when the pavement temperature is high, it is brought down to an
equilibrium temperature by the ambient temperature of the water that is applied to the pavement
ahead of the wheel before and during wheel lockup. This is further justification for not applying
a correction factor for pavement temperature.
Machine Error Effects
In 1967, when NCHRP Report 37 was published, the national Field Test and Evaluation
Centers (FT & EC) had not yet been established. Not until 1971 did the Federal Highway
Administration (FHWA) establish the centers to calibrate and correlate locked-wheel skid trailers
in order to reduce interstate variations in locked-wheel skid measurements of pavement
surfaces. (20)
In NCHRP Report 151 (1974), "Locked-Wheel Pavement Skid-Tester Correlation and
Calibration Techniques," the standard deviation of mean skid numbers was reduced from 4.08 to
1.04 after corrective measures, including calibrations, were applied. The factors thought to be
most responsible for the initially poor correlation were, in order of decreasing effect, force
calibration and wheel load errors, chart interpretation and evaluation, watering systems, and
temperature effects. Because of NCHRP Report 151's findings, significant improvements were
40

made in methods that could be controlled—these methods included all those stated above except
temperature.
The NCHRP Report 151 listed the error sources in skid-testing and the estimated error
bands at 40 mph (as shown in Appendix H, Table 1). From these estimates, the predicted total
error band for inventory testing by a single tester was calculated to be 2.4 SN for the "reduced"
condition (as shown in Appendix H, Table 2). Reduced refers to the decrease in errors resulting
from improved procedures, correction of data, and improved equipment. (13)
Furthermore, the allowable machine error stated in ASTM E-274 is a standard deviation
of*2 SN. Using a one-sided 95 percent confidence interval, the calculated machine error is
(2) (1.645) = 3.29 (or approximately 3).
Given the improved and standardized calibration procedures described above, the
machine error correction factor can safely be decreased to 3 SN.
Speed Gradient
The WSDOT mean speed gradient (G) is 0.2 SN/mph versus the G = 0.5 SN/mph in
NCHRP Report 37. This is based on calibration equations developed at TTI (as shown in
Appendix I).
REVISED SKIP NUMBER
On the basis of the findings discussed above, the correction factor for temperature effects
(6 SN) can be deleted and the correction factor for machine errors (5 SN) can be decreased to
3 SN. The result is as follows:
SN = SN +3
SN (at V = 50 mph) = 20.5 + 3 = 23.5
SN (rounded) = 24
SN40 = SN (rounded) + [0.2 SN/mph x (V - 40 mph)]
SN40 = 24 + [0.2 SN/mph x (50 - 40 mph)]
SN40 = 24 + 2 = 26
The revised minimum skid number is SN40 = 26 (revised in that it is derived using the NCHRP
methodology with improved inputs).
41

CHAPTER 4
SUMMARY
GUIDELINE
This paper examined NCHRP Report 37 (1967), which set a recommended minimum
skid number guideline of 37 for highways. Adjustments were made to the NCHRP Report 37
methodology for current knowledge in the areas of pavement temperature and machine errors
and their effect on pavement skid resistance. The resulting minimum skid number guideline was
calculated to be 26.
WSDOT uses AASHTO terminology, which assigns friction number (FN) to represent
the identical measured value of skid resistance as SN. Therefore, the recommended minimum
friction number guideline for WSDOT is 26. A CALTRANS report (18) concluded that the
accident rate was nearly constant on pavements with friction numbers greater than 26, but
increased substantially as the friction numbers decreased from 25 to 17. This supports the
suggested guideline.
State DOT's have generally not assigned a single minimum friction value as policy for
highway skid resistance. The issue is difficult because of the number of factors affecting the
availability of skid resistance (as described in the Background section, Chapter 1) and sensitive
because highway departments should be concerned with pavements in real need of surface
friction improvement. Consequently, state DOT's generally prefer to use a range of friction
values.
USE OF SMOOTH AND RIBBED STANDARD TEST TIRES FOR NETWORKTESTING
Given the research results by Henry and Wambolt (8) on the smooth tire procedure for
routine skid-testing (ASTM E-524 or AASHTO M-286), this measurement process appears
promising. Their research demonstrated that if only one tire is used, it should be the smooth tire
42

because of its equal sensitivity to micro- and macro-texture. Adjustments must be made to the
recommendations of this report if a smooth tire is used.
LIMITATIONS OF USING FN ALONE FOR PAVEMENT MANAGEMENTDECISIONS
It is essential to remember that roads should not be ranked by friction number only.
Consider the example of a long, straight road with a friction number of 25 and an ADT of 1.
This road should not be a concern if many other roads have high ADT values, curves,
intersections, etc., and have the same or even higher FN values. These roads would be more
lik'ely to have wet weather accidents.
In fact, WSDOT must analyze wet-pavement accident rates first, before skid resistance
data, when preparing the list of hazardous sites by priority order. This is recommended by
FHWA Technical Advisory T5040.17 (as shown in Appendix J). (31)
Finally, to fully evaluate the risk of a wet-pavement accident, all factors that influence
demand for friction and available friction must be considered. This is difficult because wet-
pavement accidents are caused by complex interactions among many roadway, vehicle, human,
and environmental factors. Accidents also occur because of unpredictable factors such as
inattentiveness, misjudgment, recklessness, and random variables such as unforeseeable events
or obstacles. Realizing this, pavement engineers do their best to provide reasonably safe
highways through routine skid-testing and experience. (JJ
43


ACKNOWLEDGMENTS
I wish to thank Newton Jackson, Keith Anderson and Linda Pierce of the Washington
State Department of Transportation (WSDOT) for their cooperation and assistance in conducting
this research. Also instrumental was Jeffrey Donahue, the Transportation Engineer in charge of
operation and maintenance of WSDOT's skid trailer, and his crew,
I also wish to thank Professor Joe Mahoney for his role as advisor.
44

REFERENCES
1. Byrd, Tallamy, MacDonald and Lewis. "Training Course: Skid Resistance
Measurements and Design, Instructor Notebook." U.S. Department of
Transportation, Federal Highway Administration, and National HighwayInstitute Contract DTFH61~-80-C-00023FHWA, 1981.
2. Camomilla, G. and M. Malgarini, G. Peroni "High-Performance Measurementsfor Programming and Controlling Maintenance of Surface Characteristics:
Operational Systems in Use on Italian Motorways." Surface
Characteristics ofRoadways: International Research and Technologies,
ASTM STP 1031, W.E. Meyer and J. Reichert, Eds., American Society for
Testing and Materials, Philadelphia, pp. 305-326, 1990.
3. Dahir, S.H.M. and W.L. Gramling. "Wet-Pavement Safety Programs," National
Cooperative Highway Research Program (NCHRP) Report 158,
Washington, D.C., Transportation Research Board, July, 1990.
4. Farber, E. and M.S. Janoff, S. Cristinzio, J.G. Blubaugh, W. Reisener, W.Dunning. "Determining Pavement Skid-Resistance Requirements at
Intersections and Braking Sites," National Cooperative Highway ResearchProgram (NCHRP) Report 154, Washington, D.C., Transportation
Research Board, 1974.
5. Gargett, T. "The Introduction of a Skidding-Resistance Policy in Great Britain."
Surface Characteristics ofRoadways: International Research andTechnologies, ASTM STP 1031, W^E. Meyer and J. Reichert, Eds.,
American Society for Testing and Materials, Philadelphia, pp. 30-38,
1990.
6. Hall, J. P. and D.D. Bernardin, J.G. Gehler. "Overview of Smooth- and Treaded-
Tire Friction Testing by Illinois Department of Transportation." PavementDesign, Management, and Performance, Transportation Research Record1348, Washington, D.C., Transportation Research Board, pp. 43-48, 1992.
7. Henry, J.J. "Tire Wet-Pavement Traction Measurement: A State-of-the-Art
Review." The Tire Pavement Interface, ASTM STP 929, M.G. Pottinger
and T.J. Yager, Eds., American Society for Testing and Materials,
Philadelphia, pp. 3-25, 1986.
8. Henry, J.J. and J.C. Wambold. "Use of Smooth-Treaded Test Tire in Evaluating
Skid Resistance." Pavement Design, Management, and Performance,
Transportation Research Record 1348, Washington, D.C., Transportation
Research Board, pp. 35-42, 1992.
9. Highway Research Board. "Skid Resistance," National Cooperative HighwayResearch Program (NCHRP) Synthesis ofHighway Practice 14,
Washington, D.C., Highway Research Board, 1972.
45

10. Kennedy, C.K., and A.E. Young, I. A. Butler. "Measurement of SkiddingResistance and Surface Texture and the Use of Results in the UnitedKingdom." Surface Characteristics ofRoadways: International Researchand Technologies, ASTM STP 1031, W.E. Meyer and J. Reichert, Eds.,
American Society for Testing and Materials, Philadelphia, pp. 87-102,
1990.
11. Kulakowski, B.T. and J.C. Wambold, C.E. Antle, C. Lin, J.M. Mason."Development of a Methodology to Identify and Correct Slippery
Pavements." The Pennsylvania Transportation Institute Research Project
88-06, Pennsylvania Department of Transportation, Harrisbure, PA., Nov.1990.
12. Kummer, H.W. and W.E, Meyer. "Tentative Skid-Resistance Requirements for
Main Rural Highways," National Cooperative Highway ResearchProgram (NCHRP) Report 37, Washington, D.C., Highway Research
Board, 1967.
13. Meyer, W.E. and R.R. Hegmon, T.D. Gillespie. "Locked-Wheel Pavement Skid
Tester Correlation and Calibration Techniques," National CooperativeHighway Research Program (NCHRP) Report 151, Washington, D.C.,
Transportation Research Board, 1974.
14. Mitchell, J.C. and M.I. Phillips, G.N. Shah. "Seasonal Variation of Friction
Numbers." Maryland Department of Transportation, Baltimore, Maryland,February 1986.
15. Moyer, R.A. "Motor Vehicle Operating Costs, Road Roughness and Slipperiness
of Various Bituminous and Portland Cement Concrete Surfaces."
Highway Research Board, Proceedings of the Twenty-Second AnnualMeeting, National Research Council, Washington, D.C., pp. 13-52, 1942.
16. Moyer, R.A. "Road Surface Properties, Report of the Committee on Antiskid
Properties of Road Surfaces." Bulletin No. 27, Road Surface Properties.
Highway Research Board, National Research Council, Washington, D.C.,
pp. 1-6, 1949.
17. Oglesby, C.H. and R.G. Hicks. Highway Engineering, Fourth Edition. John
Wiley & Sons, Inc., New York, 1982.
18. Page, B.G. and L.F. Butas. "Evaluation of Friction Requirements for California
State Highways in Terms of Highway Geometries." FHWA/CA/TL-86/01, U.S. Department of Transportation, Federal HighwayAdministration, Washington, D.C., January 1986.
19. Rogers, M.P. and T. Gargett. "A Skidding Resistance Standard for the National
Road Network." Highways and Transportation Vol. 38, Institution of
Highways and Transportation, London, England, pp. 10-13, April 1991.
20. Texas Transportation Institute. " Central/Western Field Test and Evaluation
Center Report No. TC-220 for Washington State Department of
Transportation System No. 3." The Texas A&M University System,
College Station, Texas, November 1989.
46

21. Wambold, J.C. and J.J. Henry, R.R. Hegmom. "Skid Resistance of Wet-WeatherAccident Sites." The Tire Pavement Interface, ASTM STP 929, M.G.Pottinger and T.J. Yager, Eds., American Society for Testing and
Materials, Philadelphia, pp. 47-60, 1986.
22. Wambold, J.C. and J.J. Henry, C.E. Antle, B.T. Kulakowski, W.E. Meyer, A.J.
Stocker, J.W. Button, D.A. Anderson. "Pavement Friction MeasurementNormalized for Operational, Seasonal, and Weather Effects." FHWA-RD-88-069, U.S. Department of Transportation, Federal HighwayAdministration, Washington, D.C., June 1989.
23. Wambold, J.C. and B.T. Kulakowski. "Limitations of Using Skid Number in
Accident Analysis and Pavement Management." Pavement Design,
Management, and Performance, Transportation Research Record 1311,
Washington, D.C., Transportation Research Board, pp. 43-50, 1991.
24. Washington State Department of Transportation and Washington State
Transportation Center, WSDOT Pavement Guide, Olvmpia, WA„ January
1993.
25. Washington State Department of Transportation, CS 9000 Pavement Skid Tester,
Olympia, WA.
26. Washington State Department of Transportation, Statewide Friction Testing
Inventory, Olympia, WA.
27. Washington State Department of Transportation, Questions and Answers AboutFriction Testing, Olympia, WA.
28. , "Skid Resistance of Paved Surfaces Using a Full-Scale Tire, (Designation: E274-90)," 1992 Annual Book ofASTM Standards, Philadelphia,
Pennsylvania, American Society for Testing and Materials, Volume 09.02,
pp. 615-619, 1992.
29. , "Standard Test Method for Calibrating a Wheel Force or Torque TransducerUsing a Calibration Platform (User Level), Designation: E 556-89)," 1992Annual Book of ASTM Standards, Philadelphia, Pennsylvania, AmericanSociety for Testing and Materials, Volume 09.02, pp. 640-642, 1992.
30. , "Calibration of Braking Force for Testing of Pneumatic Tires, (Designation:
F 377-86)," 1992 Annual Book ofASTM Standards, Philadelphia,
Pennsylvania, American Society for Testing and Materials, Volume 03.01,
pp. 513-516, 1992.
31. "FHWA Technical Advisory T 5040-17." December 23, 1980. Skid
Accident Reduction Program.
32. Maycock. G., "Studies on the Skidding Resistance of Passenger-Car Tires on WetSurfaces," Proceedings, Institute of Mechanical Engineers, AutomobileDivision, Vol. 180, Part 2A (4), 1965-66.
47


APPENDIX A
SUMMARY OF FACTORS IN SKID RESISTANCE MEASUREMENT(FROM MEYER, ET AL. LL2J)

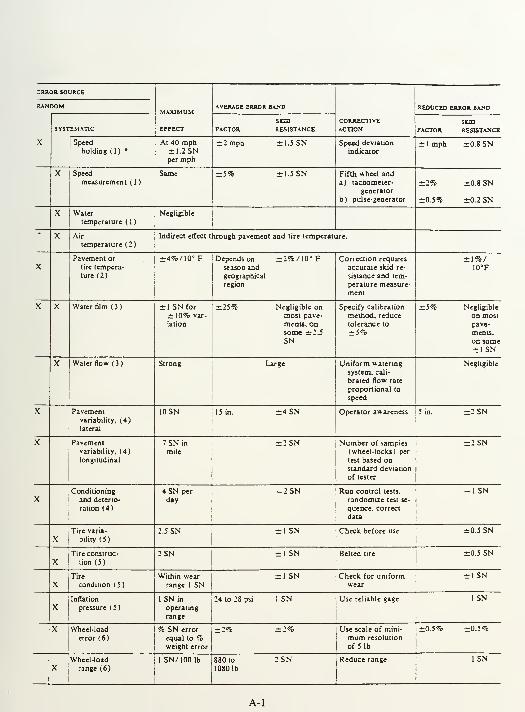
ERROR SOURCE
MAXIMUM
EFFECT
AVERAGE ERROR BAND
CORRECTIVEACTION
RANDOM REDUCED ERROR BAND
SYS1•EMATIC FACTORSODRESISTANCE
SODFACTOR RESISTANCE
X Speed
holding (1) •At 40 mph±1.2SNper mph
±2 mph ±1.5 SN Speed deviation
indicator±lmph ±0.8 SN
X Speed
measurement ( 1
)
Same ±5% ±1.5 SN Fifth wheel anda) tachometer-
generator
b) pulse-generator
±2% ±0.8 SN
±0.5% ±0.2 SN
X Watertemperature ( 1
)
Negligible
X Air
temperature (2)
Indirect effect through pavement and tire temperature.
XPavement or
tire tempera-
ture (2)
±4%/10° F Depends onseason andgeographical
region
zr2%/10"F Correction requires
accurate skid re-
sistance and tem-
perature measure-
ment
±1%/10°F
X X Water film (3) ± 1 SN for
±10% var-
iation
±25% Negligible onmost pave-
ments, onsome ±2.5SN
Specify calibration
method, reduce
tolerance to
±5%
±5% Negligible
on mostpave-
ments,
on some±1SN
X Water flow ( 3
)
Strong Large Uniform watering
system, cali-
brated flow rate
proportional to
speed
Negligible
X Pavementvariability, (4)
lateral
10 SN 15 in. ±4SN Operator awareness 5 in. ±2SN
X Pavementvariability, (4)
longitudinal
7 SNinmile
=2SN Number of samples
(wheel-locks) per
test based onstandard deviation
of tester
±2SN
XConditioning
and deterio-
ration (4)
4SNperday
-2SN Run control tests,
randomize test se-
quence, correct
data
-1SN
XTire varia-
bility (5)
2.5 SN ±1 SN Check before use ±0.5 SN
XTire construc-
tion (5)
2SN ±1 SN Belted tire ±0.5 SN
xTire
condition (5)
Within wearrange 1 SN
±1SN Check for uniformwear
±1SN
XInflation
pressure (5)
1 SNinoperating
range
24 to 28 psi 1 SN Use reliable gage 1SN
X Wheel-load
error (6)
% SN error
equal to %weight error
±2% ±2% Use scale of mini-
mum resolution
of 5 1b
±0.5% =0.5%
XWheel-load
range (6)
1 SN/lOOlb 880 to
10801b
:sn Reduce range 1 SN
A-l

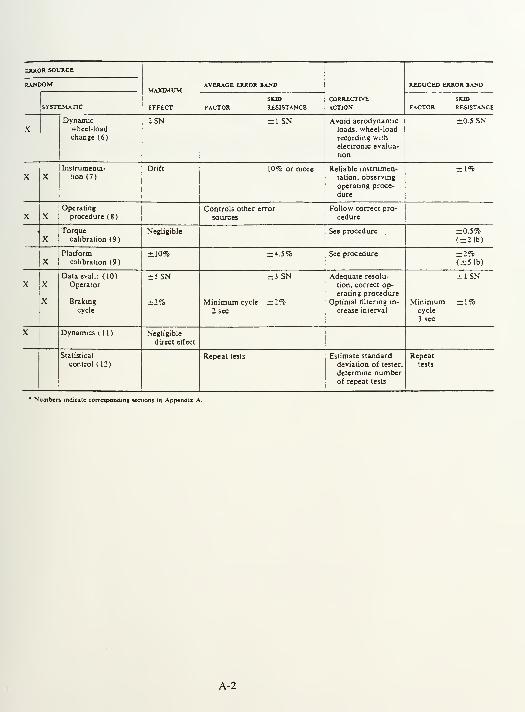
EAROR SOURCE
MAXIMUM
EFFECT
AVERAGE ERROR BAND
CORRECTIVEACTION
REDUCED EJRANDOM LROR BAND
SYSTEMATICSKID
FACTOR RESISTANCE FACTORSKID
RESISTANCE
XDynamic
wheel-load
change (6)
2SN ±1SN Avoid aerodynamicloads, wheel-load
recording with
electronic evalua-
tion
±0.5 SN
X XInstrumenta-
tion (7)
Drift 10% or more Reliable instrumen-
tation, observing
operating proce-
dure
±1%
X XOperating
procedure ( 8
)
Controls other erTor
sources
Follow correct pro-
cedure
XTorque
calibration (9)
Negligible See procedure ±0.5%(±2 lb)
XPlatform
calibration (9)
±10% = 4.5% See procedure ±2%(±5 lb)
X X
X
Dataeval.: (10)
Operator
Braking
cycle
±5SN
±2%
=3SN
Minimum cycle ±2%2 sec
Adequate resolu-
tion, correct op-
erating procedure
Optimal filtering in-
crease interval
Minimumcycle
3 sec
±1SN
±1%
X Dynamics (11) Negligible
direct effect
Statistical
control (12)
Repeat tests Estimate standard
deviation of tester,
determine numberof repeat tests
Repeattests
• Number* indicate corresponding sections in Appendix A.
A-2


APPENDIX B
VVSDOT MEMORANDUM REGARDING PAVEMENT FRICTION INVENTORY(FROM VVSDOT STATEWIDE FRICTION INVENTORY ££])

INTRA-DEPARTMENTAL COMMUNIC
DATE: December 11, 1989 j
FR0M: D.J. Vandehey/John R. S^radaphone: SCAN 753-7103 ^ SUBJECT: Pavement Friction Inventory - 1989
TO: D.S. SennG.F. DemichM.D. Tranum
Attached is an inventory of pavement friction tests performed on the statehighways in your District as specified in the Departmental Position State-ment entitled "Skid Accident Reduction Program." This test report is anupdate of our last pavement friction inventory (1988) and covers the periodfrom March through July 1989.
Approximately one-half of the entire State highway system is tested forpavement friction each year - Districts 1, 3 and 5 on even-numbered yearsand Districts 2, 4 and 6 on odd-numbered years. We are submitting to eachDistrict only the data that pertains to that specific District.
When comparing the pavement friction values from one reporting period toanother, check the lane and direction of testing for best comparison. TheADT shown at each milepost is from the 1988 traffic data obtained from bothdirections. On overlays or reconstruction, the test data should enable a
determination of whether the friction test was conducted before -or afterthe new pavement was placed.
Establishing minimum levels of pavement friction for all types of surfacesstill continues to be a subject of debate by several agencies nationwide.Our position remains the same, and until the national research is completedand the results are accepted by a majority of the states, we will continueto suggest a desirable minimum friction number of 35 and further advisethat those areas with friction numbers below 40 should be monitored for
indications of potential hazards. The inventory listing specificallydelineates those particular areas with values of to 34 and 35 to 39.
This inventory represents testing on all State highways within your
District at each milepost. Occasionally, conditions will prevent doing the
test at the milepost. Should you desire special testing or further infor-
mation, please contact Bob Allison (SCAN 234-4664) at the Materials Lab.
B-l


APPENDIX C
DYNAMIC CALIBRATION RUN—SKID TESTER OUTPUT WITH DATADEFINITIONS AND GRAPH OF FRICTION NUMBER VS. TEST NUMBER
(FROM TEXAS TRANSPORTATION INSTITUTE [211)

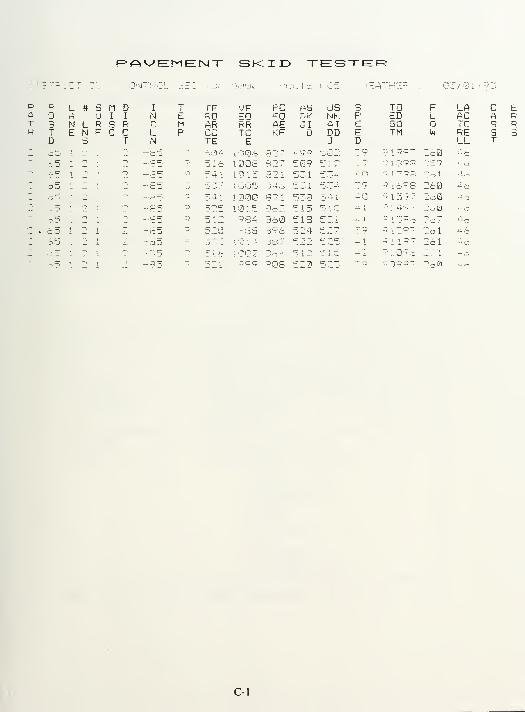
R *=» V*>EM EEMT SKID TESTER
L # 3A UN LE N
5
M D I TU II N ER S R C MFCC L P
T N
TFROARCCTE
VFEQRRTCE
PCEO
KF
ASDKJ I
D
USNKAIDDJ
PEED
TOEDSOTM
FLuw
LAACTCRELL
CAS3T
ERR6
504 L 'JIJ.-. H "' - 499 505 '-- 1 C?Q7 260 a6~,
( .-'-v 1008 827 5 9 5 1 3 " ~'9 1 398 5 59 46
54 1 1015 821 531 534 40 9 1798 261 4A53" 1005 846 531 5 3 4
~ c. 9 L 6 9 8 560 46~! 4 i i 000 82i 533 541 40 •-159 7 260 46555 101 5 R,A 7 5 L 5 5 L 3 4
1
260515 984 860 5 1
8
c- —..,. | 9 L 3 ? 6 267 46
530 : :'~\p. 896 554 5 57 39 261 .+ 6
C-l

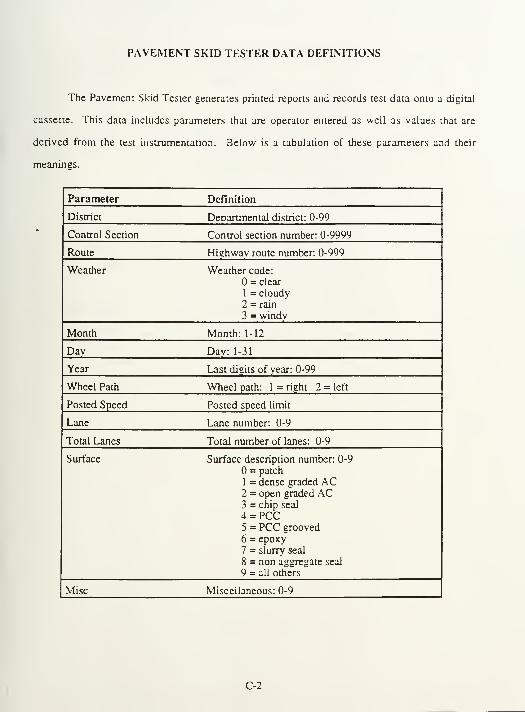
PAVEMENT SKID TESTER DATA DEFINITIONS
The Pavement Skid Tester generates printed reports and records test data onto a digital
cassette. This data includes parameters that are operator entered as well as values that are
derived from the test instrumentation. Below is a tabulation of these parameters and their
meanings.
Parameter Definition
District Departmental district: 0-99
Control Section Control section number: 0-9999
Route Hiehwav route number: 0-999
Weather Weather code:
= clear
1 = cloudy
2 = rain
3 = windv
Month Month: 1-12
Dav Dav: 1-31
Year Last digits of year: 0-99
Wheel Path Wheel path: 1 = right 2 = left
Posted Speed Posted speed limit
Lane Lane number: 0-9
Total Lanes Total number of lanes: 0-9
Surface Surface description number: 0-9
= patch
1 = dense graded AC2 = open graded AC3 = chip seal
4 = PCC5 = PCC grooved
6 = epoxy7 = slurry seal
8 = non aggregate seal
9 = all others
Misc Miscellaneous: 0-9
C-2

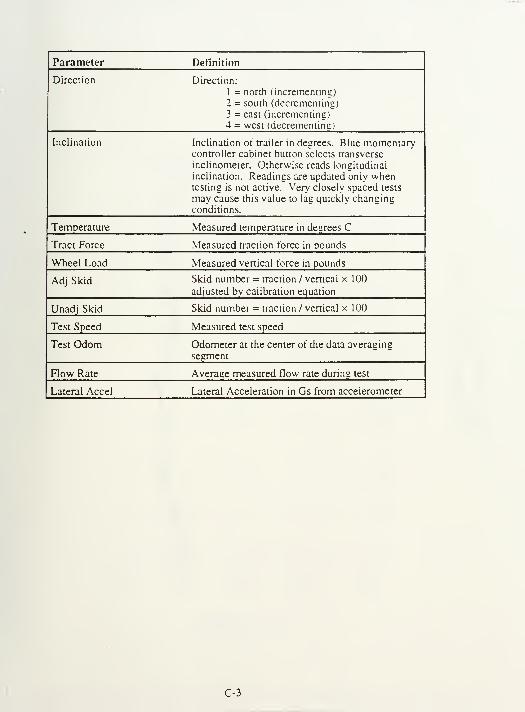
Parameter Definition
Direction Direction:
1 = north (incrementing)
2 = south (decrementing)
3 = east (incrementing)
4 = west (decrementing)
Inclination Inclination of trailer in degrees. Blue momentarycontroller cabinet button selects transverse
inclinometer. Otherwise reads longitudinal
inclination. Readings are updated only whentesting is not active. Very closely spaced tests
may cause this value to lag quickly changingconditions.
Temperature Measured temperature in degrees C
Tract Force Measured traction force in pounds
Wheel Load Measured vertical force in pounds
Adj Skid Skid number = traction / vertical x 100
adjusted by calibration equation
Unadj Skid Skid number = traction / vertical x 100
Test Speed Measured test speed
Test Odom Odometer at the center of the data averaging
segment
Row Rate Average measured flow rate during test
Lateral Accel Lateral Acceleration in Gs from accelerometer
C-3

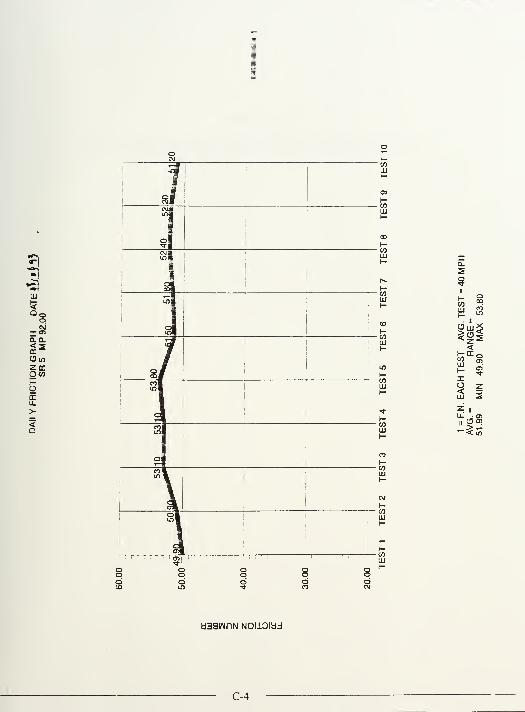
I•aLU
Qs2*
CD mZGC
cru.
2
J i
U)l
i
1i
/j
1
i
[if s
<
X
LU 2
„ CD05
*" < in
yaawnN Nonoidd
C-4


APPENDIX D
GREAT BRITAIN SKID RESISTANCE POLICY FOR DIFFERENTCATEGORIES OF SITE (FROM GARGETT [£])

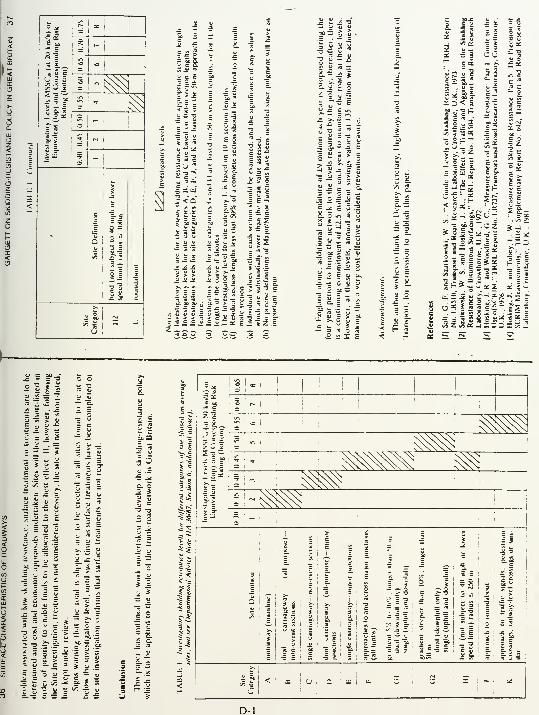
5. i»|-|
)km/1 70 7
-^
stigaK0.45 2
-i
e
£
Q
si2
C SE§5 ""
o vi
ts.iu "3
E 2a ^c EC 3
ii
iaca
SueCategory
112 L
3 £ 2— ab ClH C Q.
5 J!
2s. "".
am"
<Q
o. 5.
5 -a -a 7 5 v2
u u S ago
c 3 o^ - 2)j 3
soO 2'5 5-9
-3
•1 90 v
3 £ ±.H{2 at
—»^r> -^ ^^.
i, *
- ill-J «_ =o 2 E^
— "s. — i o-
cl 2
if
?1
— a z o
o Ea
E -3
£ 2u -
o- s I a
3 - C C —— C £ u c
e -* i u "2U i-
c W uCl vn !3 o
s l a s !!_ W *" 3 >
s «: = «
o S5 il
-3 C c _ -
III Sic u u i 3— a « o <o
£.ax E
£ c 5r- 5 "5
8. I
- . VII
2 2 < § =
oSS £ e w --lis.
J _- o
^ o S
2 |bj
-3 00
la."
1£*
2:
§ •
£>aj
•5 1= a-3 Z3 _£ 2
o
at «h
a „""**
,2 E 5
IS
a 2" :
.
Sil
! HiJUJ:i at -j •
.Is |
* s =
unS * H •= == ^ §
j c -c r S E •-)—
!Oi! S'5.1c . —
S c/s
"3 U
^^
"3 "3
a: o
- _u
? 1
c 2r "3
1 I!
V? |
t
a - 90* C
si3 !•=j C E
K .- ?/: w x
j; I"*
t E
1>S~ a
3 1 r-1
i
1 i 1
"2 S5 -^ 5 * i
1
i
1 $^i
"1 s «
^^^$it Z '* ^ s ^
Itg 2
! |« ^^B^ =
: '-^^ :!
il =: ~
!
c .
-2"**
= i .£ ; = JZ i I i
— 2:
l! i1 | e n— : c 7 1
? ^1
- > i w
e ! 9-5
E g?= £ E i
% SSI - e 5so °- c c — c i
n i 2|
^ 1 1 I i 2 Iw
i, i
2£= 1 S « 1
£! 1! S3! |i
- i
l£
| 1-
i
15
1re
OPre
!
e
j? i"!1
£
Is 11 i
ff £ ::
2 re
- *
i*i -3 B
"Sos
« 3Ji 1
SO 1
e2 -=
£.=so
re _si?
: a c: -3 "S ! £ 1
•3 5 ic S c
|1|
<
I1
< a U - LU | u. s ^
D-l

APPENDIX E
MARYLAND REPORT - CORRELATION BETWEENPAVEMENT TEMPERATURE AND FRICTION NUMBER
ANDGRAPHS OF FRICTION NUMBER VS. PAVEMENT TEMPERATURE
(FROM MITCHELL, ET AL. [J4])

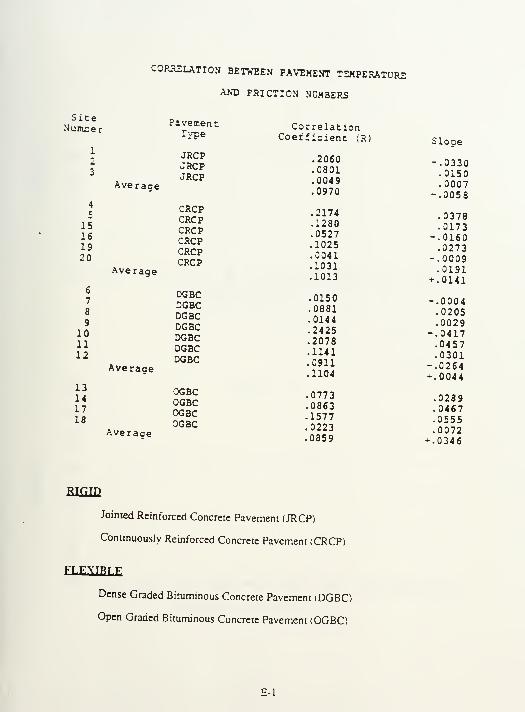
SiteNumber
1
CORRELATION BETWEEN PAVEMENT TEMPERATURE
AND FRICTION NUMBERS
Pavement CorrelationTree Coefficient (R)
JRCP
Slope
-.03303 J** -0801 .0150
Average'** -g^ 9 -0007
• 0970 -.00584 CRCP5 CRCP '*ll* -0378
15 crcp -ii!2 " 017 316 CRCP -?" 7 "-016019 CRCP -ij?? '°27320 ™£l -0?41 -.0009CRCP
Ave«ge -tXfi -2J??1031^013 +-0141
6 DGBCDG^C -215? -- 000 *
8 nrnr- 0881 -0205
1 :
I--o-
1 : :°.SSZ
AverageMBC
:?»» -0264
13
1104 0044
OGBCOGBC
17 Xr«p ' 086 3 .046718 ^bc "J
577- 055 5
Averaoe0GBC
' " -00720859
Jointed Reinforced Concrete Pavement (JRCP)
Continuously Reinforced Concrete Pavement (CRCP)
FLEXTRTF
Dense Graded Bituminous Concrete Pavement (DGBO
Open Graded Bituminous Concrete Pavement (OGBC)
E-l
.0346

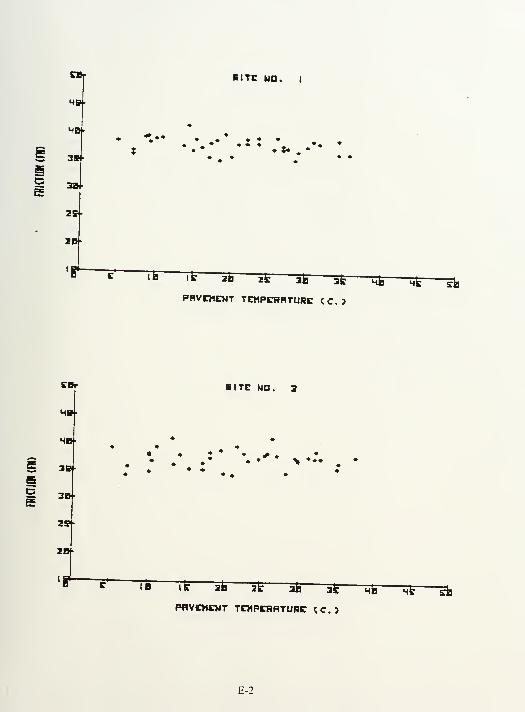
1MB-
§ 3*
S »2E-
20
r
BJTC WO. t
TS if ic it iS af
PAVEMENT TEMPERATURE CO4T sfa
:MB-
5 »g 3Bf
2Sf
2B-
l ?
BITE NO.
V
TB it in" at afc at qrPflVEMEWT TEMPERP.TURE <C.>
hF
E-2

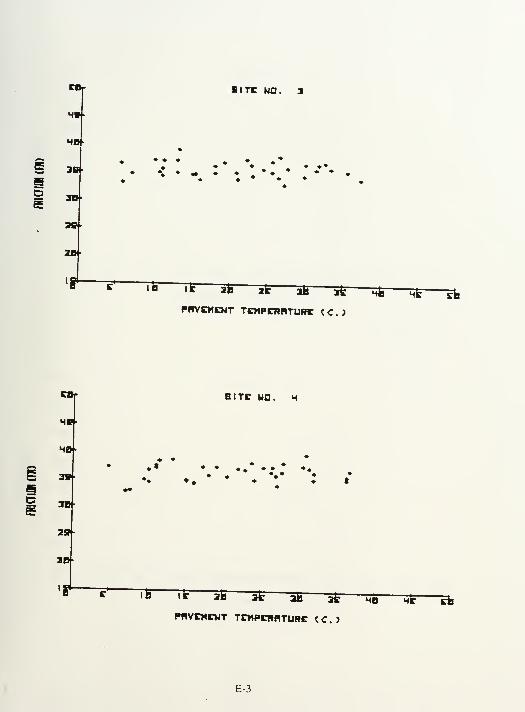
HI
S »
ITT wo. a
i
:r 75 rB 3i ** a * hS h£ rfe
PRVEMENT TCMPCHRTURC < C . >
5
C3
BITC HO. H
HO-
OT-
SO-
t
71 * *B at aB a* hS hT ft
PflVOICNT TnvCHHTURC <C.)
E-3

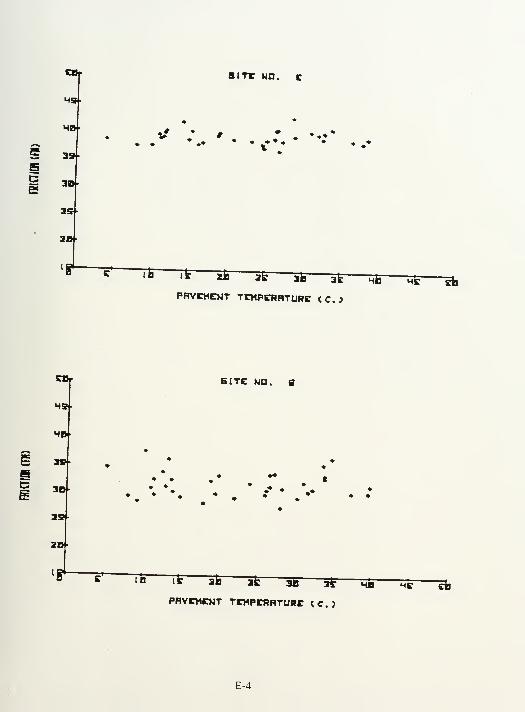
MB-
5 35f
BtTC NO.
as-
I
tfV
"*S ifi a£ IB aFPRVCHEWT TCMPCRRTURC <C.J
mB hT
MB-
gsg 3Bf
2Of
BITE NO
75 it iT
PRVCHCNT TEWPCRFTURC <C,>
hB sF
E-4

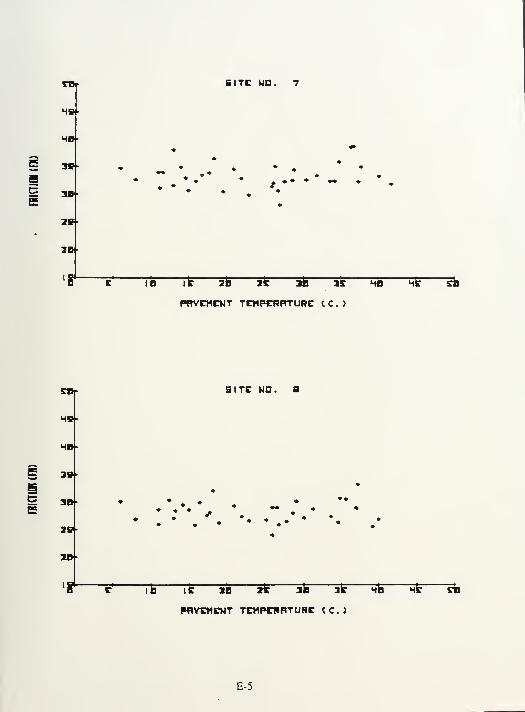
MB-
MB-
SITE MO. 7
25
2B
t ++ -
IB T5 5B iS g ig h6 hS £a
PHVCHCNT TCMPEWRTURE CO
MB-
HB»
g 3B-
5 a*
SITE NO. B
# *IB-
IS It" IB i£ IE 3K
PflYCWENT TCWPCWRTURC CO"hB hF
E-5

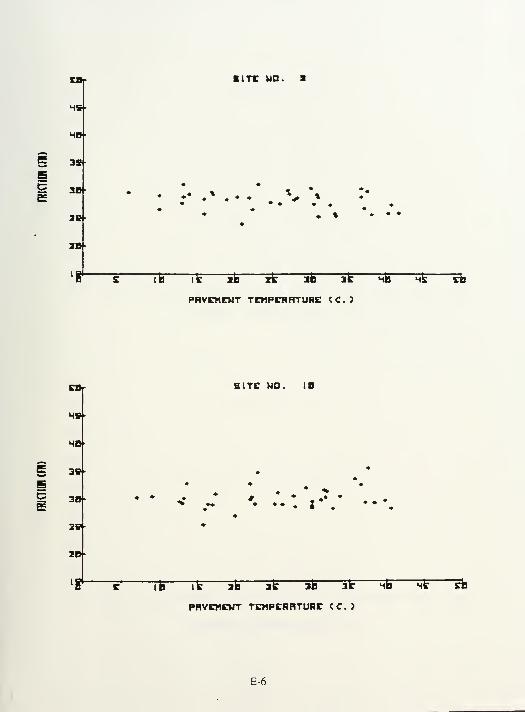
ItTt WD. 1
HS-
HB-
5 35.
26 >
2D
76 TE iB z£ iB if
PRVEMENT TCMPCTRTURE < C . >
SITC NO IB
HB-
HE-
'S 3Bj
65 2B|E
25+
2B-
V ^
73 TE 5E it ifi SF
PRVEHEWT TOIPCRRTURi: *C. >
hB hF
E-6

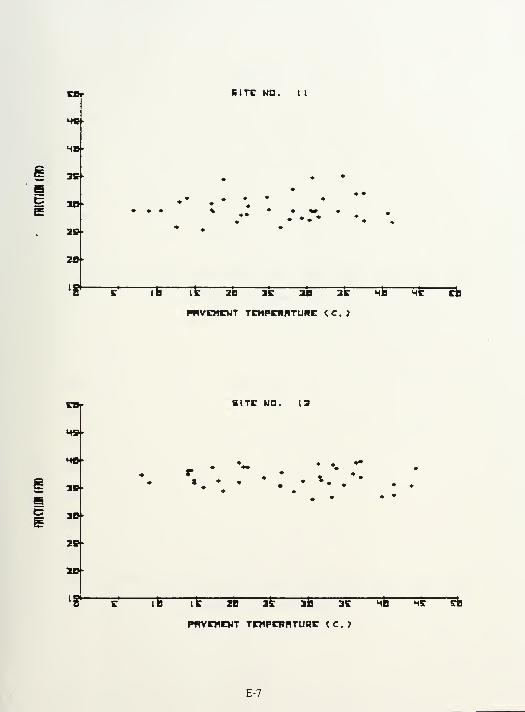
CBr IITE WD I I
B
E
20-
| „21
2Bf
ir Hfi hT
PRVCMCNT TCMPCHRTUHE < C. )
bits: md. i
a
r IB Tl? iS i£ afi aT
PBVCHOJT TmPCRRTURC CC.)
hT a
E-7

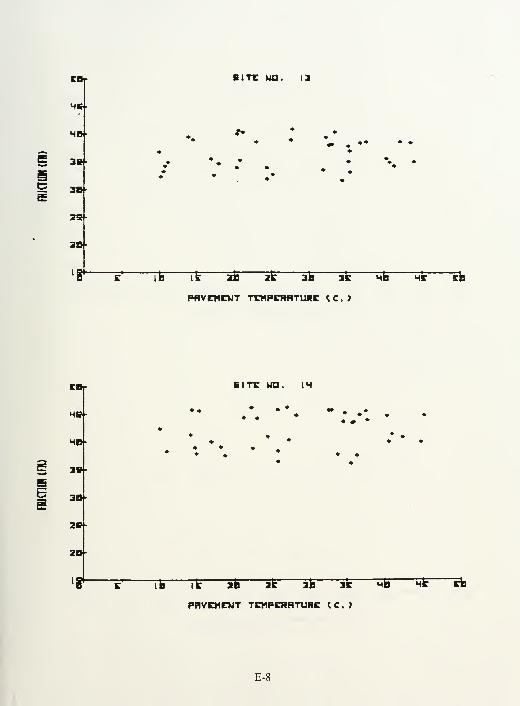
CBr
HI
MB-
5= 3B-
| 3*
bite ua. la
29-
Tfi rfc" ze at 30 56 hB h6 sb
PflVEWrWT TTHPCRfrrUBE <C>
CO-
MB-
MB-
6| 3B .
2B-
2B-
BITC WO. IH
r it—rs
—
n—it—n—ss
—
hS he aPHVEHEWT TCMPCHBTURC (CJ
E-8

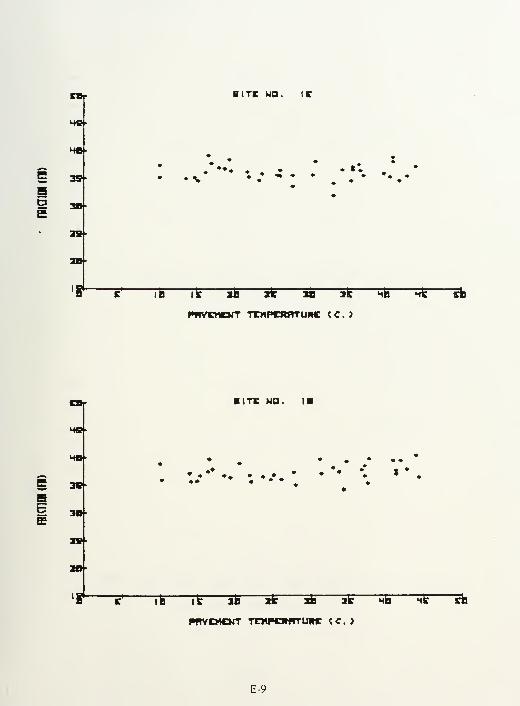
BITE MO. 1C
29-
•*V«• *
tt
i it IB 5* 16 IS hS—
hS—
a
r i
pmrMorr TEMPCftfrrunc c c .
)
BITE MO. IB
...... .'• '. **.
C tB if IS IS m IS hB—
hS—
a
pwvemcnt TEUPCfwrrum: < c. >
E-9

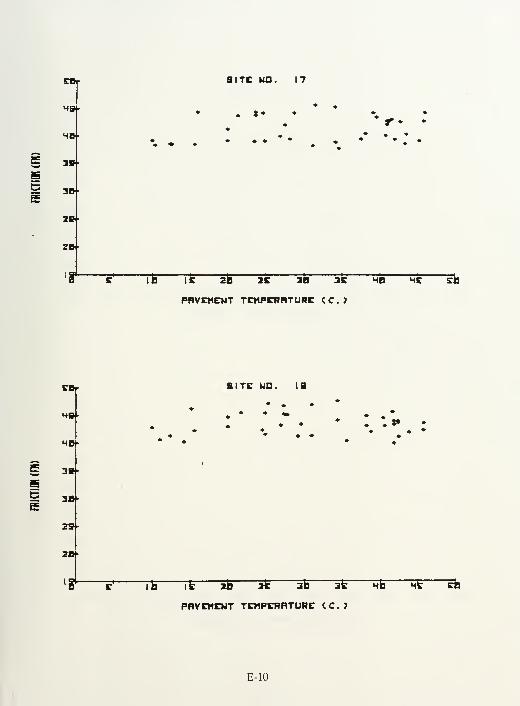
E0r
MB-
MB-
91TC HQ. 17
. t*
5 3BfE2E>
2D-
lr 7B it 2B it aB at hB hS sb
PAVEMENT TEMPERATURE CO
EB-
MB-
*«»
£ 3B
65 3DE
29-
2B»
BITE MO. I
7B if iB 55 aB if mB hS ft
PHVEHENT TEMPERRTURE (C.J
E-10

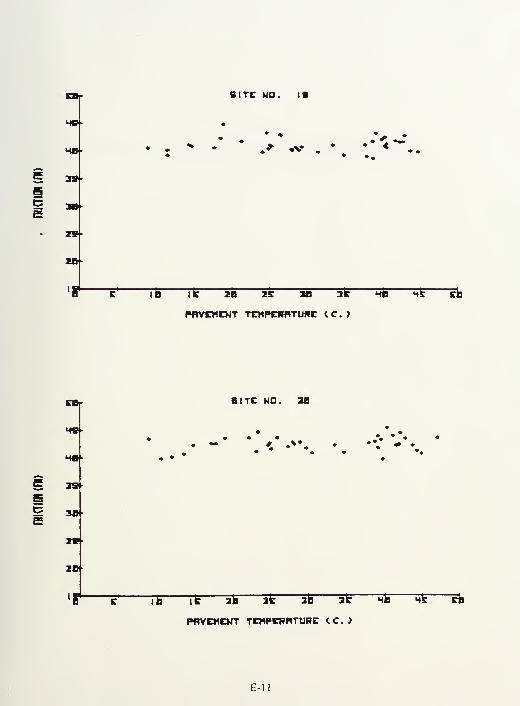
B1TC WO. IB
MB-
m
20-
1* ifi iF
PBVCWOJT TEMPCTHTLWE < C . >
M at mB Hi CB
^ 3*
BITE NO. IB
4fc.V
"B if 36 afc aB at mB mB cfa
PflYEKEWT TEMPERATURE CC.)
E-ll


APPENDIX F
PENNSYLVANIA REPORT - SKID RESISTANCE BY DAYS FORFLORIDA AND TEXAS (FROM WAMBOLT, ET AL. [22])

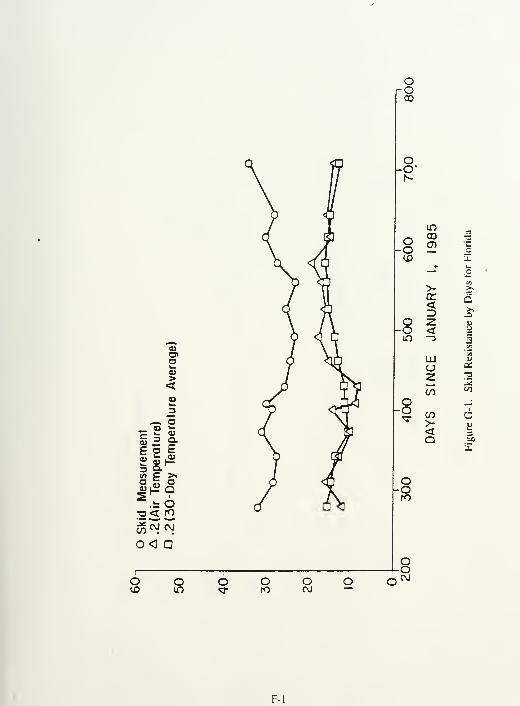
0)
s><s
^. o
§2 &E S £his(flC >a S o
-o< ro
en 0J C\J
0<D
OrOCO
o
in
ooCOen O
CD Eu_
~"<2c/5
>- >»
or Q<3 X)
8 <uoc
in "D c3
"5
LU uO as
z T3
Mlo C/3
o •
o CO> 6< 3Q &p
o om o oro
O
ro
F-l

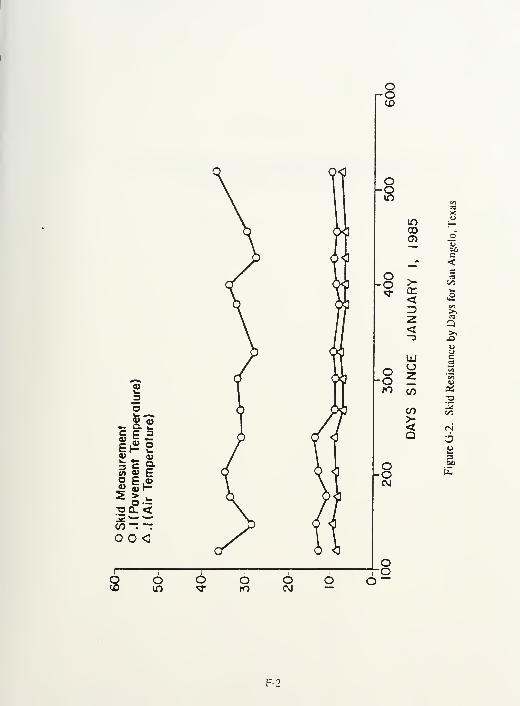
orOCO
OOin
in
1
1
<"3
c<
Q
£
= 1 =
IlSg
lit2 Si.•OQ.<
co—
—
o Ero to
CO
<Q 6
CVJ
8 O o oro
OCM
Oo
F-2


APPENDIX G
PENNSYLVANIA REPORT - SKID RESISTANCE GRAPHS AND DATA SETSFOR FLORIDA, NEW YORK, PENNSYLVANIA, AND TEXAS
(FROM WAMBOLT, ET AL. [22])

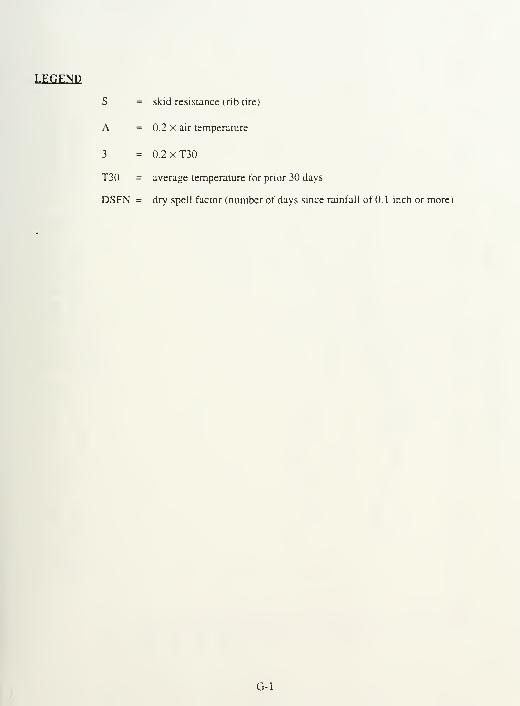
LEGEND
S = skid resistance (rib tire)
A = 0.2 x air temperature
3 = 0.2xT30
T30 = average temperature for prior 30 days
DSFN = dry spell factor (number of days since rainfall of 0.1 inch or more)
G-l

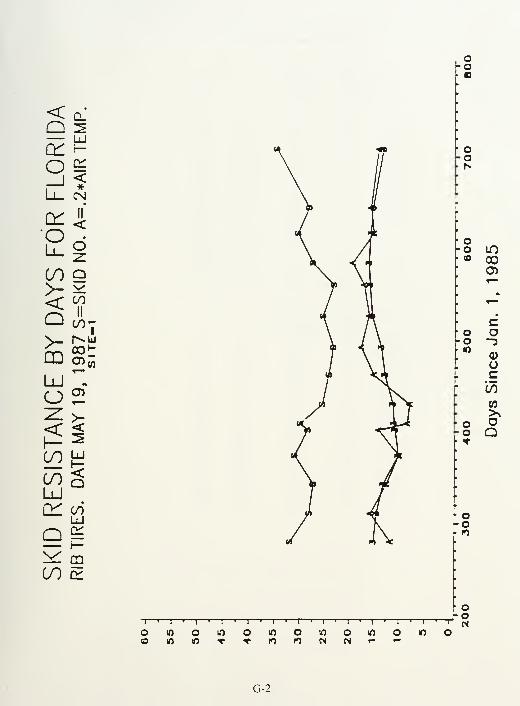
< o_o s— UJa:o g:
_i <L_
C£ if<oU_ d
:z
00 Q>- \^
< 00II
^7Q>-CD
*—Ld •t
O o>
~7>-< <
H- ^(S) UJ
CO <UJC£ 00
UJ
Q enh-V cn
CO cz
m00
co
a)
ac(75
CO
>>oQ
T
—
O in o« !
—
10
1—I
—
o'—1
—
10 oT -J
10
'—
r
oto 10 to •* * n n N N
G-2

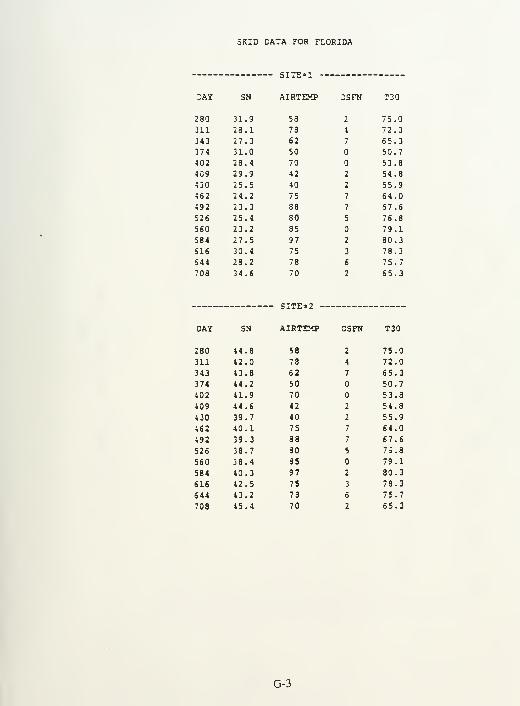
SKID DATA FOR FLORIDA
SITE*!
DAY SN AIRTEMP DSFN T30
280 31.9 58 2 75.0
311 28.1 78 4 72.0
343 27.3 62 7 65.3
374 31.0 50 50.7
402 28.4 70 53.8
409 29.9 42 2 54.8
430 25.5 40 2 55.9
462 24.2 75 7 64.0
492 23.3 88 7 67.6
526 25.4 80 5 76.8
560 23.2 85 79.1
584 27.5 97 2 80.3
616 30.4 75 3 78.3
644 28.2 78 6 75.7
708 34.6 70
- SITE=2 -
2 65.3
DAY SN AIRTEMP DSFN T30
280 44.8 58 2 75.0
311 42.0 78 4 72.0
343 43.8 62 7 65.3
374 44.2 50 50.7
402 41.9 70 53.8
409 44.6 42 2 54.8
430 39.7 40 2 55.9
462 40.1 75 7 64.0
492 39.3 88 7 67.6
526 38.7 80 5 75.8
560 38.4 85 79.1
584 40.3 97 2 80.3
616 42.5 75 3 78.3
644 43.2 78 6 75.7
708 45.4 70 2 65.3
G-3

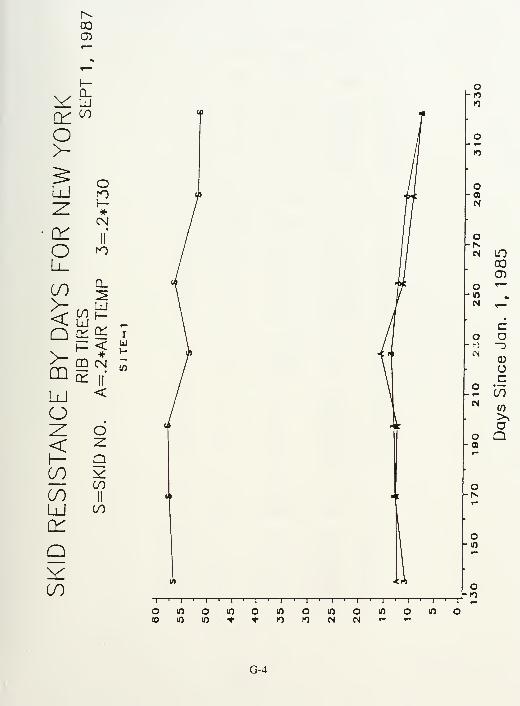
oo
o>-
LUoI—*(N
n01OLl
00 |
Q a; ^ 1
LU <O
00
00LU
00
g
II
CO
-1
—
I
«—i
—
i^—i
—
«—r— »—t—«—i
—
—
r
T -r- «—
r
r- T'—
r
T—
o m o m o m o m o 10 o m o© m m -t «• m n N N T- r-
G-4

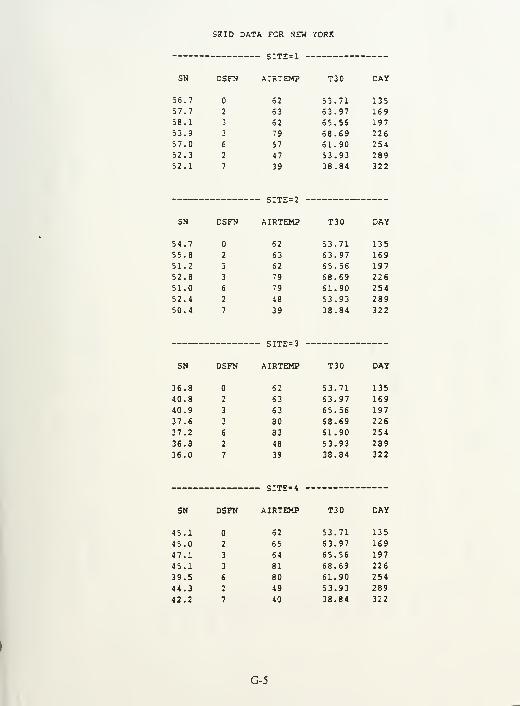
SKID DATA FOR NEW YORK
SN DSFN
31 IL- i.-
AIRTEMP T30 DAY
56.7 62 53.71 13557.7 2 63 63.97 16958.1 3 62 65.56 19753.9 3 79 68.69 22657.0 6 57 61.90 25452.3 2 47 53.93 28952.1 7 39 38.84 322
SN DSFN
——— SITE = 2 -
AIRTEMP T30 DAY
54.7 62 53.71 13555.8 2 63 63.97 16951.2 3 62 65.56 197
52.8 3 79 68.69 22651.0 6 79 61.90 25452.4 2 48 53.93 28950.4 7 39 38.84 322
——— SITE=3 -
SN DSFN AIRTEMP T30 DAY
36.8 62 53.71 135
40.8 2 63 63.97 16940.9 3 63 65.56 197
37.6 3 80 68.69 226
37.2 6 83 61.90 254
36.8 2 48 53.93 289
36.0 7 39 38.84 322
——— SITE= 4 -
SN DSFN AIRTEMP T30 DAY
45.1 62 53.71 135
45.0 2 65 63.97 169
47.1 3 64 65.56 197
45.1 3 81 68.69 226
39.5 6 80 61.90 254
44.3 2 49 53.93 289
42.2 7 40 38.84 322
G-5

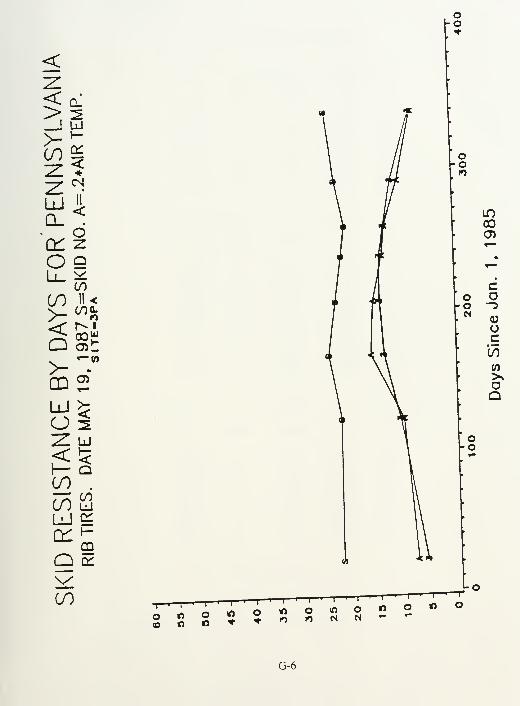
<
LU io
C£ zOQCO
00 H <>-<"%
cd 2?
V)
o!
l— Q00 .
00 LJ
LU £
00
00
CD
<D
OC(75
CO>%oQ
1 i
oCO
n oo
>o
G-6

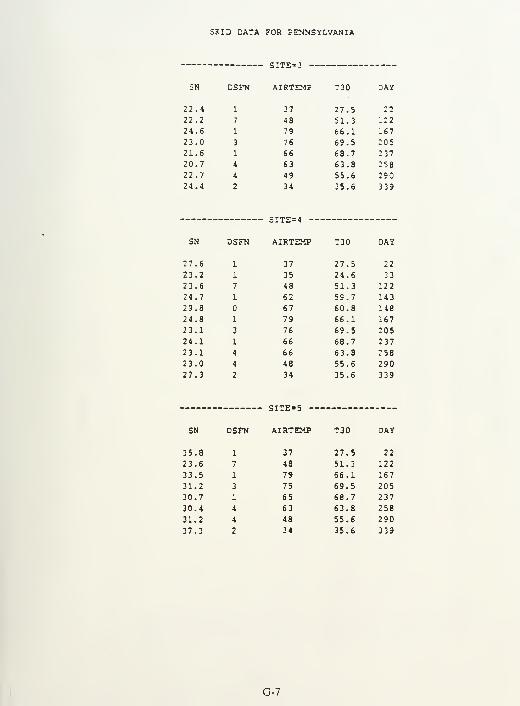
SKID DATA FOR PENNSYLVANIA
SN DSFN
- SITE=3 —AIRTEMP T30 DAY
22.4 1 37 27.5 22
22.2 7 48 51.3 122
24.6 1 79 66.1 167
23.0 3 76 69.5 20521.6 1 66 68.7 23720.7 4 63 63.8 25822.7 4 49 55.6 29024.4 2 34 35.6 339
SN DSFN
- SITE = 4 -—
AIRTEMP T30 DAY
27.6 37 27.5 22
23.2 35 24.6 33
23.6 48 51.3 122
24.7 62 59.7 143
29.8 67 60.8 148
24.8 79 66.1 167
23.1 76 69.5 20524.1 66 68.7 23723.1 66 63.8 258
23.0 48 55.6 290
27.3 34 35.6 339
SN DSFN AIRTEMP T30
35.8 1 37 27.5 22
23.6 7 48 51.3 122
33.5 1 79 66.1 167
31.2 3 75 69.5 205
30.7 1 65 68.7 237
30.4 4 63 63.8 258
31.2 4 48 55.6 290
37.3 2 34 35.6 339
G-7

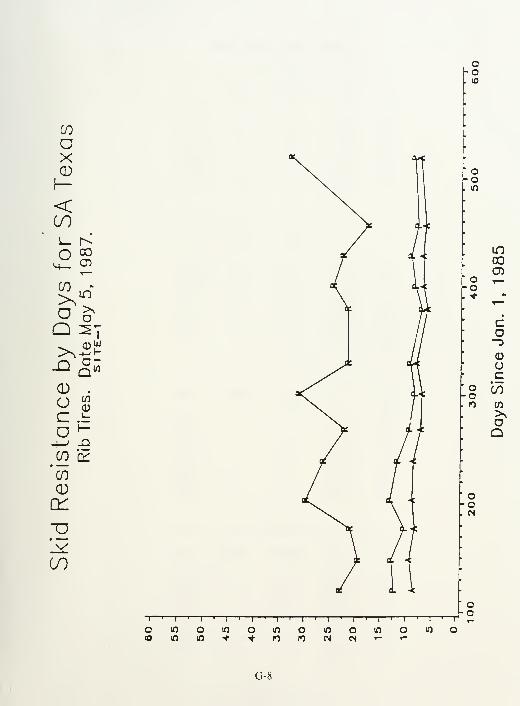
en
oXCD1—
<00L_ h-
o 00
H— o1~~
GO m
^ LO
D oQ:>N
0)UJ4-''"
-Q s=.
O en
0)c L-
o i—
-*—
'
-Q
.22 ir#
co
CD
(H
TD-*00
T
—
o1
io
i
o1
1
10
I
o1
10 o to
11
O lO o' I
10
—
r
oCO 10 10 •+ * n n CN CM T— T—

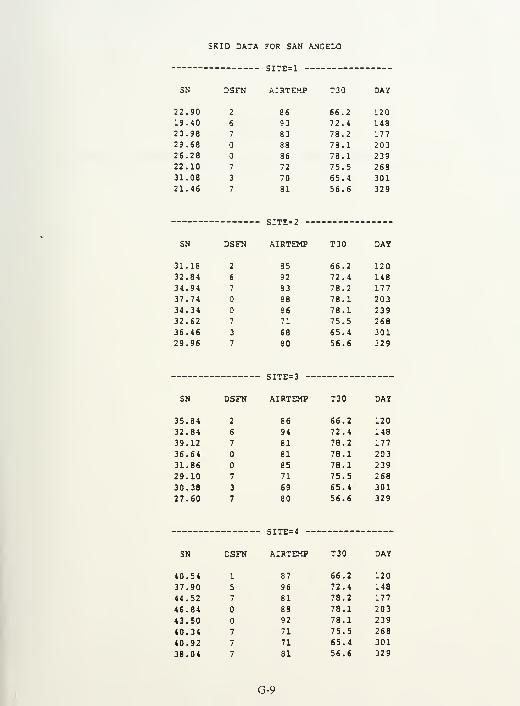
SKID DATA FOR SAN ANGELO
SN DSFN
- SITE=1 —AIRTEMP T30 DAY
22.90 2 86 66.2 12019.40 6 93 72.4 14820.98 7 83 78.2 17729.68 88 78.1 20326.28 86 78.1 23922.10 7 72 75.5 26831.08 3 70 65.4 30121.46 7 81 56.6 329
- SITE=2 —SN DSFN AIRTEMP T30 DAY
31.18 2 85 66.2 120
32.84 6 92 72.4 148
34.94 7 83 78.2 177
37.74 88 78.1 20334.34 86 78.1 23932.62 7 71 75.5 26836.46 3 68 65.4 301
29.96 7 80
- SITE=3 —
56.6 329
DSFN AIRTEMP T30 DAY
35.84 2 86 66.2 120
32.84 6 94 72.4 148
39.12 7 81 78.2 177
36.64 81 78.1 203
31.86 85 78.1 239
29.10 7 71 75.5 268
30.38 3 69 65.4 301
27.60 7 80 56.6 329
- SITE = 4 ——
SN DSFN AIRTEMP T30 DAY
40.54 1 87 66.2 120
37.90 5 96 72.4 148
44.52 7 81 78.2 177
46.84 88 78.1 203
43.50 92 78.1 239
40.34 7 71 75.5 268
40.92 7 71 65.4 301
38.04 7 81 56.6 329
G-9


APPENDIX H
ESTIMATE OF ERROR IN SKID-TESTING (FROM MEYER, ET AL. LQ])


APPENDIX I
FRICTION TEST REGRESSION AND SPEED CORRECTIONFORMULAS BASED ON CALIBRATION AT TTI (LEFT WHEEL)
(FROM TEXAS TRANSPORTATION INSTITUTE [2Q])

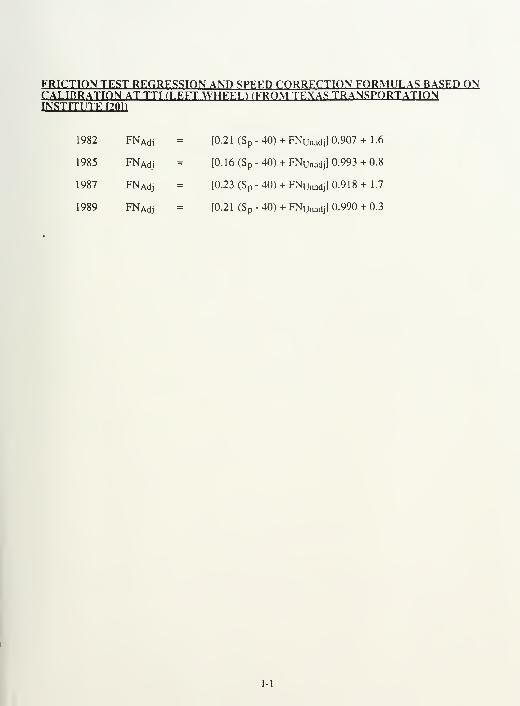
FRICTTON TEST REGRESSION AND SPEED CORRECTION FORMULAS BASED ONCALIBRATION AT TTI (I EFT WHEEL) (FROM TEXAS TRANSPORTATIONINSTITUTE POD
1982 FNAdj= [0.21 (S
p- 40) + FNUnadjJ 0.907 + 1.6
1985 FNAdj= [0.16 (S
p- 40) + FNunadjJ 0.993 +0.8
1987 FNAdj = [0.23 (S p- 40) + FNUnadj ] 0.918+1.7
1989 FNAdj- [0.21 (S p
- 40) + FNUnadj] 0.990 + 0.3
1-1


APPENDIX J
MODEL SKID ACCIDENT REDUCTION PLAN (FROM FHWA [21])

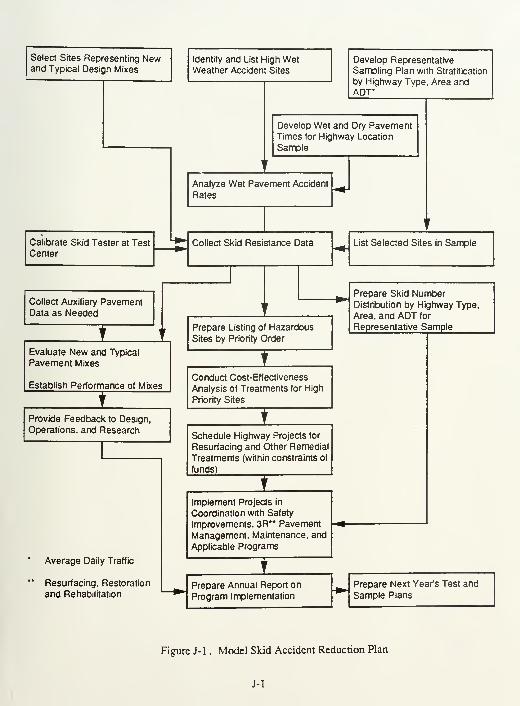
Select Sites Representing Newand Typical Design Mixes
Identify and List High WetWeather Accident Sites
Develop Representative
Sampling Plan with Stratification
by Highway Type, Area andADT*
Develop Wet and Dry PavementTimes for Highway Location
Sample
Analyze Wet Pavement Accident
Rates
Collect Auxiliary PavementData as Needed
Collect Skid Resistance Data List Selected Sites in Sample
Evaluate New and Typical
Pavement Mixes
Establish Performance of Mixes
Prepare Listing of Hazardous
Sites by Priority Order
Prepare Skid NumberDistribution by Highway Type,
Area, and ADT for
Representative Sample
Provide Feedback to Design,
Operations, and Research
Conduct Cost-Effectiveness
Analysis of Treatments for High
Priority Sites
Average Daily Traffic
Resurfacing, Restoration
and Rehabilitation
Schedule Highway Projects for
Resurfacing and Other Remedial
Treatments (within constraints of
funds)
Implement Projects in
Coordination with Safety
Improvements, 3R** Pavement
Management, Maintenance, and
Applicable Programs
Prepare Annual Report on
Program Implementation
Prepare Next Year's Test and
Sample Plans
Figure J-l . Model Skid Accident Reduction Plan
J-l

%\V*
A


DUDLEY KNOX LIBRARYNAVAL POSTGRADUATE SCHOOlMONTEREY CA 93943-5101
I