Embed Size (px)
Citation preview
DOE/CE/23810-16
THERMOPHYSICAL PROPERTIES
Final Report
1 January 1992 - 31 March 1993
Richard F. Kayser
Thermophysics DivisionBuilding 221, Room A105
National Institute of Standards and TechnologyGaithersburg, Maryland 20899
April 1993
Prepared forThe Air-Conditioning and Refrigeration Technology Institute
UnderARTI MCLR Project Number 650-50800
This research project is supported, in whole or in part, by U.S. Department of Energy grant number DE-FG02-91CE23810: Materials Compatibility andLubricants Research (MCLR) on CFC-Refrigerant Substitutes. Federal funding supporting this project constitutes 93.67% of allowable costs. Funding fromnon-government sources supporting this project consists of direct cost sharing of 6.33% of allowable costs; and in-kind contributions from theair-conditioning and refrigeration industry.
DISCLAIMER
The U.S. Department of Energy's and the air-conditioning industry's support for the MaterialsCompatibility and Lubricants Research (MCLR) program does not constitute an endorsement bythe U.S. Department of Energy, nor by the air-conditioning and refrigeration industry, of theviews expressed herein.
NOTICE
This report was prepared on account of work sponsored by the United States Government.Neither the United States Government, nor the Department of Energy, nor the Air Conditioningand Refrigeration Technology Institute, nor any of their employees, nor any of their contractors,subcontractors, or their employees, makes any warranty, expressed or implied, or assumes anylegal liability or responsibility for the accuracy, completeness, or usefulness of any information,apparatus, product or process disclosed or represents that its use would not infringe privately-owned rights.
COPYRIGHT NOTICE(for journal publication submissions)
By acceptance of this article, the publisher and/or recipient acknowledges the right of the U.S.Government and the Air-Conditioning and Refrigeration Technology Institute, Inc. (ARTI) toretain a nonexclusive, royalty-free license in and to any copyrights covering this paper.
i
DOE/CE/23810-16
THERMOPHYSICAL PROPERTIES
ARTI MCLR Project Number 650-50800
Richard F. KayserThermophysics Division
National Institute of Standards and Technology
ABSTRACT
Numerous fluids have been identified as promising alternative refrigerants, but much of theinformation needed to predict their behavior as pure fluids and as components in mixtures doesnot exist. In particular, reliable thermophysical properties data and models are needed to predictthe performance of the new refrigerants in heating and cooling equipment and to design andoptimize equipment to be reliable and energy efficient. The objective of this fifteen-month projecthas been to provide highly accurate, selected thermophysical properties data for Refrigerants 32,123, 124, and 125, and to use these data to fit equations of state and transport property models.The new data have filled gaps in the existing data sets and resolved problems and uncertaintiesthat existed in and between the data sets.
SCOPE
This project has involved selected measurements of the thermodynamic properties of HFC-32, HCFC-124, and HFC-125, and the development of high-accuracy modified Benedict-Webb-Rubin (MBWR) equations of state for each fluid. It has also included selected measurements ofthe transport properties of HFC-32 (viscosity and thermal conductivity) and HCFC-123 (thermalconductivity) and the development of detailed correlations for same. The experimentalthermodynamic measurements have included, as appropriate, accurate determinations of thepressure-volume-temperature (PVT) behavior in the superheated vapor region; the PVT behaviorof the compressed liquid; vapor pressures and saturated liquid densities; the critical temperature,pressure, and density; the vapor-phase speed of sound and the ideal-gas heat capacity; andselected measurements of the liquid-phase heat capacity. The experimental transportmeasurements have covered one-phase and saturated liquid and vapor states over the temperaturerange of interest.
SIGNIFICANT RESULTS
HFC-32
The Burnett apparatus has been used in the isochoric mode to determine the PVT relationfor the vapor phase (147 data points). Eleven isochores were completed spanning the ranges 268to 373 K (23 to 212°F) and 0.018 to 1.3 times the critical density (7.5 to 550 kg/m3; 0.47 to 34.3lb/ft3); the highest absolute pressure was 9.7 MPa (1400 psi). Two Burnett expansions werecompleted at 373 K (212°F) to establish the densities of the isochores. The locations of
1
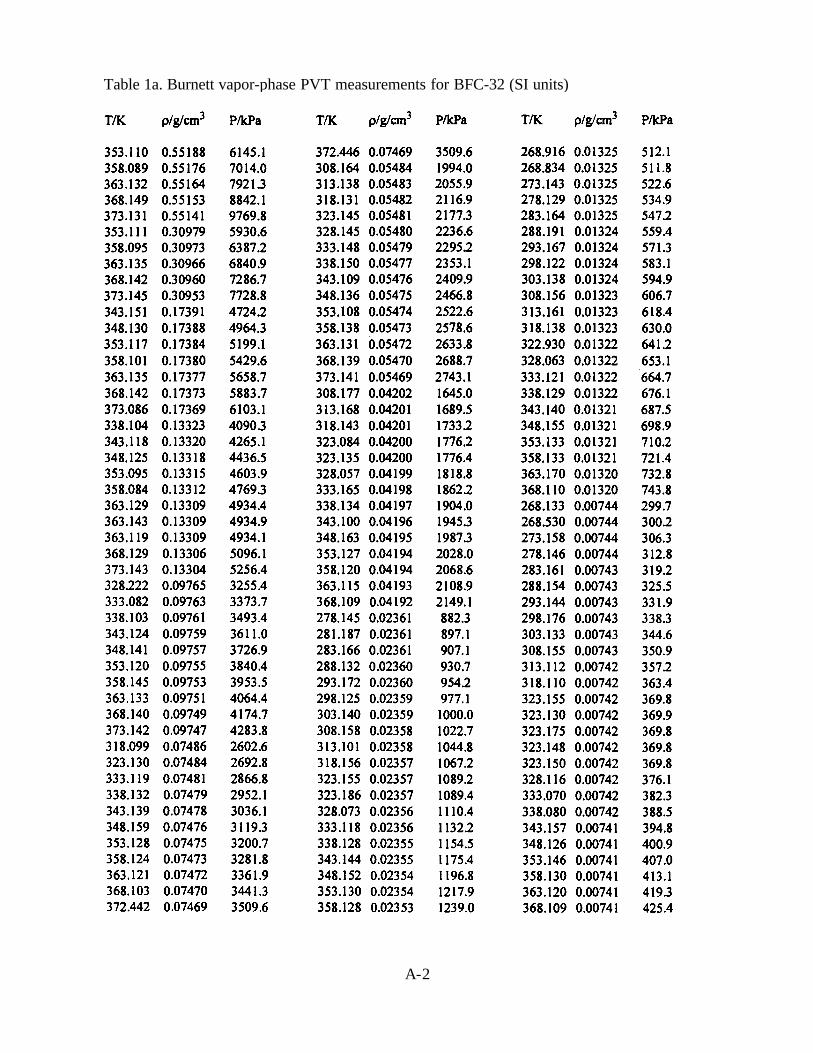
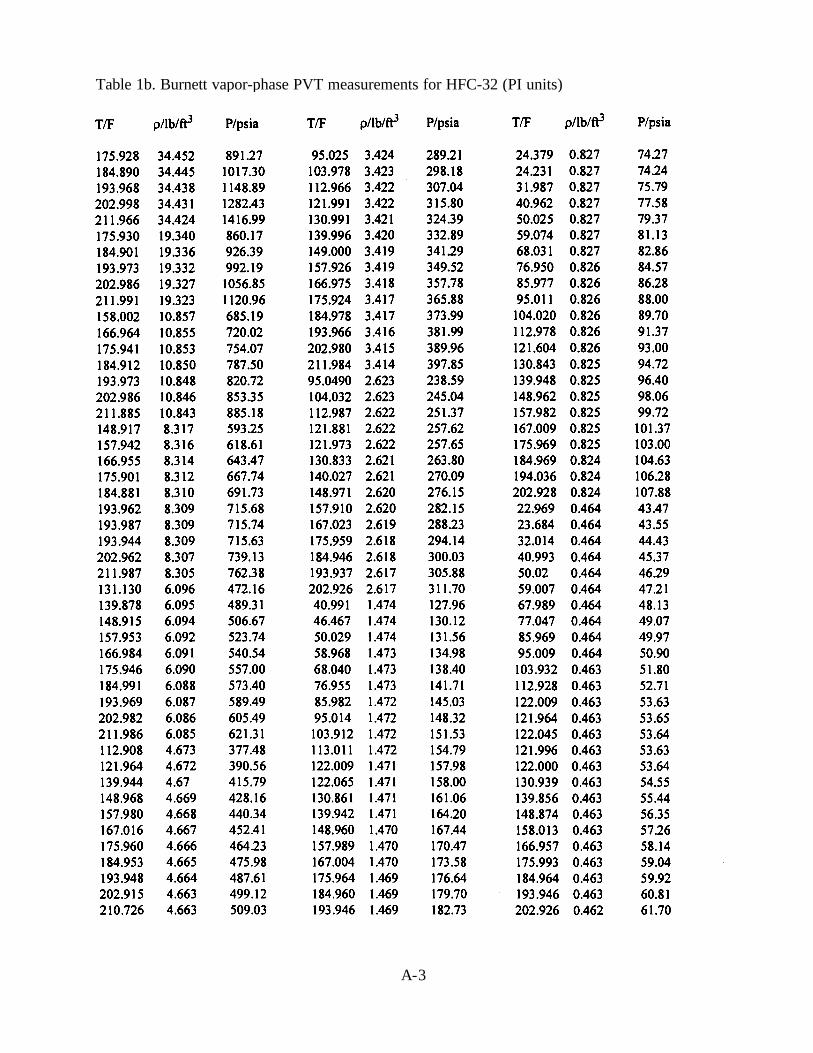
the measurements are indicated as a function of pressure and temperature by the filled circles onFigure 1, and as a function of density and pressure by the filled circles on Figure 2. The results ofthe measurements are given in Appendix A in Table 1; Appendix A includes all tables.
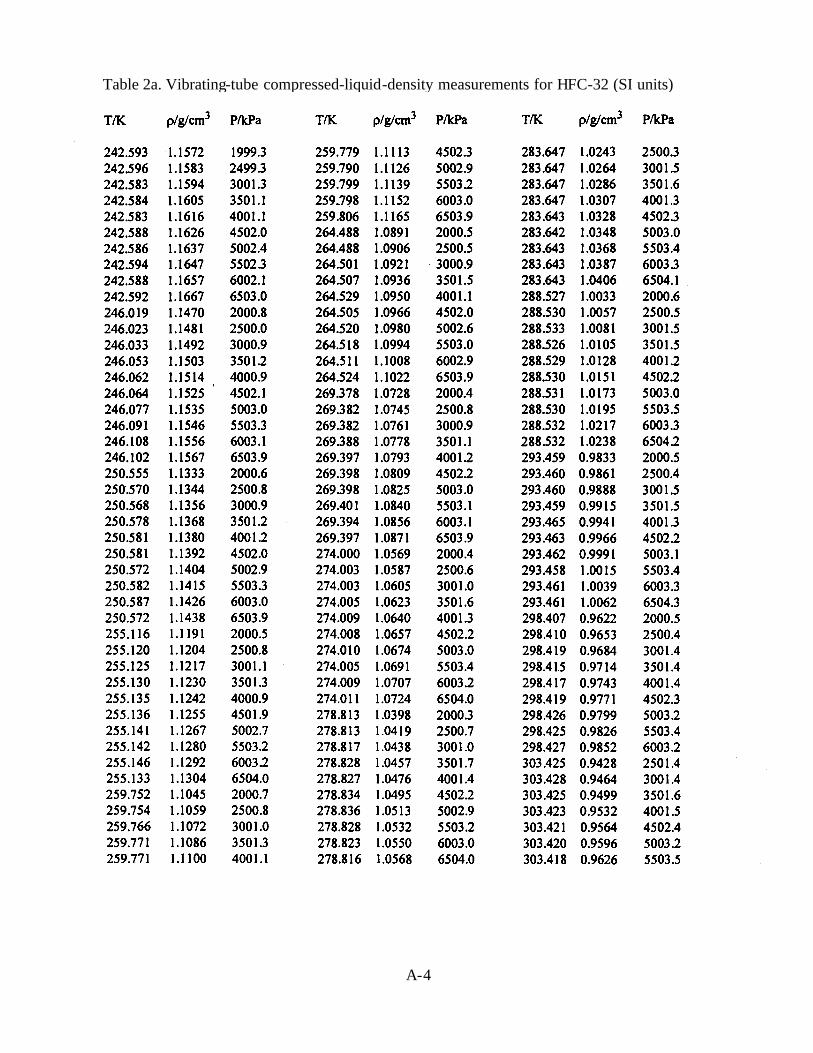
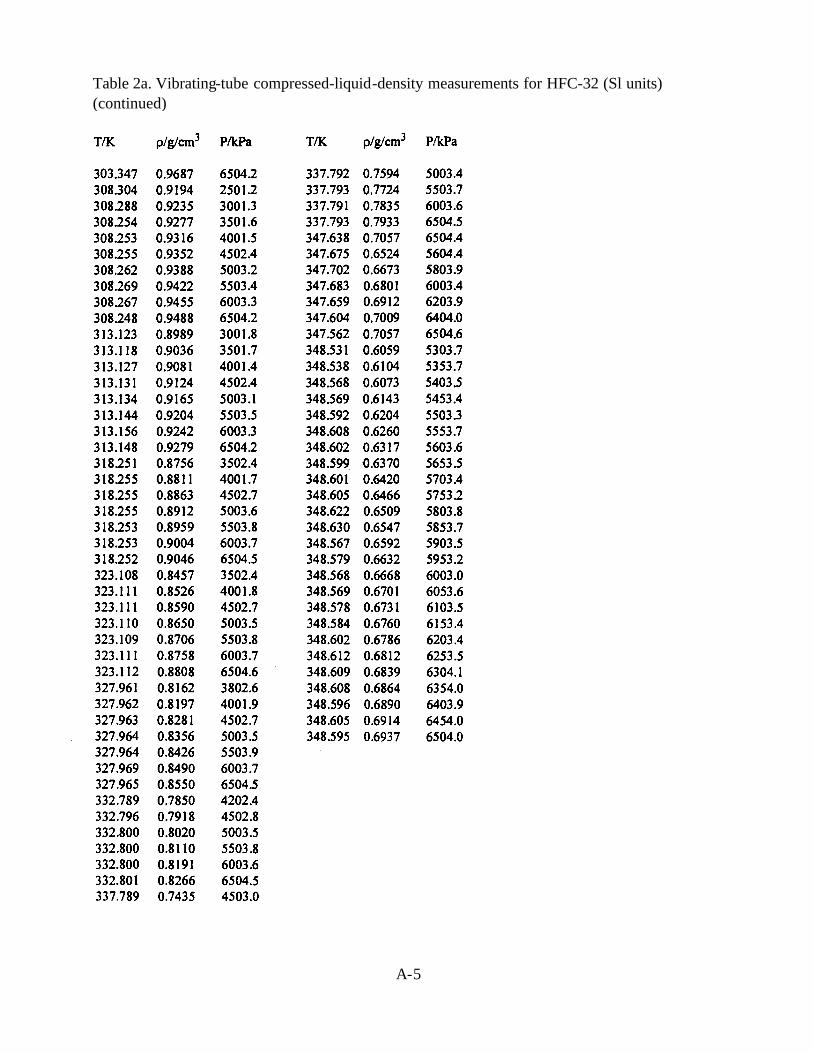
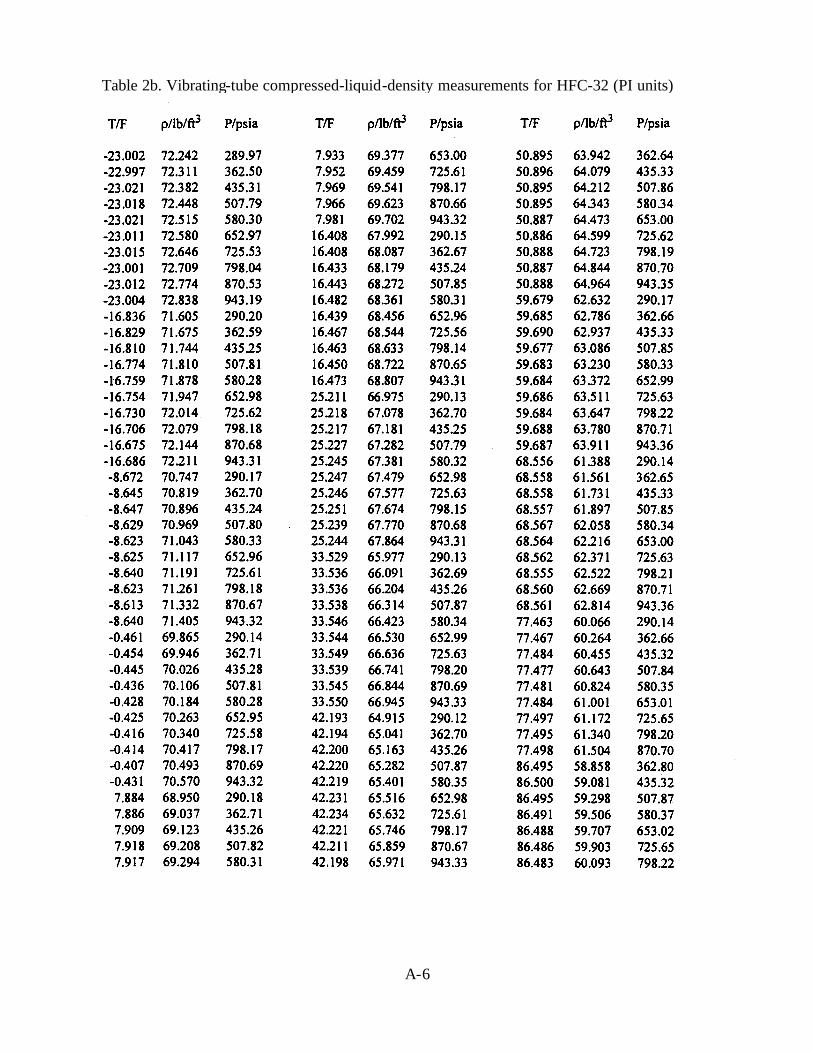
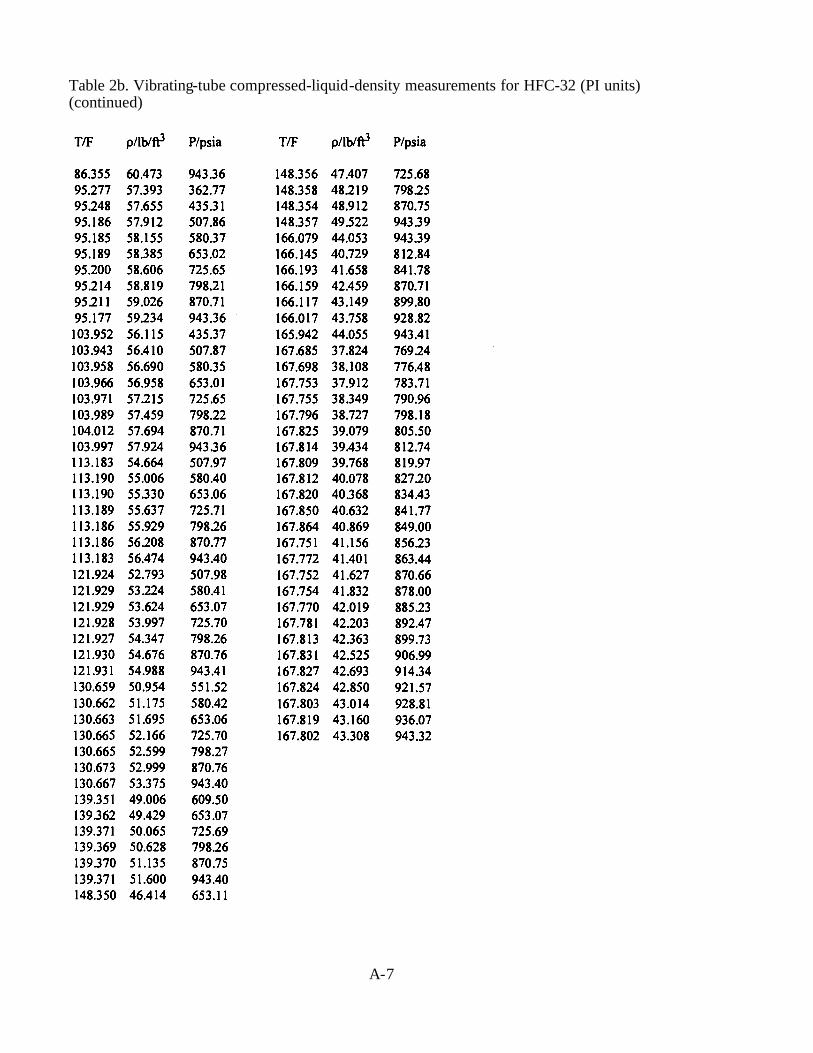
The vibrating tube densimeter has been used to determine the PVT relation for the liquidphase (654 data points). Twenty-one isotherms were completed spanning the ranges 243 to 343 K(-22 to 158°F) and 2000 to 6500 kPa (290 to 940 psi). The locations of the measurements areindicated as a function of pressure and temperature by the open circles on Figure 1, and as afunction of density and pressure by the open circles on Figure 2. The results of the measurementsare given in Table 2.
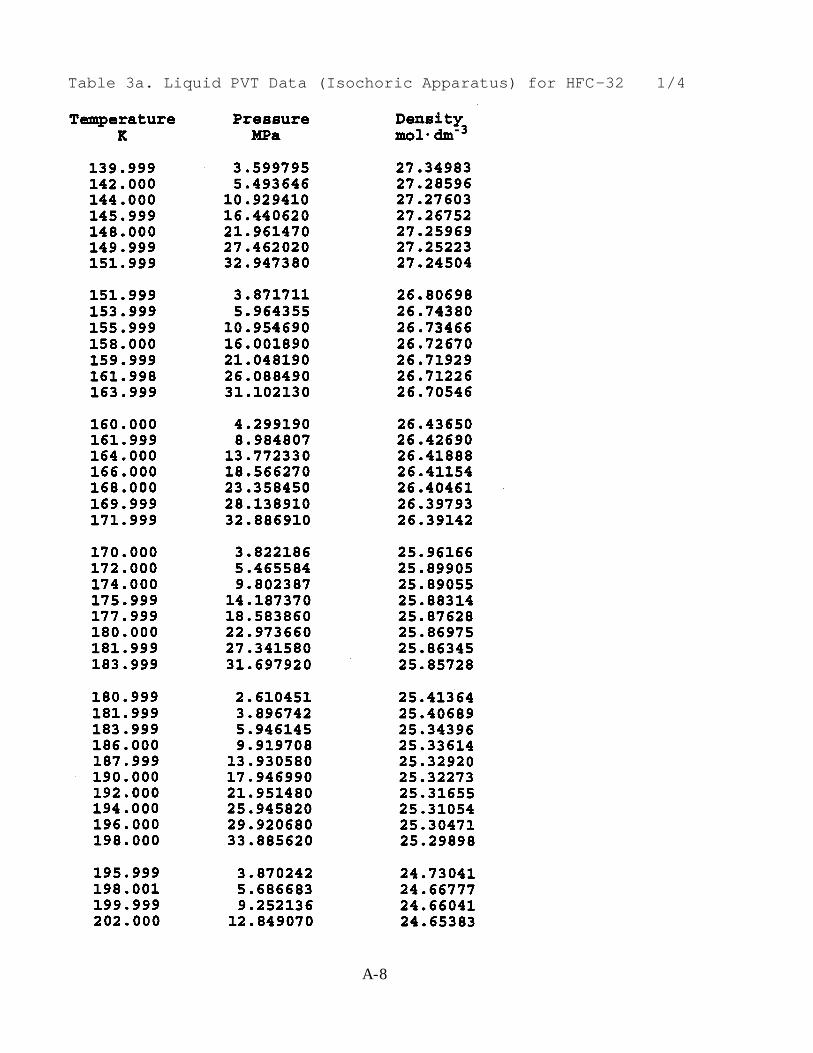
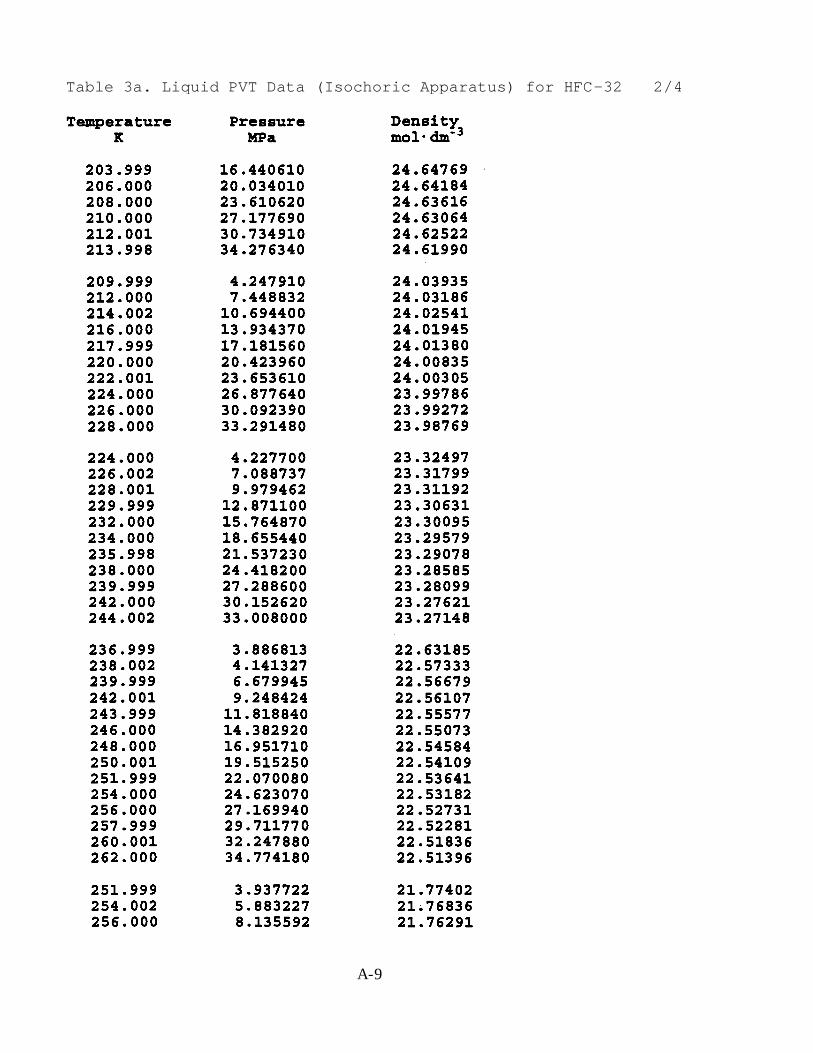
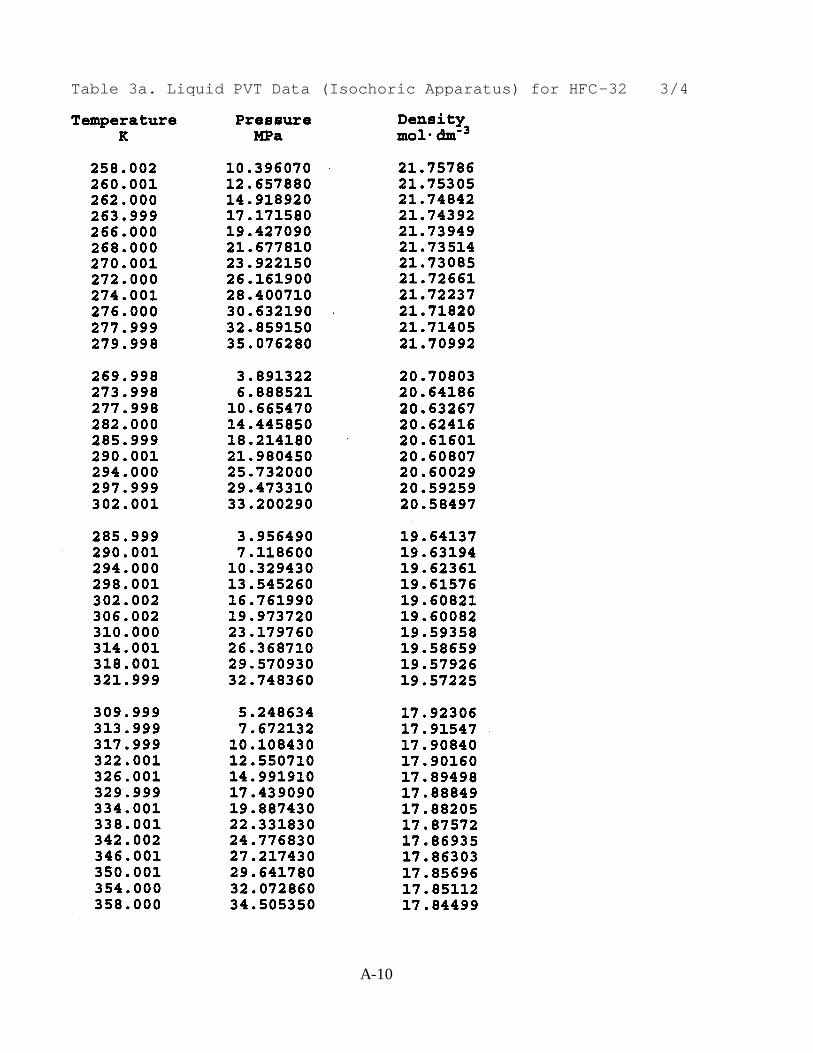
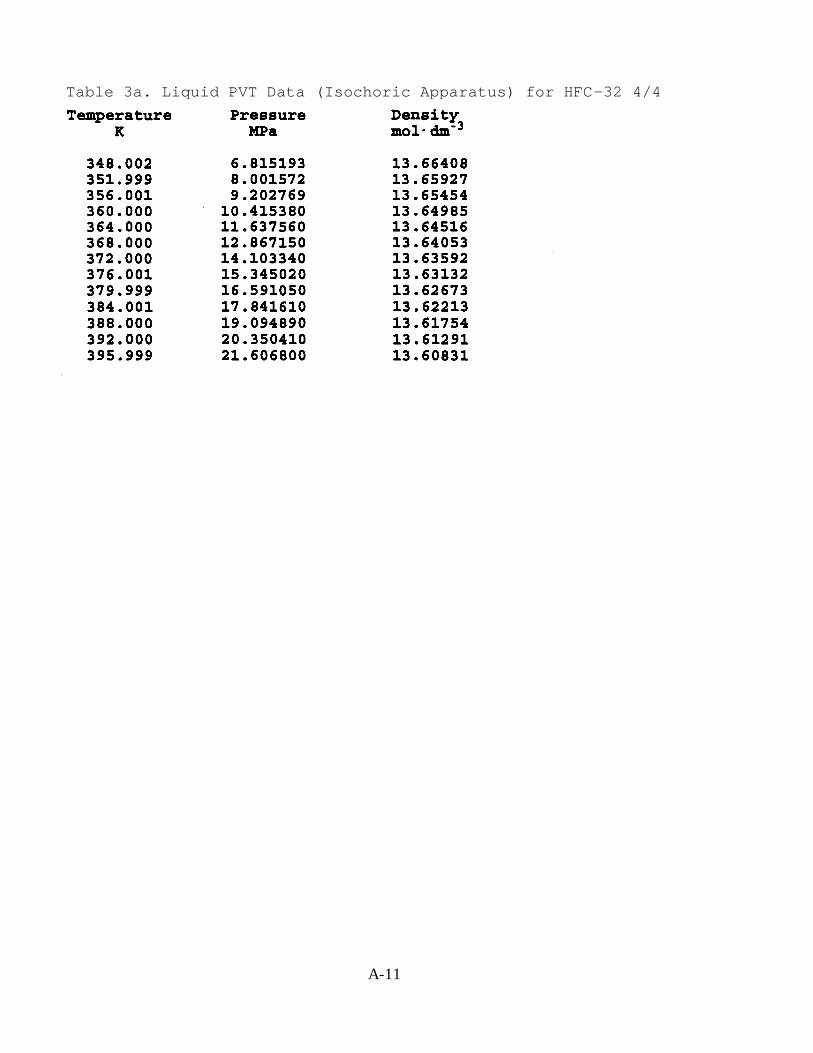
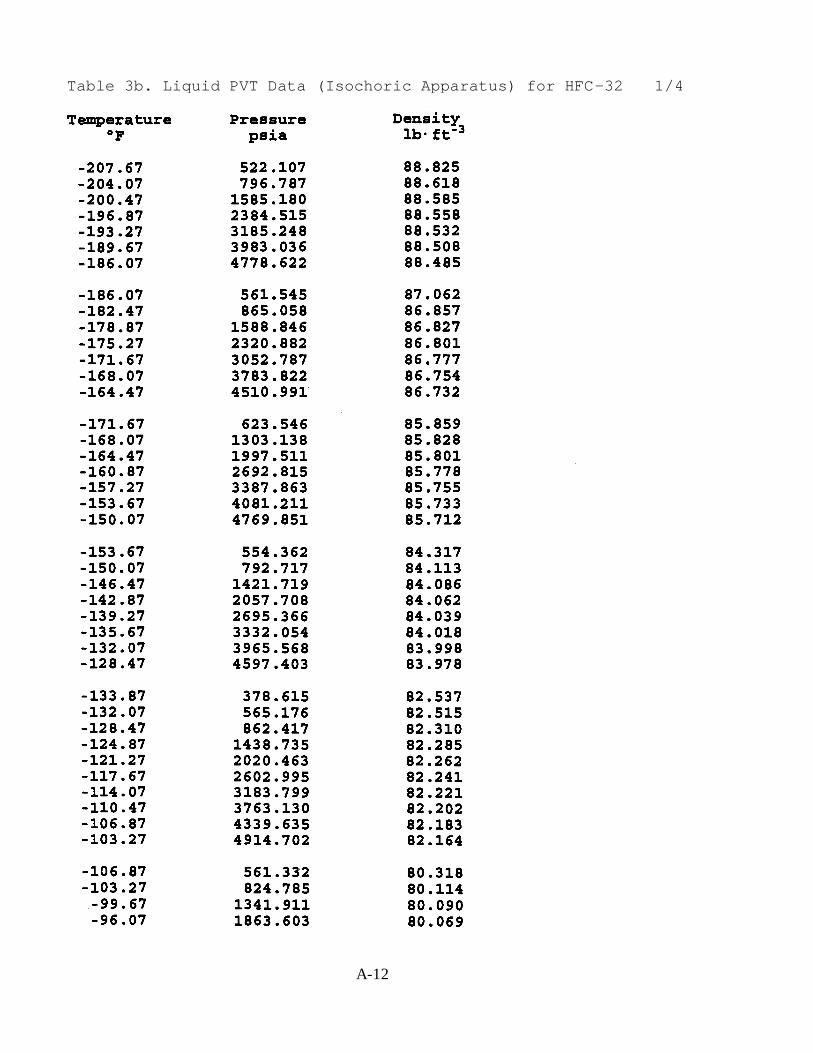
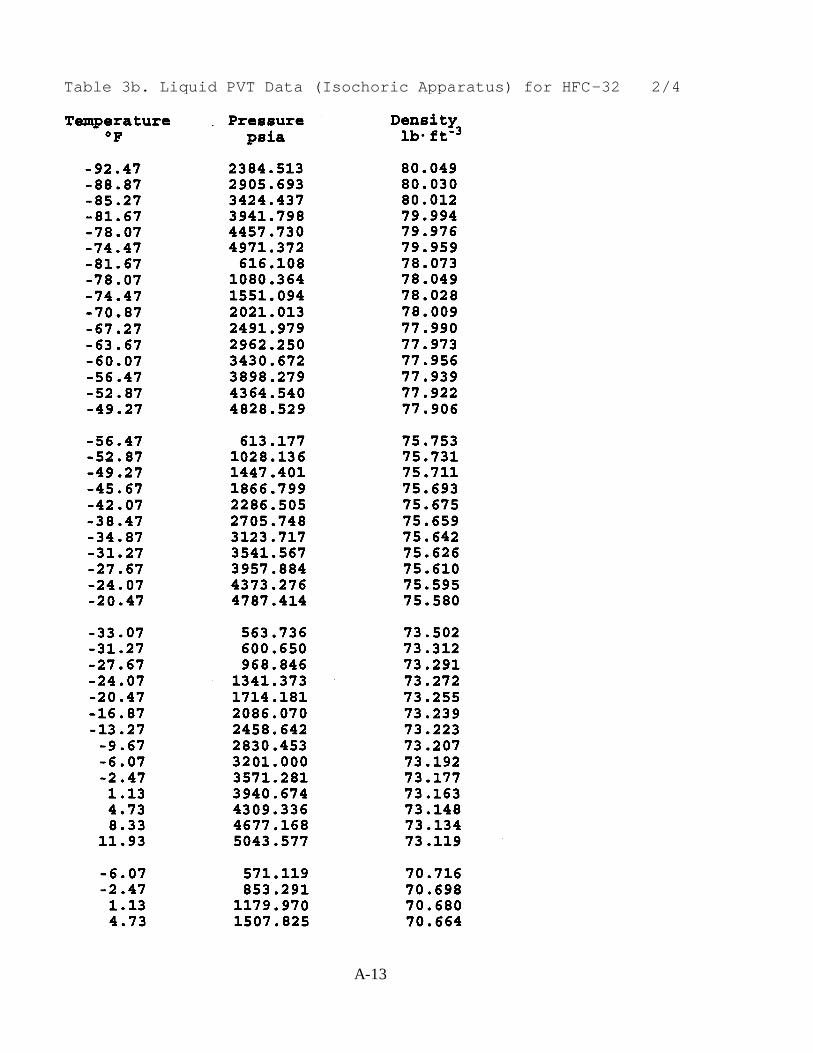
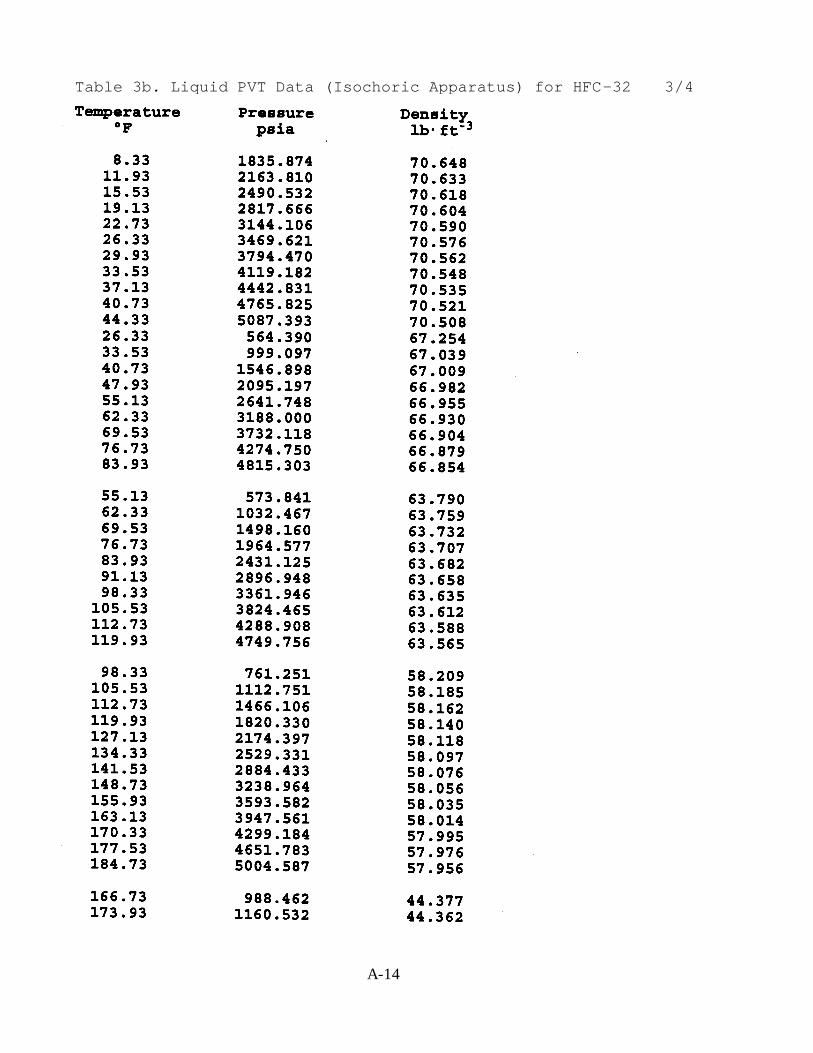
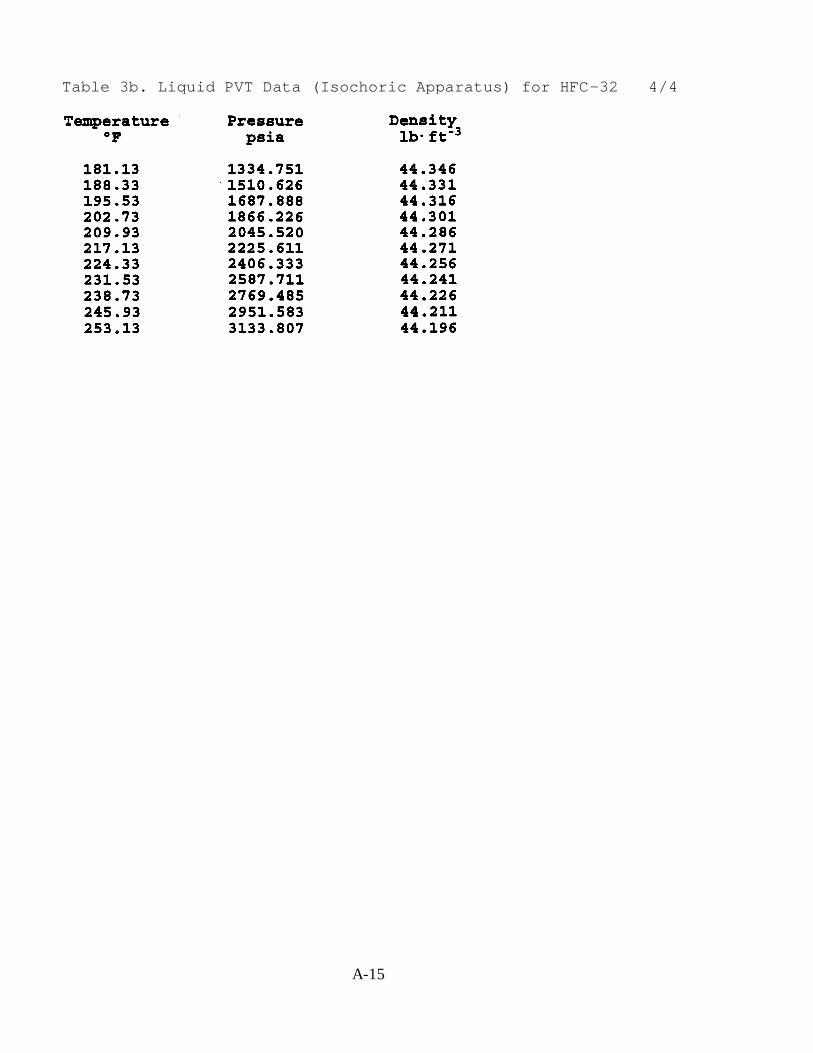
An isochoric PVT apparatus has been used to measure the density of liquid HFC-32 at144 points using the same sample as used in the Cv study (see below). The temperatures rangedfrom 140 to 396 K (-208 to 253 °F) with pressures to 35 MPa (5000 psi). The locations of themeasurements are shown in Figure 3, and the results are presented in Table 3.
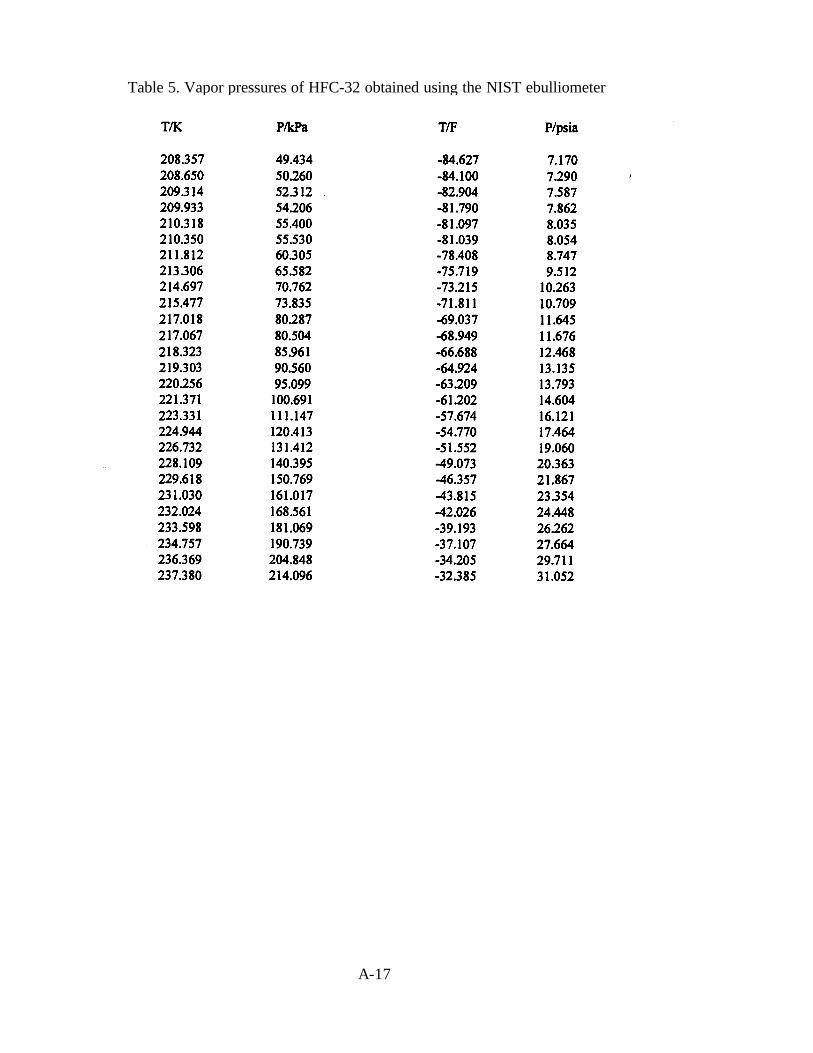
The Burnett apparatus has been used to measure the vapor pressure of HFC-32 at 18temperatures in the range from 268 K (23°F) to the critical temperature at 351.36 K (172.78°F).The results of these measurements are given in Table 4. An ebulliometer has been used tomeasure the vapor pressure of HFC-32 at low temperatures in the range between 208 and 237 K(-85 and -32°F). The results are tabulated in Table 5. The NIST Burnett and ebulliometricvapor-pressure data for HFC-32 have been correlated and their deviations from the resultingcorrelation are shown in Figure 4. Also shown in Figure 4 are the HFC-32 data of P.F. Malbrunot,et al. [J. Chem. & Eng. Data 13, 16 (1968)]. The uncertainties in the NIST measurements are oforder 0.05 %.
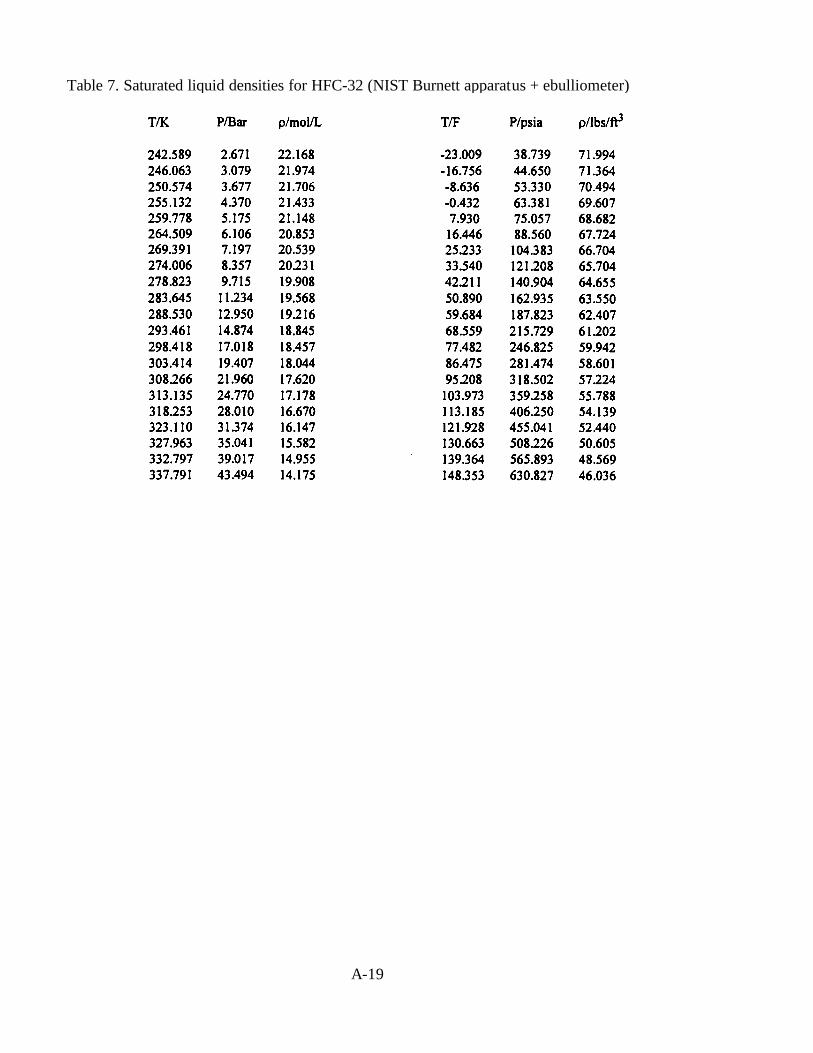
The saturated vapor and liquid densities have been obtained by extrapolating the Burnettvapor-phase and vibrating-tube liquid-phase PVT data to the vapor pressure curve. The saturatedvapor and liquid densities so obtained are given in Tables 6 and 7, respectively.
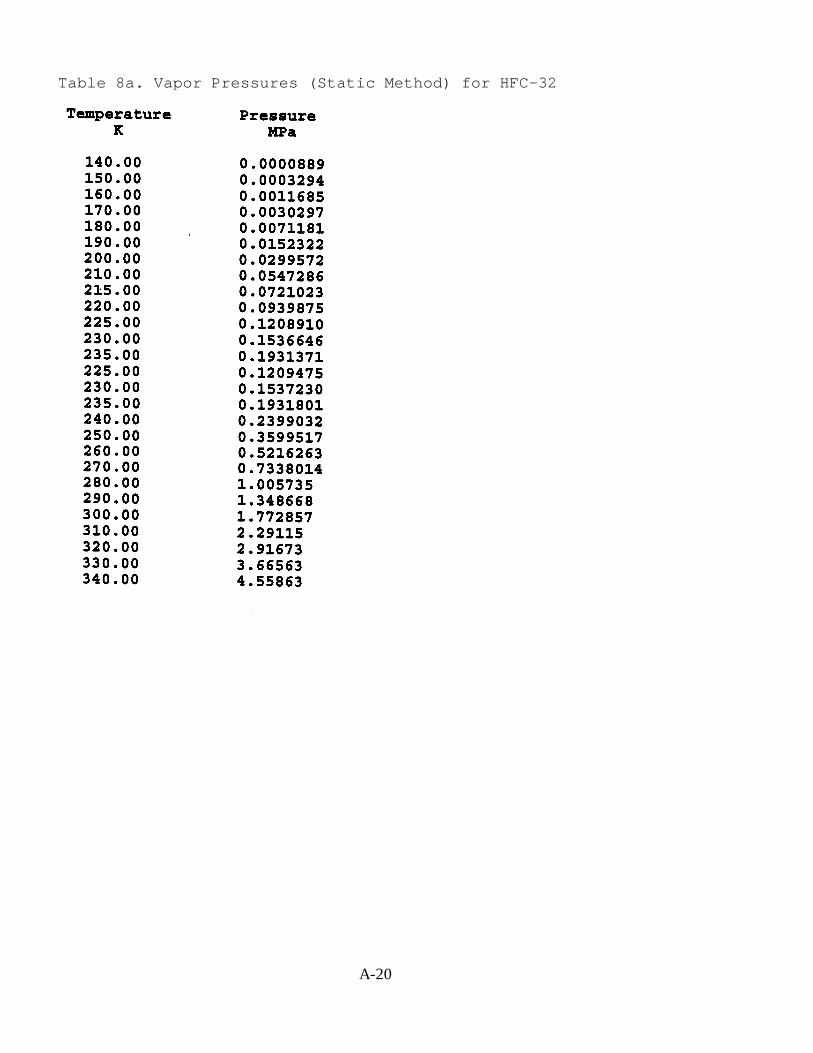
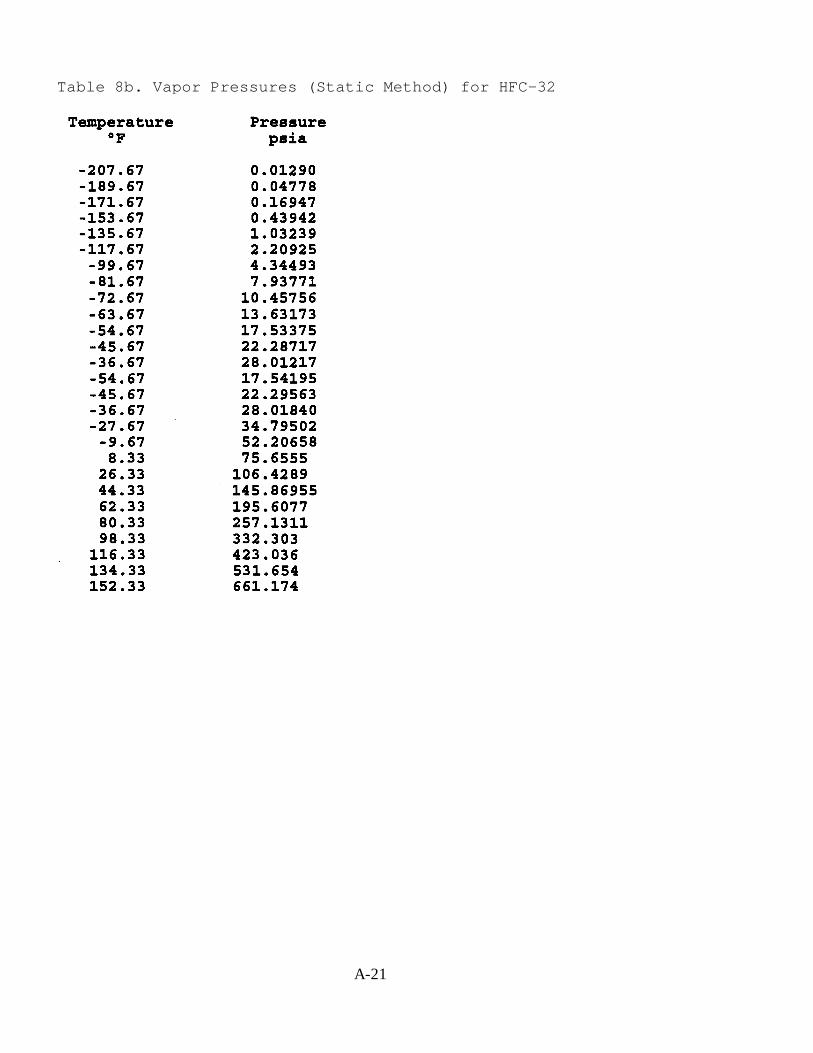
A static method has been used to perform additional measurements of the vapor pressureof HFC-32. The sample was thermostatted in the PVT cell and two additional oscillating quartz-crystal pressure transducers were used to observe the equilibrium pressures. The two transducers,with maximum pressures of 0.2 MPa (30 psi) and 6 MPa (900 psi), were calibrated versus agas-lubricated piston gage with an uncertainty of ± 0.01 %. The range of the vapor pressure datais from 140 to 340 K (-208 to 152°F). These results are given in Table 8.
An optical cell has been used to measure the refractive index and capillary rise of HFC-32from 23°C (73°F) up to the critical temperature. The critical temperature was found to be Tc =(351.36 ± 0.02) K, which corresponds to (172.78 ± 0.04)°F. The refractive index data werecombined with the liquid density data to deduce the value 0.1295 cm3/g for the Lorentz-Lorenzconstant. The refractive index data and the Lorentz-Lorenz constant were used to deduce thevalue ρc = (419 ± 7) kg/m3 [(26.13 ± 0.44) lb/ft3 ] for the critical density.
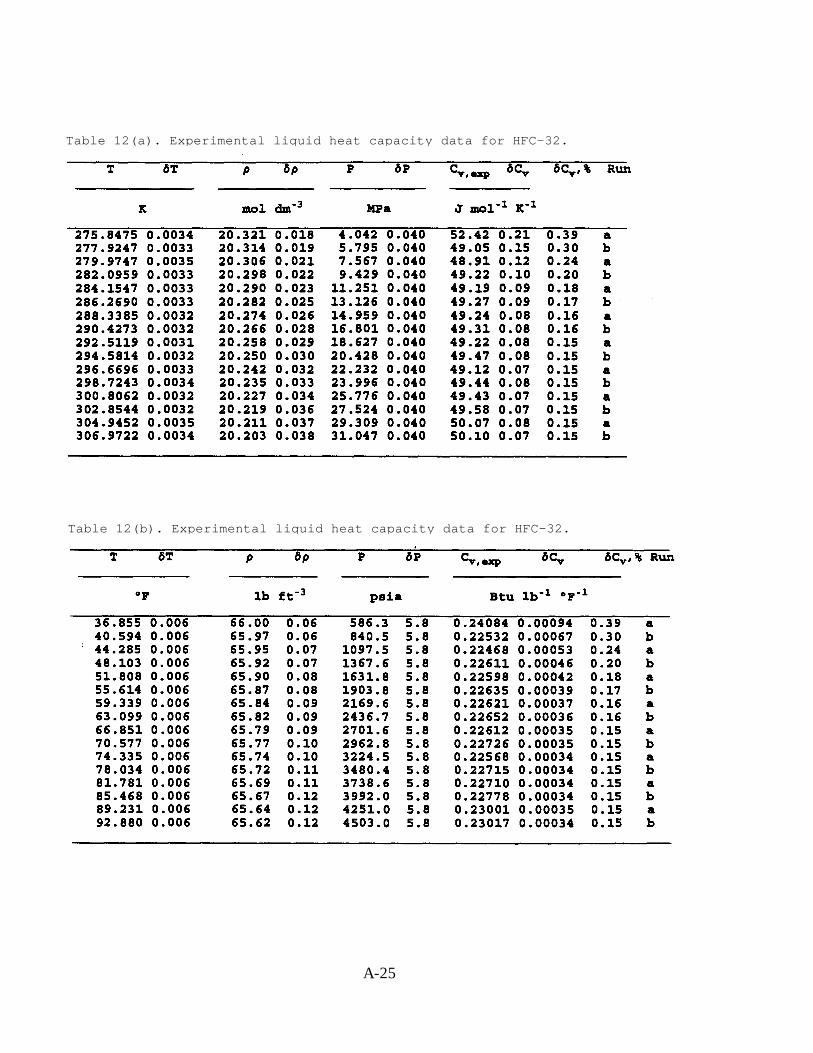
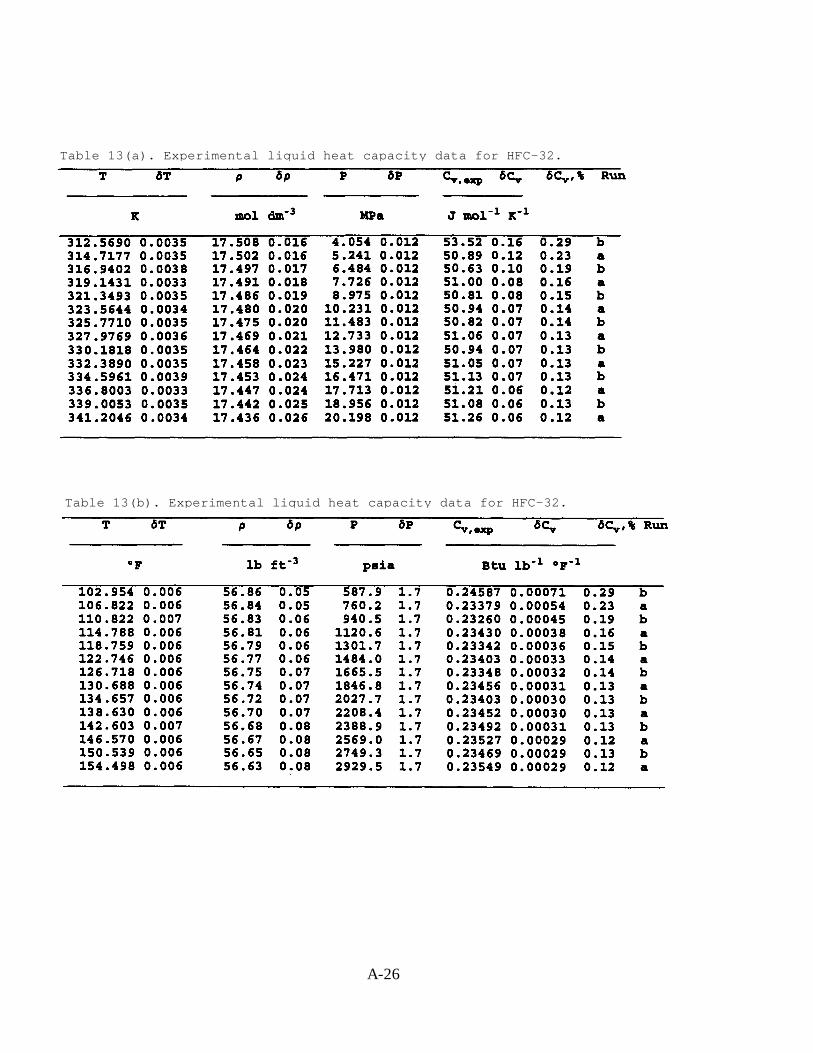
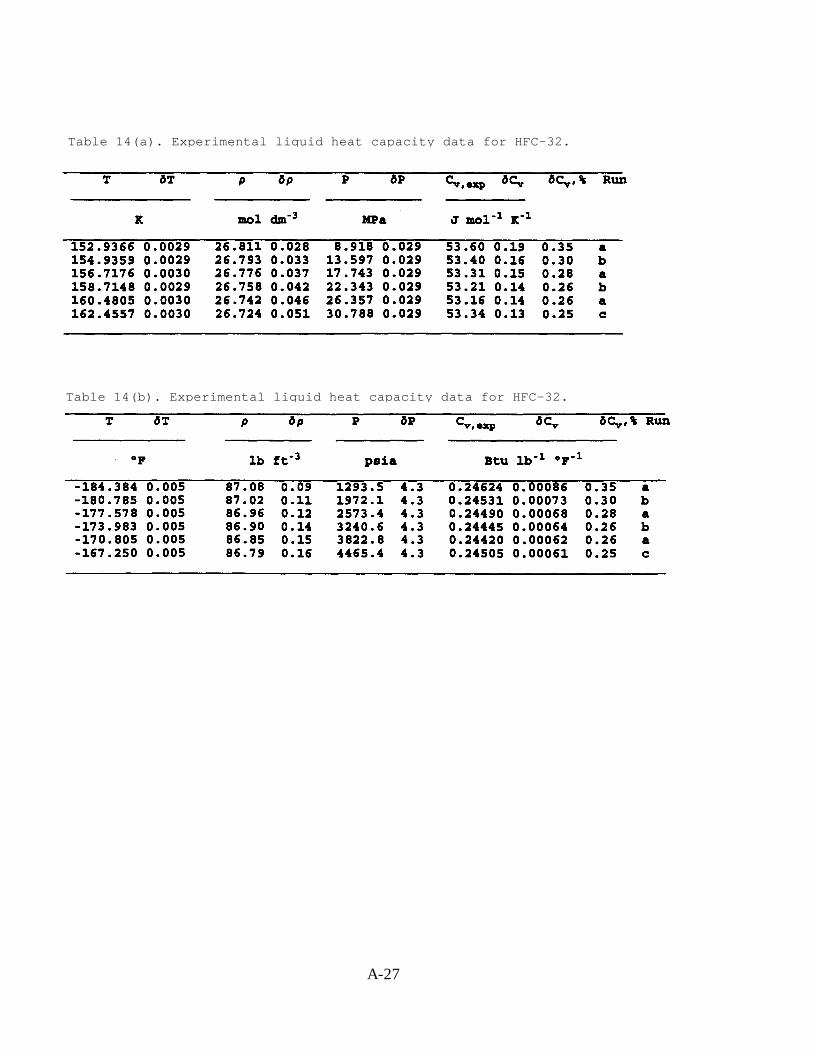
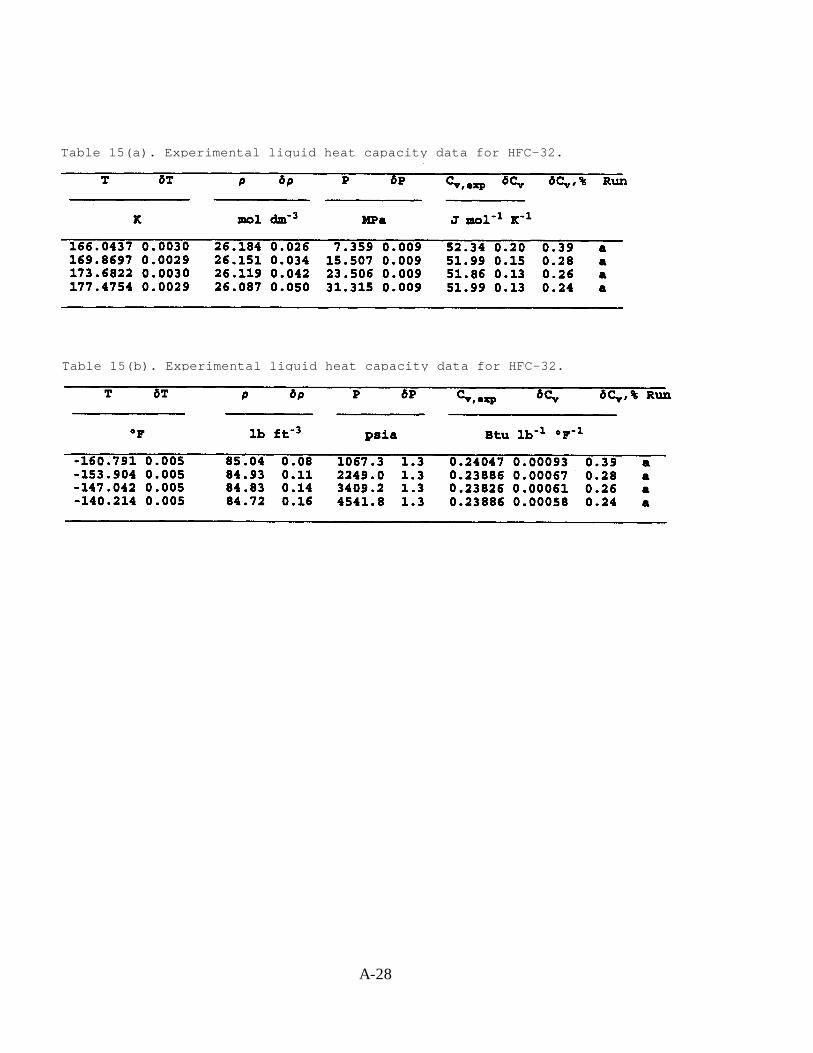
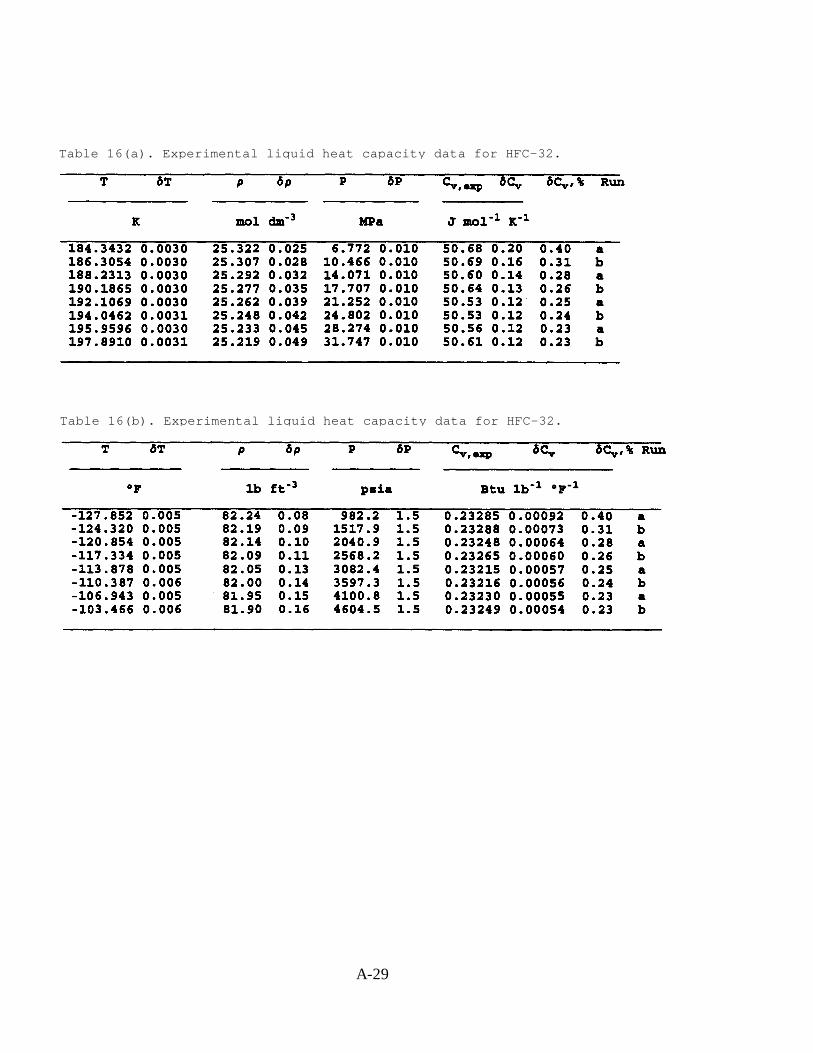
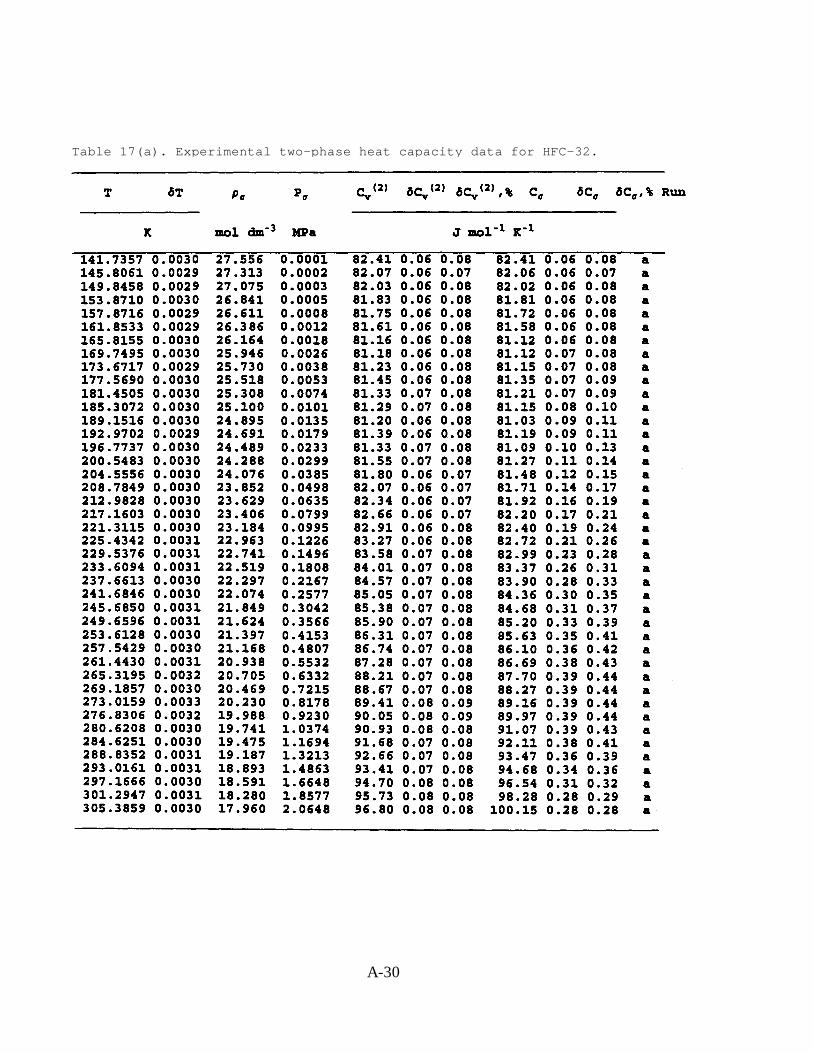
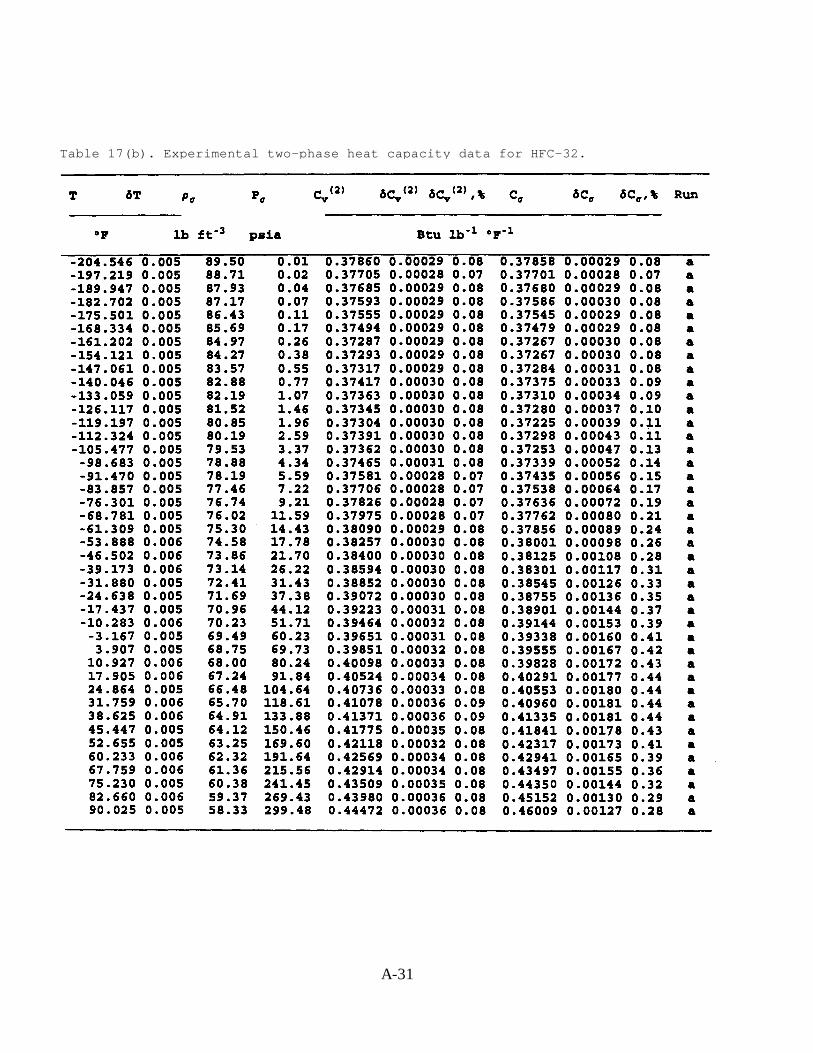
An adiabatic calorimeter has been used to measure the molar heat capacity at constantvolume Cvfor HFC-32. In total, 79 Cv values were measured in the liquid state and 105
2
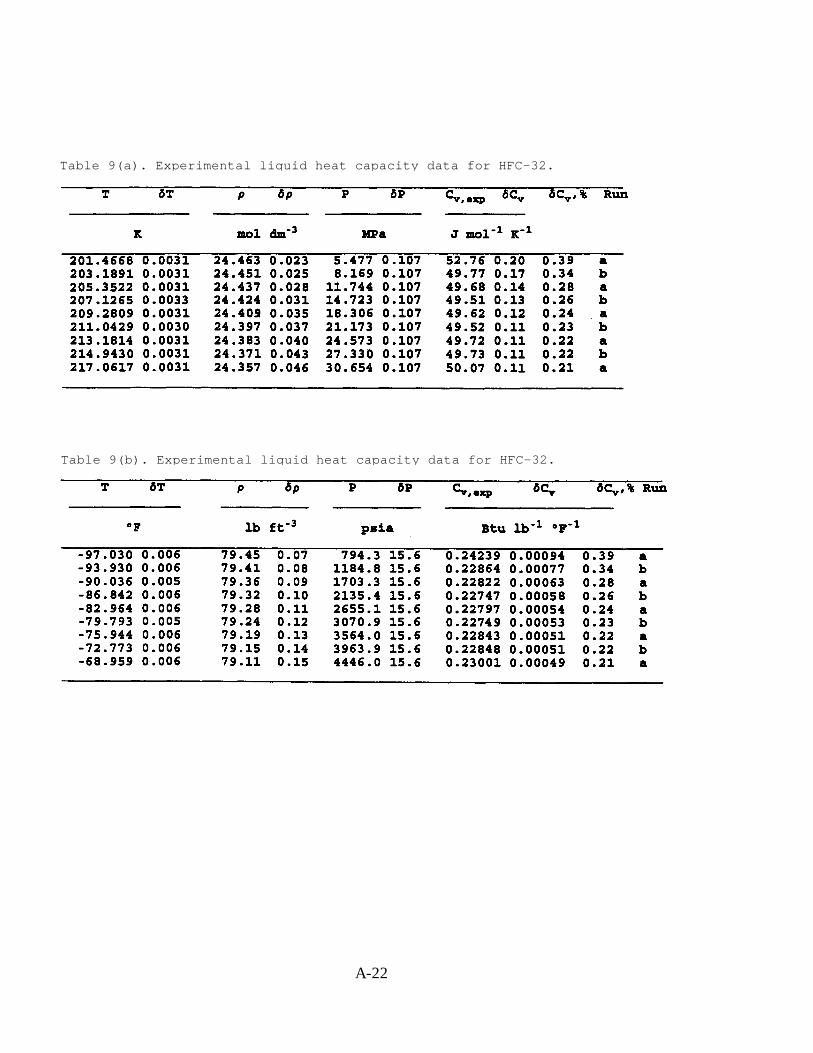
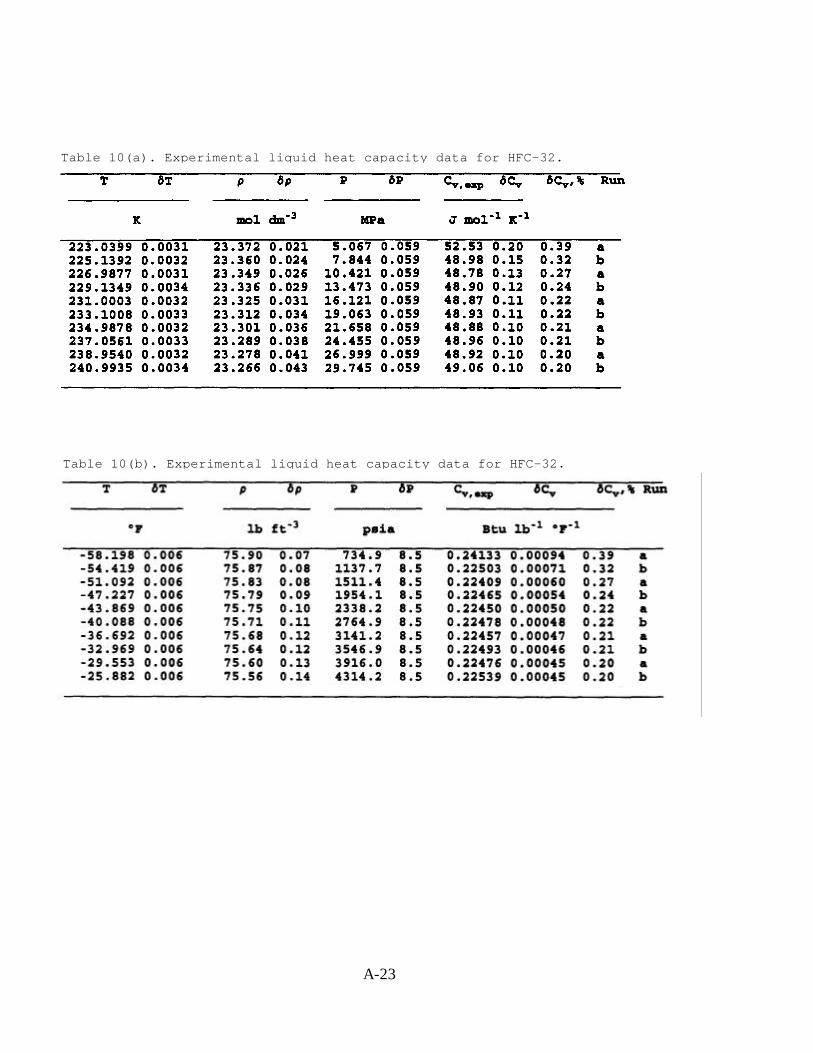
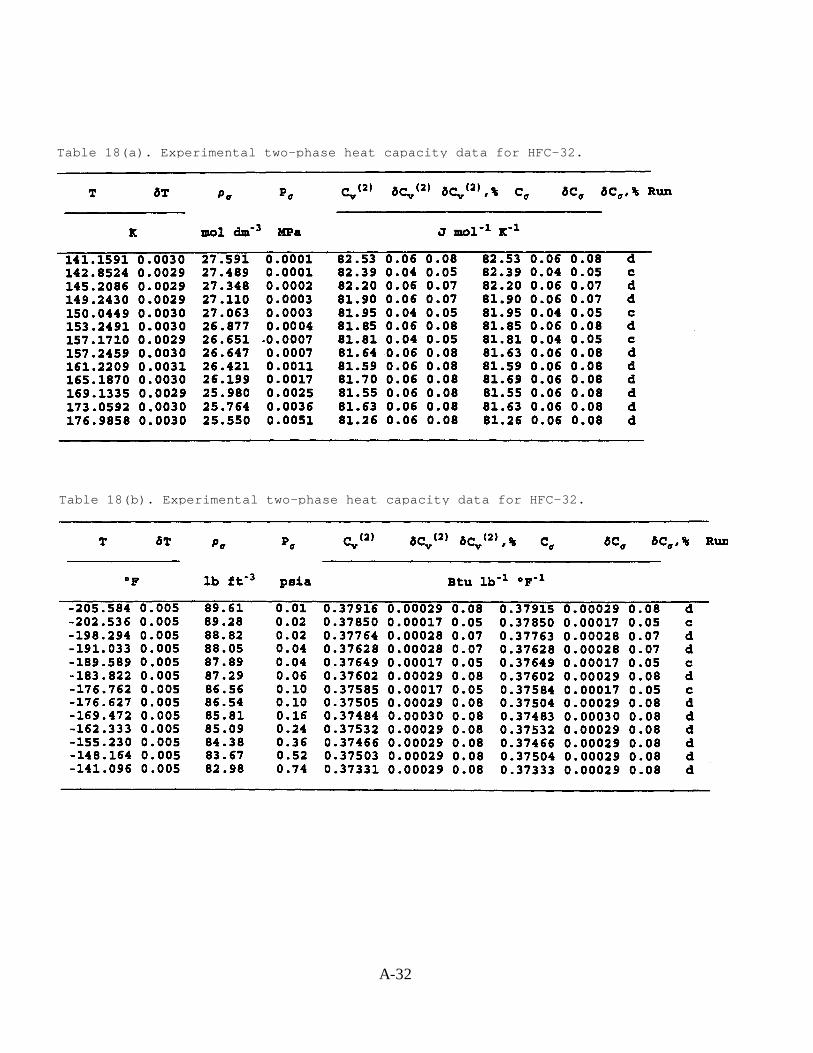
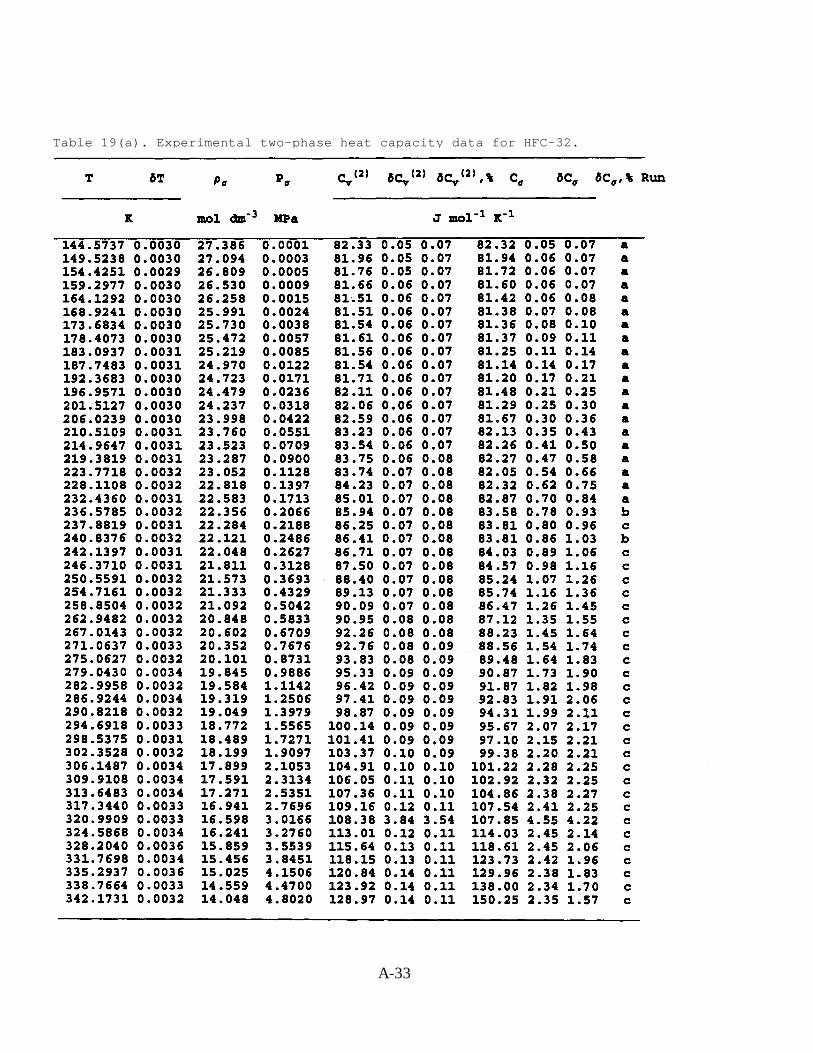
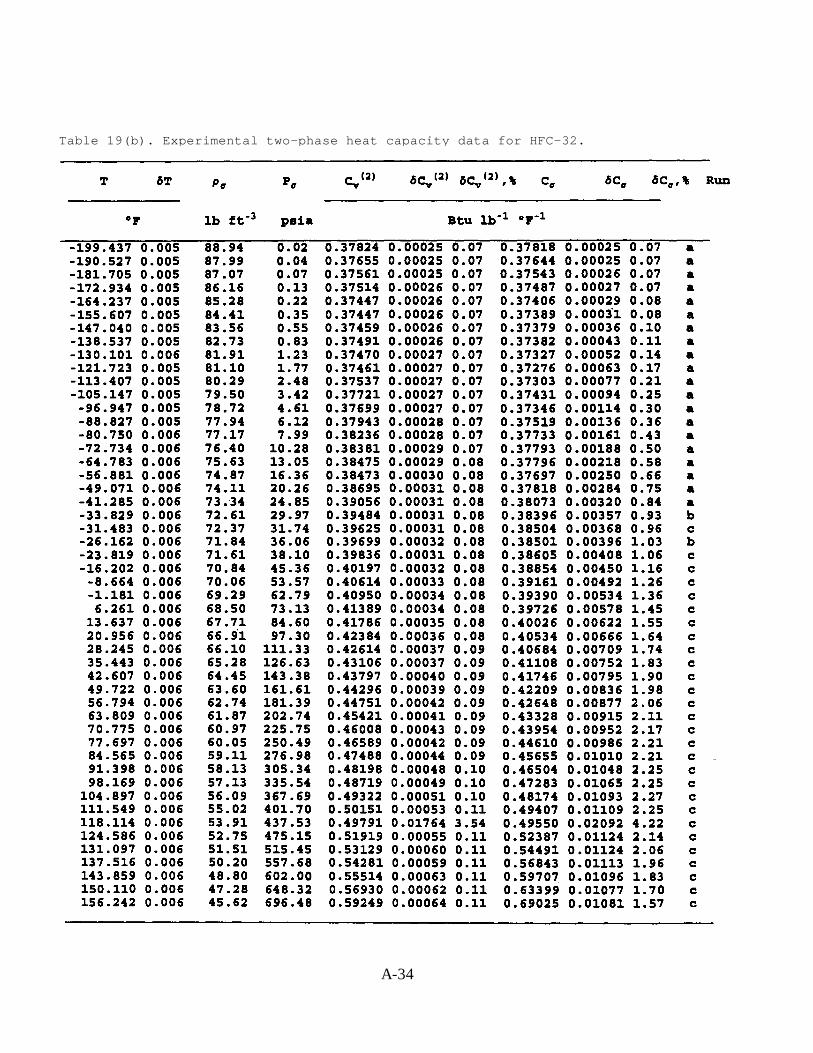
values were measured in the vapor + liquid two-phase region. The temperatures ranged from 141to 342 K (-206 to 156°F), with pressures up to 35 MPa (5000 psi). The measured values are givenin Tables 9 through 16 for the liquid phase and in Tables 17 through 19 for the two-phase region.In addition to the temperature-density-pressure (T-ρ-P) state conditions, the tables presentestimated uncertainties of the measurements which lead to values of liquid heat capacity, Cv, orheat capacity of the saturated liquid, Cσ. These measurements include the amount of sample, N,the calorimeter bomb volume, Vbomb, the observed temperature rise, ∆T, the energy absorbed,Qtare, and the heat capacity, dQtare/dT, of the empty calorimeter bomb, gross heat capacity, Q/∆T,and the PV work done by the sample to expand the bomb during a heat capacity measurement,Wpv,m. Figure 5 illustrates the pressures and temperatures covered by this study.
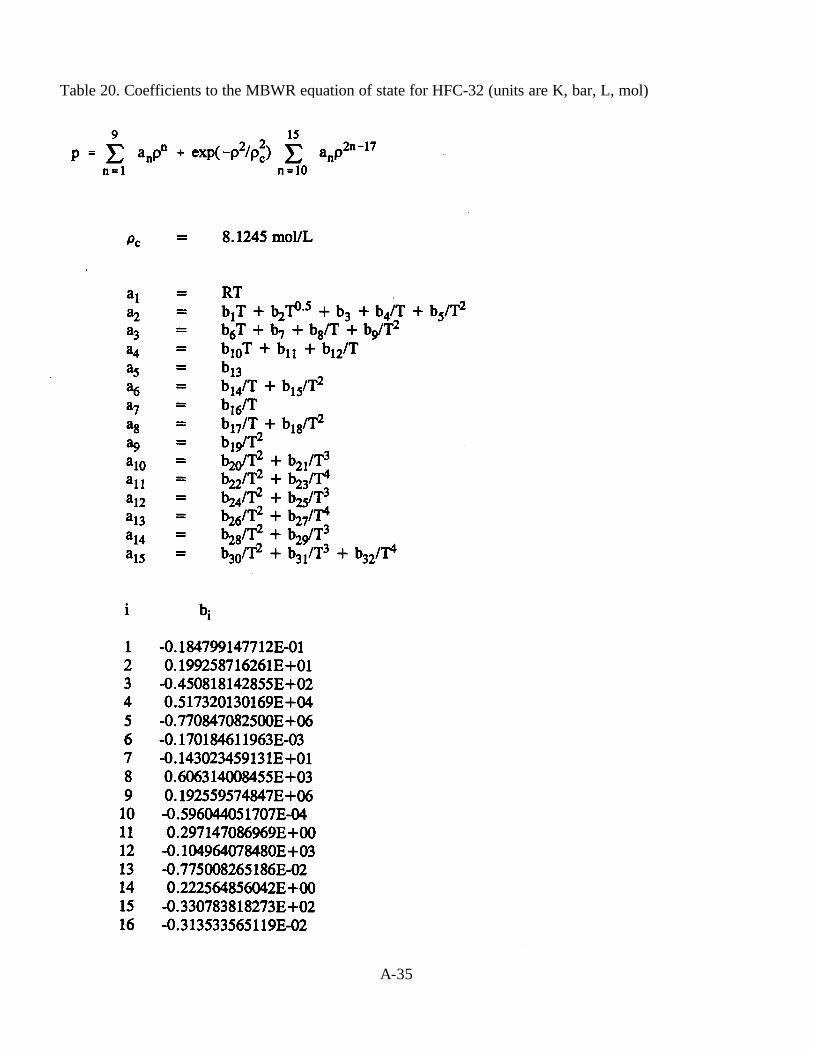
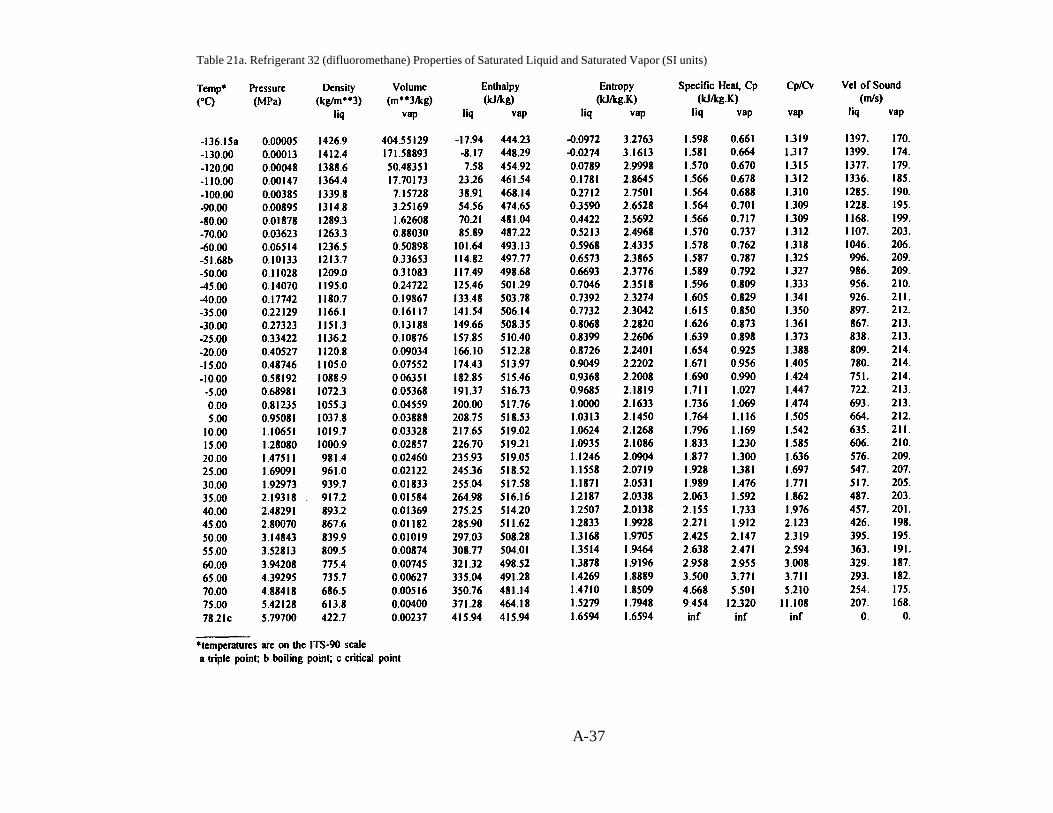
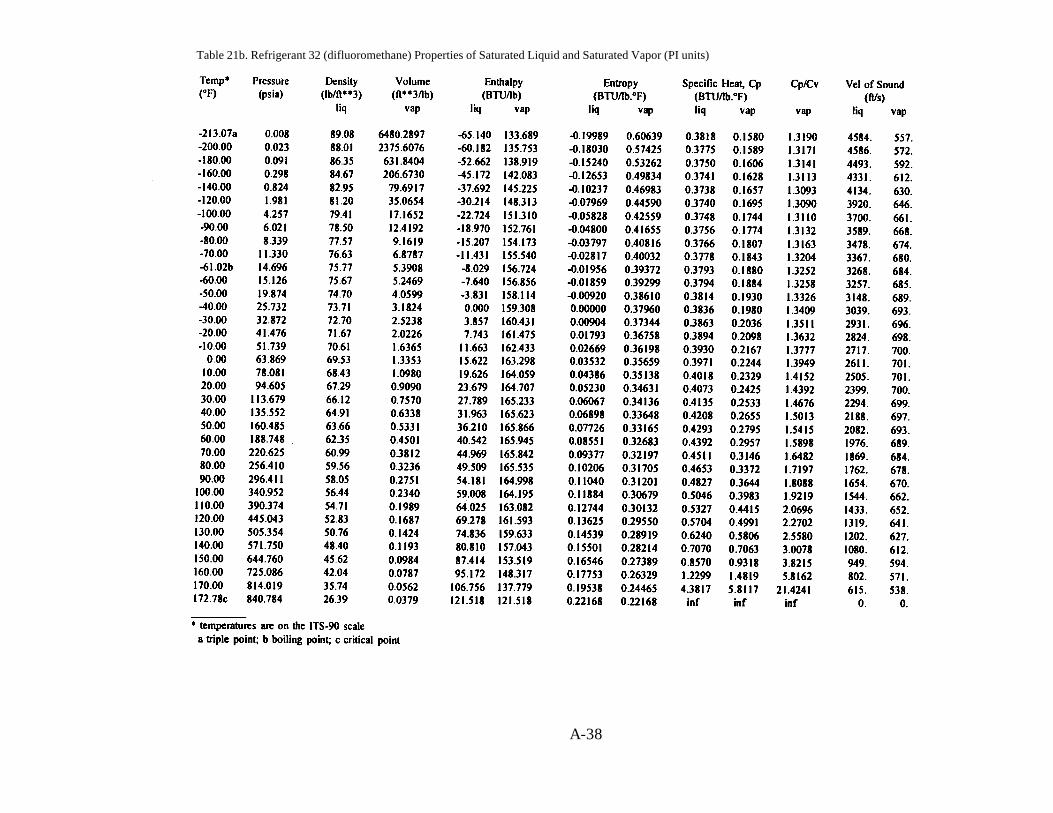
A 32-term MBWR equation of state for HFC-32 has been developed. It is valid attemperatures from the triple point at 137 K (-213 °F) to 400 K (260°F), and it appears to bereasonable upon extrapolation up to 500 K (440°F). The maximum pressure for the equation is 40MPa (6000 psi), and it appears to be reasonable upon extrapolation up to 100 MPa (15000 psi).This equation was fit using a multiparameter linear least squares routine to the data measuredunder this contract as well as selected data reported in the literature. Data used in the fit includedvapor pressures, saturated liquid and vapor densities, liquid and vapor phasepressure-volume-temperature (PVT) data, virial coefficients, and isochoric heat capacities atsaturation and in the single-phase liquid. Table 20 gives the coefficients to the equation of state,and Table 21 tabulates the saturation properties calculated with the equation of state. Figures 6through 10 compare the values of various properties calculated with the MBWR equation to theexperimental values used in the fit. This MBWR equation for HFC-32 will be incorporated intoversion 4.0 of the REFPROP computer package, which will be released in the coming months; itwill be available as an option in addition to the CSDM equation of state for HFC-32.
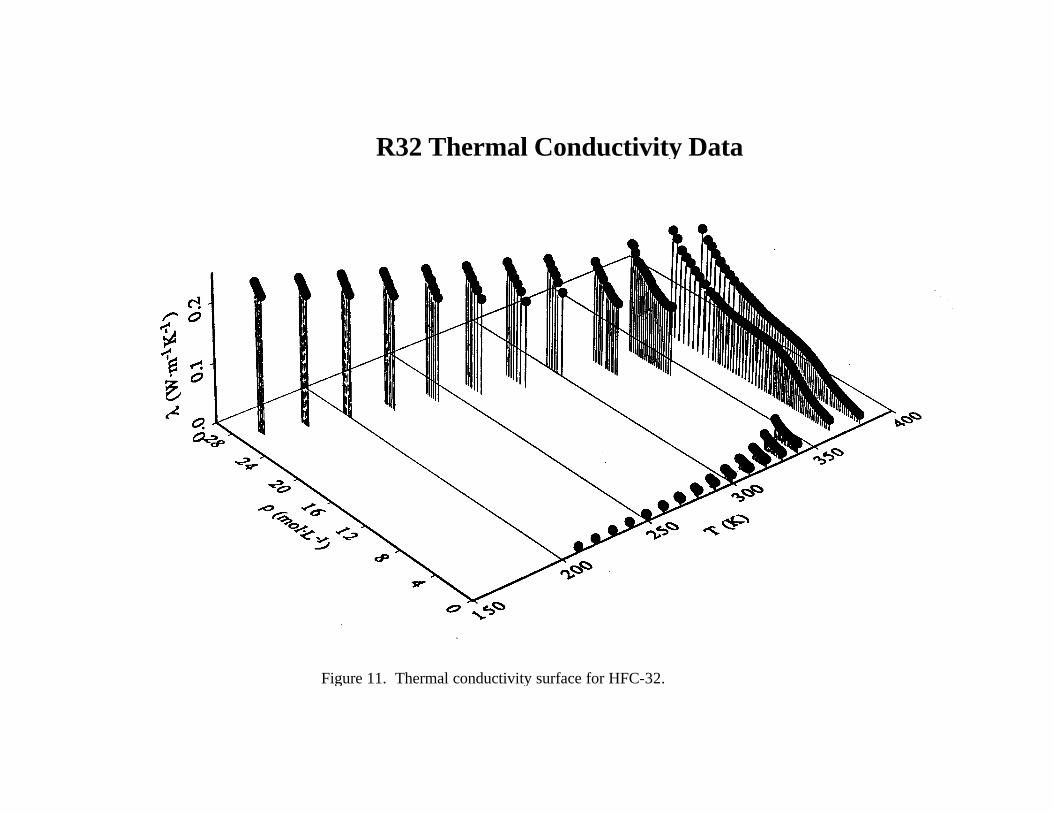
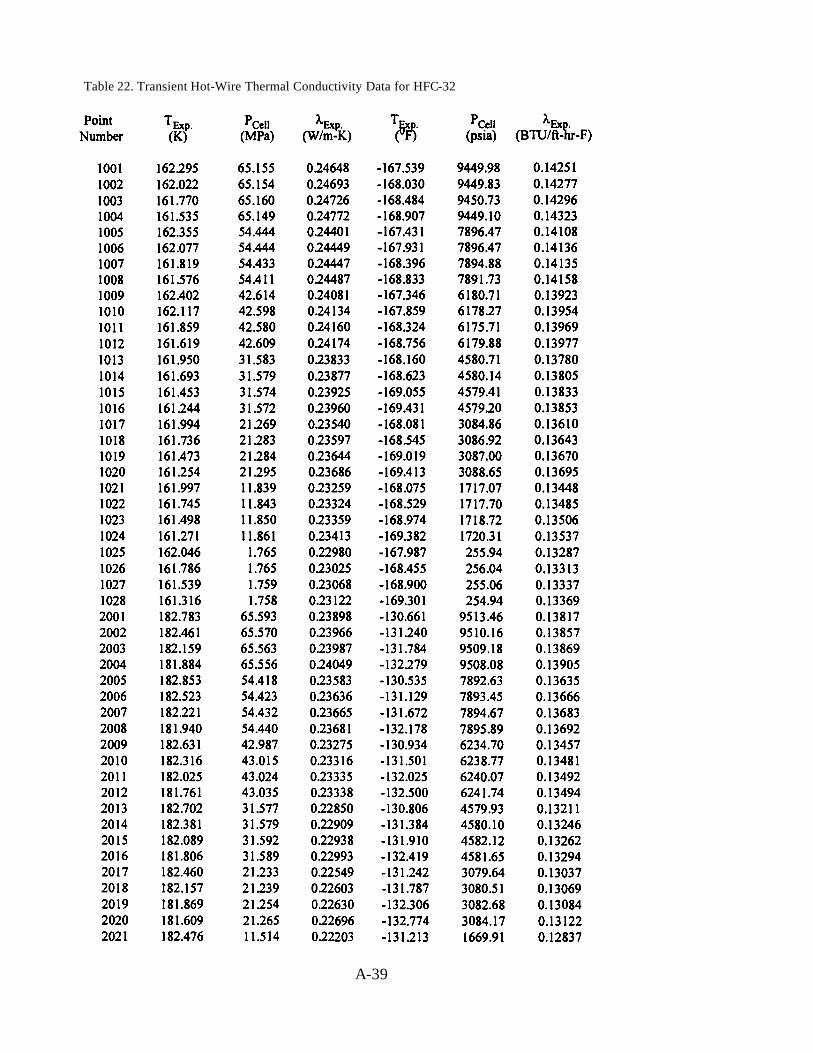
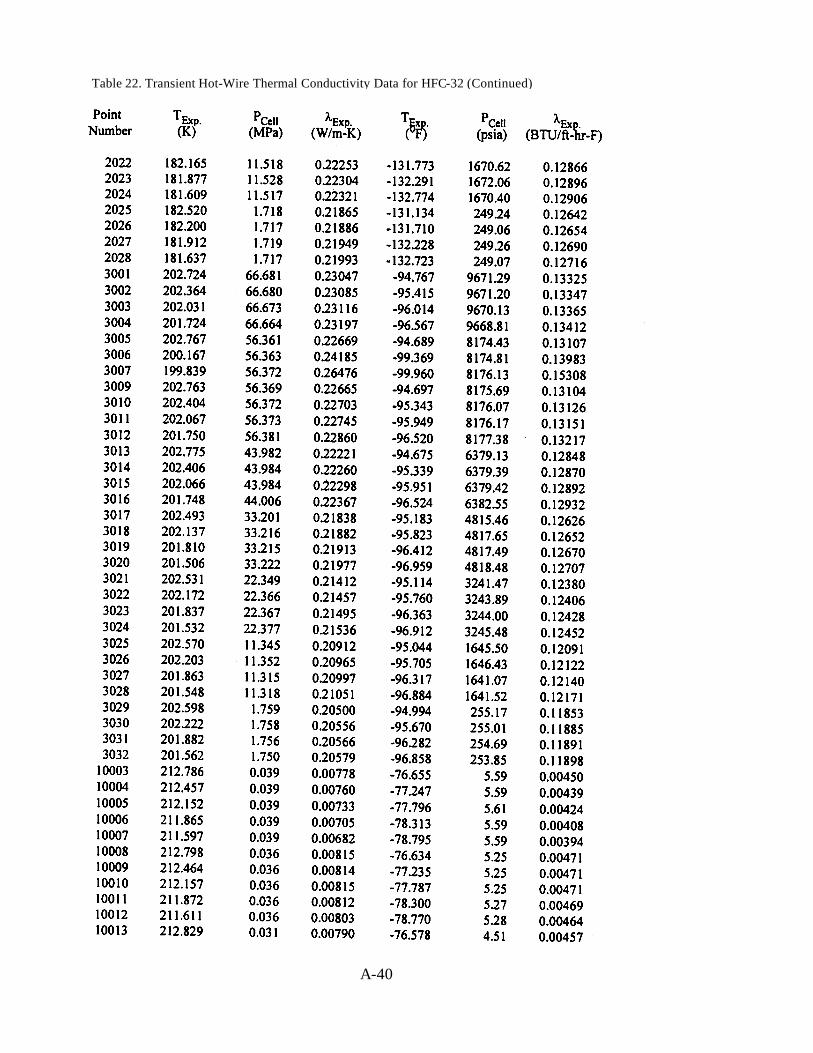
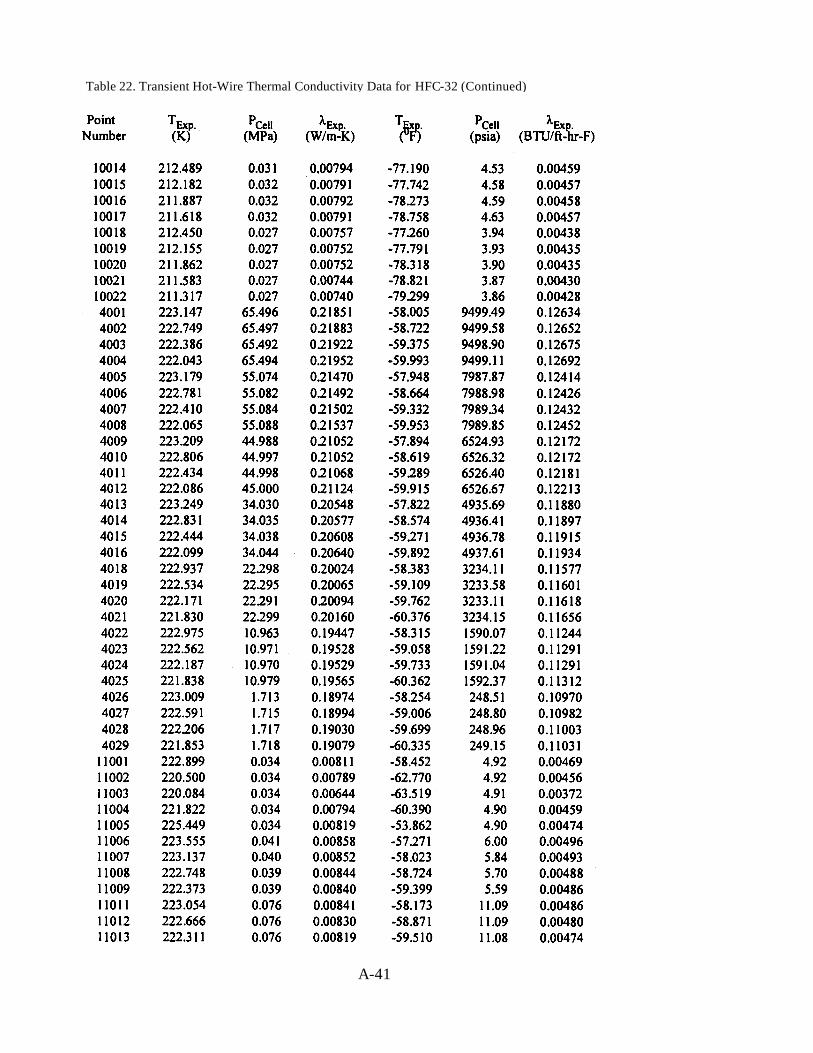
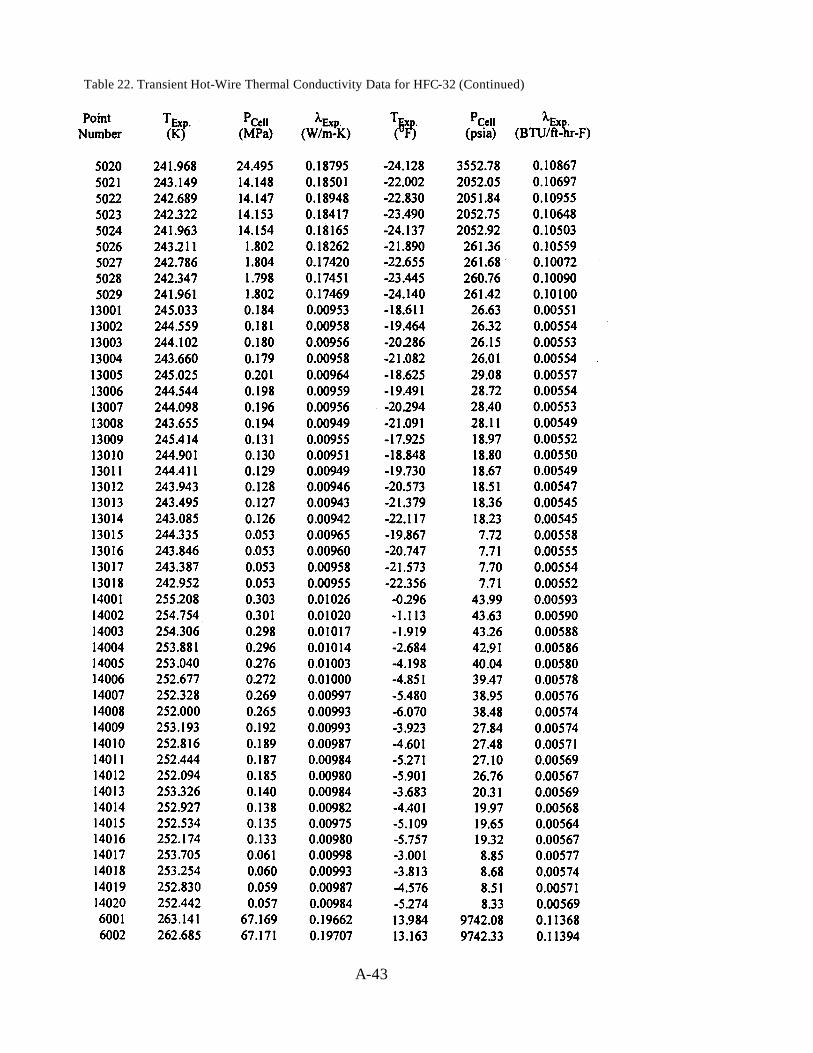
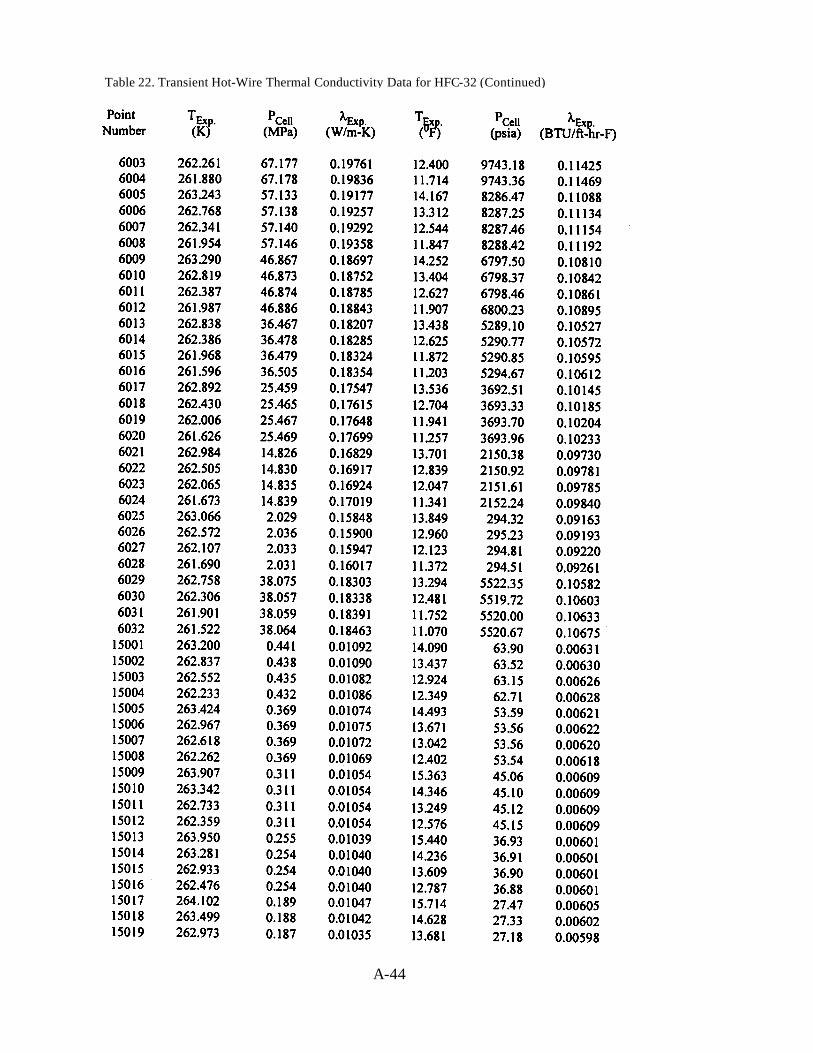
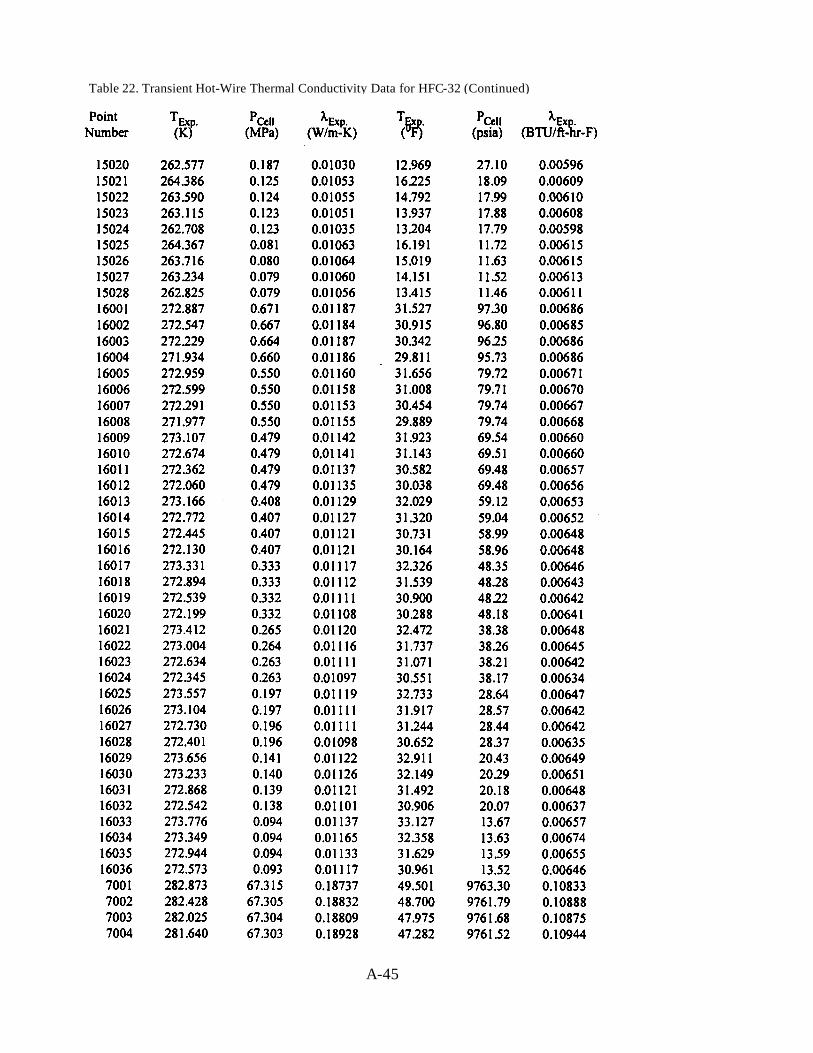
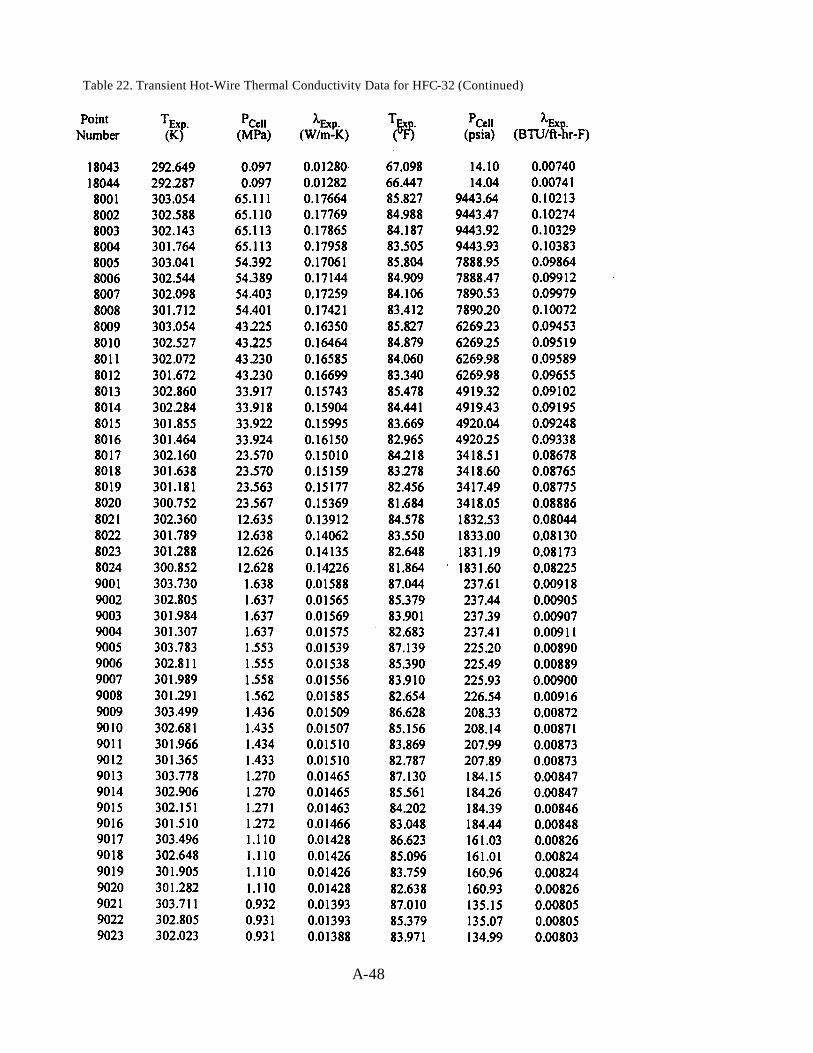
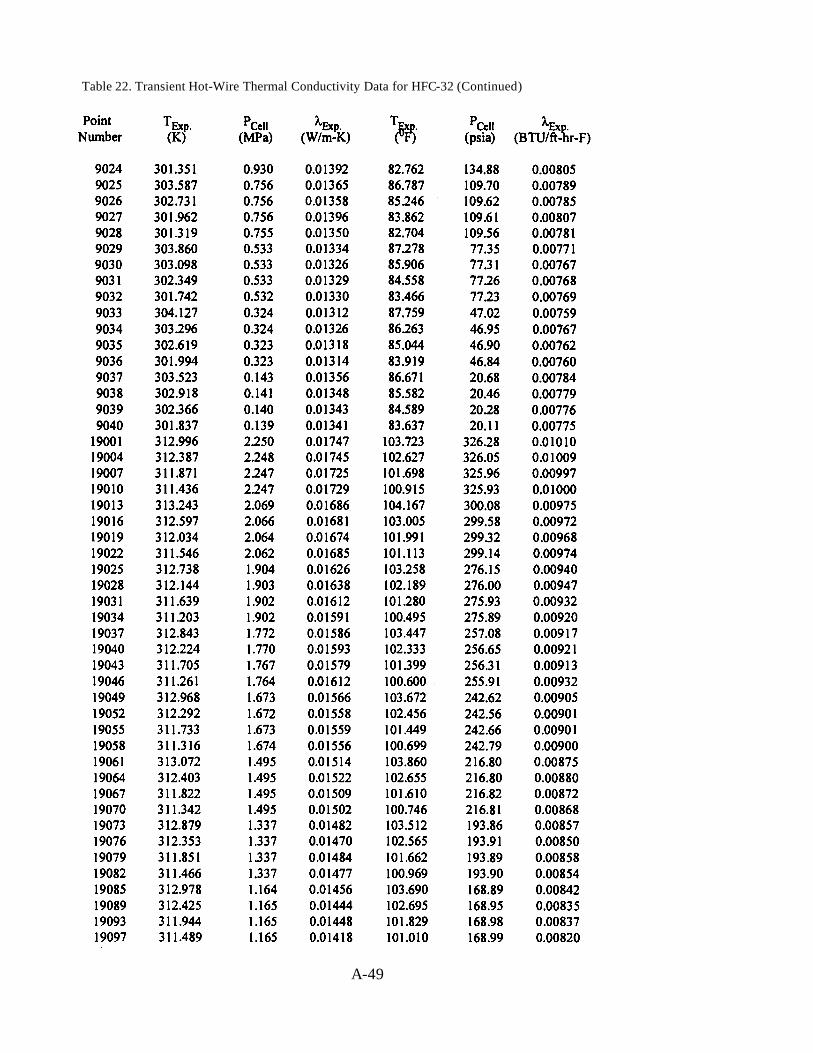
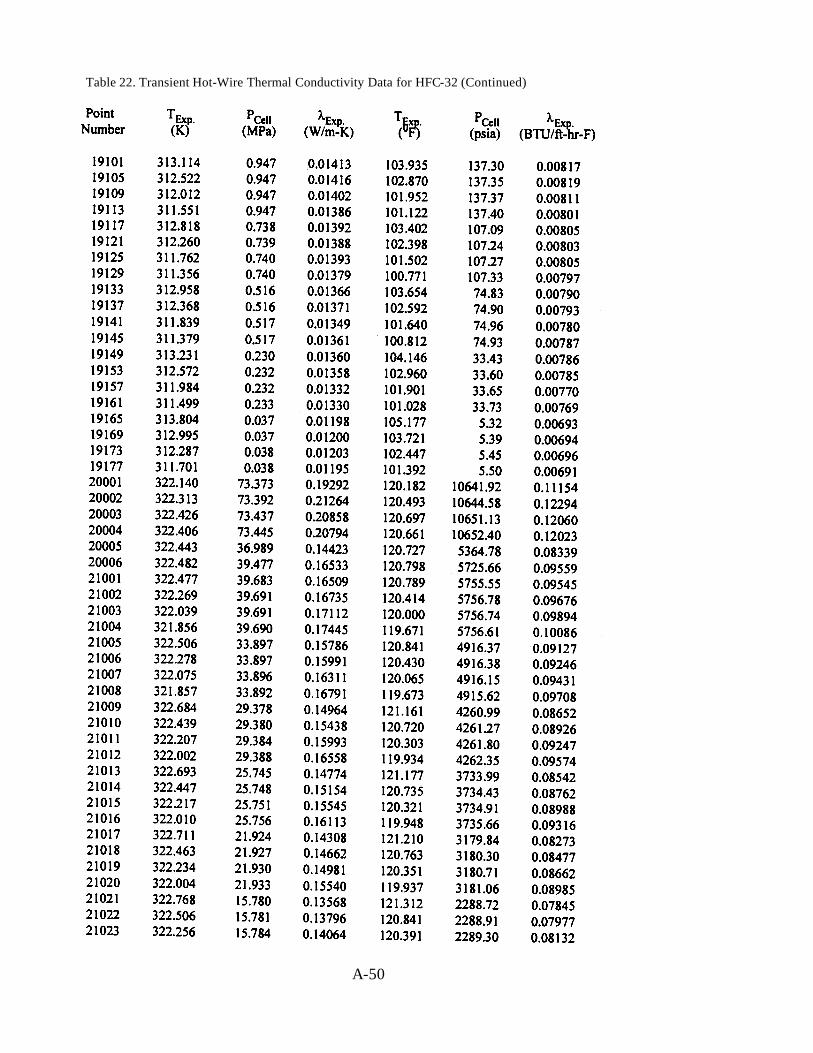
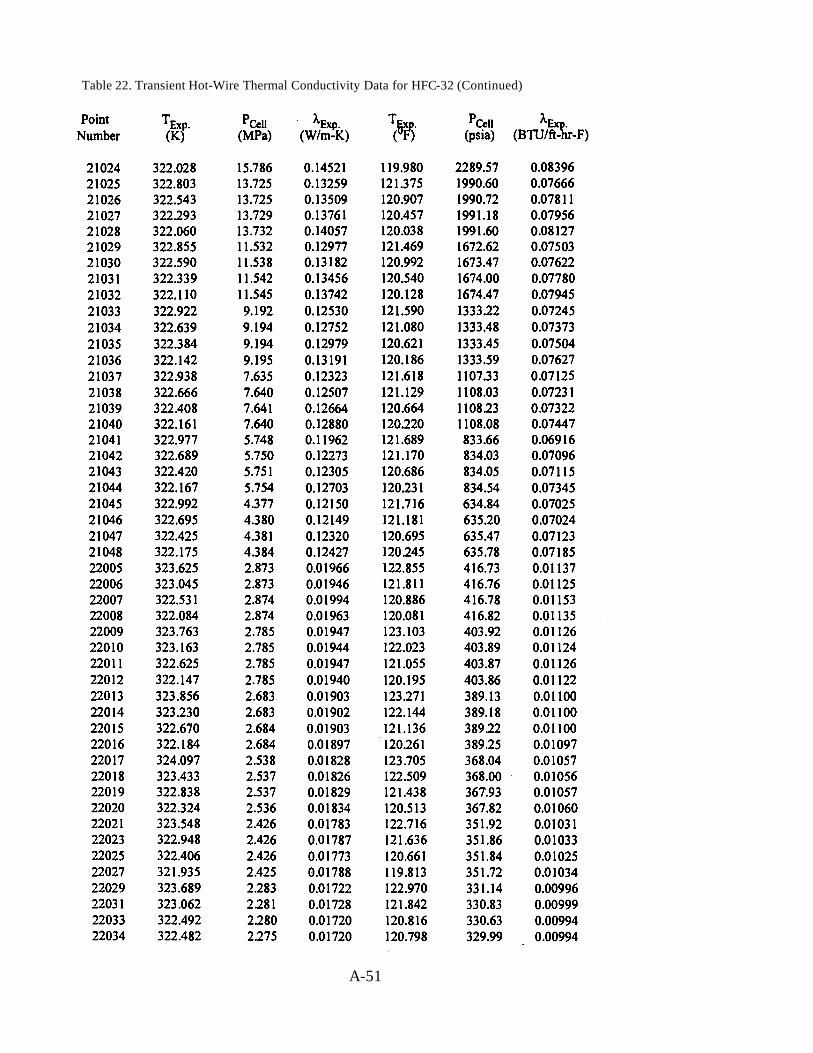
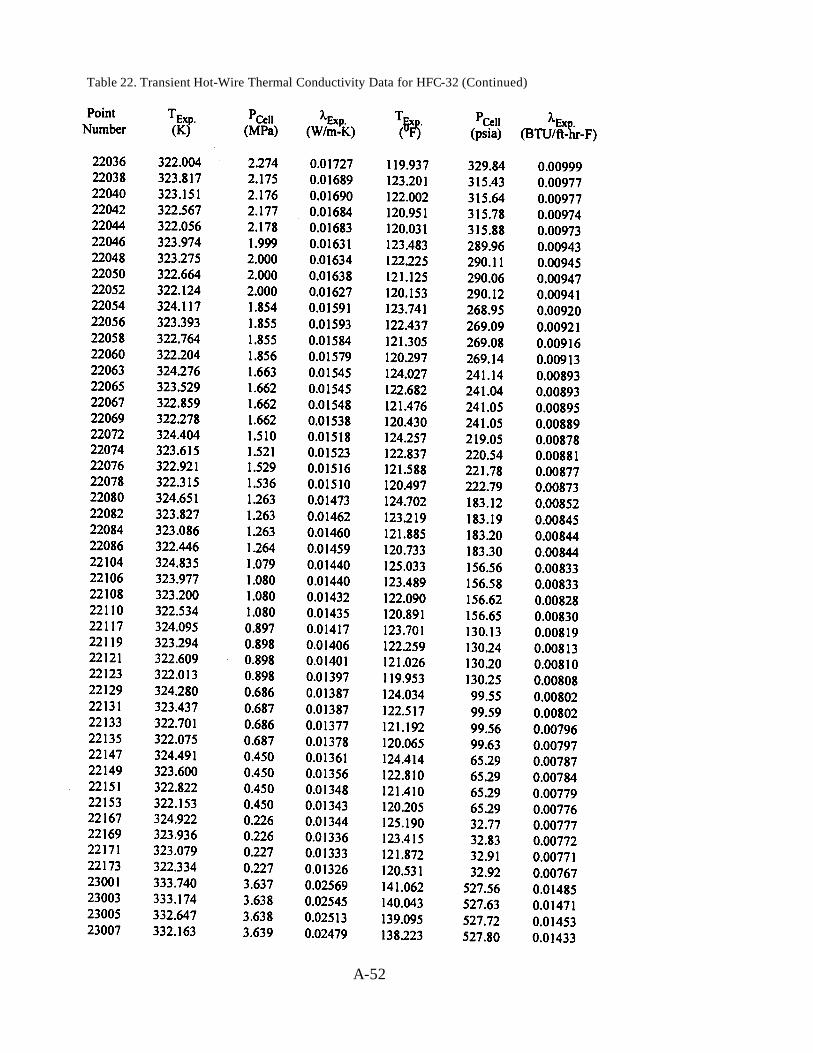
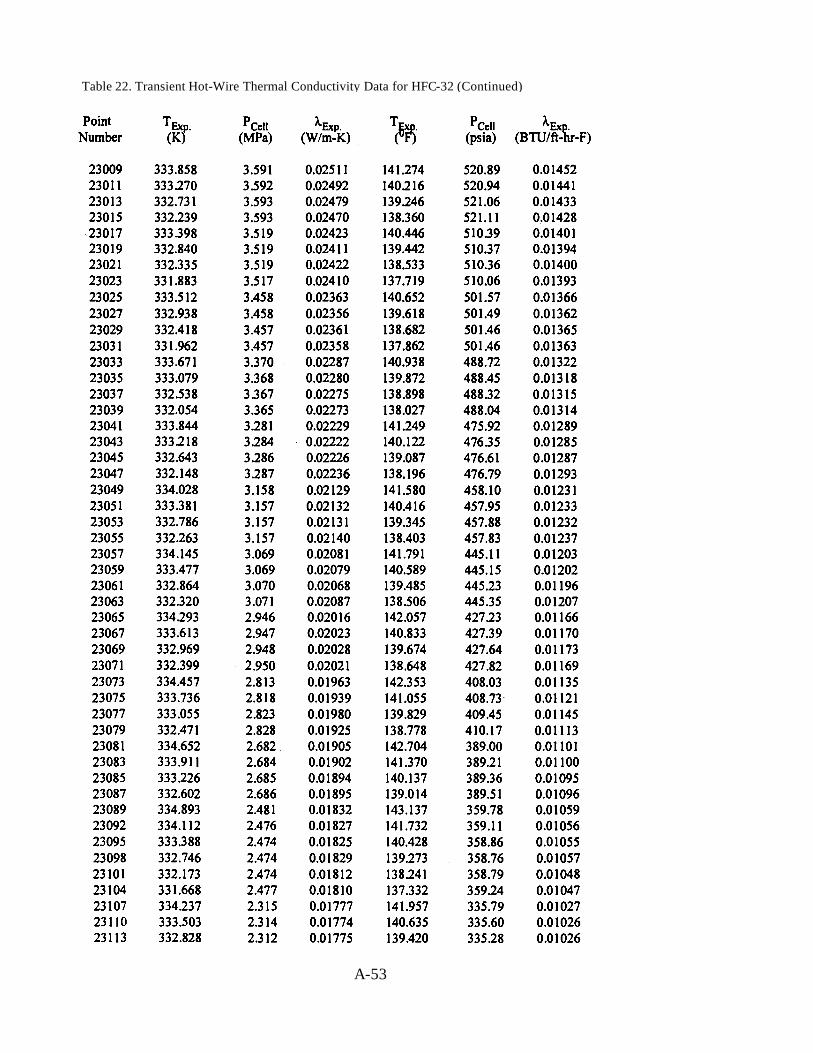
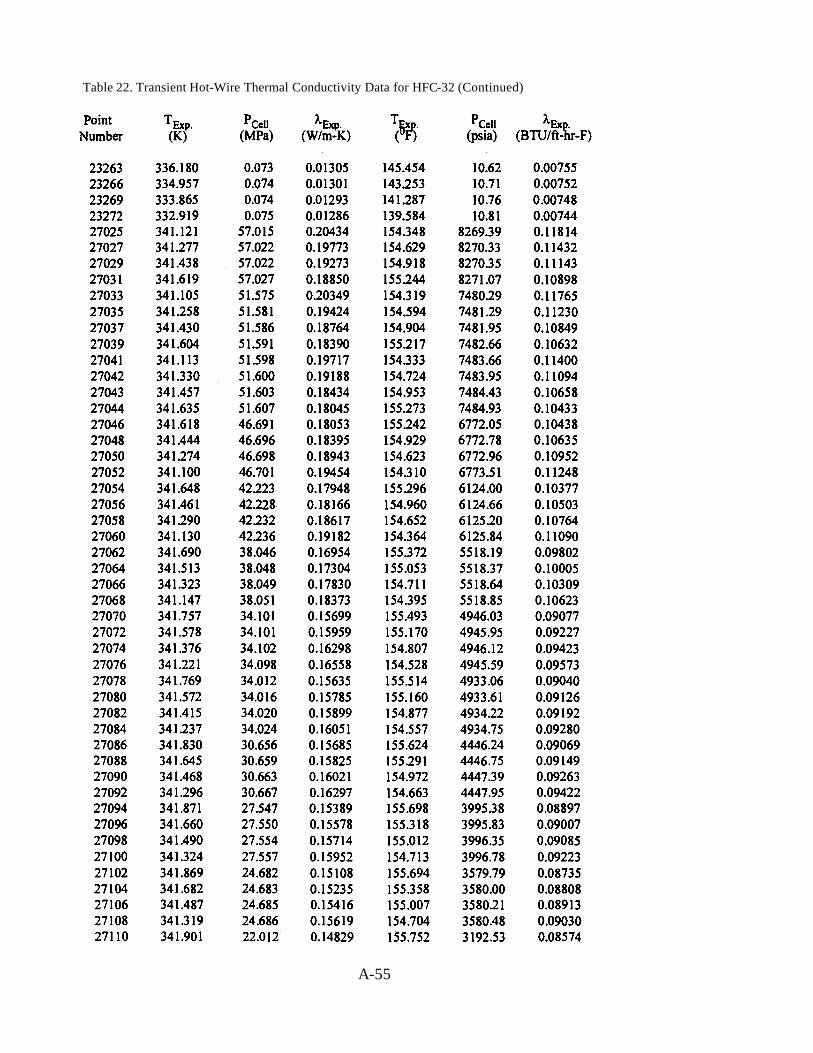
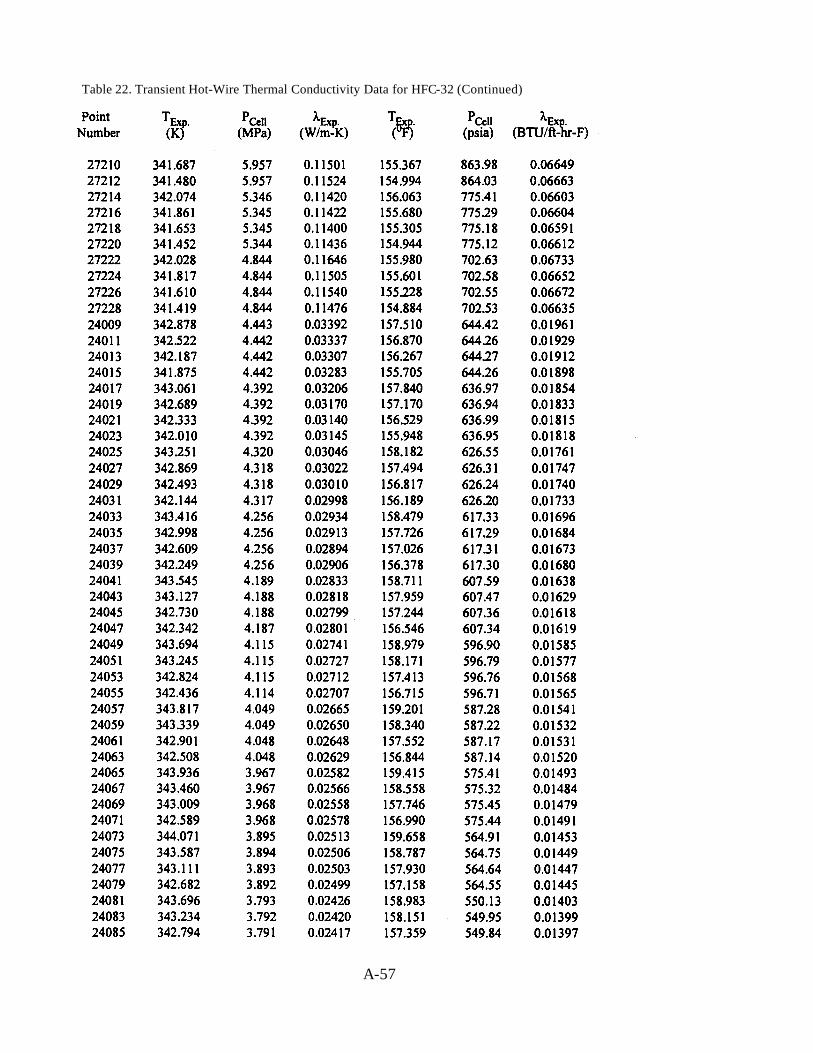
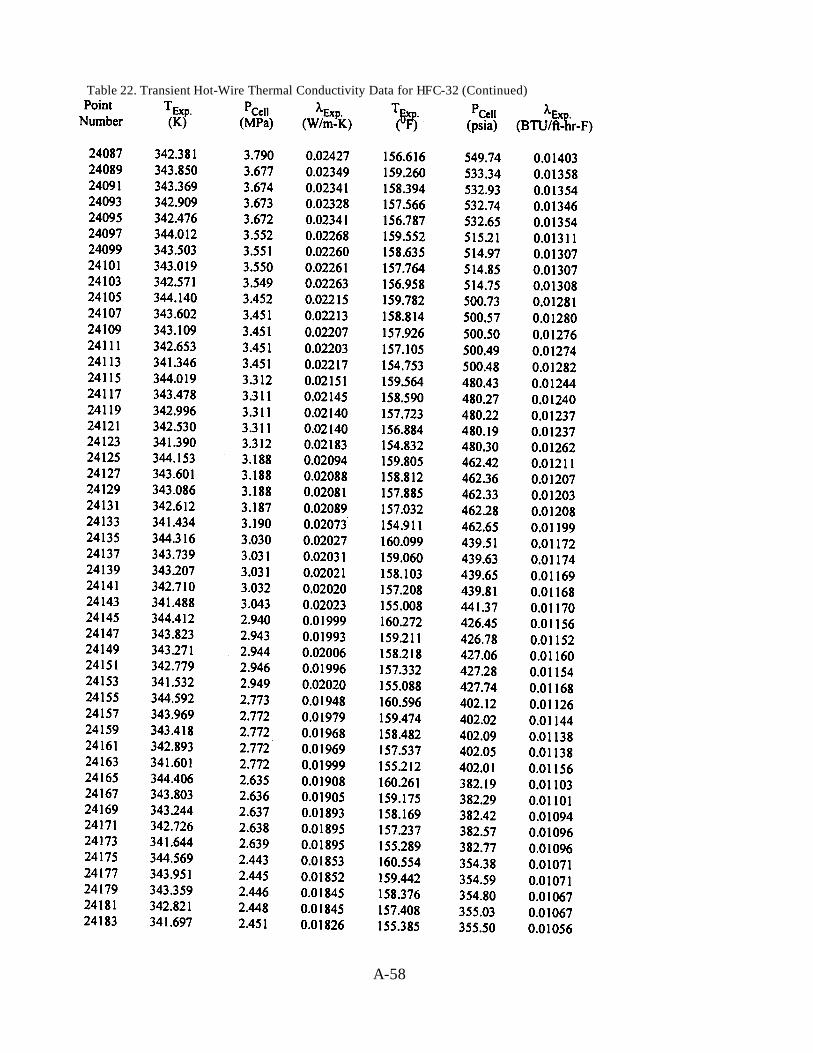
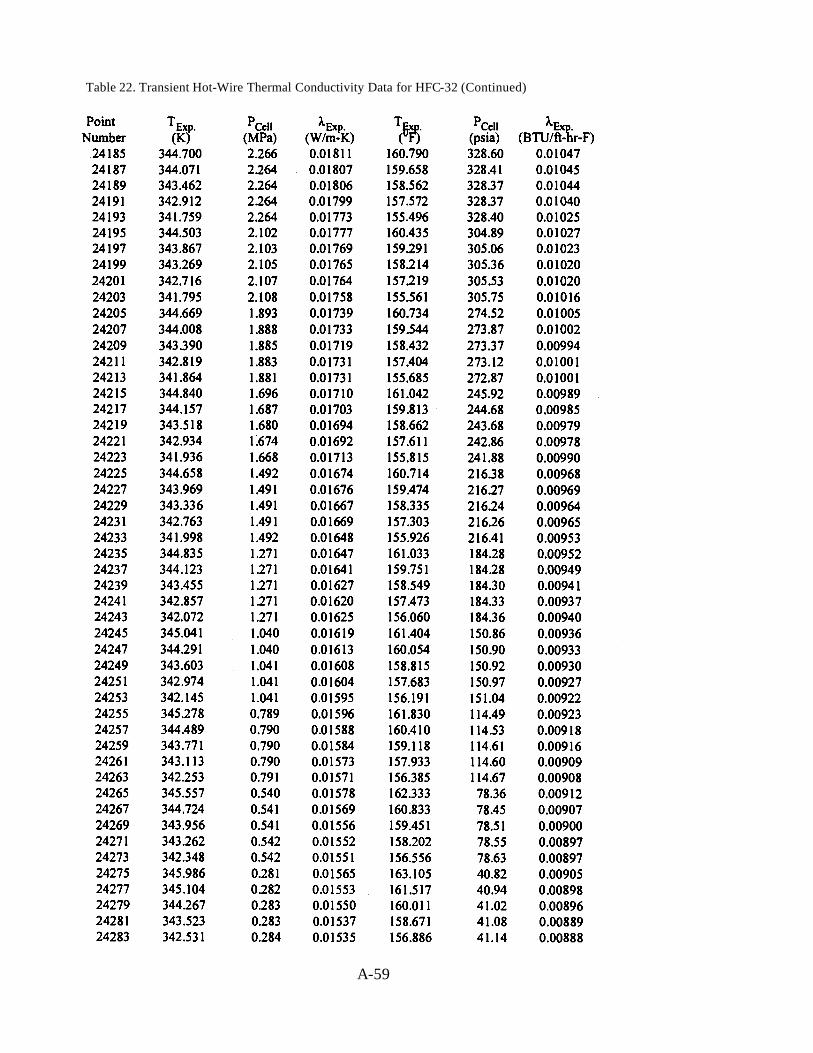
The low- and high-temperature transient hot-wire thermal conductivity instruments havebeen used to measure the thermal conductivity of HFC-32 at 1030 points over the region from160 to 340 K (-167 to 160°F) at pressures to 70 MPa (10,000 psi). The results of the analysis ofthese 1030 transient hot-wire measurements are given in Table 22. The measurements also havebeen extended to include two supercritical isotherms at 365 and 380 K (197 and 225°F); however,these measurements may have been affected by corrosion, which became a significant problem atthese higher temperatures. A plot of the entire thermal conductivity surface, including the twosupercritical isotherms, is provided for reference in Figure 11.
The vapor-phase thermal conductivity of HFC-32 is shown in Figure 12. The isothermsappear to be internally consistent, and a great deal of curvature is visible near the saturationboundary on the 330 K and 340 K isotherms. This curvature is attributed to the thermalconductivity critical enhancement.
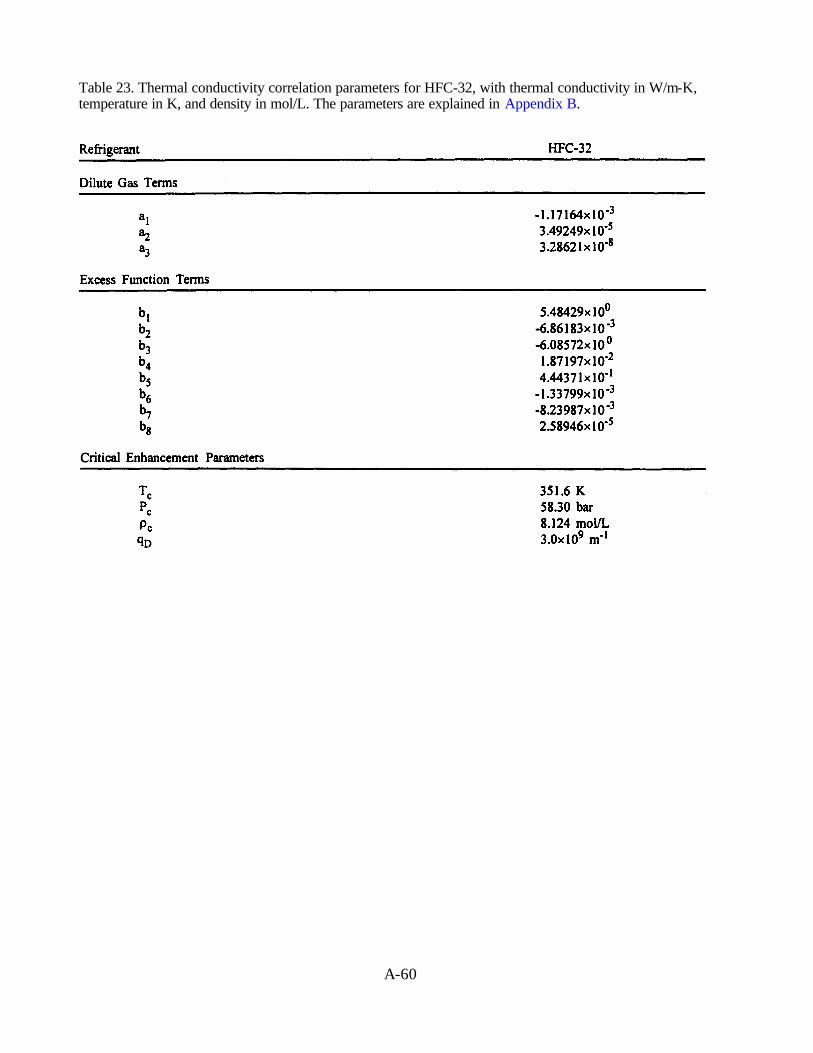
The thermal conductivity data have been correlated as described in Appendix B. Thefluid-specific information required for this correlation are the MBWR equation of state for HFC-32 described above and the parameters provided in Table 23. Deviations of the values of thermalconductivity calculated from the correlation from the experimental data used in the fit are givenin Figure 13. The uncertainty is on the order of ±5 %.
3
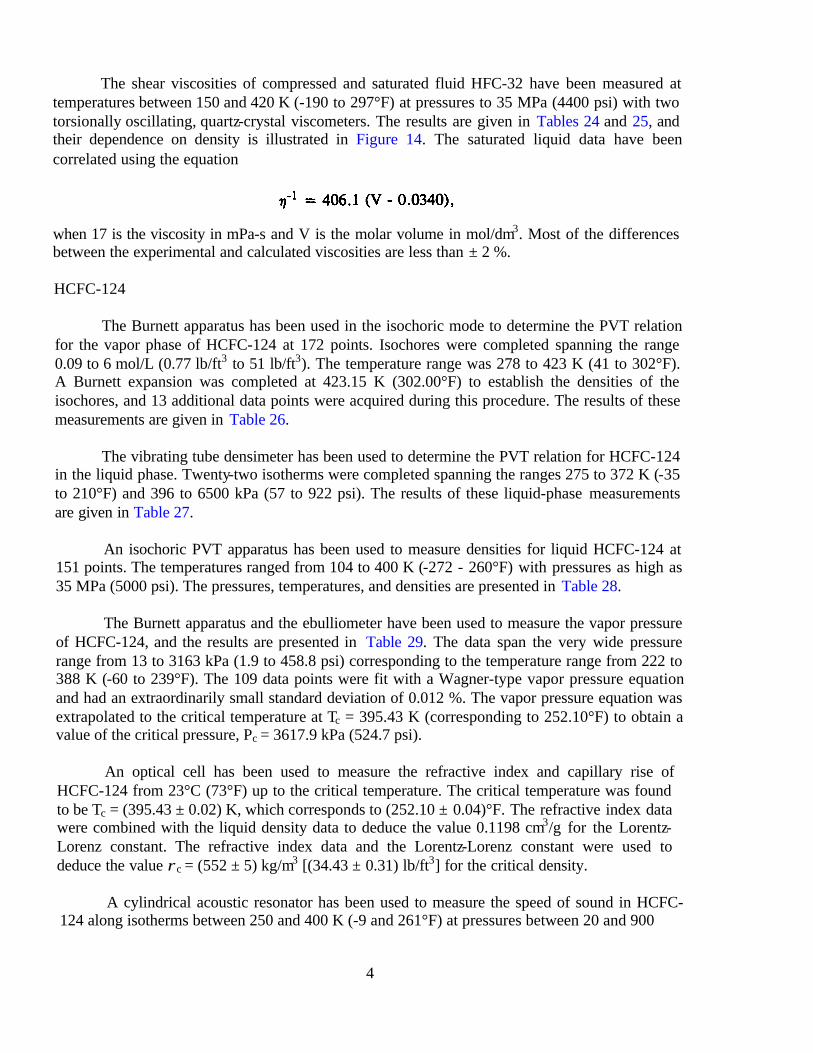
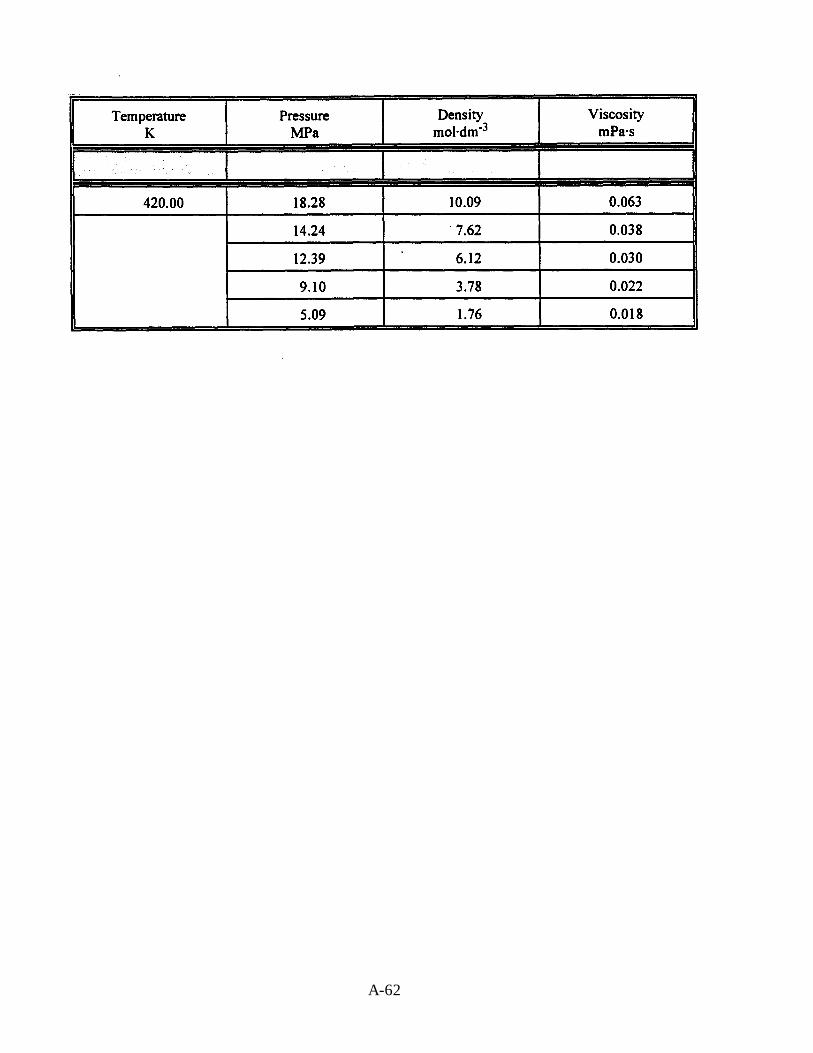
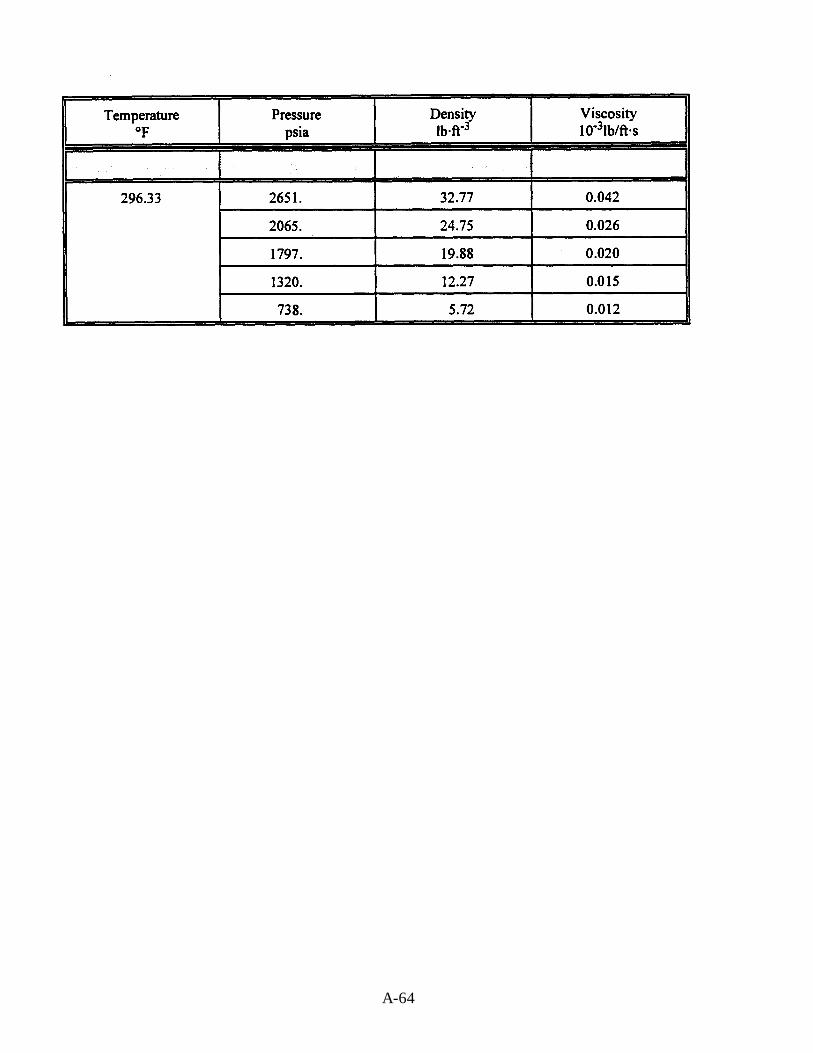
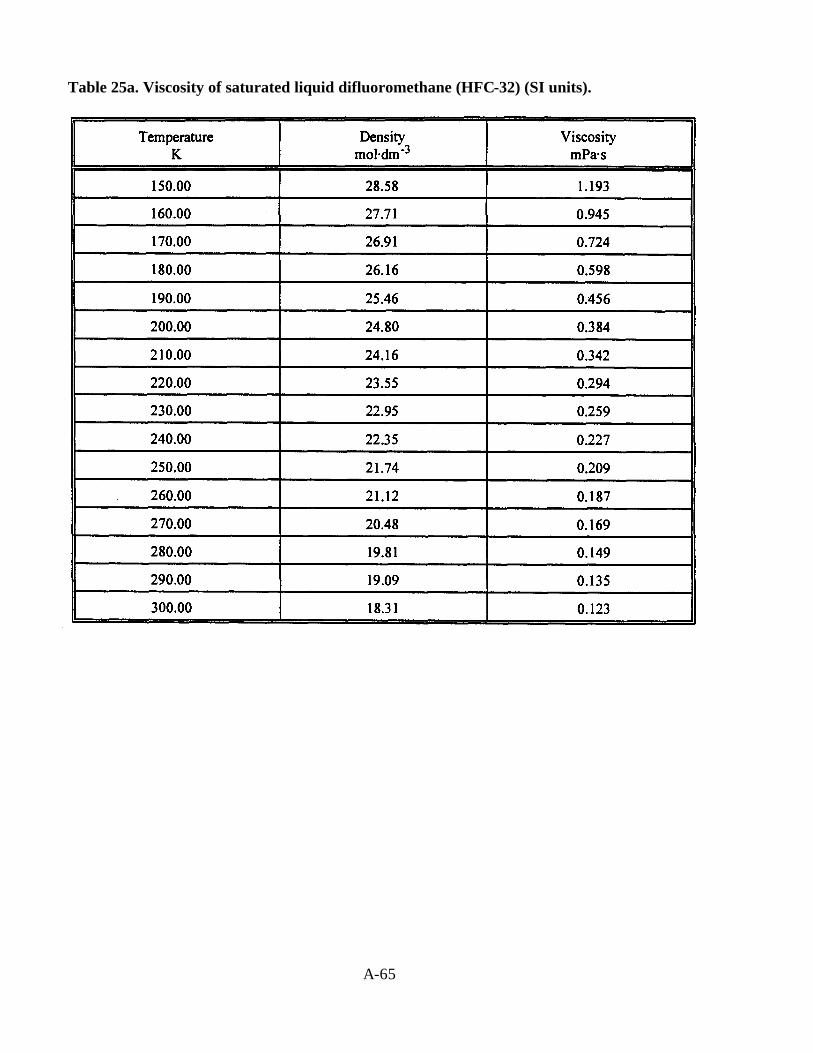
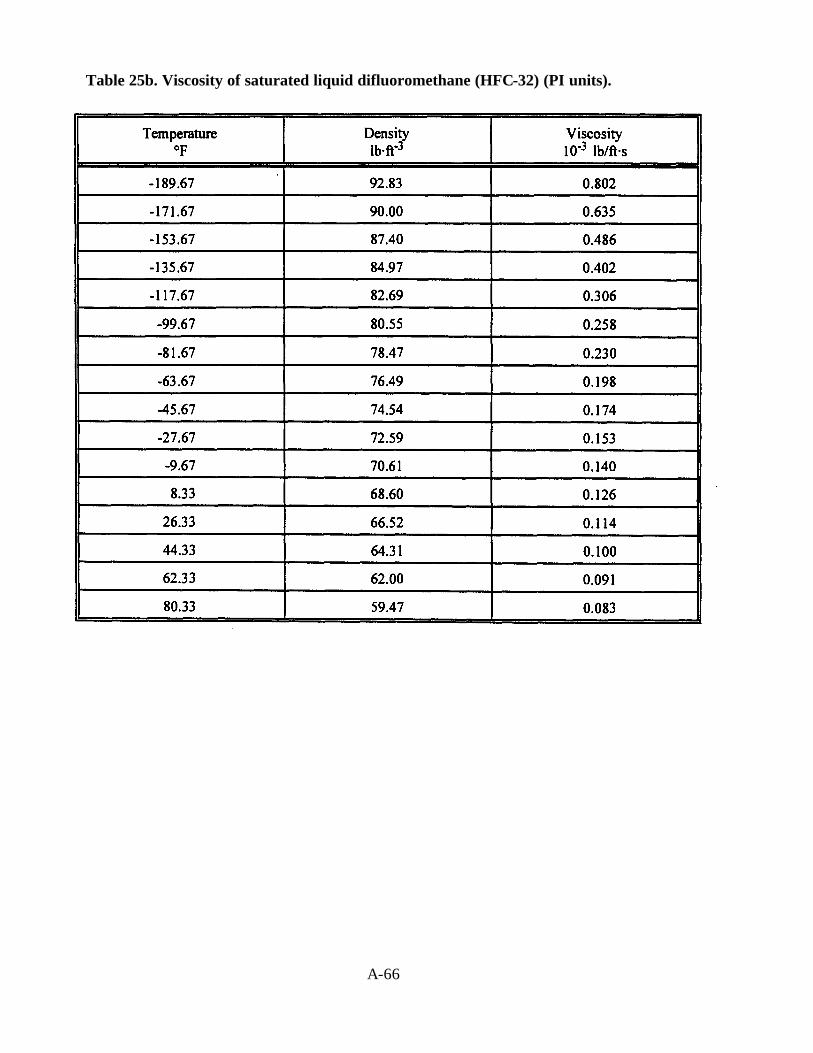
The shear viscosities of compressed and saturated fluid HFC-32 have been measured attemperatures between 150 and 420 K (-190 to 297°F) at pressures to 35 MPa (4400 psi) with twotorsionally oscillating, quartz-crystal viscometers. The results are given in Tables 24 and 25, andtheir dependence on density is illustrated in Figure 14. The saturated liquid data have beencorrelated using the equation
when 17 is the viscosity in mPa-s and V is the molar volume in mol/dm3. Most of the differencesbetween the experimental and calculated viscosities are less than ± 2 %.
HCFC-124
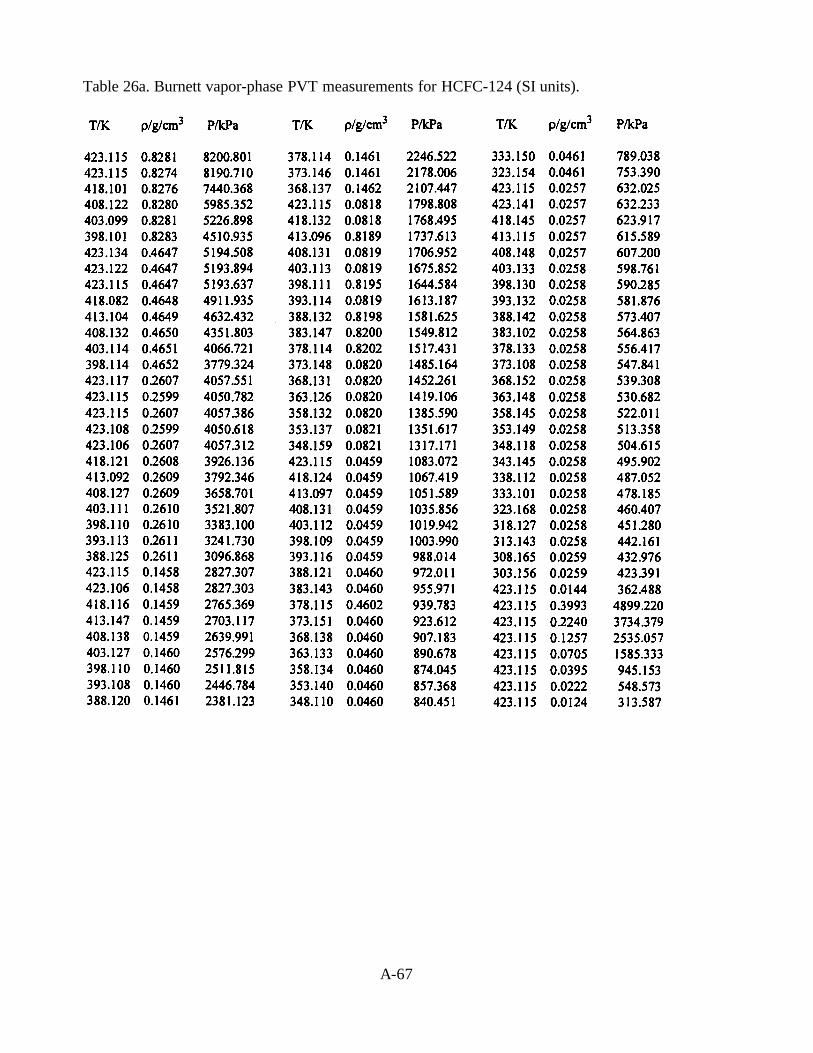
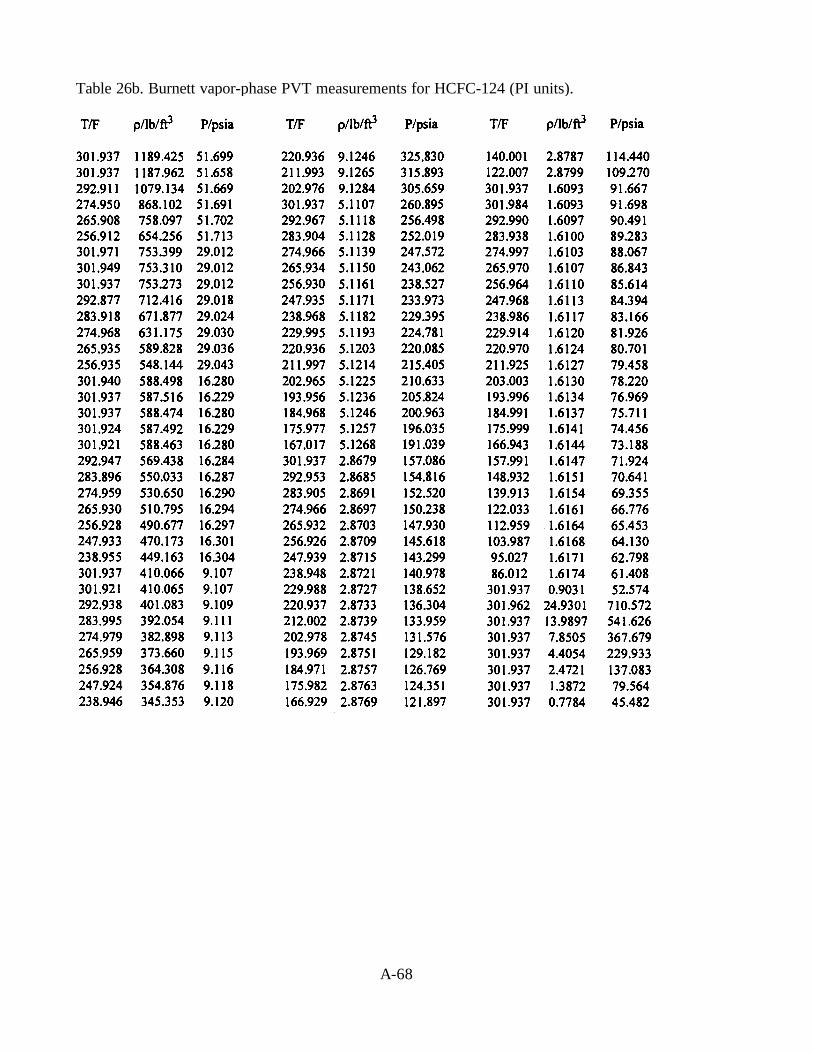
The Burnett apparatus has been used in the isochoric mode to determine the PVT relationfor the vapor phase of HCFC-124 at 172 points. Isochores were completed spanning the range0.09 to 6 mol/L (0.77 lb/ft3 to 51 lb/ft3). The temperature range was 278 to 423 K (41 to 302°F).A Burnett expansion was completed at 423.15 K (302.00°F) to establish the densities of theisochores, and 13 additional data points were acquired during this procedure. The results of thesemeasurements are given in Table 26.
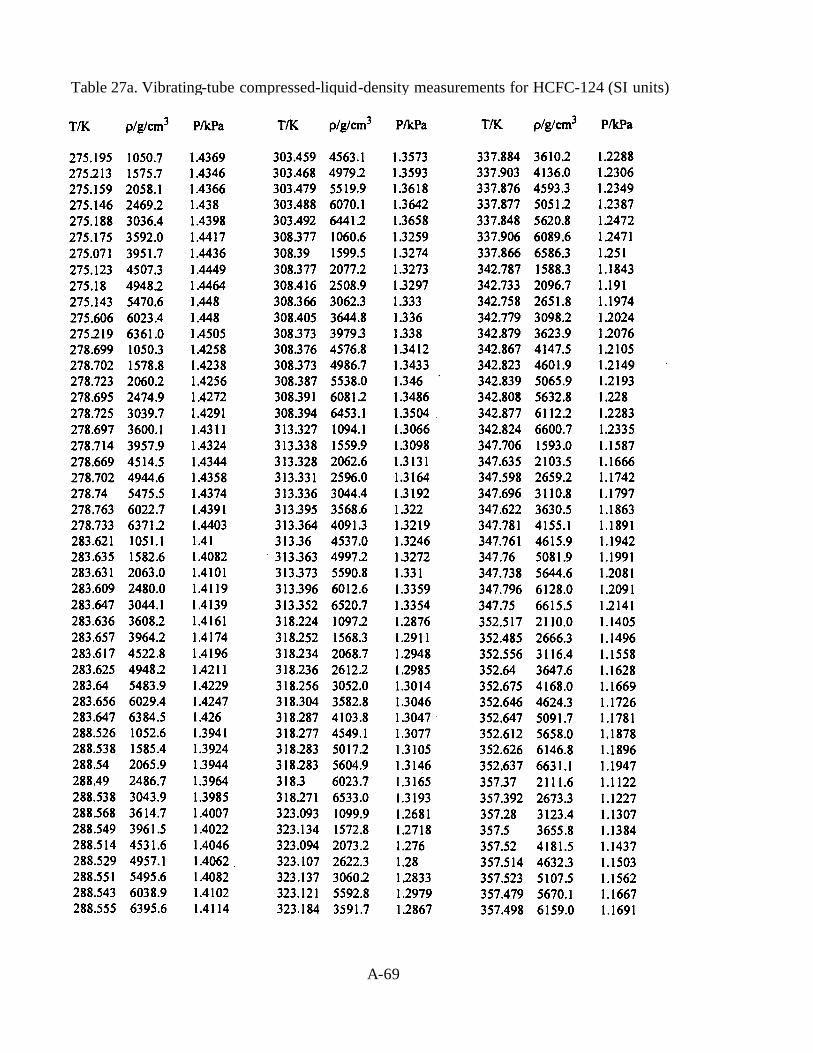
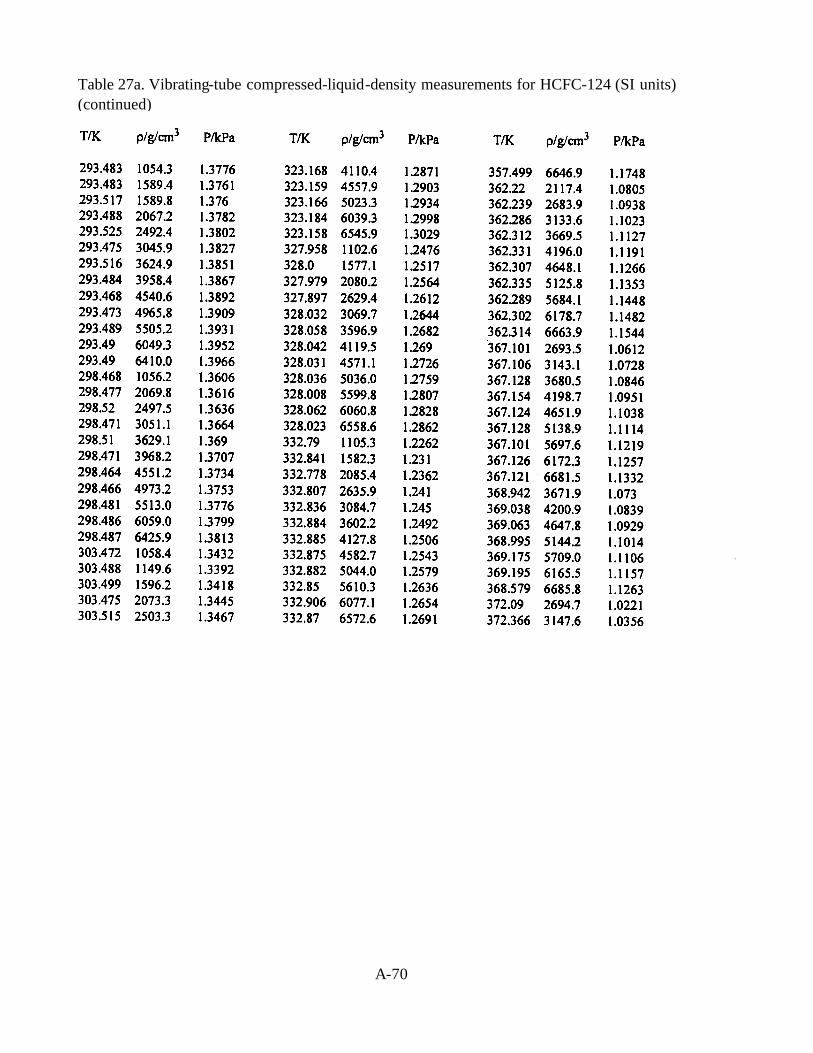
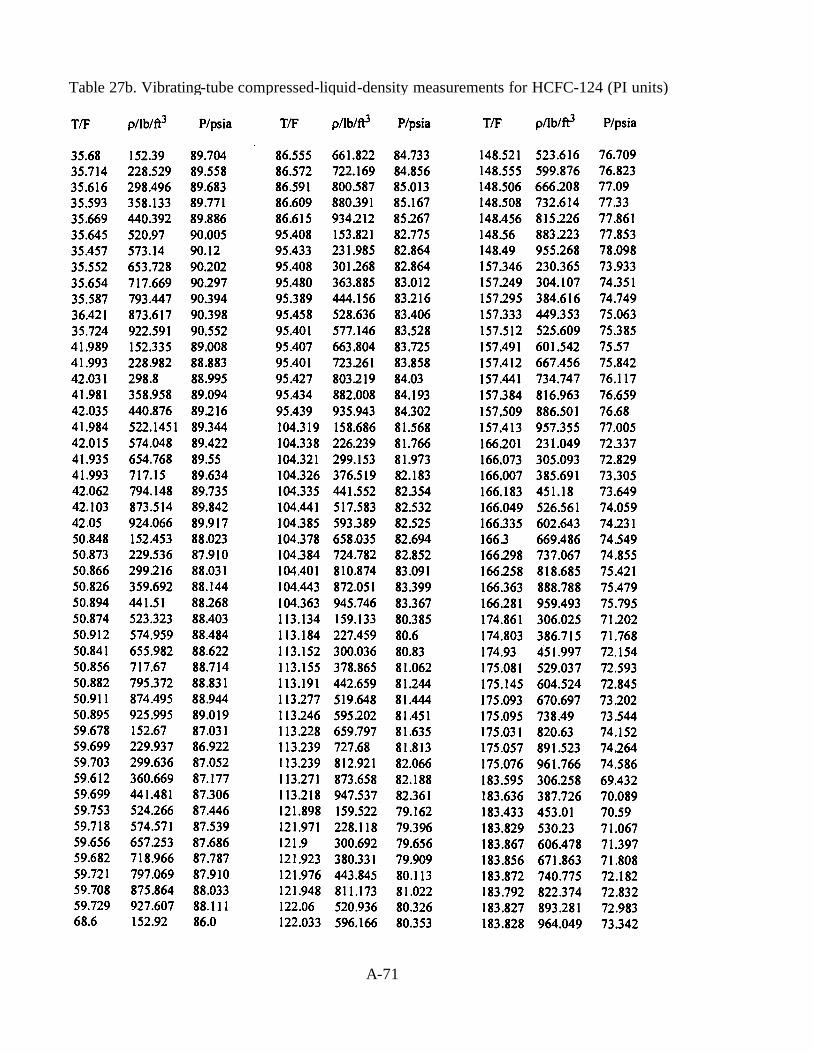
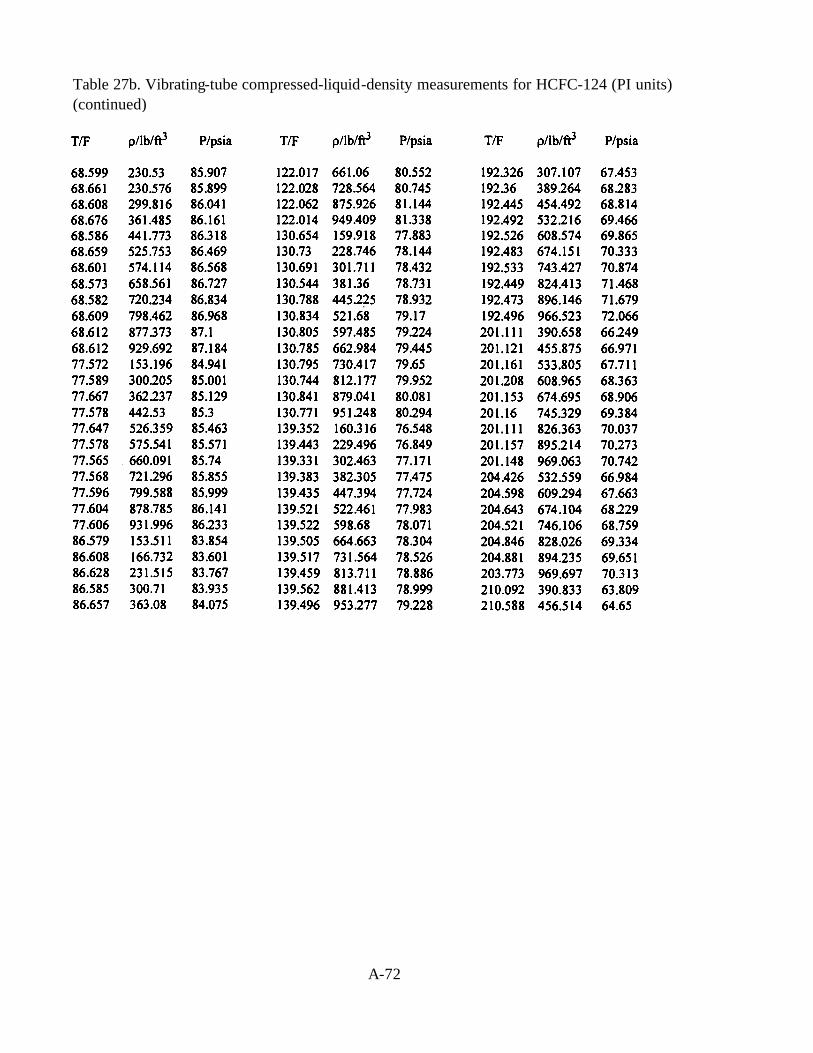
The vibrating tube densimeter has been used to determine the PVT relation for HCFC-124in the liquid phase. Twenty-two isotherms were completed spanning the ranges 275 to 372 K (-35to 210°F) and 396 to 6500 kPa (57 to 922 psi). The results of these liquid-phase measurementsare given in Table 27.
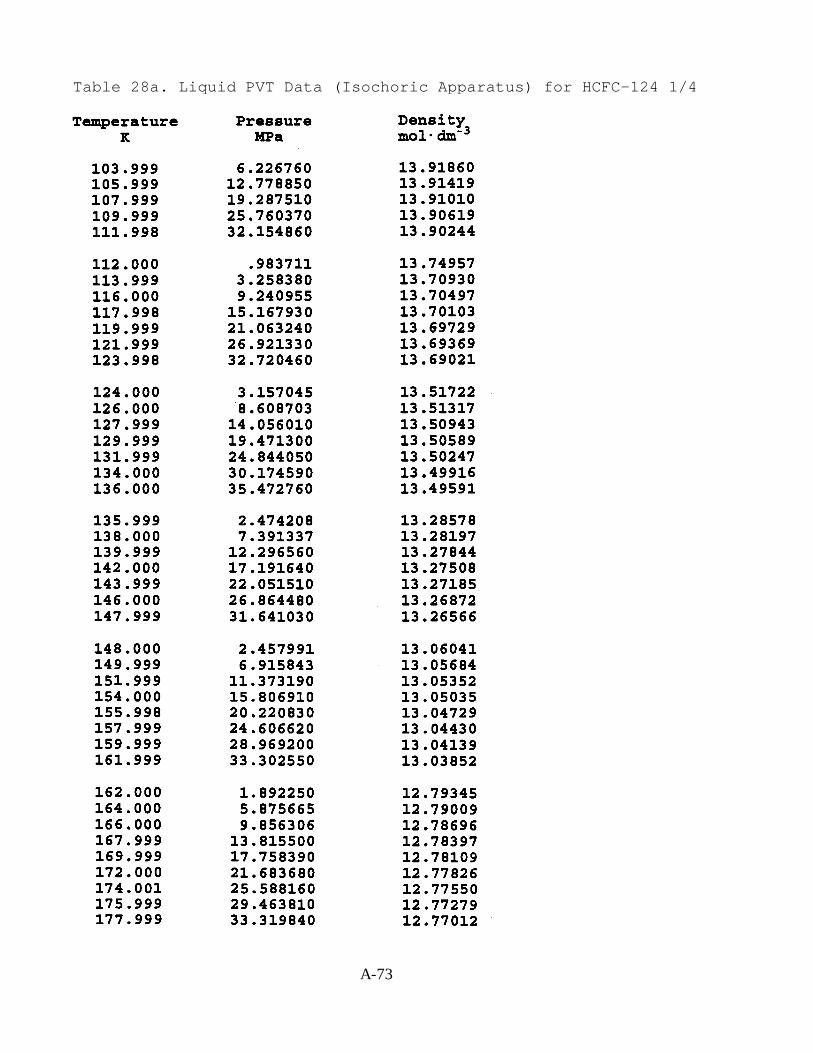
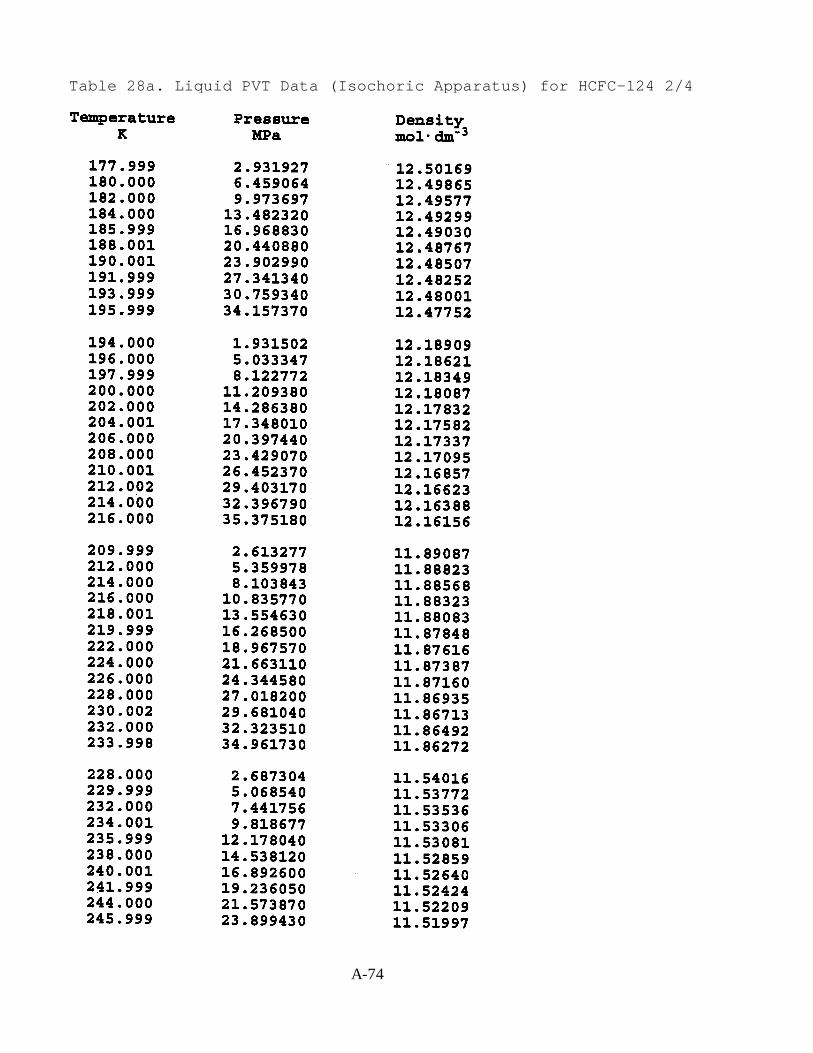
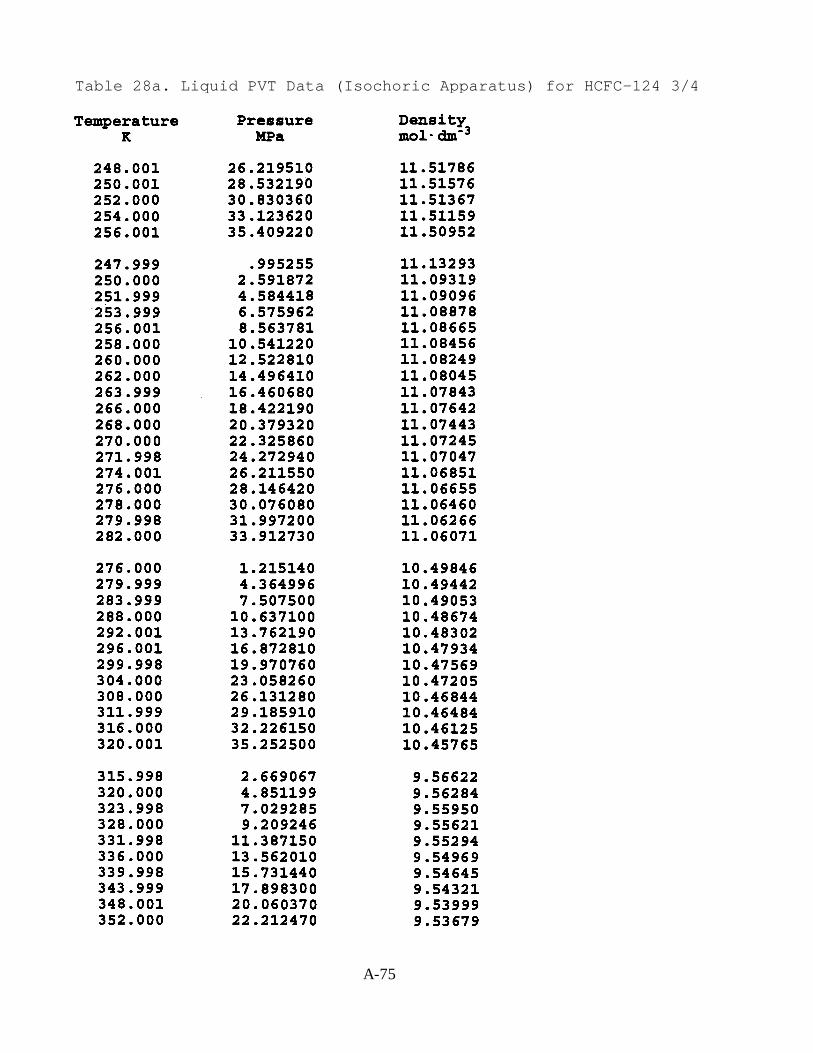
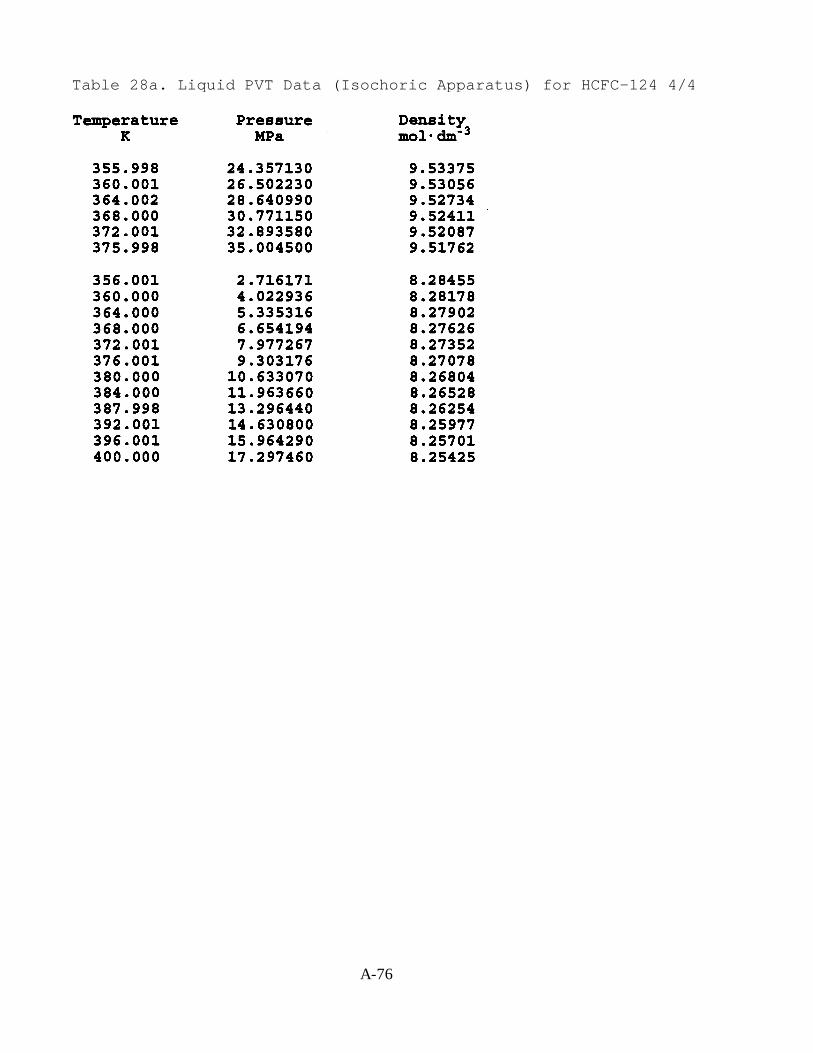
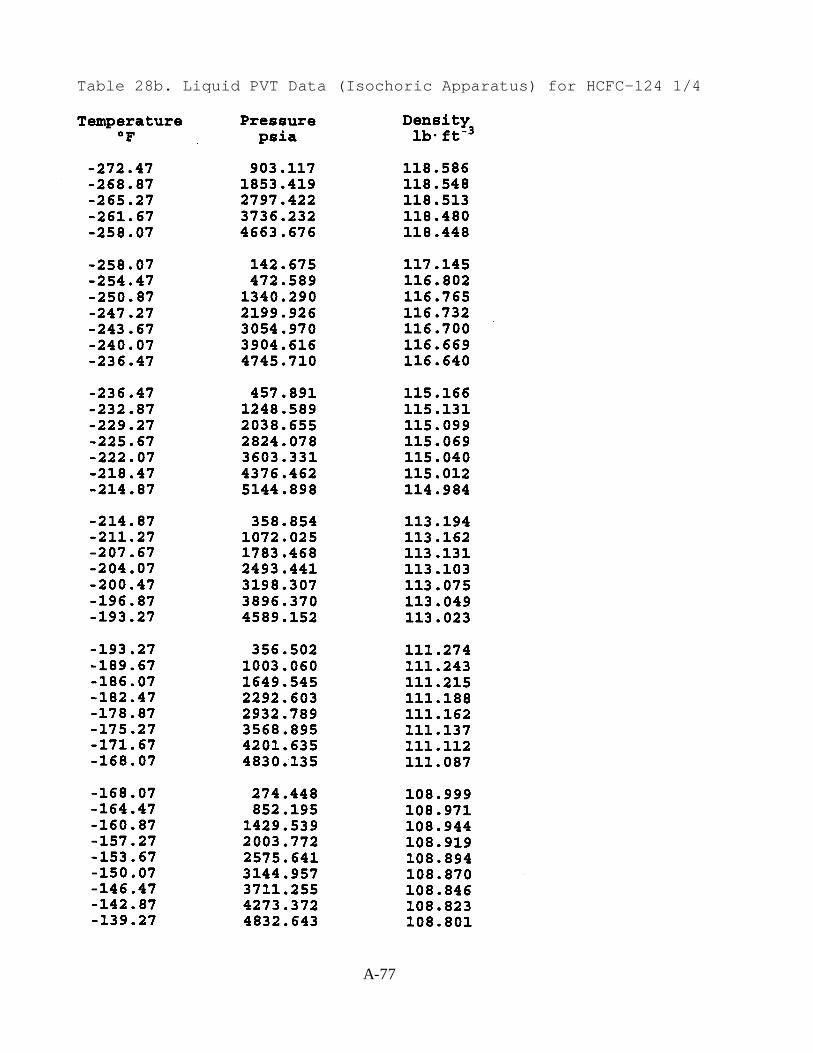
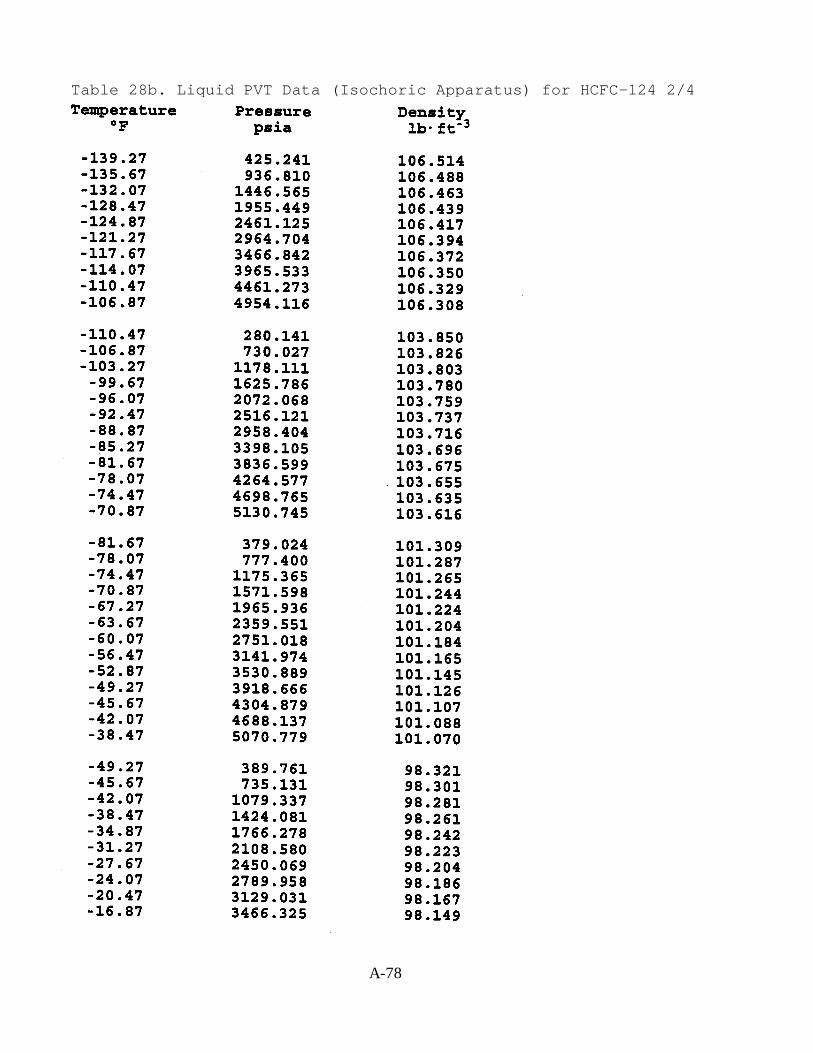
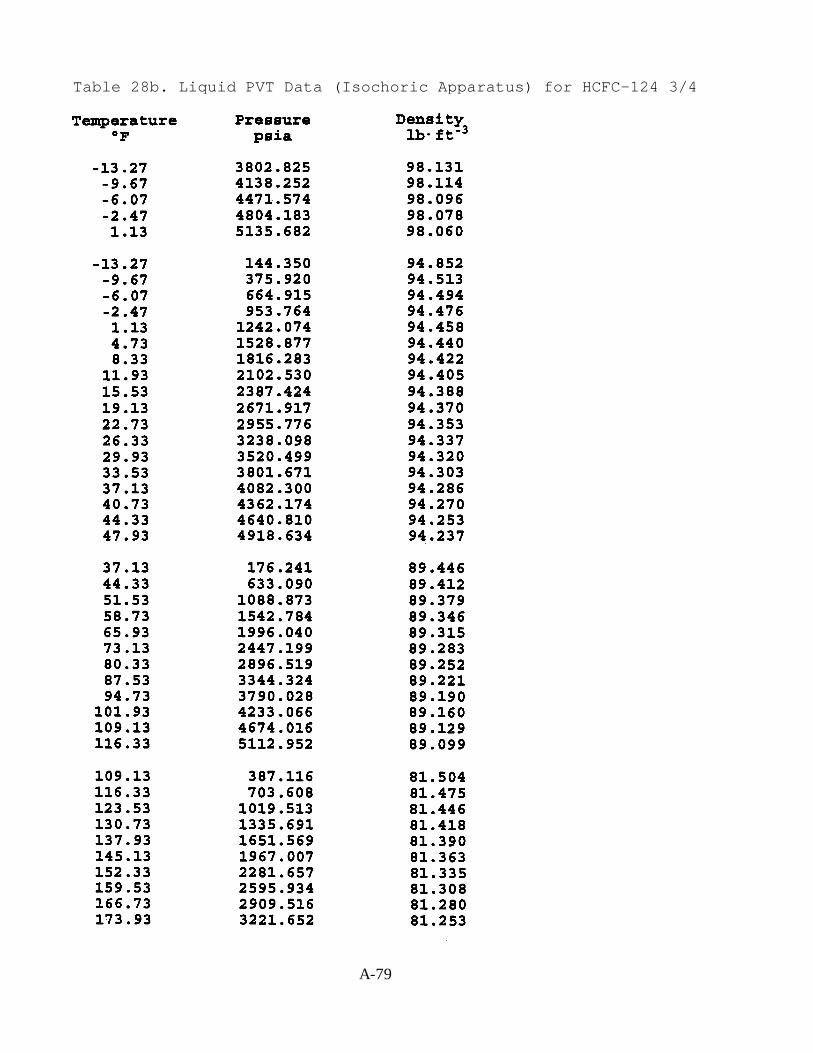
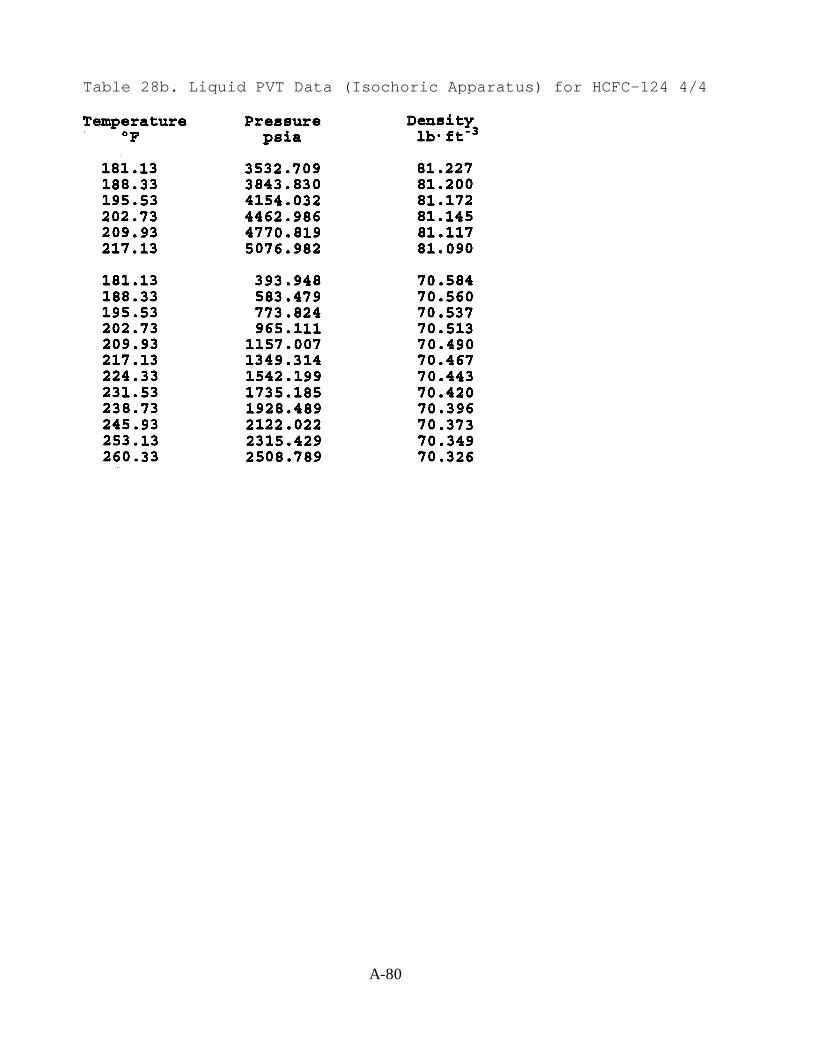
An isochoric PVT apparatus has been used to measure densities for liquid HCFC-124 at151 points. The temperatures ranged from 104 to 400 K (-272 - 260°F) with pressures as high as35 MPa (5000 psi). The pressures, temperatures, and densities are presented in Table 28.
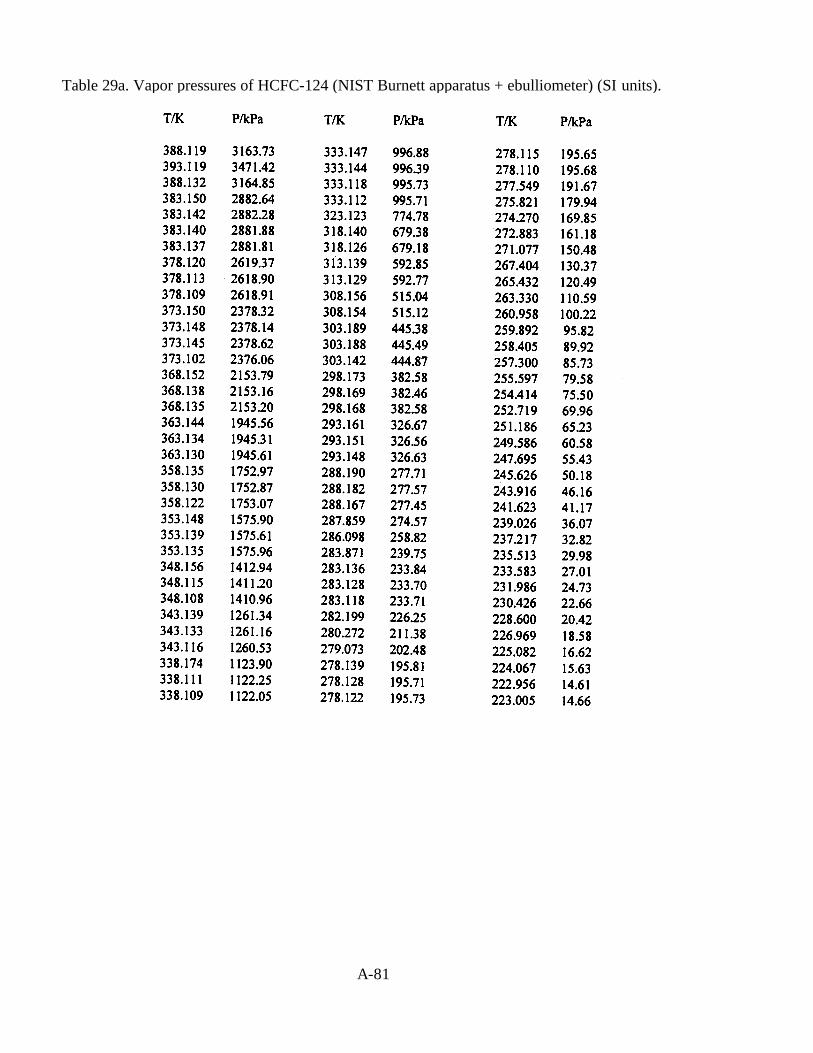
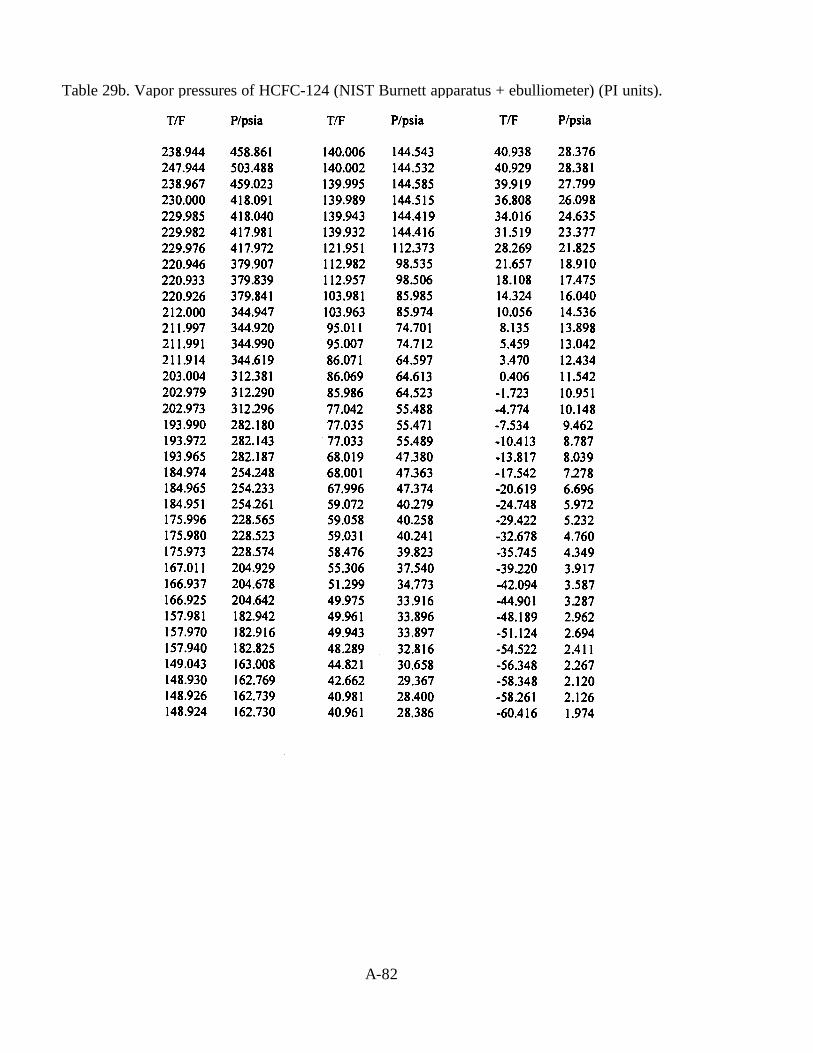
The Burnett apparatus and the ebulliometer have been used to measure the vapor pressureof HCFC-124, and the results are presented in Table 29. The data span the very wide pressurerange from 13 to 3163 kPa (1.9 to 458.8 psi) corresponding to the temperature range from 222 to388 K (-60 to 239°F). The 109 data points were fit with a Wagner-type vapor pressure equationand had an extraordinarily small standard deviation of 0.012 %. The vapor pressure equation wasextrapolated to the critical temperature at Tc = 395.43 K (corresponding to 252.10°F) to obtain avalue of the critical pressure, Pc = 3617.9 kPa (524.7 psi).
An optical cell has been used to measure the refractive index and capillary rise ofHCFC-124 from 23°C (73°F) up to the critical temperature. The critical temperature was foundto be Tc = (395.43 ± 0.02) K, which corresponds to (252.10 ± 0.04)°F. The refractive index datawere combined with the liquid density data to deduce the value 0.1198 cm3/g for the Lorentz-Lorenz constant. The refractive index data and the Lorentz-Lorenz constant were used todeduce the value ρc = (552 ± 5) kg/m3 [(34.43 ± 0.31) lb/ft3] for the critical density.
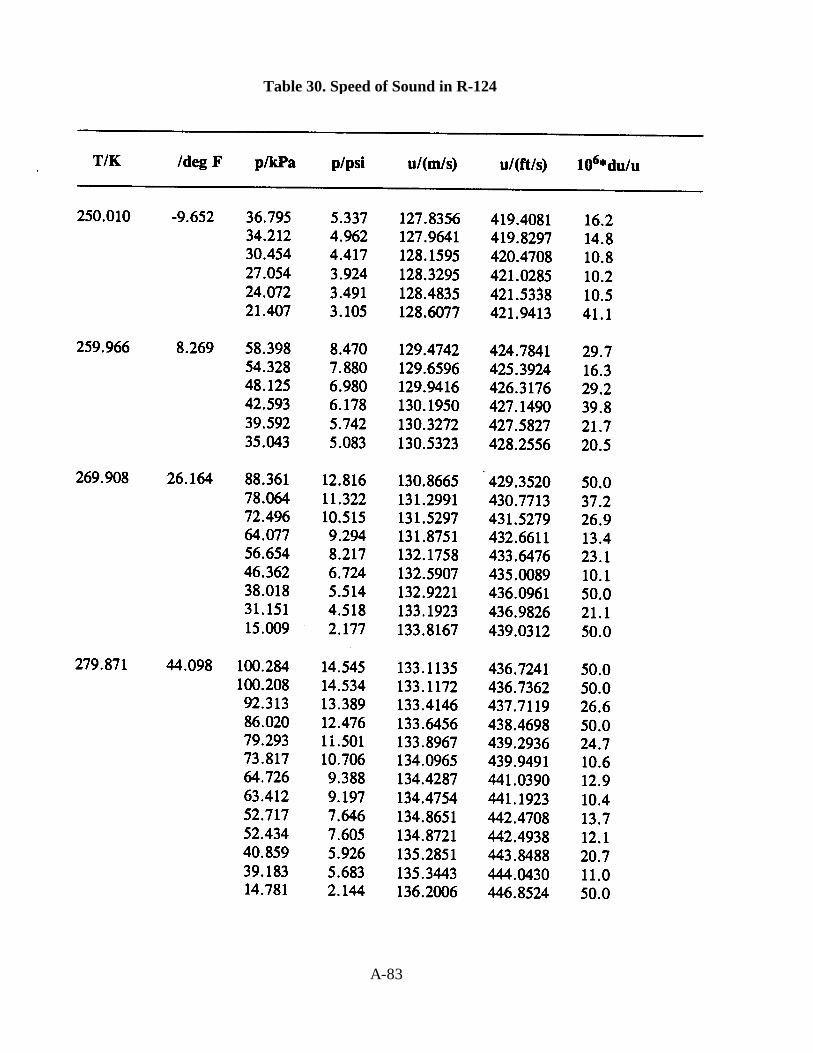
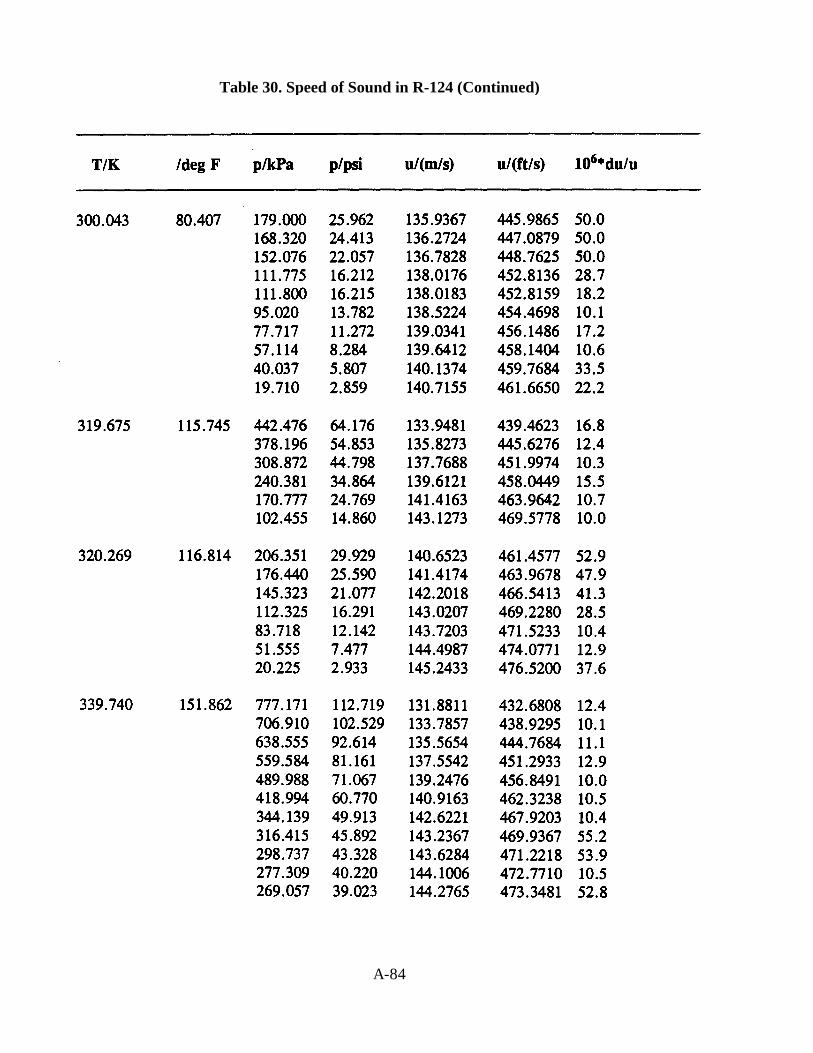
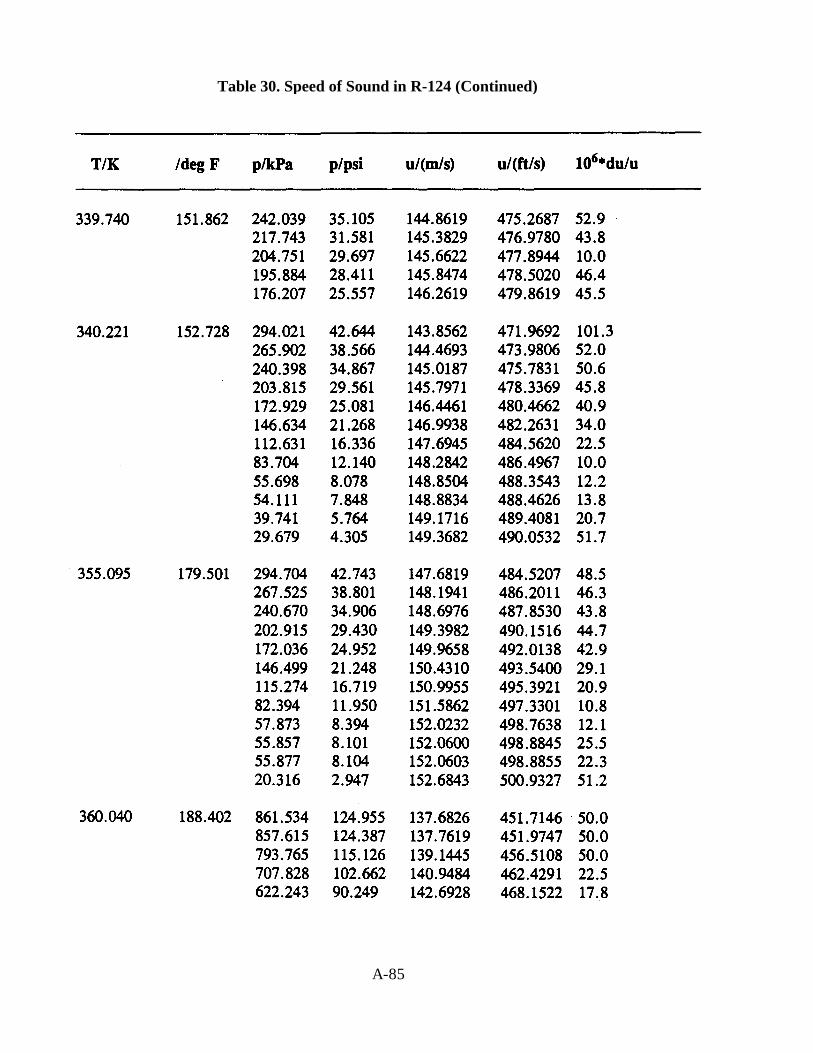
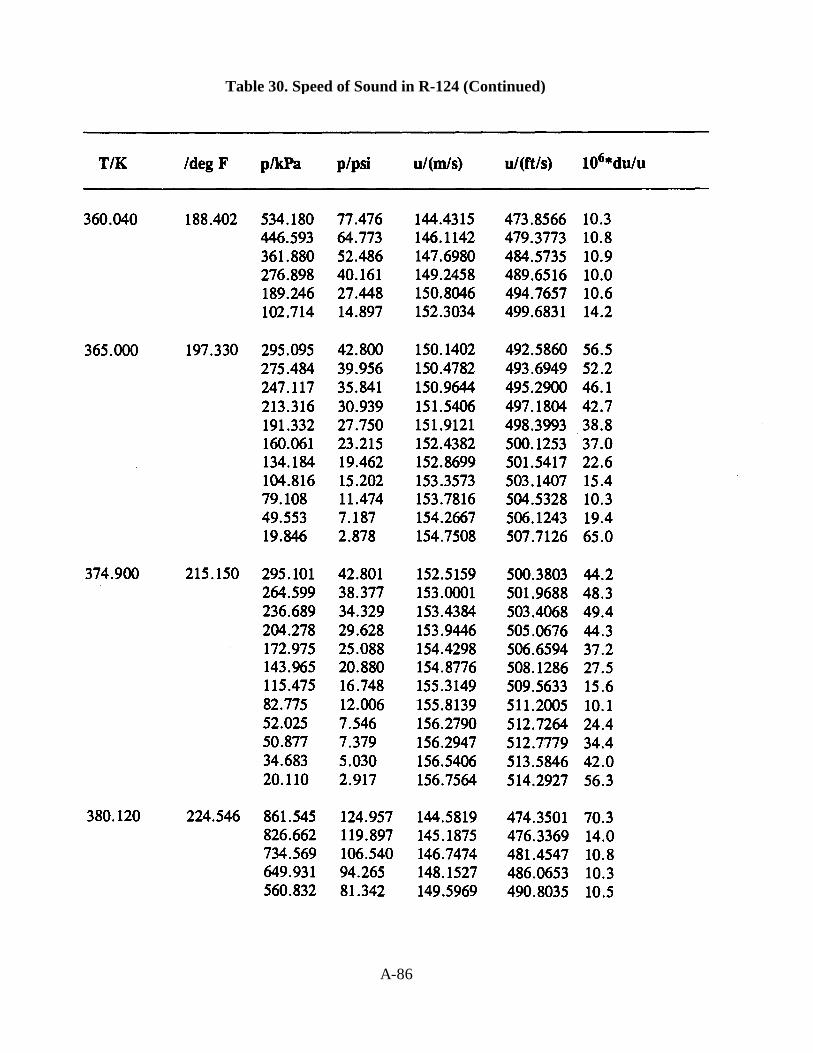
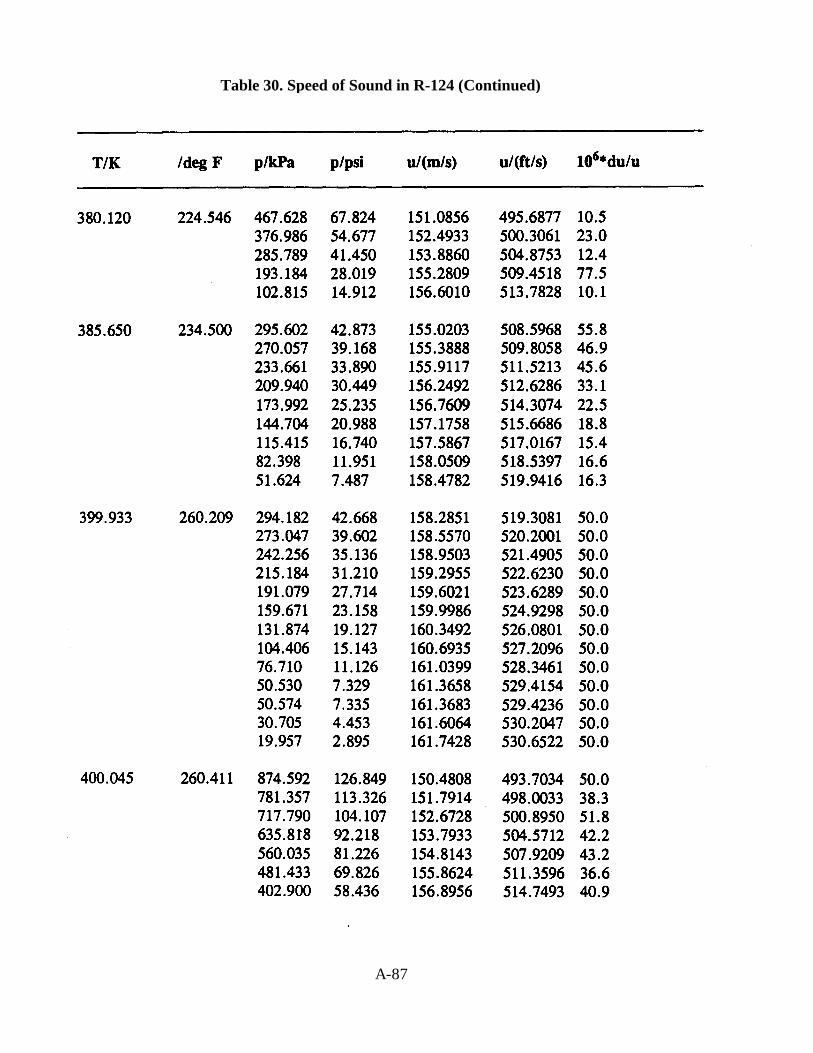
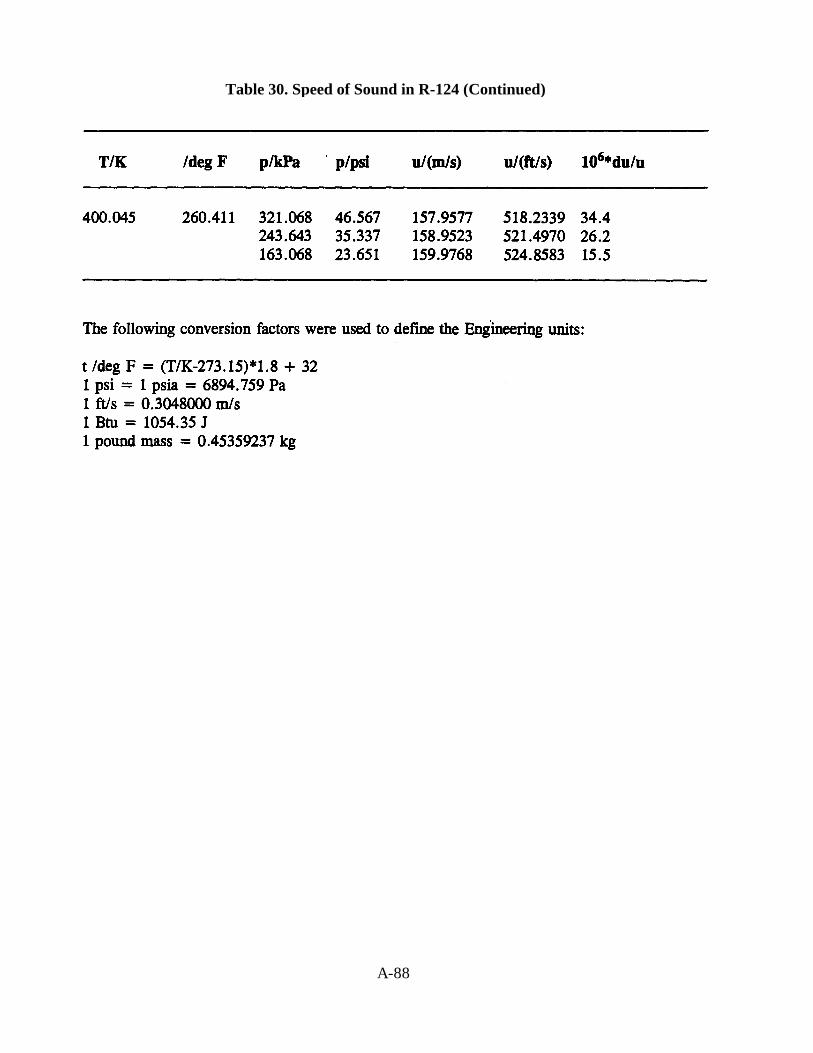
A cylindrical acoustic resonator has been used to measure the speed of sound in HCFC-124 along isotherms between 250 and 400 K (-9 and 261°F) at pressures between 20 and 900
4
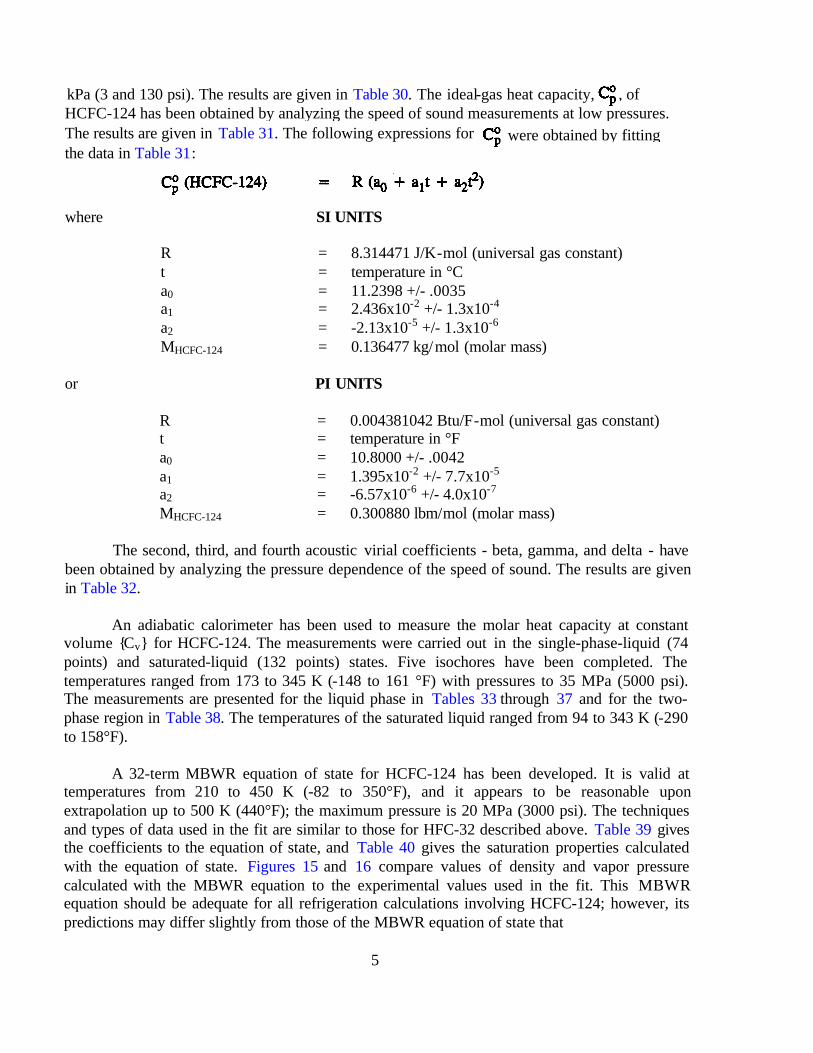
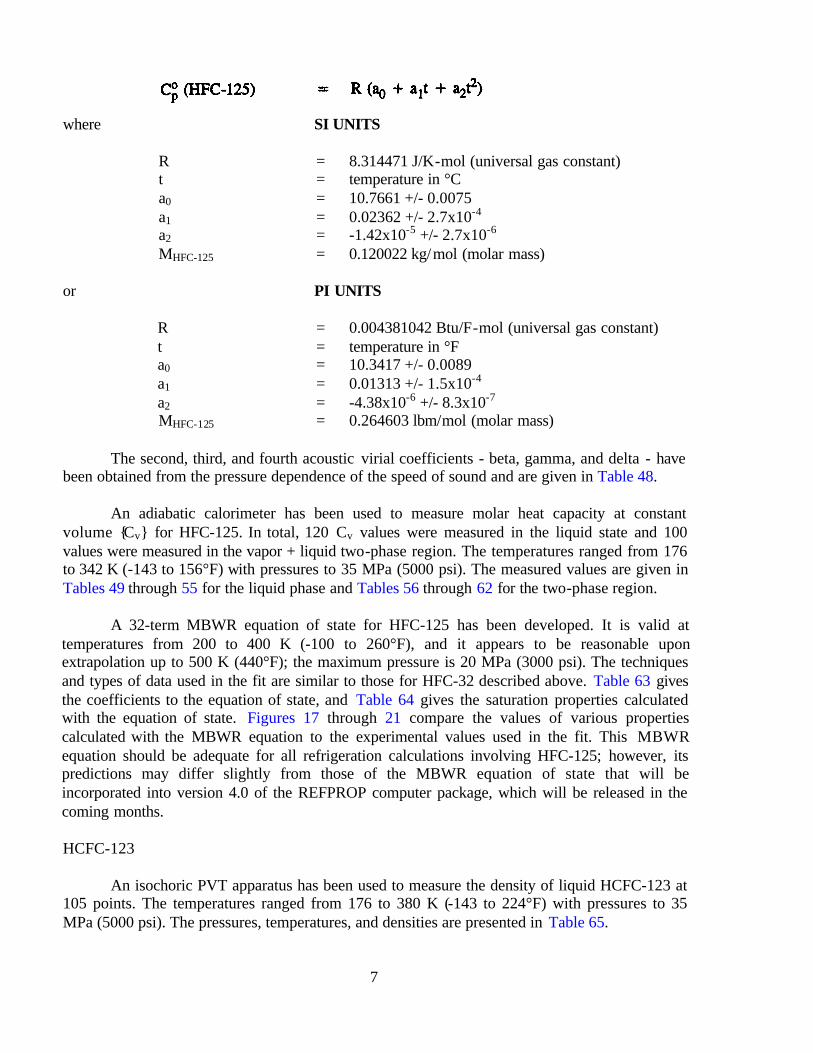
where SI UNITS
R = 8.314471 J/K-mol (universal gas constant)t = temperature in °Ca0 = 11.2398 +/- .0035a1 = 2.436x10⁻² +/- 1.3x10⁻⁴
a2 = -2.13x10⁻⁵ +/- 1.3x10⁻⁶
MHCFC-124 = 0.136477 kg/mol (molar mass)
or PI UNITS
R = 0.004381042 Btu/F-mol (universal gas constant)t = temperature in °Fa0 = 10.8000 +/- .0042a1 = 1.395x10⁻² +/- 7.7x10⁻⁵
a2 = -6.57x10⁻⁶ +/- 4.0x10⁻⁷
MHCFC-124 = 0.300880 lbm/mol (molar mass)
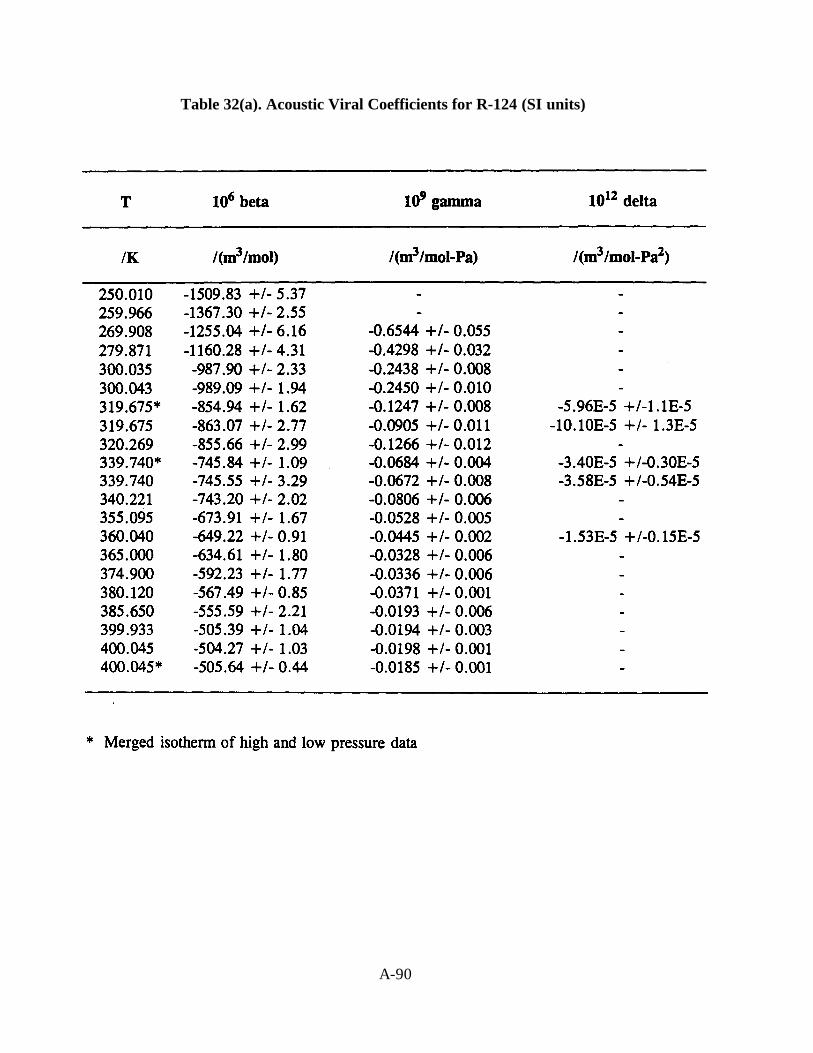
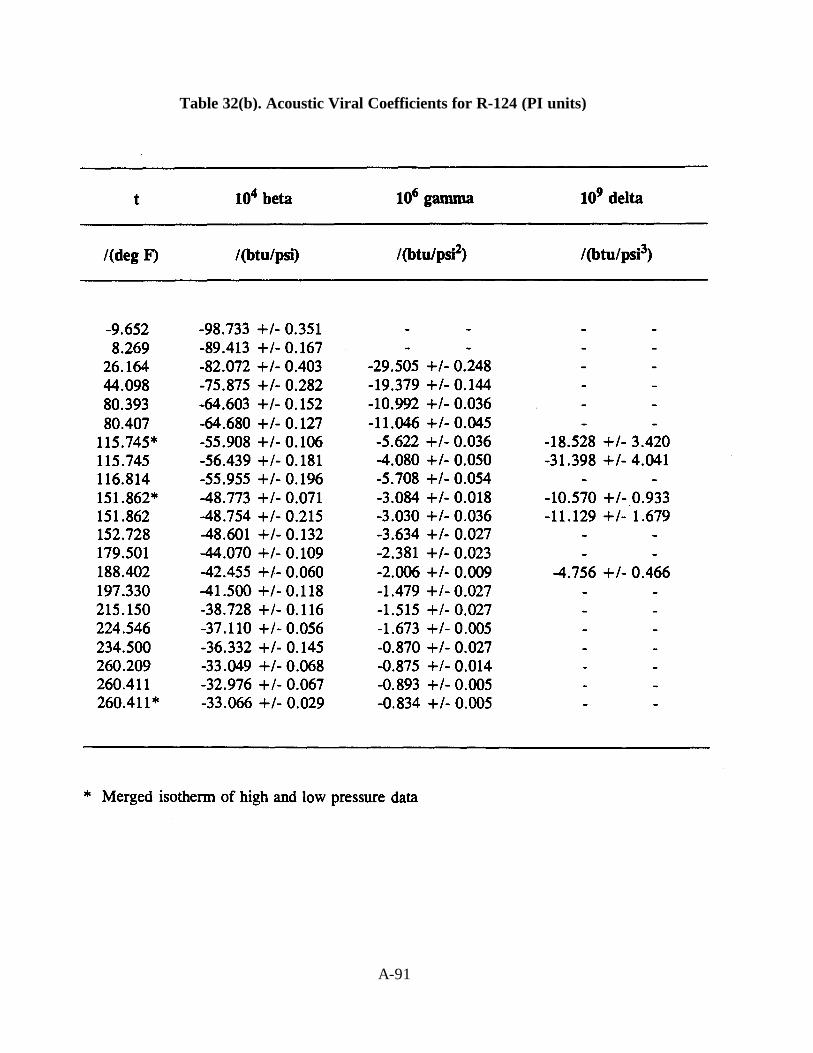
The second, third, and fourth acoustic virial coefficients - beta, gamma, and delta - havebeen obtained by analyzing the pressure dependence of the speed of sound. The results are givenin Table 32.
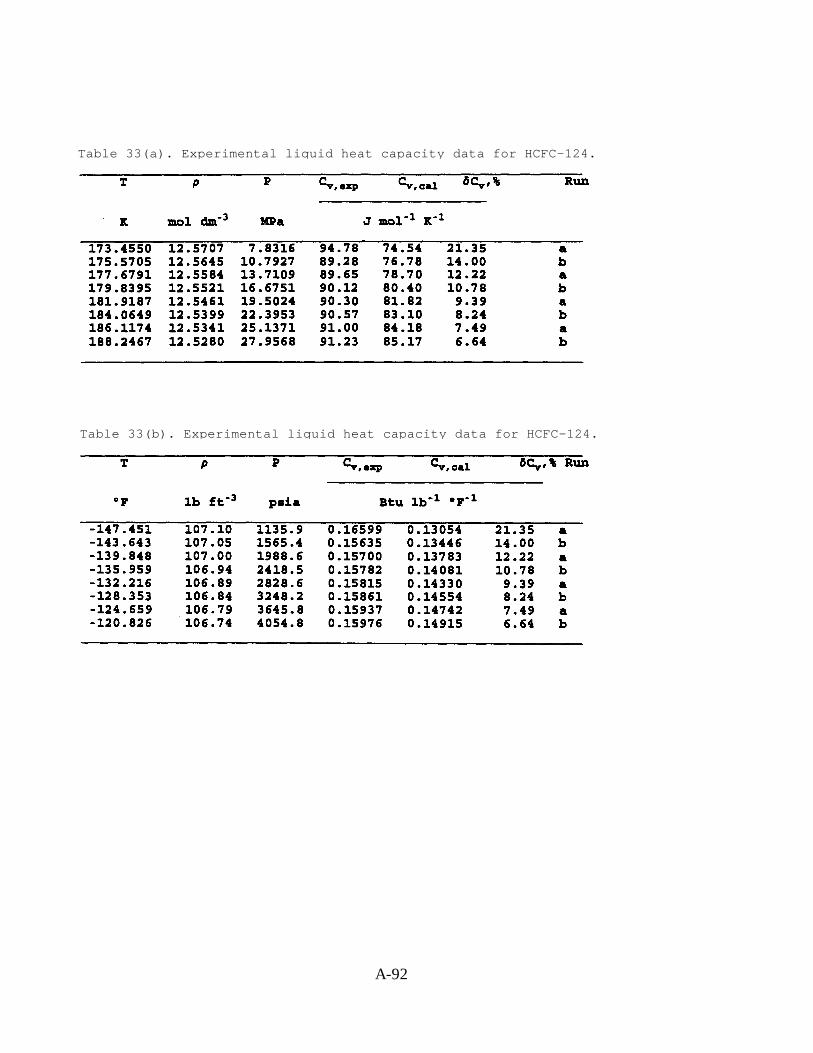
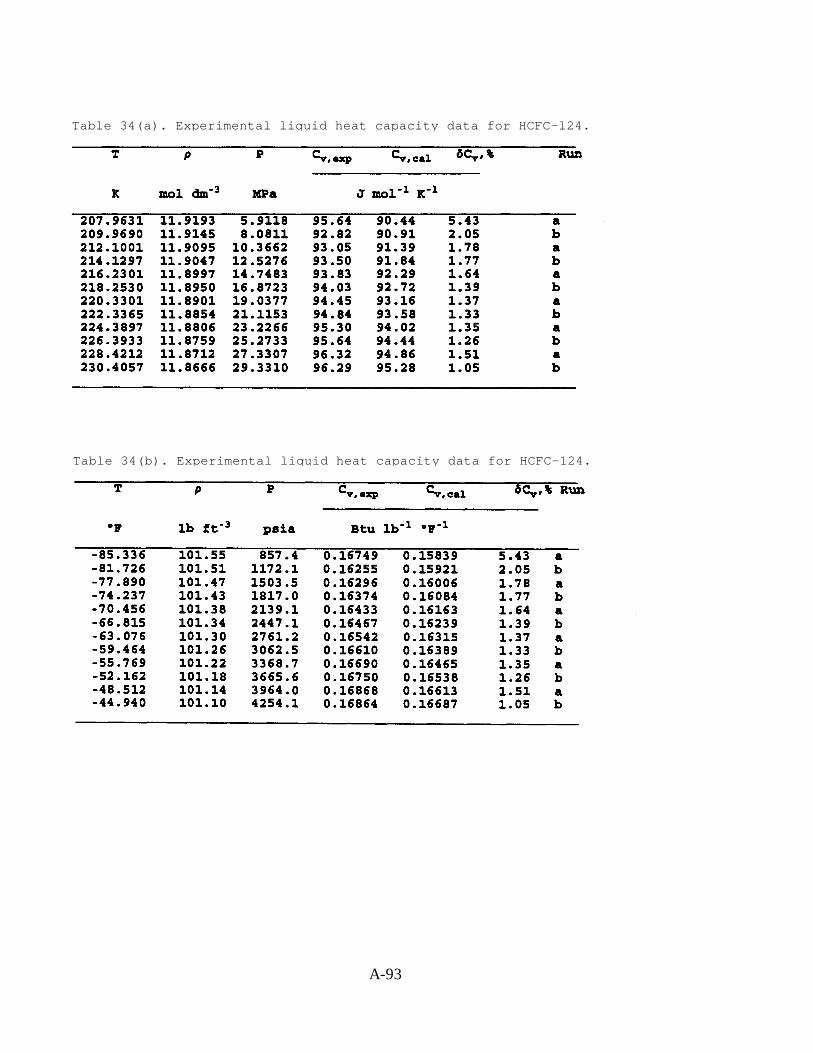
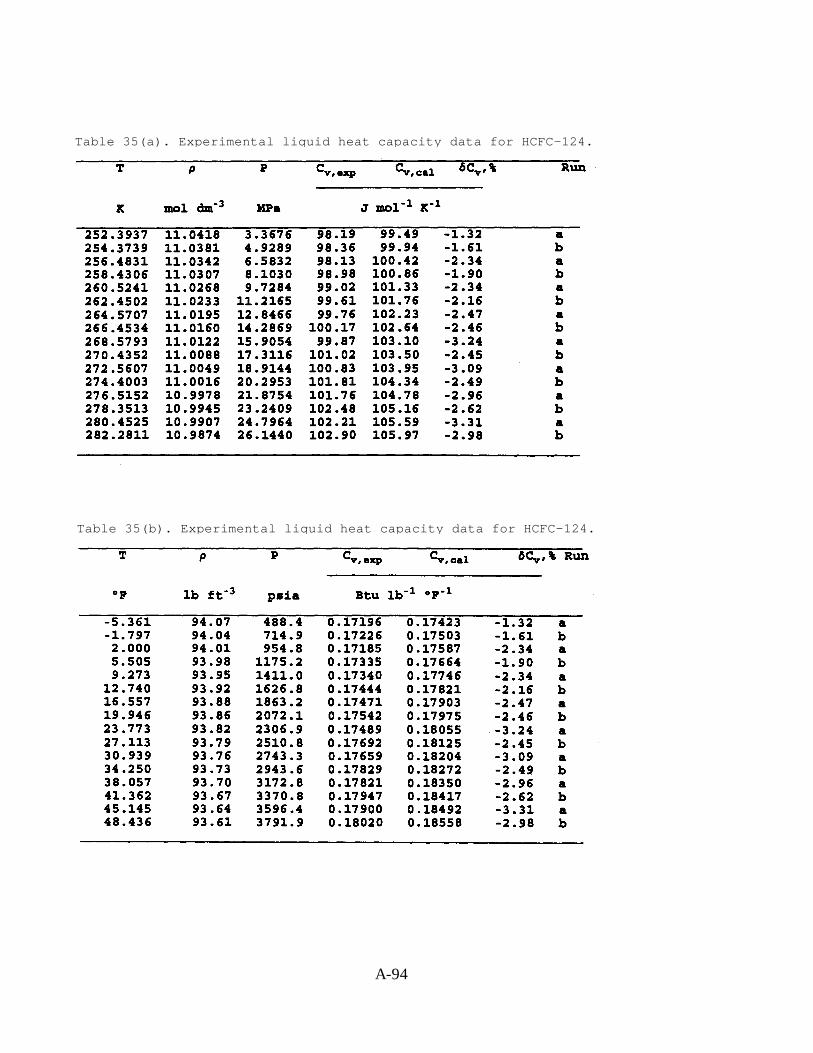
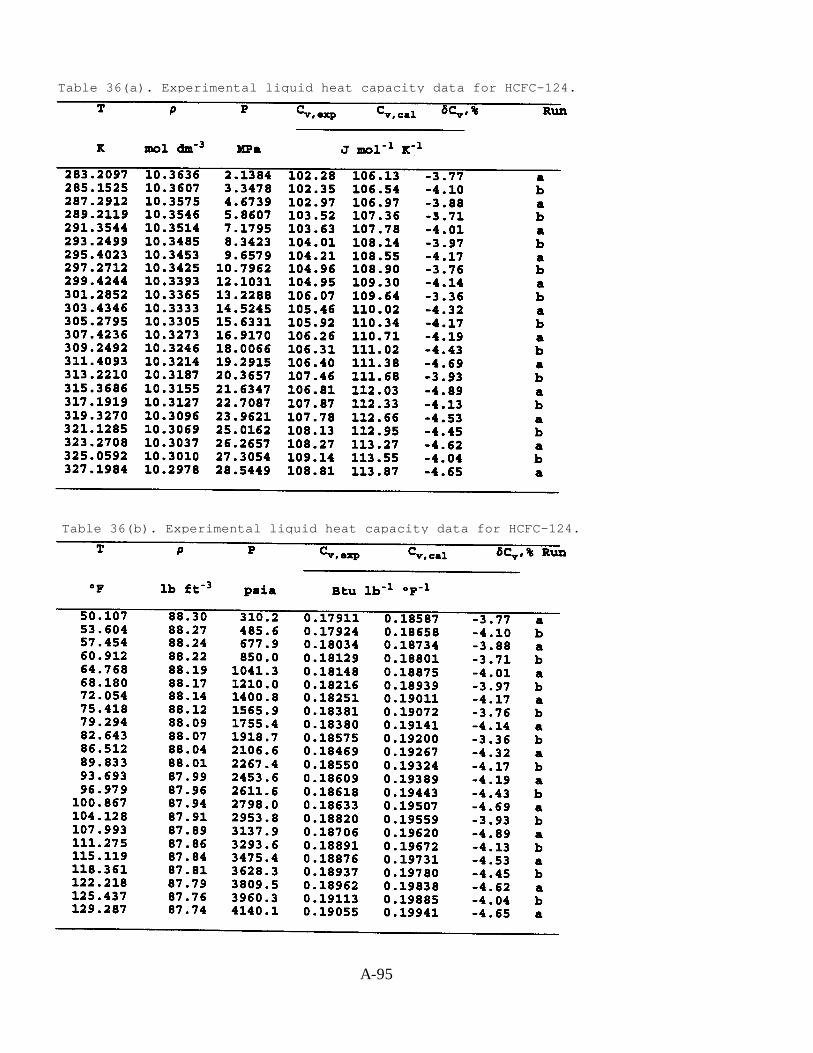
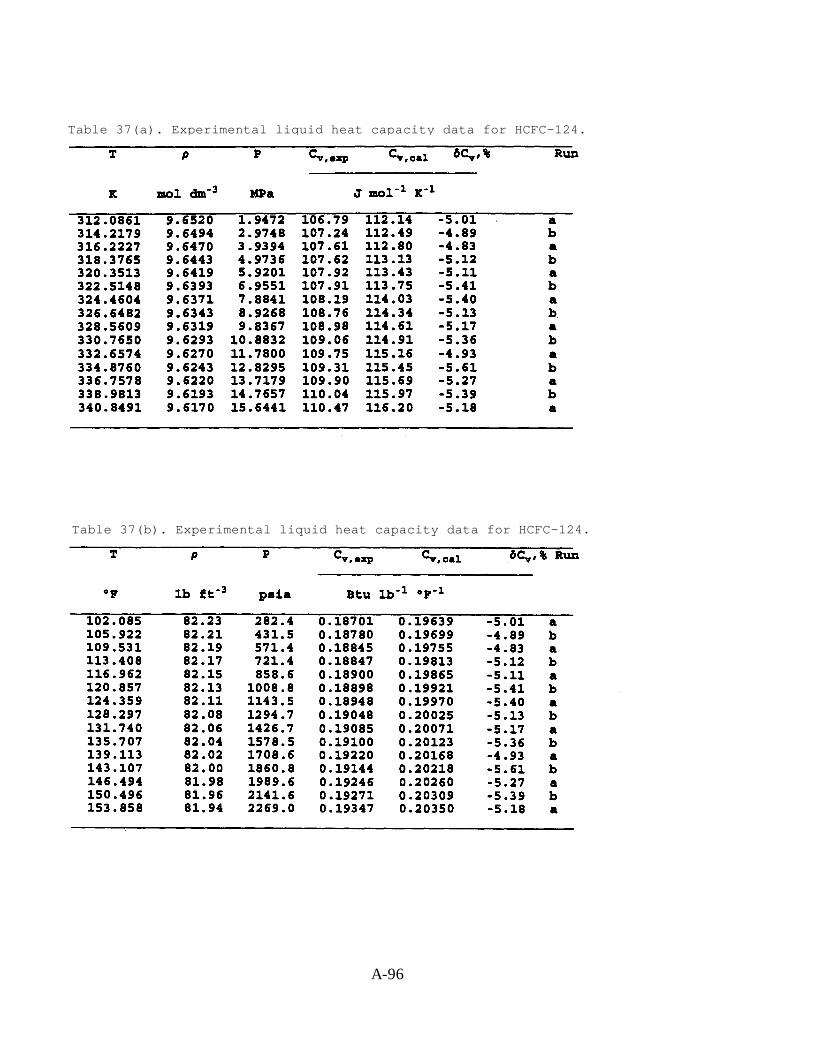
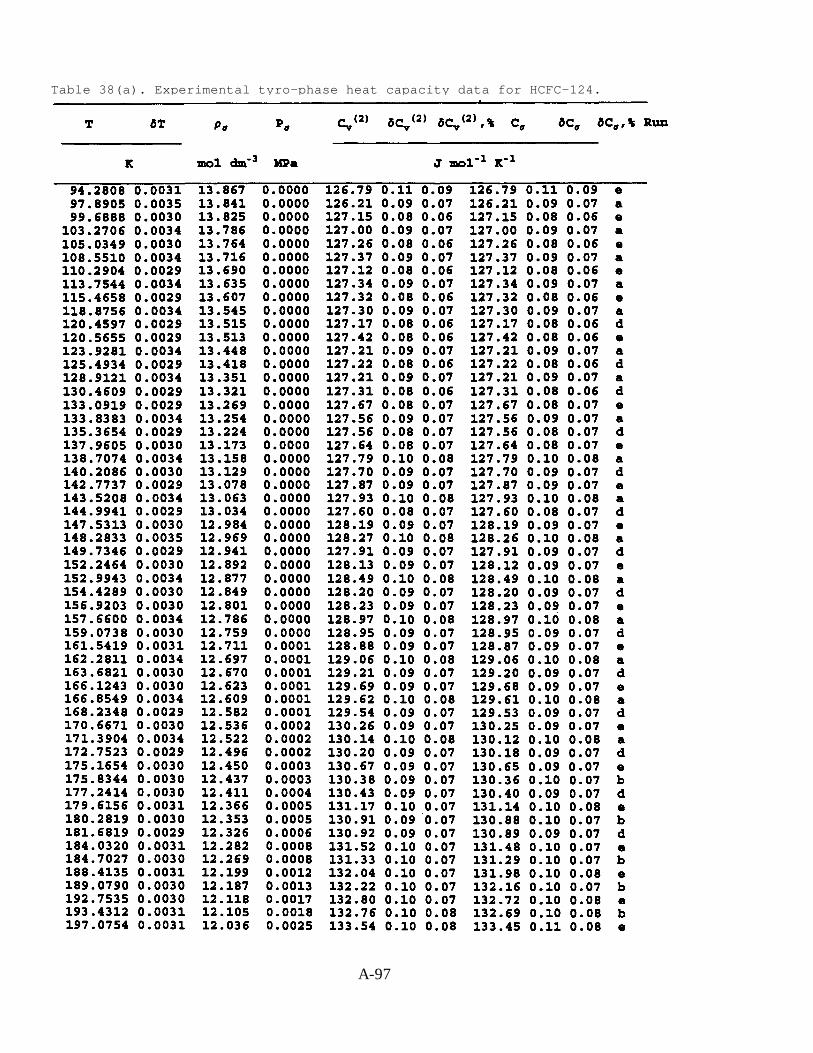
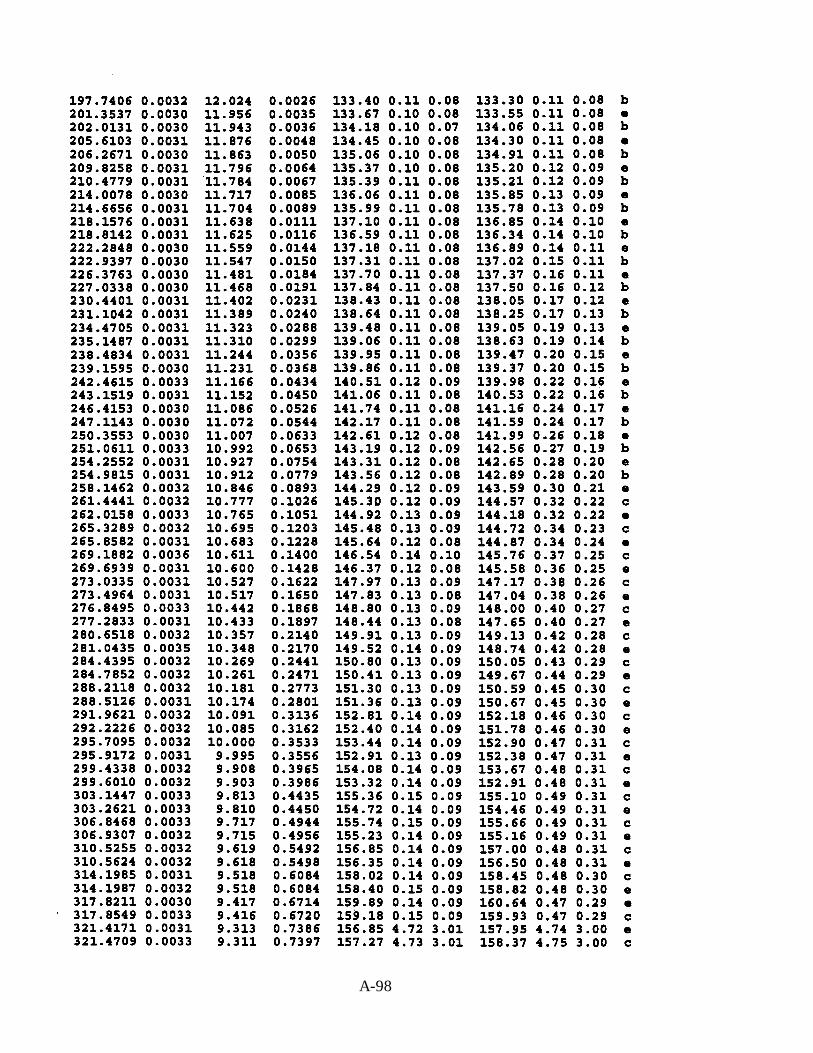
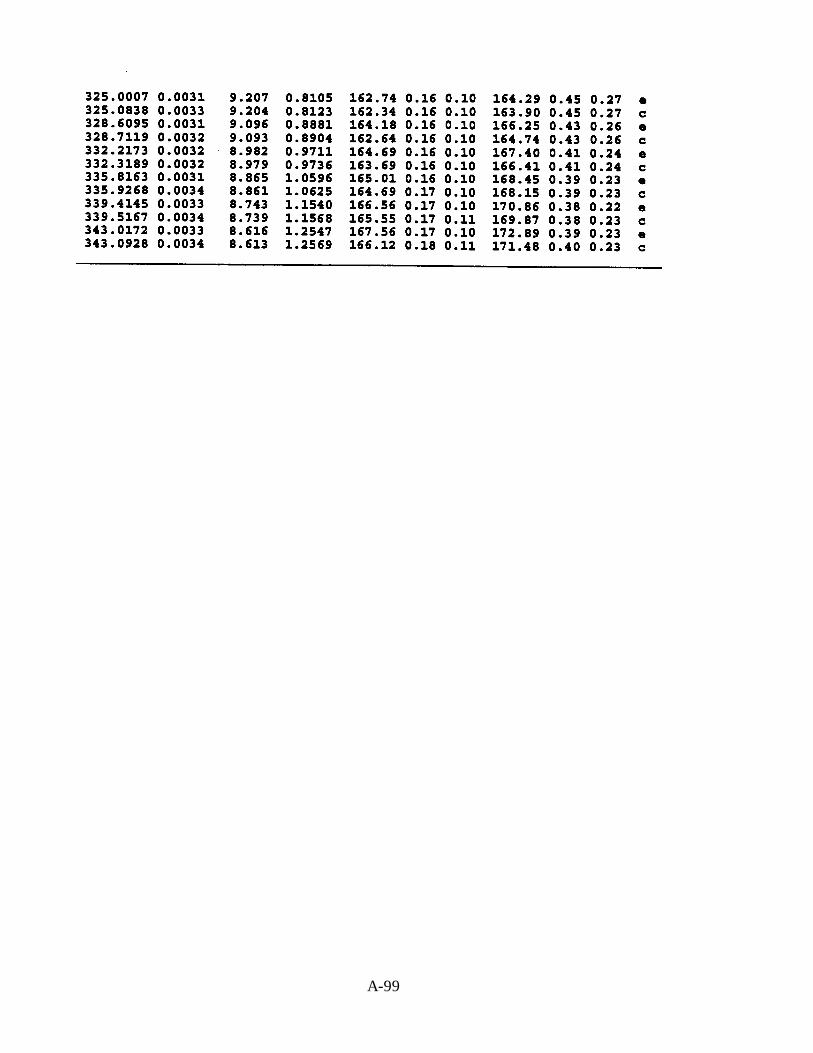
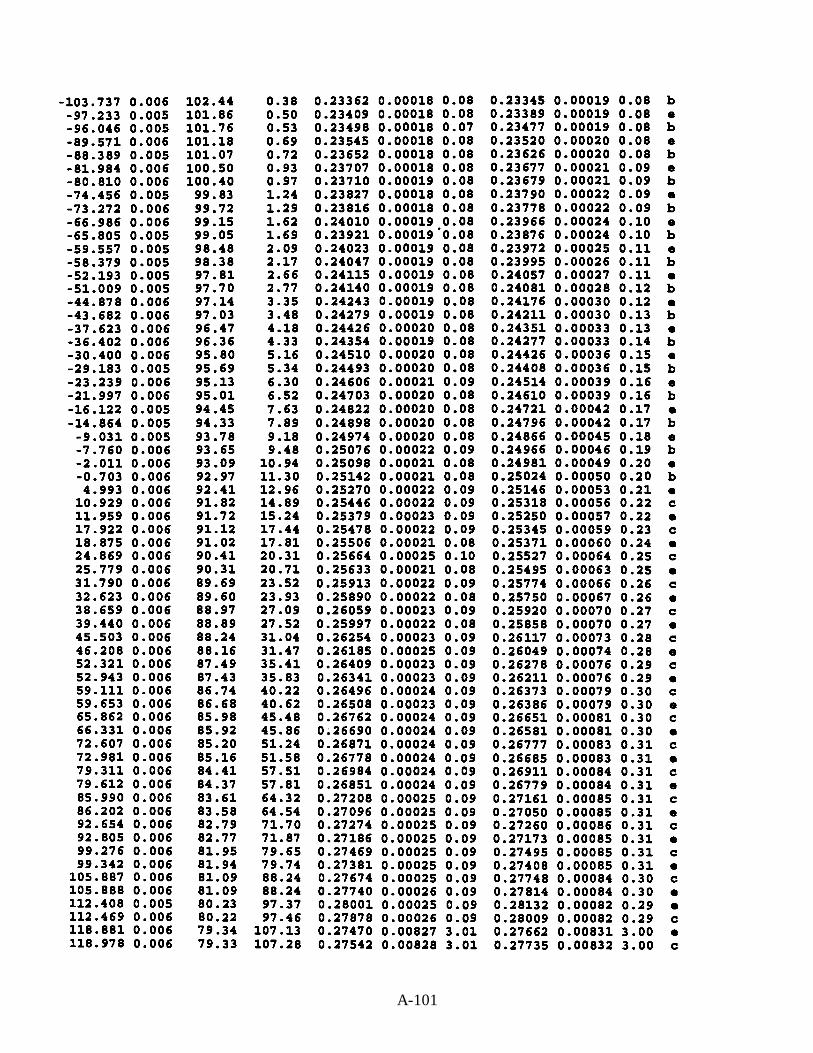
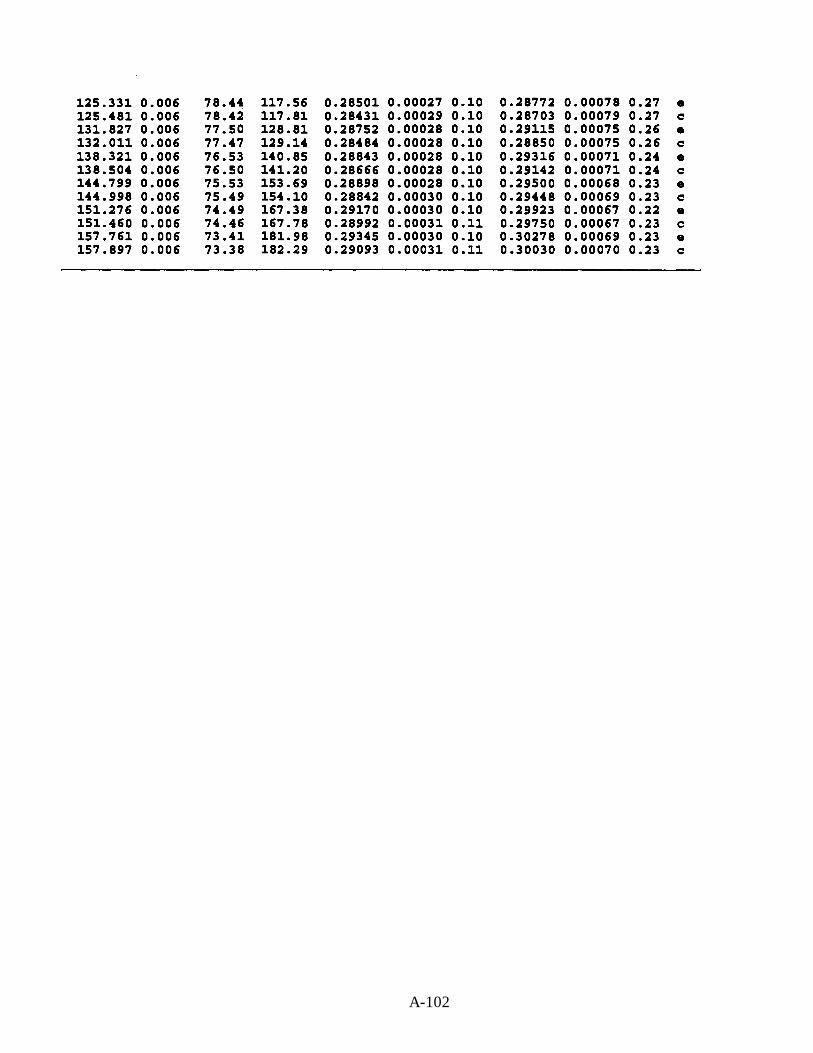
An adiabatic calorimeter has been used to measure the molar heat capacity at constantvolume Cv for HCFC-124. The measurements were carried out in the single-phase-liquid (74points) and saturated-liquid (132 points) states. Five isochores have been completed. Thetemperatures ranged from 173 to 345 K (-148 to 161 °F) with pressures to 35 MPa (5000 psi).The measurements are presented for the liquid phase in Tables 33 through 37 and for the two-phase region in Table 38. The temperatures of the saturated liquid ranged from 94 to 343 K (-290to 158°F).
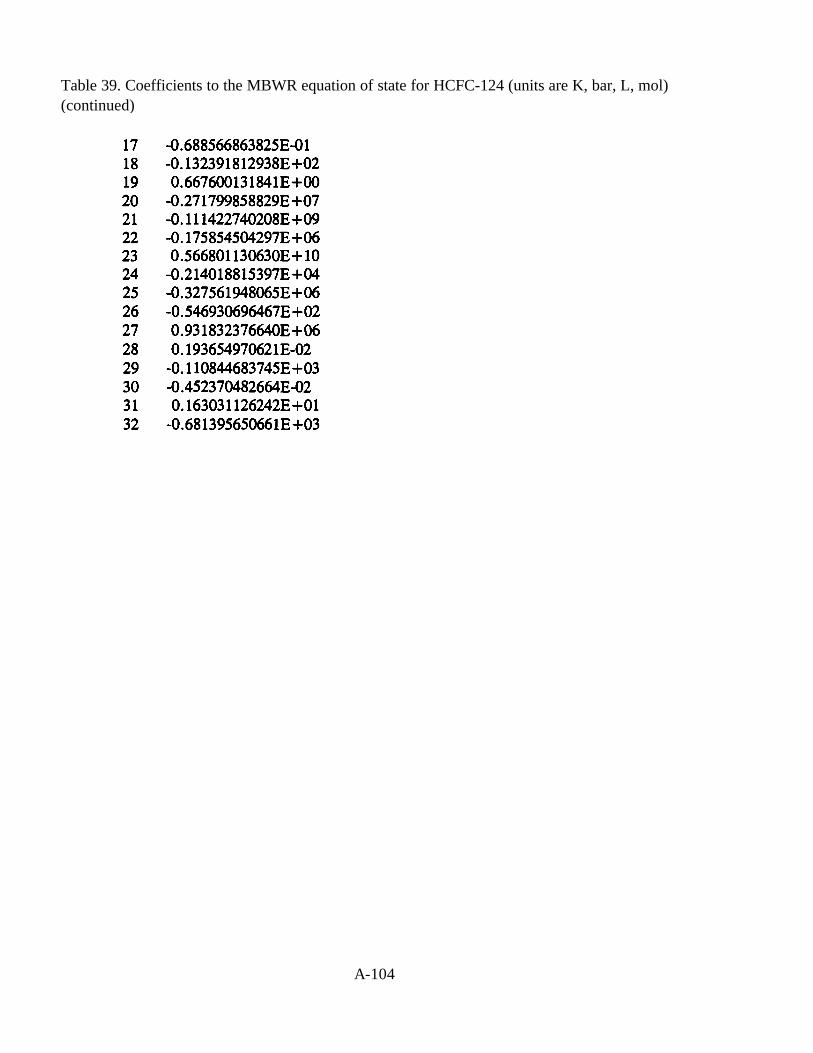
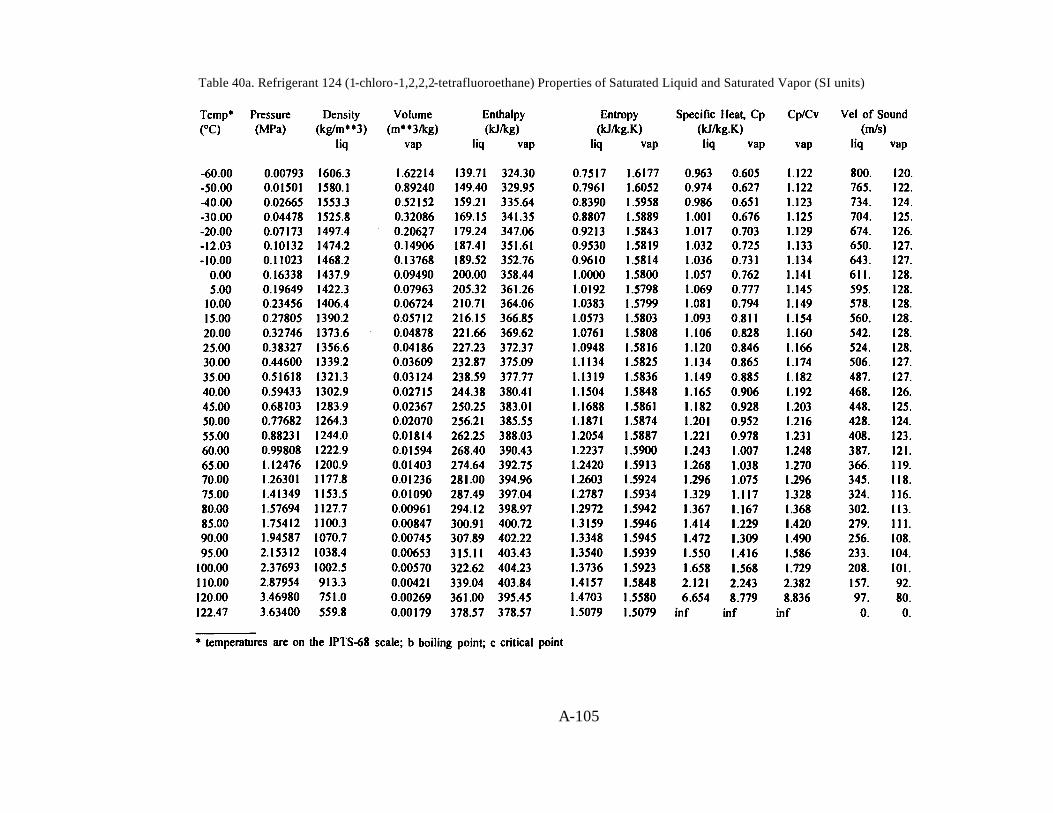
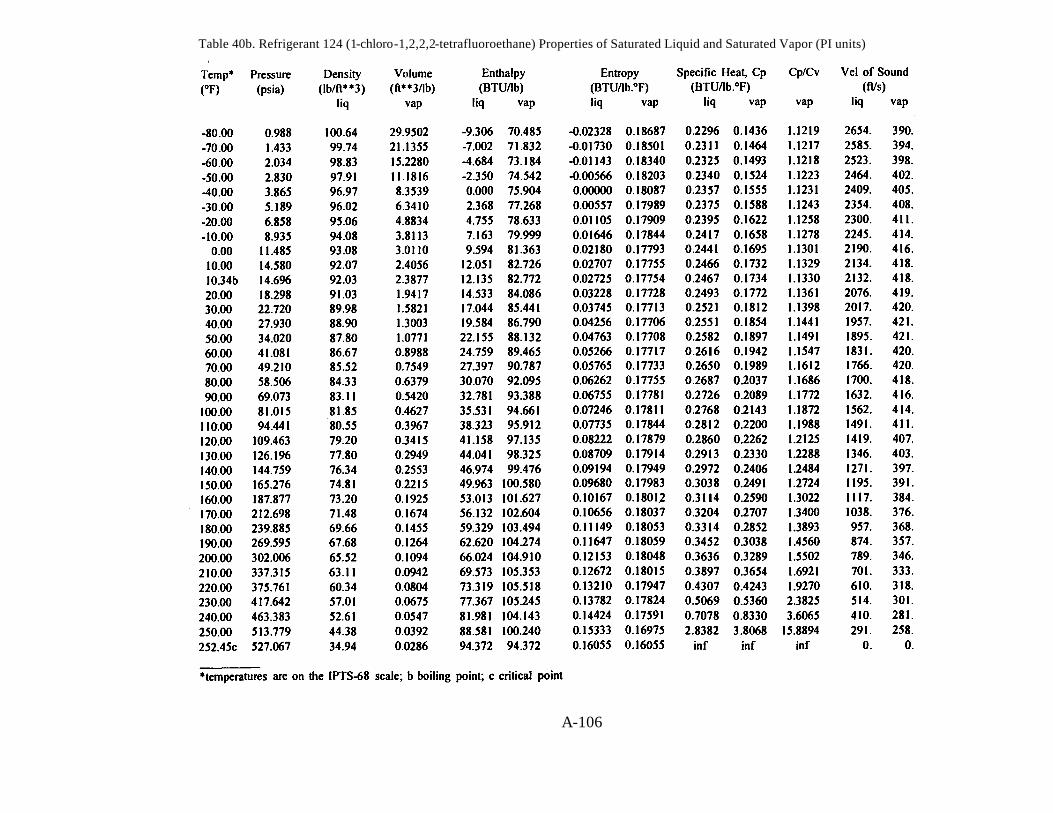
A 32-term MBWR equation of state for HCFC-124 has been developed. It is valid attemperatures from 210 to 450 K (-82 to 350°F), and it appears to be reasonable uponextrapolation up to 500 K (440°F); the maximum pressure is 20 MPa (3000 psi). The techniquesand types of data used in the fit are similar to those for HFC-32 described above. Table 39 givesthe coefficients to the equation of state, and Table 40 gives the saturation properties calculatedwith the equation of state. Figures 15 and 16 compare values of density and vapor pressurecalculated with the MBWR equation to the experimental values used in the fit. This MBWRequation should be adequate for all refrigeration calculations involving HCFC-124; however, itspredictions may differ slightly from those of the MBWR equation of state that
5
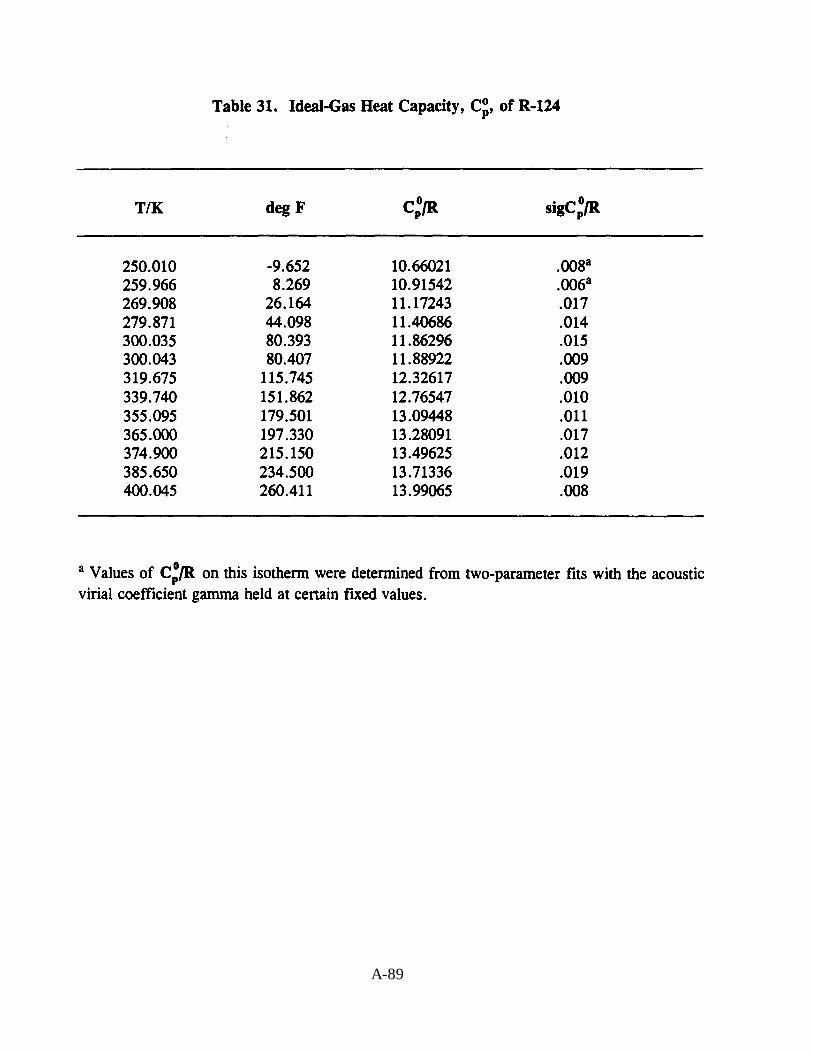
, of
were obtained by fitting
kPa (3 and 130 psi). The results are given in Table 30. The ideal-gas heat capacity,HCFC-124 has been obtained by analyzing the speed of sound measurements at low pressures.The results are given in Table 31. The following expressions forthe data in Table 31:
6
will be incorporated into version 4.0 of the REFPROP computer package, which will be releasedin the coming months.
HFC-125
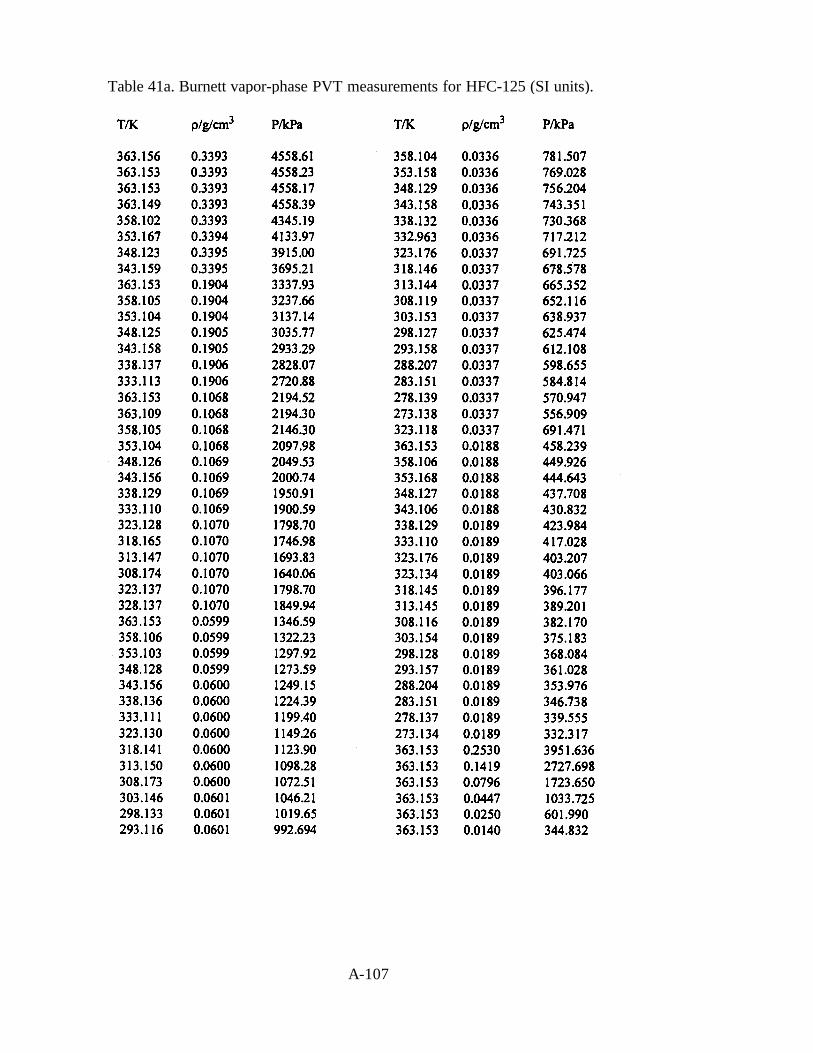
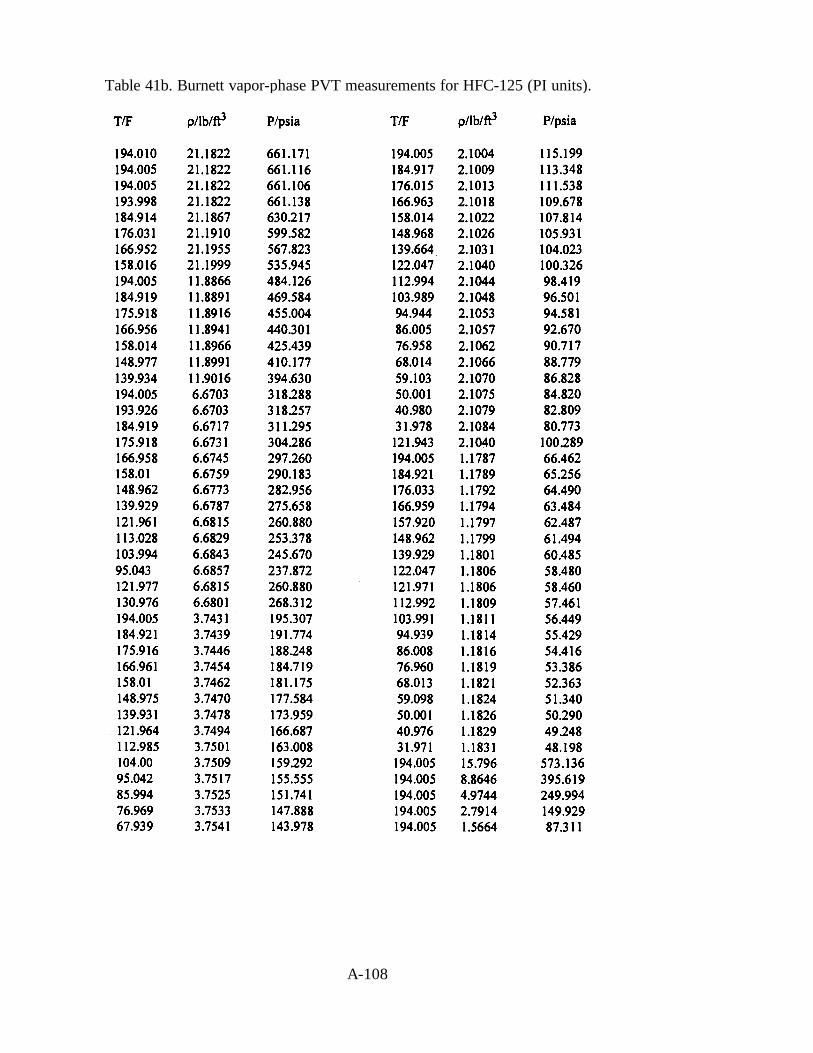
The Burnett apparatus has been used in the isochoric mode to determine the PVT relationfor the vapor phase of HFC-125 at 87 points. Isochores were completed at densities up to 2.9mol/L (21.7 lb/ft3). The temperature range was 273 to 363 K (32 to 194°F). A Burnett expansionwas completed at 363 K (194°F) to establish the densities of the isochores. The results of thesemeasurements are given in Table 41.
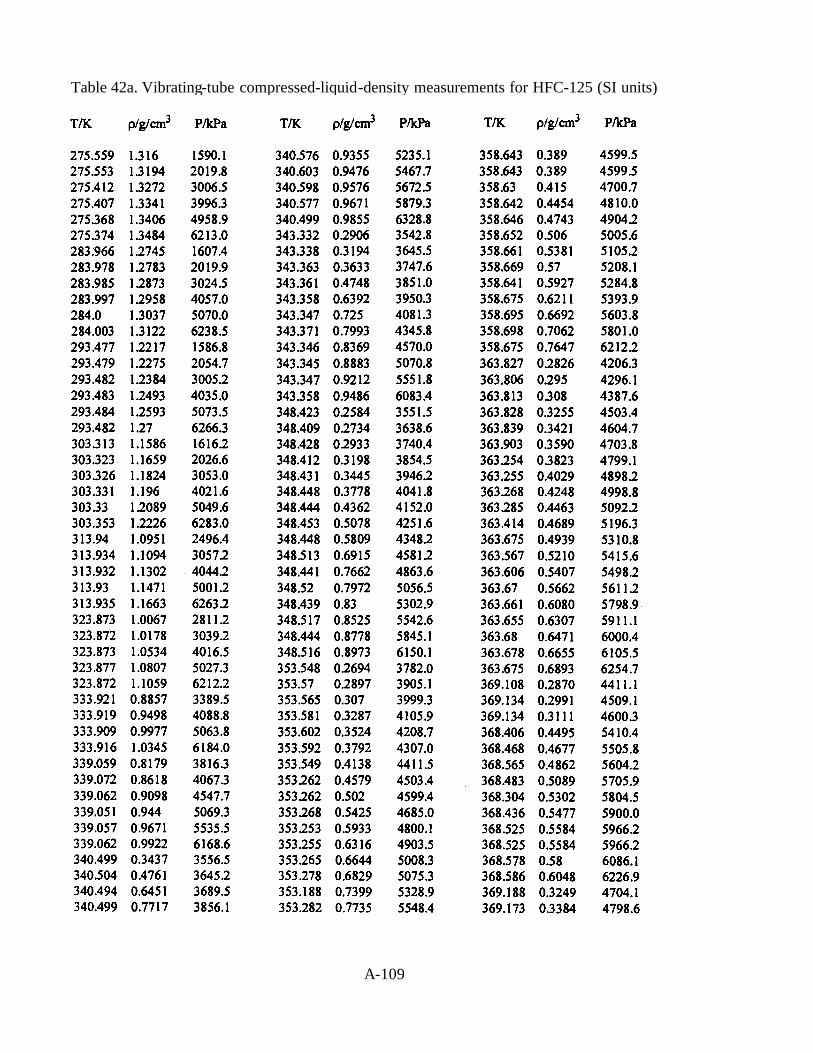
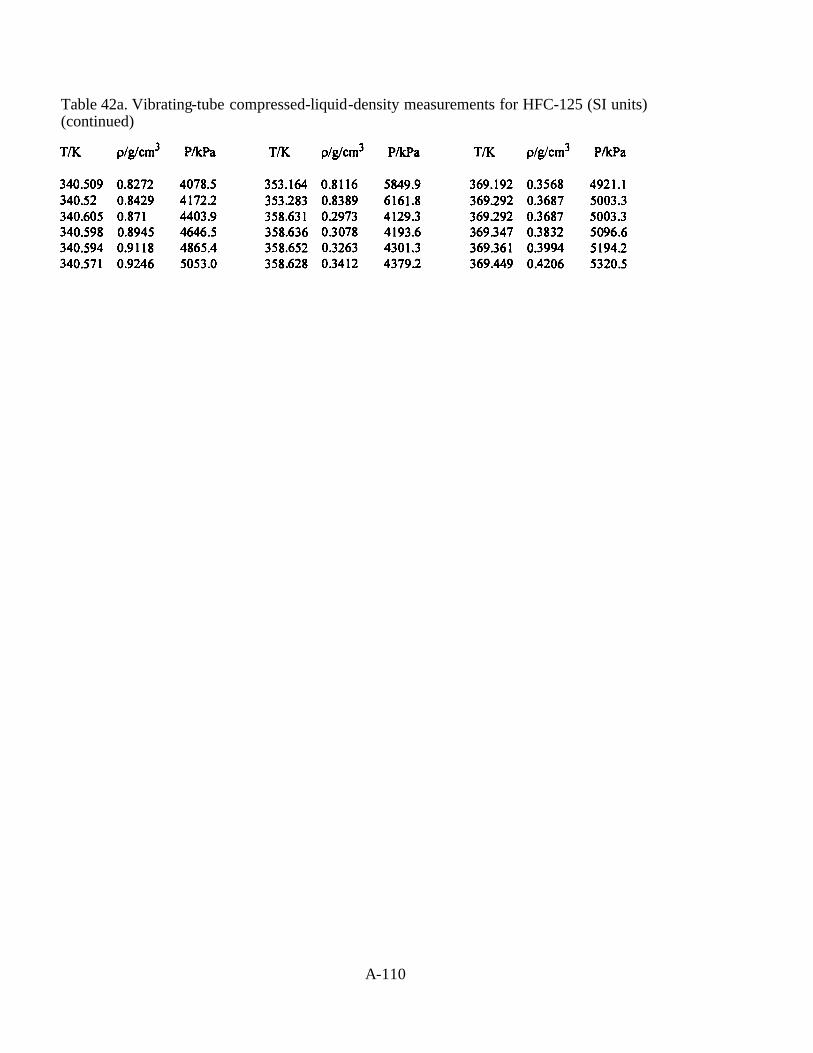
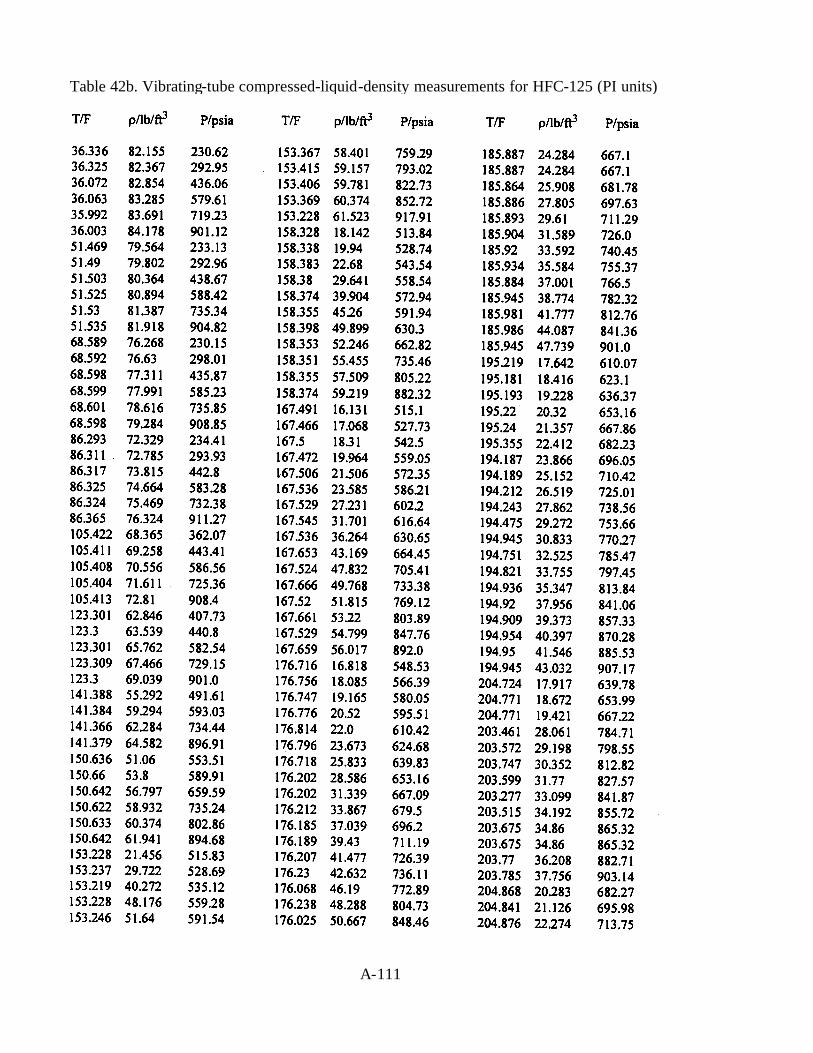
The vibrating tube densimeter has been used to determine the PVT relation for HFC-125in the liquid phase. Fifteen isotherms were completed spanning the ranges 275 to 369 K (36 to205°F) and 1500 to 6200 kPa (230 to 900 psi). The results of these liquid-phase measurementsare given in Table 42.
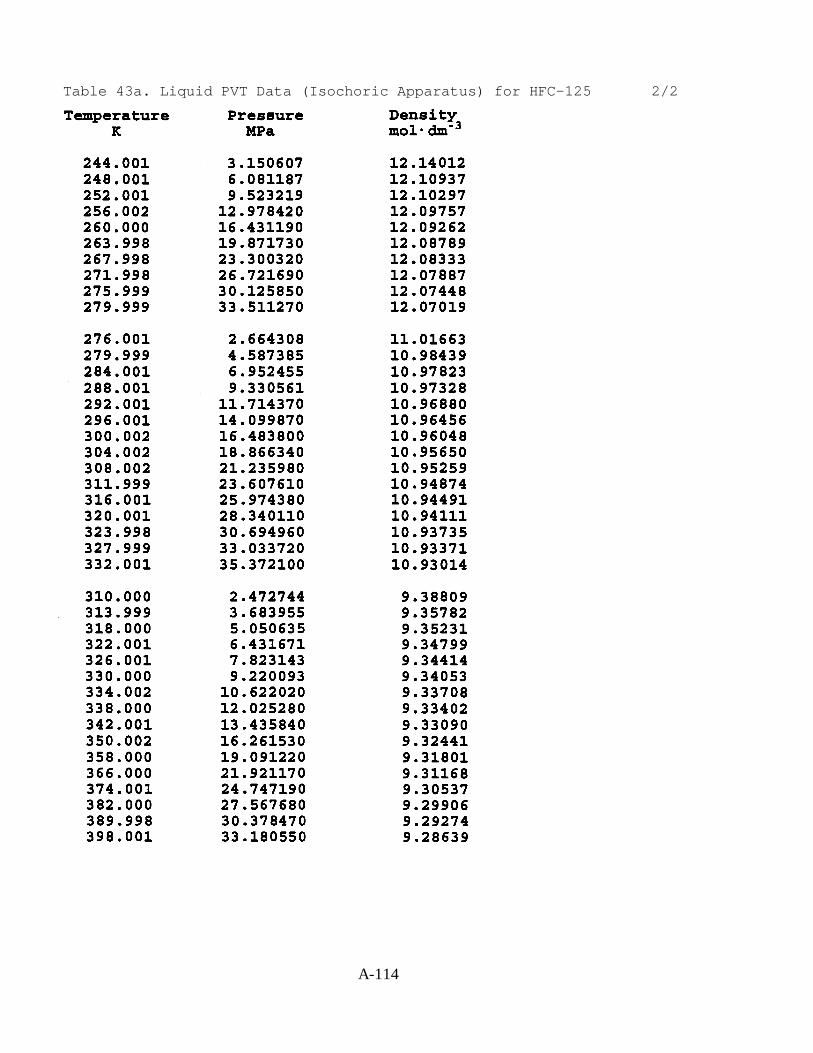
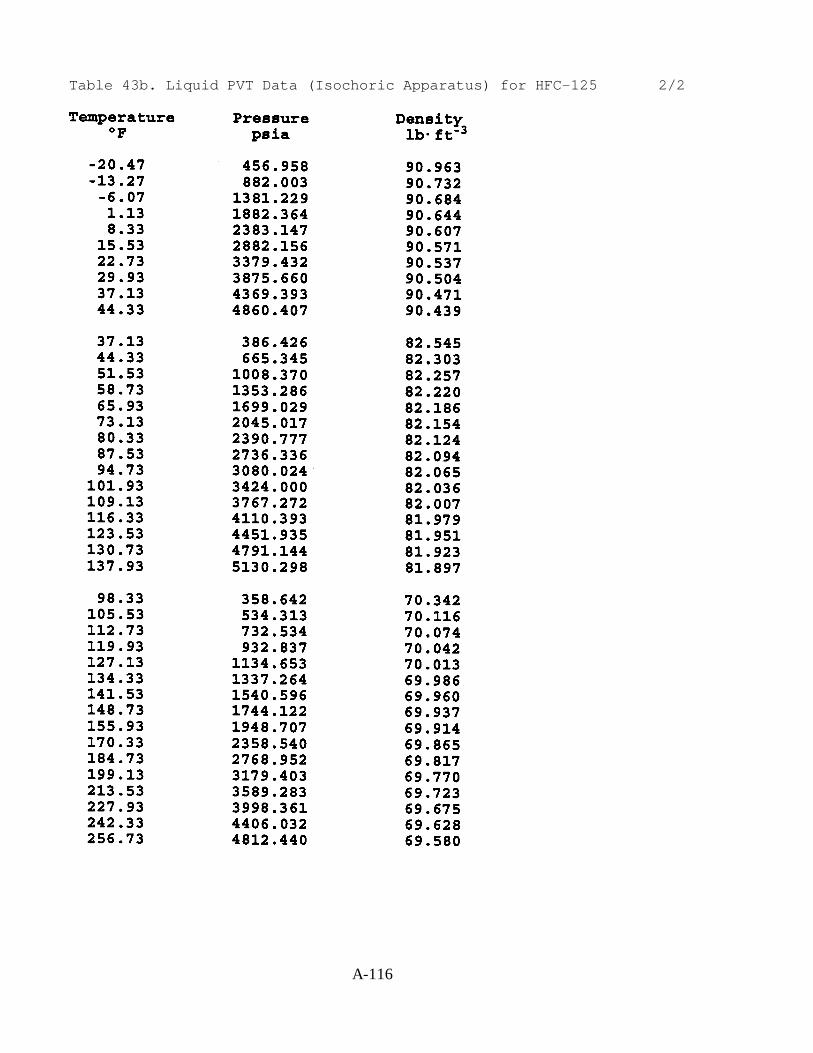
An isochoric PVT apparatus has been used to measure the density of liquid HFC-125 at87 liquid-state conditions. The measured temperatures ranged from 174 to 398 K (-146 to 257°F)with pressures up to 35 MPa (5000 psi). The results are presented in Table 43.
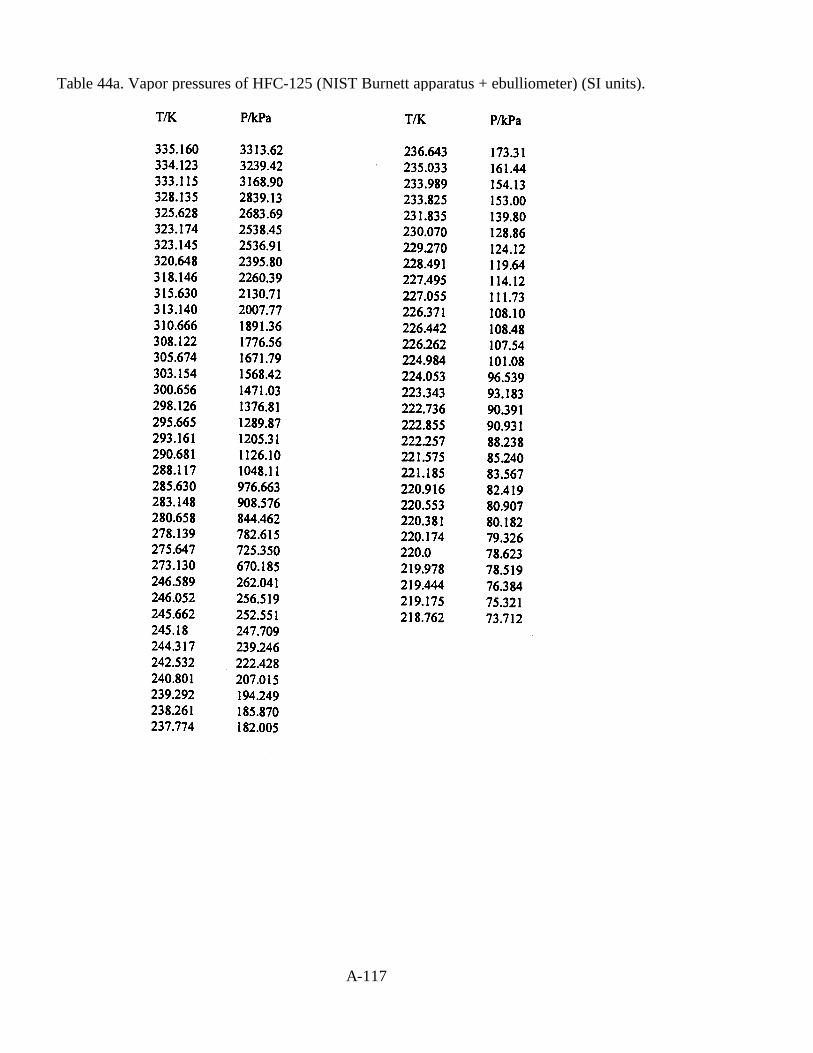
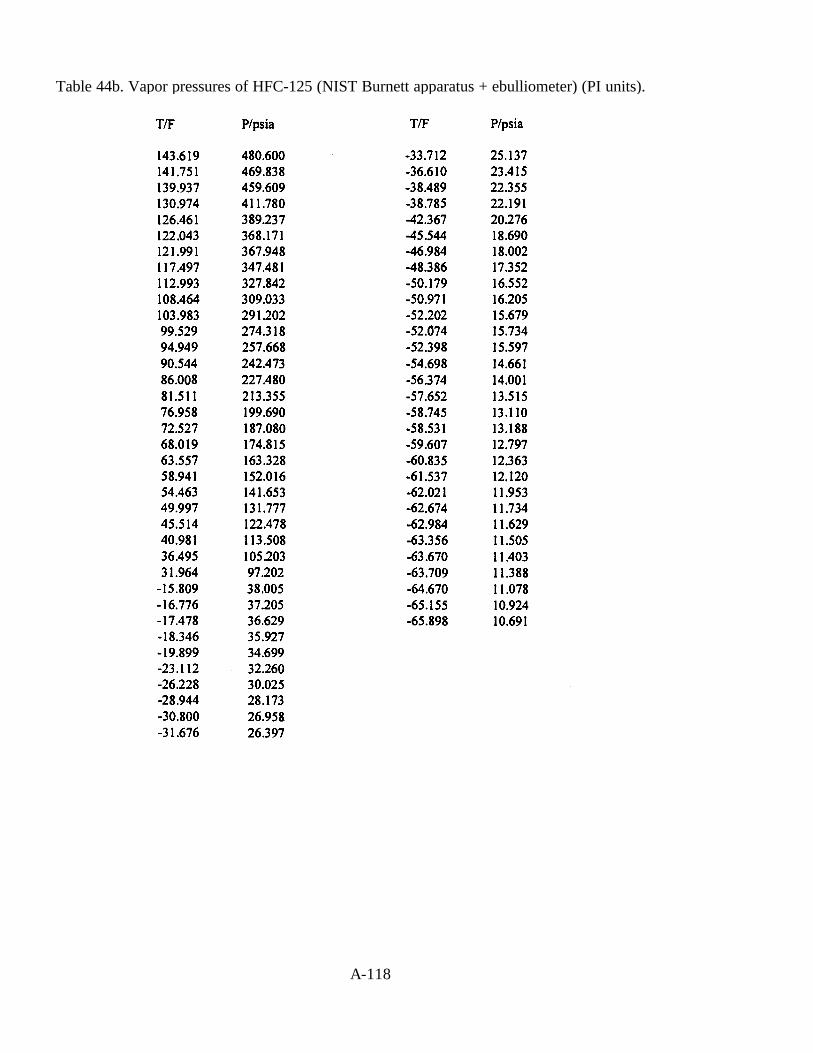
The Burnett apparatus and the glass ebulliometer have been used to measure the vaporpressure of HFC-125 at 68 points, given in Table 44. The data span the very wide pressure rangefrom 77 to 3313 kPa (1.9 to 458.8 psi ) corresponding to the temperature range from 218 to 335K (-60 to 239°F). The data were fit with a Wagner-type vapor pressure equation and had astandard deviation of 0.009% . The vapor pressure equation was extrapolated to the criticaltemperature at Tc = 339.33 K (151.11 °F) to obtain a value of the critical pressure, Pc = 3628.6kPa (525.1 psi).
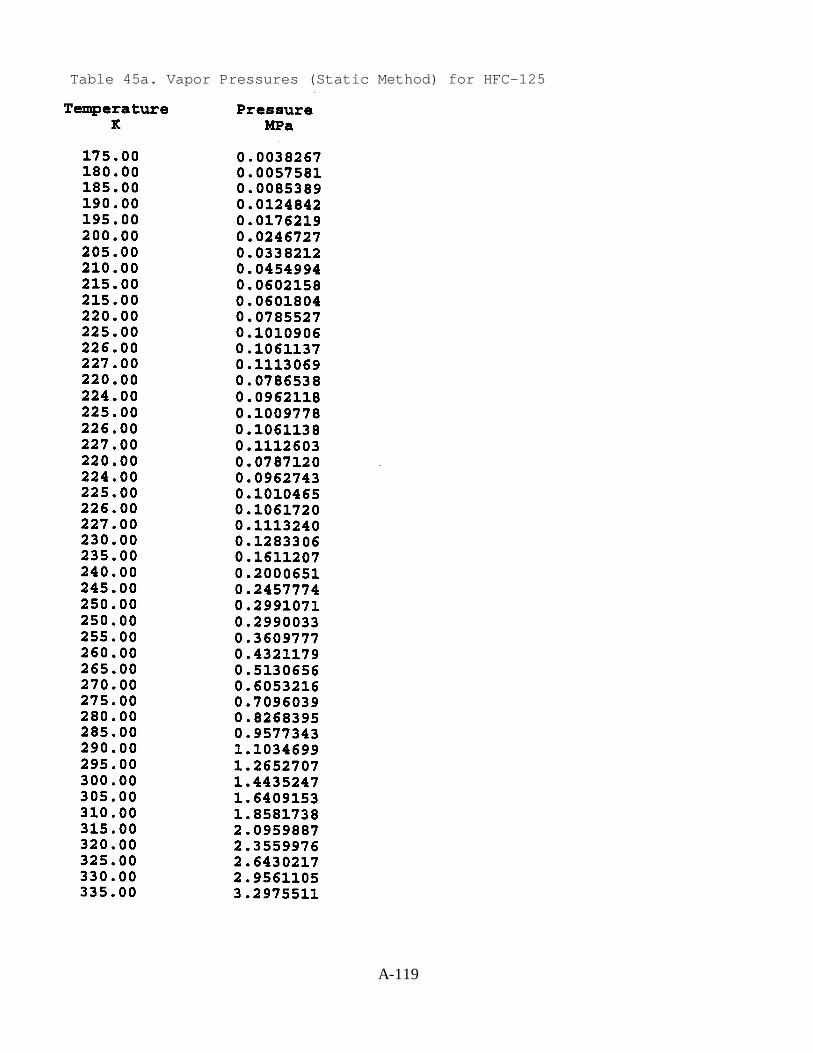
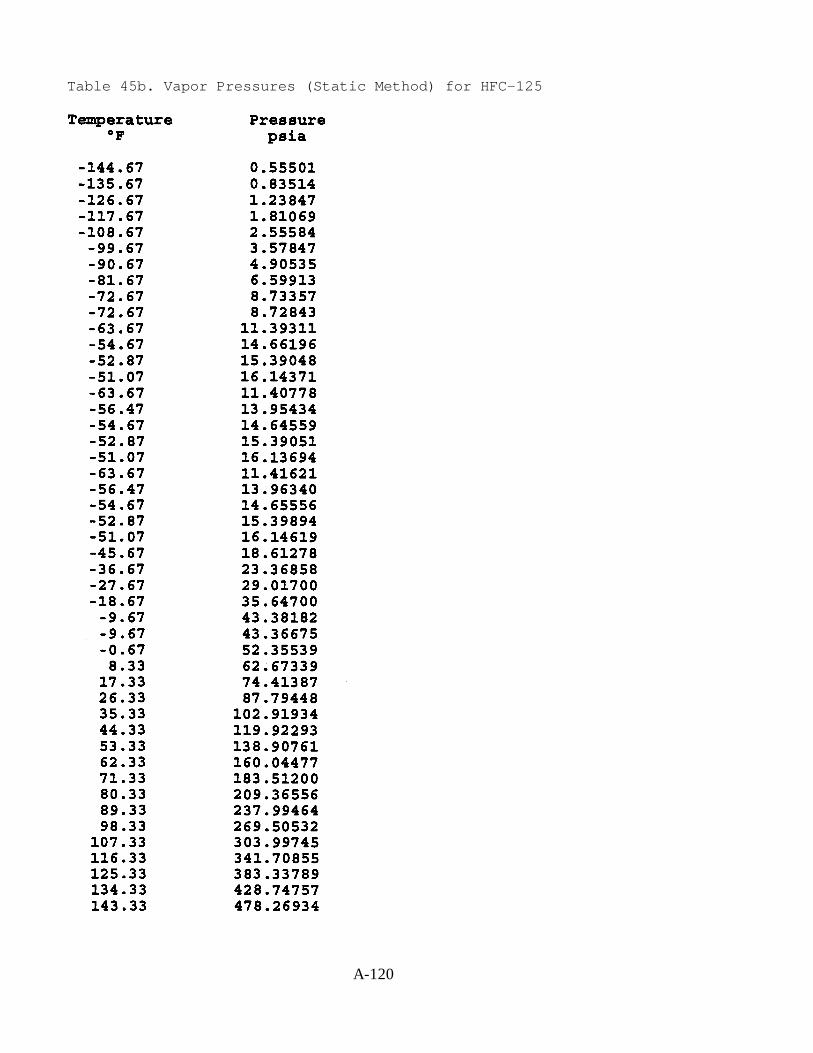
A static method has been employed to measure the vapor pressure of HFC-125 at 37temperatures ranging from 175 to 335 K (-145 to 143°F). The results are given in Table 45.
An optical cell has been used to measure the refractive index and capillary rise of HFC-125 from 23°C (73 °F) up to the critical temperature. The critical temperature was found to be Tc
= (339.33 ± 0.02) K, which corresponds to (151.11 ± 0.04)°F. The refractive index data werecombined with the liquid density data to deduce the value 0.0984 cm3/g for the Lorentz-Lorenzconstant. The refractive index data and the Lorentz-Lorenz constant were used to deduce thevalue ρc = (565 ± 9) kg/m3 [(35.24 ± 0.56) lb/ft3] for the critical density.
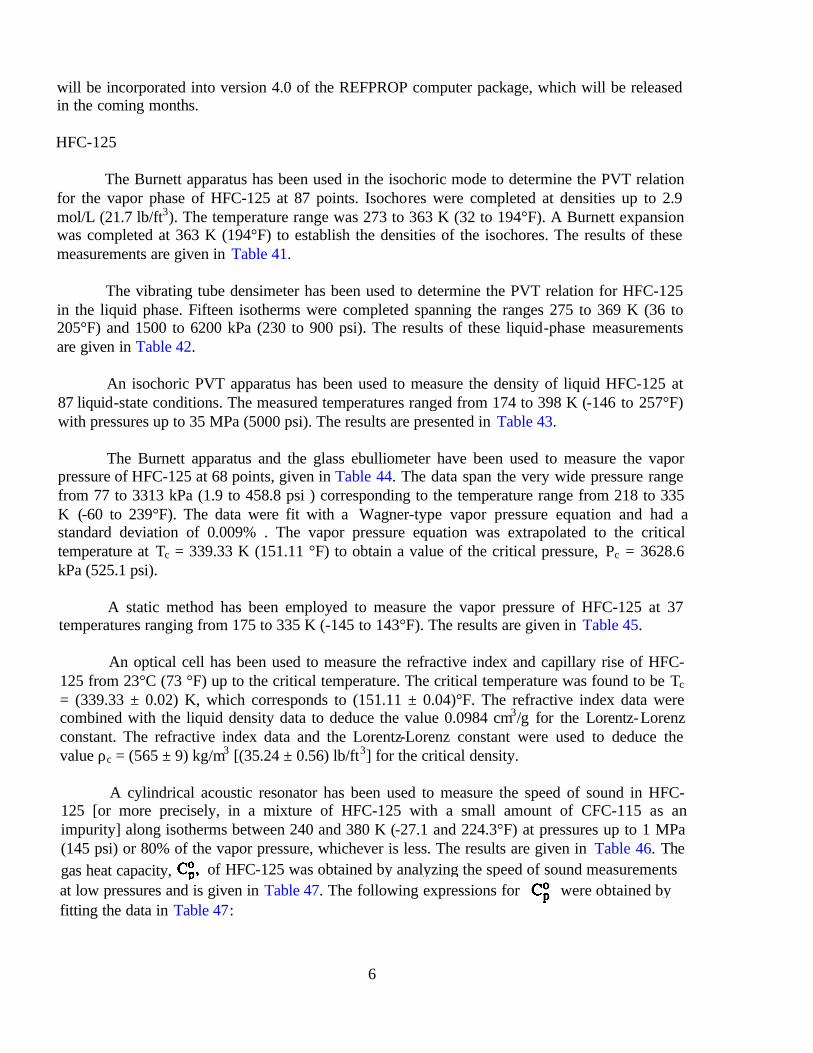
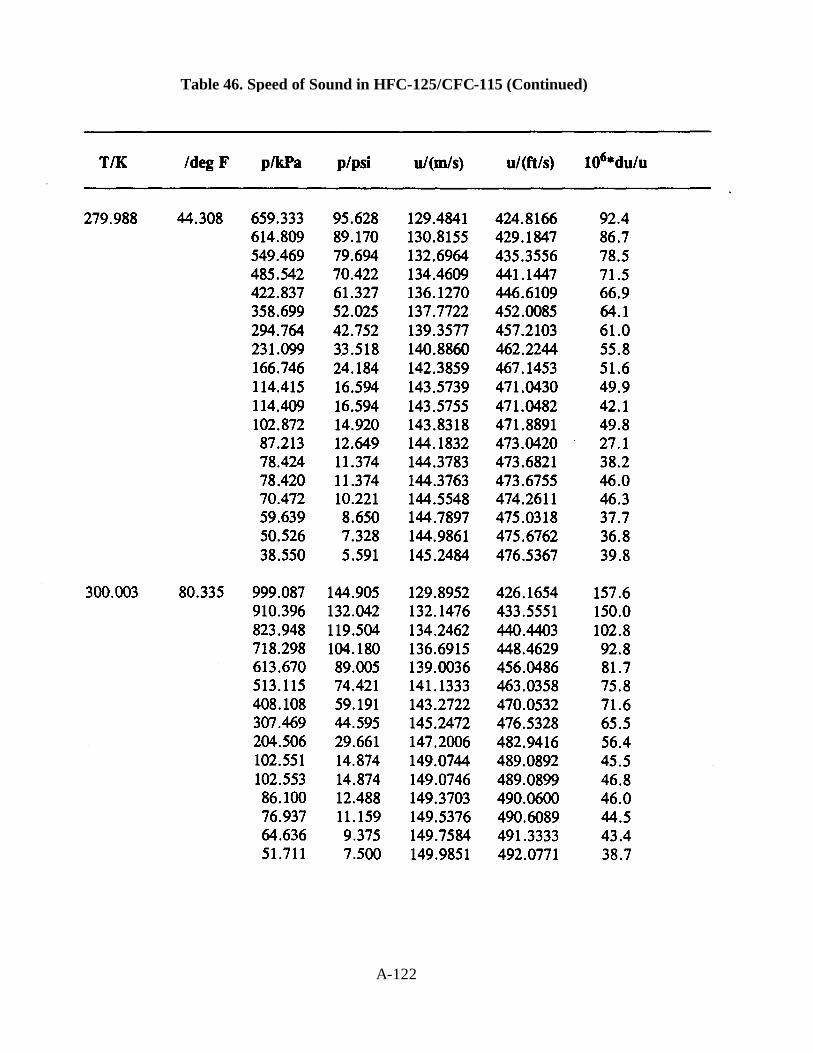
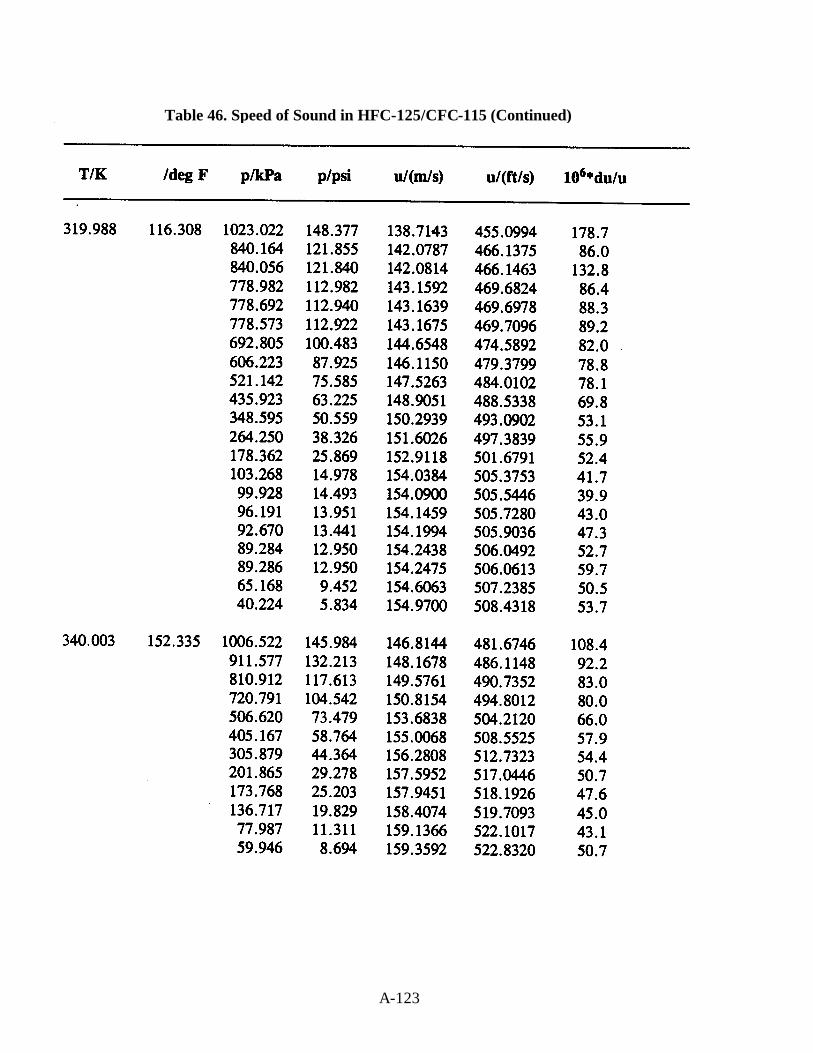
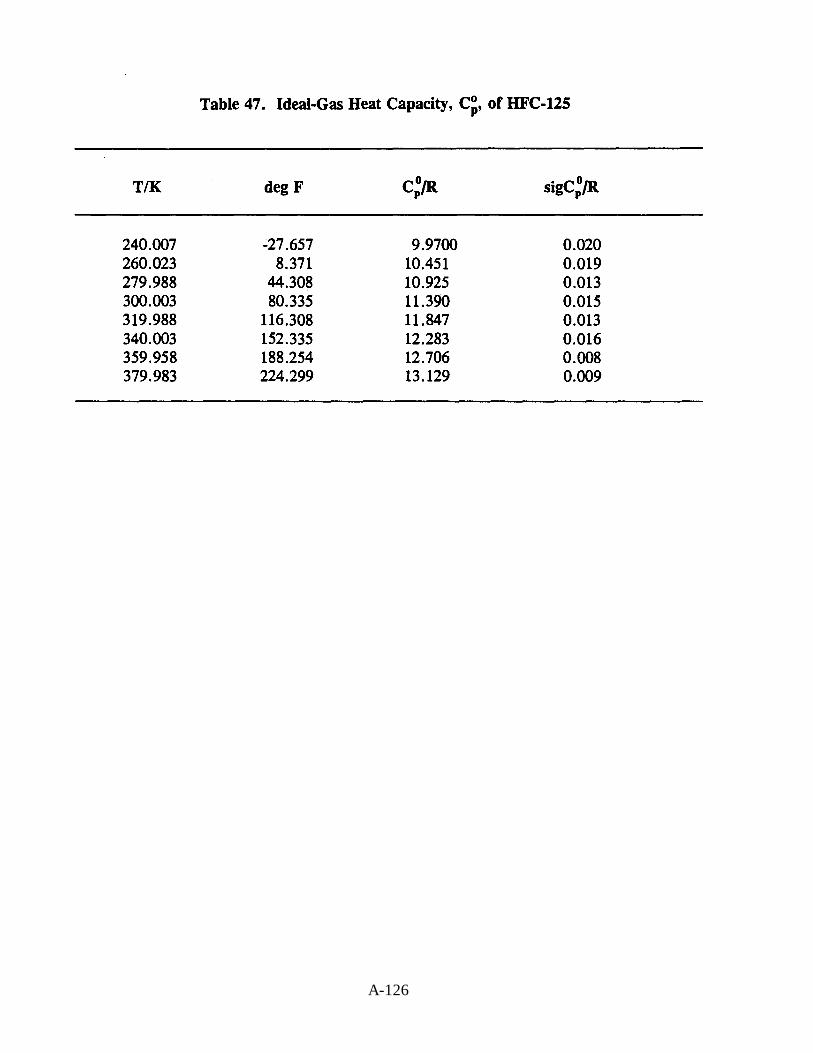
A cylindrical acoustic resonator has been used to measure the speed of sound in HFC-125 [or more precisely, in a mixture of HFC-125 with a small amount of CFC-115 as animpurity] along isotherms between 240 and 380 K (-27.1 and 224.3°F) at pressures up to 1 MPa(145 psi) or 80% of the vapor pressure, whichever is less. The results are given in Table 46. Theideal-
were obtained bygas heat capacity,at low pressures and is given in Table 47. The following expressions forfitting the data in Table 47:
of HFC-125 was obtained by analyzing the speed of sound measurements
where SI UNITS
R = 8.314471 J/K-mol (universal gas constant)t = temperature in °Ca0 = 10.7661 +/- 0.0075a1 = 0.02362 +/- 2.7x10⁻⁴
a2 = -1.42x10⁻⁵ +/- 2.7x10⁻⁶
MHFC-125 = 0.120022 kg/mol (molar mass)
or PI UNITS
R = 0.004381042 Btu/F-mol (universal gas constant)t = temperature in °Fa0 = 10.3417 +/- 0.0089a1 = 0.01313 +/- 1.5x10⁻⁴
a2 = -4.38x10⁻⁶ +/- 8.3x10⁻⁷
MHFC-125 = 0.264603 lbm/mol (molar mass)
The second, third, and fourth acoustic virial coefficients - beta, gamma, and delta - havebeen obtained from the pressure dependence of the speed of sound and are given in Table 48.
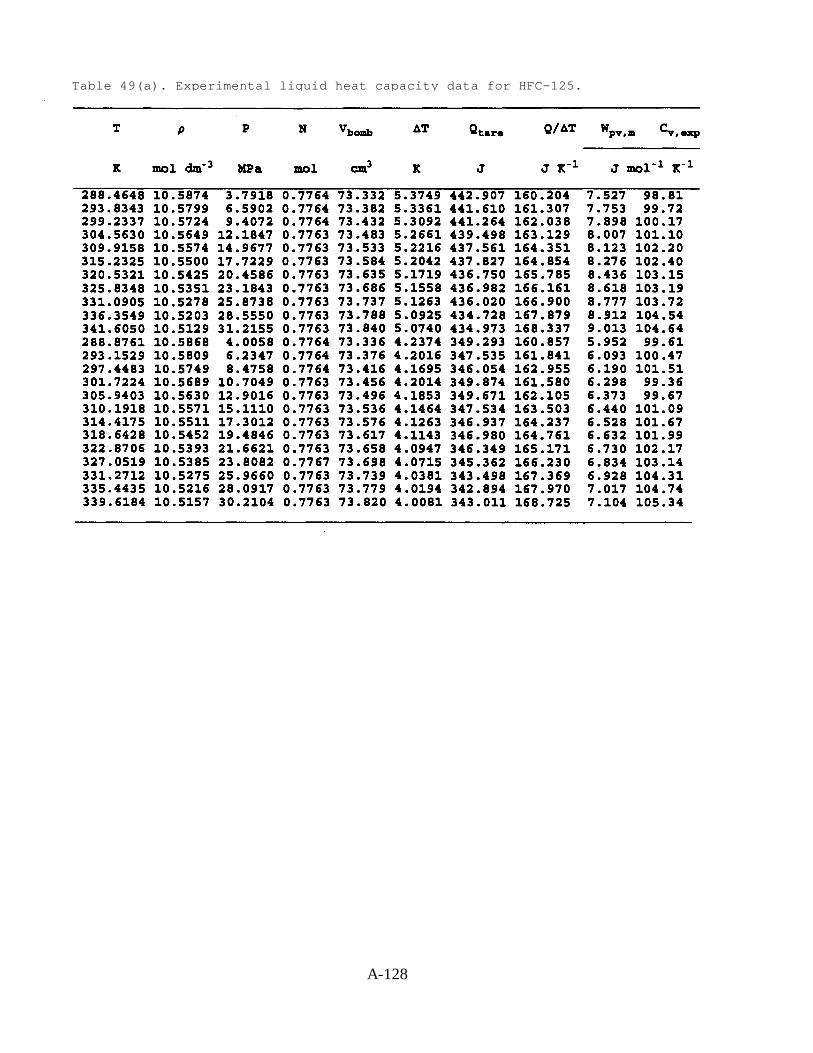
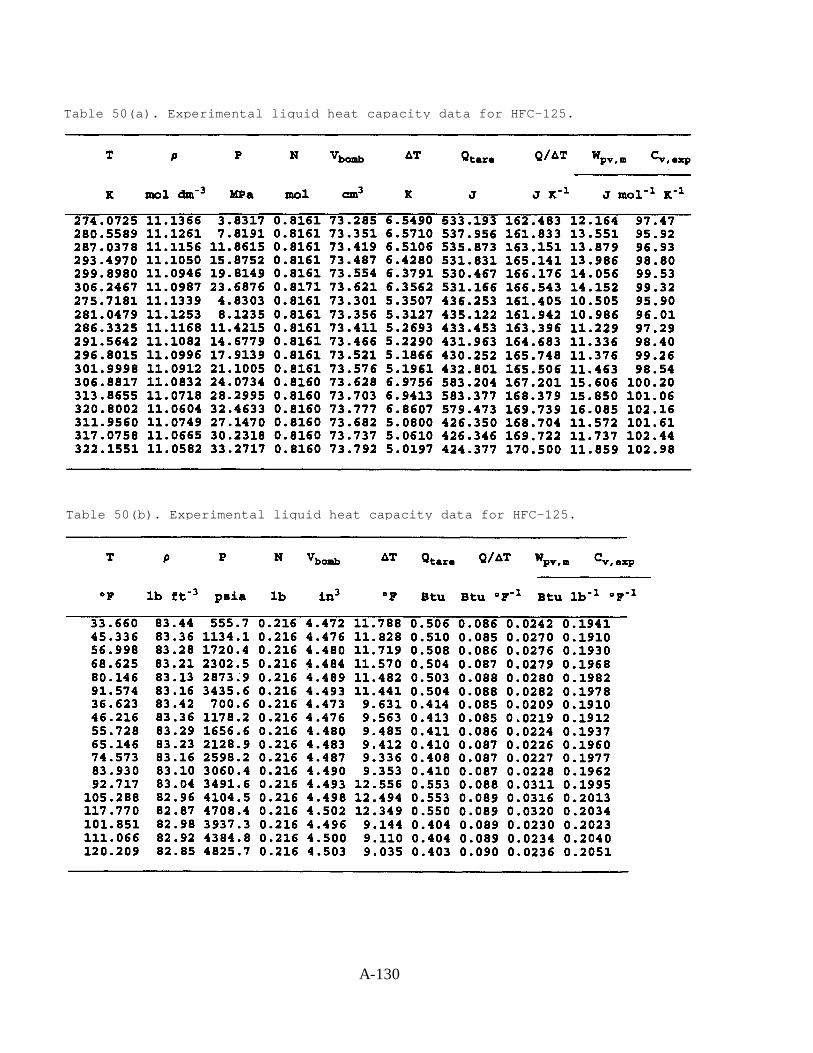
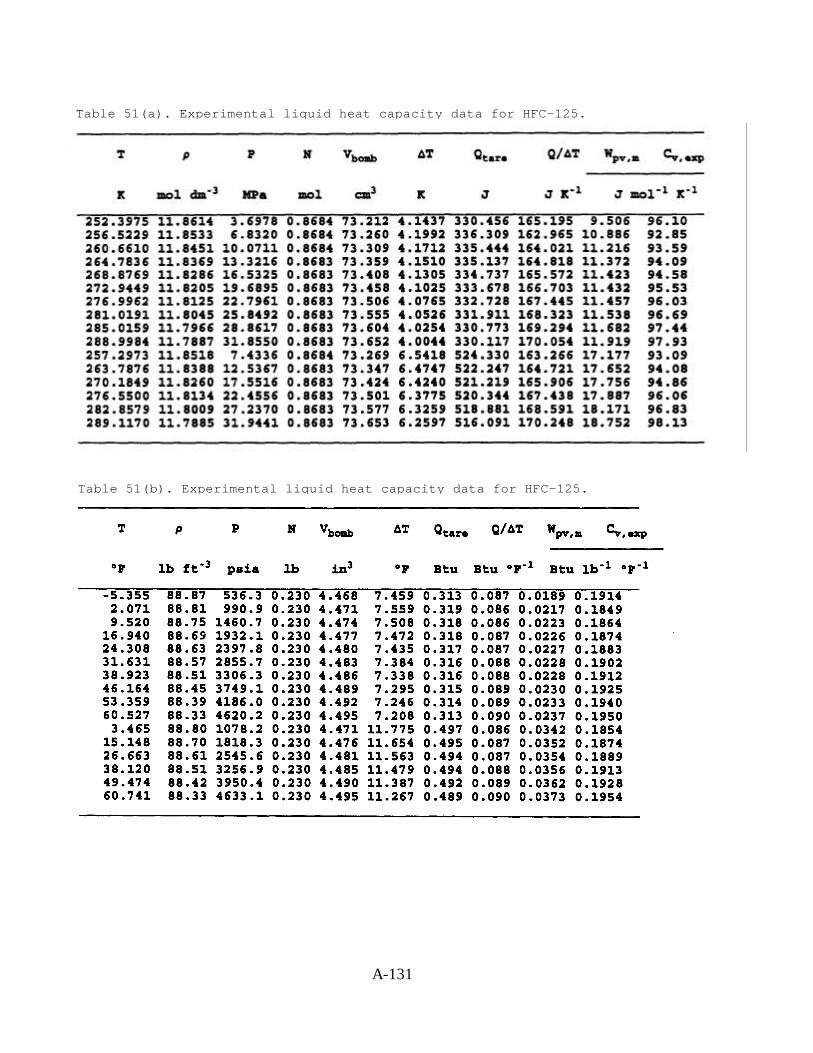
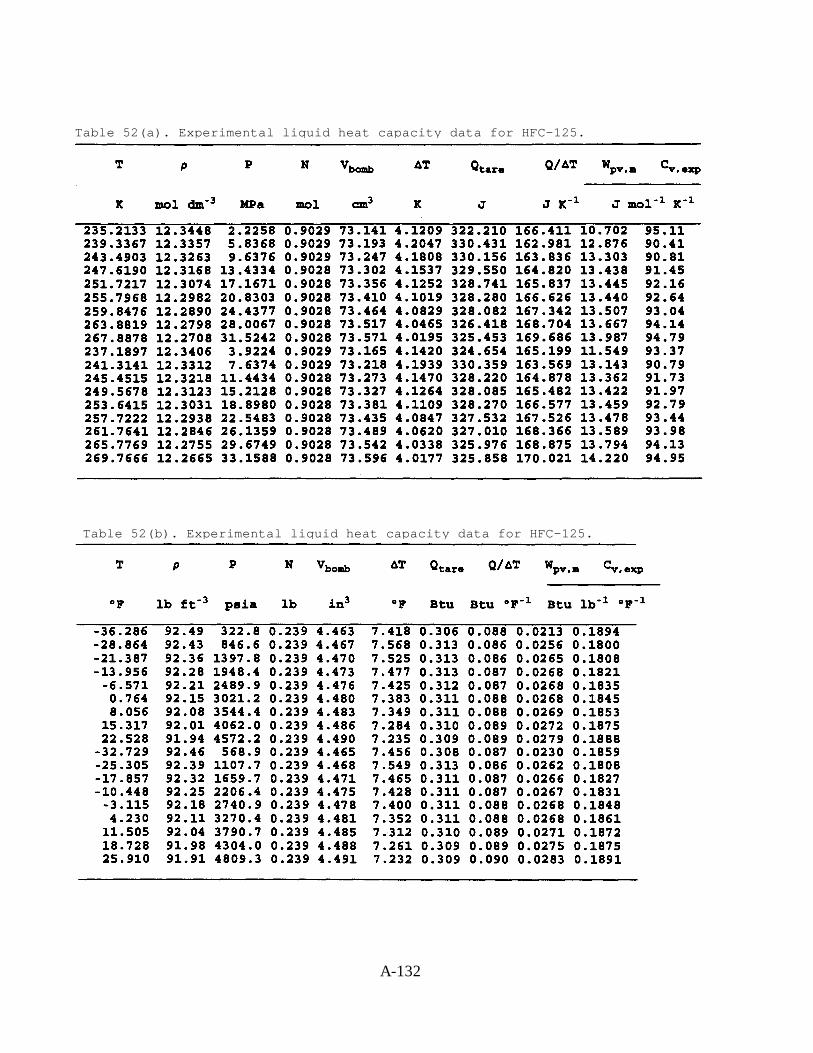
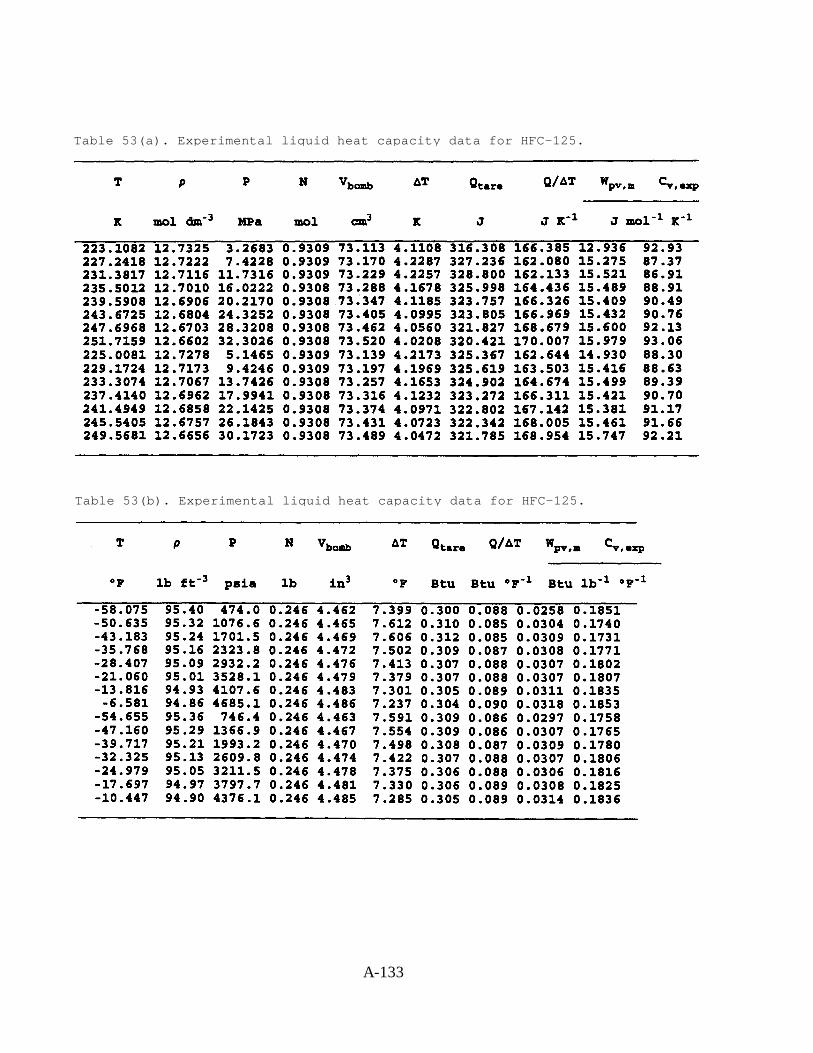
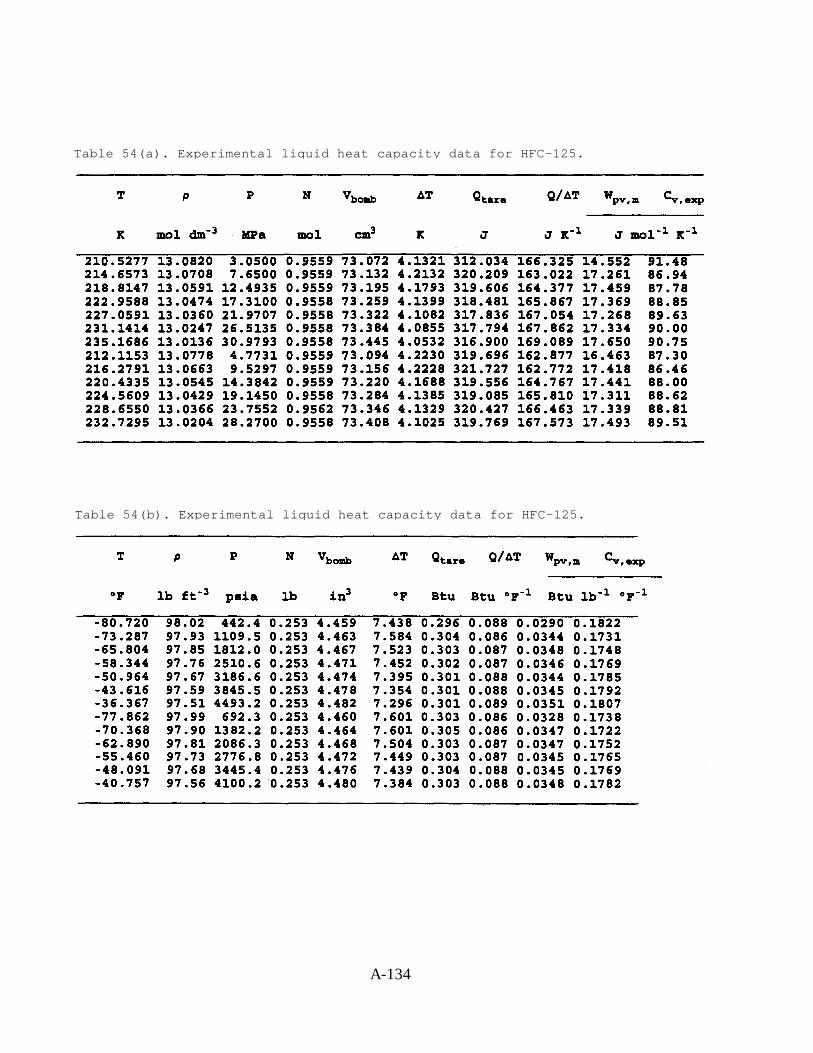
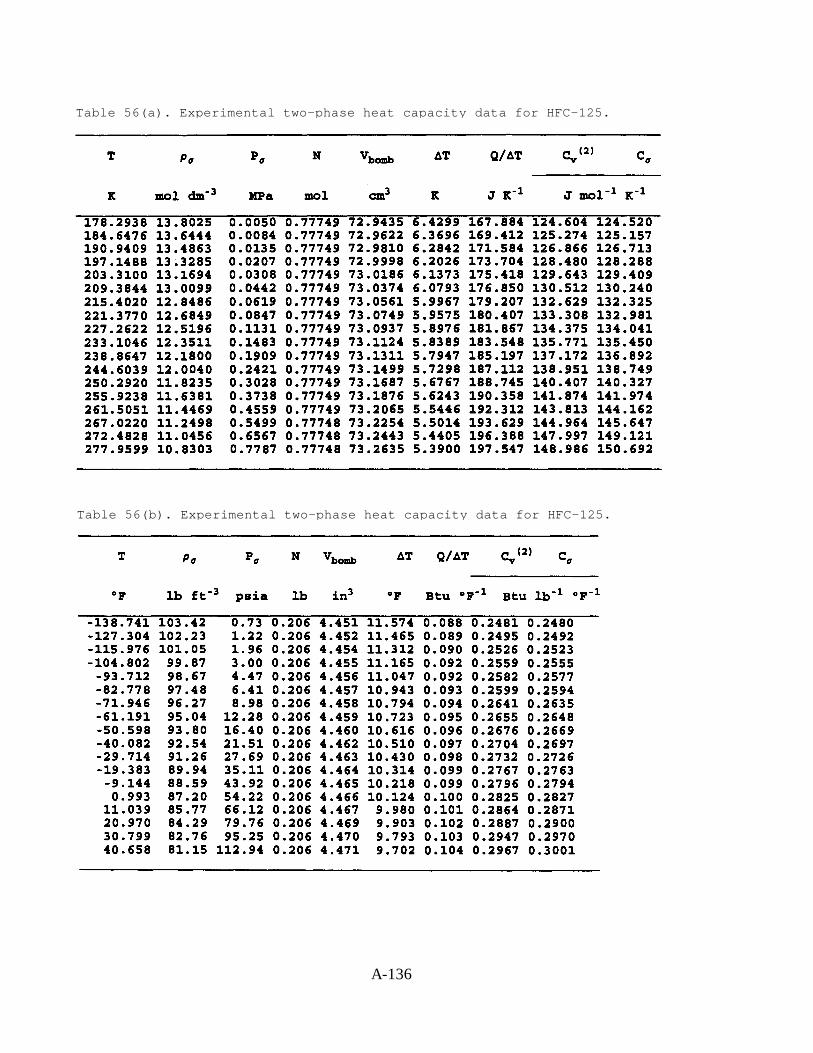
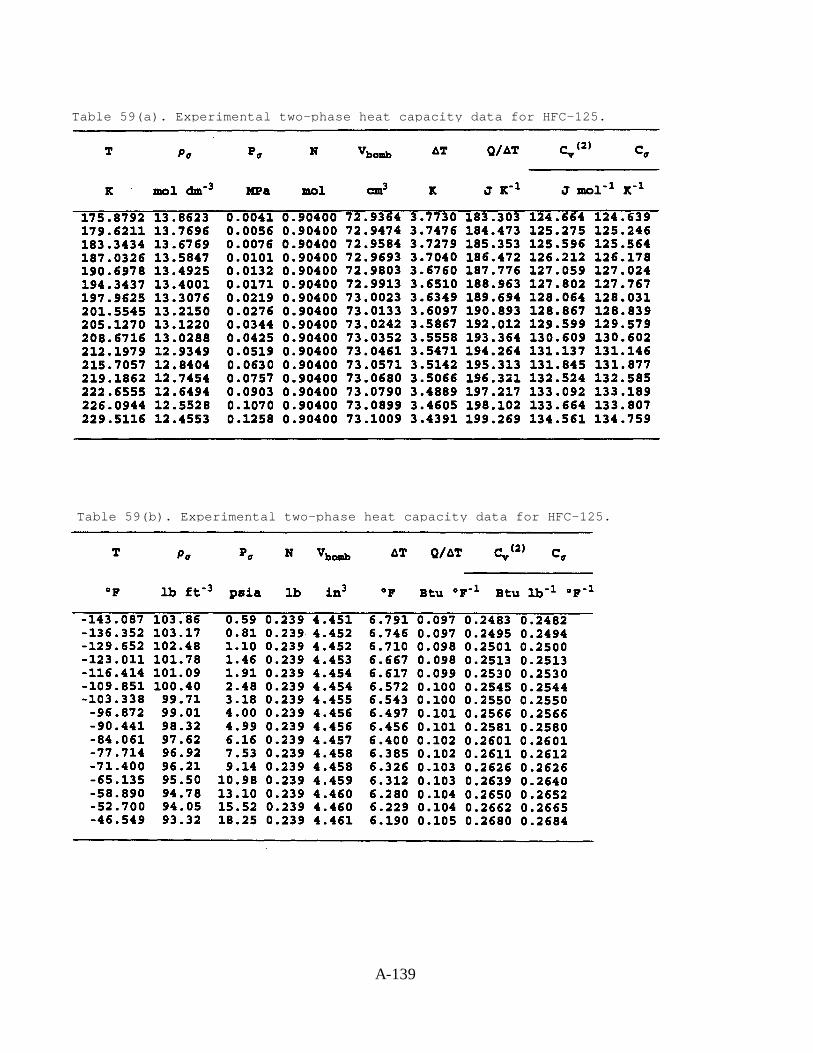
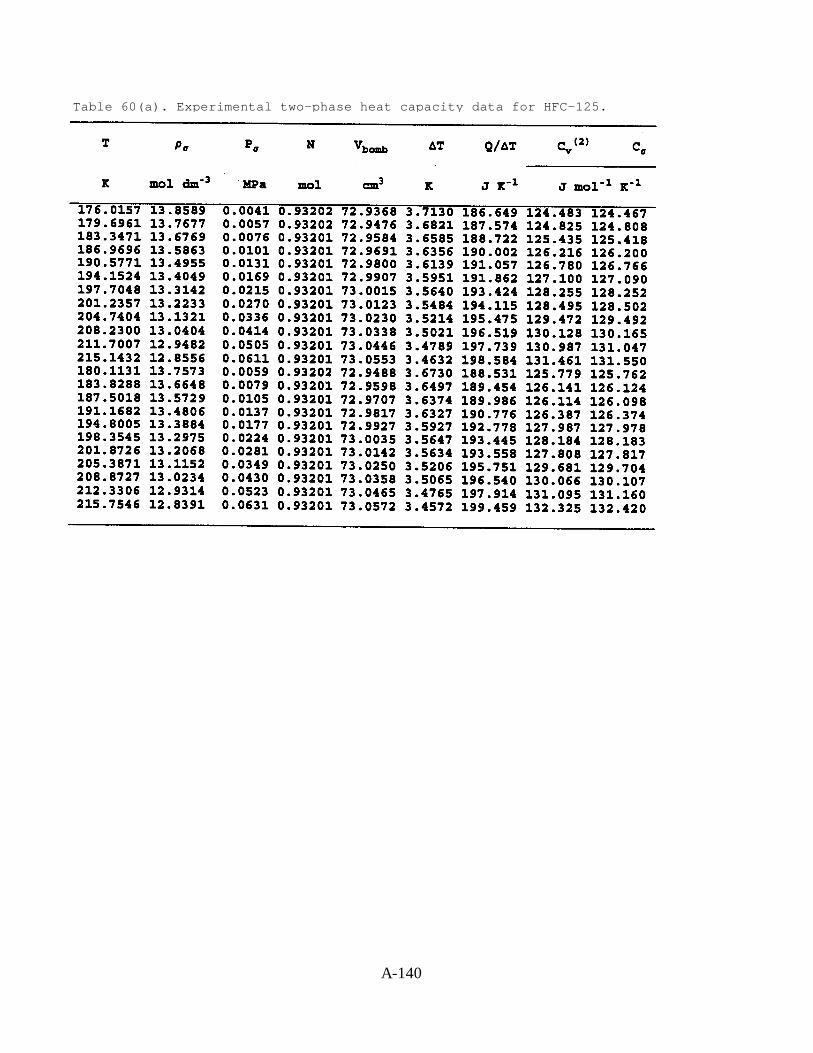
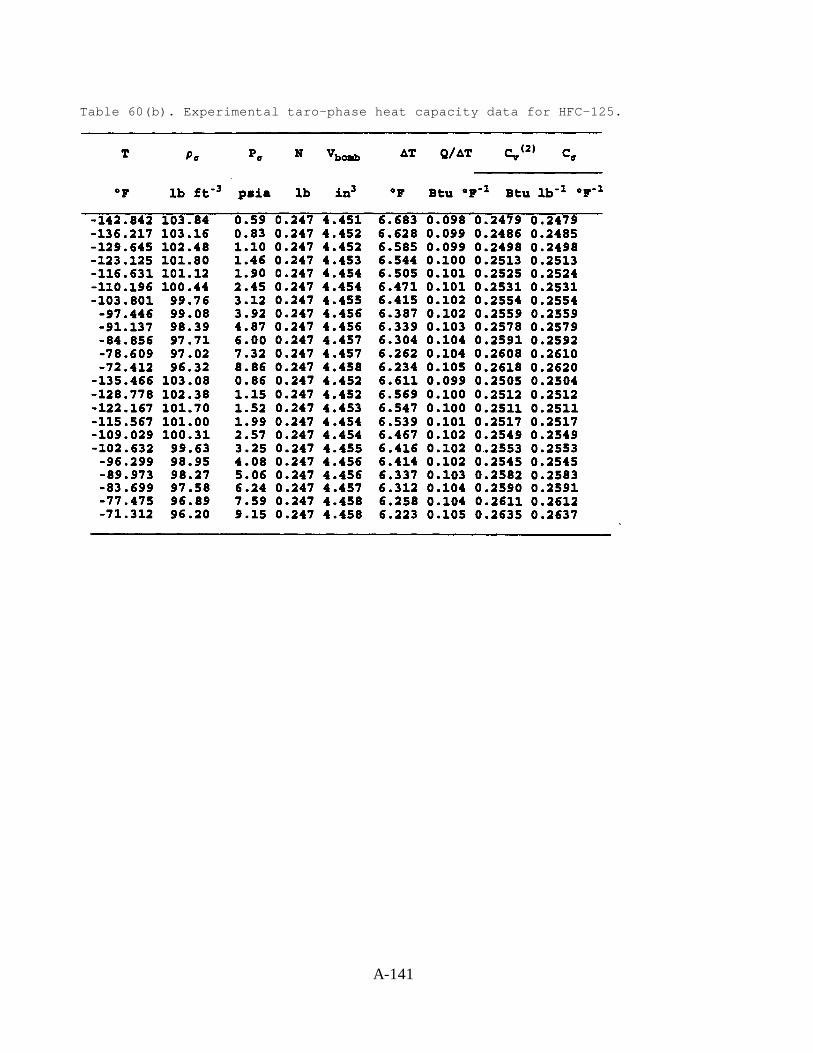
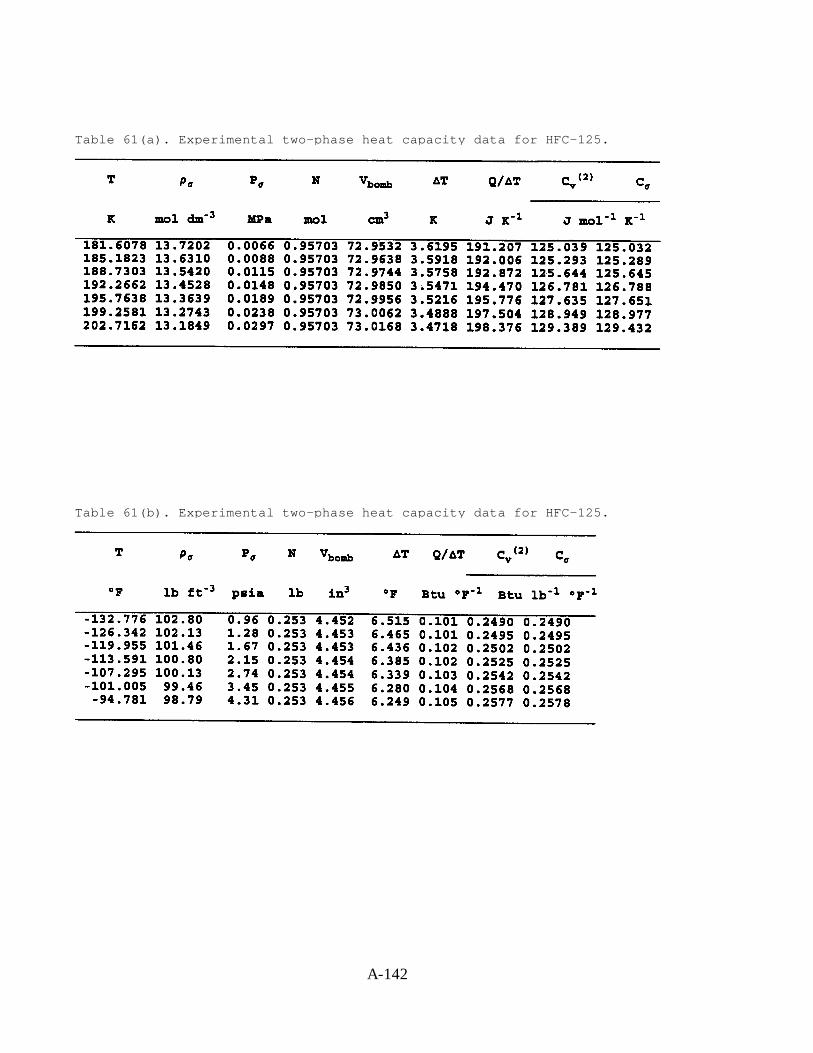
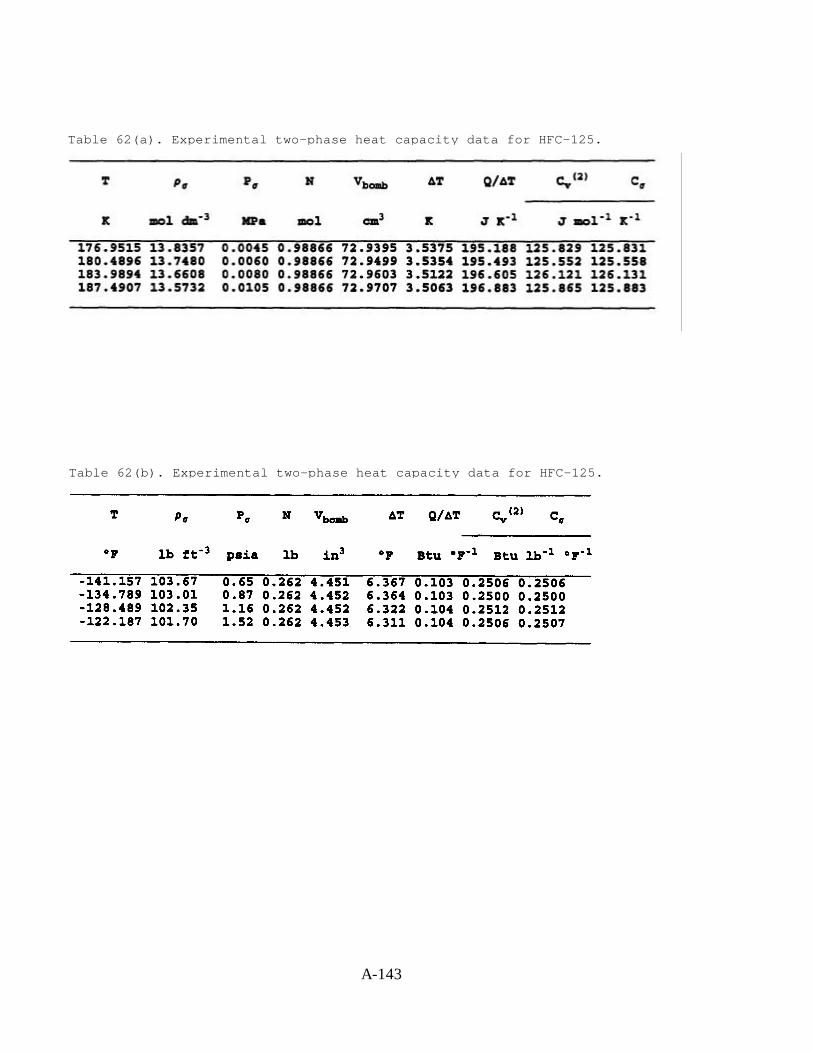
An adiabatic calorimeter has been used to measure molar heat capacity at constantvolume Cv for HFC-125. In total, 120 Cv values were measured in the liquid state and 100values were measured in the vapor + liquid two-phase region. The temperatures ranged from 176to 342 K (-143 to 156°F) with pressures to 35 MPa (5000 psi). The measured values are given inTables 49 through 55 for the liquid phase and Tables 56 through 62 for the two-phase region.
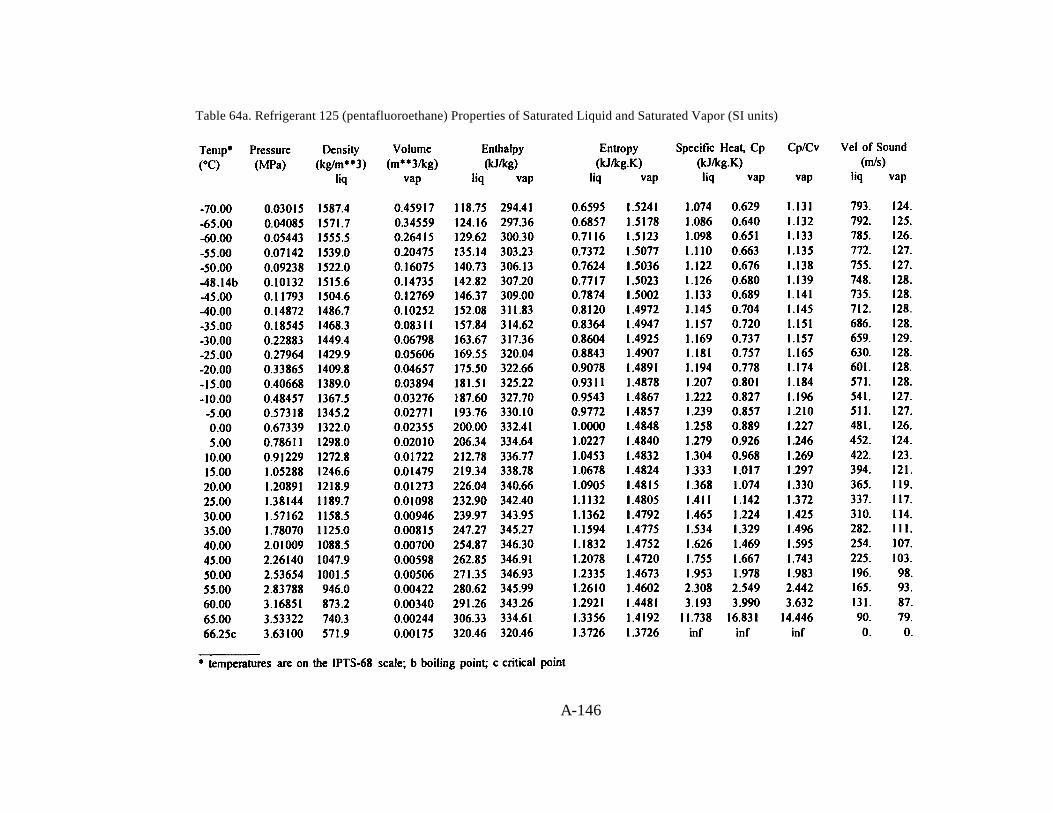
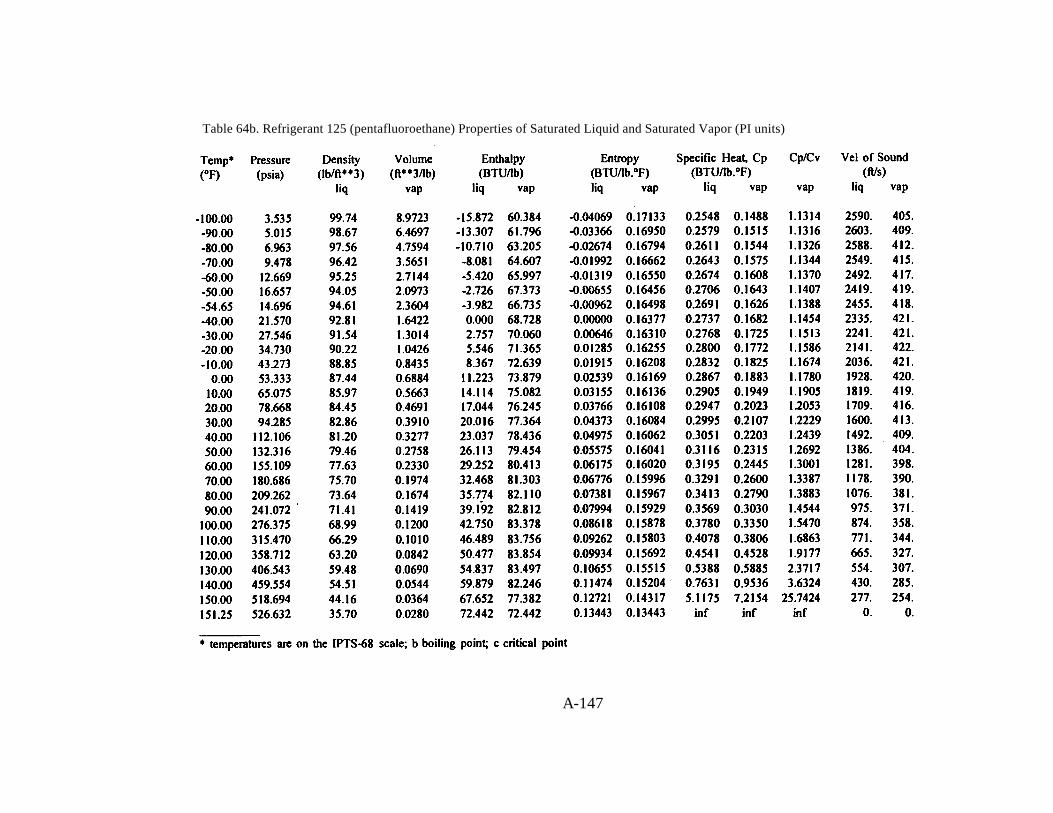
A 32-term MBWR equation of state for HFC-125 has been developed. It is valid attemperatures from 200 to 400 K (-100 to 260°F), and it appears to be reasonable uponextrapolation up to 500 K (440°F); the maximum pressure is 20 MPa (3000 psi). The techniquesand types of data used in the fit are similar to those for HFC-32 described above. Table 63 givesthe coefficients to the equation of state, and Table 64 gives the saturation properties calculatedwith the equation of state. Figures 17 through 21 compare the values of various propertiescalculated with the MBWR equation to the experimental values used in the fit. This MBWRequation should be adequate for all refrigeration calculations involving HFC-125; however, itspredictions may differ slightly from those of the MBWR equation of state that will beincorporated into version 4.0 of the REFPROP computer package, which will be released in thecoming months.
HCFC-123
An isochoric PVT apparatus has been used to measure the density of liquid HCFC-123 at105 points. The temperatures ranged from 176 to 380 K (-143 to 224°F) with pressures to 35MPa (5000 psi). The pressures, temperatures, and densities are presented in Table 65.
7
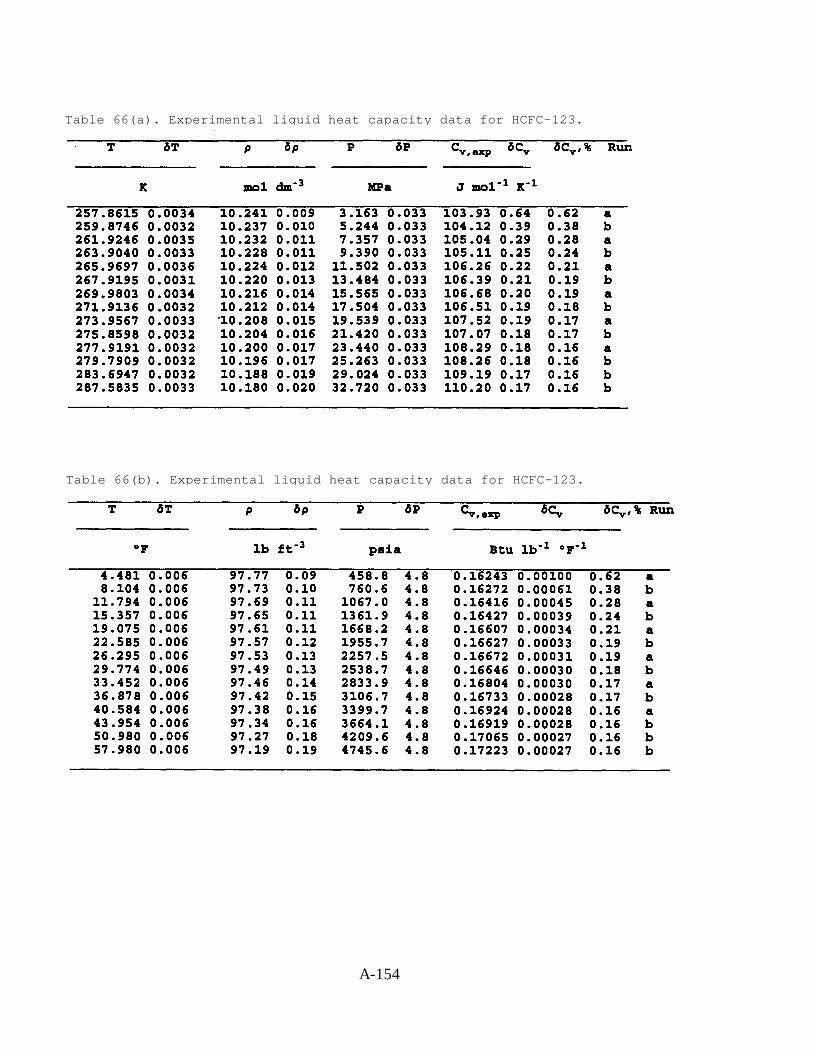
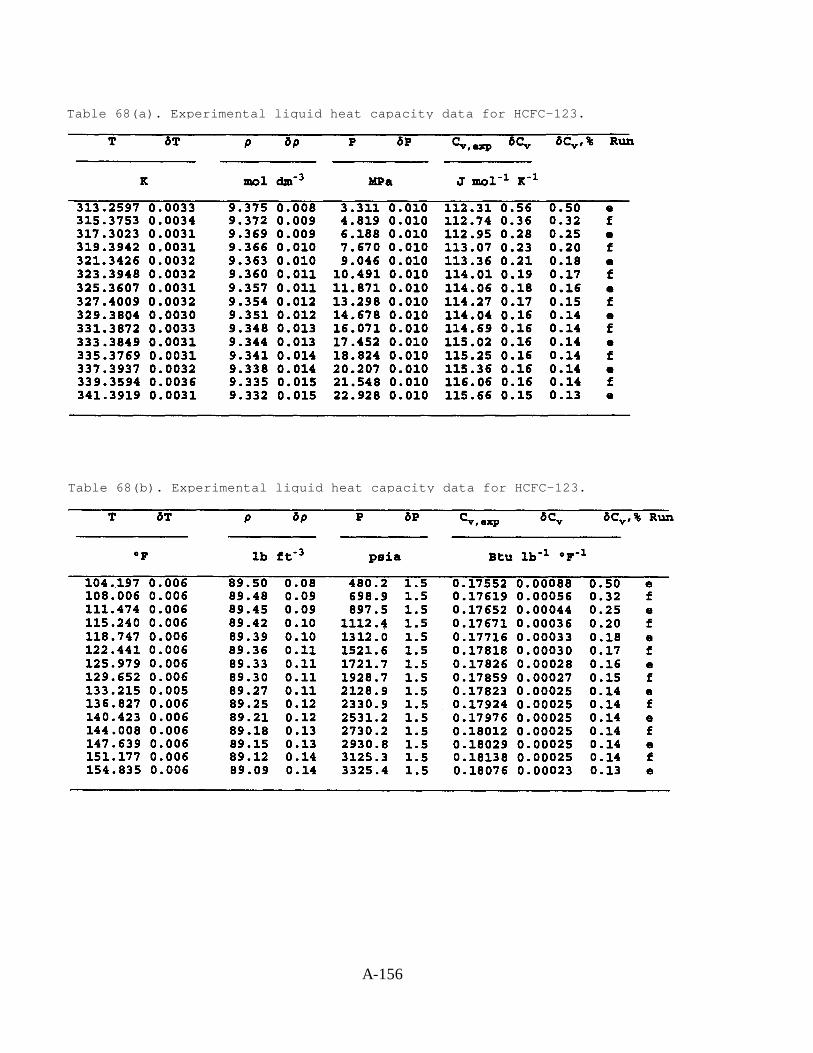
An adiabatic calorimeter has been used to measure the molar heat capacity at constantvolume Cv for HCFC-123. The measurements were carried out in the single-phase-liquid (79points) and saturated-liquid (92 points) states. Six isochores have been completed. Thetemperatures ranged from 167 to 341 K (-159 to 155 °F) with pressures up to 35 MPa (5000 psi).These measurements are presented in Tables 66 through 71 for the liquid phase and in Tables 72and 73 for the two-phase region.
The existing MBWR equation of state for HCFC-123 has been revised and considerablyimproved using the recently measured data. This work was prompted by an evaluation ofequations of state for HFC-134a and HCFC-123 carried out by Annex 18 of the InternationalEnergy Agency. Preliminary results of this comparison revealed weaknesses in some of thederived properties (specifically, speed of sound and heat capacity) for our previous HCFC-123MBWR fit. The revised equation is accurate for all thermodynamic properties from just above thetriple point to about 550 K (530°F) and at pressures up to 40 MPa (6000 psi). The techniques andtypes of data used in the fit are similar to those for HFC-32 described above. Table 74 gives thecoefficients to the equation of state. This MBWR equation for HCFC-123 will be used in version4.0 of the REFPROP computer package, which will be released in the coming months; it will beavailable as an option to the CSDM equation of state for HCFC-123.
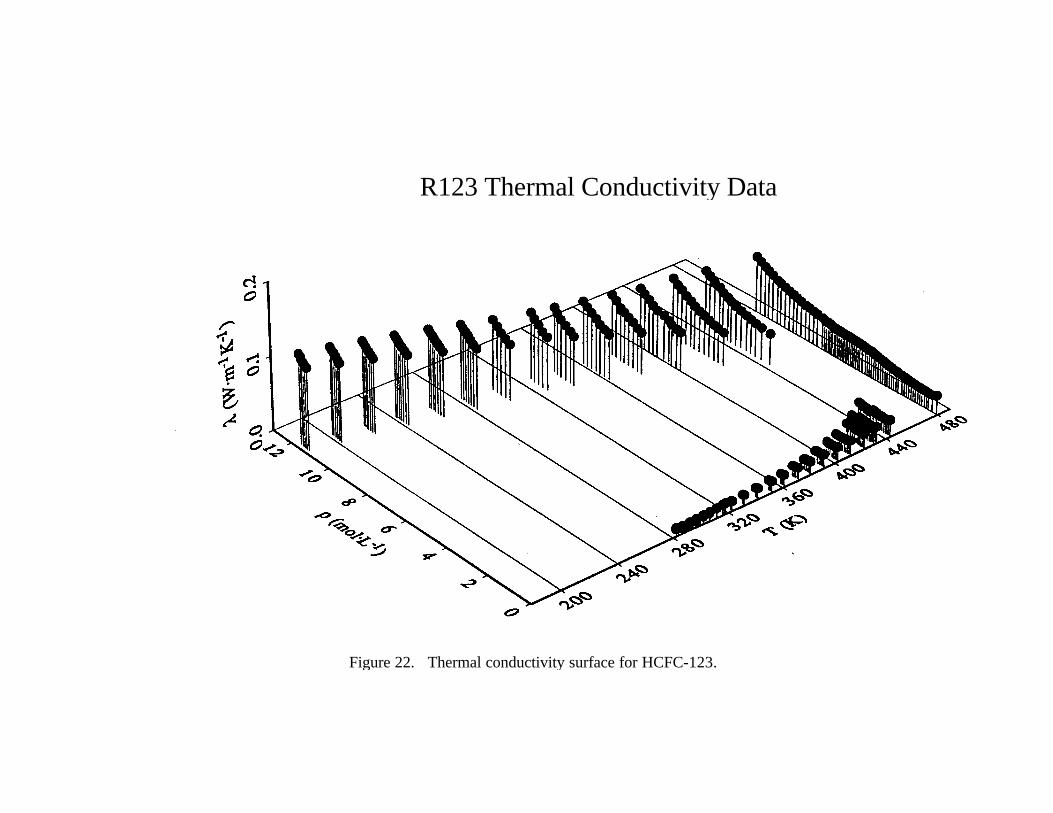
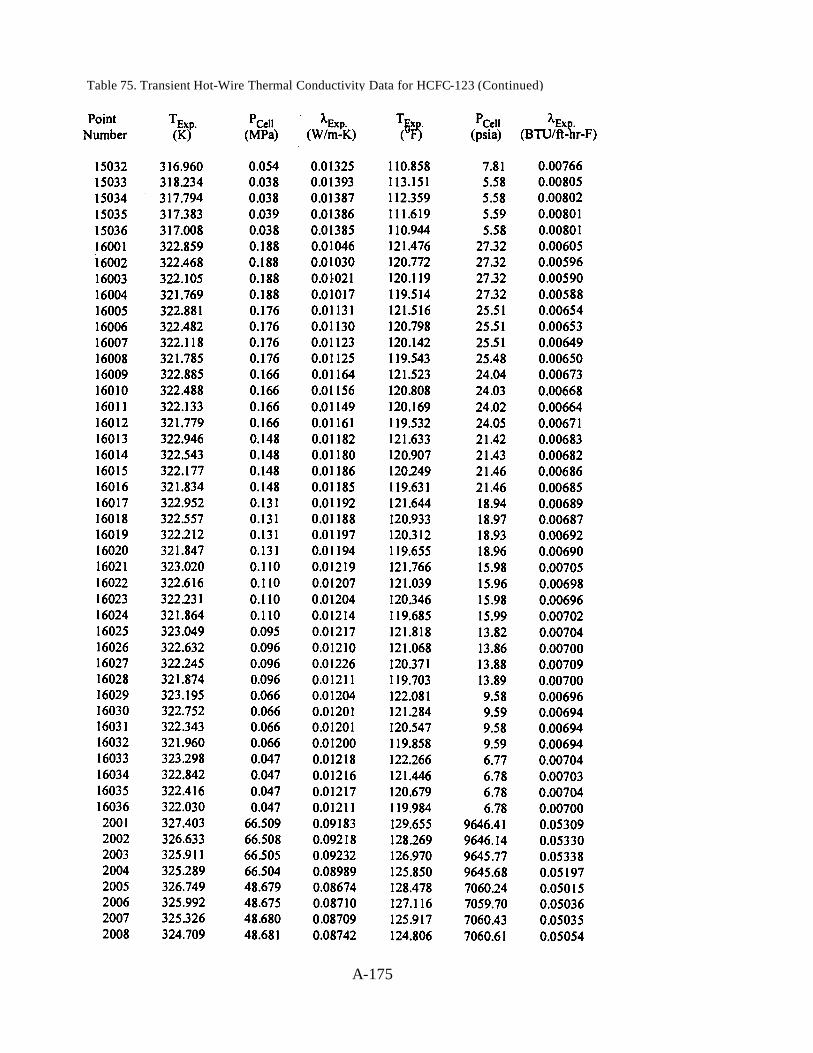
The low- and high-temperature transient hot-wire thermal conductivity instruments havebeen used to measure the thermal conductivity of HCFC-123 at 1618 points. Liquid-phase datahave been obtained in the temperature range from 180 to 440 K (-136 to 332°F) at pressures fromthe saturated vapor pressure to 70 MPa (10000 psi). Vapor-phase data have been obtained from290 to 449 K (62 to 332°F). Supercritical data have been obtained at 480 K (405°F). The resultsof the analysis of these 1618 transient hot-wire measurements are given in Table 75. A plot of theentire thermal conductivity surface is provided for reference in Figure 22. The vapor-phasethermal conductivity of HCFC-123 is shown in Figure 23. It appears to be quite consistent withthe supercritical isotherm.
The thermal conductivity data have been correlated as described in Appendix B. Thefluid-specific information required for this correlation are the MBWR equation of state forHCFC-123 described above and the parameters provided in Table 76. Deviations of the values ofthermal conductivity calculated from the correlation from the experimental data used in the fit aregiven in Figure 24. The deviations are generally less than ± 5 % .
COMPLIANCE WITH AGREEMENT
NIST has complied with all terms of the grant agreement modulo small shifts in theestimated level of effort from one property and/or fluid to another.
PRINCIPAL INVESTIGATOR EFFORT
Dr. Richard F. Kayser is the NIST Principal Investigator for the MCLR program. Duringthe fifteen months of this project, Dr. Kayser devoted approximately four weeks to monitoringand reviewing the research, and preparing the quarterly and final report. The project involvesmultiple researchers and capabilities in Gaithersburg, MD and Boulder, CO.
8
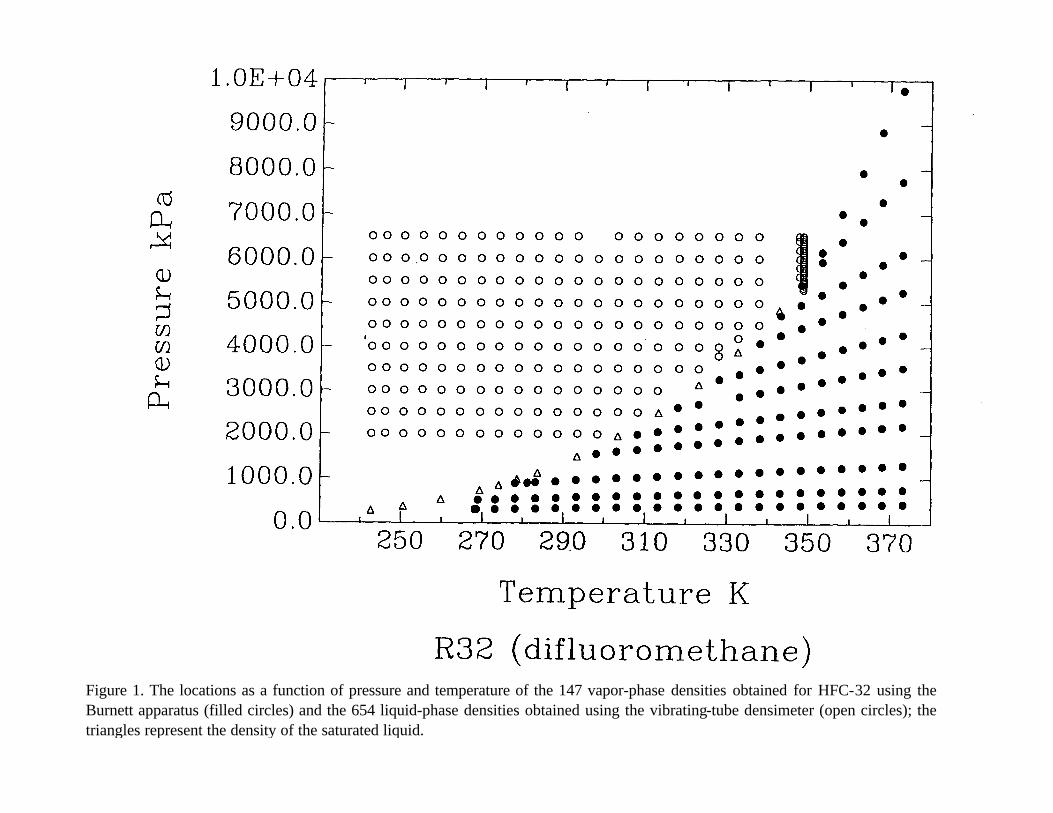
Figure 1. The locations as a function of pressure and temperature of the 147 vapor-phase densities obtained for HFC-32 using theBurnett apparatus (filled circles) and the 654 liquid-phase densities obtained using the vibrating-tube densimeter (open circles); thetriangles represent the density of the saturated liquid.
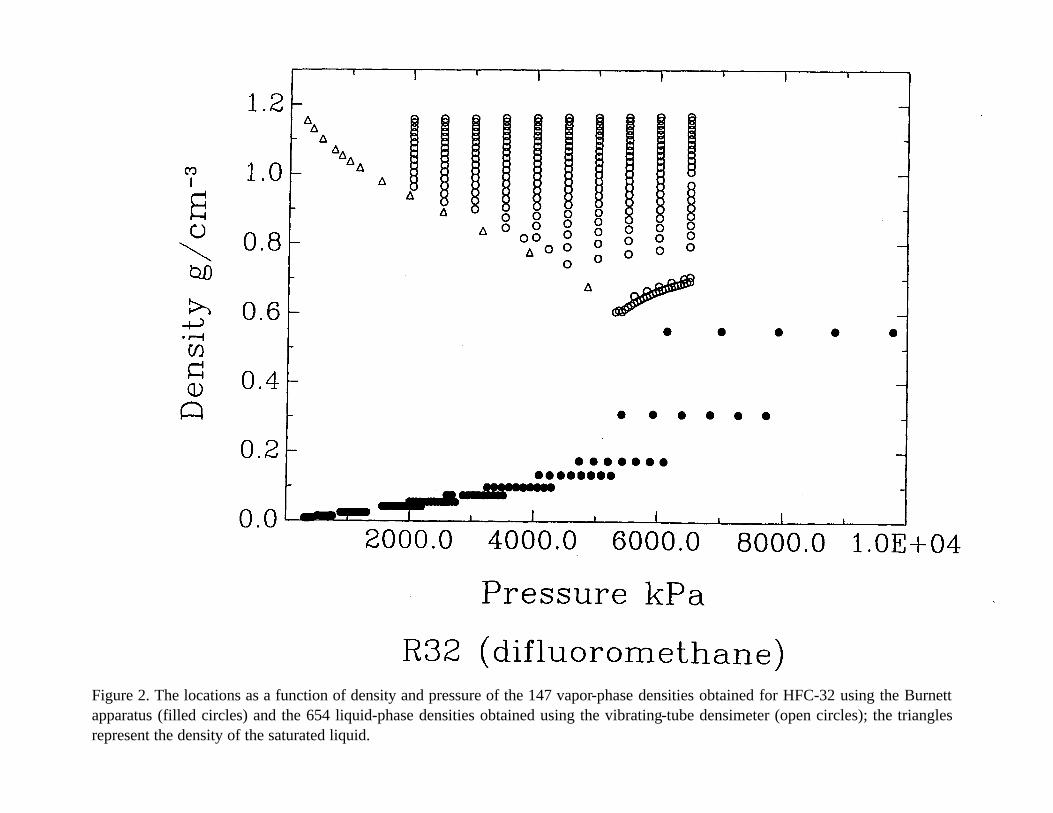
Figure 2. The locations as a function of density and pressure of the 147 vapor-phase densities obtained for HFC-32 using the Burnettapparatus (filled circles) and the 654 liquid-phase densities obtained using the vibrating-tube densimeter (open circles); the trianglesrepresent the density of the saturated liquid.
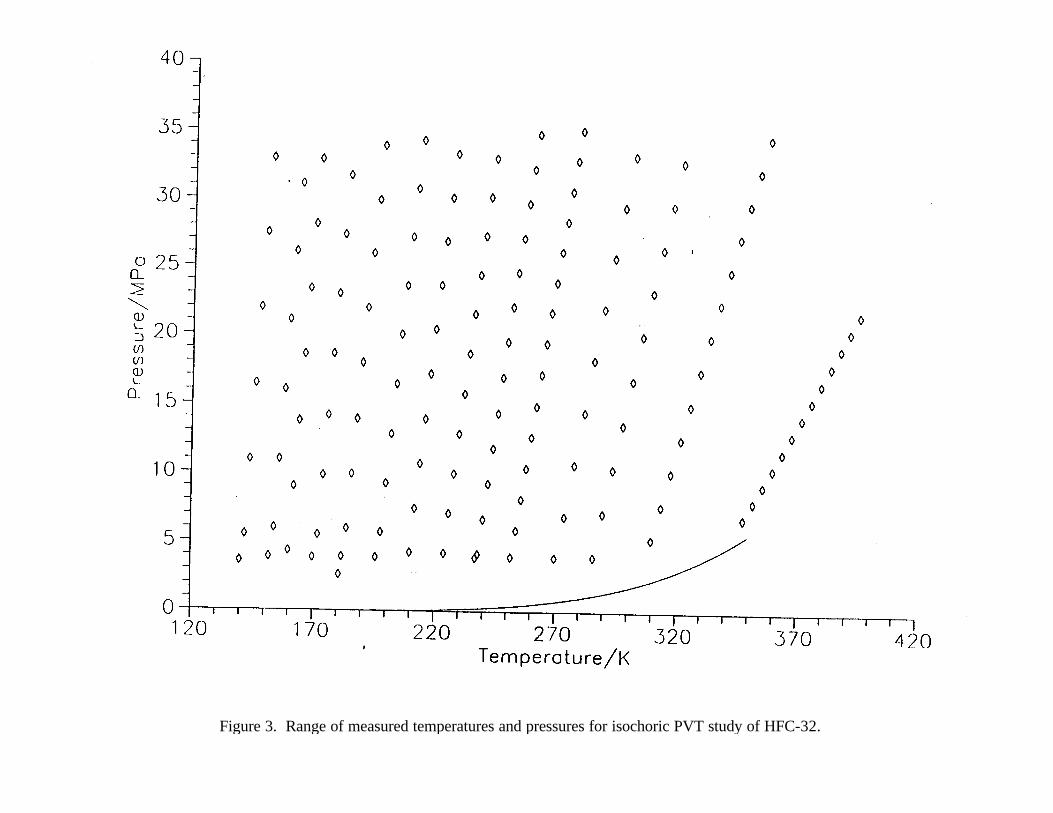
Figure 3. Range of measured temperatures and pressures for isochoric PVT study of HFC-32.
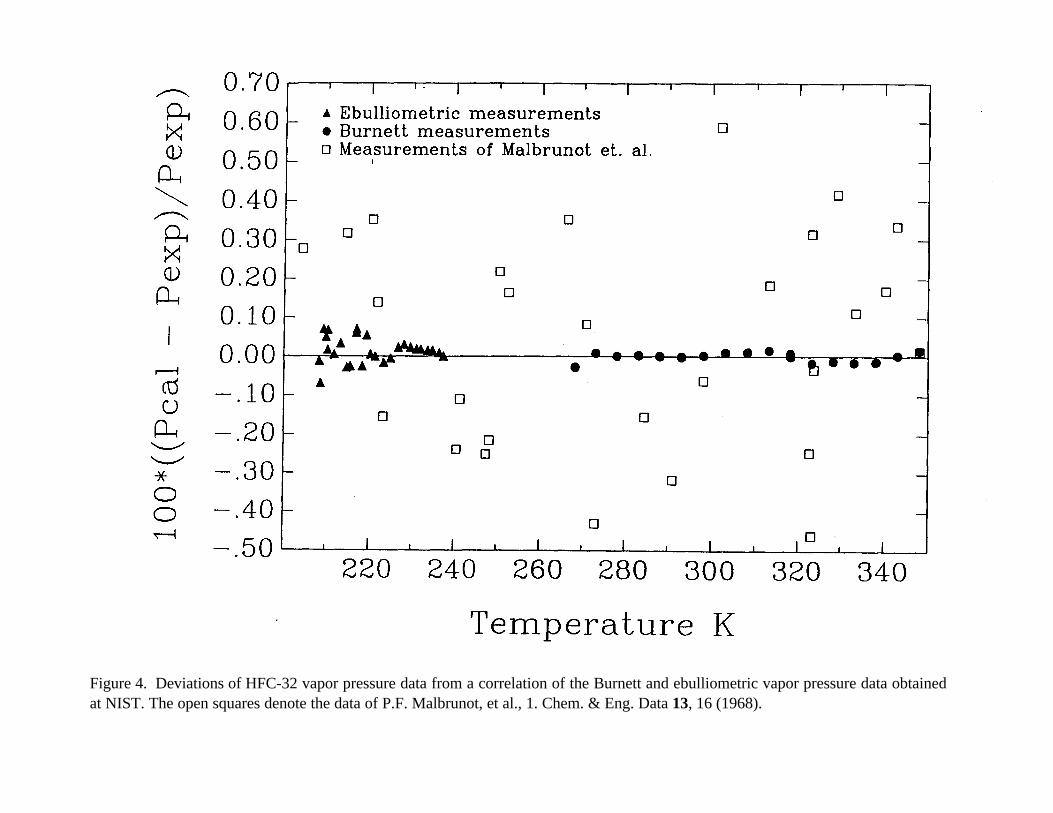
Figure 4. Deviations of HFC-32 vapor pressure data from a correlation of the Burnett and ebulliometric vapor pressure data obtainedat NIST. The open squares denote the data of P.F. Malbrunot, et al., 1. Chem. & Eng. Data 13, 16 (1968).
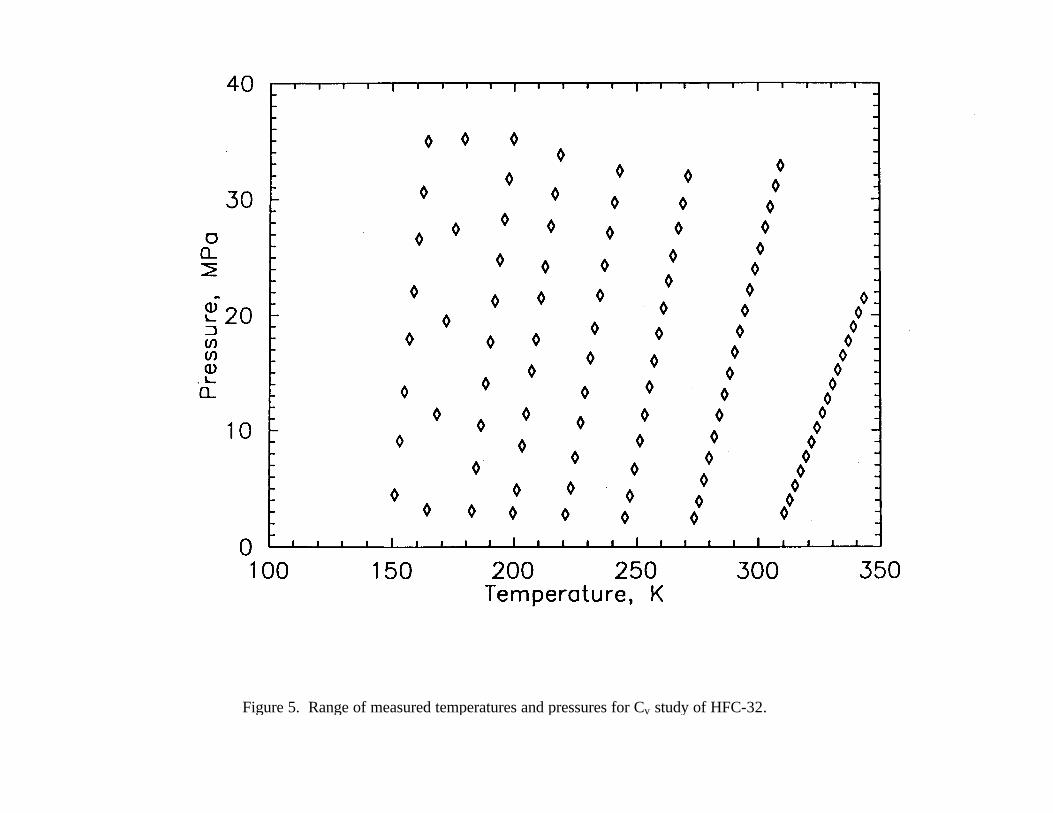
Figure 5. Range of measured temperatures and pressures for Cv study of HFC-32.
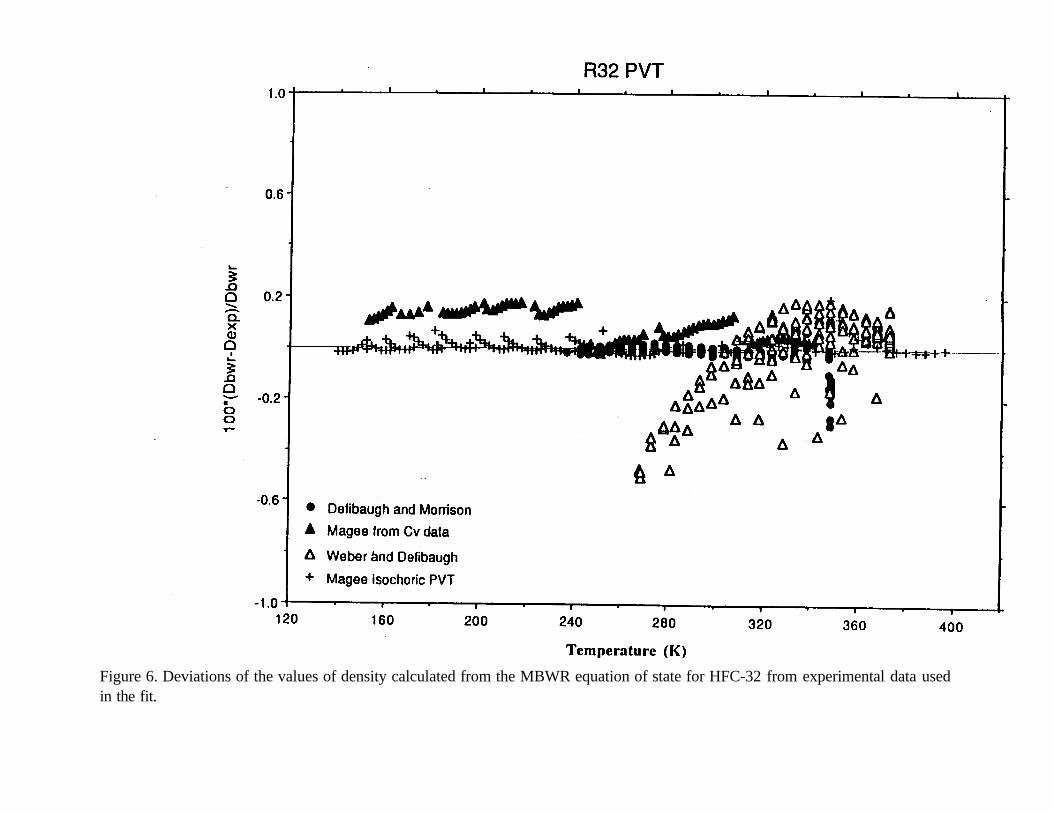
Figure 6. Deviations of the values of density calculated from the MBWR equation of state for HFC-32 from experimental data usedin the fit.
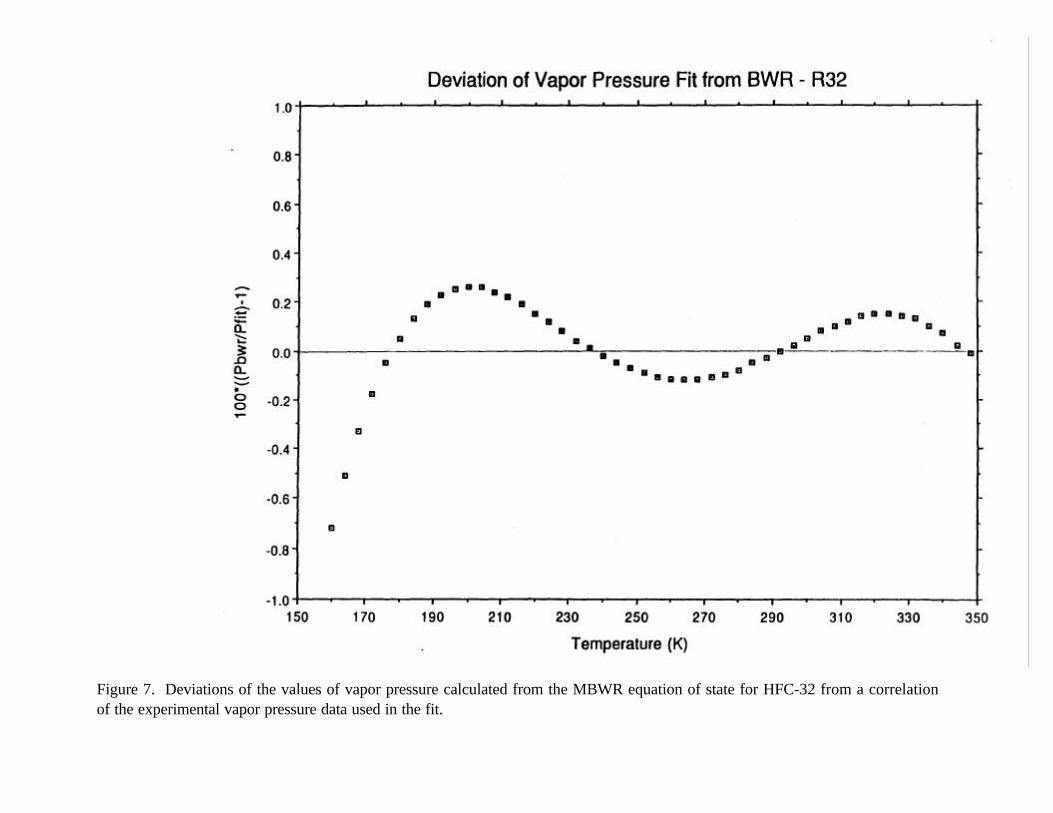
Figure 7. Deviations of the values of vapor pressure calculated from the MBWR equation of state for HFC-32 from a correlationof the experimental vapor pressure data used in the fit.
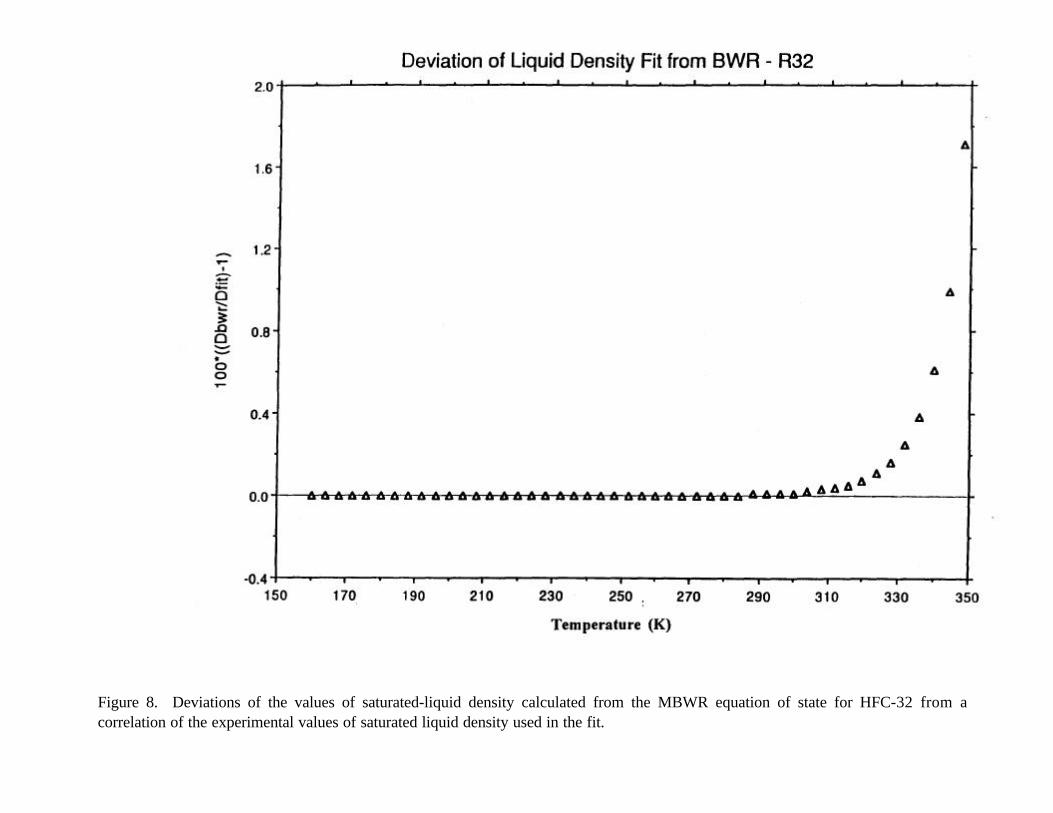
Figure 8. Deviations of the values of saturated-liquid density calculated from the MBWR equation of state for HFC-32 from acorrelation of the experimental values of saturated liquid density used in the fit.
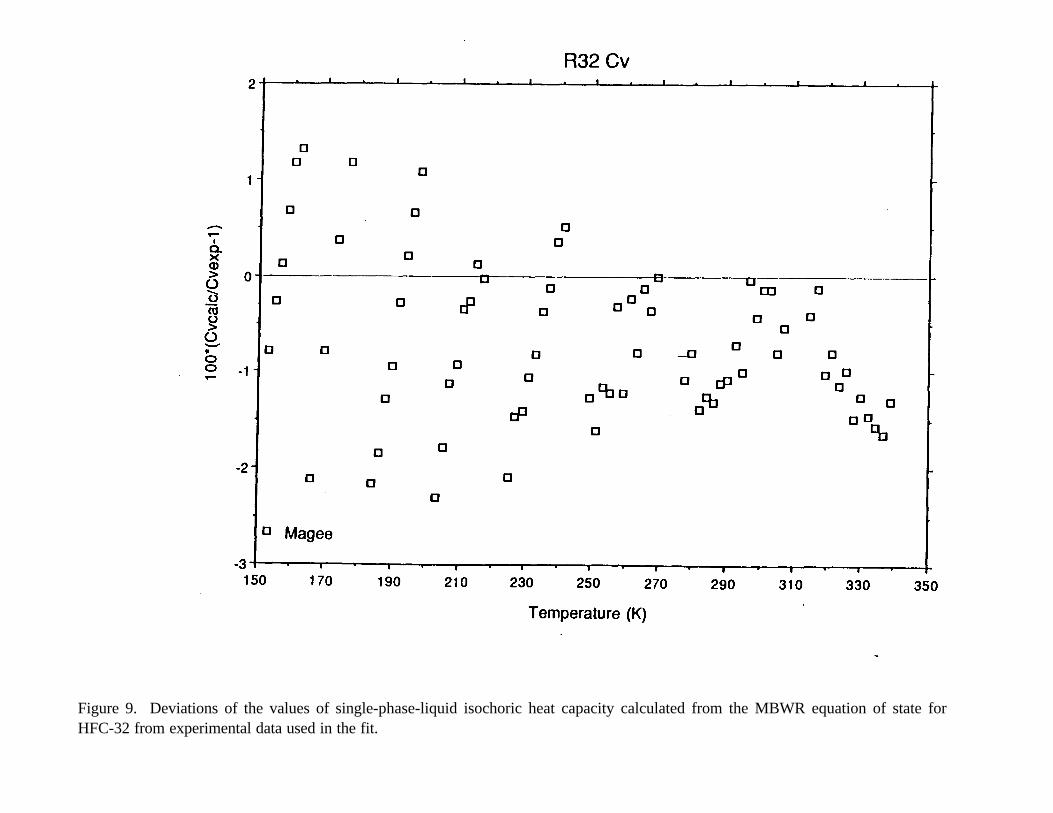
Figure 9. Deviations of the values of single-phase-liquid isochoric heat capacity calculated from the MBWR equation of state forHFC-32 from experimental data used in the fit.
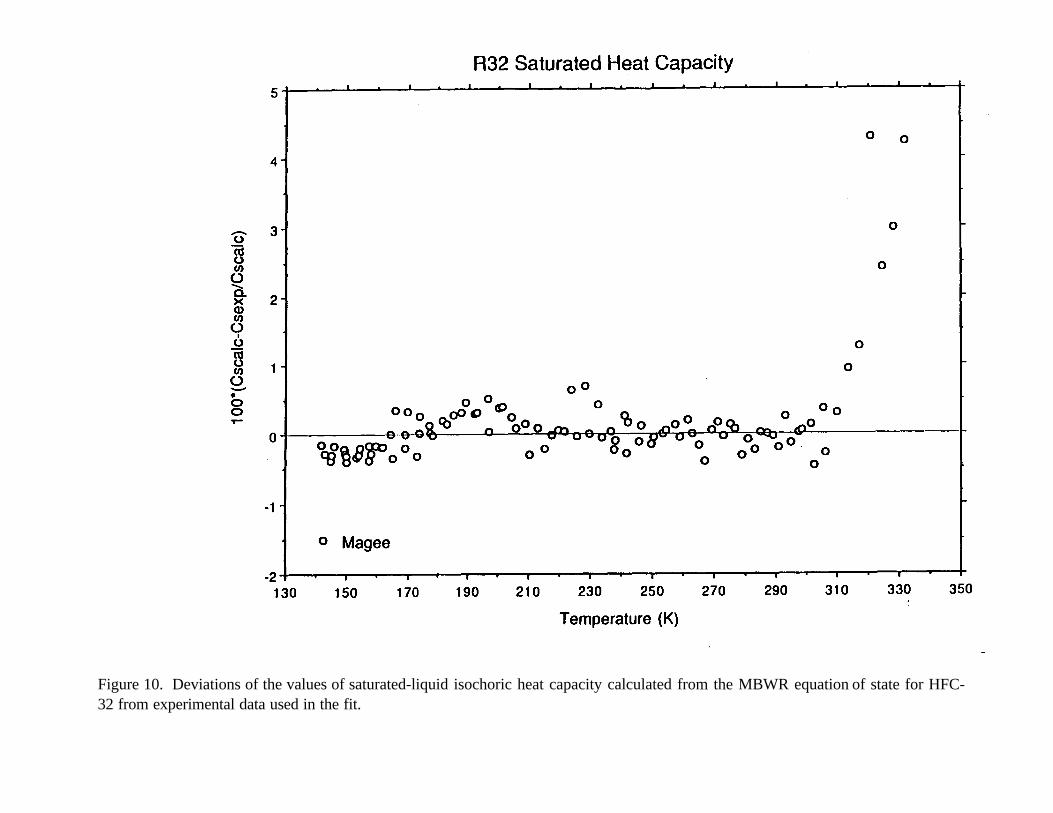
Figure 10. Deviations of the values of saturated-liquid isochoric heat capacity calculated from the MBWR equation of state for HFC-32 from experimental data used in the fit.
R32 Thermal Conductivity Data
Figure 11. Thermal conductivity surface for HFC-32.
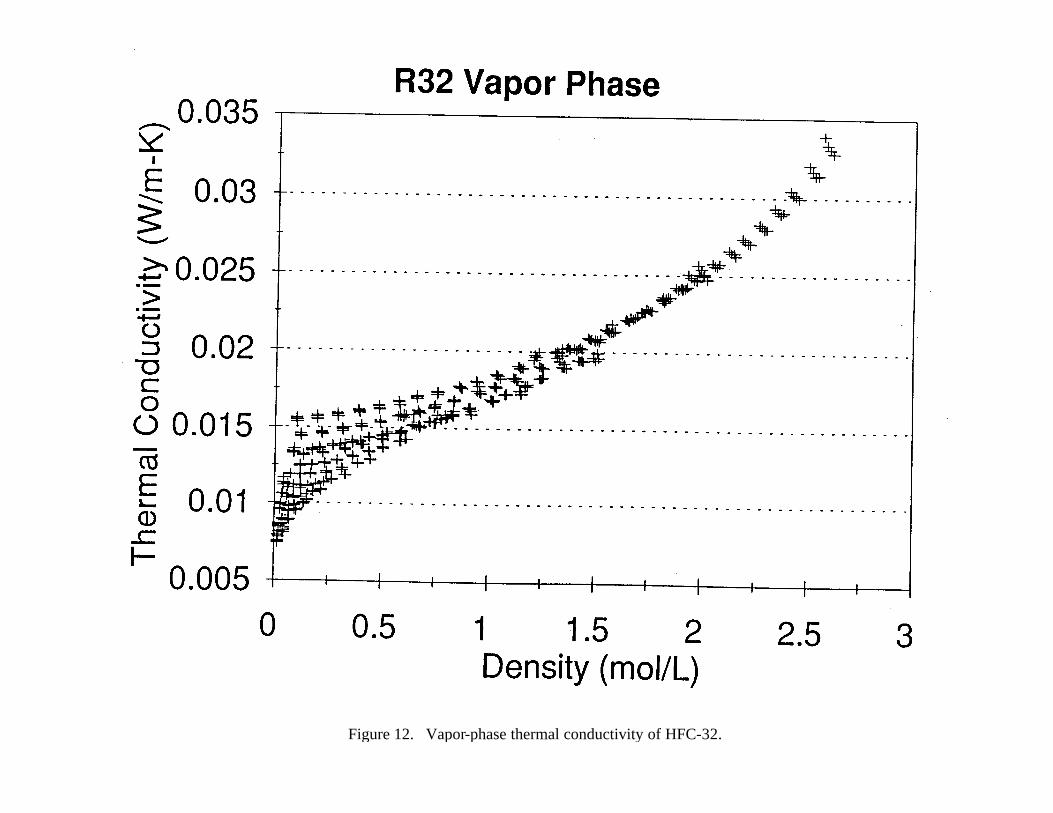
Figure 12. Vapor-phase thermal conductivity of HFC-32.

Figure 13. Deviations of the values of thermal conductivity calculated from the thermal conductivity correlation for HFC-32 fromexperimental data used in the fit.
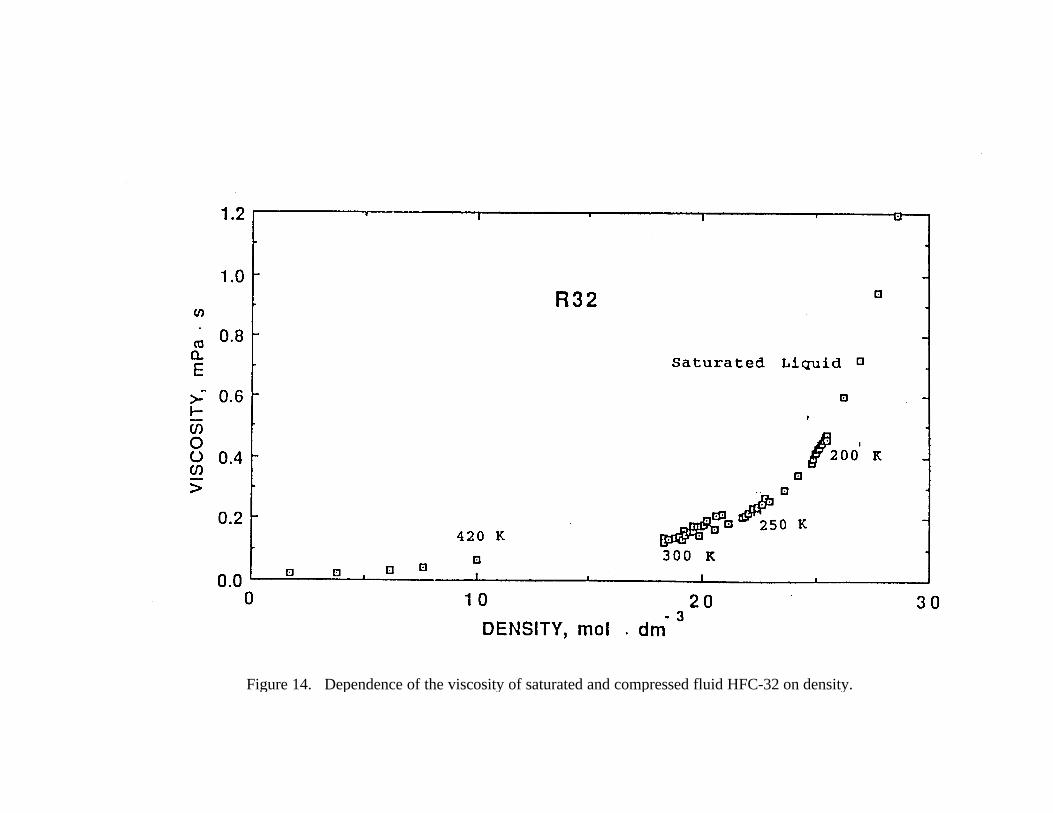
Figure 14. Dependence of the viscosity of saturated and compressed fluid HFC-32 on density.
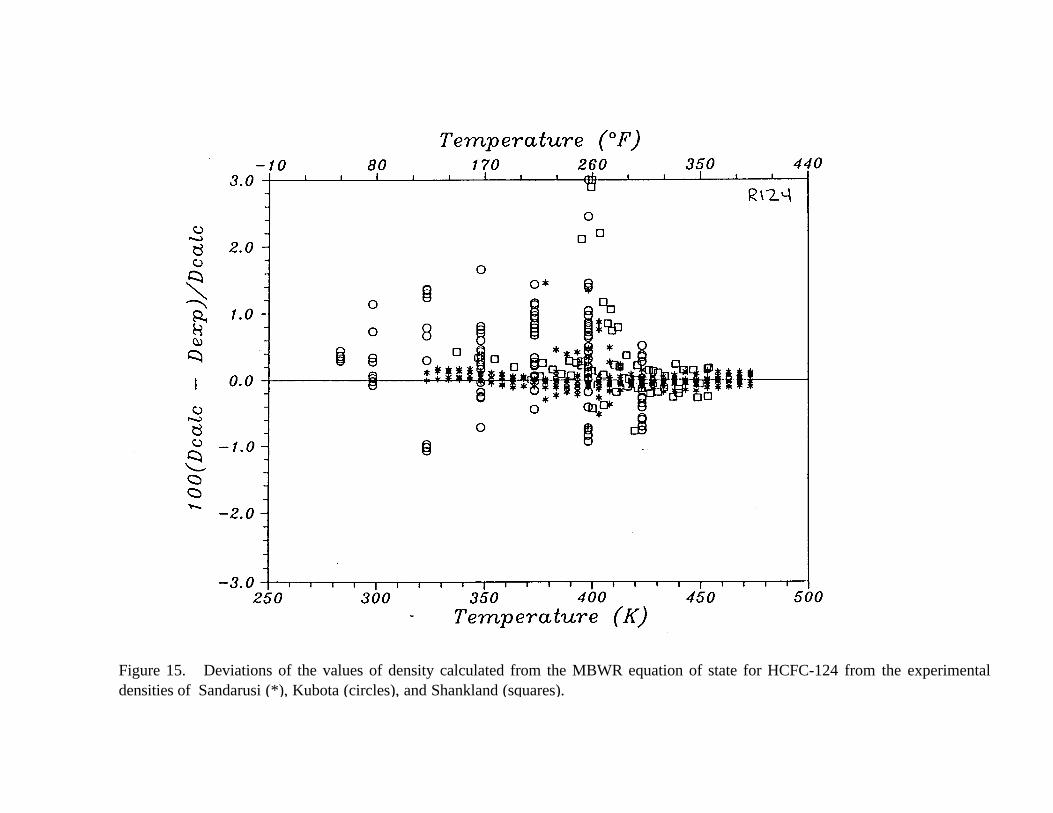
Figure 15. Deviations of the values of density calculated from the MBWR equation of state for HCFC-124 from the experimentaldensities of Sandarusi (*), Kubota (circles), and Shankland (squares).
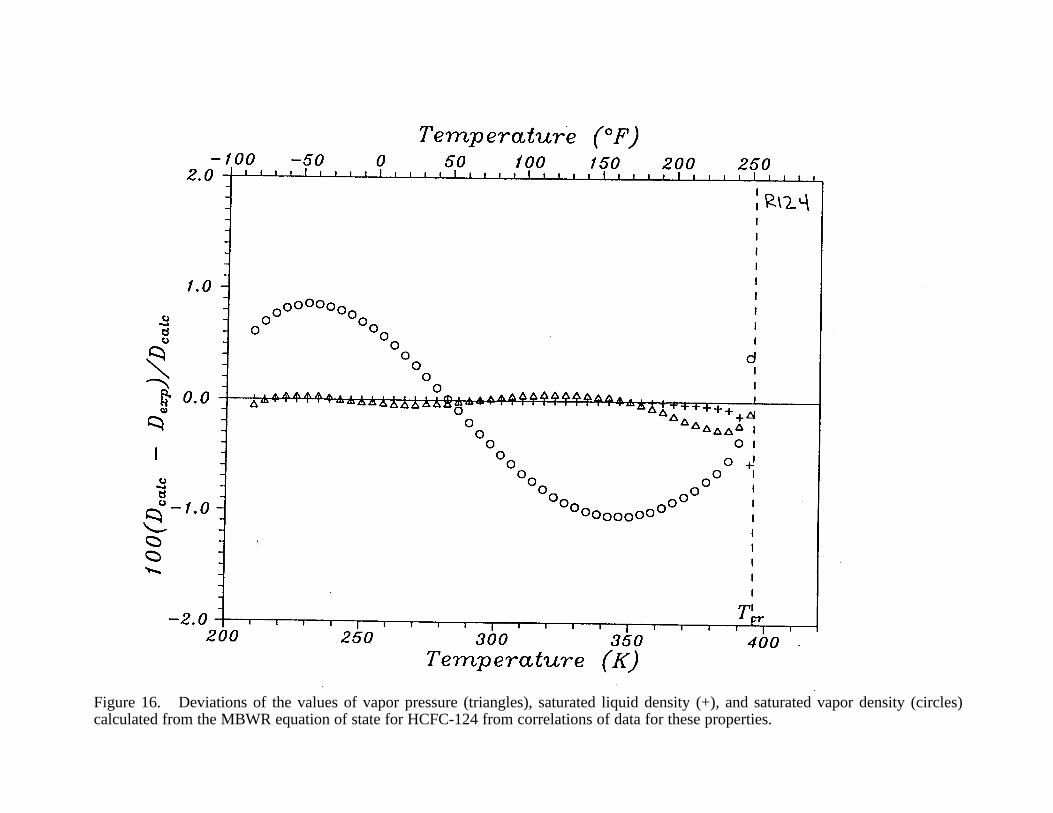
Figure 16. Deviations of the values of vapor pressure (triangles), saturated liquid density (+), and saturated vapor density (circles)calculated from the MBWR equation of state for HCFC-124 from correlations of data for these properties.
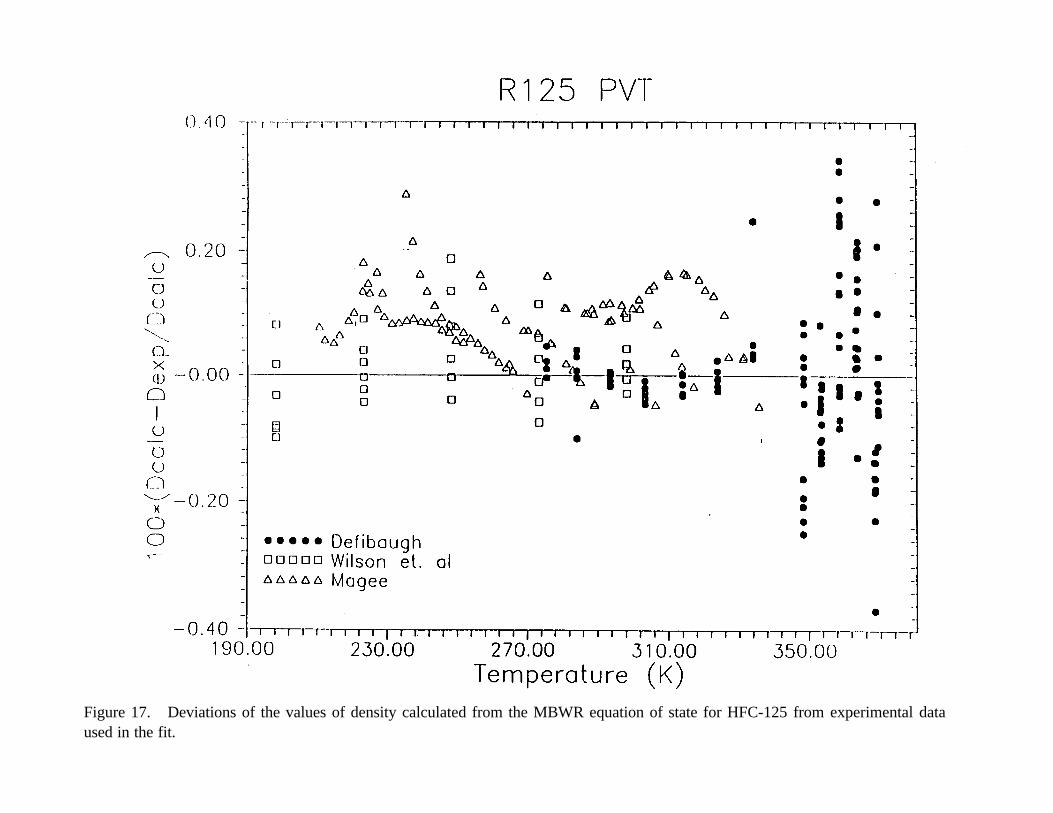
Figure 17. Deviations of the values of density calculated from the MBWR equation of state for HFC-125 from experimental dataused in the fit.
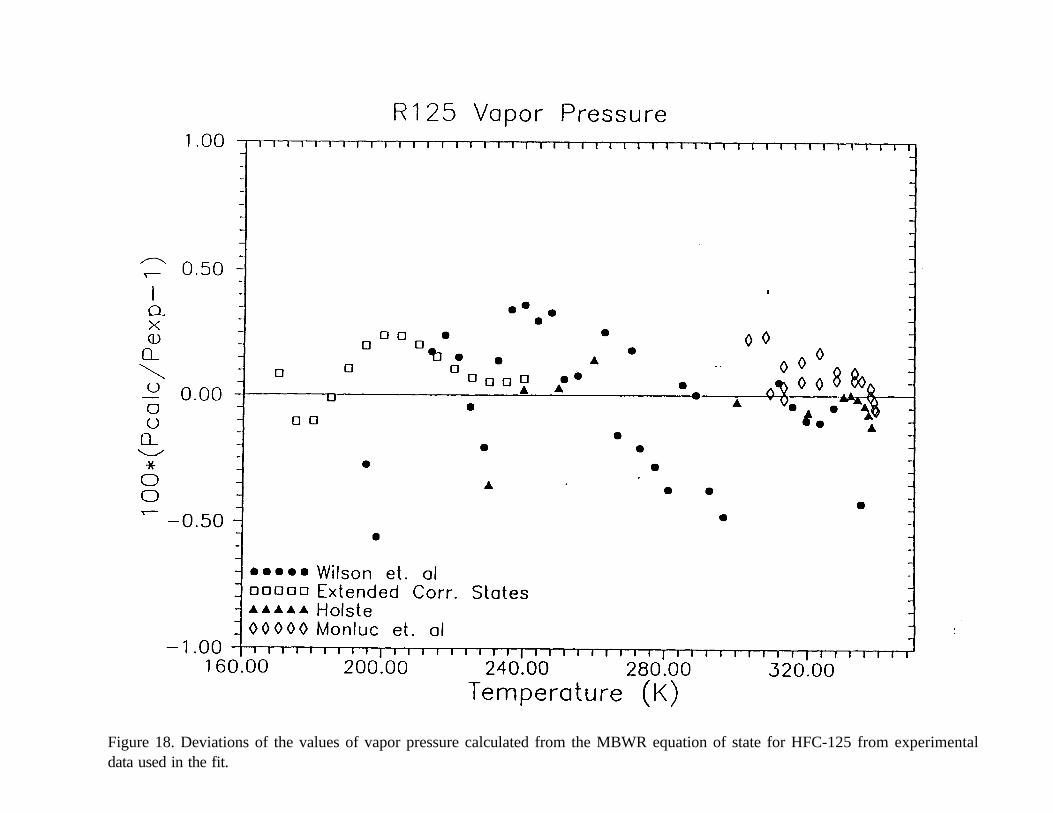
Figure 18. Deviations of the values of vapor pressure calculated from the MBWR equation of state for HFC-125 from experimentaldata used in the fit.
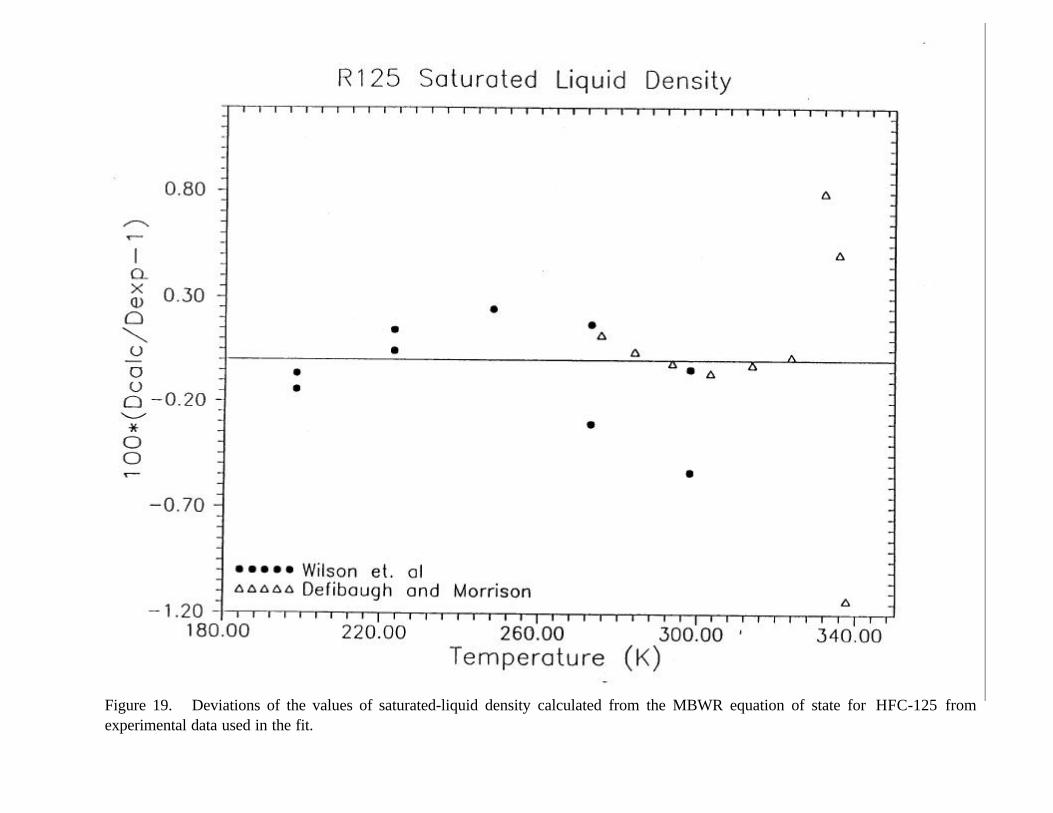
Figure 19. Deviations of the values of saturated-liquid density calculated from the MBWR equation of state for HFC-125 fromexperimental data used in the fit.
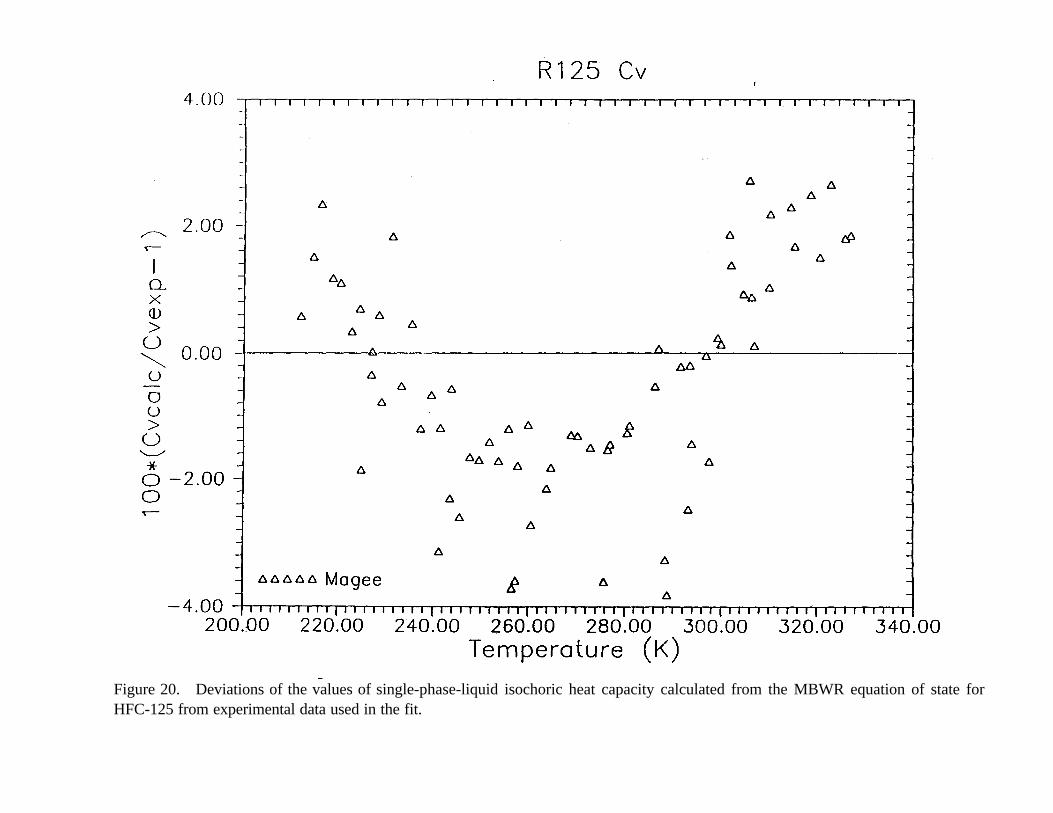
Figure 20. Deviations of the values of single-phase-liquid isochoric heat capacity calculated from the MBWR equation of state forHFC-125 from experimental data used in the fit.
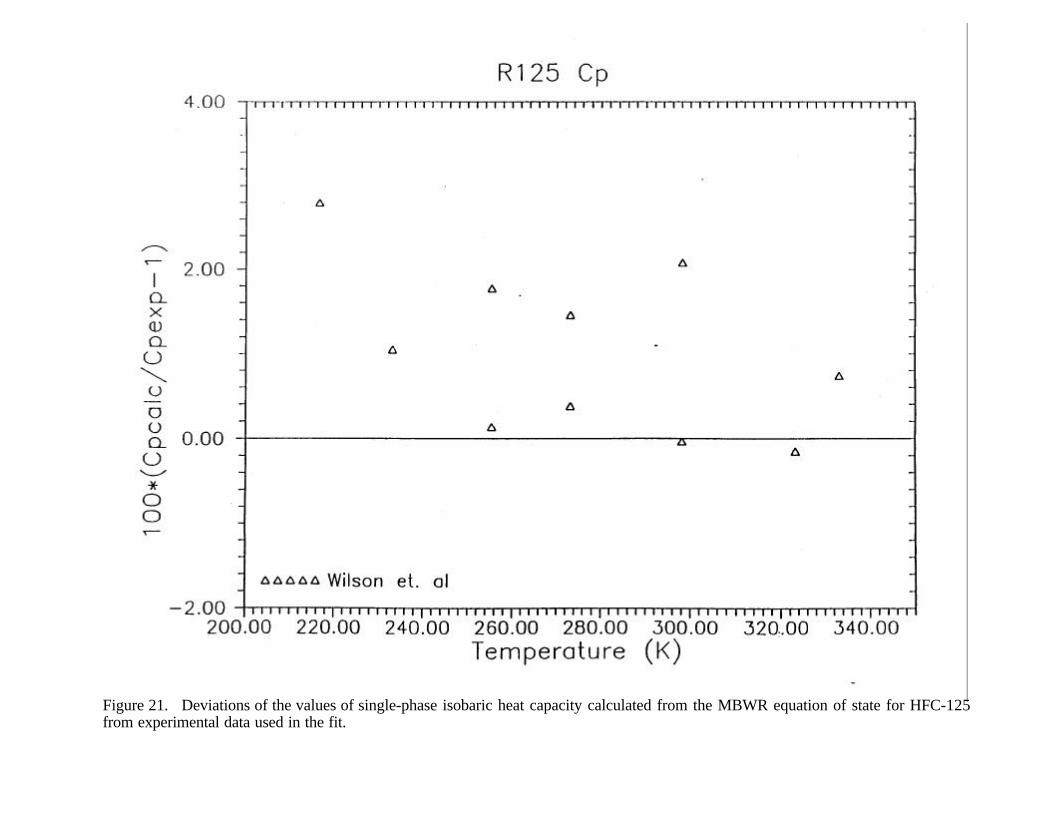
Figure 21. Deviations of the values of single-phase isobaric heat capacity calculated from the MBWR equation of state for HFC-125from experimental data used in the fit.
R123 Thermal Conductivity Data
Figure 22. Thermal conductivity surface for HCFC-123.
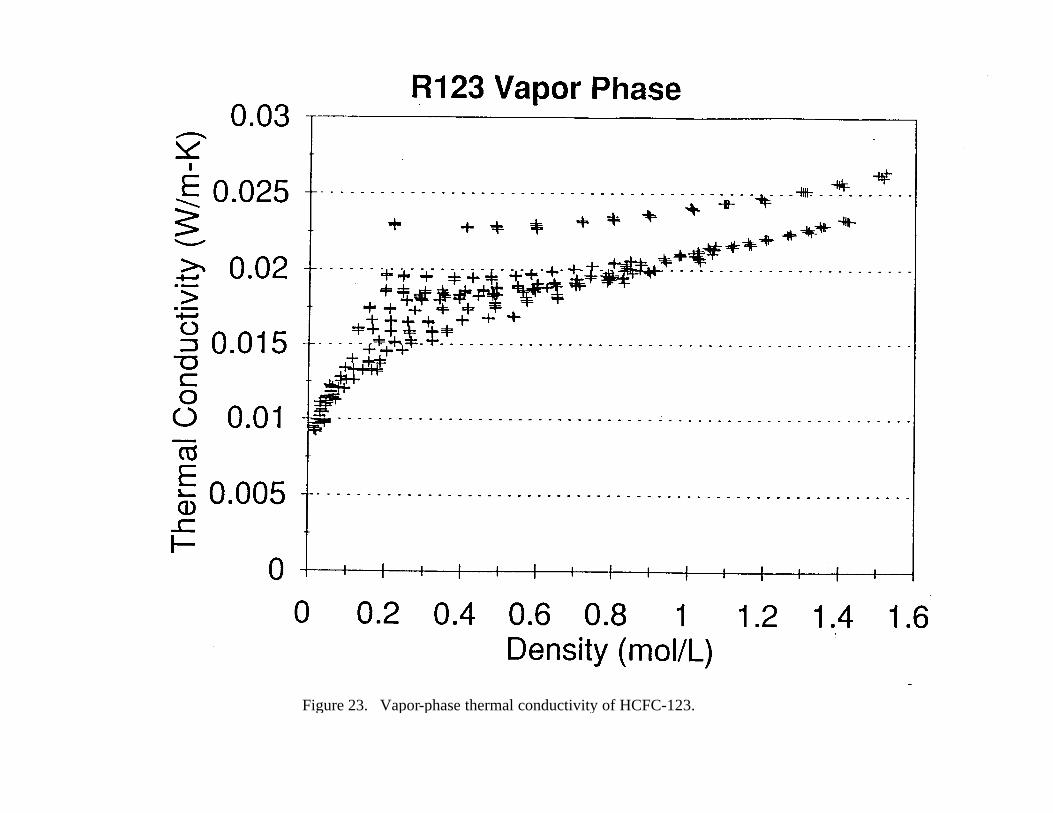
Figure 23. Vapor-phase thermal conductivity of HCFC-123.
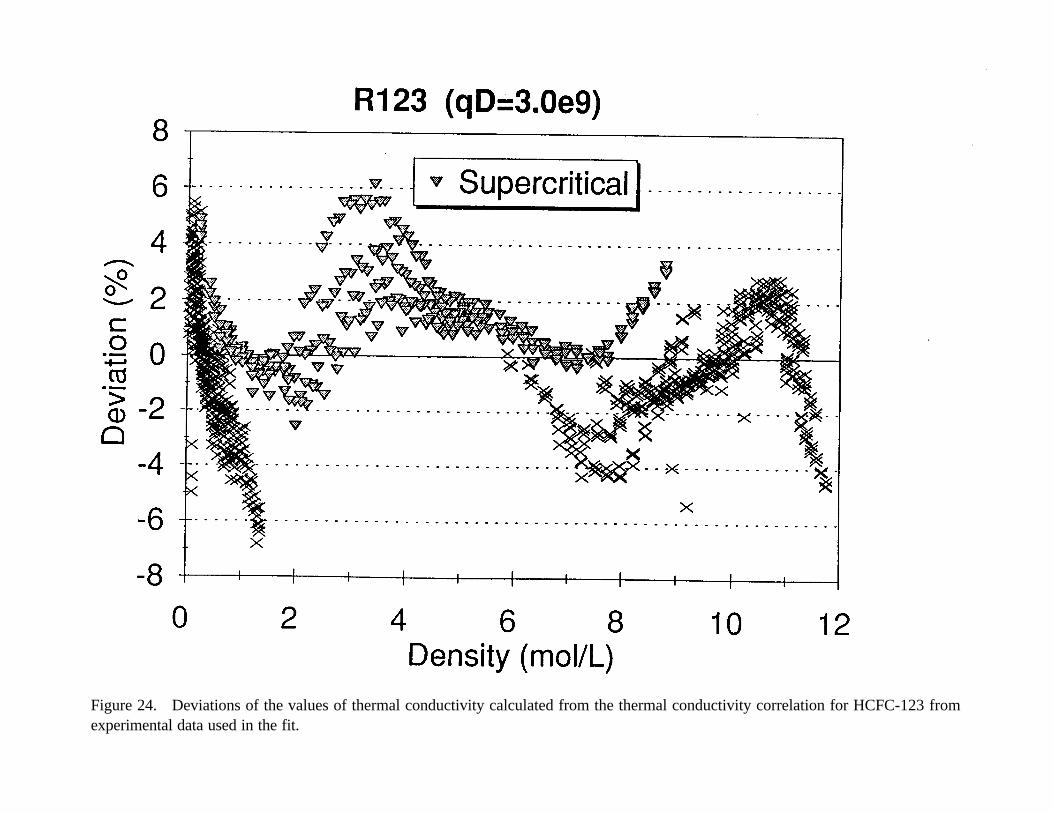
Figure 24. Deviations of the values of thermal conductivity calculated from the thermal conductivity correlation for HCFC-123 fromexperimental data used in the fit.
APPENDIX A:
TABLES OF THERMOPHYSICAL PROPERTIES
A-1
A-2
Table 1a. Burnett vapor-phase PVT measurements for BFC-32 (SI units)
A-3
Table 1b. Burnett vapor-phase PVT measurements for HFC-32 (PI units)
A-4
Table 2a. Vibrating-tube compressed-liquid-density measurements for HFC-32 (SI units)
A-5
Table 2a. Vibrating-tube compressed-liquid-density measurements for HFC-32 (Sl units)(continued)
A-6
Table 2b. Vibrating-tube compressed-liquid-density measurements for HFC-32 (PI units)
A-7
Table 2b. Vibrating-tube compressed-liquid-density measurements for HFC-32 (PI units)(continued)
A-8
Table 3a. Liquid PVT Data (Isochoric Apparatus) for HFC-32 1/4
A-9
Table 3a. Liquid PVT Data (Isochoric Apparatus) for HFC-32 2/4
A-10
Table 3a. Liquid PVT Data (Isochoric Apparatus) for HFC-32 3/4
A-11
Table 3a. Liquid PVT Data (Isochoric Apparatus) for HFC-32 4/4
A-12
Table 3b. Liquid PVT Data (Isochoric Apparatus) for HFC-32 1/4
A-13
Table 3b. Liquid PVT Data (Isochoric Apparatus) for HFC-32 2/4
A-14
Table 3b. Liquid PVT Data (Isochoric Apparatus) for HFC-32 3/4
A-15
Table 3b. Liquid PVT Data (Isochoric Apparatus) for HFC-32 4/4
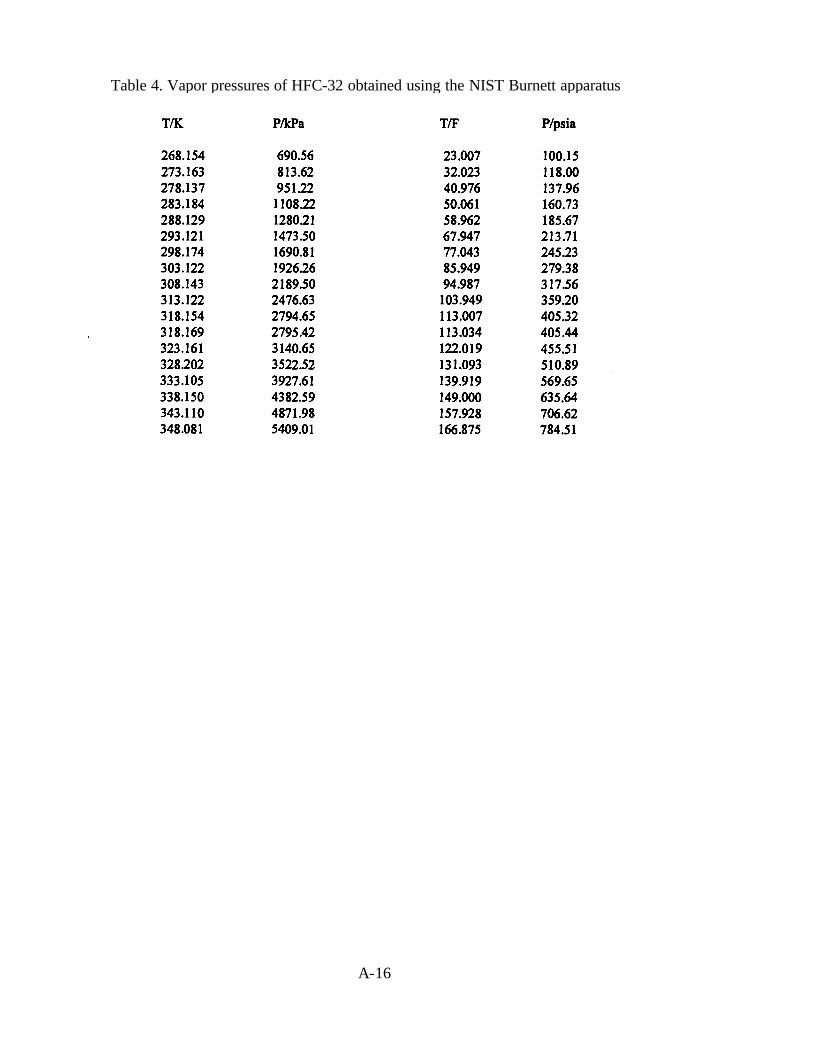
Table 4. Vapor pressures of HFC-32 obtained using the NIST Burnett apparatus
A-16
A-17
Table 5. Vapor pressures of HFC-32 obtained using the NIST ebulliometer
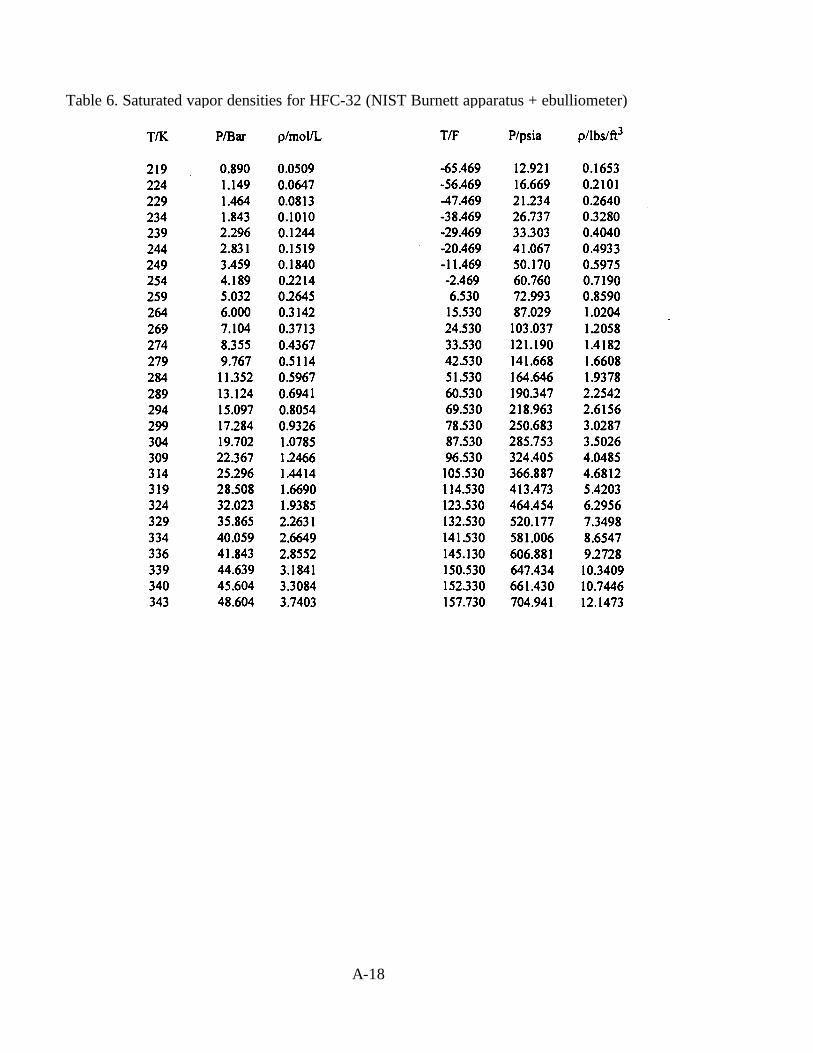
Table 6. Saturated vapor densities for HFC-32 (NIST Burnett apparatus + ebulliometer)
A-18
A-19
Table 7. Saturated liquid densities for HFC-32 (NIST Burnett apparatus + ebulliometer)
A-20
Table 8a. Vapor Pressures (Static Method) for HFC-32
A-21
Table 8b. Vapor Pressures (Static Method) for HFC-32
A-22
Table 9(a). Experimental liquid heat capacity data for HFC-32.
Table 9(b). Experimental liquid heat capacity data for HFC-32.
A-23
Table 10(a). Experimental liquid heat capacity data for HFC-32.
Table 10(b). Experimental liquid heat capacity data for HFC-32.
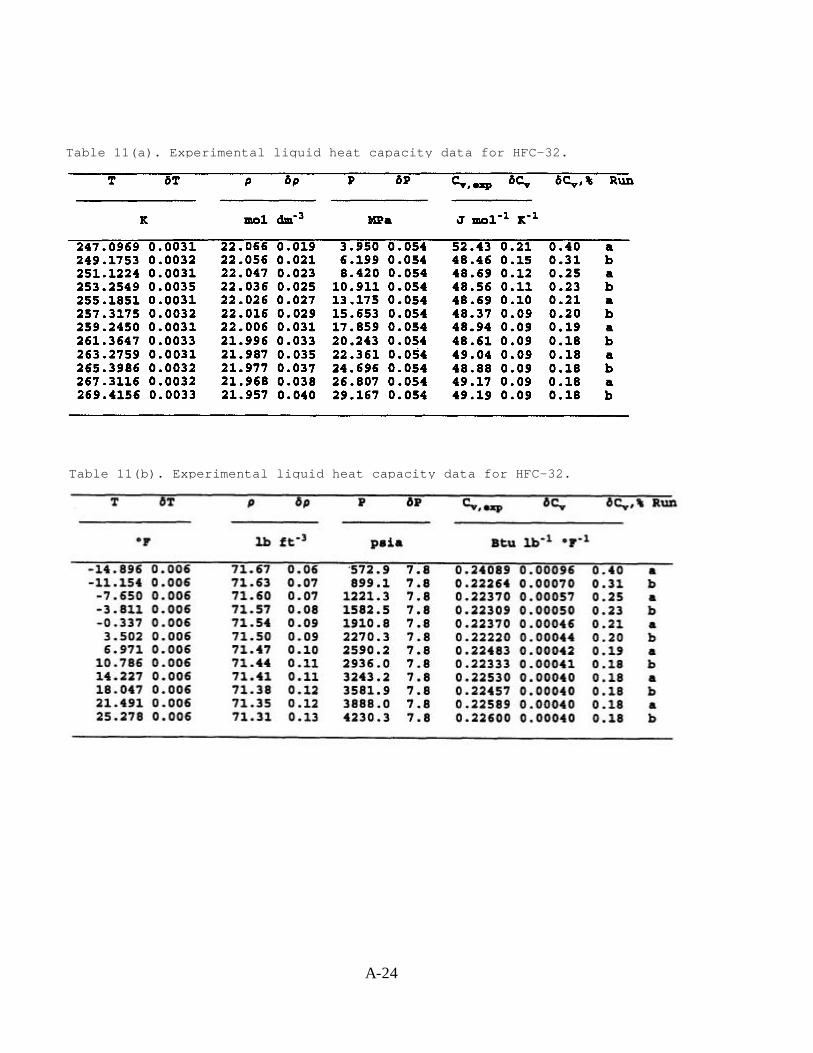
Table 11(a). Experimental liquid heat capacity data for HFC-32.
Table 11(b). Experimental liquid heat capacity data for HFC-32.
A-24
A-25
Table 12(a). Experimental liquid heat capacity data for HFC-32.
Table 12(b). Experimental liquid heat capacity data for HFC-32.
A-26
Table 13(b). Experimental liquid heat capacity data for HFC-32.
Table 13(a). Experimental liquid heat capacity data for HFC-32.
A-27
Table 14(a). Experimental liquid heat capacity data for HFC-32.
Table 14(b). Experimental liquid heat capacity data for HFC-32.
A-28
Table 15(a). Experimental liquid heat capacity data for HFC-32.
Table 15(b). Experimental liquid heat capacity data for HFC-32.
A-29
Table 16(a). Experimental liquid heat capacity data for HFC-32.
Table 16(b). Experimental liquid heat capacity data for HFC-32.
A-30
Table 17(a). Experimental two-phase heat capacity data for HFC-32.
A-31
Table 17(b). Experimental two-phase heat capacity data for HFC-32.
A-32
Table 18(a). Experimental two-phase heat capacity data for HFC-32.
Table 18(b). Experimental two-phase heat capacity data for HFC-32.
A-33
Table 19(a). Experimental two-phase heat capacity data for HFC-32.
A-34
Table 19(b). Experimental two-phase heat capacity data for HFC-32.
A-35
Table 20. Coefficients to the MBWR equation of state for HFC-32 (units are K, bar, L, mol)

Table 20. Coefficients to the MBWR equation of state for HFC-32 (units are K, bar, L, mol)(continued)
A-36
A-37
Table 21a. Refrigerant 32 (difluoromethane) Properties of Saturated Liquid and Saturated Vapor (SI units)
A-38
Table 21b. Refrigerant 32 (difluoromethane) Properties of Saturated Liquid and Saturated Vapor (PI units)
A-39
Table 22. Transient Hot-Wire Thermal Conductivity Data for HFC-32
A-40
Table 22. Transient Hot-Wire Thermal Conductivity Data for HFC-32 (Continued)
A-41
Table 22. Transient Hot-Wire Thermal Conductivity Data for HFC-32 (Continued)
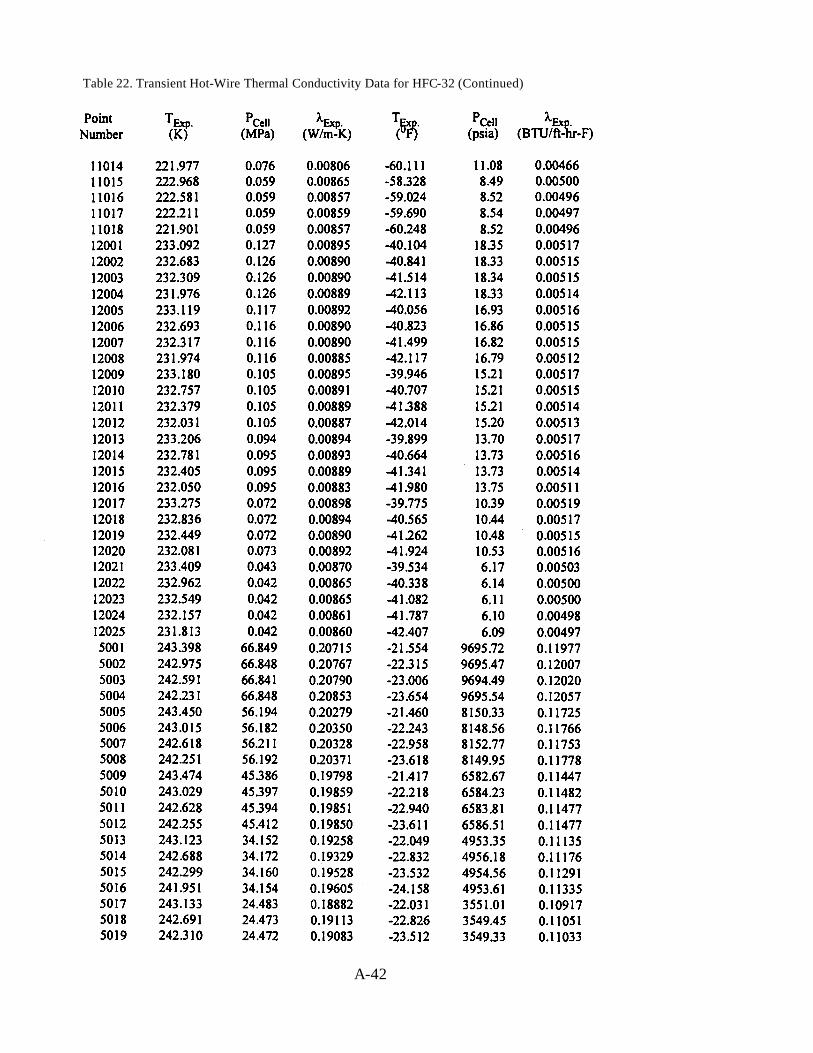
Table 22. Transient Hot-Wire Thermal Conductivity Data for HFC-32 (Continued)
A-42
A-43
Table 22. Transient Hot-Wire Thermal Conductivity Data for HFC-32 (Continued)
A-44
Table 22. Transient Hot-Wire Thermal Conductivity Data for HFC-32 (Continued)
A-45
Table 22. Transient Hot-Wire Thermal Conductivity Data for HFC-32 (Continued)

A-46
Table 22. Transient Hot-Wire Thermal Conductivity Data for HFC-32 (Continued)
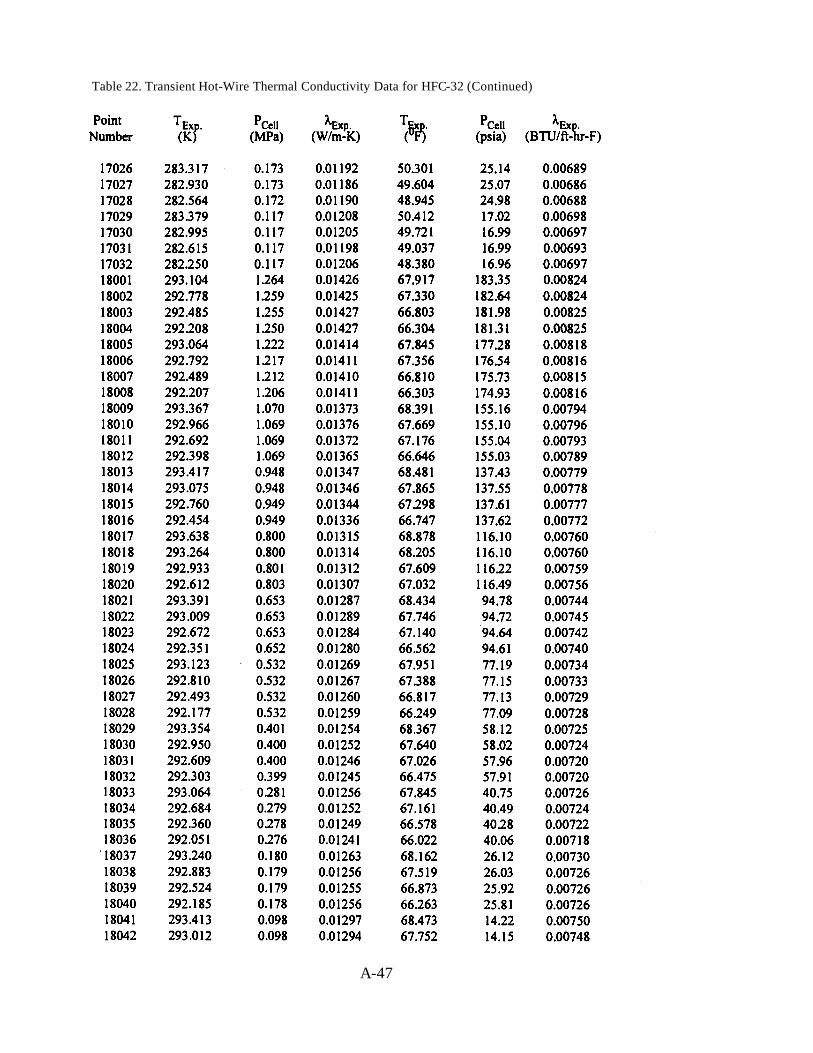
Table 22. Transient Hot-Wire Thermal Conductivity Data for HFC-32 (Continued)
A-47
A-48
Table 22. Transient Hot-Wire Thermal Conductivity Data for HFC-32 (Continued)
A-49
Table 22. Transient Hot-Wire Thermal Conductivity Data for HFC-32 (Continued)
A-50
Table 22. Transient Hot-Wire Thermal Conductivity Data for HFC-32 (Continued)
A-51
Table 22. Transient Hot-Wire Thermal Conductivity Data for HFC-32 (Continued)
A-52
Table 22. Transient Hot-Wire Thermal Conductivity Data for HFC-32 (Continued)
A-53
Table 22. Transient Hot-Wire Thermal Conductivity Data for HFC-32 (Continued)
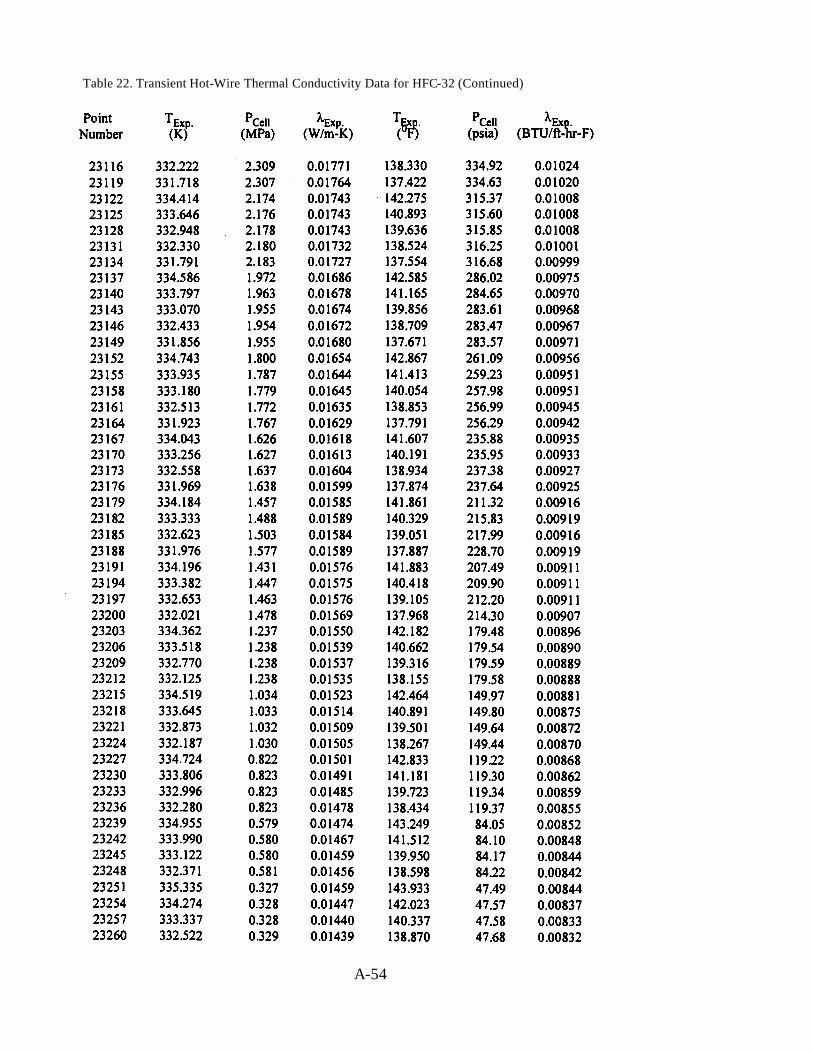
Table 22. Transient Hot-Wire Thermal Conductivity Data for HFC-32 (Continued)
A-54
A-55
Table 22. Transient Hot-Wire Thermal Conductivity Data for HFC-32 (Continued)
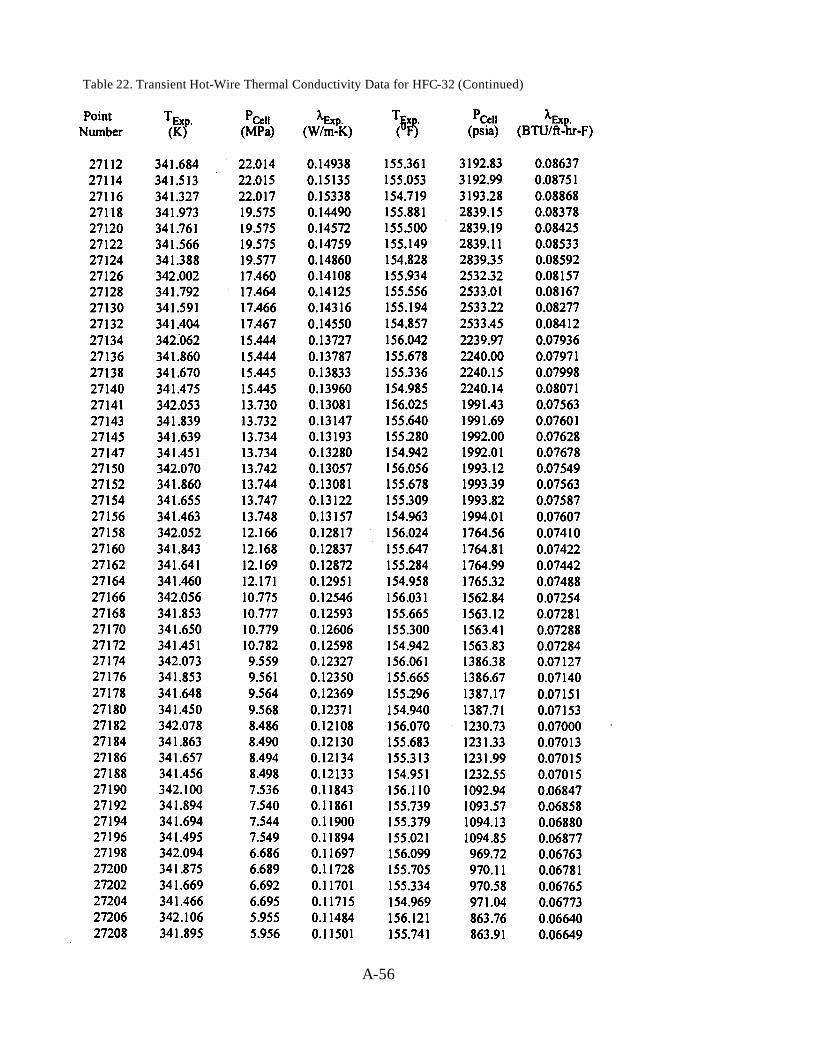
Table 22. Transient Hot-Wire Thermal Conductivity Data for HFC-32 (Continued)
A-56
A-57
Table 22. Transient Hot-Wire Thermal Conductivity Data for HFC-32 (Continued)
A-58
Table 22. Transient Hot-Wire Thermal Conductivity Data for HFC-32 (Continued)
A-59
Table 22. Transient Hot-Wire Thermal Conductivity Data for HFC-32 (Continued)
A-60
Table 23. Thermal conductivity correlation parameters for HFC-32, with thermal conductivity in W/m-K,temperature in K, and density in mol/L. The parameters are explained in Appendix B.
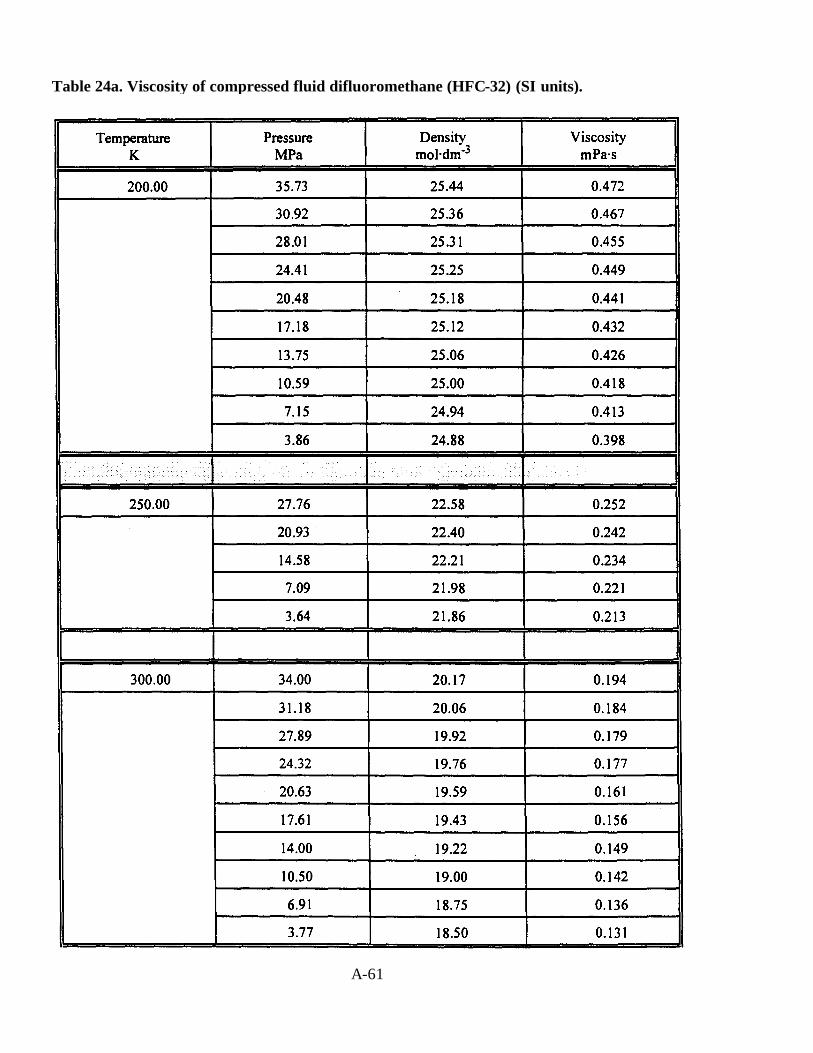
Table 24a. Viscosity of compressed fluid difluoromethane (HFC-32) (SI units).
A-61
A-62
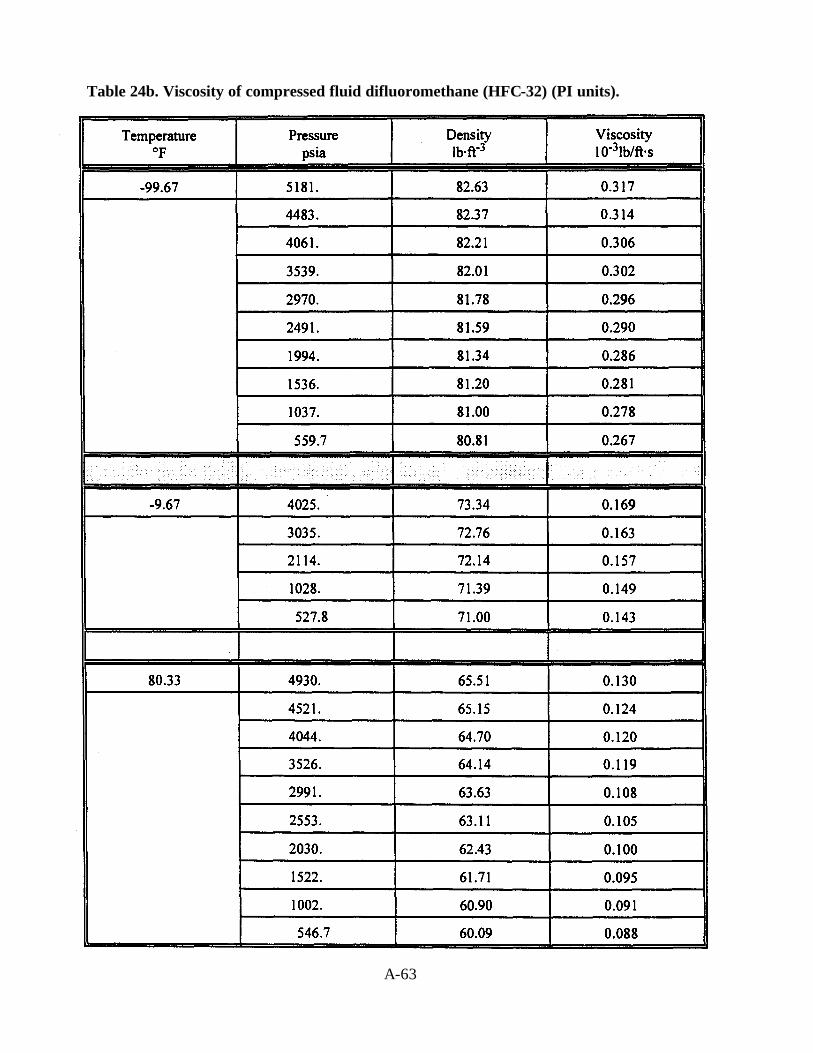
Table 24b. Viscosity of compressed fluid difluoromethane (HFC-32) (PI units).
A-63
A-64
A-65
Table 25a. Viscosity of saturated liquid difluoromethane (HFC-32) (SI units).
A-66
Table 25b. Viscosity of saturated liquid difluoromethane (HFC-32) (PI units).
A-67
Table 26a. Burnett vapor-phase PVT measurements for HCFC-124 (SI units).
A-68
Table 26b. Burnett vapor-phase PVT measurements for HCFC-124 (PI units).
A-69
Table 27a. Vibrating-tube compressed-liquid-density measurements for HCFC-124 (SI units)
A-70
Table 27a. Vibrating-tube compressed-liquid-density measurements for HCFC-124 (SI units)(continued)
A-71
Table 27b. Vibrating-tube compressed-liquid-density measurements for HCFC-124 (PI units)
A-72
Table 27b. Vibrating-tube compressed-liquid-density measurements for HCFC-124 (PI units)(continued)
A-73
Table 28a. Liquid PVT Data (Isochoric Apparatus) for HCFC-124 1/4
A-74
Table 28a. Liquid PVT Data (Isochoric Apparatus) for HCFC-124 2/4
A-75
Table 28a. Liquid PVT Data (Isochoric Apparatus) for HCFC-124 3/4
A-76
Table 28a. Liquid PVT Data (Isochoric Apparatus) for HCFC-124 4/4
A-77
Table 28b. Liquid PVT Data (Isochoric Apparatus) for HCFC-124 1/4
A-78
Table 28b. Liquid PVT Data (Isochoric Apparatus) for HCFC-124 2/4
A-79
Table 28b. Liquid PVT Data (Isochoric Apparatus) for HCFC-124 3/4
A-80
Table 28b. Liquid PVT Data (Isochoric Apparatus) for HCFC-124 4/4
A-81
Table 29a. Vapor pressures of HCFC-124 (NIST Burnett apparatus + ebulliometer) (SI units).
A-82
Table 29b. Vapor pressures of HCFC-124 (NIST Burnett apparatus + ebulliometer) (PI units).
A-83
Table 30. Speed of Sound in R-124
A-84
Table 30. Speed of Sound in R-124 (Continued)
A-85
Table 30. Speed of Sound in R-124 (Continued)
A-86
Table 30. Speed of Sound in R-124 (Continued)
A-87
Table 30. Speed of Sound in R-124 (Continued)
A-88
Table 30. Speed of Sound in R-124 (Continued)
A-89
A-90
Table 32(a). Acoustic Viral Coefficients for R-124 (SI units)
A-91
Table 32(b). Acoustic Viral Coefficients for R-124 (PI units)
A-92
Table 33(a). Experimental liquid heat capacity data for HCFC-124.
Table 33(b). Experimental liquid heat capacity data for HCFC-124.
A-93
Table 34(a). Experimental liquid heat capacity data for HCFC-l24.
Table 34(b). Experimental liquid heat capacity data for HCFC-124.
A-94
Table 35(a). Experimental liquid heat capacity data for HCFC-124.
Table 35(b). Experimental liquid heat capacity data for HCFC-124.
A-95
Table 36(a). Experimental liquid heat capacity data for HCFC-124.
Table 36(b). Experimental liquid heat capacity data for HCFC-124.
A-96
Table 37(a). Experimental liquid heat capacity data for HCFC-124.
Table 37(b). Experimental liquid heat capacity data for HCFC-124.
A-97
Table 38(a). Experimental tyro-phase heat capacity data for HCFC-124.
A-98
A-99
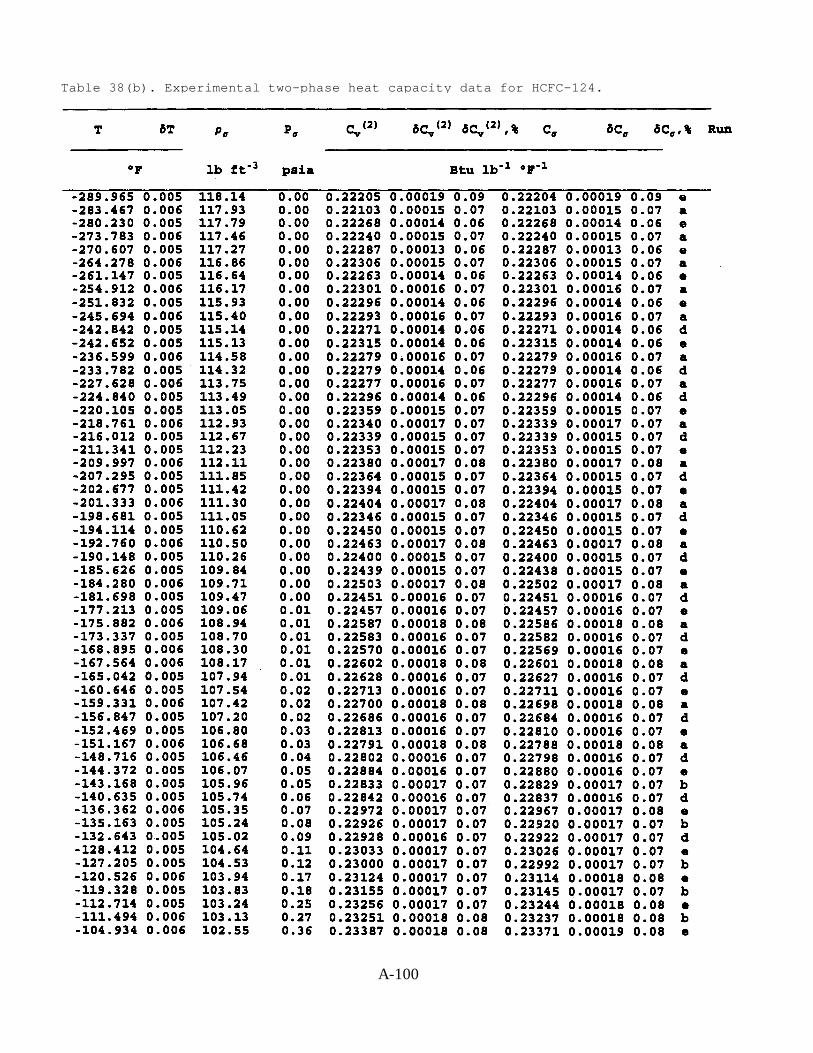
Table 38(b). Experimental two-phase heat capacity data for HCFC-124.
A-100
A-101
A-102
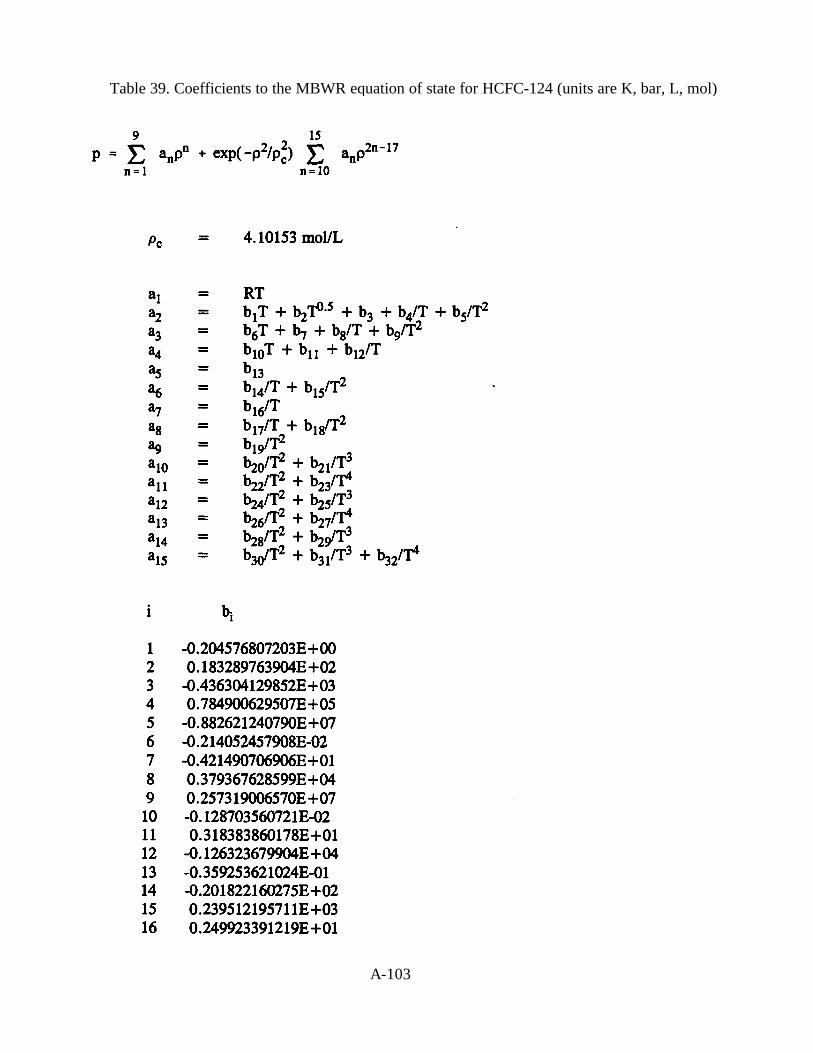
Table 39. Coefficients to the MBWR equation of state for HCFC-124 (units are K, bar, L, mol)
A-103
A-104
Table 39. Coefficients to the MBWR equation of state for HCFC-124 (units are K, bar, L, mol)(continued)
A-105
Table 40a. Refrigerant 124 (1-chloro-1,2,2,2-tetrafluoroethane) Properties of Saturated Liquid and Saturated Vapor (SI units)
A-106
Table 40b. Refrigerant 124 (1-chloro-1,2,2,2-tetrafluoroethane) Properties of Saturated Liquid and Saturated Vapor (PI units)
A-107
Table 41a. Burnett vapor-phase PVT measurements for HFC-125 (SI units).
A-108
Table 41b. Burnett vapor-phase PVT measurements for HFC-125 (PI units).
A-109
Table 42a. Vibrating-tube compressed-liquid-density measurements for HFC-125 (SI units)
A-110
Table 42a. Vibrating-tube compressed-liquid-density measurements for HFC-125 (SI units)(continued)
A-111
Table 42b. Vibrating-tube compressed-liquid-density measurements for HFC-125 (PI units)

A-112
Table 42b. Vibrating-tube compressed-liquid-density measurements for HFC-125 (PI units)(continued)
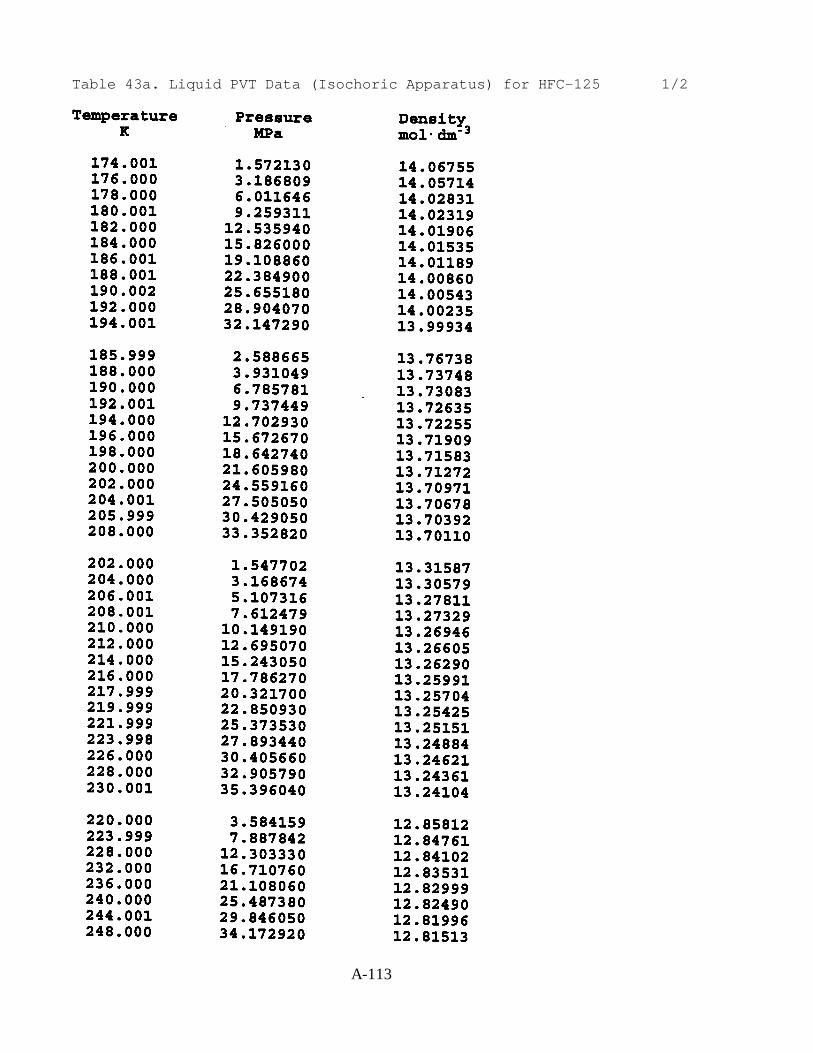
Table 43a. Liquid PVT Data (Isochoric Apparatus) for HFC-125 1/2
A-113
A-114
Table 43a. Liquid PVT Data (Isochoric Apparatus) for HFC-125 2/2
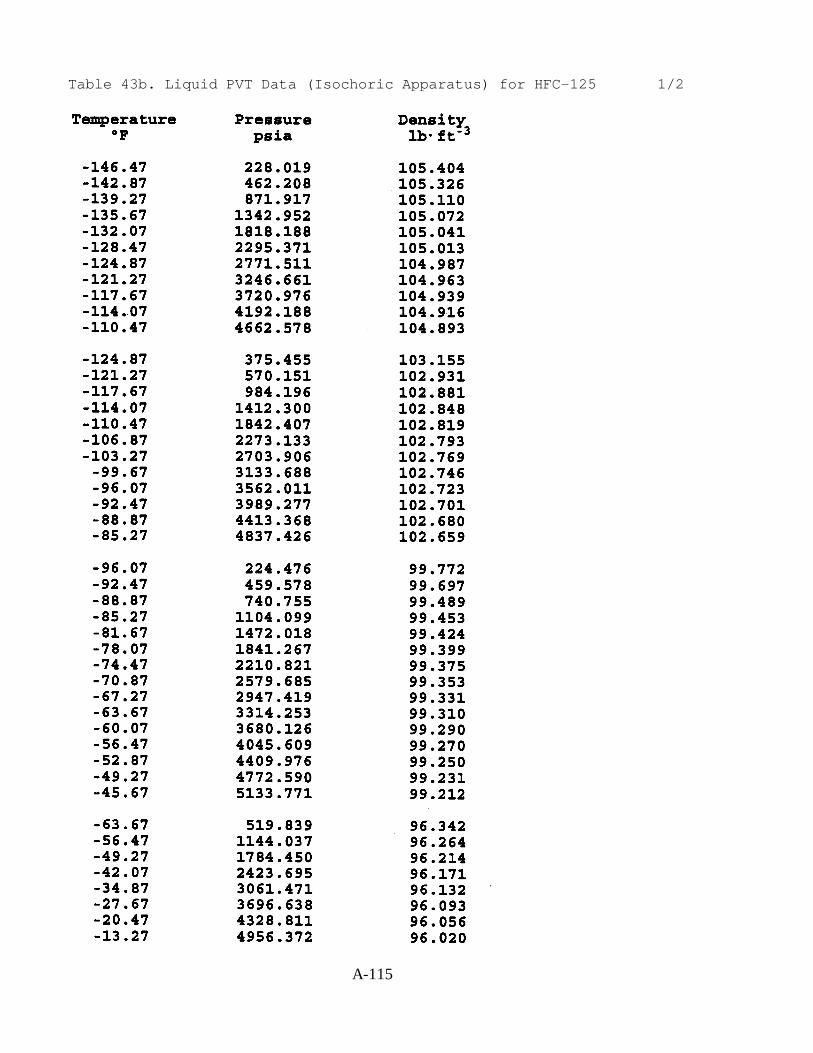
Table 43b. Liquid PVT Data (Isochoric Apparatus) for HFC-125 1/2
A-115
A-116
Table 43b. Liquid PVT Data (Isochoric Apparatus) for HFC-125 2/2
A-117
Table 44a. Vapor pressures of HFC-125 (NIST Burnett apparatus + ebulliometer) (SI units).
A-118
Table 44b. Vapor pressures of HFC-125 (NIST Burnett apparatus + ebulliometer) (PI units).
A-119
Table 45a. Vapor Pressures (Static Method) for HFC-125
A-120
Table 45b. Vapor Pressures (Static Method) for HFC-125
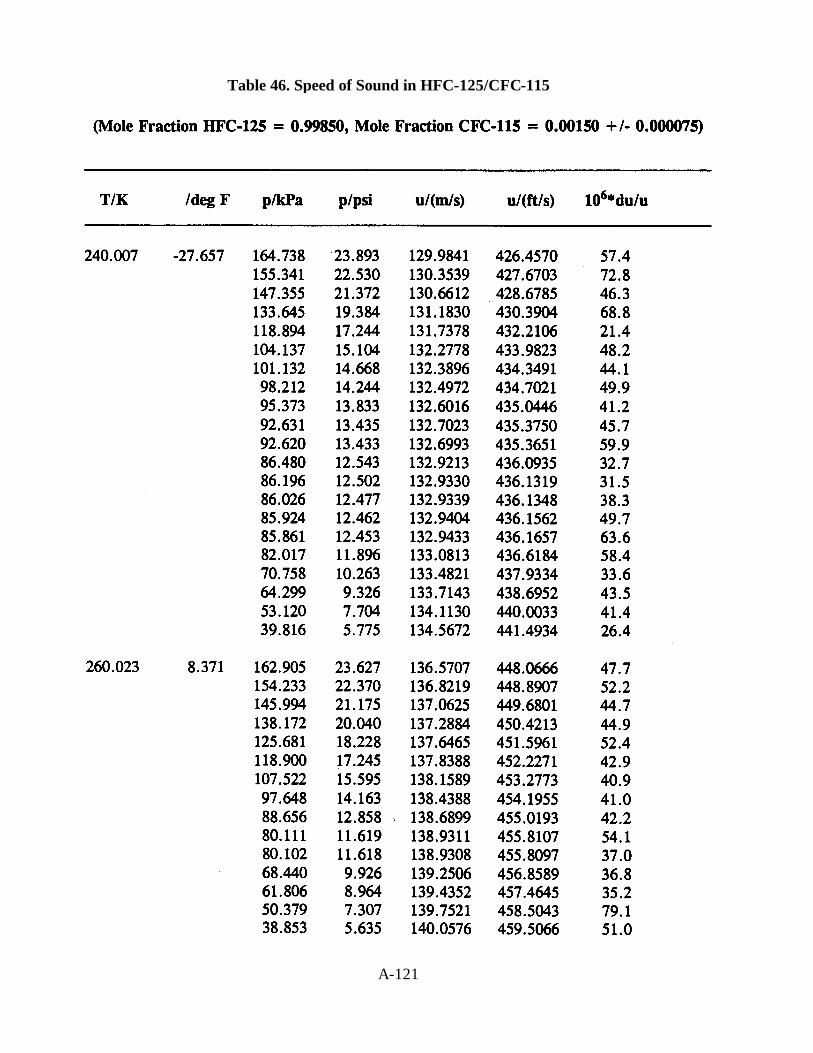
Table 46. Speed of Sound in HFC-125/CFC-115
A-121
A-122
Table 46. Speed of Sound in HFC-125/CFC-115 (Continued)
A-123
Table 46. Speed of Sound in HFC-125/CFC-115 (Continued)
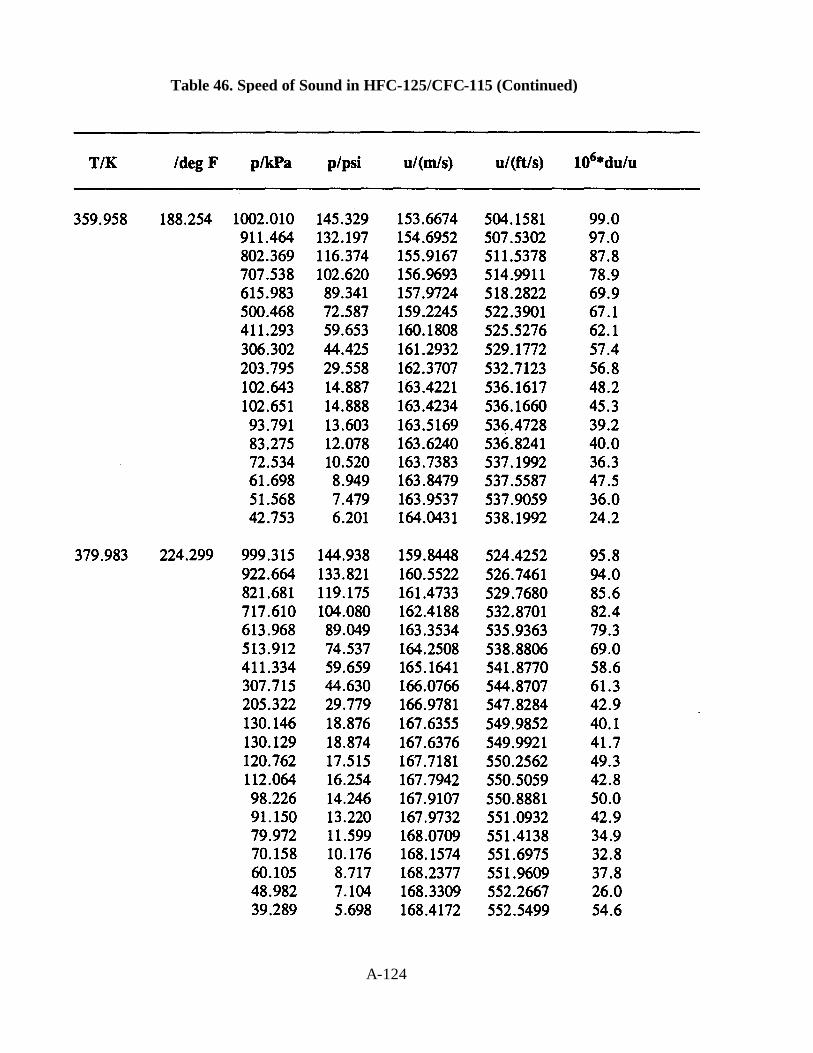
Table 46. Speed of Sound in HFC-125/CFC-115 (Continued)
A-124
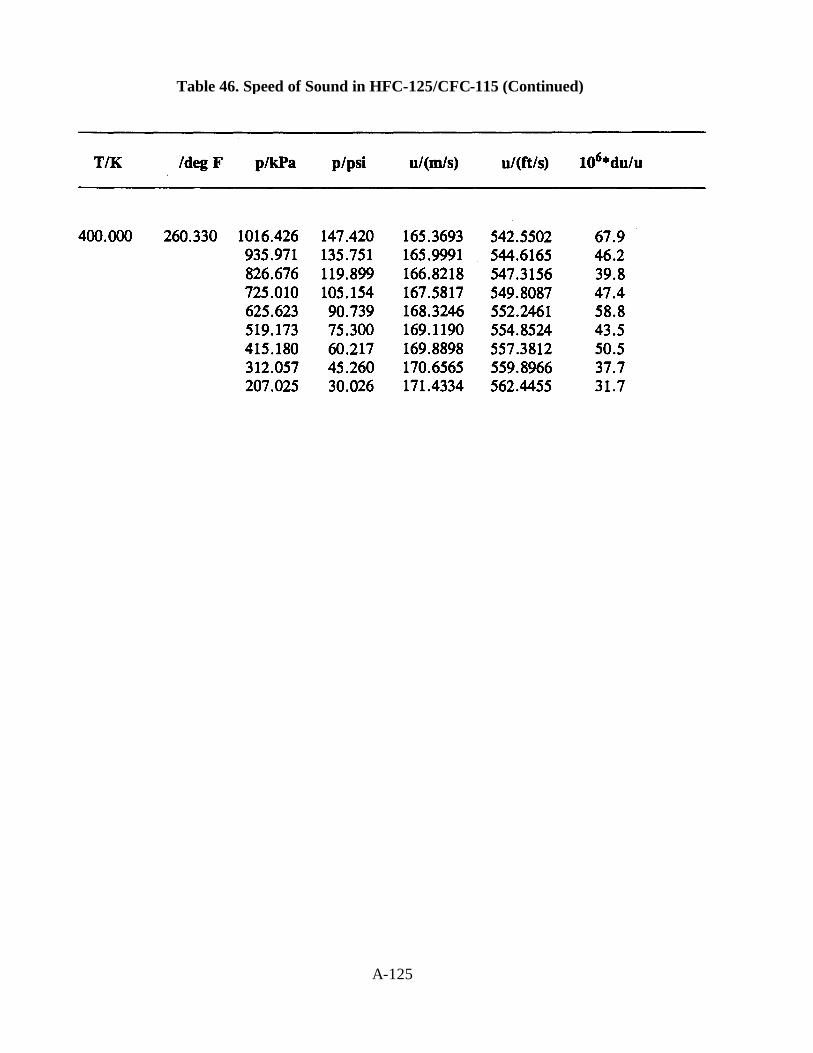
Table 46. Speed of Sound in HFC-125/CFC-115 (Continued)
A-125
A-126
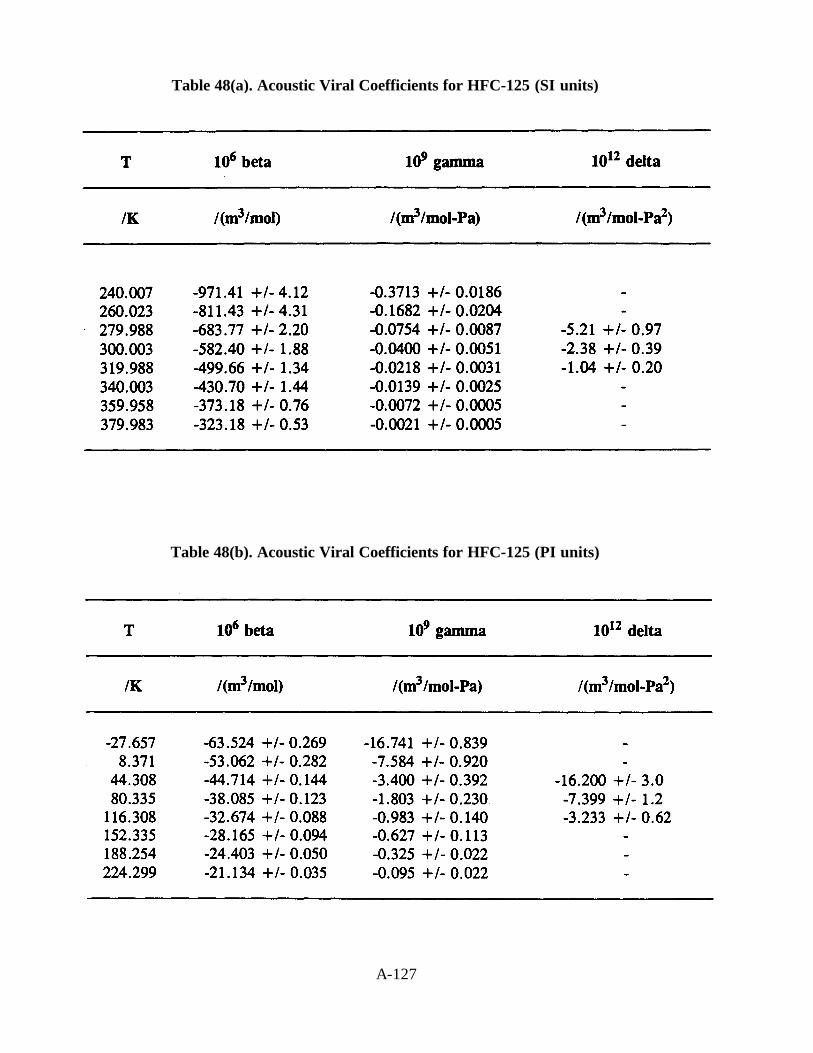
Table 48(a). Acoustic Viral Coefficients for HFC-125 (SI units)
A-127
Table 48(b). Acoustic Viral Coefficients for HFC-125 (PI units)
A-128
Table 49(a). Experimental liquid heat capacity data for HFC-125.
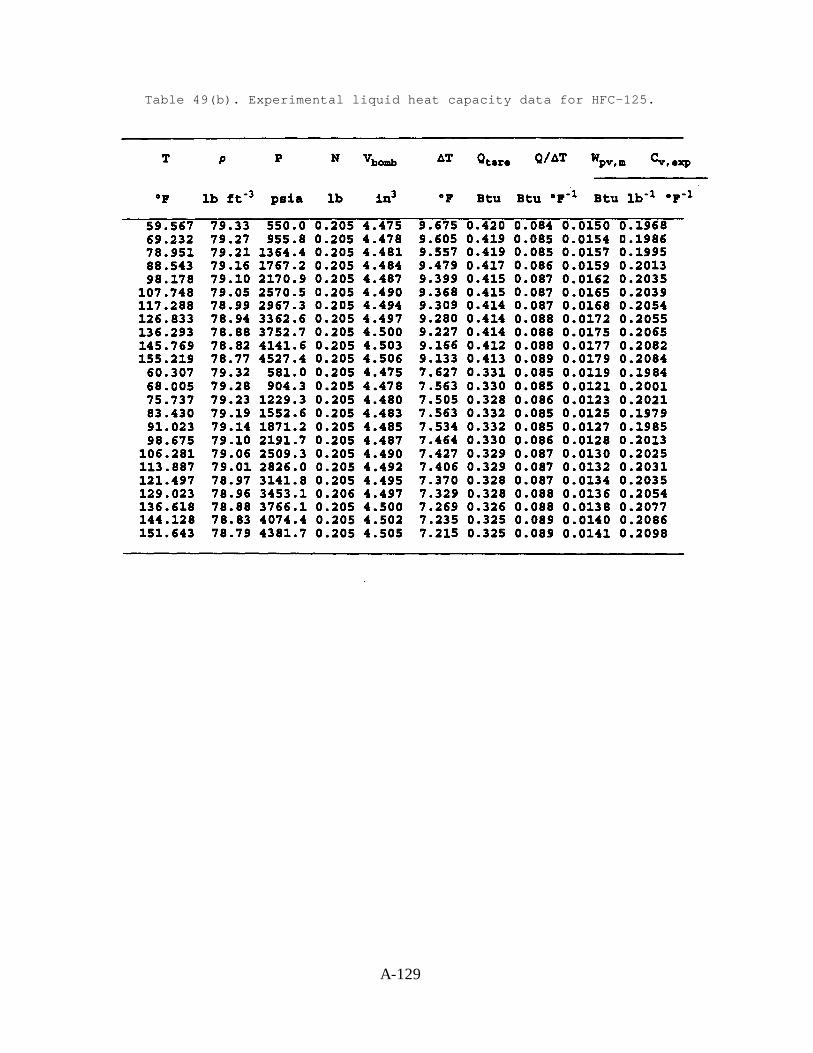
Table 49(b). Experimental liquid heat capacity data for HFC-125.
A-129
A-130
Table 50(a). Experimental liquid heat capacity data for HFC-125.
Table 50(b). Experimental liquid heat capacity data for HFC-125.
A-131
Table 51(a). Experimental liquid heat capacity data for HFC-125.
Table 51(b). Experimental liquid heat capacity data for HFC-125.
A-132
Table 52(a). Experimental liquid heat capacity data for HFC-125.
Table 52(b). Experimental liquid heat capacity data for HFC-125.
A-133
Table 53(a). Experimental liquid heat capacity data for HFC-125.
Table 53(b). Experimental liquid heat capacity data for HFC-125.
A-134
Table 54(a). Experimental liquid heat capacity data for HFC-125.
Table 54(b). Experimental liquid heat capacity data for HFC-125.
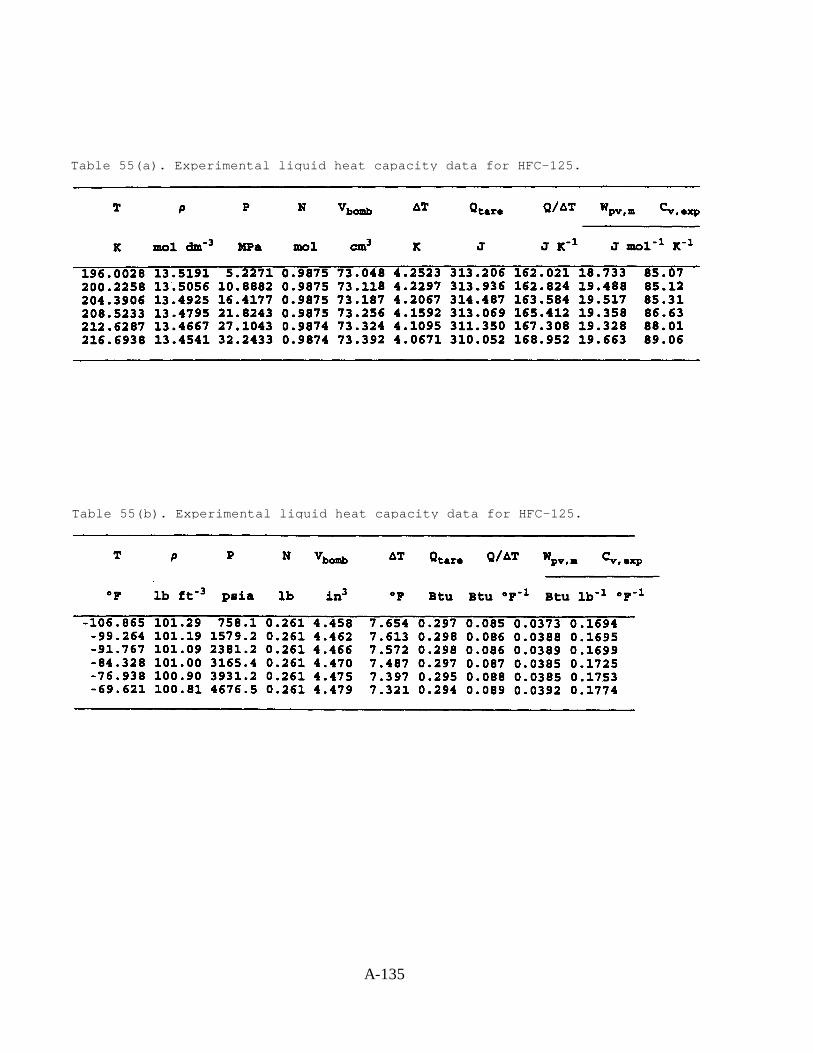
A-135
Table 55(b). Experimental liquid heat capacity data for HFC-125.
Table 55(a). Experimental liquid heat capacity data for HFC-125.
A-136
Table 56(b). Experimental two-phase heat capacity data for HFC-125.
Table 56(a). Experimental two-phase heat capacity data for HFC-125.
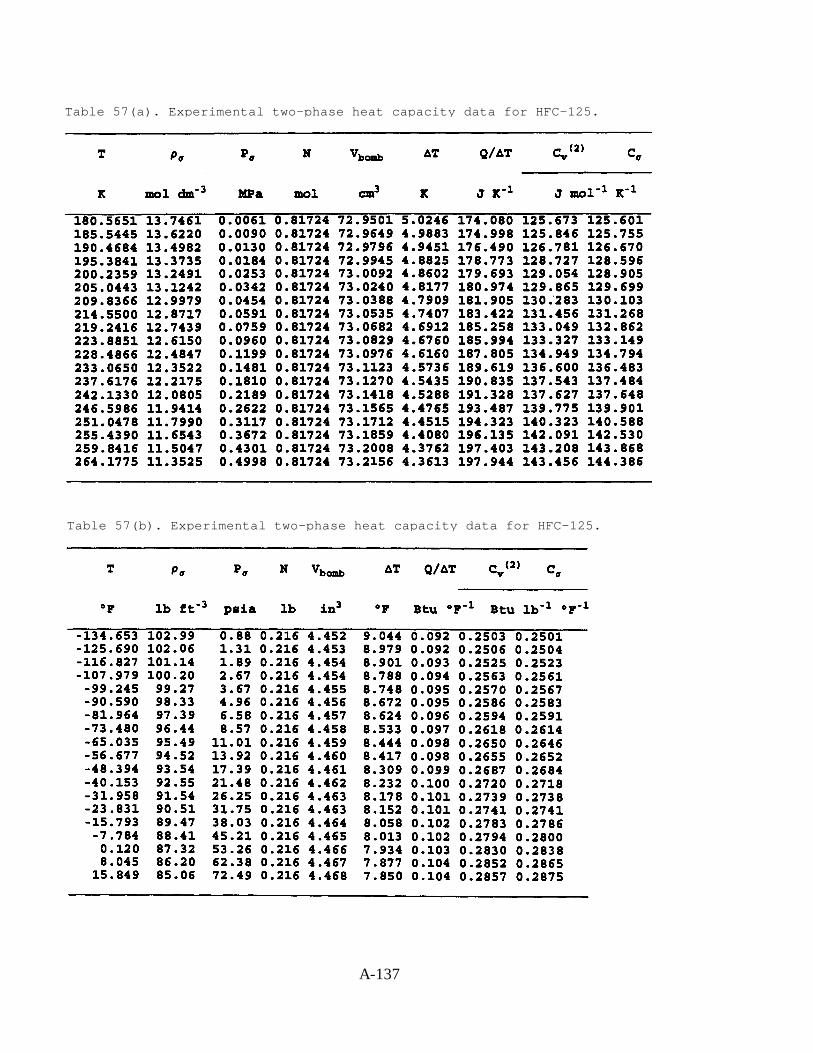
A-137
Table 57(b). Experimental two-phase heat capacity data for HFC-125.
Table 57(a). Experimental two-phase heat capacity data for HFC-125.
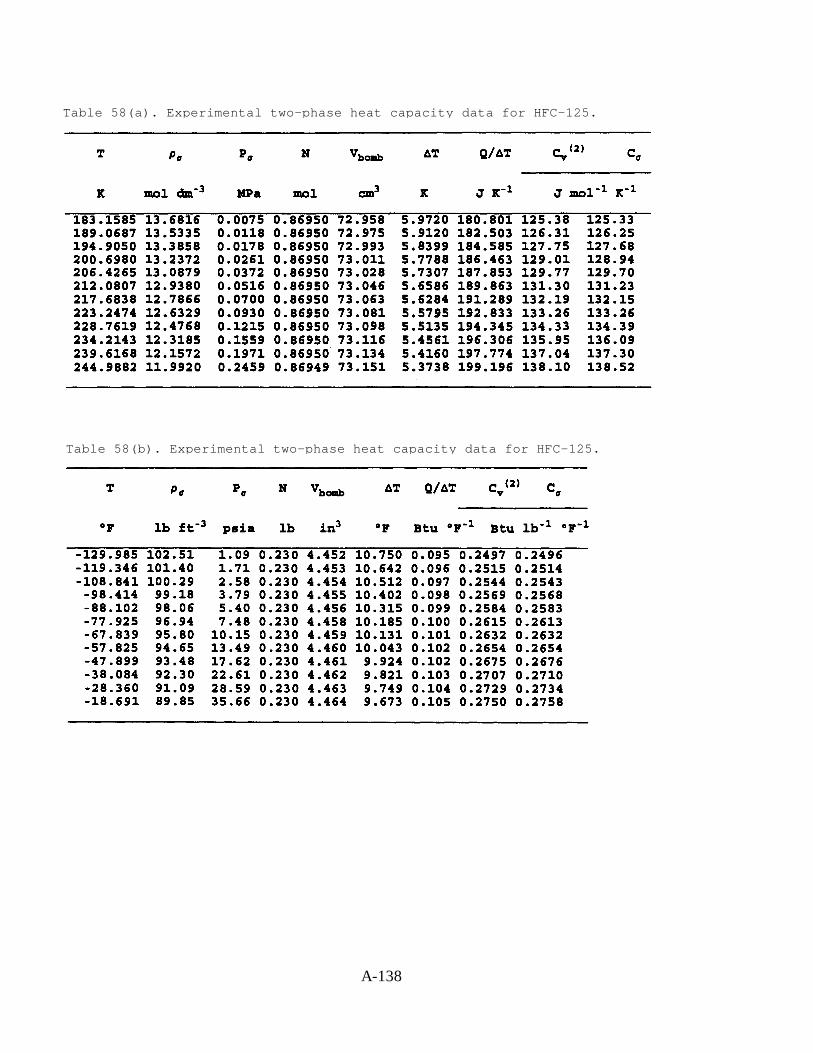
A-138
Table 58(a). Experimental two-phase heat capacity data for HFC-125.
Table 58(b). Experimental two-phase heat capacity data for HFC-125.
A-139
Table 59(b). Experimental two-phase heat capacity data for HFC-125.
Table 59(a). Experimental two-phase heat capacity data for HFC-125.
A-140
Table 60(a). Experimental two-phase heat capacity data for HFC-125.
A-141
Table 60(b). Experimental taro-phase heat capacity data for HFC-125.
A-142
Table 61(b). Experimental two-phase heat capacity data for HFC-125.
Table 61(a). Experimental two-phase heat capacity data for HFC-125.
A-143
Table 62(b). Experimental two-phase heat capacity data for HFC-125.
Table 62(a). Experimental two-phase heat capacity data for HFC-125.

A-144
Table 63. Coefficients to the MBWR equation of state for HFC-125 (units are K, bar, L, mol)
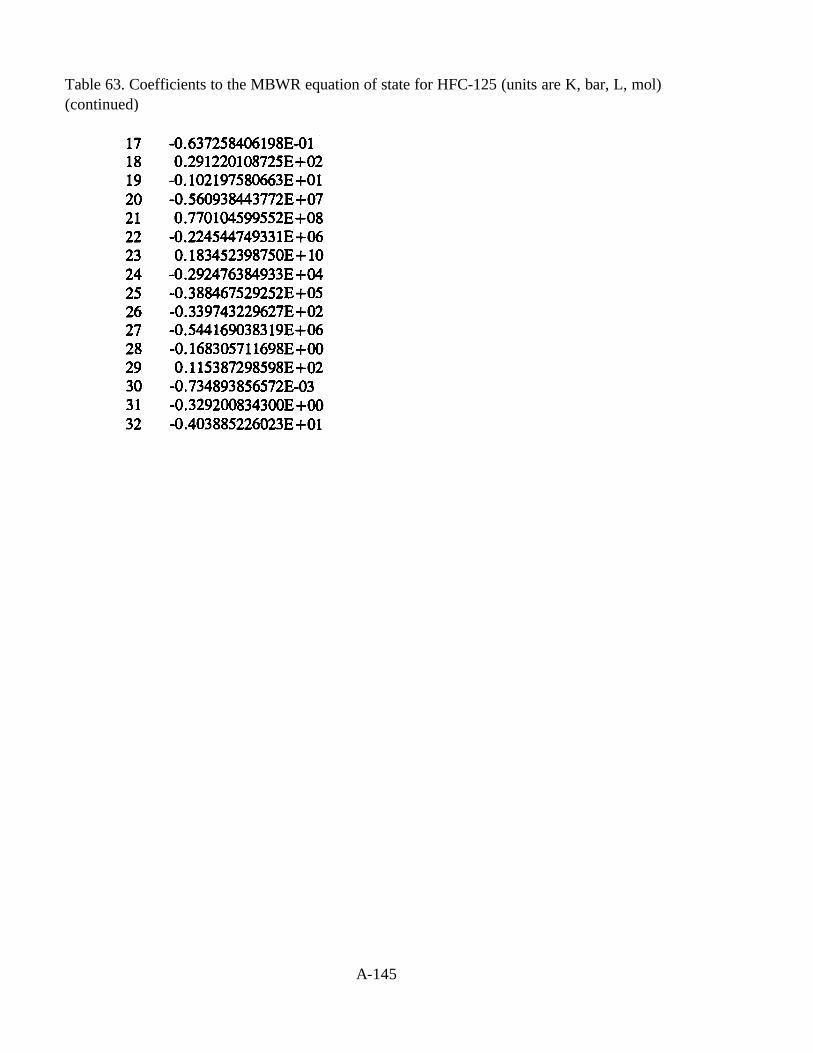
Table 63. Coefficients to the MBWR equation of state for HFC-125 (units are K, bar, L, mol)(continued)
A-145
A-146
Table 64a. Refrigerant 125 (pentafluoroethane) Properties of Saturated Liquid and Saturated Vapor (SI units)
A-147
Table 64b. Refrigerant 125 (pentafluoroethane) Properties of Saturated Liquid and Saturated Vapor (PI units)
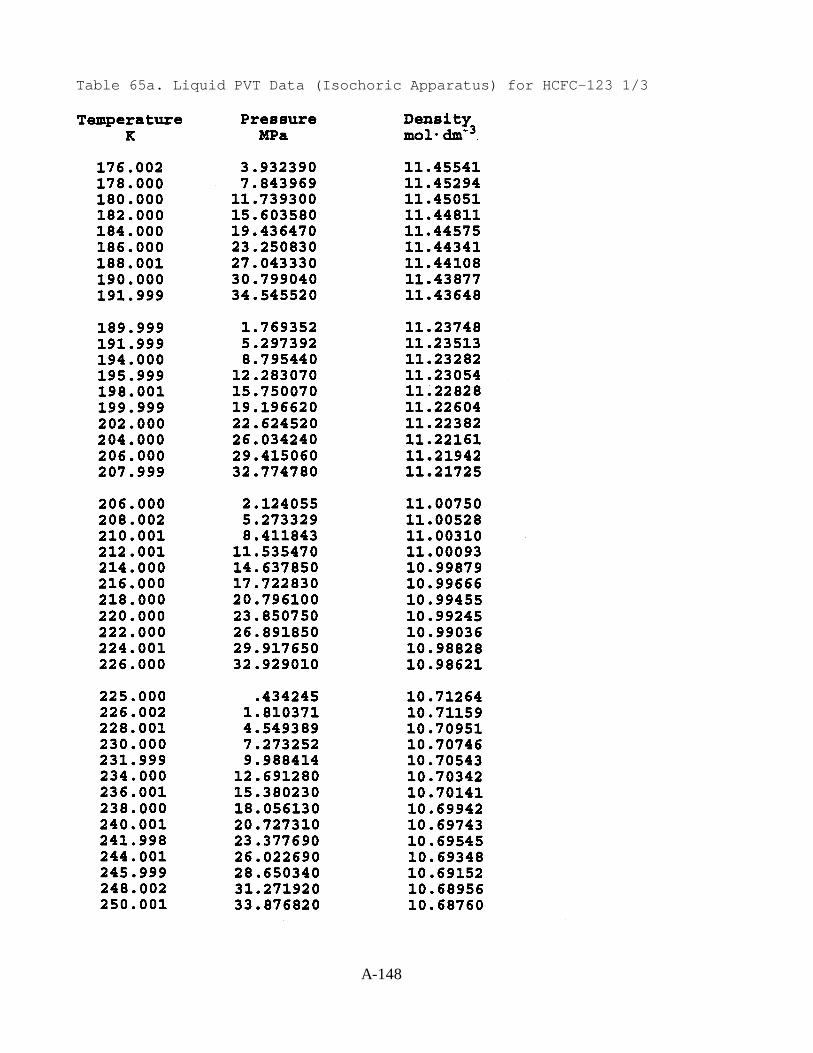
Table 65a. Liquid PVT Data (Isochoric Apparatus) for HCFC-123 1/3
A-148
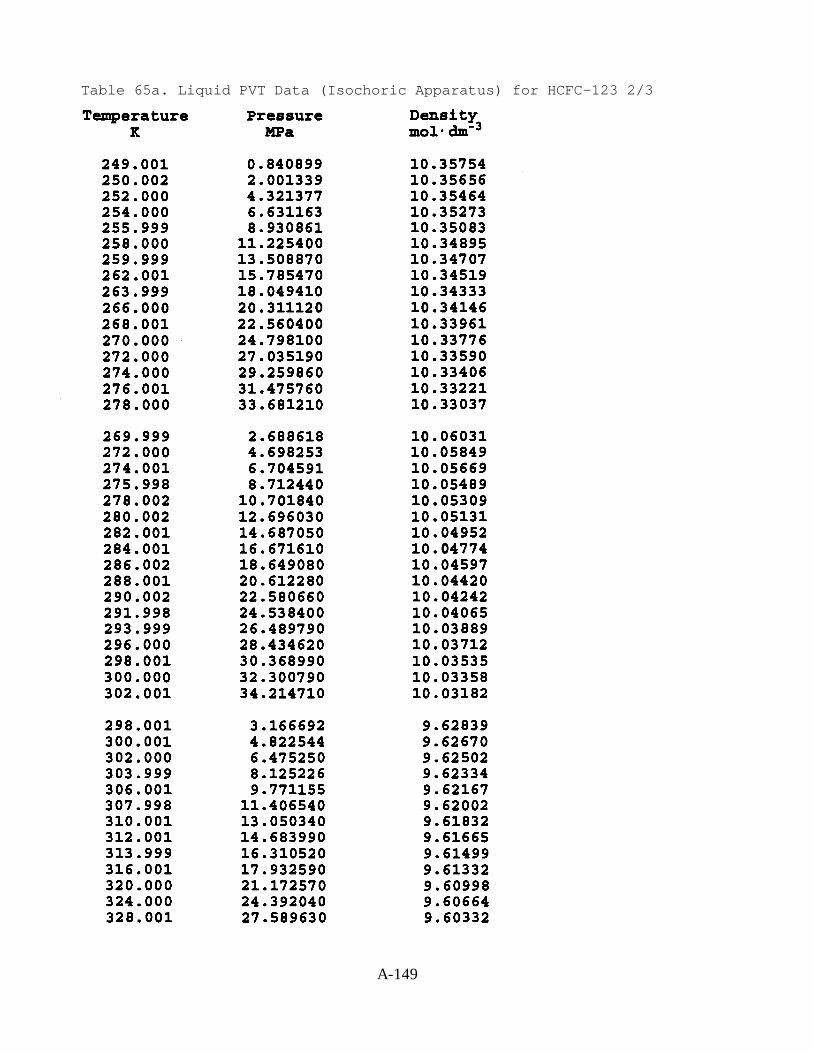
Table 65a. Liquid PVT Data (Isochoric Apparatus) for HCFC-123 2/3
A-149
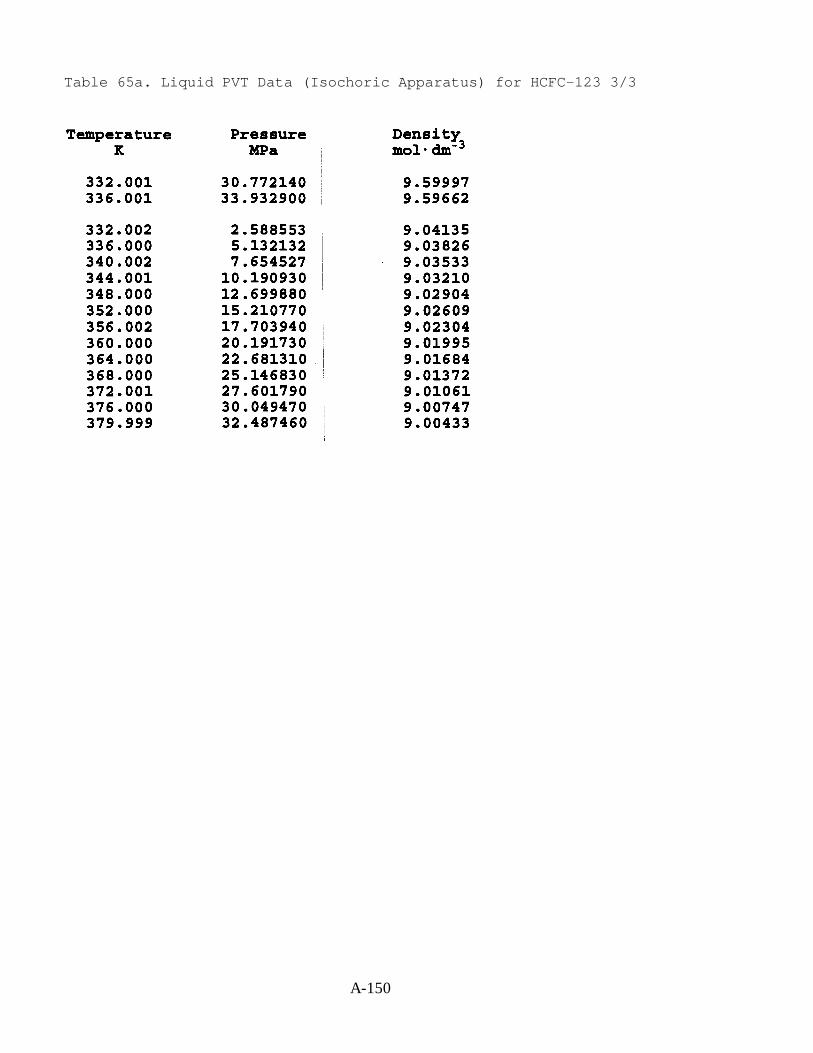
Table 65a. Liquid PVT Data (Isochoric Apparatus) for HCFC-123 3/3
A-150
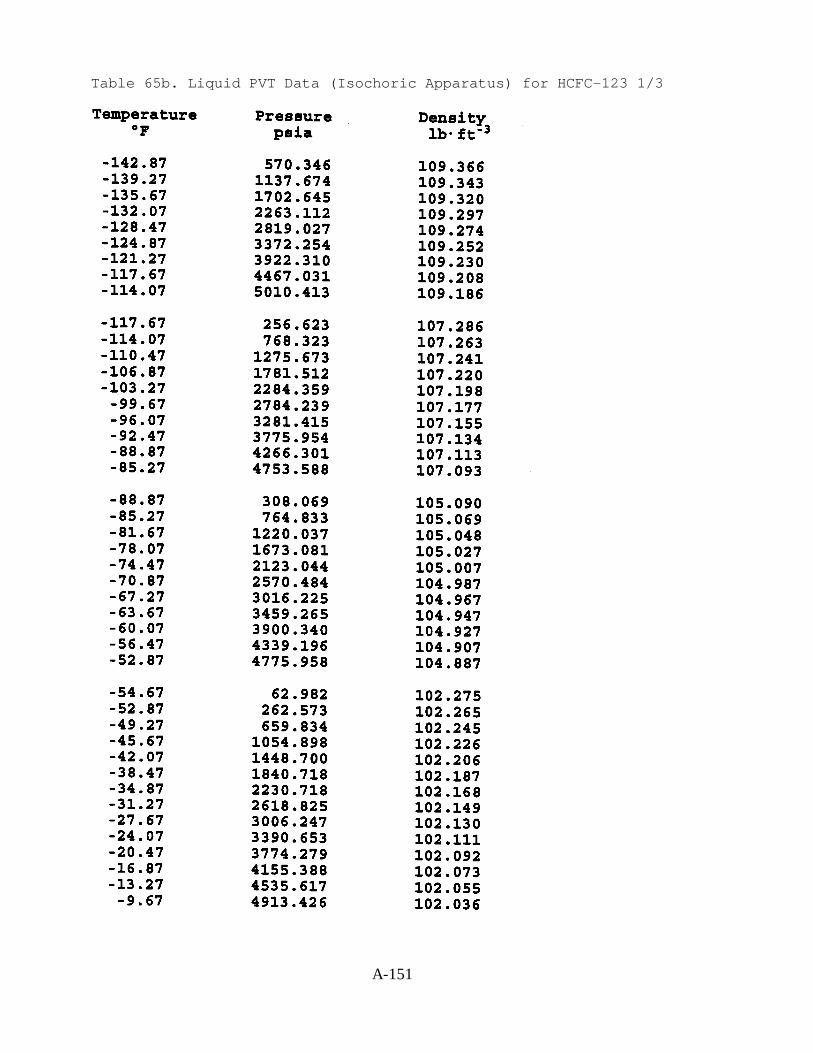
Table 65b. Liquid PVT Data (Isochoric Apparatus) for HCFC-123 1/3
A-151
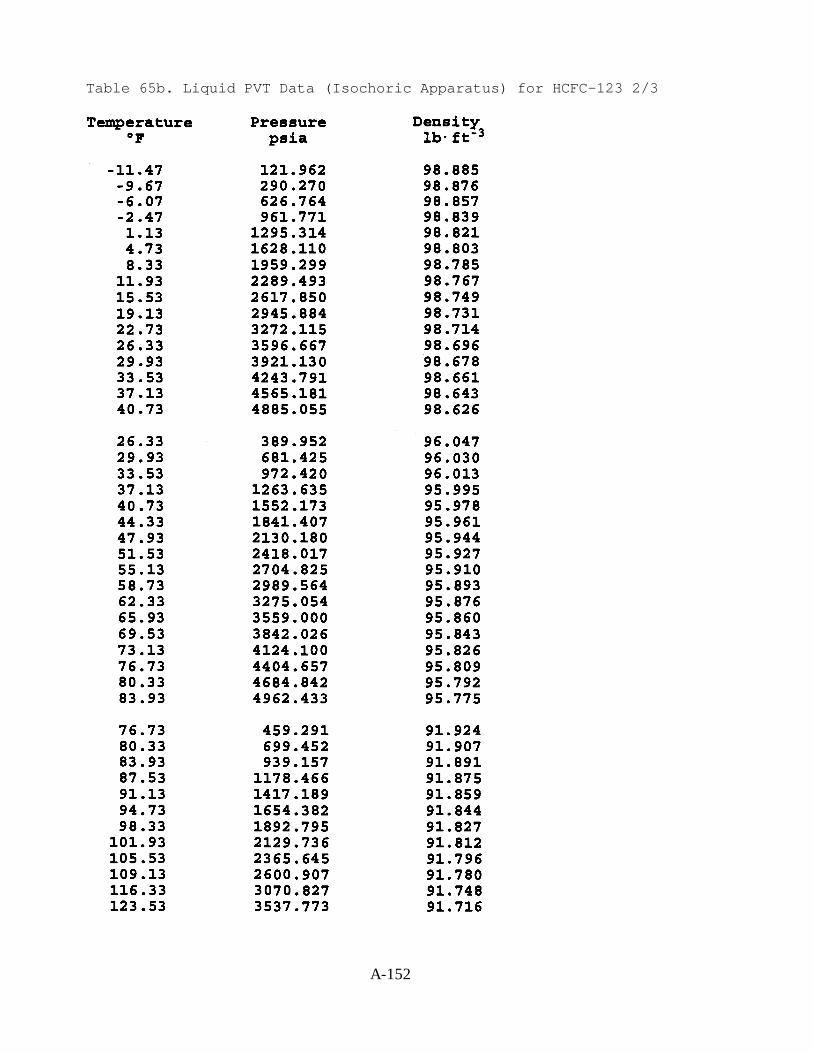
Table 65b. Liquid PVT Data (Isochoric Apparatus) for HCFC-123 2/3
A-152
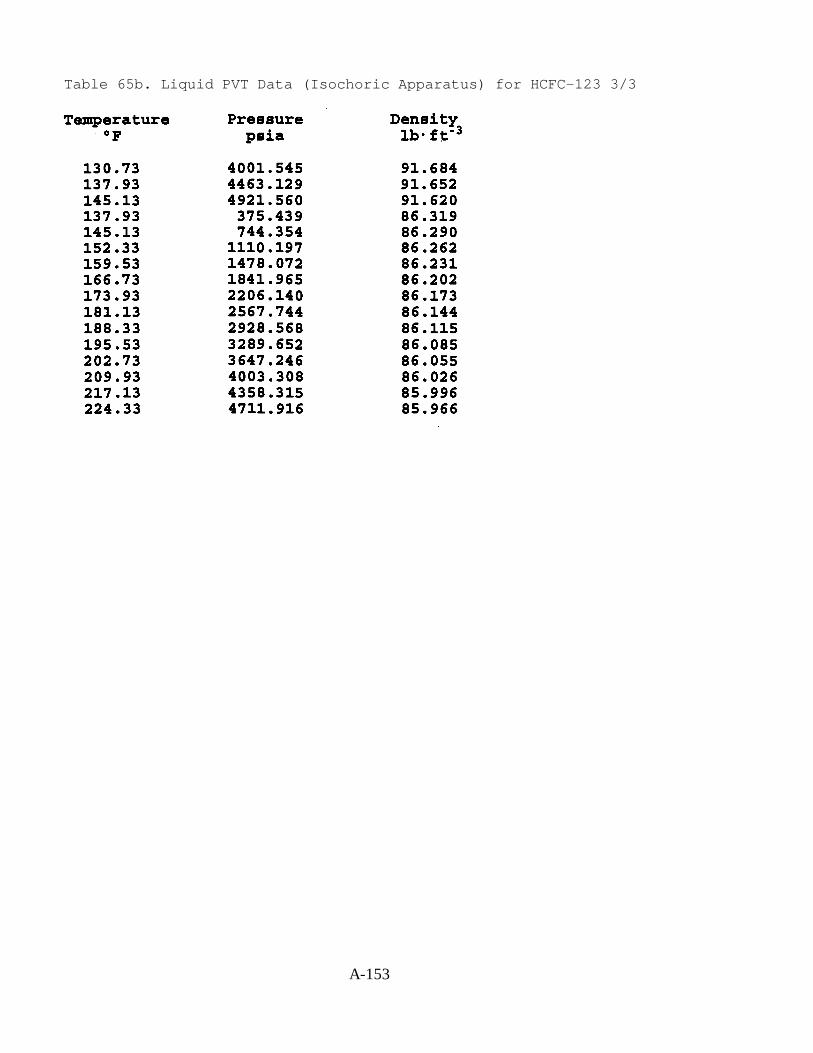
Table 65b. Liquid PVT Data (Isochoric Apparatus) for HCFC-123 3/3
A-153
A-154
Table 66(a). Experimental liquid heat capacity data for HCFC-123.
Table 66(b). Experimental liquid heat capacity data for HCFC-123.
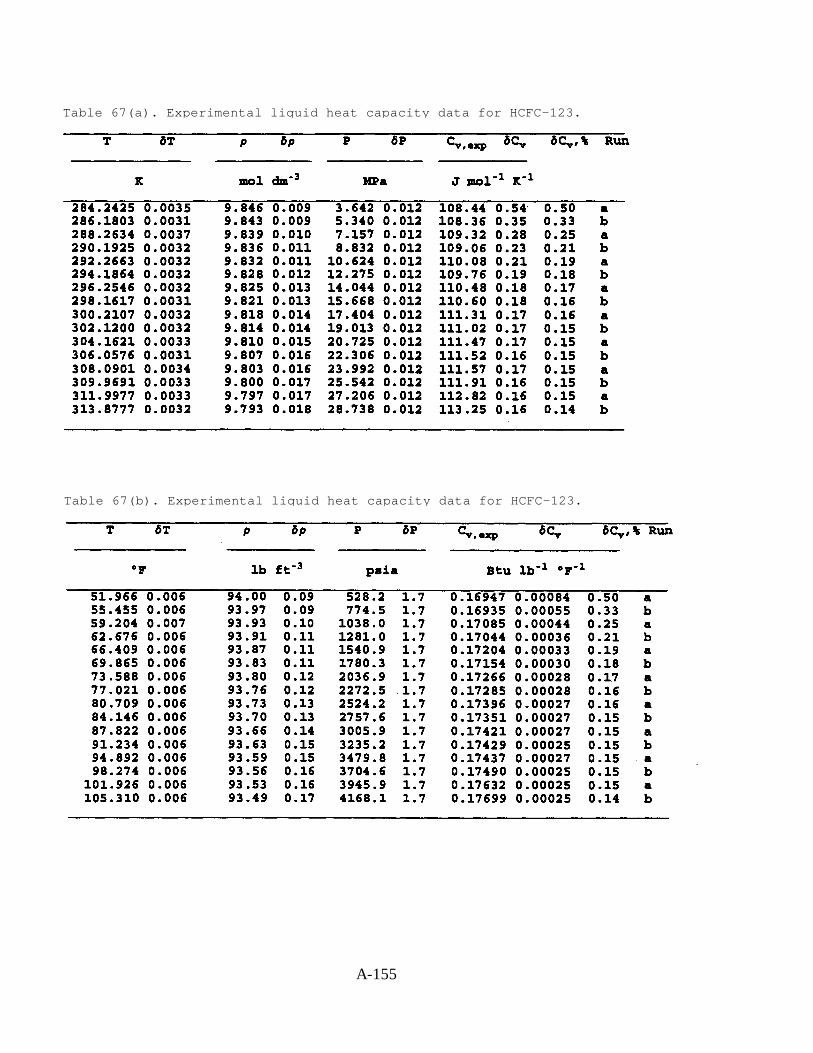
Table 67(a). Experimental liquid heat capacity data for HCFC-123.
Table 67(b). Experimental liquid heat capacity data for HCFC-123.
A-155
A-156
Table 68(a). Experimental liquid heat capacity data for HCFC-123.
Table 68(b). Experimental liquid heat capacity data for HCFC-123.
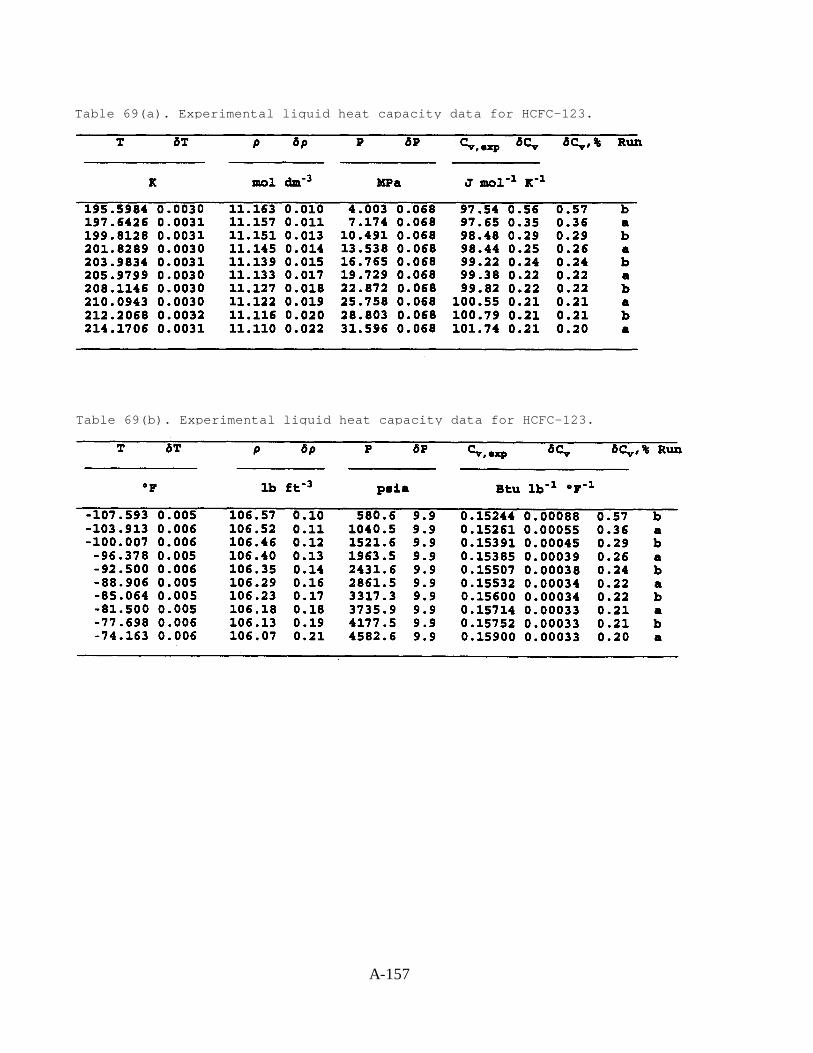
Table 69(a). Experimental liquid heat capacity data for HCFC-123.
Table 69(b). Experimental liquid heat capacity data for HCFC-123.
A-157

A-158
Table 70(a). Experimental liquid heat capacity data for HCFC-123.
Table 70(b). Experimental liquid heat capacity data for HCFC-123.
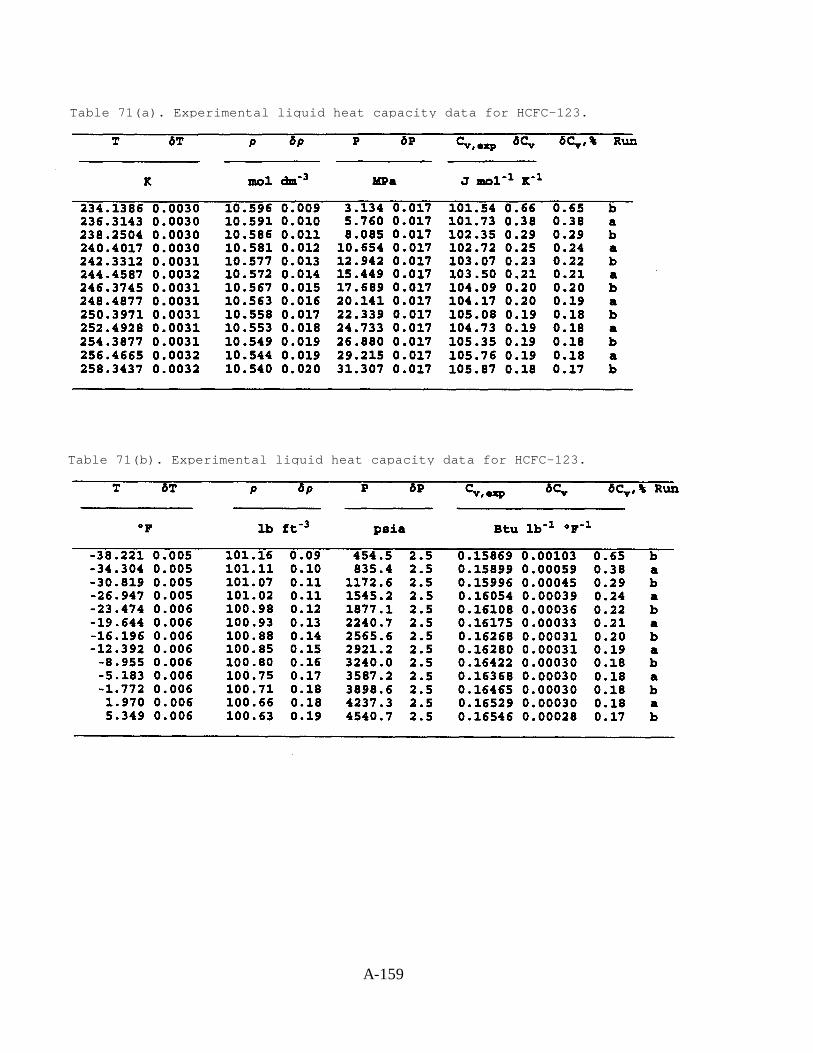
Table 71(a). Experimental liquid heat capacity data for HCFC-123.
Table 71(b). Experimental liquid heat capacity data for HCFC-123.
A-159
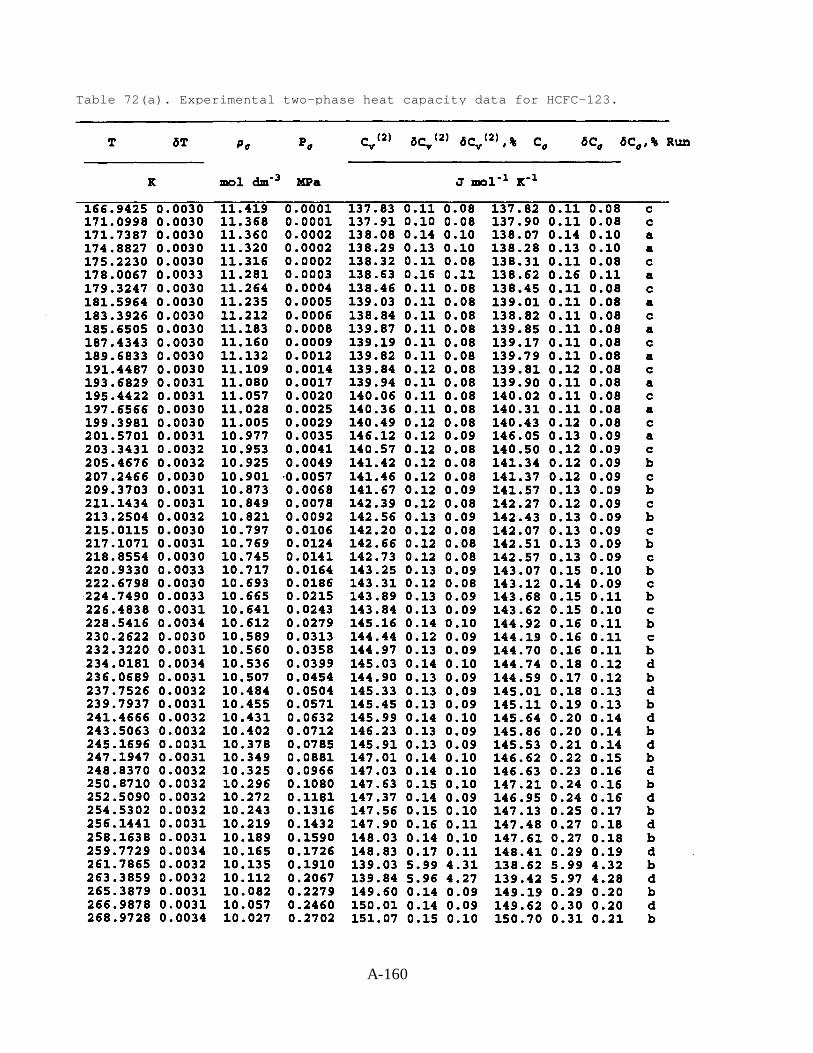
Table 72(a). Experimental two-phase heat capacity data for HCFC-123.
A-160
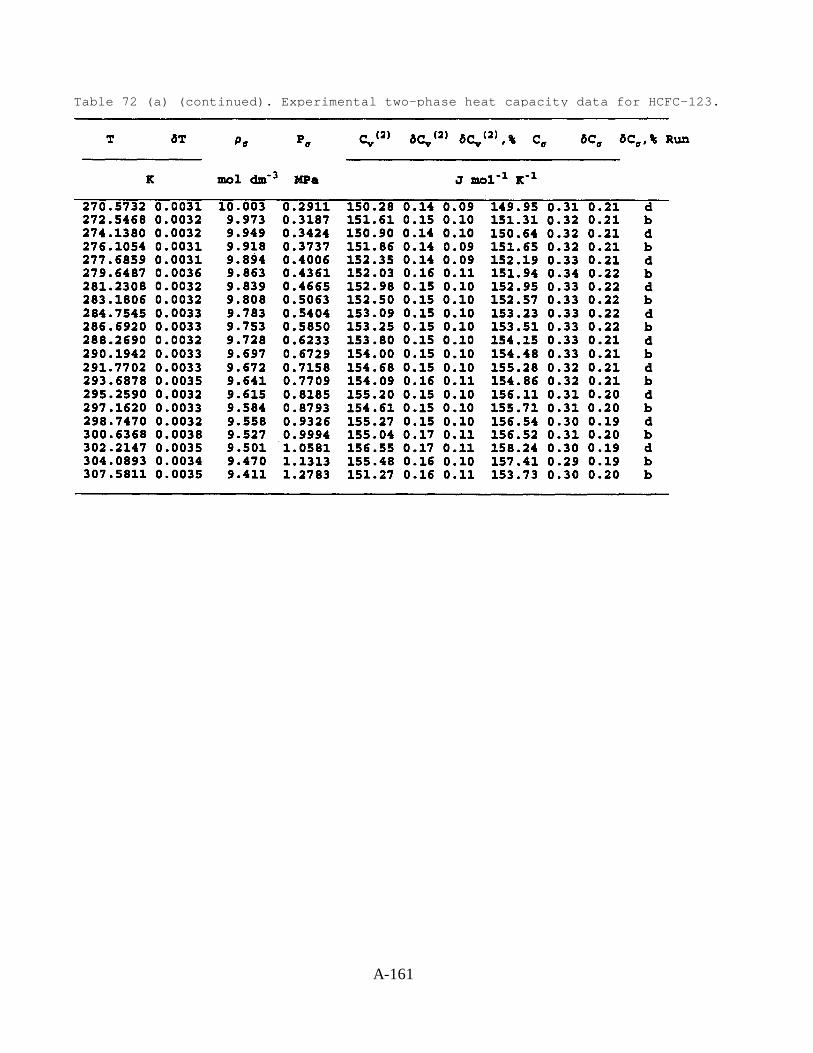
Table 72 (a) (continued). Experimental two-phase heat capacity data for HCFC-123.
A-161
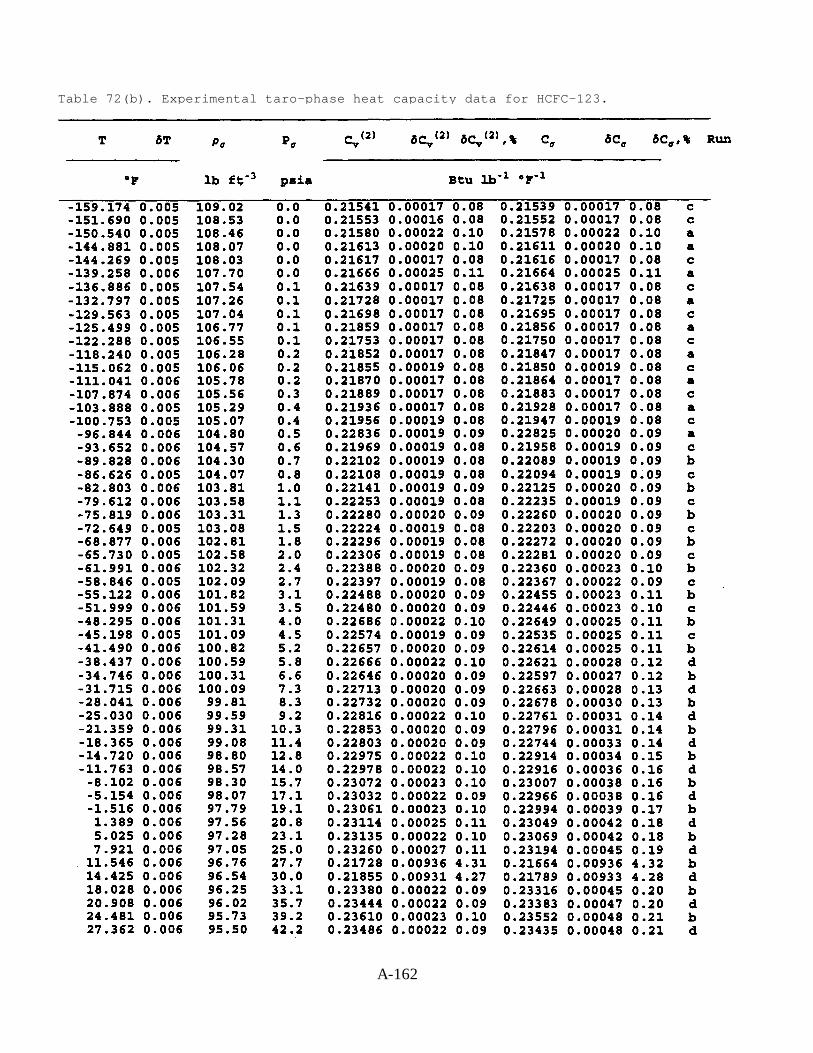
Table 72(b). Experimental taro-phase heat capacity data for HCFC-123.
A-162
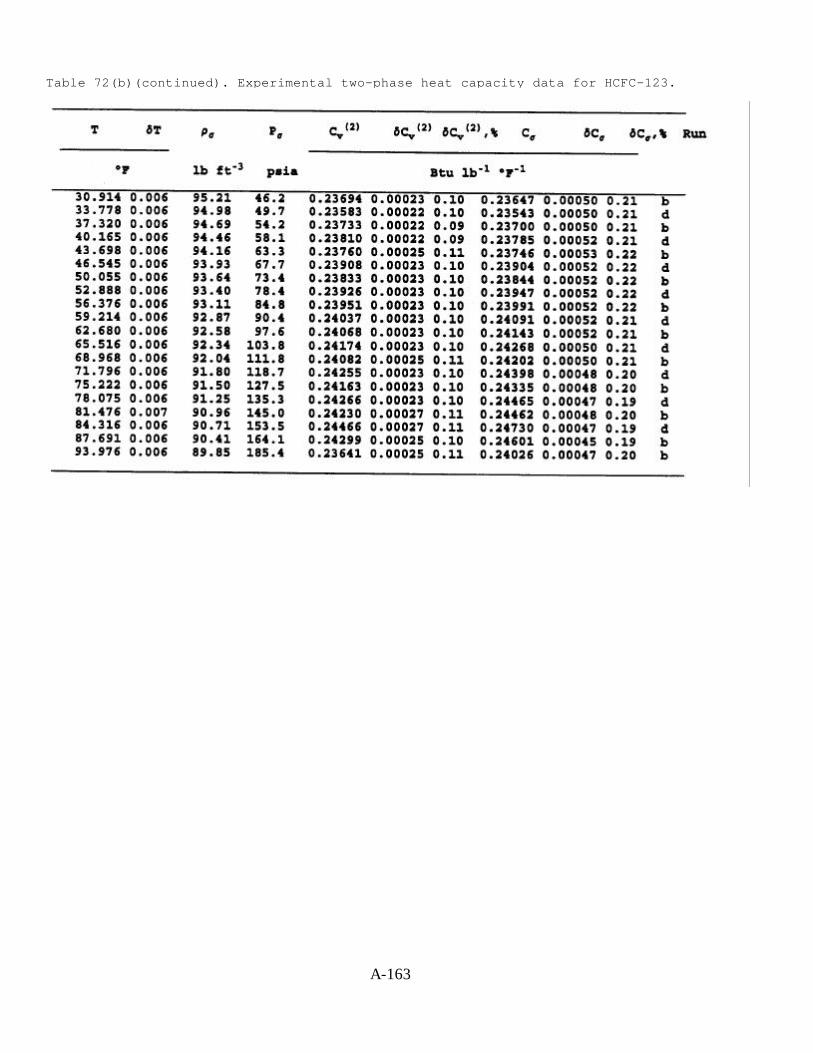
Table 72(b)(continued). Experimental two-phase heat capacity data for HCFC-123.
A-163
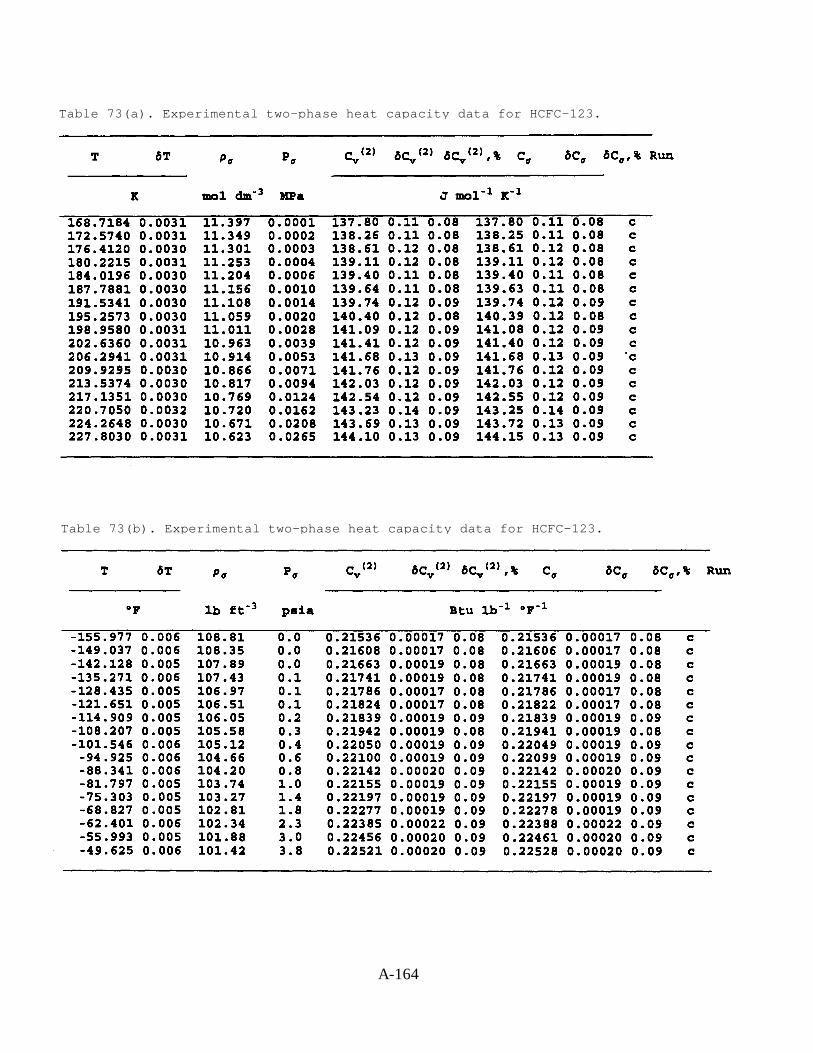
Table 73(a). Experimental two-phase heat capacity data for HCFC-123.
Table 73(b). Experimental two-phase heat capacity data for HCFC-123.
A-164

Table 74. Coefficients to the MBWR equation of state for HCFC-123 (units are K, bar, L, mol)
A-165
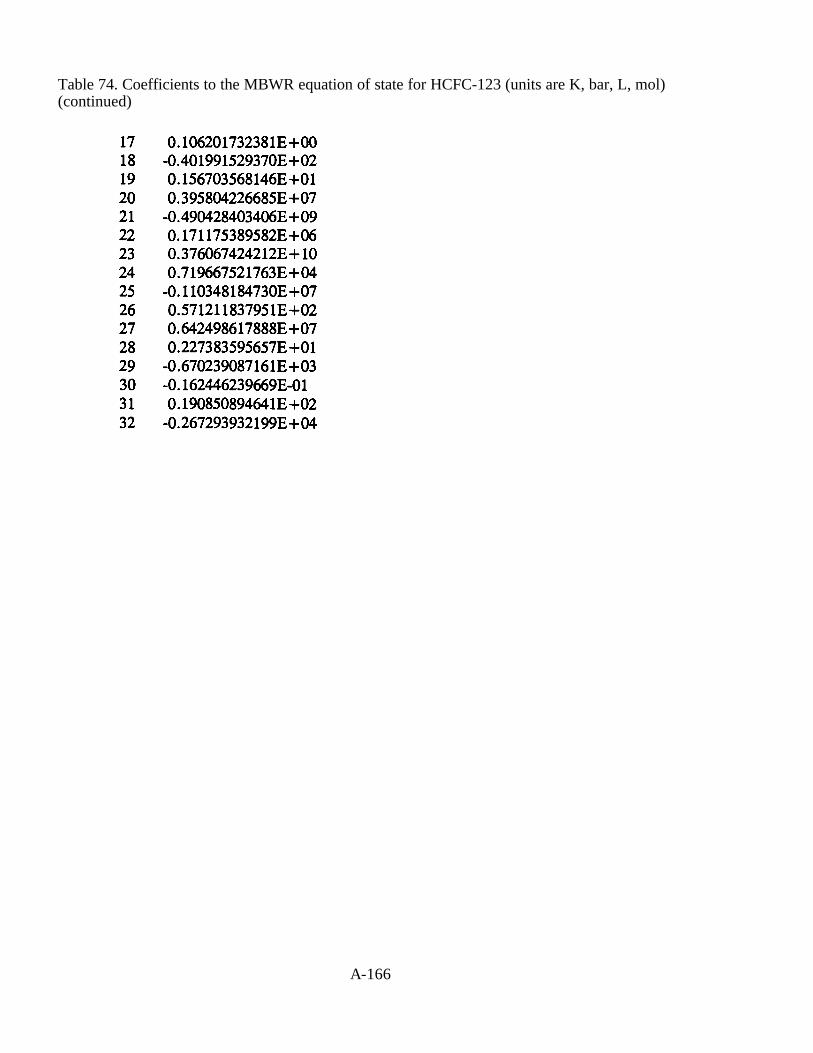
Table 74. Coefficients to the MBWR equation of state for HCFC-123 (units are K, bar, L, mol)(continued)
A-166
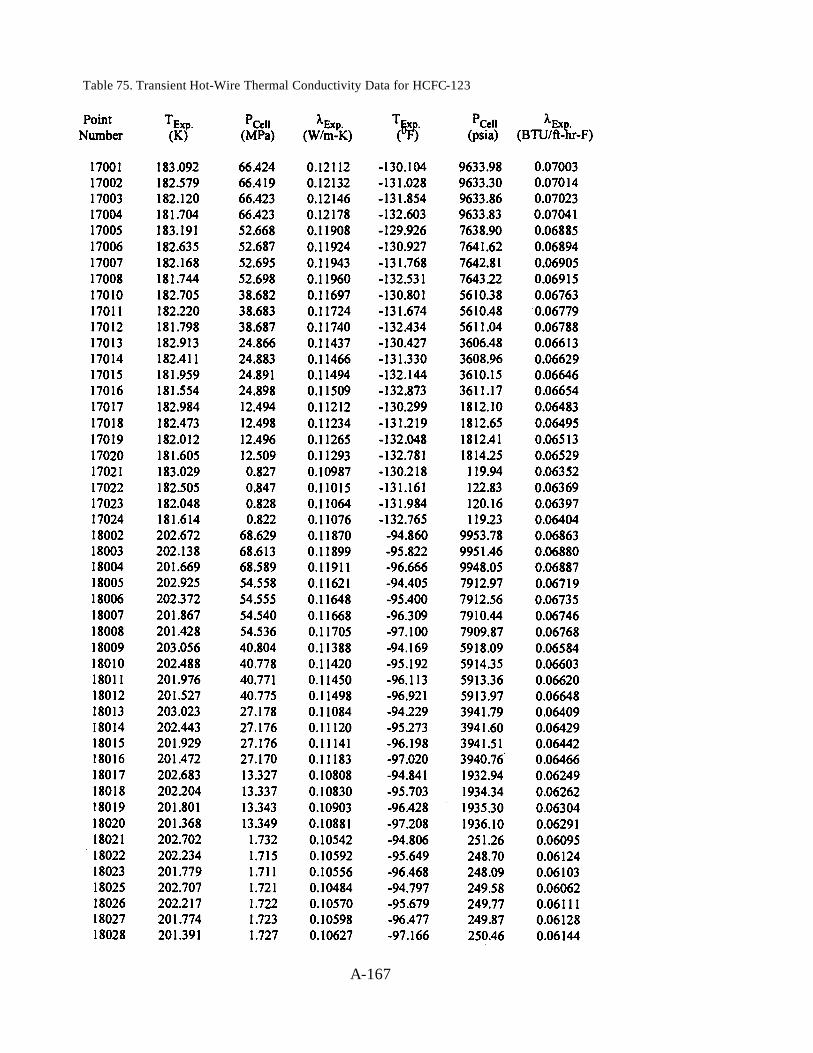
Table 75. Transient Hot-Wire Thermal Conductivity Data for HCFC-123
A-167
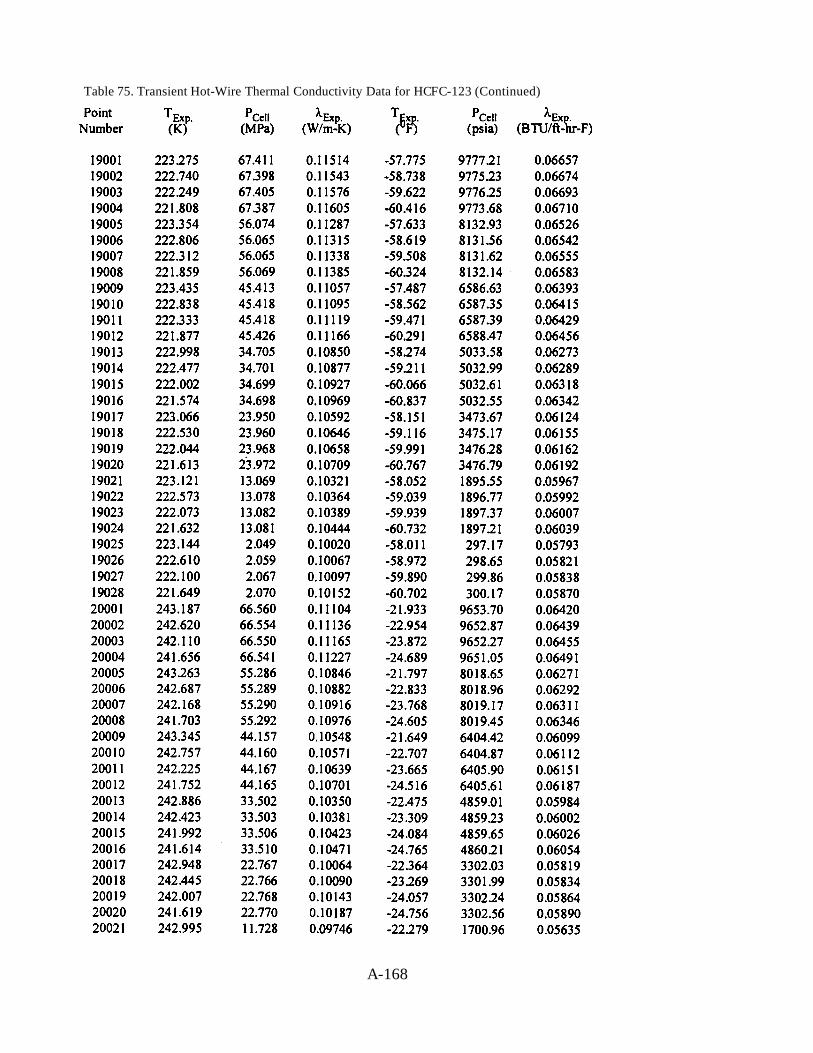
Table 75. Transient Hot-Wire Thermal Conductivity Data for HCFC-123 (Continued)
A-168
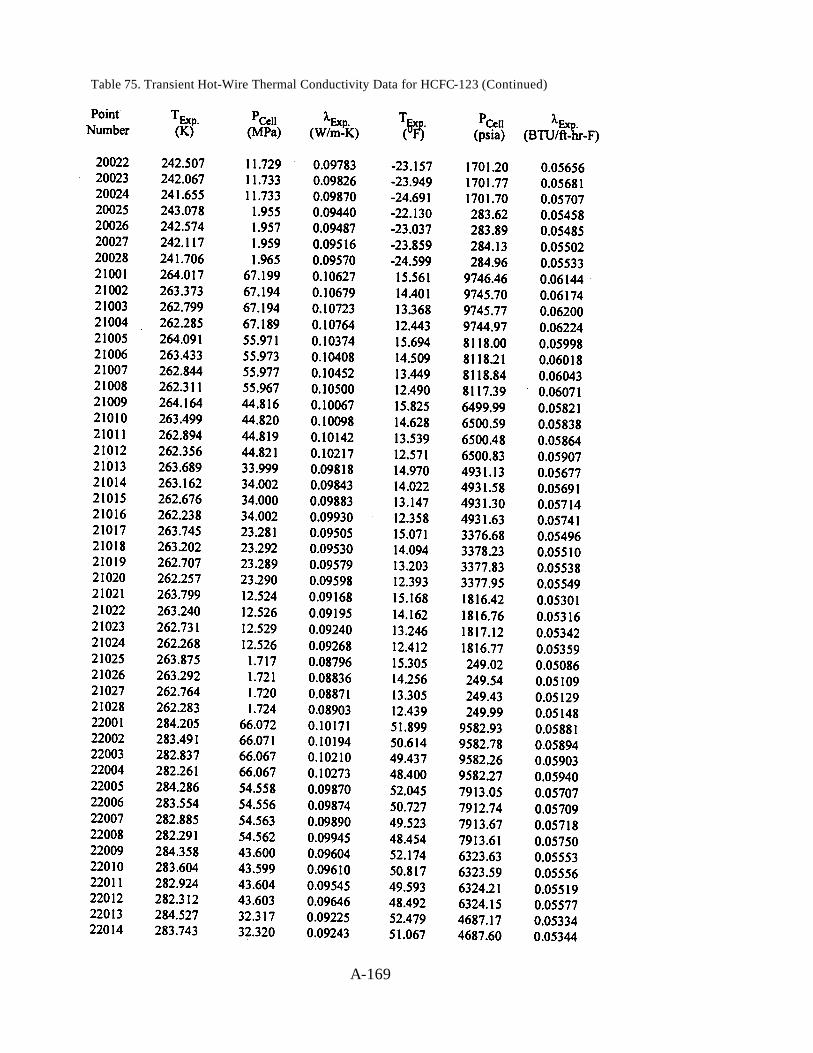
Table 75. Transient Hot-Wire Thermal Conductivity Data for HCFC-123 (Continued)
A-169
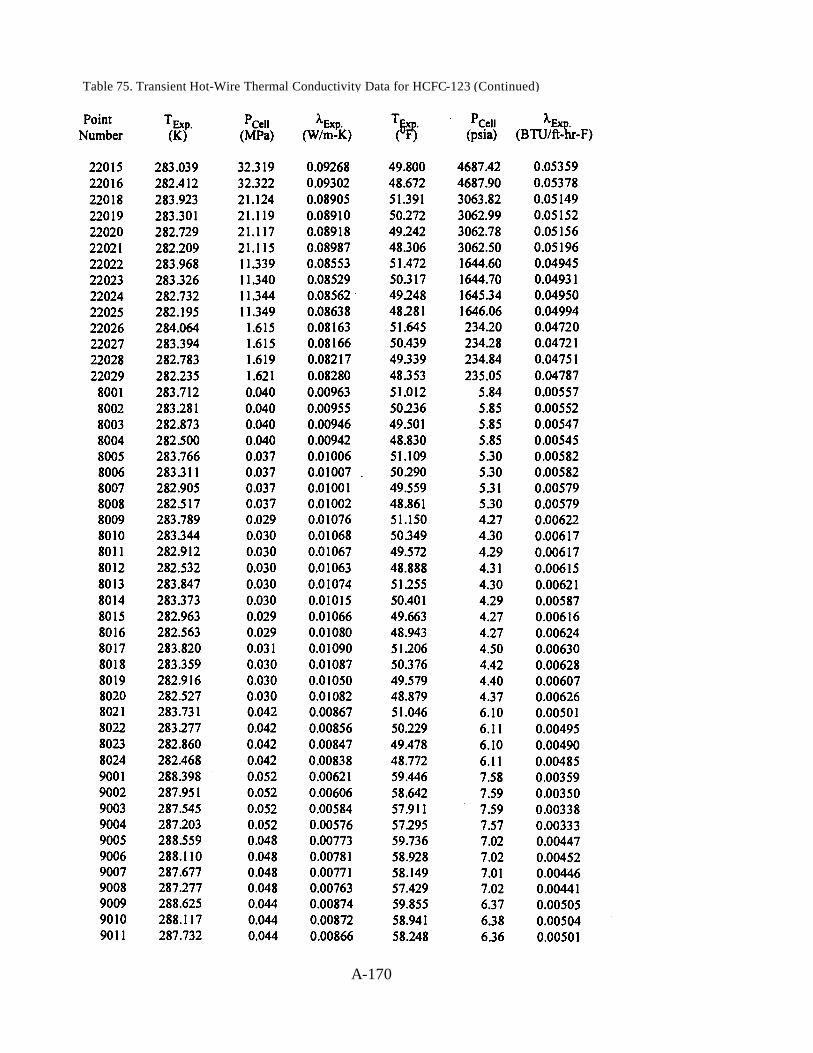
Table 75. Transient Hot-Wire Thermal Conductivity Data for HCFC-123 (Continued)
A-170
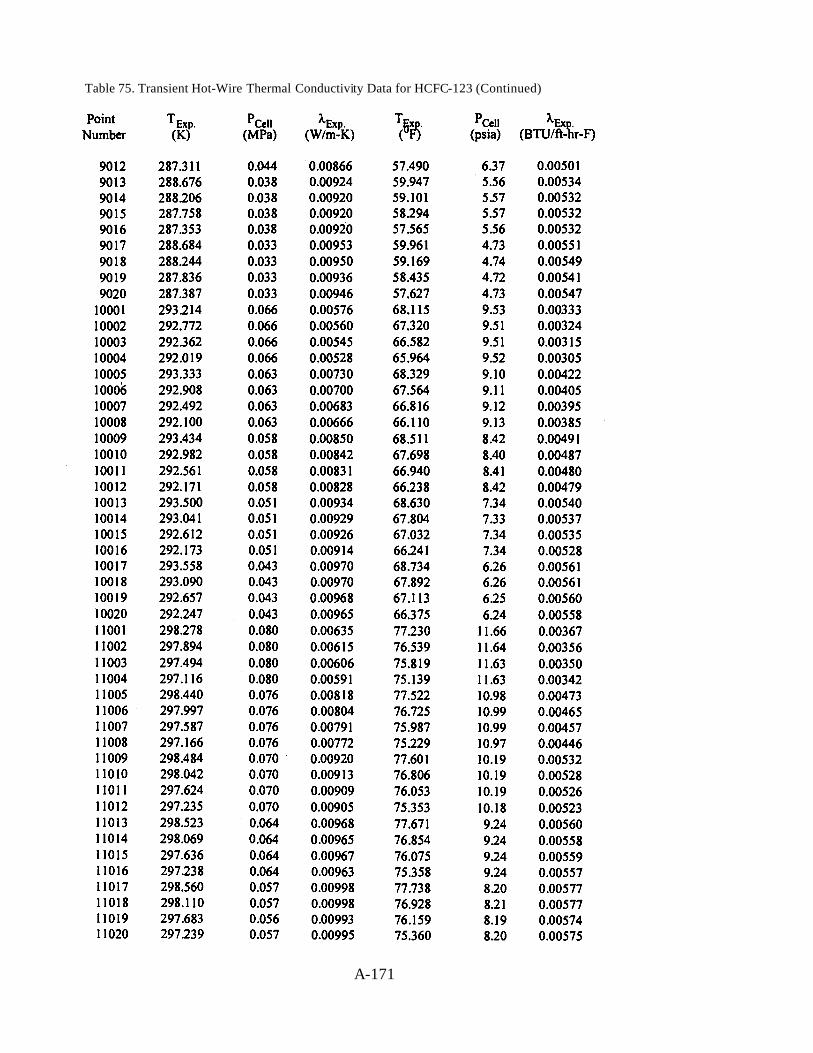
Table 75. Transient Hot-Wire Thermal Conductivity Data for HCFC-123 (Continued)
A-171
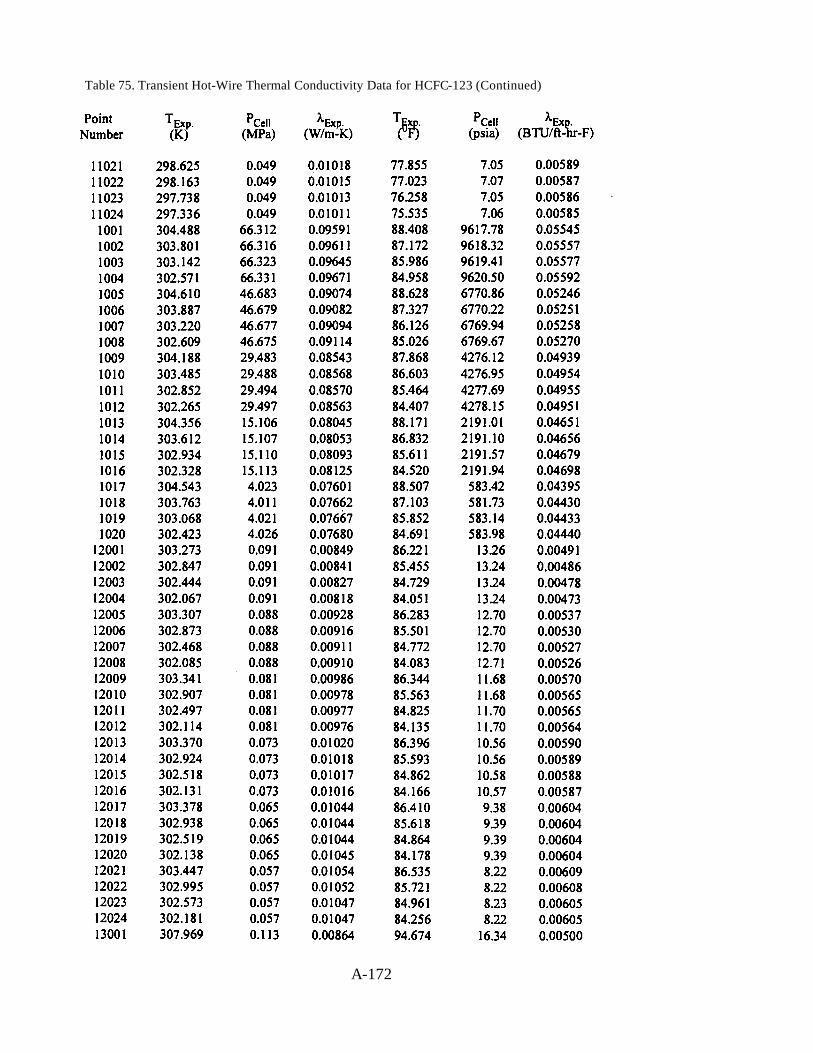
Table 75. Transient Hot-Wire Thermal Conductivity Data for HCFC-123 (Continued)
A-172
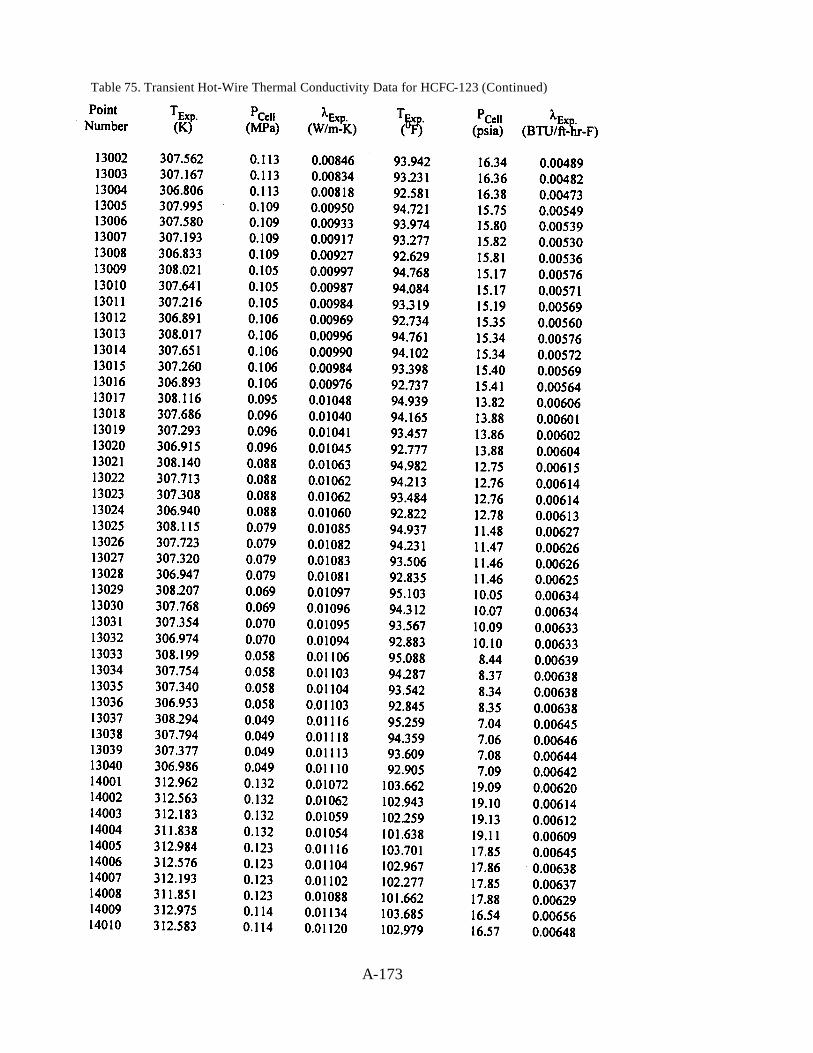
Table 75. Transient Hot-Wire Thermal Conductivity Data for HCFC-123 (Continued)
A-173
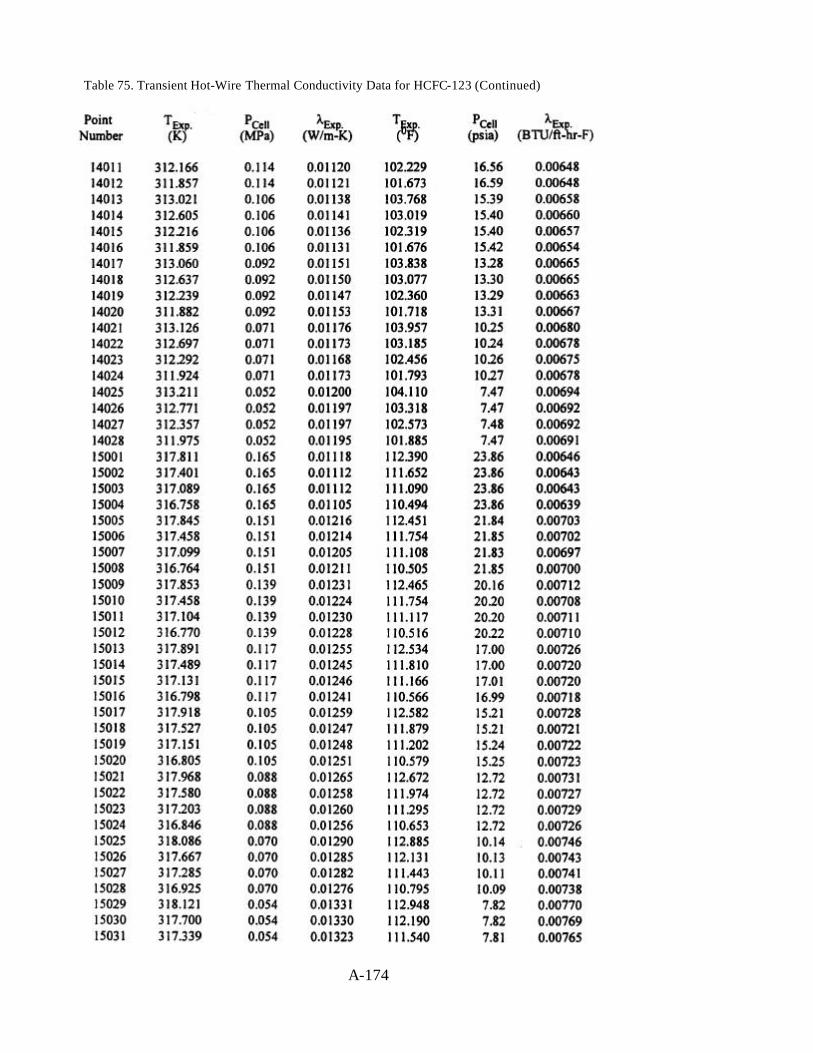
Table 75. Transient Hot-Wire Thermal Conductivity Data for HCFC-123 (Continued)
A-174
A-175
Table 75. Transient Hot-Wire Thermal Conductivity Data for HCFC-123 (Continued)
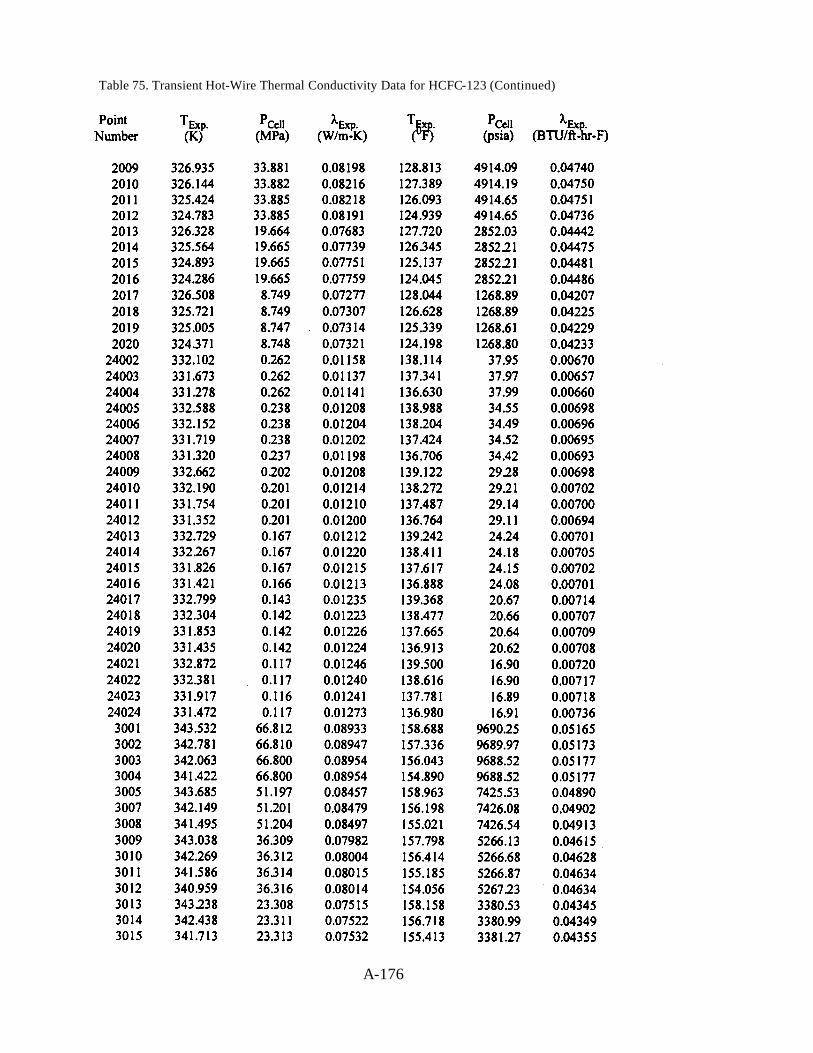
Table 75. Transient Hot-Wire Thermal Conductivity Data for HCFC-123 (Continued)
A-176
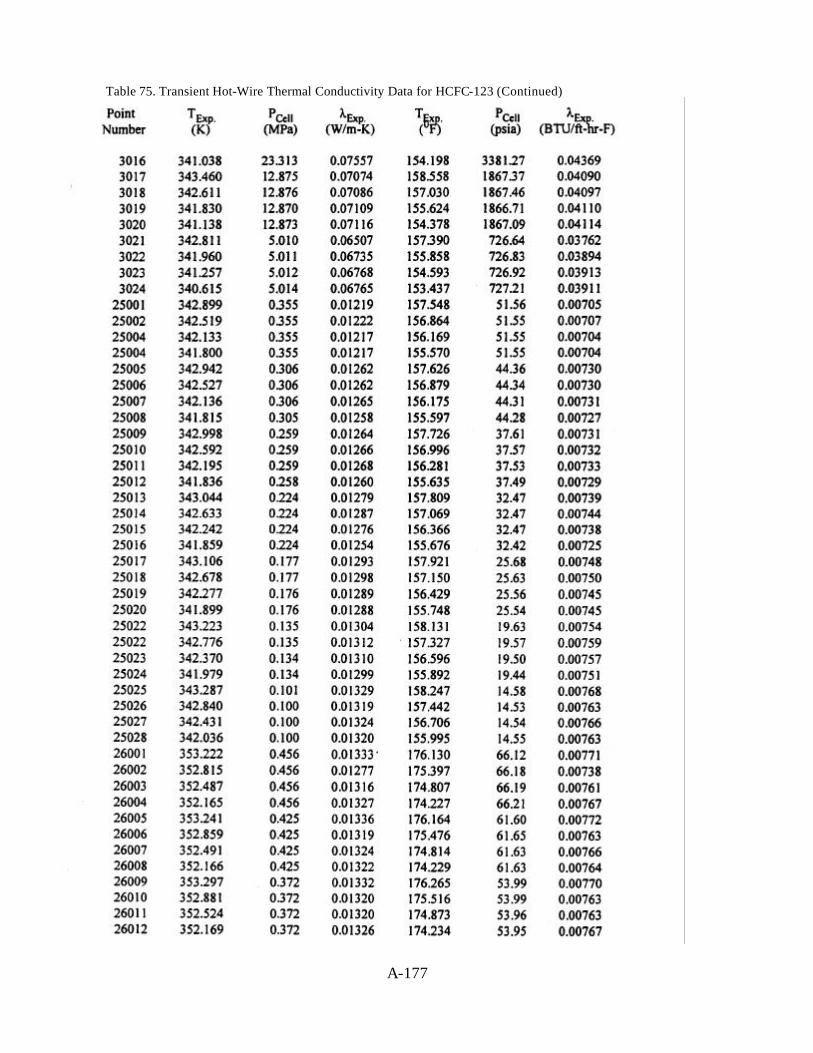
Table 75. Transient Hot-Wire Thermal Conductivity Data for HCFC-123 (Continued)
A-177
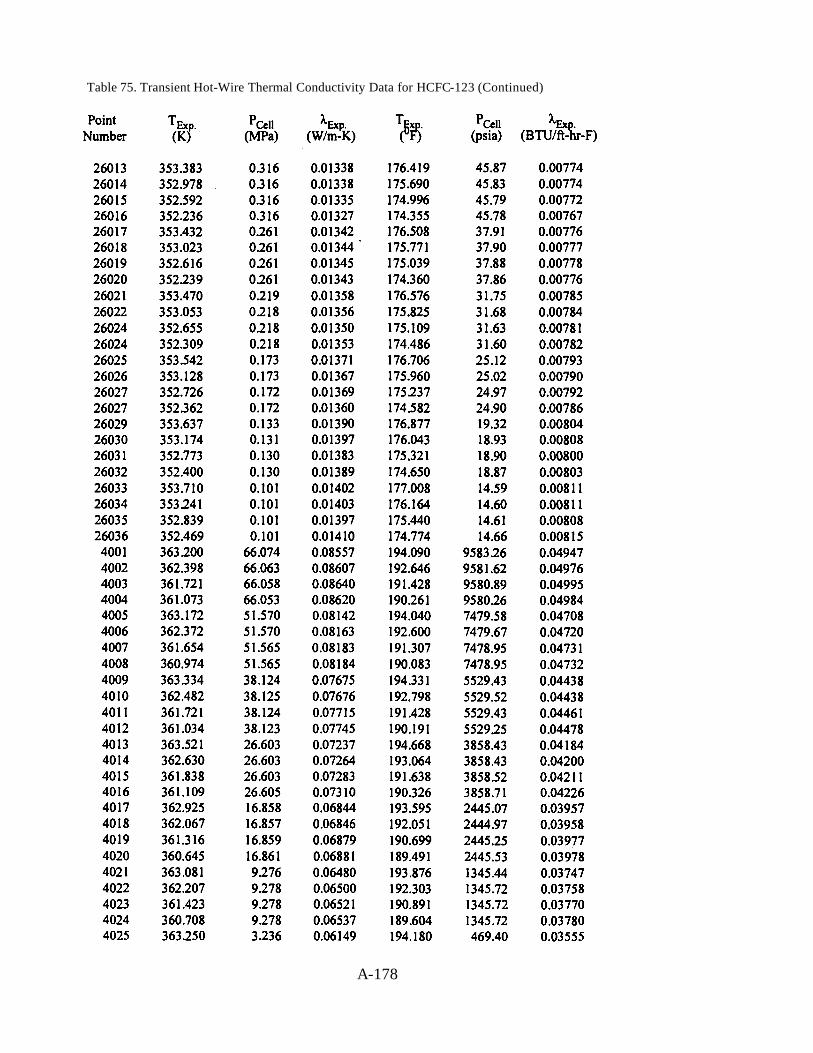
Table 75. Transient Hot-Wire Thermal Conductivity Data for HCFC-123 (Continued)
A-178
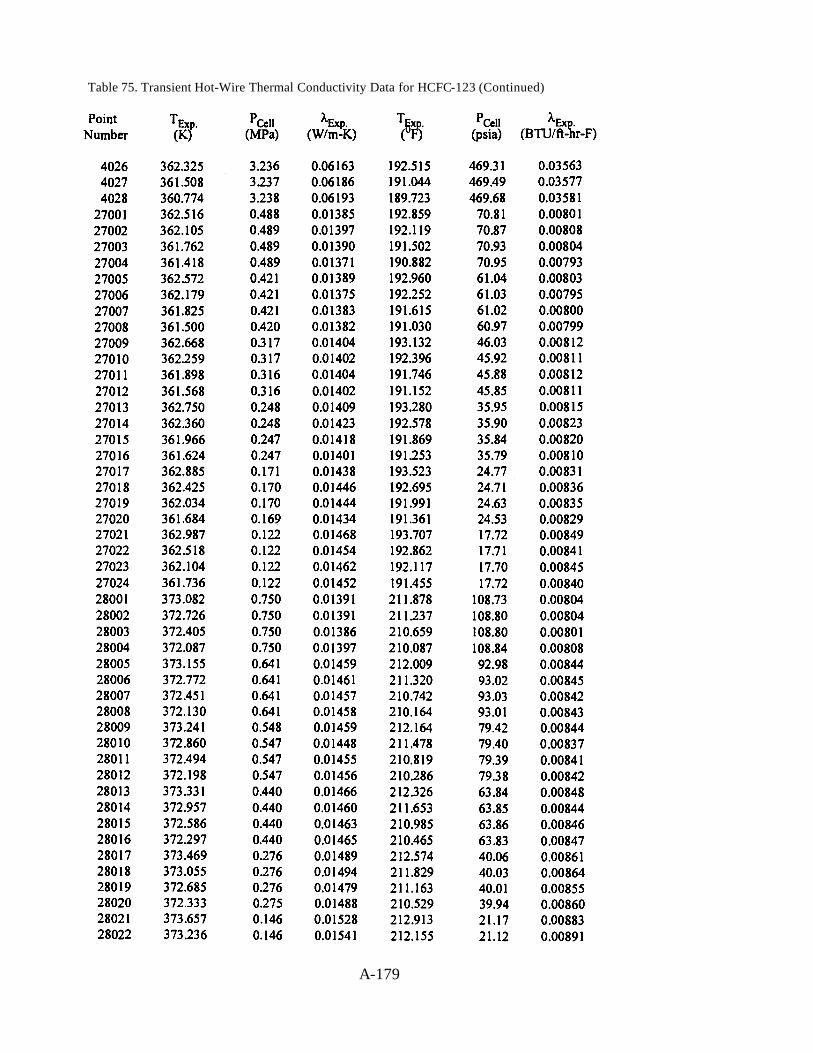
Table 75. Transient Hot-Wire Thermal Conductivity Data for HCFC-123 (Continued)
A-179
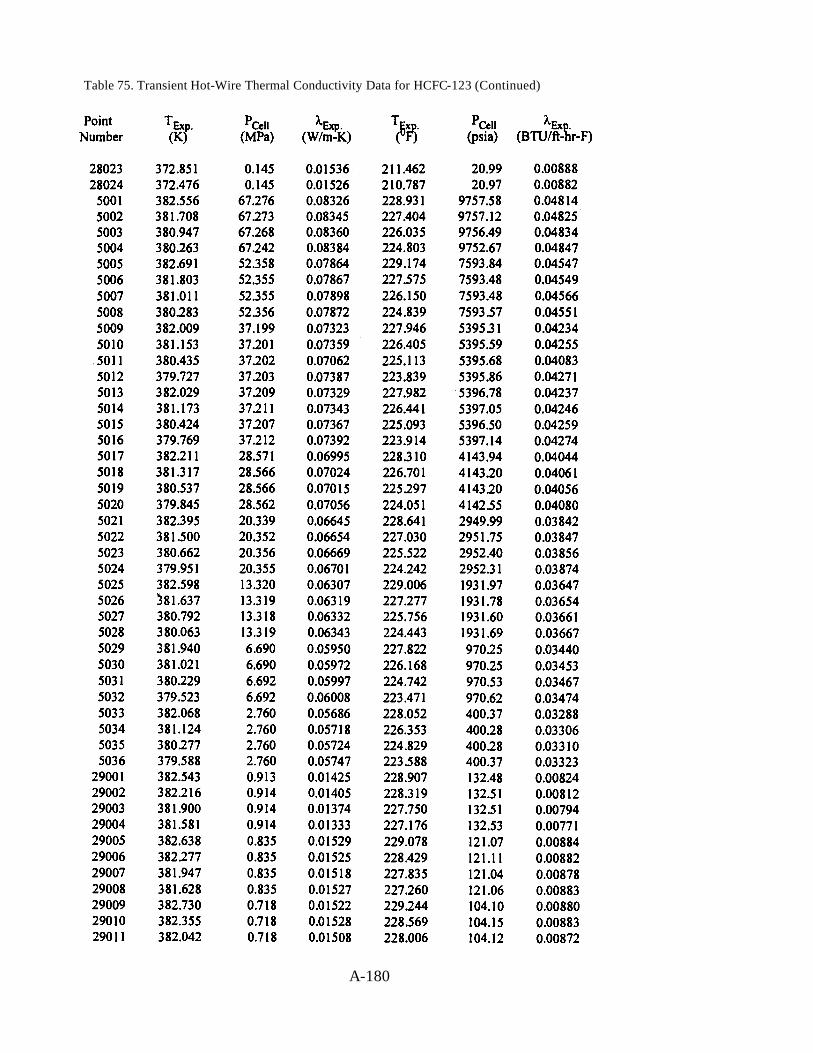
Table 75. Transient Hot-Wire Thermal Conductivity Data for HCFC-123 (Continued)
A-180
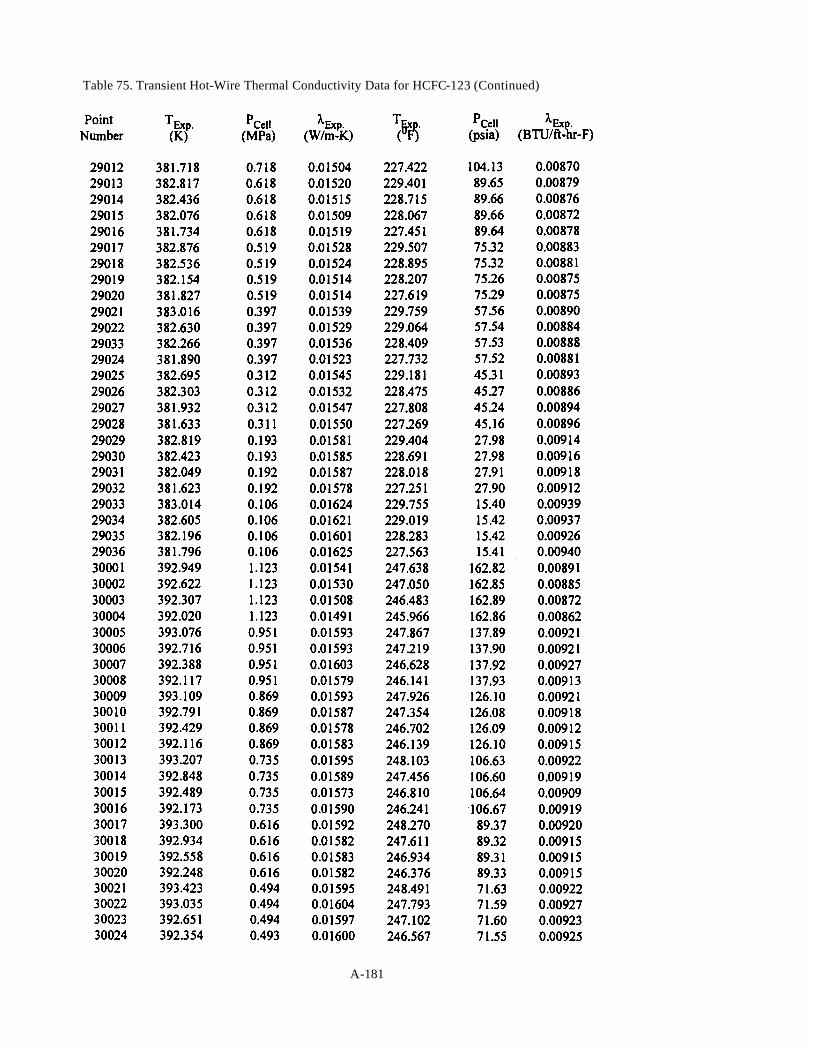
Table 75. Transient Hot-Wire Thermal Conductivity Data for HCFC-123 (Continued)
A-181
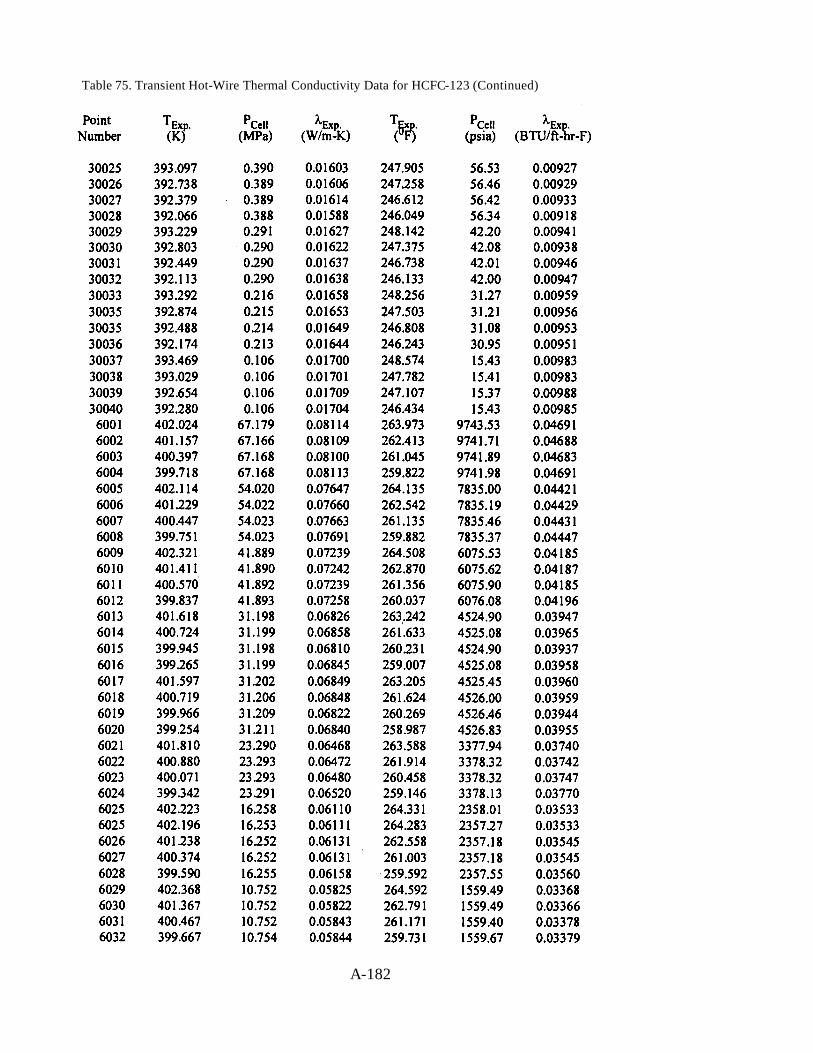
Table 75. Transient Hot-Wire Thermal Conductivity Data for HCFC-123 (Continued)
A-182
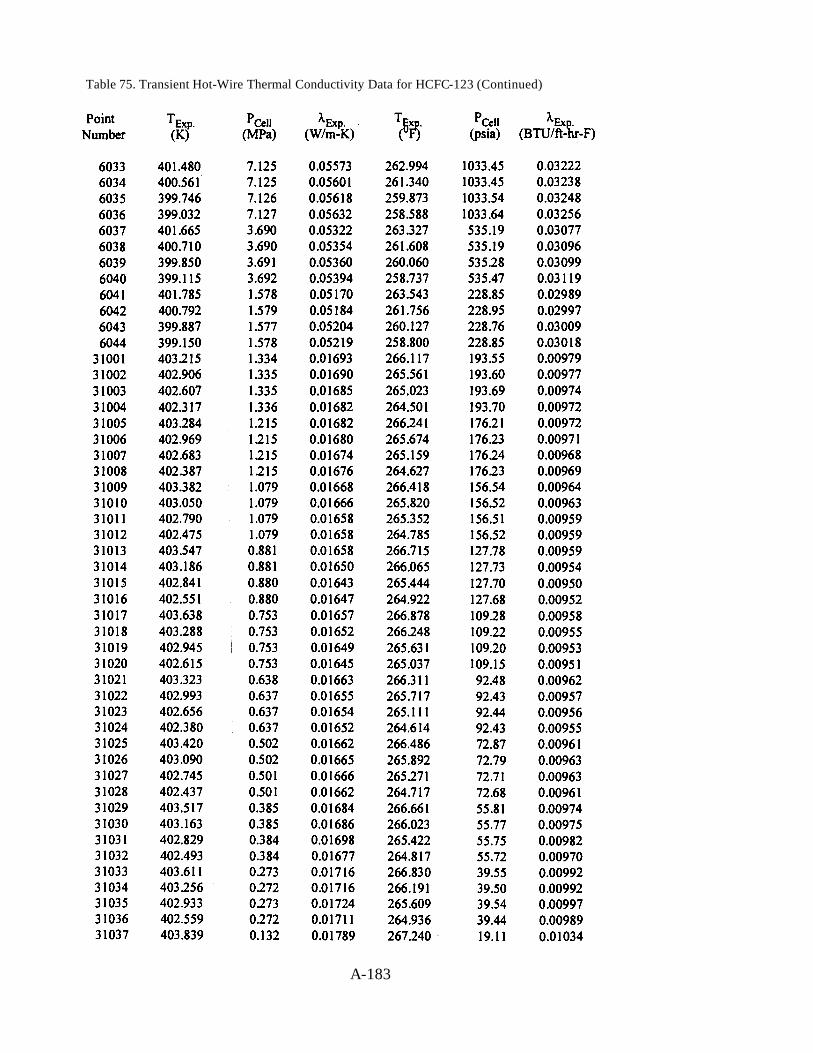
Table 75. Transient Hot-Wire Thermal Conductivity Data for HCFC-123 (Continued)
A-183
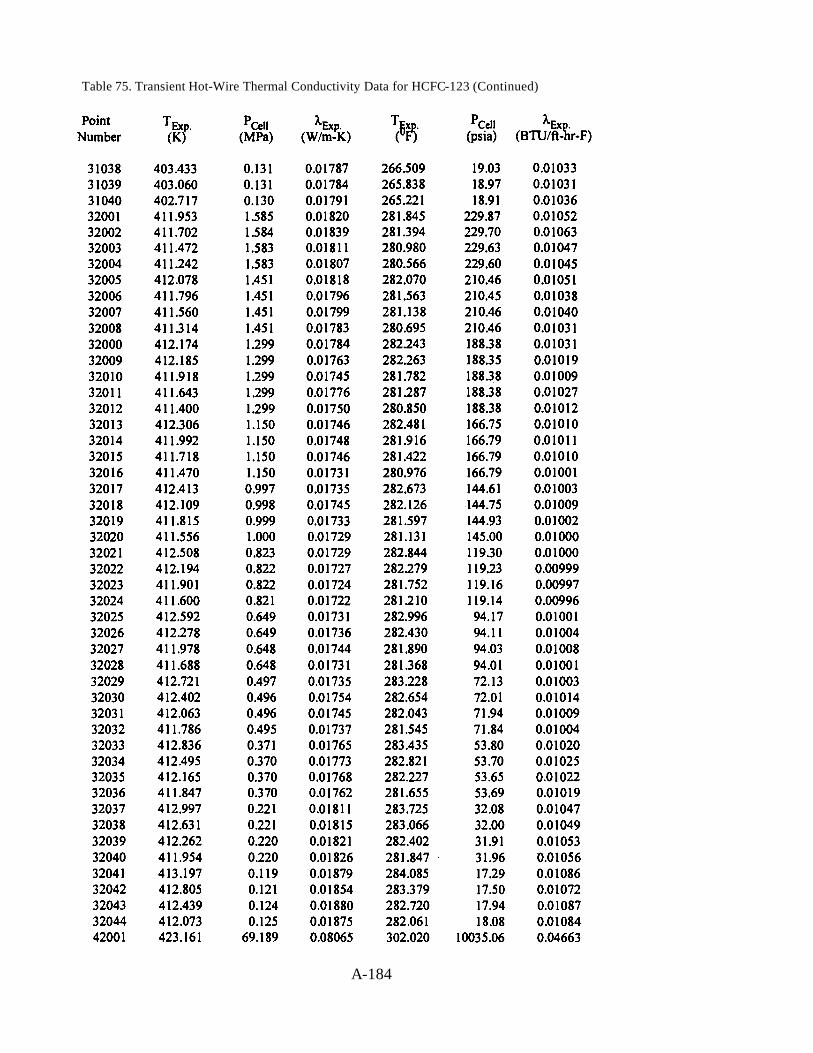
Table 75. Transient Hot-Wire Thermal Conductivity Data for HCFC-123 (Continued)
A-184
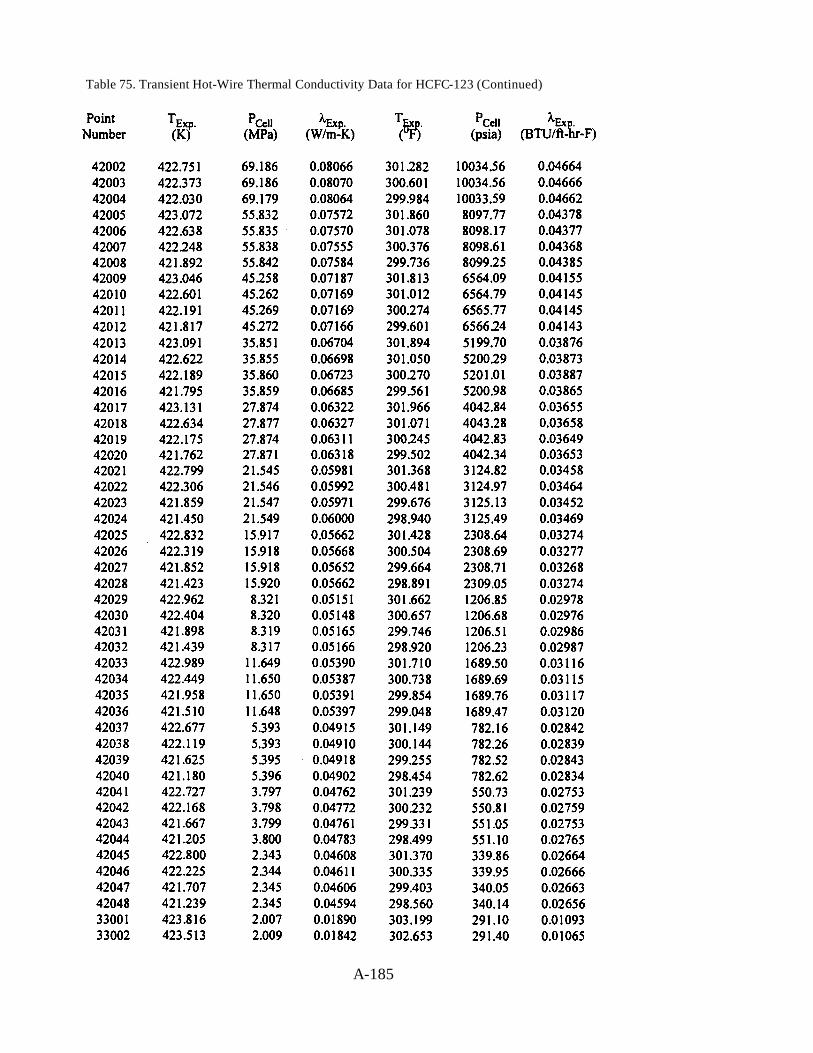
Table 75. Transient Hot-Wire Thermal Conductivity Data for HCFC-123 (Continued)
A-185
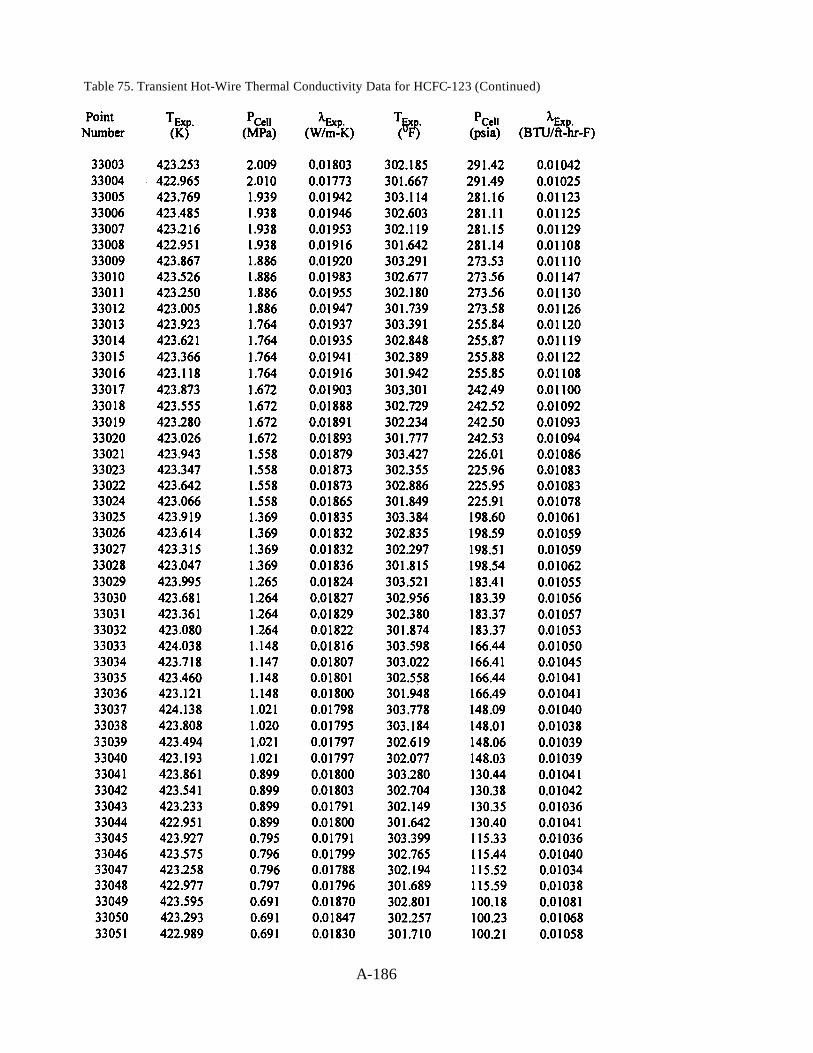
Table 75. Transient Hot-Wire Thermal Conductivity Data for HCFC-123 (Continued)
A-186
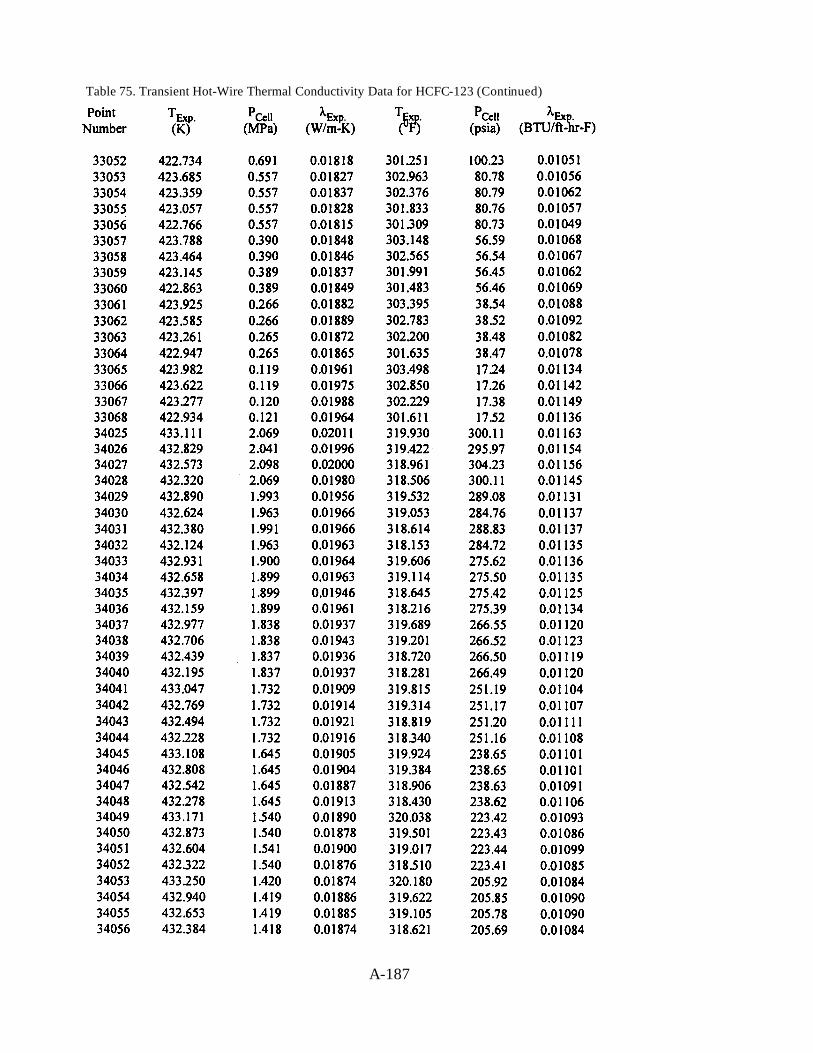
Table 75. Transient Hot-Wire Thermal Conductivity Data for HCFC-123 (Continued)
A-187
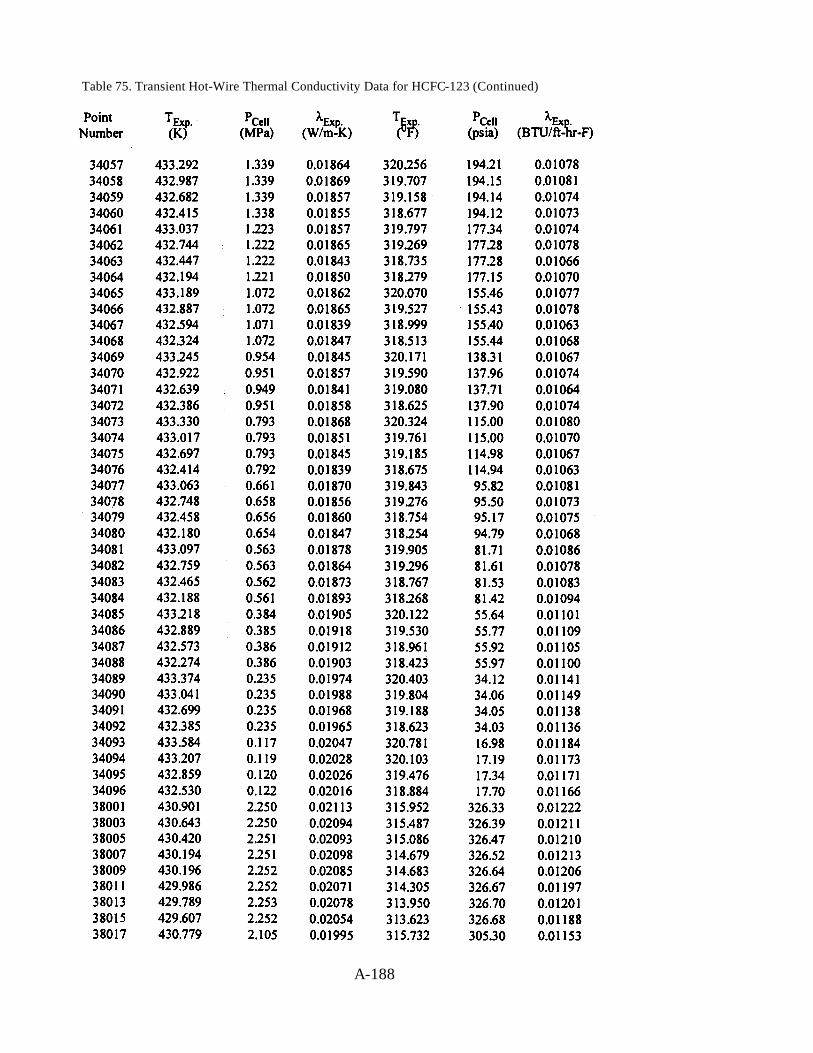
Table 75. Transient Hot-Wire Thermal Conductivity Data for HCFC-123 (Continued)
A-188
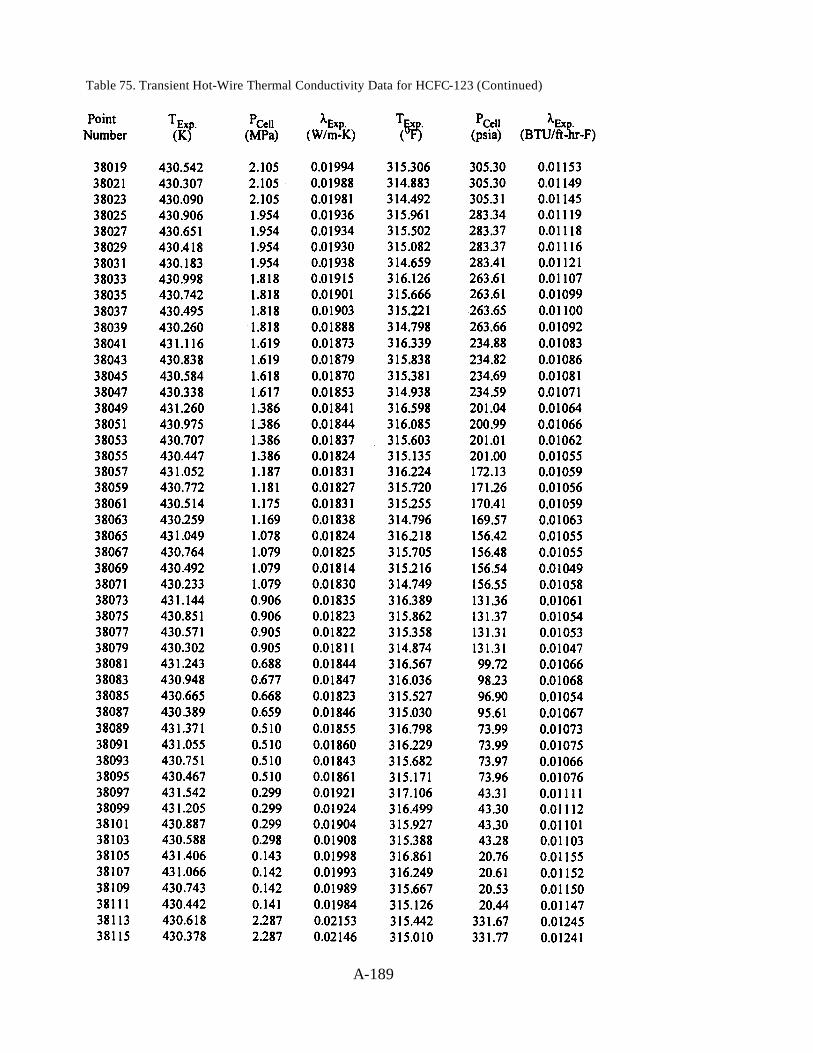
Table 75. Transient Hot-Wire Thermal Conductivity Data for HCFC-123 (Continued)
A-189
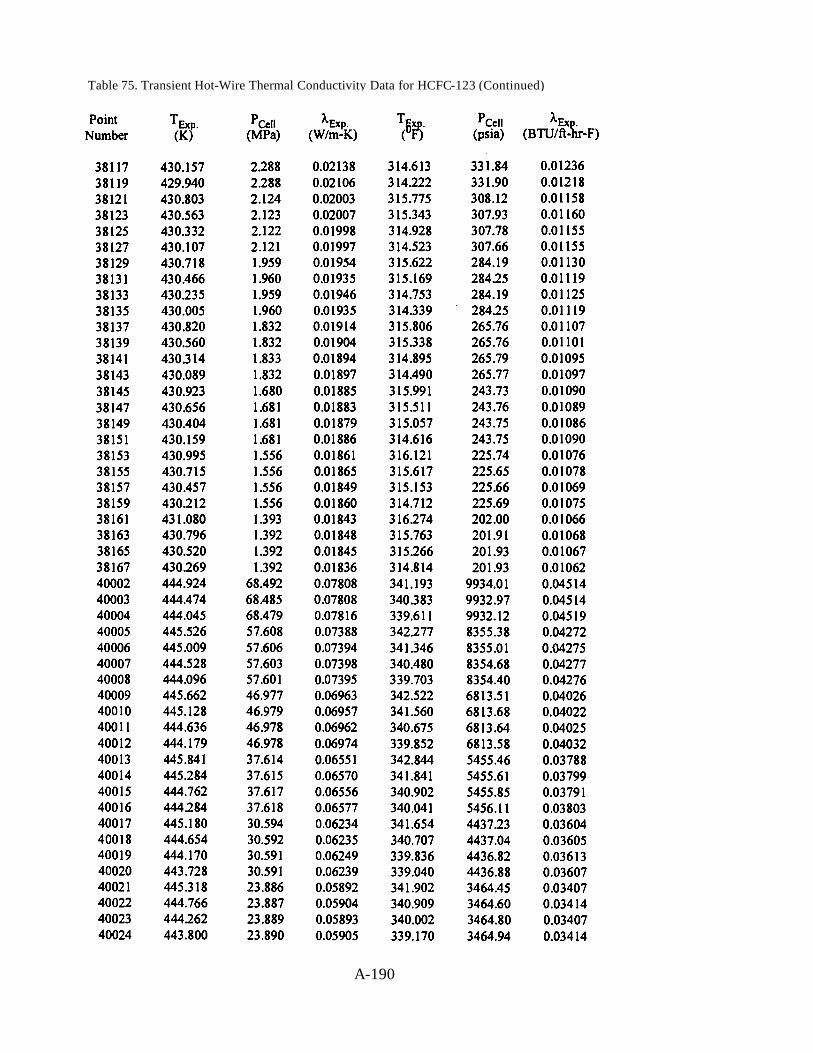
Table 75. Transient Hot-Wire Thermal Conductivity Data for HCFC-123 (Continued)
A-190
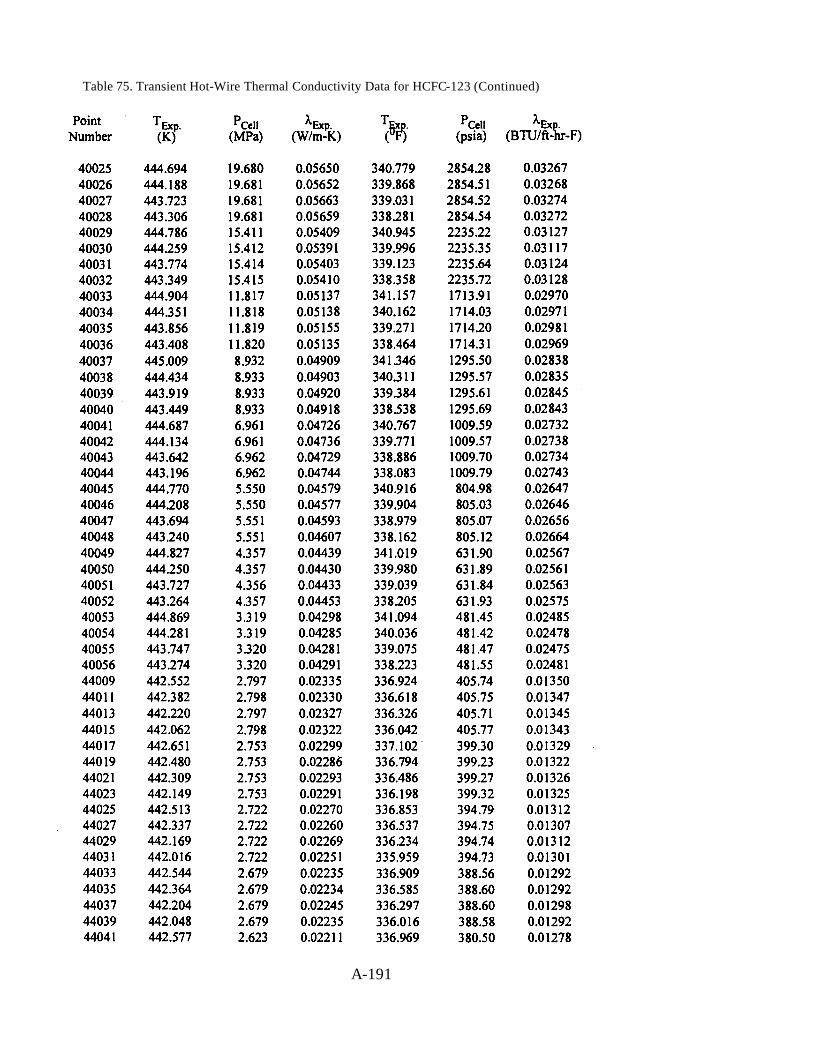
Table 75. Transient Hot-Wire Thermal Conductivity Data for HCFC-123 (Continued)
A-191
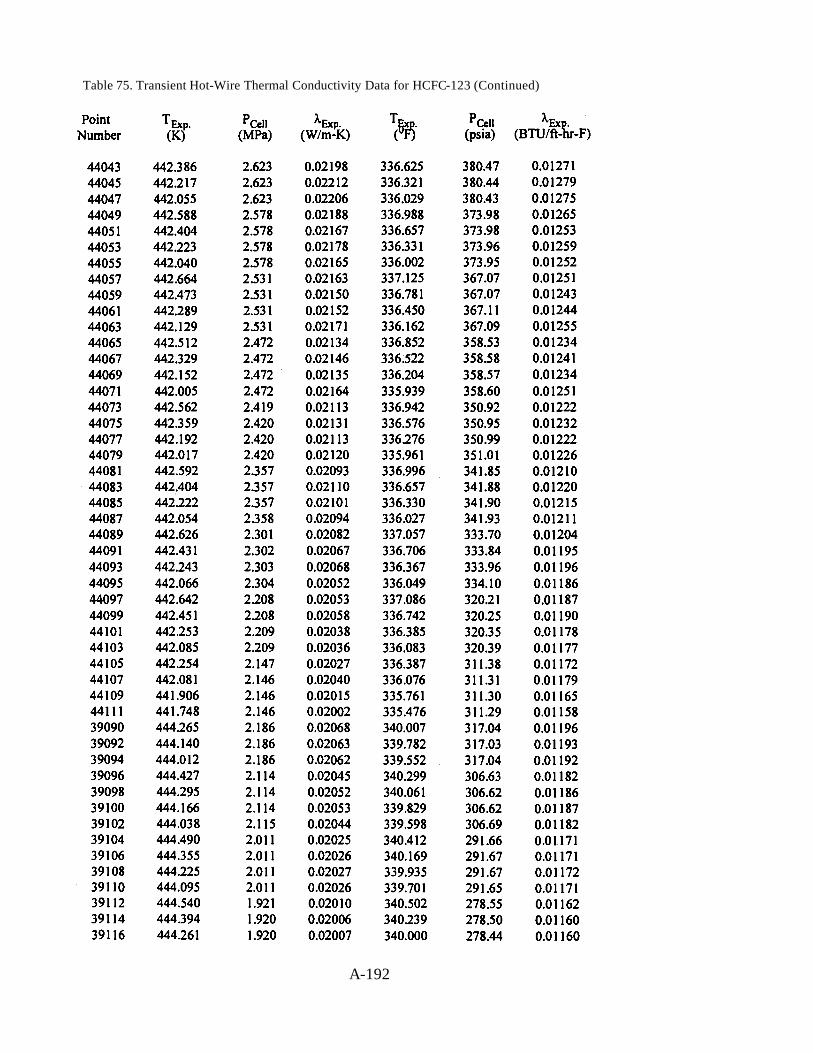
Table 75. Transient Hot-Wire Thermal Conductivity Data for HCFC-123 (Continued)
A-192
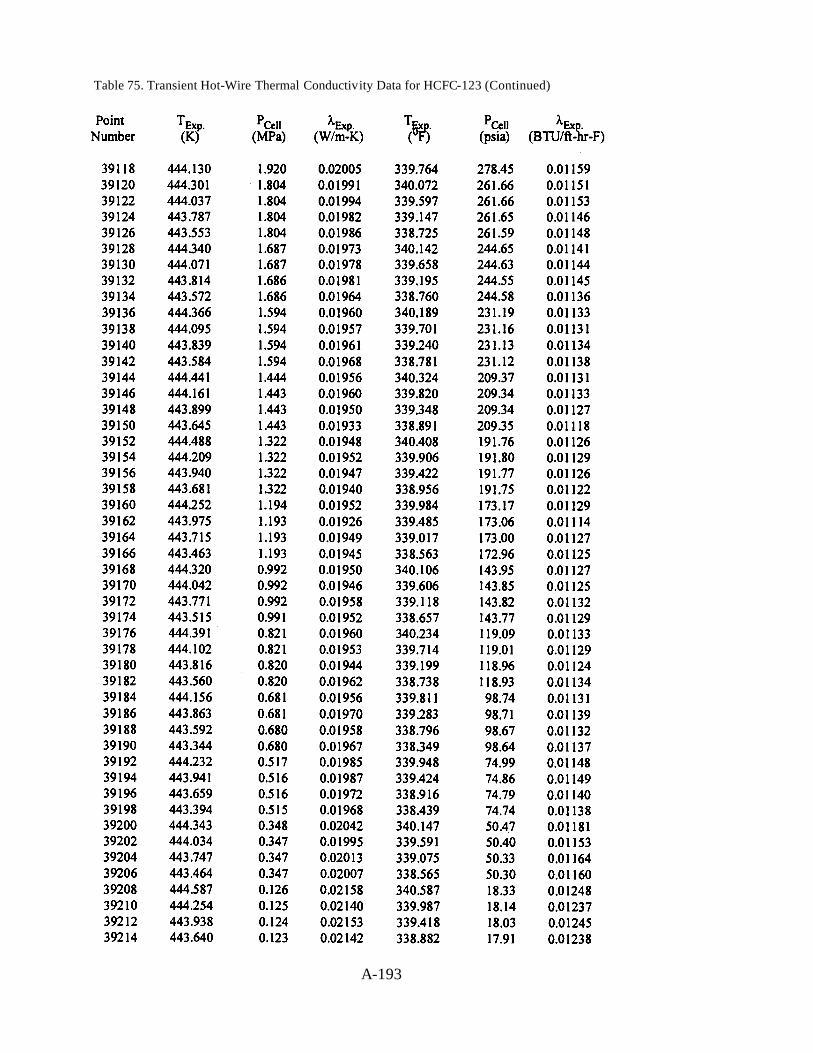
Table 75. Transient Hot-Wire Thermal Conductivity Data for HCFC-123 (Continued)
A-193
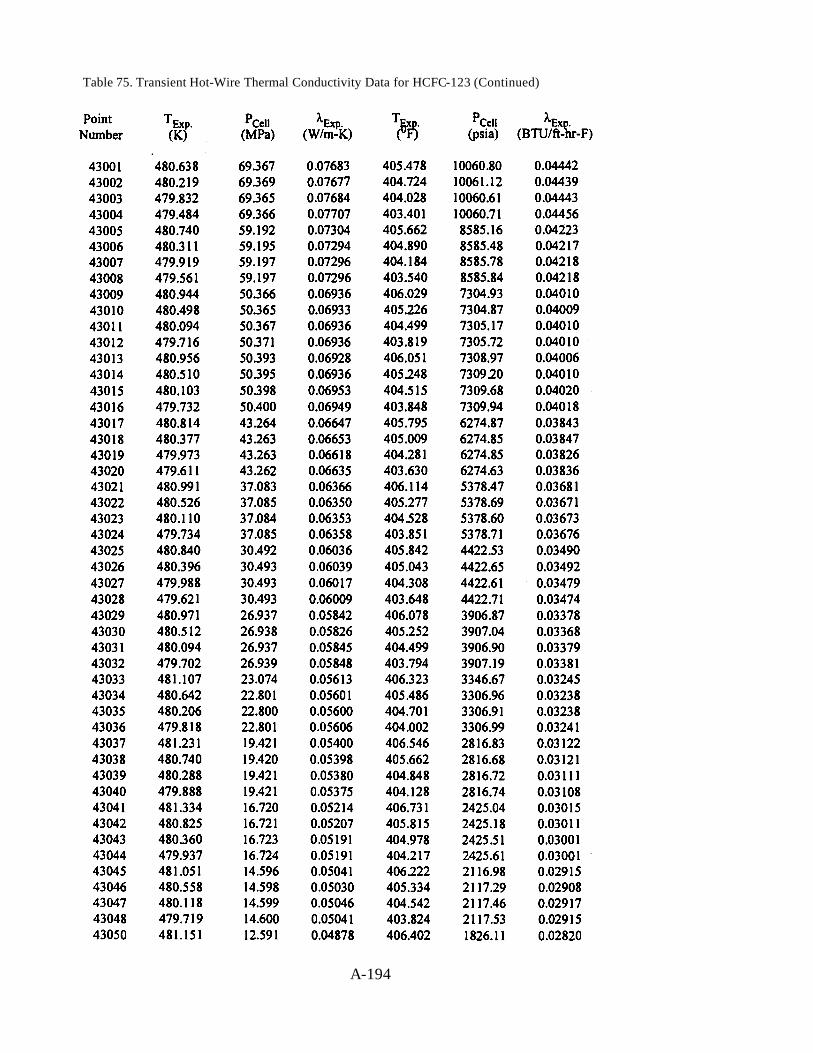
Table 75. Transient Hot-Wire Thermal Conductivity Data for HCFC-123 (Continued)
A-194
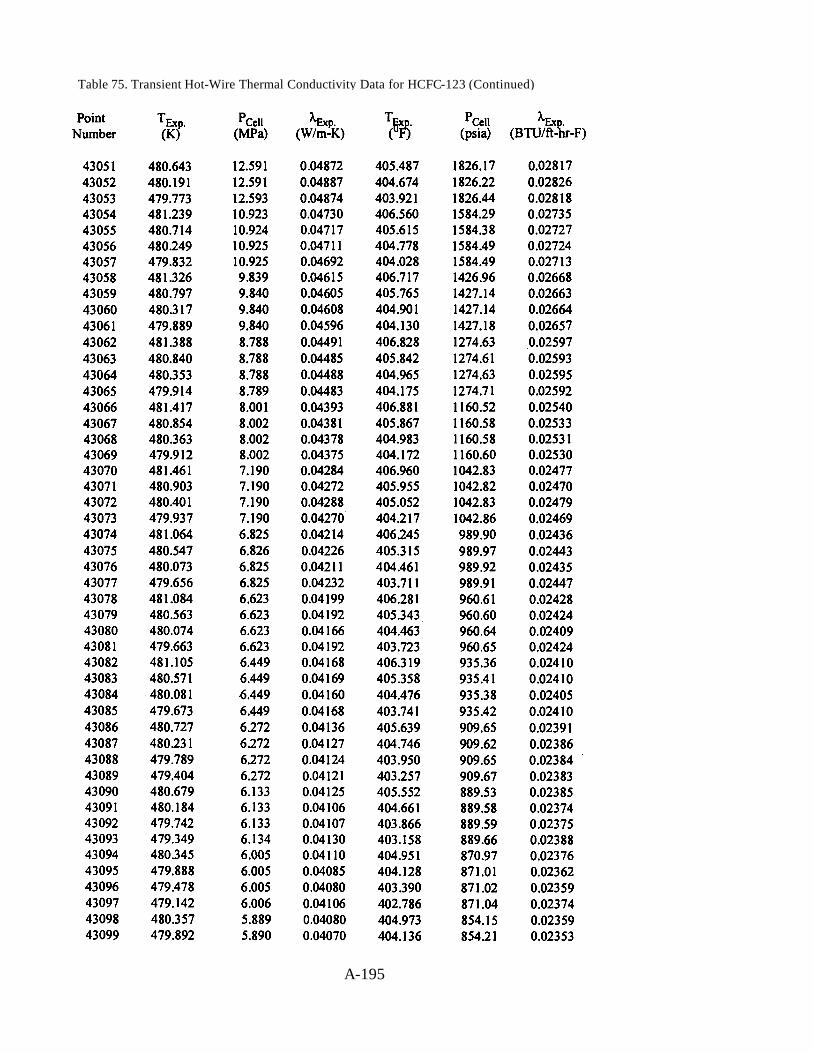
Table 75. Transient Hot-Wire Thermal Conductivity Data for HCFC-123 (Continued)
A-195
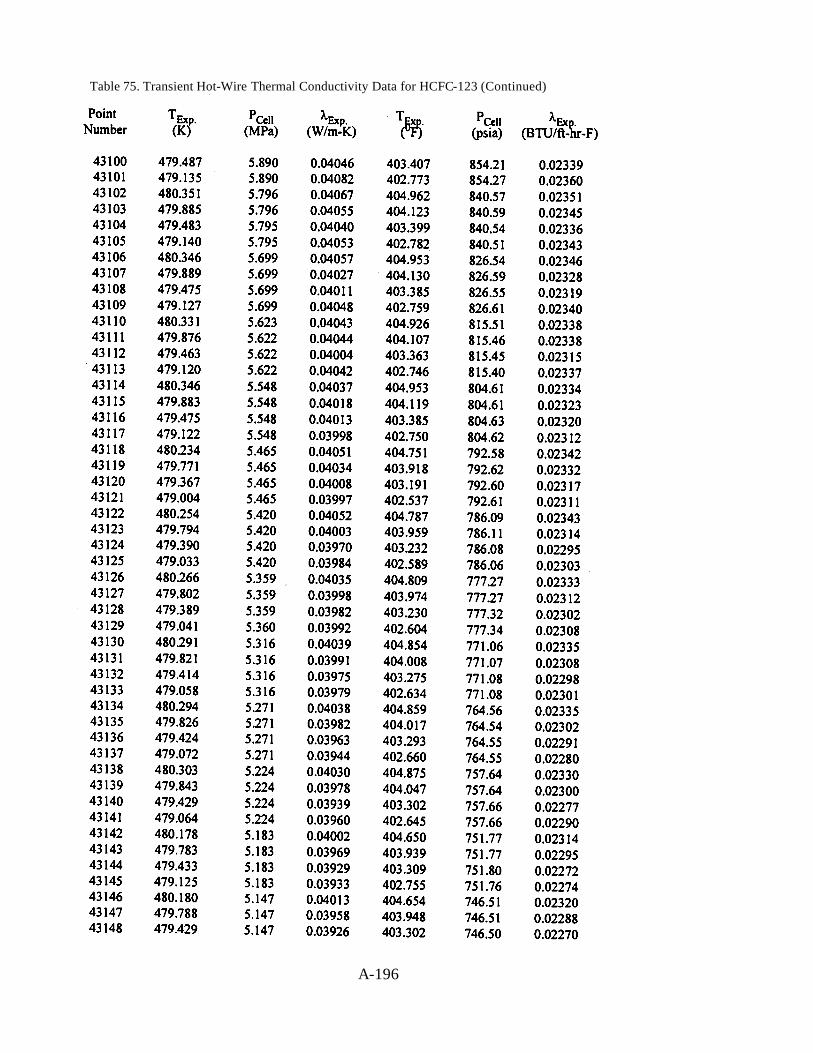
Table 75. Transient Hot-Wire Thermal Conductivity Data for HCFC-123 (Continued)
A-196
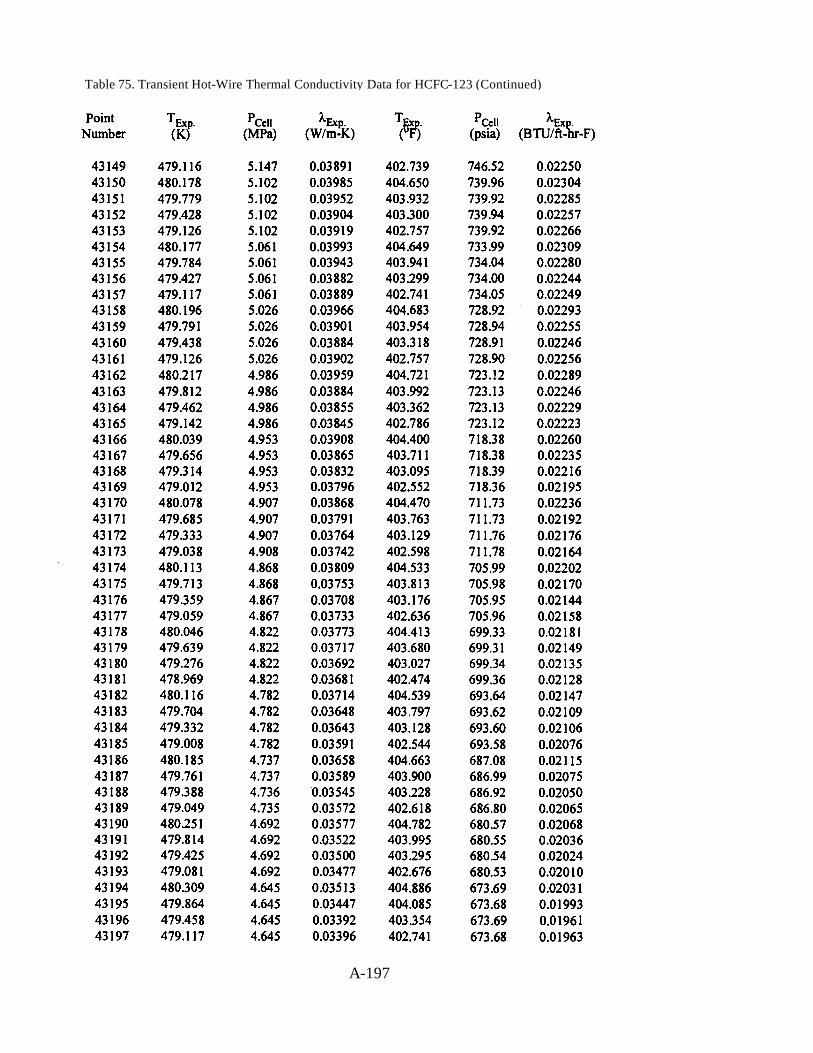
Table 75. Transient Hot-Wire Thermal Conductivity Data for HCFC-123 (Continued)
A-197
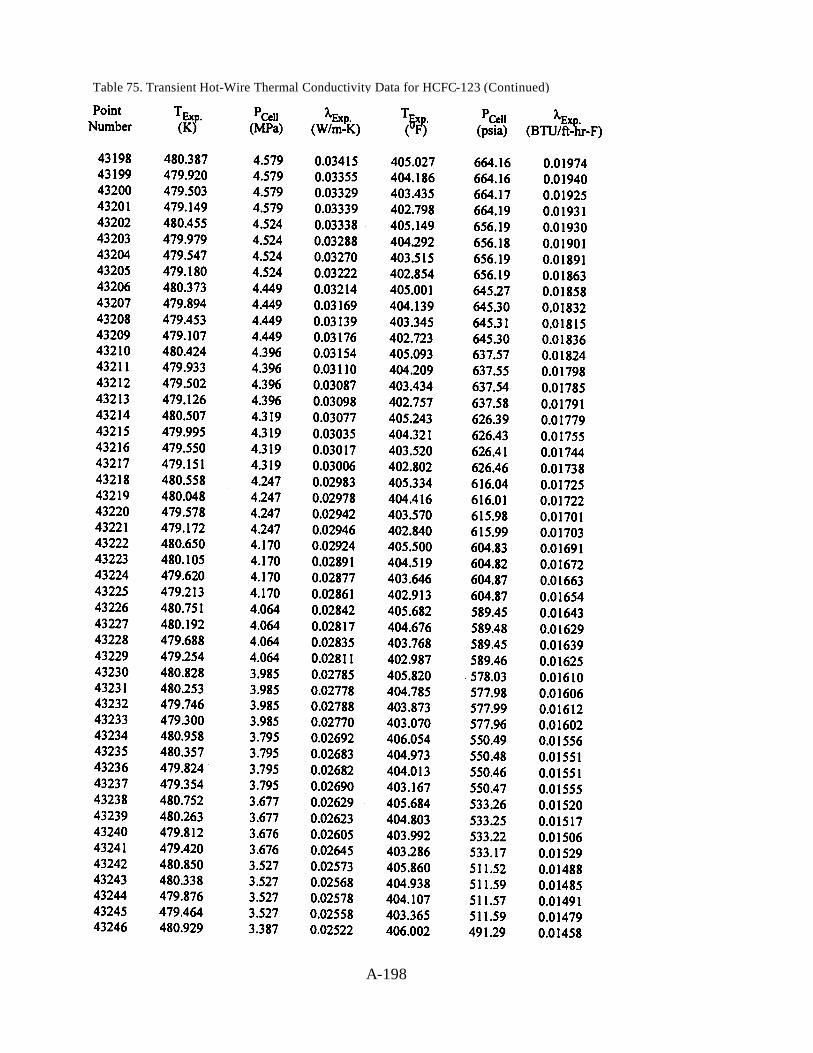
Table 75. Transient Hot-Wire Thermal Conductivity Data for HCFC-123 (Continued)
A-198
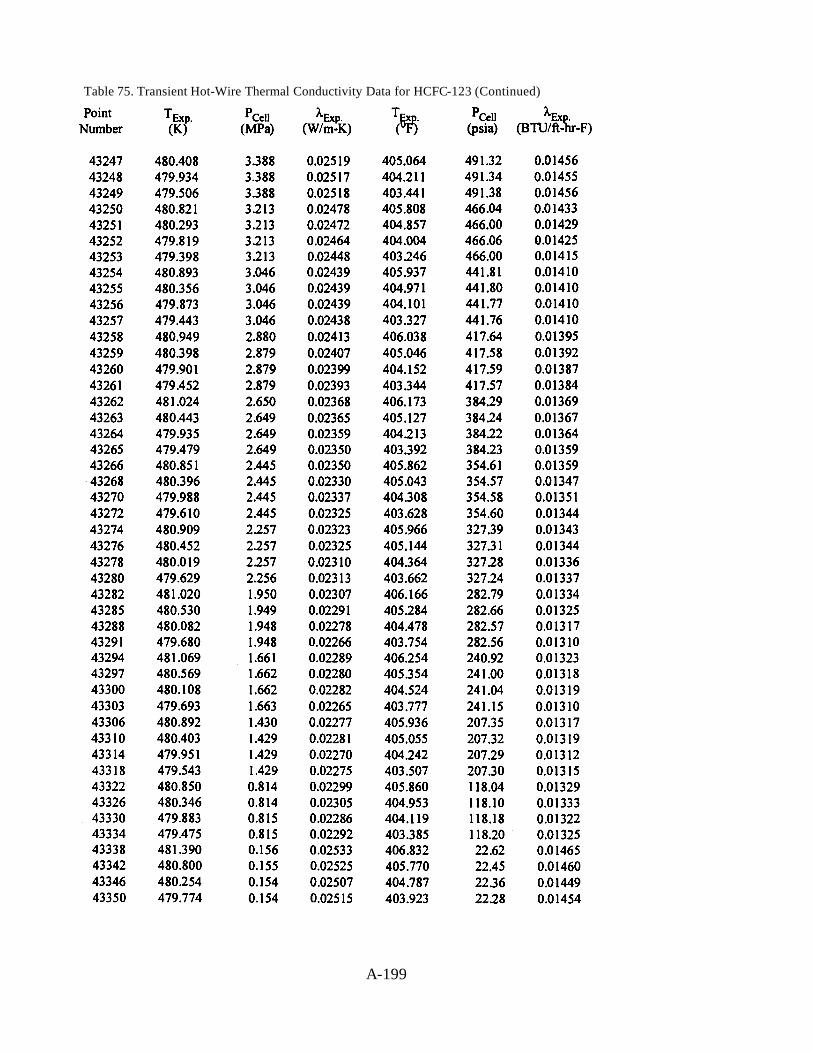
Table 75. Transient Hot-Wire Thermal Conductivity Data for HCFC-123 (Continued)
A-199
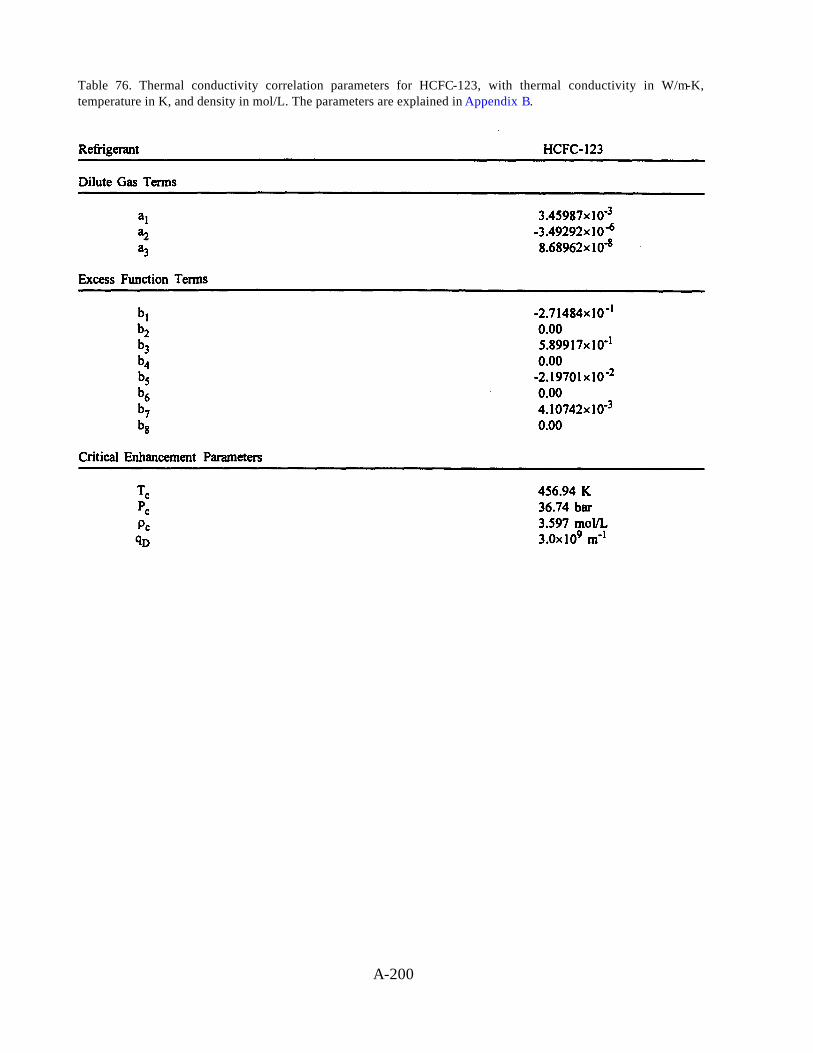
Table 76. Thermal conductivity correlation parameters for HCFC-123, with thermal conductivity in W/m-K,temperature in K, and density in mol/L. The parameters are explained in Appendix B.
A-200
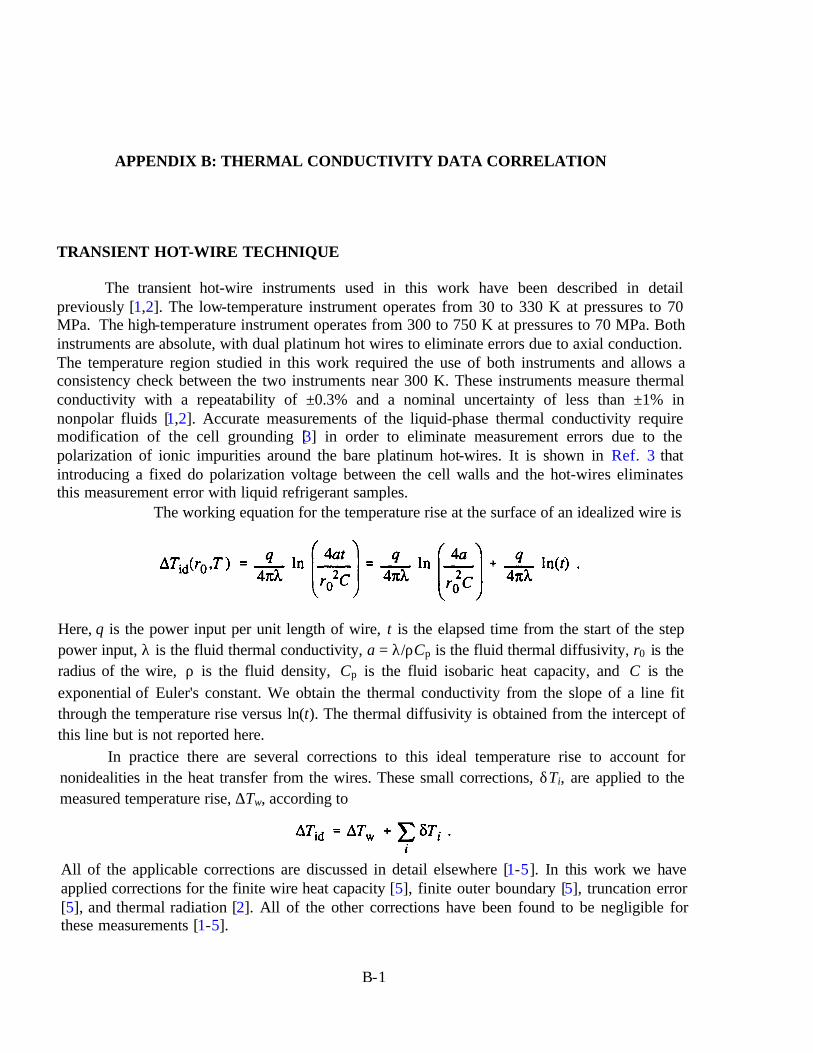
All of the applicable corrections are discussed in detail elsewhere [1-5]. In this work we haveapplied corrections for the finite wire heat capacity [5], finite outer boundary [5], truncation error[5], and thermal radiation [2]. All of the other corrections have been found to be negligible forthese measurements [1-5].
B-1
APPENDIX B: THERMAL CONDUCTIVITY DATA CORRELATION
TRANSIENT HOT-WIRE TECHNIQUE
The transient hot-wire instruments used in this work have been described in detailpreviously [1,2]. The low-temperature instrument operates from 30 to 330 K at pressures to 70MPa. The high-temperature instrument operates from 300 to 750 K at pressures to 70 MPa. Bothinstruments are absolute, with dual platinum hot wires to eliminate errors due to axial conduction.The temperature region studied in this work required the use of both instruments and allows aconsistency check between the two instruments near 300 K. These instruments measure thermalconductivity with a repeatability of ±0.3% and a nominal uncertainty of less than ±1% innonpolar fluids [1,2]. Accurate measurements of the liquid-phase thermal conductivity requiremodification of the cell grounding [3] in order to eliminate measurement errors due to thepolarization of ionic impurities around the bare platinum hot-wires. It is shown in Ref. 3 thatintroducing a fixed do polarization voltage between the cell walls and the hot-wires eliminatesthis measurement error with liquid refrigerant samples.
The working equation for the temperature rise at the surface of an idealized wire is
Here, q is the power input per unit length of wire, t is the elapsed time from the start of the steppower input, λ is the fluid thermal conductivity, a = λ/ρCp is the fluid thermal diffusivity, r0 is theradius of the wire, ρ is the fluid density, Cp is the fluid isobaric heat capacity, and C is theexponential of Euler's constant. We obtain the thermal conductivity from the slope of a line fitthrough the temperature rise versus ln(t). The thermal diffusivity is obtained from the intercept ofthis line but is not reported here.
In practice there are several corrections to this ideal temperature rise to account fornonidealities in the heat transfer from the wires. These small corrections, δTi, are applied to themeasured temperature rise, ∆Tw, according to
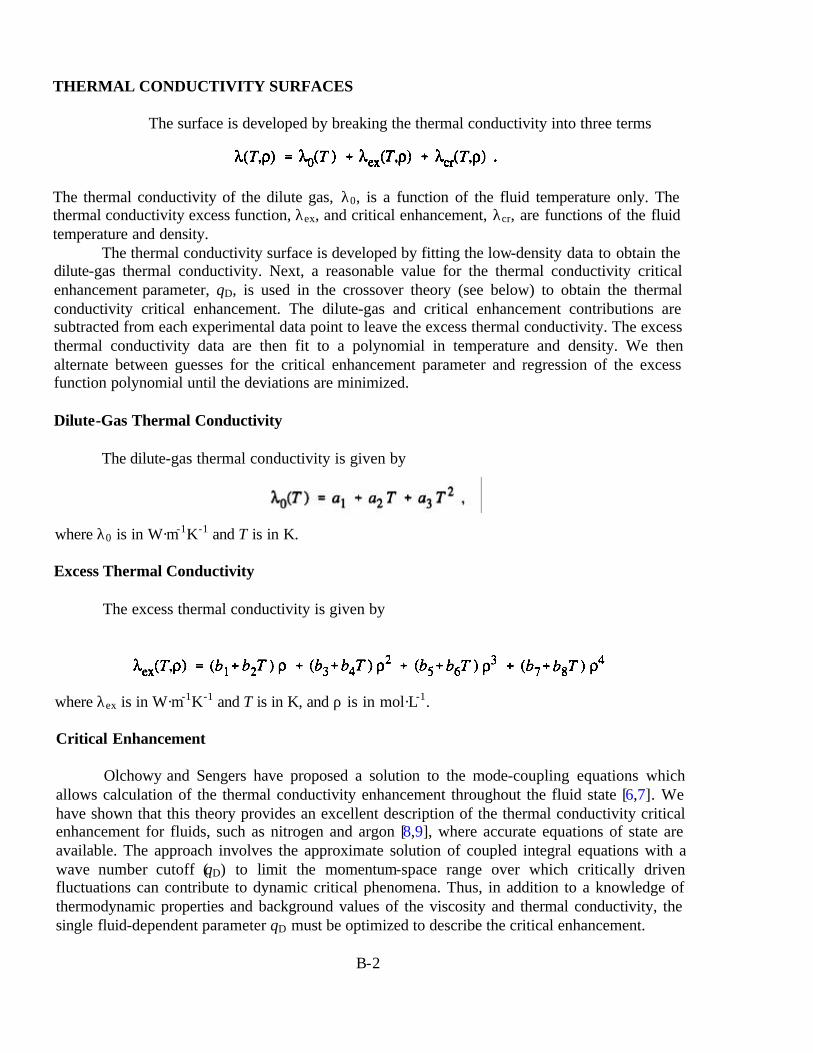
The thermal conductivity of the dilute gas, λ0, is a function of the fluid temperature only. Thethermal conductivity excess function, λex, and critical enhancement, λcr, are functions of the fluidtemperature and density.
The thermal conductivity surface is developed by fitting the low-density data to obtain thedilute-gas thermal conductivity. Next, a reasonable value for the thermal conductivity criticalenhancement parameter, qD, is used in the crossover theory (see below) to obtain the thermalconductivity critical enhancement. The dilute-gas and critical enhancement contributions aresubtracted from each experimental data point to leave the excess thermal conductivity. The excessthermal conductivity data are then fit to a polynomial in temperature and density. We thenalternate between guesses for the critical enhancement parameter and regression of the excessfunction polynomial until the deviations are minimized.
Dilute-Gas Thermal Conductivity
The dilute-gas thermal conductivity is given by
THERMAL CONDUCTIVITY SURFACES
The surface is developed by breaking the thermal conductivity into three terms
where λ0 is in W·m-1K-1 and T is in K.
Excess Thermal Conductivity
The excess thermal conductivity is given by
where λex is in W·m-1K-1 and T is in K, and ρ is in mol·L-1.
Critical Enhancement
Olchowy and Sengers have proposed a solution to the mode-coupling equations whichallows calculation of the thermal conductivity enhancement throughout the fluid state [6,7]. Wehave shown that this theory provides an excellent description of the thermal conductivity criticalenhancement for fluids, such as nitrogen and argon [8,9], where accurate equations of state areavailable. The approach involves the approximate solution of coupled integral equations with awave number cutoff (qD) to limit the momentum-space range over which critically drivenfluctuations can contribute to dynamic critical phenomena. Thus, in addition to a knowledge ofthermodynamic properties and background values of the viscosity and thermal conductivity, thesingle fluid-dependent parameter qD must be optimized to describe the critical enhancement.
B-2
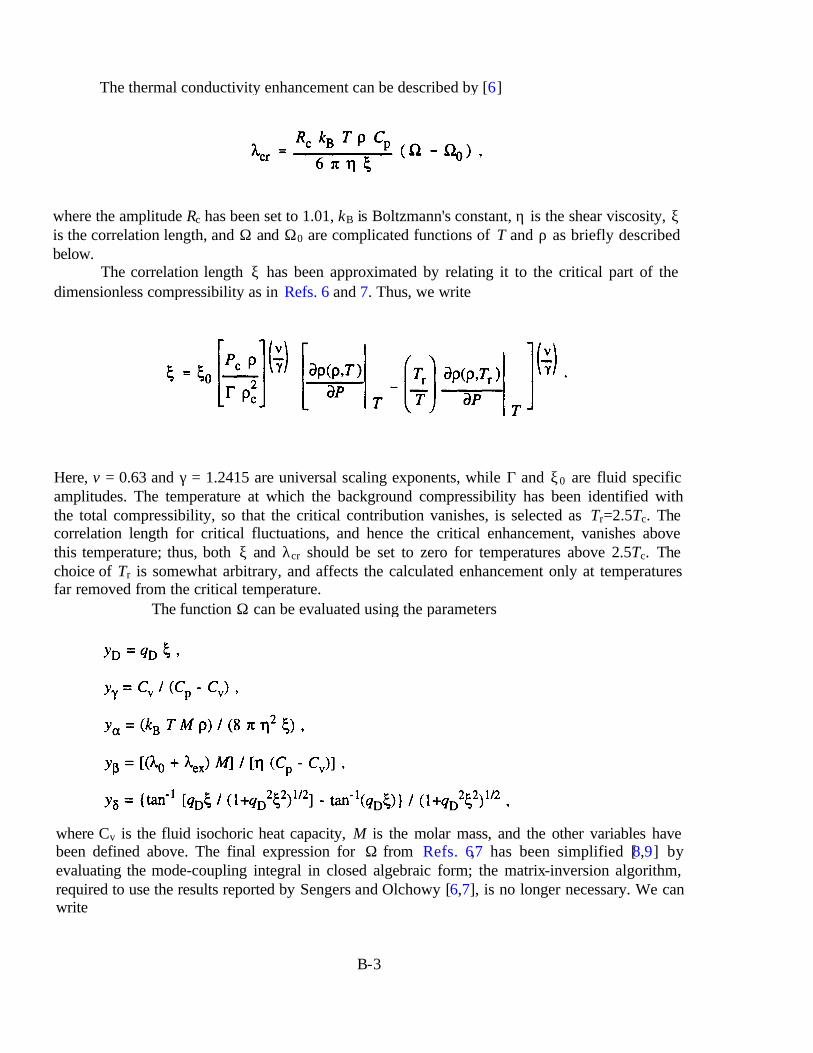
where Cv is the fluid isochoric heat capacity, M is the molar mass, and the other variables havebeen defined above. The final expression for Ω from Refs. 6,7 has been simplified [8,9] byevaluating the mode-coupling integral in closed algebraic form; the matrix-inversion algorithm,required to use the results reported by Sengers and Olchowy [6,7], is no longer necessary. We canwrite
B-3
The thermal conductivity enhancement can be described by [6]
where the amplitude Rc has been set to 1.01, kB is Boltzmann's constant, η is the shear viscosity, ξis the correlation length, and Ω and Ω0 are complicated functions of T and ρ as briefly describedbelow.
The correlation length ξ has been approximated by relating it to the critical part of thedimensionless compressibility as in Refs. 6 and 7. Thus, we write
Here, v = 0.63 and γ = 1.2415 are universal scaling exponents, while Γ and ξ0 are fluid specificamplitudes. The temperature at which the background compressibility has been identified withthe total compressibility, so that the critical contribution vanishes, is selected as Tr=2.5Tc. Thecorrelation length for critical fluctuations, and hence the critical enhancement, vanishes abovethis temperature; thus, both ξ and λcr should be set to zero for temperatures above 2.5Tc. Thechoice of Tr is somewhat arbitrary, and affects the calculated enhancement only at temperaturesfar removed from the critical temperature.
The function Ω can be evaluated using the parameters
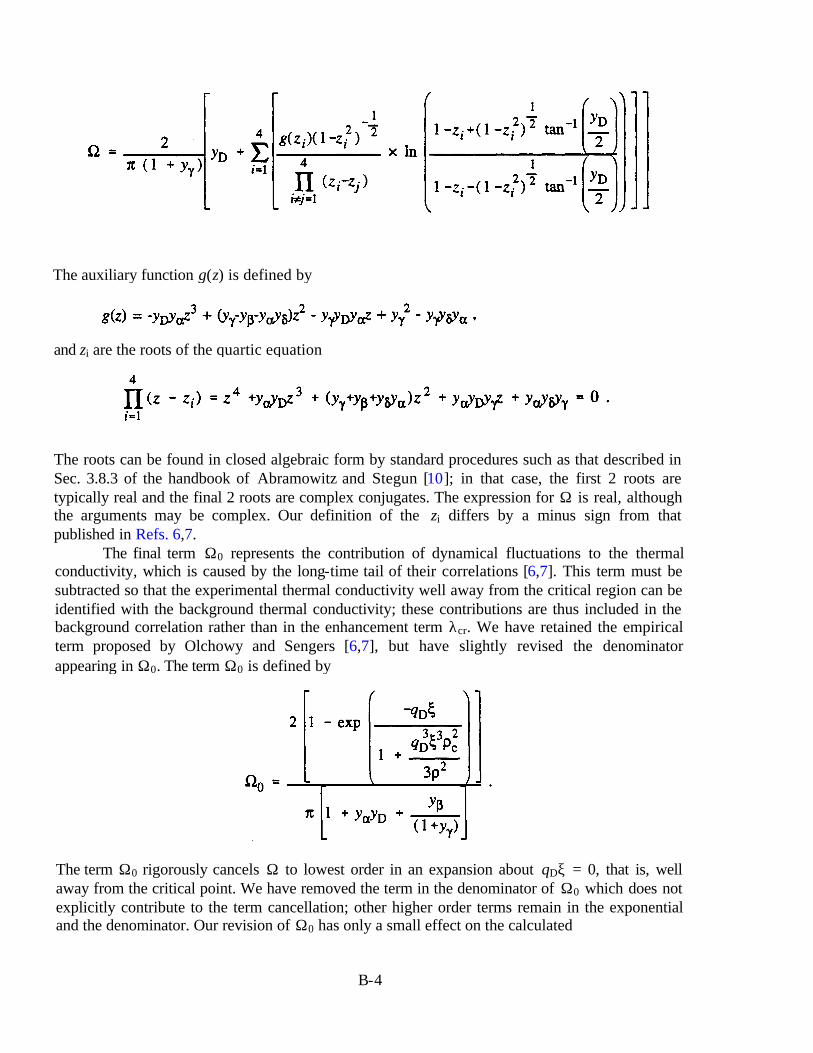
The auxiliary function g(z) is defined by
and zi are the roots of the quartic equation
The roots can be found in closed algebraic form by standard procedures such as that described inSec. 3.8.3 of the handbook of Abramowitz and Stegun [10]; in that case, the first 2 roots aretypically real and the final 2 roots are complex conjugates. The expression for Ω is real, althoughthe arguments may be complex. Our definition of the zi differs by a minus sign from thatpublished in Refs. 6,7.
The final term Ω0 represents the contribution of dynamical fluctuations to the thermalconductivity, which is caused by the long-time tail of their correlations [6,7]. This term must besubtracted so that the experimental thermal conductivity well away from the critical region can beidentified with the background thermal conductivity; these contributions are thus included in thebackground correlation rather than in the enhancement term λcr. We have retained the empiricalterm proposed by Olchowy and Sengers [6,7], but have slightly revised the denominatorappearing in Ω0. The term Ω0 is defined by
The term Ω0 rigorously cancels Ω to lowest order in an expansion about qDξ = 0, that is, wellaway from the critical point. We have removed the term in the denominator of Ω0 which does notexplicitly contribute to the term cancellation; other higher order terms remain in the exponentialand the denominator. Our revision of Ω0 has only a small effect on the calculated
B-4
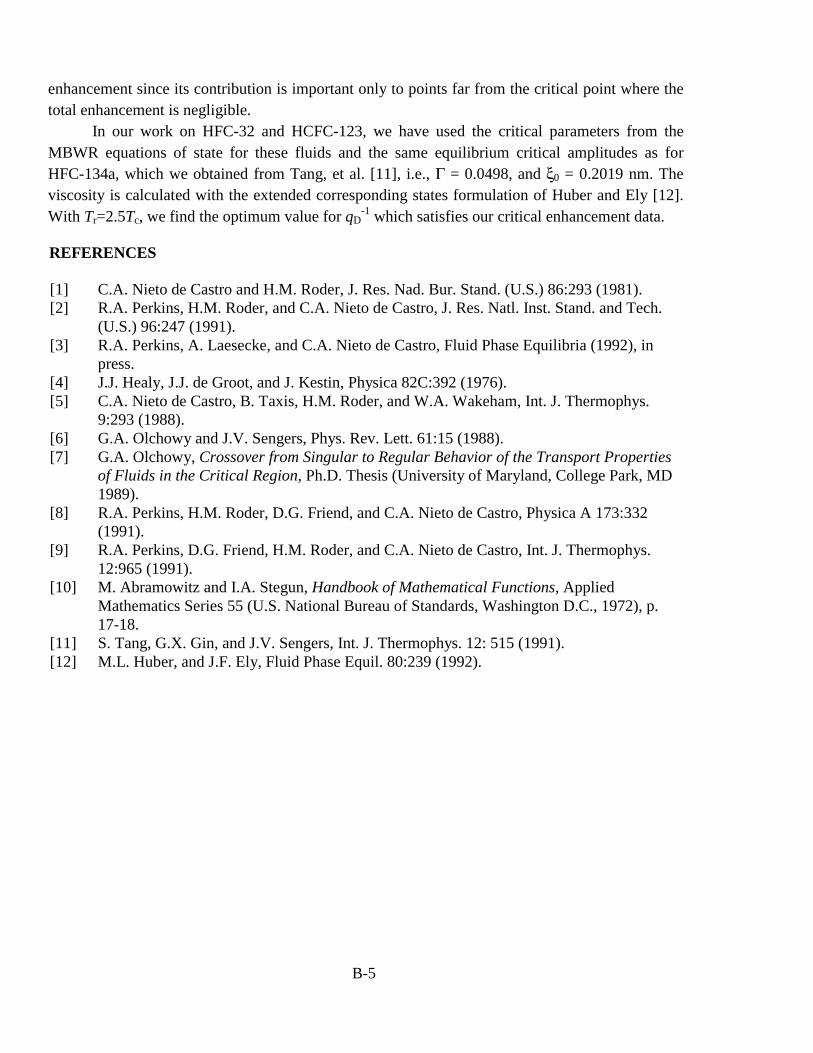
enhancement since its contribution is important only to points far from the critical point where thetotal enhancement is negligible.
In our work on HFC-32 and HCFC-123, we have used the critical parameters from theMBWR equations of state for these fluids and the same equilibrium critical amplitudes as forHFC-134a, which we obtained from Tang, et al. [11], i.e., Γ = 0.0498, and ξ0 = 0.2019 nm. Theviscosity is calculated with the extended corresponding states formulation of Huber and Ely [12].With Tr=2.5Tc, we find the optimum value for qD
-1 which satisfies our critical enhancement data.
REFERENCES
[1] C.A. Nieto de Castro and H.M. Roder, J. Res. Nad. Bur. Stand. (U.S.) 86:293 (1981).[2] R.A. Perkins, H.M. Roder, and C.A. Nieto de Castro, J. Res. Natl. Inst. Stand. and Tech.
(U.S.) 96:247 (1991).[3] R.A. Perkins, A. Laesecke, and C.A. Nieto de Castro, Fluid Phase Equilibria (1992), in
press.[4] J.J. Healy, J.J. de Groot, and J. Kestin, Physica 82C:392 (1976).[5] C.A. Nieto de Castro, B. Taxis, H.M. Roder, and W.A. Wakeham, Int. J. Thermophys.
9:293 (1988).[6] G.A. Olchowy and J.V. Sengers, Phys. Rev. Lett. 61:15 (1988).[7] G.A. Olchowy, Crossover from Singular to Regular Behavior of the Transport Properties
of Fluids in the Critical Region, Ph.D. Thesis (University of Maryland, College Park, MD1989).
[8] R.A. Perkins, H.M. Roder, D.G. Friend, and C.A. Nieto de Castro, Physica A 173:332(1991).
[9] R.A. Perkins, D.G. Friend, H.M. Roder, and C.A. Nieto de Castro, Int. J. Thermophys.12:965 (1991).
[10] M. Abramowitz and I.A. Stegun, Handbook of Mathematical Functions, AppliedMathematics Series 55 (U.S. National Bureau of Standards, Washington D.C., 1972), p.17-18.
[11] S. Tang, G.X. Gin, and J.V. Sengers, Int. J. Thermophys. 12: 515 (1991).[12] M.L. Huber, and J.F. Ely, Fluid Phase Equil. 80:239 (1992).
B-5