Embed Size (px)
Citation preview
THERMOPHYSICAL PROPERTIES OF TROPICAL FRUIT JUICESl
Sílvia Cristina Sobottka Rolim de MOURA2, Silvia Pimentel Marconi GERMER3, Denise Calil PereiraJARDIM4, Mitie Sônia SADAHlRAs
SUMMARY
Precise knowledge of the thermal and rheological properties of foods is of fundamental importance to establish thedesign of process equipment. However, for tropical fruit products such as juices, there is a complete lack of this information in the literature, seriously hindering processing procedures. Thermophysical properties of tropical fruit juices:thermal diffusivity, specific heat and density, were experimentally determined, and the values obtained compared withthose predicted by mathematical models already existent in the literature, based on the chemical composition. The juicesstudied were prepared from pulps of cupuaçu (Theobroma grandiflorum), açai (Euterpe oleracea, Mart.) and graviola (Annonamuricata), and the determinations were made in the temperature range from 10 to BO°e. The thermal conductivity wasdeduced from the knowledge of the other properties. The viscosity of the filtered juices was also determined using acapillary viscometer.
KEY WüRDS: Thermal properties; Tropical fruit juices; Viscosity; Thermal diffusivity; Specific heat.
RESUMO
PROPRIEDADES TERMOFÍSICAS DE SUCOS DE FRUTASTROPICAIS
o conhecimento preciso das propriedades térmicas e reológicas dos alimentos é de fundamental importância no dimensionamento de equipamentos. Porém, para produtos de frutas tropicais, como sucos, não existe na literatura referências destaspropriedades, o que dificulta seriamente o processamento dos mesmos. Propriedades termofísicas: difusividade térmica,calor específico e densidade, de sucos de frutas tropicais, foram determinadas experimentalmente e comparadas a valorespreditos por modelos matemáticos, já existentes na literatura, em função da sua composição química. Os sucos estudadosforam preparados com polpas de cupuaçu (Theobroma grandiflorum), açaí (Euterpe oleracea, Mart.) e graviola (Annona muricata)e as determinações foram realizadas na faixa de temperatura de 10 a BO°e. A condutividade térmica foi obtida através doconhecimento das demais propriedades. Determinou-se, também, a viscosidade dos sucos filtrados em um viscosímetrocapilar.
PALAVRAS-CHAVE: Propriedades térmicas; Sucos de frutas tropicais; Viscosidade; Difusividade térmica; Calor específico.
1 Recebido para publicação em 21/09/1998. Aprovado para publicação em 30/12/1998.2.3.4.sPesquisadores do Instituto de Tecnologia de Alimentos - FRUTHOTEC/ITAL. Av. Brasil, 2880 - Campinas/SP - CEP 13073-001emails:[email protected]@[email protected]@ital.org.br
70 Braz. J. Food Technol., Campinas, 1(1,2): 70-76, janldez.1998_______~-----_...I
2. METHODOLOGY
Viscosity (/l)
Determined at three temperatures using a capillary glass viscometer, after filtering through cotton wool(VAN WAZER et aI., 1972).
2.2 Methods
Juices prepared from commercial pulps of cupuaçu(Theobroma grandiflorum), açaí (Euterpe oleracea, Mart.)and graviola (Annona muricata), chemically analysingusing official methods (WILLIAMS, 1990).
2.1 MateriaIs
Density (p)
Determined at three temperatures by fluid displacement using a pycnometer, according to AOAC method n°. 985.19 (WILLIANS, 1990).
models to predict rise in boiling point, density, enthalpy, specific heat, sucrose solubility, surface tension, thermal conductivity and viscosity. The studyshows that good correlation exists between the thermophysical properties and the concentration andtemperature of fluid products.
It is important to emphasize the increasing demandfor processed food in the country (Brazil), bringing,as a consequence, the demand for industrial modernization, technological adequation and improvedquality. These demands can only be met if more scientific information on food processing becomes available, requiring knowledge of the physical propertiesin order to calculate the processes. Currently, the countless data available in the literature on similar products are inadequate, in the majority of cases, for brazilian products. For the majority of brazilian products, the thermophysical properties are not available in the literature.
The objective of this research was to experimentally determine the density, viscosity, specific heat and
- thermal diffusivity as well as calculate the thermalconductivity of cupuaçu, açaí and graviola juices in thetemperature range from 10 to 80°e. ln addition, thepaper presents a comparison between the experimental data and values obtained from mathematical modeIs found in the literature.
1.INTRODUCTION
ln order to determine the dimensions of food processing equipment, especially heat exchangers andother equipment requiring pumping of the product, itis essential to know the precise values of the thermalproperties of the products (thermal conductivity, thermal diffusivity and specific heat) and how these properties react during processing as a function of temperature.
The need for precise knowledge of the thermal properties has led to studies on the influence of composition and temperature on these properties.
POLLEY et aI. (1980), have published a collectionof tables of the thermal properties of various foods,including meats, fruits, vegetables, milk and cereaIs.Some, but not all, of the thermal properties of the following fruit juices can be found in these tables: appIe, cherry, grape, orange and pear.
CONSTENLA et aI. (1989) published more specificdata on the thermophysical properties of clarifiedapple juice at various temperatures and concentrations. This paper presents the experimental results ofthe determinations of density, viscosity, specific heatand thermal conductivity. The results show the greatinfluence of concentration and temperature on thedetermination of these properties, and model the dataas a function of these variables. VIRENDRA et aI.(1989) studied the prediction of the thermal conductivity of various juices (apple, cherry, grape, orangeand strawberry), using several mathematical models,and a comparison of the theoretical values with theexperimental values showed an error of less than 10%.
Experimental values for the thermal diffusivity ofapple, cherry, grape, orange and tomato juices can befound in GEORGE (1990). Once again, the majority ofthe data are for sub-tropical fruit juices.
A knowledge of the rheological properties of foodsbecomes necessary in a series of applications suchas: quality control, knowledge of the physical structure and principally the control and sizing of industrial processes.
The effect of temperature and concentration on thedensity and viscosity of apple juice was studied byBAYINDIRLI (1992). Mathematical models were obtained from the experimental data, showing excellent correlation (r>0.99). The influence of temperature and viscosity on filtered fruit juices and sugar cane juice can befound inALVARADO (1993). The results show that theviscosity of the fruit juices follows Arrhenius' law, showing activation energies of the order of 20kJ/ g.mo!.
A more recent prediction of the thermophysicalproperties, applied to clarified fruit juices as a functi- Specific heat (Cp)on of concentration and temperature, can be found in Specific heat was determined using an adaptationPEACOCK (1995). The paper presents mathematical of the method of mixtures of HWANG, HAYAKAWA
Braz. J. Food Technol., Campinas, 1(1,2): 70-76, jan/dez.1998 71
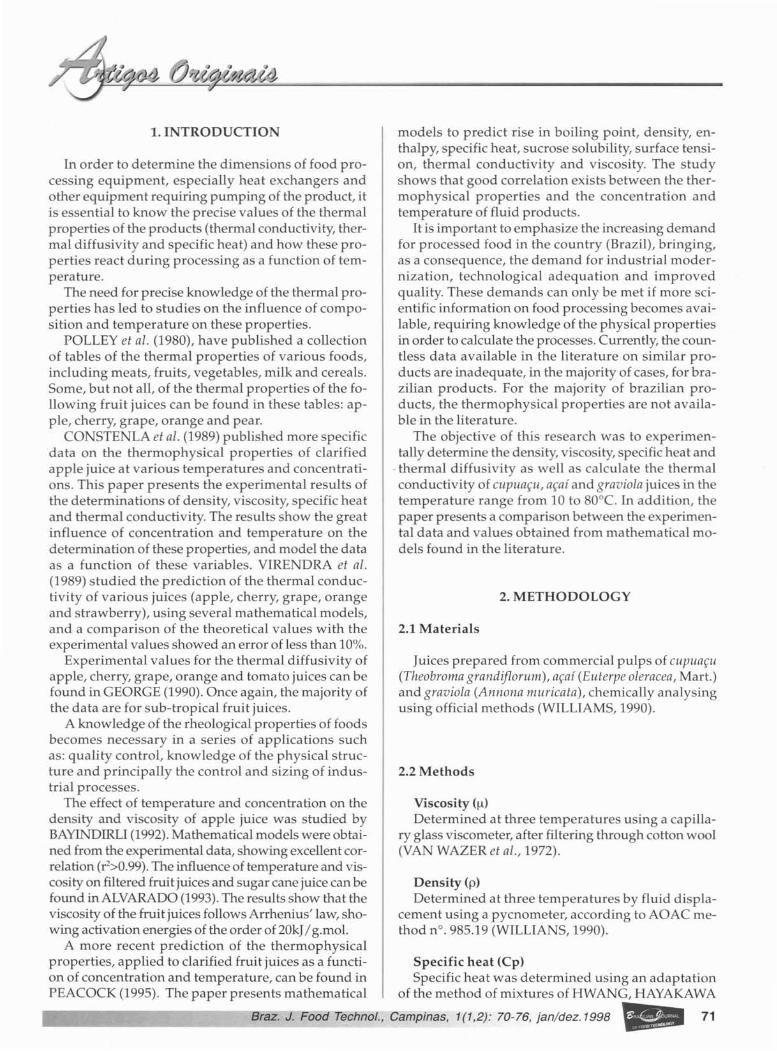
(1979). The calorimeter used for the measurement ofthe specific heat consisted of a ane liter thermos flask.Before starting the tests, the thermal capacity of thecalorimeter was obtained, by calibrating it in the temperature range to be used (10 to 70°C). 100 to 150gsamples of juice, packaged in polyethylene bags, wereplaced in a cold chamber (S°C) for 24 hours to stabilize the temperature.
Approximately 500g distilled water at 90°C wereintroduced into the calorimeter, and after stabilizingthe temperature, a sample package was placed in thecalorimeter after initially determining its internal temperature.
Using a calibrated T-type needle thermocouple,passing through the lid of the thermos flask, the temperature inside the calorimeter was recorded every30 seconds. The equipment was shaken constantly ina shaker, as shown in Figure 1.
Hk
= thermal capacity of the calorimeter (cal;oC)C w =specific heat of distilled water (cal/g.°C)v( = mass of distilled water (g)T fw = temperature corresponding to the start ofthe straight part of the time' temperature curvefor distilled water (0C)T
ow= initial temperature of the distilled water (0C)
dT/ dt =slope of the time' temperature curve fordistilled water (OC/min)te = time corresponding to Tfw of the time' temperature curve for distilled water (min)C s =specific heat of the polyethylene bag (cal!g.0C)Ws =mass of the polyethylene bag (g)Wc =sample mass (g)Toe =initial temperature of sample (0C)
Assay for Specific Heat
(c)
\.
(a) ~J \ I \. J
74§: 72GI
70...j-lO 68...GIQ. 66EGI 64~
62o 50 100
time (min) 1
_- CarrectedTemperature
(d)FIGURE 2. Example of a time' temperature curve obtained using the calorimeter, for the determination ofspecific heat in tropical fruit juices.
Where:
Cp =~•.w). la, - To) - IdTldtlt).±...C,.•.W.,U,. - Toe - IdTldtlt) (1)
W, «Toe -TIw) + (dT/dt)t.)
FIGURE 1. Design of the apparatus constructed tomeasure specific heat: (a) calorimeter (b) digital thermometer (c) thermocouple lead (d) shaker.
Readings were taken until thermal equilibrium wasreached, and the data used to construct a graph of thetemperatures (duly corrected using a calibration equation) as a function of time (Figure 2). The linear regression was determined from the linear part of thecurve. The specific heat of the sample was calculatedusing equation (1), which was derived as a functionof the energy balance.
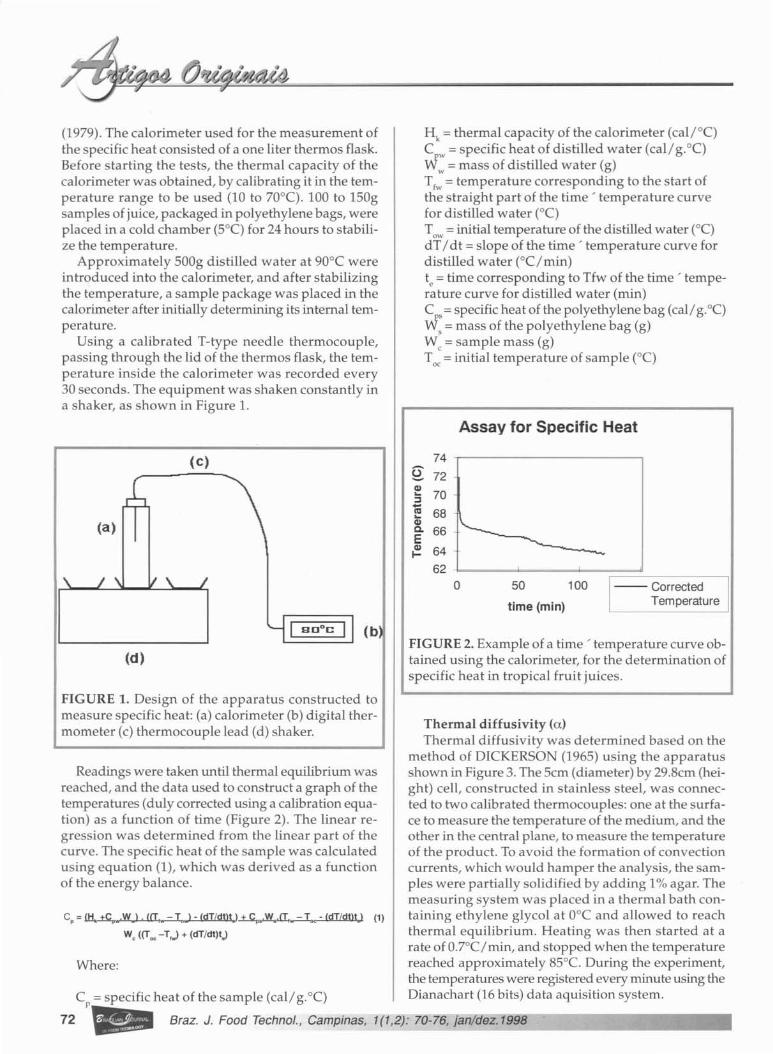
Thermal diffusivity (a)Thermal diffusivity was determined based on the
method of DICKERSON (1965) using the apparatusshown in Figure 3. The Scm (diameter) by 29.8cm (height) celI, constructed in stainless steel, was connected to two calibrated thermocouples: one at the surface to measure the temperature of the medium, and theother in the central plane, to measure the temperatureof the product. To avoid the formation of convectioncurrents, which would hamper the analysis, the sampIes were partialIy solidified by adding 1% agar. Themeasuring system was placed in a thermal bath containing ethylene glycol at O°C and alIowed to reachthermal equilibrium. Heating was then started at arate of 0.7°C/min, and stopped when the temperaturereached approximately 8S°C. During the experiment,the temperatures were registered every minute using the
Cp = specific heat of the sample (cal/ g.0C) Dianachart (16 bits) data aquisition system.
72 Braz. J. Food Technol., Campinas, 1(1,2): 70-76, jan/dez.1998
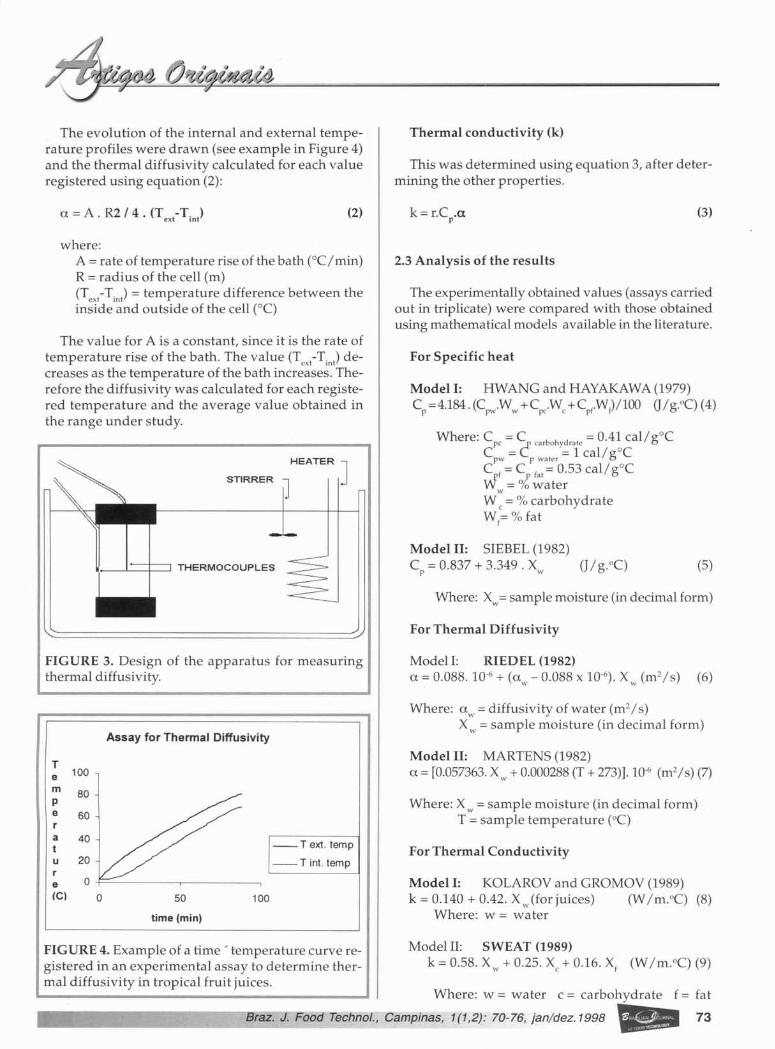
The evolution of the internal and external temperature profiles were drawn (see example in Figure 4)and the thermal diffusivity calculated for each valueregistered using equation (2):
Thermal conductivity (k)
This was determined using equation 3, after determining the other properties.
(2) k=r.C .up
(3)
where:A = rate of temperature rise of the bath (OC/min)R = radius of the cell (m)(Text-Tint) = temperature difference between theinside and outside of the cell (0C)
The value for A is a constant, since it is the rate oftemperature rise of the bath. The value (Text-Tint) decreases as the temperature of the bath increases. Therefore the diffusivity was calculated for each registered temperature and the average value obtained inthe range under study.
STIRRER
HEATERJ
IJ
2.3 Analysis of the results
The experimentally obtained values (assays carriedout in triplicate) were compared with those obtainedusing mathematical modeIs available in the literature.
For Specific heat
Model I: HWANG and HAYAKAWA (1979)Cp = 4.184. (Cpw·Ww+Cpc,Wc+CpfWr)I 100 aI g.0C) (4)
Where: C = C b h d t = 0.41 cal/gOCpc .....p car o y ra e
C = L = 1 cal/gOCpw p water
C r = C rat = 0.53 call gOCW = % water
w
Wc = % carbohydrateWr=%fat
Where: Xw= sample moisture (in decimal form)
~__-l~+=~ THERMOCOUPLES
Model II: SIEBEL (1982)C = 0.837 + 3.349 . X (J Ig.°C)p w
(5)
For Thermal Diffusivity
FIGURE 3. Design of the apparatus for measuringthermal diffusivity.
Model I: RIEDEL (1982)a =0.088.10-6 + (a
w- 0.088 x 10⁻⁶). X
w(m 2/s) (6)
Assay for Thermal Diffusivity
Where: a w= diffusivity of water (m2I s)Xw= sample moisture (in decimal form)
Te 100
m 80pe 60ra 40t --T ex!. temp
u 20 --Tint.tempre O
ICI O 50 100
time (min)
Model II: MARTENS (1982)a = [0.057363. X
w+ 0.000288 (T + 273)].10-6 (m2/s) (7)
Where: Xw= sample moisture (in decimal form)T = sample temperature (0C)
For Thermal Conductivity
Model I: KOLAROV and GROMOV (1989)k = 0.140 + 0.42. Xw(forjuices) (W Im.°C) (8)
Where: w = water
Model II: SWEAT (1989)k = 0.58. Xw+ 0.25. Xc + 0.16. Xr (W Im.°C) (9)
FIGURE 4. Example of a time' temperature curve registered in an experimental assay to determine thermal diffusivity in tropical fruit juices.
Where: w = water c = carbohydrate f = fat
Braz. J. Food Technol., Campinas, 1(1,2): 70-76, jan/dez.1998 73'----------------
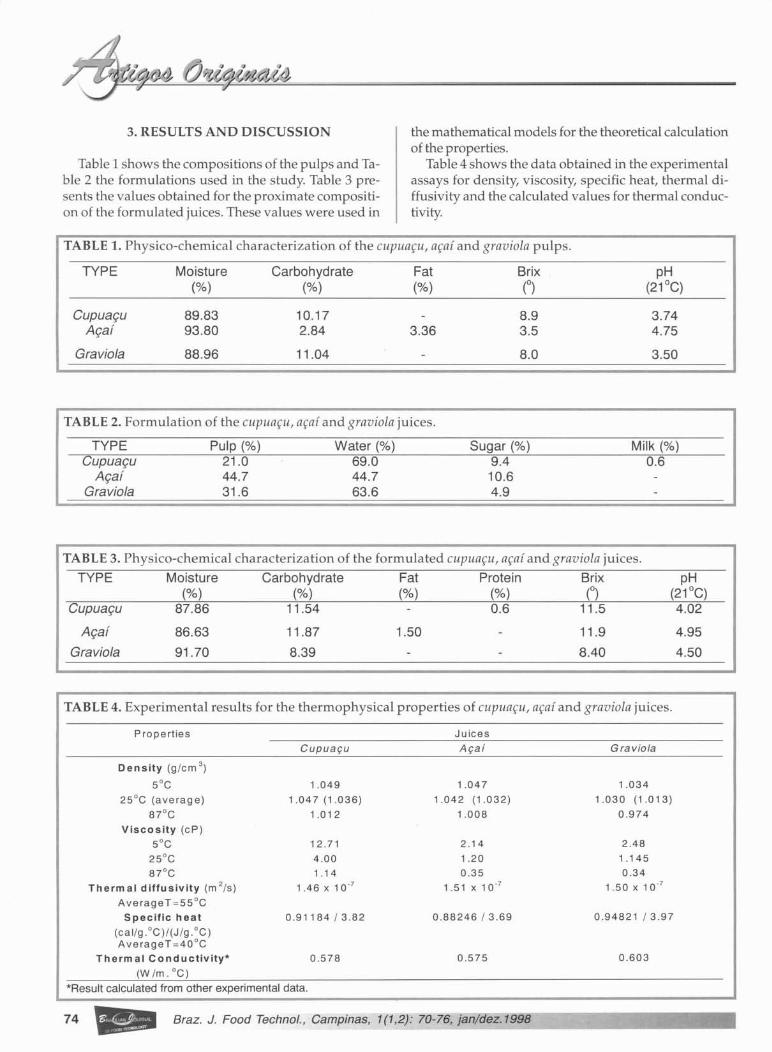
3. RESULTS AND DISCUSSION
Table 1 shows the compositions of the pulps and Table 2 the formulations used in the study. Table 3 presents the values obtained for the proximate composition of the formulated juices. These values were used in
the mathematical models for the theoretical calculationof the properties.
Table 4 shows the data obtained in the experimentalassays for density, viscosity, specific heat, thermal diffusivity and the calculated values for thermal conductivity.
TABLE 1. Physico-chemical characterization of the cupuaçu, açaí and graviola pulps.
TYPE Moisture Carbohydrate Fat Brix pH(%) (%) (%) (o) (21°C)
Cupuaçu 89.83 10.17 8.9 3.74Açaí 93.80 2.84 3.36 3.5 4.75
Graviola 88.96 11.04 8.0 3.50
TABLE 2. Formulation of the cupuaçu, açaí and graviola juices.
TYPECupuaçu
AçaíGraviola
Pulp (%)21.044.731.6
Water (%)69.044.763.6
Sugar (%)9.410.64.9
Milk (%)0.6
TABLE 3. Physico-chemical characterization of the formulated cupuaçu, açaí and graviola juices.
TYPE Moisture Carbohydrate Fat Protein Brix(%) (%) (%) (%) (0)
pH(21°C)
Cupuaçu
Açaí
Graviola
87.86 11.54 0.6 11.5
86.63 11.87 1.50 11.9
91.70 8.39 8.40
4.02
4.95
4.50
TABLE 4. Experimental results for the thermophysical properties of cupuaçu, açaí and graviola juices.
Properties
Density (g/cm 3)
5°C
25°C (average)
87°C
Viscosity (cP)
5°C
25°C87°e
Thermal diffusivity (m 2/s)
AverageT=55°e
Specific heat(cal/g .oe )/(J/g. oe)AverageT=40oe
T h erm a I C ond u ctivity*(w/m.oe)
Cupuaçu
1.049
1.047 (1.036)
1.012
12.71
4.00
1.141.46 x 10.7
0.91184/3.82
0.578
Juices
Açaí
1.047
1.042 (1.032)
1.008
2.14
1.20
0.351.51 x 10.7
0.88246/3.69
0.575
Graviola
1.034
1.030 (1.013)
0.974
2.48
1.145
0.34
1.50x10·7
0.94821 /3.97
0.603
*Result calculated from other experimental data.
74 Braz. J. Food Technol., Campinas, 1(1,2): 70-76, janldez.1998------------_.....
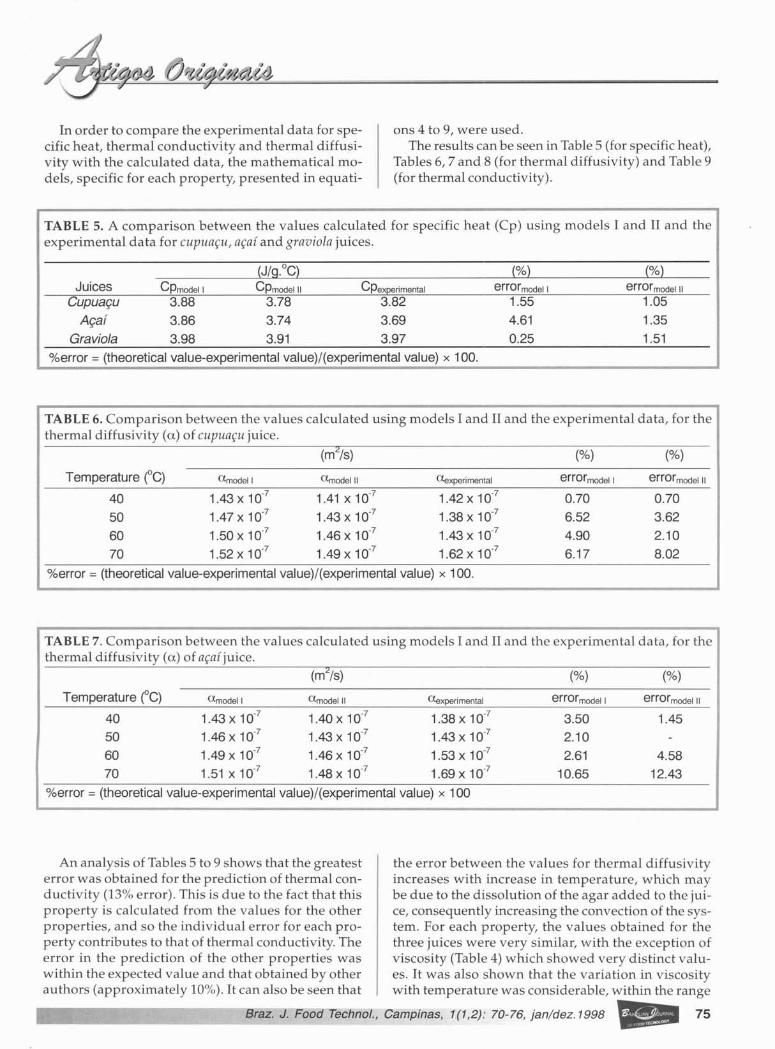
ln order to compare the experimental data for specific heat, thermal conductivity and thermal diffusivity with the calculated data, the mathematical modeIs, specific for each property, presented in equati-
ons 4 to 9, were used.The results can be seen in Table 5 (for specific heat),
Tables 6, 7 and 8 (for thermal diffusivity) and Table 9(for thermal conductivity).
TABLE 5. A comparison between the values calculated for specific heat (Cp) using modeIs I and II and theexperimental data for cupuaçu, açaí and graviola juices.
Juices Cpmodell Cpmodelll CpexperimentalCupuaçu 3.88 3.78 3.82
Açaí 3.86 3.74 3.69
Graviola 3.98 3.91 3.97
%errar = (thearetical vaiue-experimental value)/(experimental value) x 100.
(%)errarmodel I
1.55
4.61
0.25
(%)errarmodelll
1.05
1.35
1.51
TABLE 6. Comparison between the values calculated using models I and II and the experimental data, for thethermal diffusivity (a) of cupuaçu juice.
Temperature (0C) amodell amodelll Uexperimental
40 1.43 X 10⁻⁷ 1.41 x 10'7 1.42 X 10'7
50 1.47 X 10⁻⁷ 1.43 X 10'7 1.38 X 10'7
60 1.50 X 10⁻⁷ 1.46 X 10'7 1.43 X 10'7
70 1.52 X 10'7 1.49 x 10'7 1.62 X 10⁻⁷
(%) (%)
errarmodel I errarmodel II
0.70 0.70
6.52 3.62
4.90 2.10
6.17 8.02
%errar = (thearetical value-experimental value)/(experimental value) x 100.
TABLE 7_ Comparison between the values calculated using modeIs I and II and the experimental data, for thethermal diffusivity (a) of açaí juice.
Temperature (oC) amodell amodelll aexperimental
40 1.43 X 10'7 1.40 X 10'7 1.38 X 10'7
50 1.46 X 10⁻⁷ 1.43 X 10'7 1.43 X 10⁻⁷
60 1.49 X 10⁻⁷ 1.46 X 10'7 1.53 x 10'7
70 1.51 X 10⁻⁷ 1.48 X 10⁻⁷ 1.69 X 10⁻⁷
(%) (%)
errarmodell errarmodel II
3.50 1.45
2.10
2.61 4.58
10.65 12.43
%error = (thearetical vaiue-experimental value)/(experimental vaiue) x 100
An analysis of Tables 5 to 9 shows that the greatesterror was obtained for the prediction of thermal conductivity (13% error). This is due to the fact that thisproperty is calculated from the values for the otherproperties, and so the individual error for each property contributes to that of thermal conductivity. Theerror in the prediction of the other properties waswithin the expected value and that obtained by otherauthors (approximately 10%). It can also be seen that
the error between the values for thermal diffusivityincreases with increase in temperature, which maybe due to the dissolution of the agar added to the juice, consequently increasing the convection of the system. For each property, the values obtained for thethree juices were very similar, with the exception ofviscosity (Table 4) which showed very distinct values. It was also shown that the variation in viscositywith temperature was considerable, within the range
Braz. J. Food Technol., Campinas, 1(1,2): 70-76, jan/dez.1998'-------------- 75
studied, especially for cupuaçu juice. On the otherhand, thermal diffusivity (Tables 6 to 8) showed littlevariation with temperature within the sarne range.
4. CONCLUSIONS
It was conduded that the experimental results werevery dose to the calculated ones, based on the composition and temperature (error of approximately10%). Thus the methodologies used here can be safely applied to determining the thermal properties ofthis type of product. It is important to emphasize thatif these properties were not adequately determined, .this could result in under-processing or an incorrectcalculation of equipment dimensions.
ACKNOWLEDGEMENTS
The authors would like to thank Cia. Ciali. Amazonense for their authorization to publish the resultsobtained in this joint projecto We would also like tothank the trainee Áurea Maria Castelo Branco Lealfor her collaboration in the assays and in the evaluation of the results.
LITERATURE CITEO
ALVARADO, J.D. Nota. Viscosidad y energía deactivación de jugos filtrados, Revista Espanola de Ciencia y Tecnología de Alimentos,33(1):87-93, 1993.
BAYINDIRLI, L. Mathematical Analysis of Variation of Density and Viscosity of Apple Juicewith temperature and Concentration, Journalof Food Processing and Preservation, 16:2328, 1992.
CONSTENLA, D.T., LOZANO, J.E., CRAPISTE,G.H. Thermophysical Properties of ClarifiedApple Juice as a Function of Concentration andTemperature, Journal of Food Science,54(3):663-668, 1989.
DICKERSON, RW. An apparatus for measurements of Thermal Diffusivity of Foods, FoodTechnology, 19(5):198-204, 1965.
GEORGE, RM. A Literature Survey of Thermal Diffusivity of Food Products, Campden Food &
Drink Research Association, Technical Bulletin, 73(2):1-23, 1990.
HWANG, M.P., HAYAKAWA, K. A specific heatcalorimeter for foods, Journal of Food Science,44(2):435-448, 1979.
KOLAROV, K.M., GROMOV, M.A. KhromitelnaPromishenost 2(10):32, ln: JOWITT, R, ESCHER, F., HALLSTROM, H.F., MEFFERT, Th.,SPIESS, W.E.L., VOS, G. Physical Properties ofFoods. Applied Science Publisher, NY, 1973.Apud: VIRENDRA, K.B., SINGH, A.K., SINGHY. Prediction of Thermal Conductivity ofFruit Juices by Thermal Resistance Model, Journal of Food Science, 54(4):1007-1012,1989.
MARTENS, T. Mathematical model of heat processing in flat containers. Ph. D. thesis. Katholeike University, Leuven, Belgium, 1980. Apud:SINGH, RP. Thermal Diffusivity in food processing, Food Technology, 36(2):87-91, 1982.
PEACOCK, S. Predicting physical properties offactory juices and syrups, International SugarJournal, 97(1162):571-577,1995.
POLLEY, S.L., SNYDER, O.P., KOTNOUR, P. A compilation of Thermal Properties of Foods, FoodTechnology, 34(11):76-94, 1980.
RIEDEL, L. Measurements of thermal diffusivityof foodstuffs rich in water. Kaltetechnik-Klimatisierung, v. 21, n. 11, p. 315, 1969. Apud: SINGH, RP. Thermal Diffusivity in food processing, Food Technology, 36(2):87-91, 1982.
SIEBEL, J.E. Specific heat of various products. IceRefrig., 2:256-257, 1982.
SWEAT, Y.E. Thermal Properties of Foods. ln: RAO,M.A., RIZVI, S5.H. Engineering Properties ofFoods. Marcel Dekker Inc, NY, 1986. Apud:VIRENDRA, K.B., SINGH, A.K., SINGHY. Prediction of Thermal Conductivity of Fruit Juicesby Thermal Resistance Model, Journal of FoodScience, 54(4):1007-1012, 1989.
VAN WAZER, J.R, LYONS, J.w., KIM, K.Y., COLWELL, RE. Viscosity and Flow Measurement - ALaboratory Handbook of Rheology. New York:Intersience Publishers, 1972. p.215-230.
VIRENDRA, K.B., SINGH, A.K., SINGHY. Predictionof Thermal Conductivity of Fruit Juices by Thermal Resistance Model, Journal of Food Science,54(4):1007-1012, 1989.
WILLIAMS, S. (ed.) Official methods of analysis ofthe Association of Official Analytical Chernists.14'· ed., Arlington, AOAC Inc., 1990, 1141p.
76 Braz. J. Food Technol., Campinas, 1(1,2): 70-76, Jan eZ.1998-..:..;..~-~---------_-""'....:;.;.I