Embed Size (px)
Citation preview

Thermoelectric properties of BiOCu1xMxSe (M = Cd and Zn) Article
Accepted Version
Luu, S. D. N. and Vaqueiro, P. (2013) Thermoelectric properties of BiOCu1xMxSe (M = Cd and Zn). Semiconductor Science and Technology, 29 (6). 064002. ISSN 02681242 doi: https://doi.org/10.1088/02681242/29/6/064002 Available at http://centaur.reading.ac.uk/36420/
It is advisable to refer to the publisher’s version if you intend to cite from the work.
To link to this article DOI: http://dx.doi.org/10.1088/02681242/29/6/064002
Publisher: IOP
Publisher statement: Authors who do not select the gold open access option can post the accepted version of their manuscript to an institutional or subject repository after a 12 month embargo (with reuse restrictions). The accepted version of a paper refers to an author's original version of an article after any changes made during peer review but before any editing, typesetting, etc by the publisher
All outputs in CentAUR are protected by Intellectual Property Rights law, including copyright law. Copyright and IPR is retained by the creators or other copyright holders. Terms and conditions for use of this material are defined in the End User Agreement .

www.reading.ac.uk/centaur
CentAUR
Central Archive at the University of Reading
Reading’s research outputs online
1
Thermoelectric Properties of BiOCu1-xMxSe (M = Cd and Zn)
Son D. N. Luu1 and Paz Vaqueiro
1,2*
1. Institute of Chemical Sciences, Heriot-Watt University, Edinburgh, EH14, 4AS, UK
2. Department of Chemistry, University of Reading, Whiteknights, Reading RG6 6AD
Email: [email protected]
Abstract
Doping of BiOCuSe at the copper site with divalent cadmium and zinc cations has been investigated.
Analysis of the powder X-ray diffraction data indicates that the ZrCuSiAs structure of BiOCuSe is
retained up to substitution levels of 10 and 5 at.% for Cd2+
and Zn2+
, respectively. Substitution of
monovalent Cu+ with divalent Cd
2+ or Zn
2+ leads to an increase in the magnitude of the electrical
resistivity and the Seebeck coefficient. All synthesized materials behave as p-type semiconductors.
1. Introduction
Layered oxychalcogenides with the general formula ROTmCh (R = La, Ce, Nd, Pr, Bi; Tm = Cu, Ag
and Ch = S, Se, Te) [1, 2, 3,4, 5] have attracted considerable interest due to their optoelectronic
properties, as many of them are transparent p-type semiconductors [6]. These materials crystallise in
the ZrCuSiAs structure, which consists of alternating fluorite and antifluorite layers (Figure 1), and
are isostructural to the newly discovered superconducting oxypnictides LnOFePn (Ln = La, Pr, Ce,
Sm; Pn = P and As) [7]. Very recently, it has been reported that two members of the oxychalcogenide
family, BiOCuTe and BiOCuSe, exhibit promising thermoelectric properties at temperatures suitable
for waste heat recovery [8, 9]. Their remarkable thermoelectric performance arises from a
combination of very low thermal conductivities () with reasonable values of the Seebeck coefficient
(S) and the electrical conductivity (). This leads to promising values of the thermoelectric figure of
merit (ZT), which is defined by ZT = S2T/ and is related to the efficiency of thermoelectric energy
recovery [10]. It has been suggested that these oxychalcogenides behave as “natural superlattices”,
which are layered materials in which slabs with excellent electronic transport properties are combined
with a second type of slab which serves as a phonon scatterer, to reduce the thermal conductivity [11].
Other thermoelectric materials have been recently reviewed [12].
Recently, it has been shown that aliovalent substitution at the Bi3+
site in BiOCuSe can lead to p-type
thermoelectric materials with an excellent performance [9, 13,14,15, 16]. For instance, high values of
the thermoelectric figure of merit, ZT, have been obtained by doping with Sr2+
(ZT = 0.76 at 873 K)
[9], Ca2+
(ZT= 0.8 at 773 K) [13], Pb2+
(ZT = 0.65 at 673 K)[14] and Mg2+
(ZT = 0.74 at 923 K) [15].
Doping with divalent Ba2+
ions at the Bi3+
site, combined with a reduction in grain sizes down to 200-

2
400 nm which decreases the thermal conductivity by ca. 40%, results in even higher ZT values of 1.1
at 923K [13]. Similar reductions in thermal conductivity have been found for ball milled BiOCuSe
[17], suggesting that nanostructuring may be an effective approach to enhance the thermoelectric
response of these materials. Instead of conventional solid-state synthesis and ball milling, a simple
mechanical alloying process can be used to produce single phase nanocrystalline BiOCuQ (Q = Se,
Te)[18]. Texturing of Bi0.875Ba0.125OCuSe by hot forging also increases ZT up to 1.4 at 923K [19].
To date, efforts on modifying the electrical transport properties of BiOCuSe to improve its
thermoelectric performance have been primarily focused on doping at the bismuth site. Isoelectronic
substitution at the Se site, to form BiOCuSe1-xTex, has been investigated by Liu et. al., who have
shown that it leads to improved electrical transport properties due to band gap tuning [21].To the best
of our knowledge, the effect of aliovalent substitution at the copper site on the thermoelectric
properties has not been investigated. However, it has been demonstrated that copper deficiency, which
introduces holes into the conducting layer of BiOCuSe, results in a remarkable enhancement of the
thermoelectric performance, with ZT reaching a value of 0.81 at 923 K [20]. In this paper, we report
the effect of the partial substitution of Cu+ by divalent cations (Cd
2+ and Zn
2+) on the structure and
transport properties of BiOCuSe.
2. Experimental procedure
2.1. Sample preparation
A series of polycrystalline BiOCu1-xMxSe (M= Cd, and Zn; x= 0.05, 0.10, 0.15 and 0.20) compounds
were synthesized by solid state reaction in evacuated and sealed silica tubes (< 10-4
Torr) from
mixtures of Bi2O3 (99.99%, Sigma Aldrich), Bi (99.5%, Aldrich), Cu (99.5%, Johnson Matthey), CdO
(≥99.99%, Aldrich) Zn (99%, Aldrich) and Se (99.99%, Aldrich). Each stoichiometric mixture was
first heated up to 623 K for 20h and then up to 773 K for 10h with a 2 K min-1
ramp rate. A second
annealing process at 873 K for a further 7h was carried out after regrinding the obtained powders. For
electrical and thermal property measurements, the as-prepared powders were hot pressed into highly
densified pellets (≥ 95% of theoretical density) at 853K and with a uniaxial pressure of 50 bars for 30
minutes under a N2 flow.
2.2. Characterization and physical property measurements
2.2.1. Structural characterisation
Samples were characterized by powder X-ray diffraction (XRD) using a Bruker D8 Advance Powder
X-ray diffractometer, operating with germanium monochromated CuKα1 radiation (λ = 1.54056 Å)
3
and fitted with a LynxEye detector. Data were collected over a range of 5≤2θ/o ≤ 120 for a period of 7
hours. Rietveld refinements were carried out using GSAS software [17].
2.2.2. Electrical transport measurements
The electrical resistivity of sample over the temperature range of 100 ≤ T/K ≤ 300 was measured
using a 4-probe DC technique. For each sample, a rectangular bar (~ 6 x 3 x 1 mm3) was cut from a
hot pressed pellet. Four 50µm silver wires were attached using silver paint and connections were
made to a Keithley 2182 nanovoltmeter and a TTi QL564P power supply. The sample was mounted in
an Oxford Instruments CF1200 cryostat connected to an ITC502 temperature controller. To measure
the Seebeck coefficient over the same temperature range, the sample bar (~ 6 x 3 x 1 mm3) was
mounted on a copper holder, which incorporates a small heater (120 strain gauge), located close to
one end of the sample. The copper holder is attached to the hot stage of a closed-cycle refrigerator
(DE-202, Advanced Research Systems), which is connected to a Lakeshore LS-331 temperature
controller. Two 50µΩ copper wires were attached to the ends of the sample bar using silver paint and
connections made to a Keithley 2182A nanovoltmeter. Two Au: 0.07% Fe vs. chromel thermocouples
were placed at the hot and cold ends of the sample, and connected to a second Lakeshore LS-331
temperature controller. The Seebeck coefficient at a given temperature was determined by applying a
temperature gradient, ΔT, across the sample and measuring the corresponding thermal voltage, ΔV.
The slope of the line, ΔV/ ΔT, was used to determine the Seebeck coefficient.
For measurements above room temperature (300 < T/K ≤ 673), the resistivity and Seebeck coefficient
of each sample were measured simultaneously using a Linseis LSR-3 instrument (Germany).
2.2.3. Thermal transport measurements
An Anter FL3000 system was employed for measuring thermal diffusivity (α) and the heat capacity
(Cp) of samples over a temperature range of 373≤T/K≤673 in 50 K steps. Samples were hot pressed
into highly densified pellets with a diameter of approximate 13 mm and a thickness of 1-2 mm. A
graphite coating on the surface of pellet was applied to maximize heat absorption. The pellet was then
loaded into the sample chamber which was purged with N2 during the measurement. The thermal
conductivity (κ) is calculated from the relationship = Cp where ρ is the sample density. A
reference material, PyroceramTM
9606, of known heat capacity was used as a reference for the
determination of the heat capacity of sample. The details of procedure of determination of the heat
capacity are described in Ref. 21.
4
3. Results and discussion
3.1. Structural characterisation
Figure 2 shows selected powder X-ray diffraction patterns of the BiOCu1-xMxSe (M = Cd, Zn)
samples. Analysis of these data indicates that these materials crystallise in the ZrCuSiAs structure
type (space group P4/mmm). Cd-containing samples with low dopant contents are single phases,
while for the Zn-doped samples trace amounts of Bi2O2Se were detected. The maximum doping level
was found at ca. x = 0.10 and 0.05 for Cd2+
and Zn2+
, respectively. Samples with larger values of x
(Supplementary Information) contain significant amounts of impurities, which were identified by
powder X-ray diffraction as CdSe and Bi10Cd3O20 for Cd-containing samples and as Bi2O2Se for Zn-
containing samples.
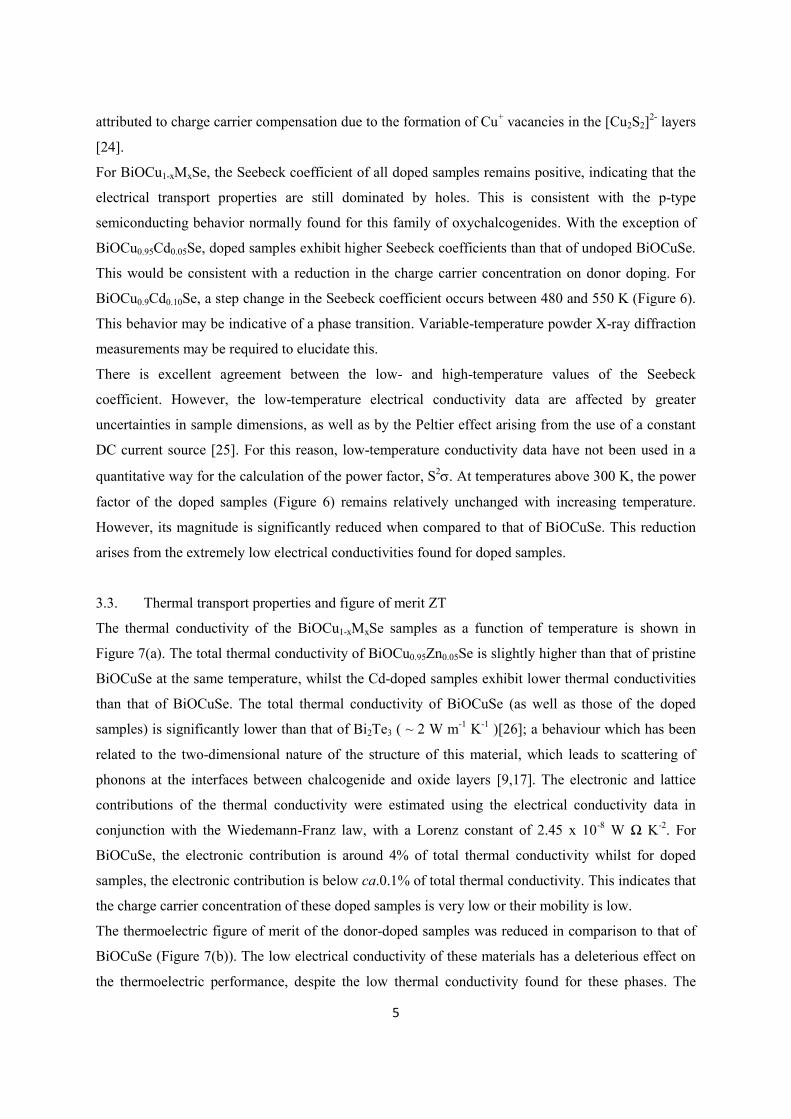
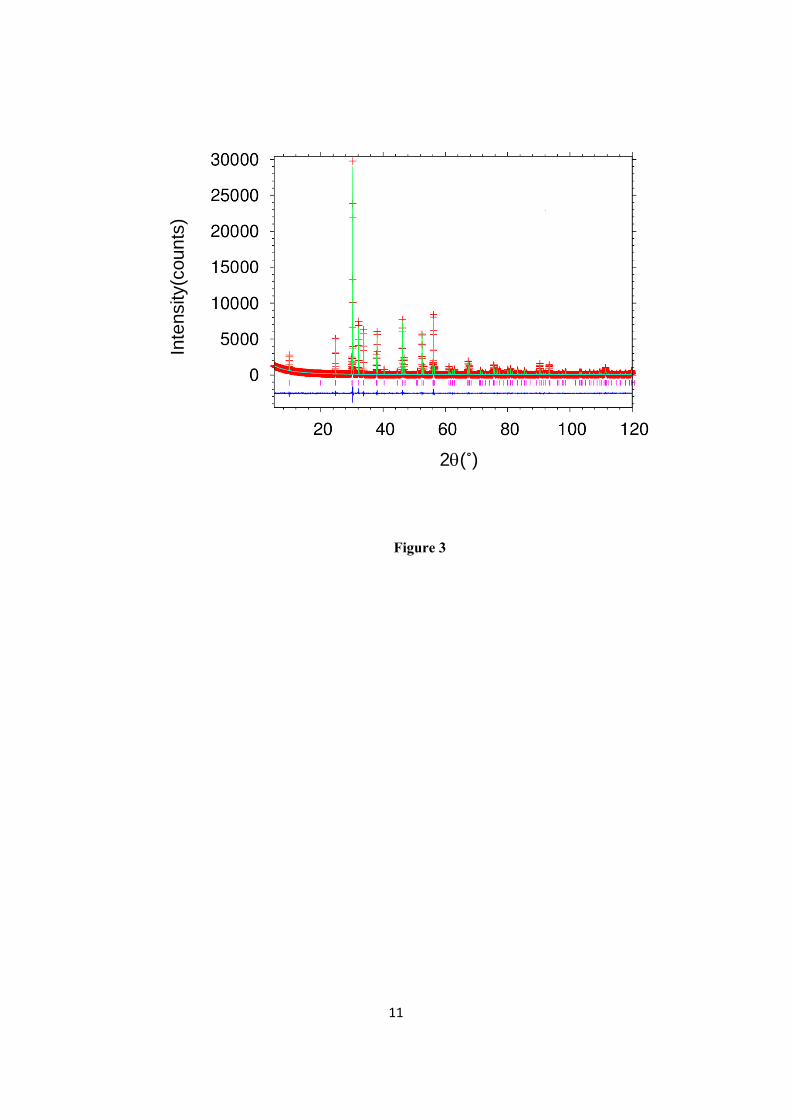
A representative Rietveld refinement is shown in Figure 3. The remaining refinements, together with
tables of refined parameters, selected distances and angles are given in the Supplementary
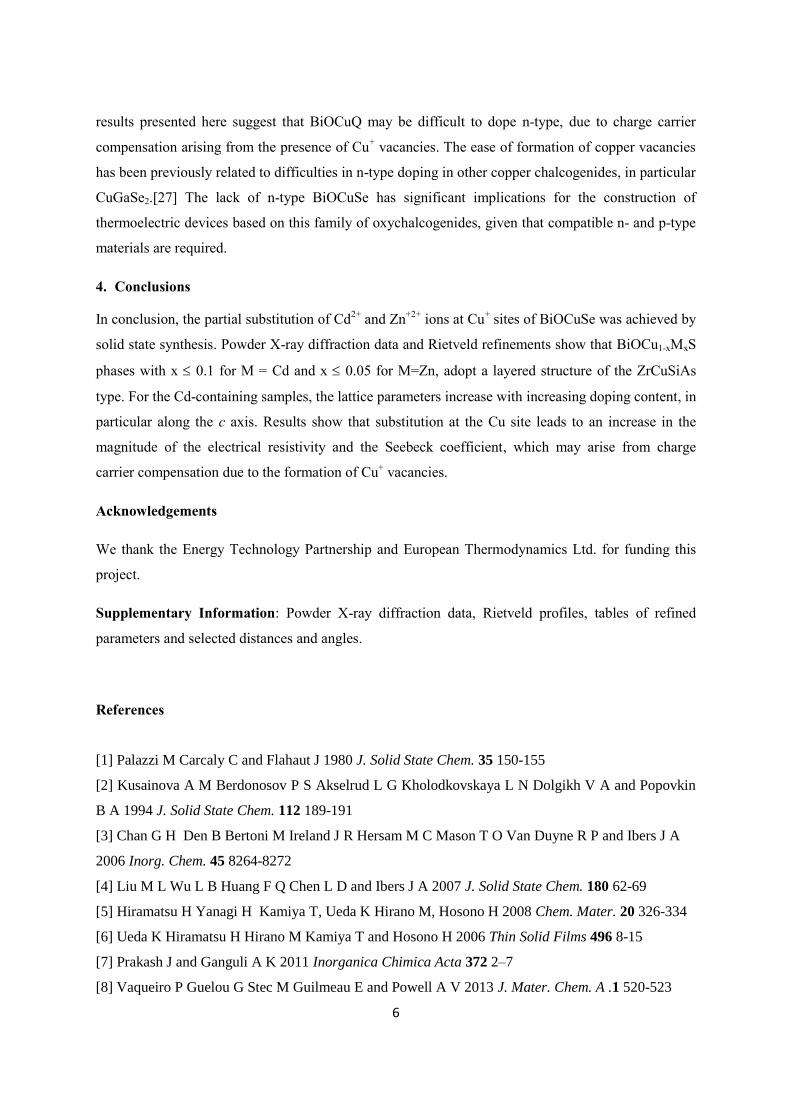
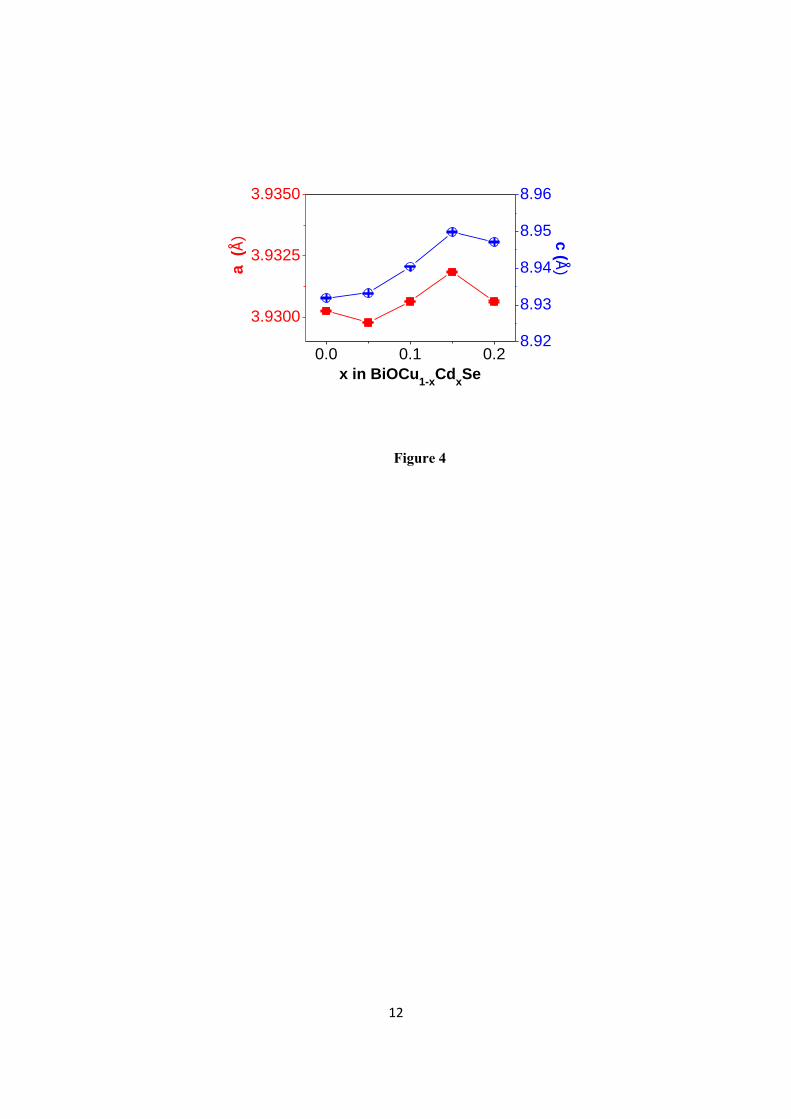
Information. As shown in Figure 4, in the single-phase region the c lattice parameter of BiOCu1-
xCdxSe increases with increasing x. This expansion of the unit cell along the c axis might be related to
the larger ionic radius of Cd2+
(109pm) when compared to that of Cu+ (91pm) [13]. By contrast,
substitution with Zn2+
results in a reduction in the lattice parameters (Supplementary Information),
which may be related to the smaller ionic radius of Zn2+
(74pm). In all cases, there are only very small
changes (~ ± 0.05 - 0.1%) in bond distance and angles with doping.
3.2. Electrical transport properties
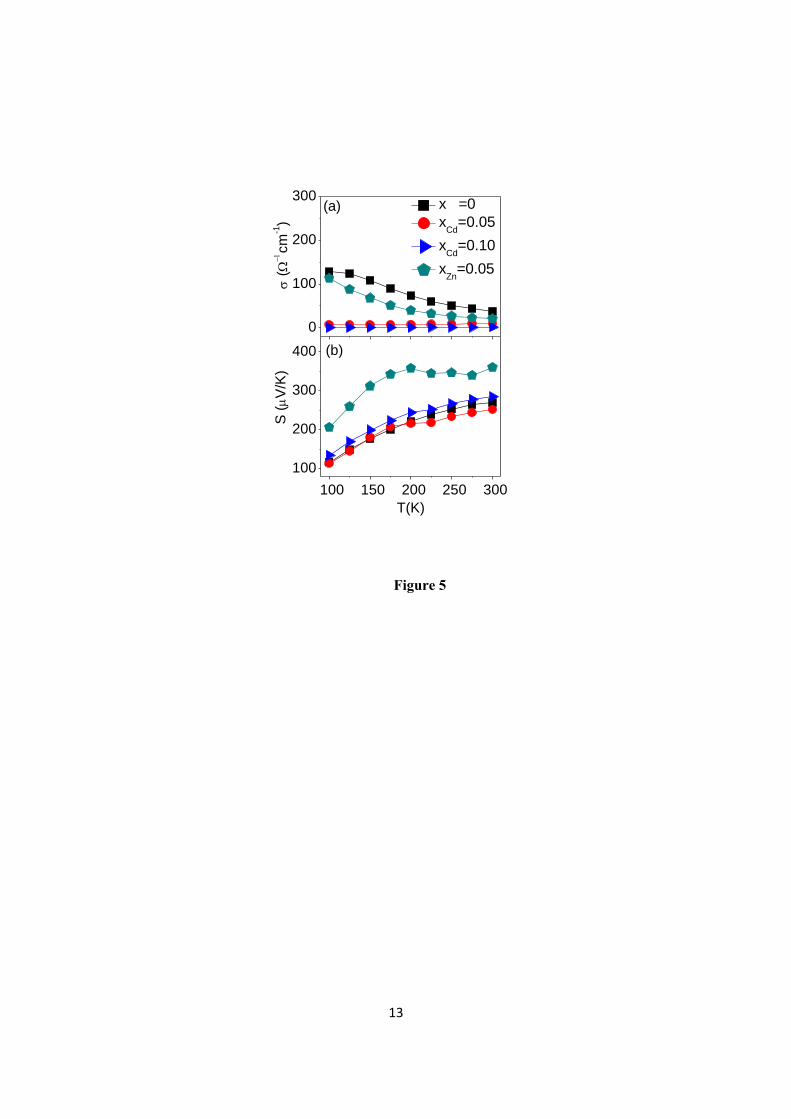
The electrical conductivity of undoped BiOCuSe decreases with increasing temperature (Figures 5
and 6), indicating that this material exhibits a degenerate semiconducting behavior, in agreement with
previous reports on BiOCuSe [14, 22]. In sharp contrast with doping at the Bi3+
site with divalent
cations, which results in a significant enhancement of the electrical conductivity of BiOCuSe due to
an increase in the concentration of holes [13,15,16,22], the substitution at the Cu+ site with divalent
ions leads to a major reduction in the electrical conductivity. With increasing levels of dopants, the
electrical conductivity decreases in a systematic fashion, and the temperature dependence changes
from that characteristic of a degenerate semiconductor to that expected for intrinsic behaviour. This
may be indicative of a reduction in charge carrier concentration from the value of 1.1 1018
cm-3
previously found for undoped BiOCuSe [16]. Whilst Cd2+
and Zn2+
would be expected to act as n-type
dopants, Cu+ vacancies, which would act as acceptors, are known to form easily in this family of
oxychalcogenides [20, 23], and this would lead to charge carrier compensation. Donor doping has
been previously attempted in the related materials Sr2MO3CuS (M = Zn, Ga, In), which also contain
[Cu2Q2]2-
antifluorite-type layers, and it was found that p-type behavior was retained [24]. This was
5
attributed to charge carrier compensation due to the formation of Cu+ vacancies in the [Cu2S2]
2- layers
[24].
For BiOCu1-xMxSe, the Seebeck coefficient of all doped samples remains positive, indicating that the
electrical transport properties are still dominated by holes. This is consistent with the p-type
semiconducting behavior normally found for this family of oxychalcogenides. With the exception of
BiOCu0.95Cd0.05Se, doped samples exhibit higher Seebeck coefficients than that of undoped BiOCuSe.
This would be consistent with a reduction in the charge carrier concentration on donor doping. For
BiOCu0.9Cd0.10Se, a step change in the Seebeck coefficient occurs between 480 and 550 K (Figure 6).
This behavior may be indicative of a phase transition. Variable-temperature powder X-ray diffraction
measurements may be required to elucidate this.
There is excellent agreement between the low- and high-temperature values of the Seebeck
coefficient. However, the low-temperature electrical conductivity data are affected by greater
uncertainties in sample dimensions, as well as by the Peltier effect arising from the use of a constant
DC current source [25]. For this reason, low-temperature conductivity data have not been used in a
quantitative way for the calculation of the power factor, S2. At temperatures above 300 K, the power
factor of the doped samples (Figure 6) remains relatively unchanged with increasing temperature.
However, its magnitude is significantly reduced when compared to that of BiOCuSe. This reduction
arises from the extremely low electrical conductivities found for doped samples.
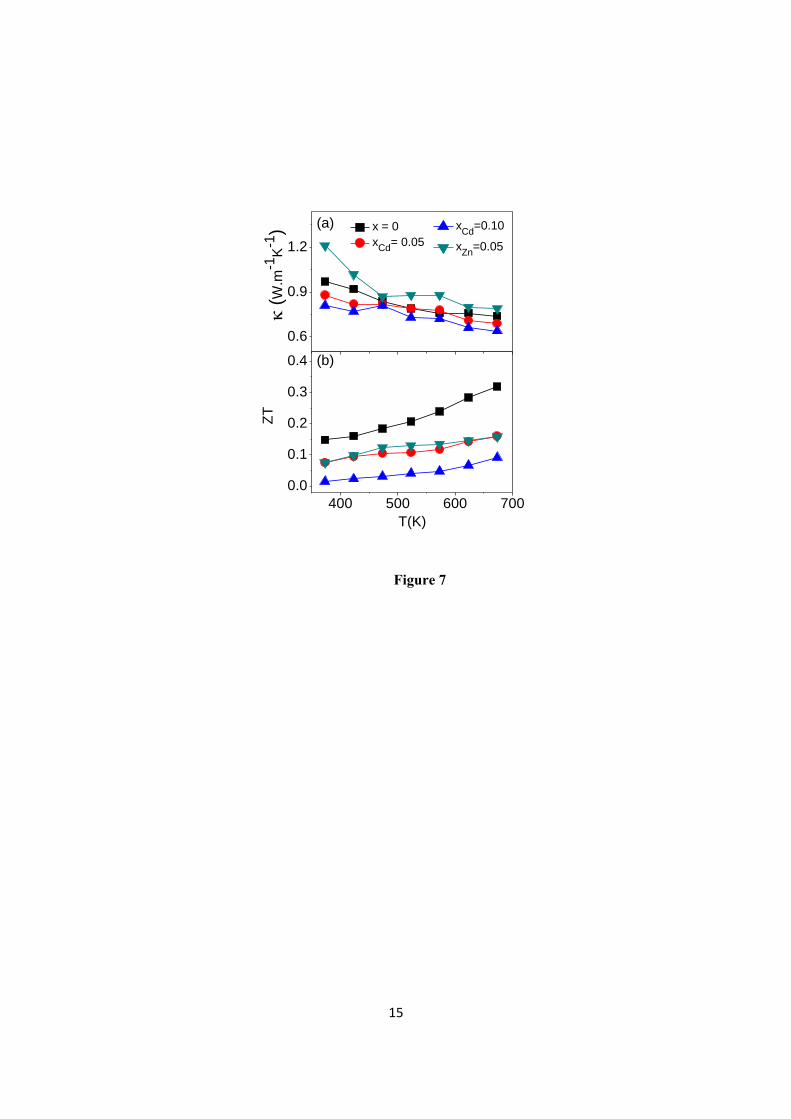
3.3. Thermal transport properties and figure of merit ZT
The thermal conductivity of the BiOCu1-xMxSe samples as a function of temperature is shown in
Figure 7(a). The total thermal conductivity of BiOCu0.95Zn0.05Se is slightly higher than that of pristine
BiOCuSe at the same temperature, whilst the Cd-doped samples exhibit lower thermal conductivities
than that of BiOCuSe. The total thermal conductivity of BiOCuSe (as well as those of the doped
samples) is significantly lower than that of Bi2Te3 ( ~ 2 W m-1
K-1
)[26]; a behaviour which has been
related to the two-dimensional nature of the structure of this material, which leads to scattering of
phonons at the interfaces between chalcogenide and oxide layers [9,17]. The electronic and lattice
contributions of the thermal conductivity were estimated using the electrical conductivity data in
conjunction with the Wiedemann-Franz law, with a Lorenz constant of 2.45 x 10⁻⁸
W Ω K-2
. For
BiOCuSe, the electronic contribution is around 4% of total thermal conductivity whilst for doped
samples, the electronic contribution is below ca.0.1% of total thermal conductivity. This indicates that
the charge carrier concentration of these doped samples is very low or their mobility is low.
The thermoelectric figure of merit of the donor-doped samples was reduced in comparison to that of
BiOCuSe (Figure 7(b)). The low electrical conductivity of these materials has a deleterious effect on
the thermoelectric performance, despite the low thermal conductivity found for these phases. The
6
results presented here suggest that BiOCuQ may be difficult to dope n-type, due to charge carrier
compensation arising from the presence of Cu+ vacancies. The ease of formation of copper vacancies
has been previously related to difficulties in n-type doping in other copper chalcogenides, in particular
CuGaSe2.[27] The lack of n-type BiOCuSe has significant implications for the construction of
thermoelectric devices based on this family of oxychalcogenides, given that compatible n- and p-type
materials are required.
4. Conclusions
In conclusion, the partial substitution of Cd2+
and Zn+2+
ions at Cu+ sites of BiOCuSe was achieved by
solid state synthesis. Powder X-ray diffraction data and Rietveld refinements show that BiOCu1-xMxS
phases with x 0.1 for M = Cd and x 0.05 for M=Zn, adopt a layered structure of the ZrCuSiAs
type. For the Cd-containing samples, the lattice parameters increase with increasing doping content, in
particular along the c axis. Results show that substitution at the Cu site leads to an increase in the
magnitude of the electrical resistivity and the Seebeck coefficient, which may arise from charge
carrier compensation due to the formation of Cu+ vacancies.
Acknowledgements
We thank the Energy Technology Partnership and European Thermodynamics Ltd. for funding this
project.
Supplementary Information: Powder X-ray diffraction data, Rietveld profiles, tables of refined
parameters and selected distances and angles.
References
[1] Palazzi M Carcaly C and Flahaut J 1980 J. Solid State Chem. 35 150-155
[2] Kusainova A M Berdonosov P S Akselrud L G Kholodkovskaya L N Dolgikh V A and Popovkin
B A 1994 J. Solid State Chem. 112 189-191
[3] Chan G H Den B Bertoni M Ireland J R Hersam M C Mason T O Van Duyne R P and Ibers J A
2006 Inorg. Chem. 45 8264-8272
[4] Liu M L Wu L B Huang F Q Chen L D and Ibers J A 2007 J. Solid State Chem. 180 62-69
[5] Hiramatsu H Yanagi H Kamiya T, Ueda K Hirano M, Hosono H 2008 Chem. Mater. 20 326-334
[6] Ueda K Hiramatsu H Hirano M Kamiya T and Hosono H 2006 Thin Solid Films 496 8-15
[7] Prakash J and Ganguli A K 2011 Inorganica Chimica Acta 372 2–7
[8] Vaqueiro P Guelou G Stec M Guilmeau E and Powell A V 2013 J. Mater. Chem. A .1 520-523

7
[9] Zhao L D Berardan D Pei Y L Byl C Pinsard-Gaudart L and Dragoe N 2010 App. Phys. Lett. 97
092118
[10] Rowe D M 2006 Thermoelectrics Handbook: Macro to Nano ed. D M Rowe (Boca Raton FL:
CRC Press) Chapter 1
[11] Wan C Wang Y Wang N Norimatsu W Kusumoki M and Koumoto K 2010 Sci. Technol. Adv.
Mater. 11 044306
[12] Sootsman JR Chung DY Kanatzidis MG 2009 Angew. Chem. 48 8616-8639
[13] Li F Wei T-R Kang F Li J-F 2013 J. Mater. Chem A 1 11942-11949
[14] Luu S D N and Vaqueiro P 2013 J. Mater. Chem. A 1 12270-12275
[15] Lan J-L Zhan B Liu Y-C Zheng B Liu Y Lin Y-H and Nan C-W 2013 Appl. Phys. Lett. 102
123905
[16] Li J Sui J Pei Y Barreteau C Berardan D Dragoe N Cai W He J and Zhao L D 2012 Energy
Environ. Sci. 5 8543-8547
[17] Li F Li J-F Zhao L D Xiang K Liu Y Zhang B P Lin Y-H Nan C-W and Zhu H-M 2012 Energy
Environ. Sci. 5 7188-7195
[18] Pele V Barreteau C Berardan D Zhao L-D Dragoe N 2013 J. Solid State Chem. 203 187-191
[19] Sui J Li J He J Pei Y-L Berardan D Wu H Dragoe N Cai W and Zhao L-D 2013 Energy Environ.
Sci. 6 2916-2920.
[20] Liu Y Zhao L-D Liu Y Lan J Xu W Li F Zhang B-P Berardan D Dragoe N Lin Y-H Nan C-W Li
J-F and Zhu H 2011 J. Am. Chem. Soc.133 20112-20115
[21] Gaal P S Apostolescu S P 2002 US Patent No. US 6,375,349.
[22] Barreteau C Bérardan D Amzallag E Zhao L D Dragoe N 2012 Chem. Mater. 24 3168-3178
[23] Pitcher M J Smura C F. Clarke S J 2006 Inorg. Chem. 48 9054-9056
[24] Ueda K Hirose S Kawazoe H Hosono H 2001 Chem. Mater. 13 1880-1883
[25] Nolas G S Sharp J Goldsmid H J 2001 Thermoelectrics: Basic Principles and New Materials
Developments, Springer, Berlin Heidelberg
[26] Scherrer H Scherrer S 1995 CRC Handbook of Thermoelectrics, Ed. D.M. Rowe, CRC Press,
Boca Raton, FL, Chapter 19
[27] Persson C Zhao Y-J Lany S Zunger A 2005 Phys Rev. B 72 035211

8
Figure captions
Figure 1 View of the crystal structure of ROTmCh (R = La, Ce, Nd, Pr, Bi; Tm =
Cu, Ag and Ch = S, Se, Te).
Figure 2 Powder X-ray diffraction patterns of BiOCu1-xMxSe (M = Cd, Zn).
Figure 3 Rietveld refinement using powder X-ray diffraction data for
BiOCu0.95Cd0.05Se (Rwp=10.71%). Key: observed data (red crosses);
difference curve (blue line); calculated pattern (green line) and
reflection positions (pink markers).
Figure 4 Lattice parameters as a function of composition for BiOCu1-xCdxSe.
Figure 5 Temperature dependence of the electrical properties of BiOCu1-xMxSe
over the temperature range 100≤T/K≤300: (a) Electrical conductivity
(σ); and (b) Seebeck coefficient (S).
Figure 6 Temperature dependence of the electrical properties of BiOCu1-xMxSe
over the temperature range 300<T/K<673: (a) Electrical conductivity
(σ); (b) Seebeck coefficient (S) and (c) power factor (S2σ).
Figure 7 Temperature dependence of (a) thermal conductivity () and (b) figure
of merit (ZT) of BiOCu1-xMxSe.

9
Figure 1

10
20 40 60 80 100 120
(d)
(c)
(b)
Inte
nsity (
a.u
.)
2( )
(a) BiOCuSe
(b) BiOCu0.95
Cd0.05
Se
(c) BiOCu0.90
Cd0.10
Se
(d) BiOCu0.95
Zn0.05
Se
(a)
Figure 2
11
2(˚)
Inte
nsity(c
ou
nts
)
Figure 3
12
0.0 0.1 0.2
3.9300
3.9325
3.9350
x in BiOCu1-x
CdxSe
a
(Å)
8.92
8.93
8.94
8.95
8.96
c (Å)
Figure 4
13
0
100
200
300
100
200
300
400
100 150 200 250 300
(
cm
-1)
x =0
xCd
=0.05
xCd
=0.10
xZn
=0.05
(a)
S (V
/K)
(b)
T(K)
Figure 5

14
0
50
100
200
300
400
300 400 500 600
0
4x10⁻⁴
(
-1.c
m-1)
x = 0
xCd
= 0.05
xCd
=0.10
xZn
=0.05
(a)
S (V
/K) (b)
S2 (
W.m
-1K
-2)
T(K)
(c)
Figure 6
15
400 500 600 700
0.0
0.1
0.2
0.3
0.4
0.6
0.9
1.2
ZT
T(K)
x = 0
xCd
= 0.05
(b)
(
W.m
-1K
-1) (a) x
Cd=0.10
xZn
=0.05
Figure 7