Embed Size (px)
Citation preview
08/06/2009
Thermodynamic Performance Monitoring OF Gas Turbine:
AEN ExperienceR. Bittarello & P. Levorato
08/06/2009
Introduction 1/2
• In the last few years, the necessity to verify the thermodynamic performance of GT has been increased.
• Performance monitoring of all components in a power plant is a primary requirement that allows improvement in plant efficiency, availability and maintenance scheduling .
• AEN thermodynamics monitoring software has been installed in several AEN power plants to monitor Gas Turbines type V94.3A2/4 and V94.2
08/06/2009
Introduction 2/2
• Performance GT software has proved its usefulness in several applications, for example:– to analyse the best time interval between two off-line
compressor washing.– to analyse GT performance degradation during the
machine lifetime.– to support the commissioning activities post Major
Overhaul, supplying to AEN technicians a real time monitoring during the combustion optimisation.

08/06/2009
History
– 1997: Thermo System • implemented for the V64.3 gas turbines of a power plant in Greece.
– 2000: TVA • The modular structure allows the system to be adapt to the different
requirements of each power plant .– 2008: ADA – GTPA (Gas Turbine Performance Analysis)
• GTPA marks a new approach in performance monitoring, passing from a correction curves based method to a model based performance analysis, with the use of the Gas Turbine’s components performance maps
08/06/2009
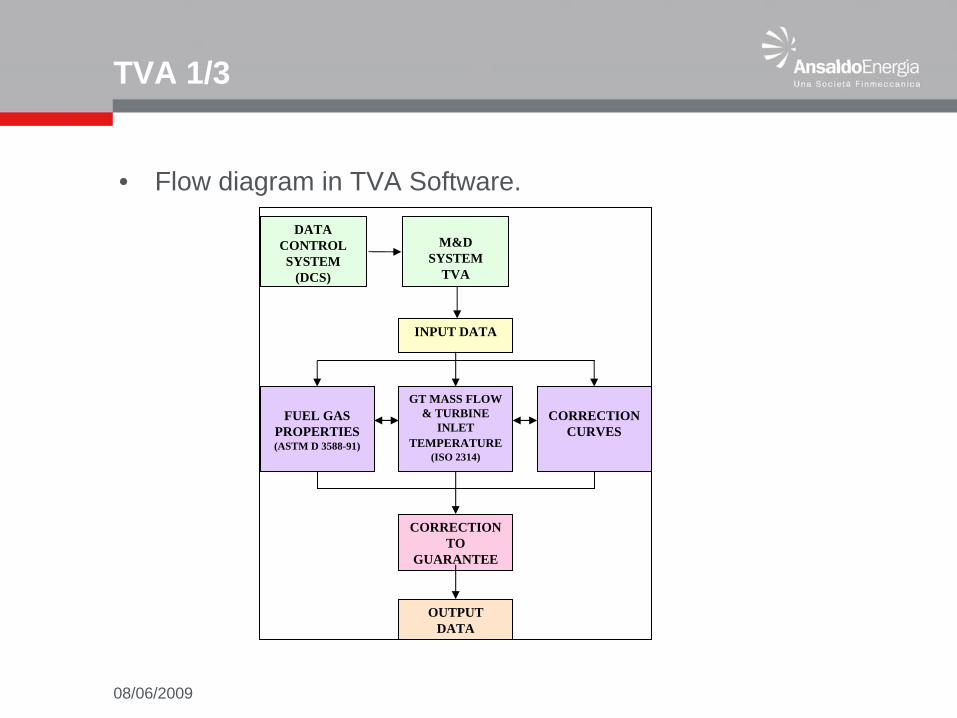
TVA 1/3
• Flow diagram in TVA Software.DATA
CONTROLSYSTEM
(DCS)
M&D SYSTEM
TVA
INPUT DATA
FUEL GAS PROPERTIES(ASTM D 3588-91)
CORRECTION CURVES
GT MASS FLOW & TURBINE
INLET TEMPERATURE
(ISO 2314)
CORRECTION TO
GUARANTEE
OUTPUT DATA

08/06/2009
TVA 2/3
• The most important parameters for thermodynamic diagnostics are the turbine inlet temperature, the turbine outlet temperature, the turbine exhaust mass flow rate, the compressor ratio, the compressor isentropic efficiency and the turbine isentropic efficiency
08/06/2009
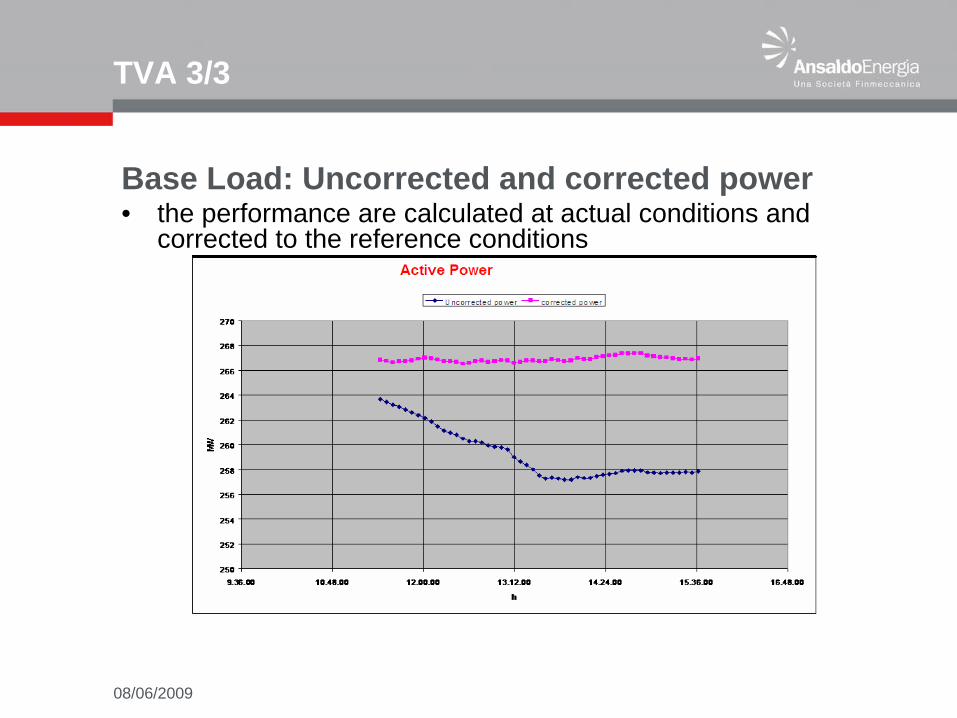
TVA 3/3
Base Load: Uncorrected and corrected power• the performance are calculated at actual conditions and
corrected to the reference conditions
08/06/2009
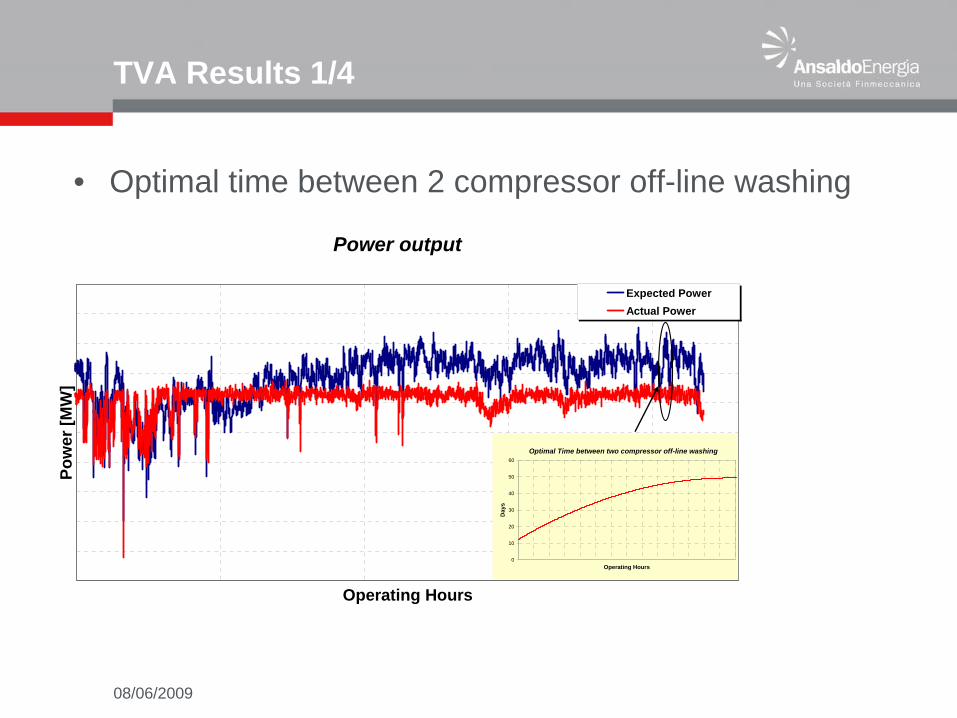
TVA Results 1/4
• Optimal time between 2 compressor off-line washing
Power output
Operating Hours
Pow
er [M
W]
Expected PowerActual Power
Optimal Time between two compressor off-line washing
0
10
20
30
40
50
60
Operating Hours
Day
s
08/06/2009
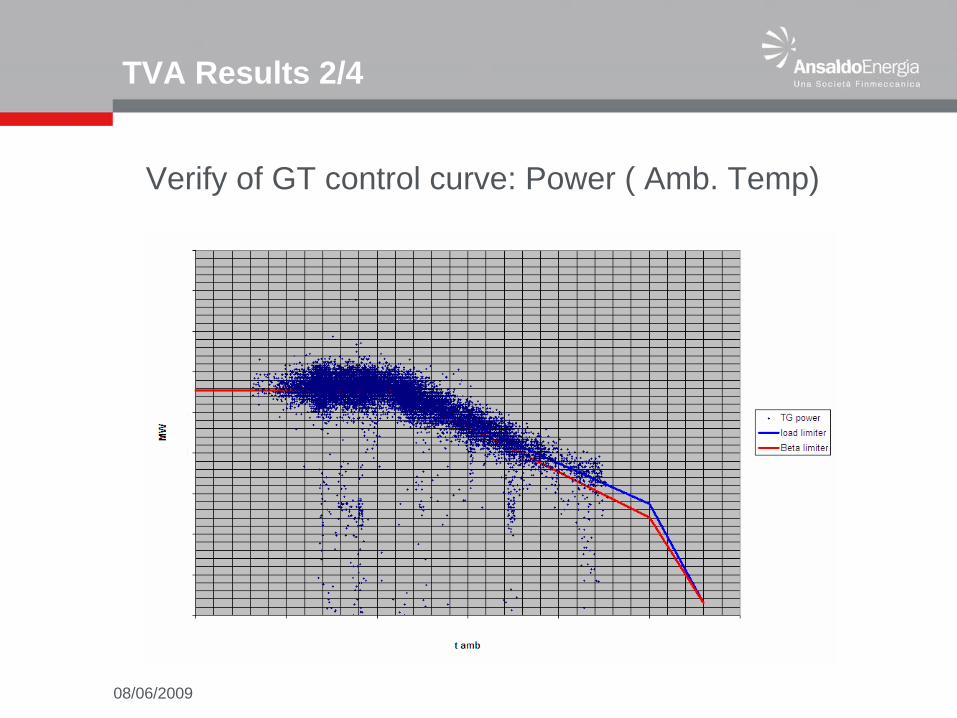
TVA Results 2/4
Verify of GT control curve: Power ( Amb. Temp)
08/06/2009
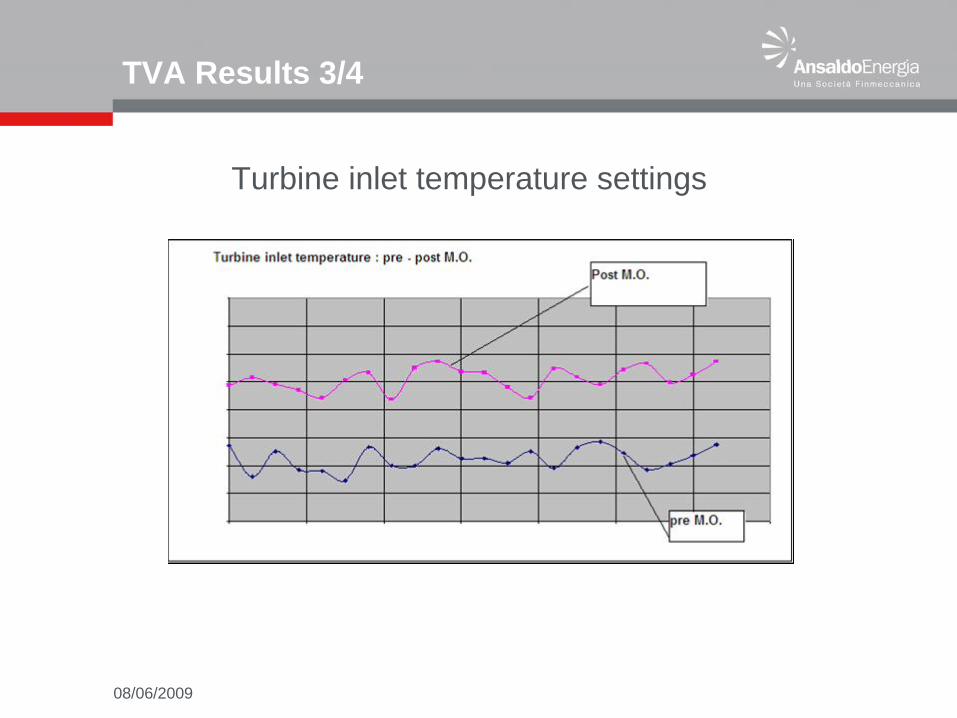
TVA Results 3/4
Turbine inlet temperature settings
08/06/2009
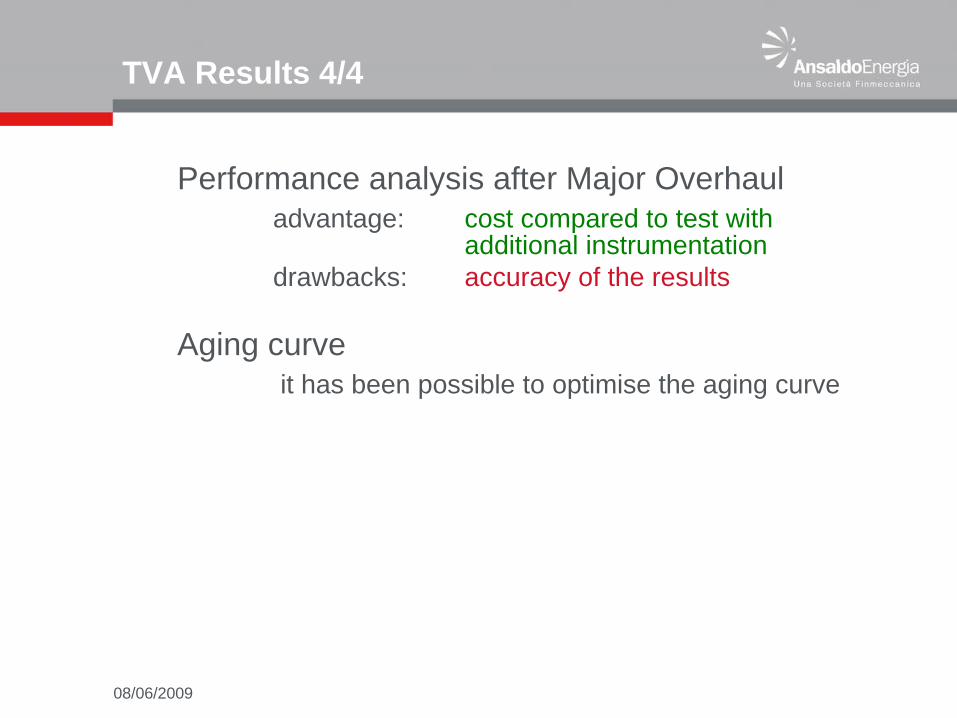
TVA Results 4/4
Performance analysis after Major Overhauladvantage: cost compared to test with
additional instrumentationdrawbacks: accuracy of the results
Aging curveit has been possible to optimise the aging curve
08/06/2009
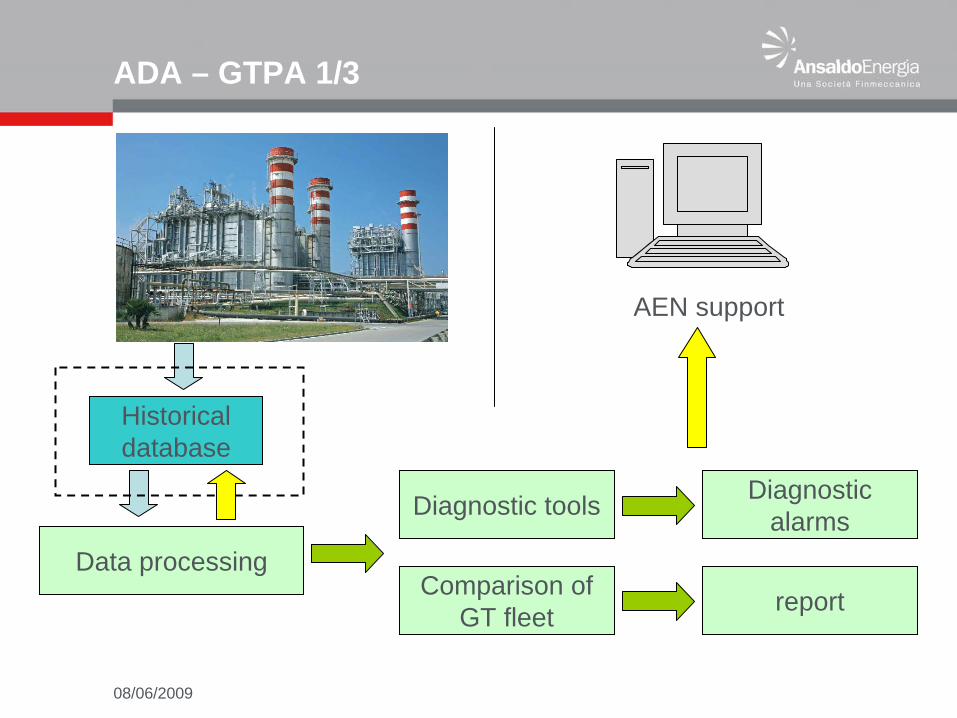
ADA – GTPA 1/3
Historical database
AEN support
Data processing
Diagnostic tools
Comparison of GT fleet
Diagnostic alarms
report

08/06/2009
ADA – GTPA 2/3
• ADA allows to compare on real time all the units.
.
08/06/2009
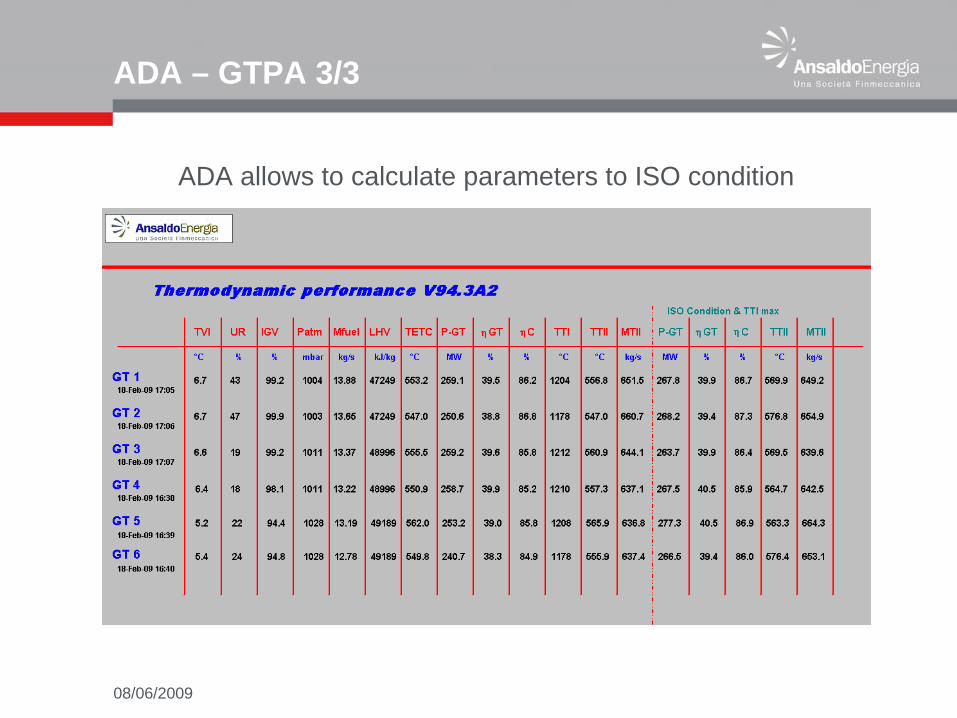
ADA – GTPA 3/3
ADA allows to calculate parameters to ISO condition

08/06/2009
• Summarising the real time performance analysis allows :– To evaluate the productivity capacity and the
efficiency of the plant;– To evaluate the performance degradation– To optimise the plant operation. maintenance
scheduling and to improve the performance;– To identify malfunction, and to improve the
plant availability
Conclusions

08/06/2009
• Thanks for your attention
Conclusions