Embed Size (px)
Citation preview

Thermal stability of Ba ( Zr 0.8 − x Ce x Y 0.2 ) O 2.9 ceramics in carbon dioxideC.-S. Tu, R. R. Chien, V. H. Schmidt, S.-C. Lee, C.-C. Huang, and C.-L. Tsai Citation: Journal of Applied Physics 105, 103504 (2009); doi: 10.1063/1.3117835 View online: http://dx.doi.org/10.1063/1.3117835 View Table of Contents: http://scitation.aip.org/content/aip/journal/jap/105/10?ver=pdfcov Published by the AIP Publishing Articles you may be interested in Thermal stability of piezoelectric coefficients in (Ba1−xCax)(Zr0.05Ti0.95)O3: A lead-free piezoelectric ceramic Appl. Phys. Lett. 102, 162905 (2013); 10.1063/1.4802971 Influences of annealing temperature on structural characterization and magnetic properties of Mn-doped BaTiO3ceramics J. Appl. Phys. 112, 013909 (2012); 10.1063/1.4733691 Structural phase separation and optical and magnetic properties of BaTi1−xMnxO3 multiferroics J. Appl. Phys. 111, 113913 (2012); 10.1063/1.4725195 Correlation of phonon characteristics and crystal structures of Ba[Zn1/3(Nb1− x Ta x )2/3]O3 solid solutions J. Appl. Phys. 111, 014111 (2012); 10.1063/1.3676216 Polar order and diffuse scatter in Ba ( Ti 1 − x Zr x ) O 3 ceramics J. Appl. Phys. 106, 114111 (2009); 10.1063/1.3253735
Reuse of AIP Publishing content is subject to the terms at: https://publishing.aip.org/authors/rights-and-permissions. Download to IP: 153.90.170.56 On: Fri, 29 Apr 2016
18:31:31
Thermal stability of Ba„Zr0.8−xCexY0.2…O2.9 ceramics in carbon dioxideC.-S. Tu,1,2,a� R. R. Chien,3 V. H. Schmidt,3 S.-C. Lee,2 C.-C. Huang,2 and C.-L. Tsai31Graduate Institute of Applied Science and Engineering, Fu Jen Catholic University, Taipei, Taiwan 242,Republic of China2Department of Physics, Fu Jen Catholic University, Taipei, Taiwan 242, Republic of China3Department of Physics, Montana State University, Bozeman, Montana 59717, USA
�Received 11 October 2008; accepted 18 March 2009; published online 18 May 2009�
In situ x-ray diffraction spectra �25–1000 °C� have been measured as a function of temperature forproton-conducting Ba�Zr0.8−xCexY0.2�O2.9 �x=0.0–0.4� ceramics in CO2 atmosphere. Atomicvibrations before and after exposure to CO2 were obtained by using the micro-Raman scattering�150–1600 cm−1�. Ba�Zr0.8Y0.2�O2.9 and Ba�Zr0.6Ce0.2Y0.2�O2.9 reveal a promising thermal stabilityin CO2 without apparent decomposition up to 1000 °C. However, Ba�Zr0.5Ce0.3Y0.2�O2.9 andBa�Zr0.4Ce0.4Y0.2�O2.9 exhibit thermally stable below 550 °C and then proceed an obvious chemicaldecomposition of BaCO3 and Zr0.8−xCexY0.2O2 above 550 °C, which were clearly evidenced by theRaman vibrations of 1057 and 466 cm−1, respectively. A first-order orthorhombic-hexagonalstructure transition was confirmed in BaCO3 in the region of 810–850 °C upon heating. This studysuggests that the Ba�Zr0.8−xCexY0.2�O2.9 ceramics with x�0.2 are promising candidates forproton-conducting applications in CO2-containing environment. © 2009 American Institute ofPhysics. �DOI: 10.1063/1.3117835�
I. INTRODUCTION
One challenging issue in proton-conducting ceramics forapplications of hydrogen purification and solid oxide fuelcell �SOFC� electrolytes is thermal instability due to the re-action with environment, especially components of hydrocar-bon fuels such as CO2, H2S, and other trace species.1–3 Suchunfavorable reactions with carbon species and H2S couldcause performance loss and degradation. However, the effectof species of hydrocarbon fuels on SOFC materials is notpresently well known. Although proton conductors are prom-ising candidates for SOFC at intermediate temperatures�typically 700–850 °C� because of their low activationenergy,4–7 the remained challenge is to find an appropriatecompromise between ionic conductivity and thermal stabilityin various environments.
Doped BaCeO3 has been known to exhibit high ionicconductivity above 500 °C and poor stability in CO2 andH2O.4–13 On the other hand, yttrium-doped BaZrO3 shows asufficient thermal stability.14,15 Partially substituting Zr forCe can reduce tendency of decomposition in CO2 at hightemperature but decreases the ionic conductivity. Therefore,it has been a goal to find doped Ba�Zr,Ce�O3 ceramics withsufficient ionic conductivity and thermal stability by replac-ing a fraction of cerium with Zr or other dopants.14–22
By thermal gravimetric analysis �TGA� and x-ray dif-fraction �XRD�, BaCe0.9Y0.1O3−� �BCY10� powder was con-firmed to be only kinetically stable below 500 °C and thendecomposes completely to BaCO3, CeO2, and Y2O3 afterheating in pure CO2 at 860 °C.8 Similarly, powder XRDresult of BCY10 heated in 100% CO2 in the range of700–1000 °C evidenced BaCO3 and fluoritelike CeO2
structure.9 It was found that BCY10 can absorb 0.13 g ofCO2 per ceramic gram.9 BaCe0.9Nd0.1O3−� �BCN� ceramicalso showed decomposition of BaCO3 and CeO2 in 1 atmCO2 before reaching 1200 °C.10 Above 1200 °C, the BCNceramics reacted with alumina or zirconia, leading to the lossof barium and an excess of cerium.10
The XRD result of BaZr0.4Ce0.5Y0.1O3−� showed a goodstability after exposure to CO2 at 900 °C.12 The total con-ductivity of BaZrxCe0.9−xY0.1O3−� �x=0.0–0.9� in wet H2
�pH2O=1.7�103 Pa� varies from 3.5�10−2 to 3.0�10−3 S cm−1 at 800 °C.12 The XRD spectra ofBa�Zr0.4Ce0.5Y0.1�O2.95 and Ba�Zr0.6Ce0.3Y0.1�O2.95 sinteredpellets showed good stability after being boiled in water orafter being exposed to CO2 at 900 °C.13 TGA and differen-tial thermal analysis of Gd- and Nd-doped Ba�Ce,Zr�O3
solid solutions showed a reaction with CO2 above 600 °Cand a reverse reaction at about 1150 °C for low Zr content.16
Recent XRD investigation of Ba�Ce0.8Y0.2�O3 andBa�Zr0.1Ce0.7Y0.2�O3−� powders exposed to 2% CO2 �withH2� at 500 °C for 1 week suggested that Ba�Ce0.8Y0.2�O3
decomposed to BaCO3, CeO2, and Y2O3.18 However,Ba�Zr0.1Ce0.7Y0.2�O3−� remained unchanged at 500 °C andexhibited sufficient stability in 2% CO2 atmosphere.18 TheXRD result of Ba�Zr0.1Ce0.7Y0.2�O3−� powder before and af-ter exposure to H2 containing 15% H2O at 500 °C showedno decomposition.18 Most recently, double perovskitelikeBa2�Ca0.75Nb0.59Ta0.66�O6−�, Ba2�Ca0.75Nb0.66Ta0.59�O6−�,and Ba2�Ca0.79Nb0.66Ta0.55�O6−� showed a long-term struc-tural stability in CO2 at 800 °C and boiling water.23
Although proton-conducting ceramics are promisingcandidates for SOFC, the major issue for these materials is tofind appropriate components with a wide-temperature-rangethermal stability in various environments. In this work, insitu temperature-dependent XRD and post-micro-Ramanscattering were employed to investigate the structure stability
a�Author to whom correspondence should be addressed. Electronic mail:[email protected].
JOURNAL OF APPLIED PHYSICS 105, 103504 �2009�
0021-8979/2009/105�10�/103504/7/$25.00 © 2009 American Institute of Physics105, 103504-1
Reuse of AIP Publishing content is subject to the terms at: https://publishing.aip.org/authors/rights-and-permissions. Download to IP: 153.90.170.56 On: Fri, 29 Apr 2016
18:31:31
of Ba�Zr0.8−xCexY0.2�O2.9 �x=0.0, 0.2, 0.3, and 0.4� ceramicpowders before and after exposure to CO2 in the temperatureregion of 25–1000 °C.
II. EXPERIMENTAL PROCEDURE
Ba�Zr0.8−xCexY0.2�O2.9 �x=0.0, 0.2, 0.3, and 0.4� ceramicpowders were synthesized by the glycine-nitrate process.24
Synthesized powders were calcined at 1300 °C for 5 h tooptimize the perovskite phase. Hereafter, BZCY442,BZCY532, BZCY622, and BZY82 representBa�Zr0.4Ce0.4Y0.2�O2.9, Ba�Zr0.5Ce0.3Y0.2�O2.9,Ba�Zr0.6Ce0.2Y0.2�O2.9, and Ba�Zr0.8Y0.2�O2.9, respectively.Ba�Zr,Ce,Y�O3 and �Zr,Ce,Y�O2 symbolizeBa�Zr0.8−xCexY0.2�O2.9 and Zr0.8−xCexY0.2O2, respectively.For in situ XRD measurements, a Rigaku Model MultiFlexx-ray diffractometer with Cu K�1 and Cu K�2 radiations wasused. The intensity ratio between K�1 and K�2 is about2:1.25 The calcined powders were scanned at room tempera-ture first before flowing CO2, and then the atmosphere wasswitched to flow at 1 atm CO2. The temperature was raisedin steps from room temperature. Each XRD scan was takenafter holding the powder for more than 40 min at the settingtemperature to allow complete reaction with CO2.
A double grating Jobin Yvon Model U-1000 doublemonochromator with 1800 grooves/mm gratings and anitrogen-cooled charge coupled device as a detector wereemployed for the post-micro-Raman scattering. A CoherentModel Innova 90 argon laser with wavelength �=514.5 nm was used as an excitation source. The Ramanscattering was performed in the region of 150–1600 cm−1.The powder used in the post-Raman scattering measurementswas previously exposed to CO2 during the in situ XRD.
III. RESULTS AND DISCUSSION
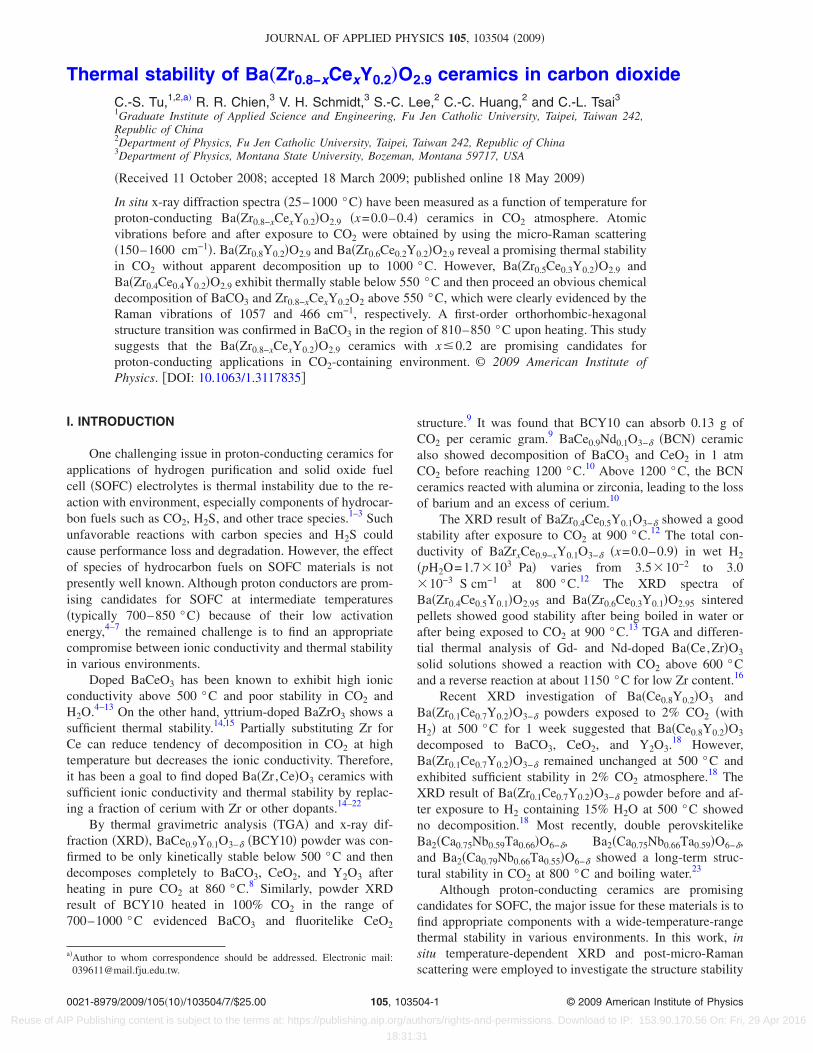
To understand structure transition of BaCO3,temperature-dependent XRD spectra of BaCO3 powder weremeasured in 1 atm CO2, as shown in Fig. 1�a�. The strongest2�-peak appears at 24.0° at room temperature, indicating anorthorhombic phase.25 Near 810 °C, two new peaks appearat 21.2° and 25.9°, suggesting a new phase. As temperatureincreases, the orthorhombic phase disappears completelynear 850 °C. These phenomena reveal a first-orderorthorhombic-hexagonal26,27 structural transition in the re-gion of 810–850 °C.
To identify possible decomposition, the XRD spectra ofZrO2, CeO2, and Y2O3 powders were obtained at room tem-perature as given in Fig. 1�b�. The main 2� peaks appear at28.2° and 31.5° for monoclinic ZrO2 and 28.5°, 33.0°, 47.5°,and 56.2° for cubic CeO2. For cubic Y2O3, the main 2�peaks occur at 29.2°, 33.9°, 48.5°, and 57.8°. There is nophase transformation for both ZrO2 and CeO2 below1000 °C.28,29 BaCeO3 has a phase sequence of orthorhombic
�Pnma�-orthorhombic �Imma�-rhombohedral �R3̄c�-cubic
�Pm3̄m� at 290, 400, and 900 °C.30 BaZrO3 is cubic at andabove room temperature.31
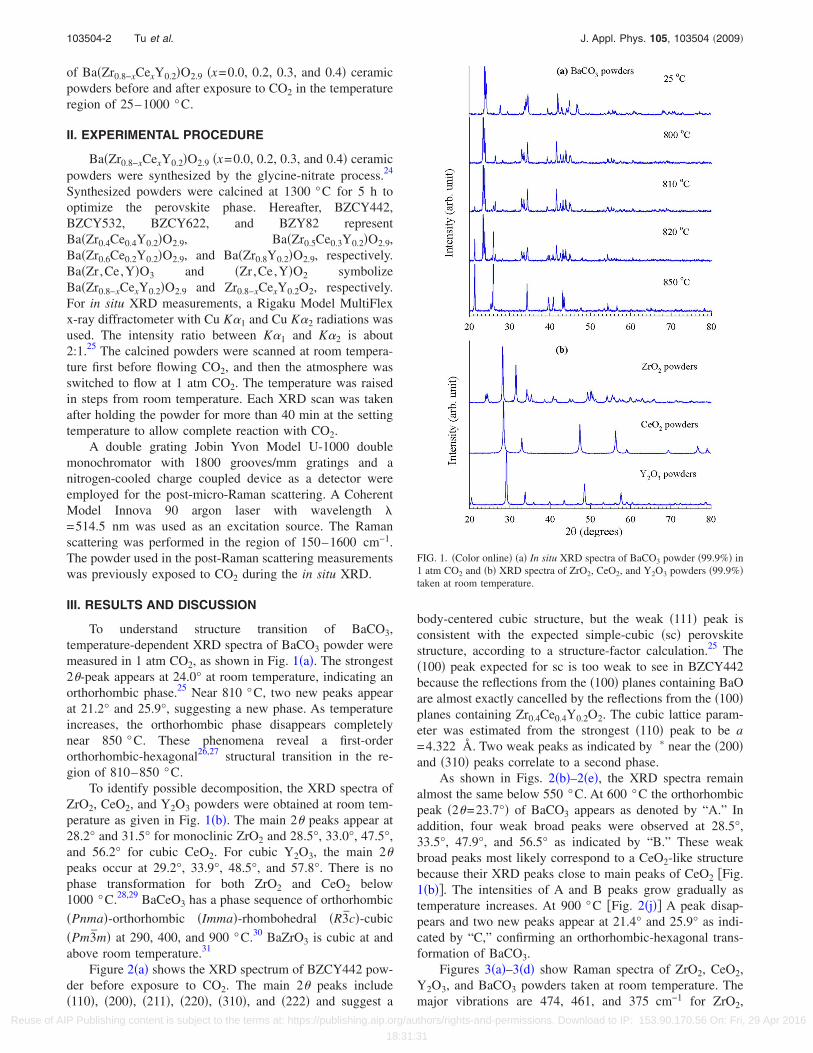
Figure 2�a� shows the XRD spectrum of BZCY442 pow-der before exposure to CO2. The main 2� peaks include�110�, �200�, �211�, �220�, �310�, and �222� and suggest a
body-centered cubic structure, but the weak �111� peak isconsistent with the expected simple-cubic �sc� perovskitestructure, according to a structure-factor calculation.25 The�100� peak expected for sc is too weak to see in BZCY442because the reflections from the �100� planes containing BaOare almost exactly cancelled by the reflections from the �100�planes containing Zr0.4Ce0.4Y0.2O2. The cubic lattice param-eter was estimated from the strongest �110� peak to be a=4.322 Å. Two weak peaks as indicated by � near the �200�and �310� peaks correlate to a second phase.
As shown in Figs. 2�b�–2�e�, the XRD spectra remainalmost the same below 550 °C. At 600 °C the orthorhombicpeak �2�=23.7°� of BaCO3 appears as denoted by “A.” Inaddition, four weak broad peaks were observed at 28.5°,33.5°, 47.9°, and 56.5° as indicated by “B.” These weakbroad peaks most likely correspond to a CeO2-like structurebecause their XRD peaks close to main peaks of CeO2 �Fig.1�b��. The intensities of A and B peaks grow gradually astemperature increases. At 900 °C �Fig. 2�j�� A peak disap-pears and two new peaks appear at 21.4° and 25.9° as indi-cated by “C,” confirming an orthorhombic-hexagonal trans-formation of BaCO3.
Figures 3�a�–3�d� show Raman spectra of ZrO2, CeO2,Y2O3, and BaCO3 powders taken at room temperature. Themajor vibrations are 474, 461, and 375 cm−1 for ZrO2,
FIG. 1. �Color online� �a� In situ XRD spectra of BaCO3 powder �99.9%� in1 atm CO2 and �b� XRD spectra of ZrO2, CeO2, and Y2O3 powders �99.9%�taken at room temperature.
103504-2 Tu et al. J. Appl. Phys. 105, 103504 �2009�
Reuse of AIP Publishing content is subject to the terms at: https://publishing.aip.org/authors/rights-and-permissions. Download to IP: 153.90.170.56 On: Fri, 29 Apr 2016
18:31:31
CeO2, and Y2O3, respectively. The 474 cm−1 of ZrO2 corre-sponds to the Ag Raman-active mode of O–O vibration.32
The 461 cm−1 vibration of CeO2 results from the F2g
Raman-active mode of fluorite structure.33 The main vibra-tions of BaCO3 include 690, 1059, and 1419 cm−1 �Fig.3�d��, which correspond respectively to the doubly degener-ate bending mode �E��, symmetric stretching vibration �A1��,and doubly degenerate asymmetric stretching vibration �E��of CO3
2− ion.34 The chemical decompositions occurred inBZCY442 were confirmed by 689, 1057, and 1418 cm−1 forBaCO3 and 466 cm−1 for �Zr,Ce,Y�O2 �Fig. 3�e��. Note thatthe 466 cm−1 is between 461 cm−1 of CeO2 and 474 cm−1
of ZrO2, but there are no peaks corresponding to the otherZrO2 peaks. Another evidence for cubic fluorite structure isthat the major Raman vibrations of both Zr–Ce–O �Ce /Zr=1� and Si-doped Zr–Ce–O �Ce /Zr=1� solid solutions ap-pear near 470 cm−1.35 It was concluded that Si dopant hardlychanges the phase of the solid solution. As shown in Fig.3�e�, the relative intensities of 1057 cm−1 �BaCO3� and466 cm−1 ��Zr,Ce,Y�O2� increase significantly after expo-sure to CO2, but the intensity of 356 cm−1 vibration de-creases.
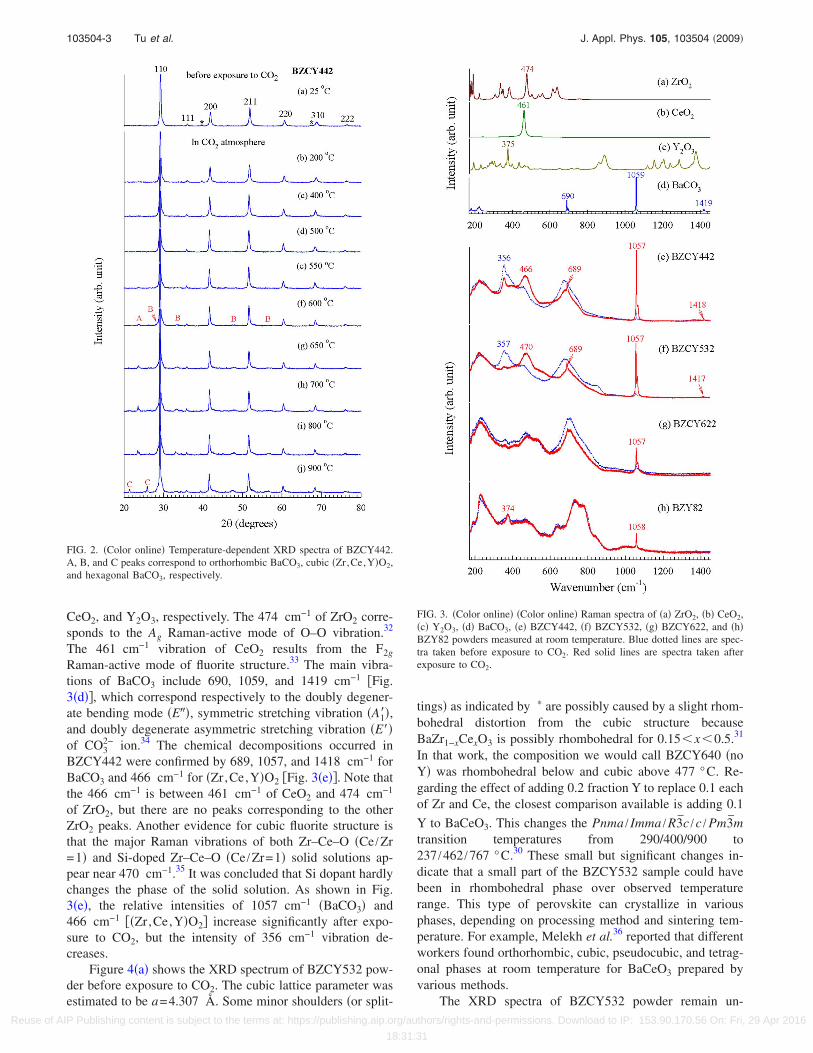
Figure 4�a� shows the XRD spectrum of BZCY532 pow-der before exposure to CO2. The cubic lattice parameter wasestimated to be a=4.307 Å. Some minor shoulders �or split-
tings� as indicated by � are possibly caused by a slight rhom-bohedral distortion from the cubic structure becauseBaZr1−xCexO3 is possibly rhombohedral for 0.15�x�0.5.31
In that work, the composition we would call BZCY640 �noY� was rhombohedral below and cubic above 477 °C. Re-garding the effect of adding 0.2 fraction Y to replace 0.1 eachof Zr and Ce, the closest comparison available is adding 0.1
Y to BaCeO3. This changes the Pnma / Imma /R3̄c /c / Pm3̄mtransition temperatures from 290/400/900 to237 /462 /767 °C.30 These small but significant changes in-dicate that a small part of the BZCY532 sample could havebeen in rhombohedral phase over observed temperaturerange. This type of perovskite can crystallize in variousphases, depending on processing method and sintering tem-perature. For example, Melekh et al.36 reported that differentworkers found orthorhombic, cubic, pseudocubic, and tetrag-onal phases at room temperature for BaCeO3 prepared byvarious methods.
The XRD spectra of BZCY532 powder remain un-
FIG. 2. �Color online� Temperature-dependent XRD spectra of BZCY442.A, B, and C peaks correspond to orthorhombic BaCO3, cubic �Zr,Ce,Y�O2,and hexagonal BaCO3, respectively.
FIG. 3. �Color online� �Color online� Raman spectra of �a� ZrO2, �b� CeO2,�c� Y2O3, �d� BaCO3, �e� BZCY442, �f� BZCY532, �g� BZCY622, and �h�BZY82 powders measured at room temperature. Blue dotted lines are spec-tra taken before exposure to CO2. Red solid lines are spectra taken afterexposure to CO2.
103504-3 Tu et al. J. Appl. Phys. 105, 103504 �2009�
Reuse of AIP Publishing content is subject to the terms at: https://publishing.aip.org/authors/rights-and-permissions. Download to IP: 153.90.170.56 On: Fri, 29 Apr 2016
18:31:31
changed below 550 °C �Fig. 4�. BaCO3 and �Zr,Ce,Y�O2
structures appear noticeably at 550 and 600 °C as indicatedby A and B, respectively. They increase in amplitude withtemperature and the A peak splits above 800 °C because ofthe orthorhombic-hexagonal transition of BaCO3. As shownin Fig. 3�f�, the decomposition of BZCY532 was confirmedby the 470 cm−1 vibration of �Zr,Ce,Y�O2 and 689, 1057,and 1417 cm−1 vibrations of BaCO3. It was found thatBZCY532 can absorb about 0.03 g of CO2 per ceramic gramafter exposure to CO2 from 900 °C.
The XRD spectrum of BZCY622 powder before expo-sure to CO2 is given in Fig. 5�a�. The cubic lattice parameterwas estimated to be a=4.279 Å. Two very weak peaks asindicated by � near the �200� and �310� peaks correlate to asecond phase. As shown in Fig. 5, BZCY622 remains ther-mally stable in CO2 up to 900 °C with a very slight decom-position above 550 K �Figs. 5�f�–5�j��. This stability is con-firmed by the Raman spectra �Fig. 3�g��, in which there is nomuch difference before and after exposure to CO2. The weak1057 cm−1 vibration before exposure to CO2 indicates a verysmall amount of BaCO3 likely formed in the calcining pro-cess.
The Raman spectra of BZCY442, BZCY532, andBZCY622 powders before exposure to CO2 �Figs. 3�e�–3�g��
show that the 356 �or 357 cm−1� vibrations and its shoulder�about 370 cm−1� become weaker as cerium content de-creases, indicating that the 356 �or 357� and 370 cm−1 vibra-tions are sensitive to cerium content. These are consistentwith the Raman result of BaZr1−xCexO3,31 in which the rela-tive intensities of these vibrations �356 and 370 cm−1� de-crease and their frequencies also shift to higher region as xdecreases.
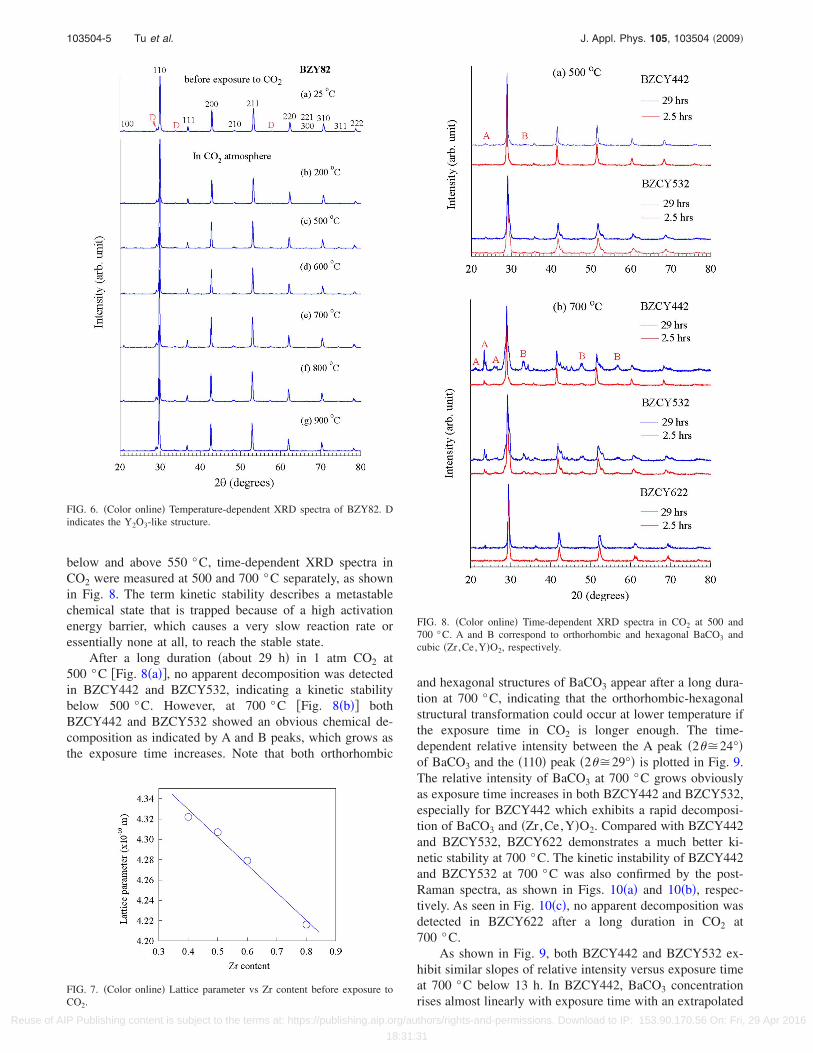
Just as for BZCY622, BZY82 powder demonstrates agood thermal stability in CO2 as evidenced in Figs. 6 and3�h�. Some weak peaks of Y2O3-like structure were observedas indicated by “D,” which was confirmed by the Ramanvibration of 374 cm−1 �Figs. 3�c� and 3�h��. The cubic latticeparameter of BZY82 is a=4.216 Å. This is slightly largerthan the lattice constant a=4.192 Å of cubic BaZrO3 �Ref.31� because the ionic radius of Y3+ �RIII=0.9 Å� is largerthan for Zr4+ �RIV=0.72 Å�. The lattice parameters ofBZY82 �4.216 Å�, BZCY622 �4.279 Å�, BZCY532 �4.307Å�, and BZCY442 �4.322 Å� increase with Ce content be-cause the radius of Ce4+ �RIV=0.87 Å� is larger than for Zr4+
�RIV=0.72 �.37 Figure 7 shows a nearly linear relation be-tween lattice parameter and Zr content.
As shown in the results and discussion described above,no apparent decompositions of BaCO3 and �Zr,Ce,Y�O2
were detected below 550 °C, and the BZCY622 and BZY82exhibit significant thermal stability in CO2 at intermediatetemperatures �600–900 °C�. To clarify the kinetic stability
FIG. 4. �Color online� Temperature-dependent XRD spectra of BZCY532.
FIG. 5. �Color online� Temperature-dependent XRD spectra of BZCY622.
103504-4 Tu et al. J. Appl. Phys. 105, 103504 �2009�
Reuse of AIP Publishing content is subject to the terms at: https://publishing.aip.org/authors/rights-and-permissions. Download to IP: 153.90.170.56 On: Fri, 29 Apr 2016
18:31:31
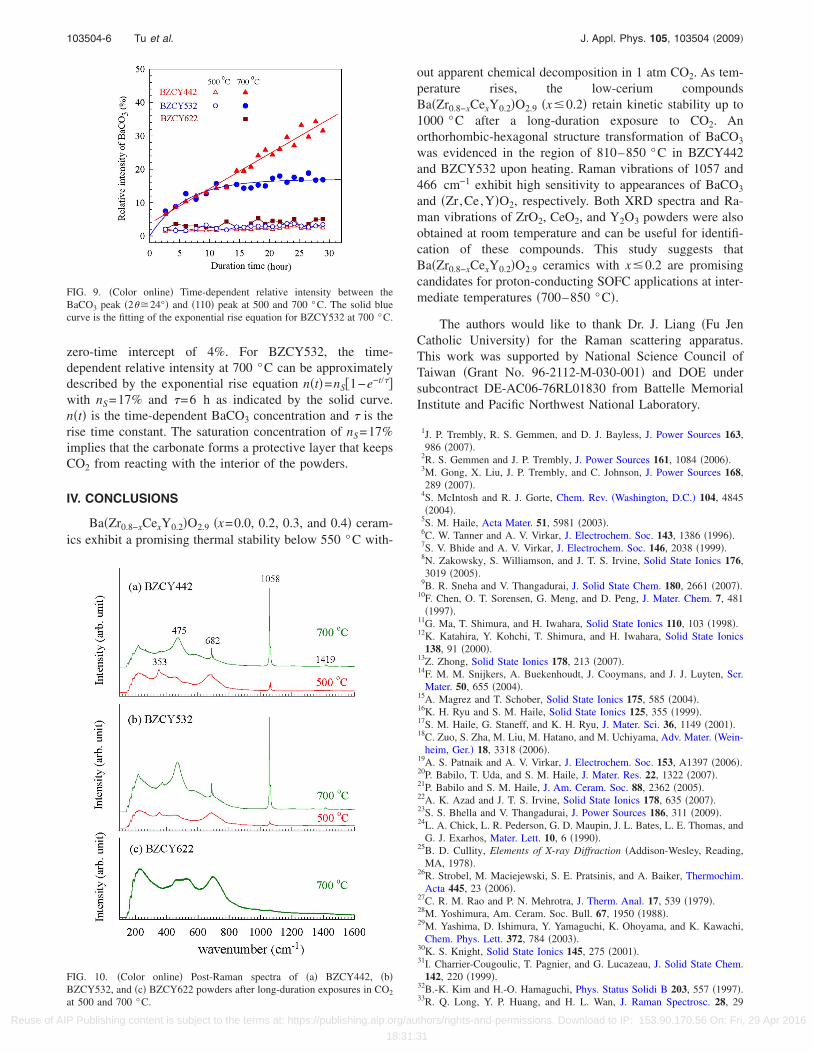
below and above 550 °C, time-dependent XRD spectra inCO2 were measured at 500 and 700 °C separately, as shownin Fig. 8. The term kinetic stability describes a metastablechemical state that is trapped because of a high activationenergy barrier, which causes a very slow reaction rate oressentially none at all, to reach the stable state.
After a long duration �about 29 h� in 1 atm CO2 at500 °C �Fig. 8�a��, no apparent decomposition was detectedin BZCY442 and BZCY532, indicating a kinetic stabilitybelow 500 °C. However, at 700 °C �Fig. 8�b�� bothBZCY442 and BZCY532 showed an obvious chemical de-composition as indicated by A and B peaks, which grows asthe exposure time increases. Note that both orthorhombic
and hexagonal structures of BaCO3 appear after a long dura-tion at 700 °C, indicating that the orthorhombic-hexagonalstructural transformation could occur at lower temperature ifthe exposure time in CO2 is longer enough. The time-dependent relative intensity between the A peak �2��24°�of BaCO3 and the �110� peak �2��29°� is plotted in Fig. 9.The relative intensity of BaCO3 at 700 °C grows obviouslyas exposure time increases in both BZCY442 and BZCY532,especially for BZCY442 which exhibits a rapid decomposi-tion of BaCO3 and �Zr,Ce,Y�O2. Compared with BZCY442and BZCY532, BZCY622 demonstrates a much better ki-netic stability at 700 °C. The kinetic instability of BZCY442and BZCY532 at 700 °C was also confirmed by the post-Raman spectra, as shown in Figs. 10�a� and 10�b�, respec-tively. As seen in Fig. 10�c�, no apparent decomposition wasdetected in BZCY622 after a long duration in CO2 at700 °C.
As shown in Fig. 9, both BZCY442 and BZCY532 ex-hibit similar slopes of relative intensity versus exposure timeat 700 °C below 13 h. In BZCY442, BaCO3 concentrationrises almost linearly with exposure time with an extrapolated
FIG. 6. �Color online� Temperature-dependent XRD spectra of BZY82. Dindicates the Y2O3-like structure.
FIG. 7. �Color online� Lattice parameter vs Zr content before exposure toCO2.
FIG. 8. �Color online� Time-dependent XRD spectra in CO2 at 500 and700 °C. A and B correspond to orthorhombic and hexagonal BaCO3 andcubic �Zr,Ce,Y�O2, respectively.
103504-5 Tu et al. J. Appl. Phys. 105, 103504 �2009�
Reuse of AIP Publishing content is subject to the terms at: https://publishing.aip.org/authors/rights-and-permissions. Download to IP: 153.90.170.56 On: Fri, 29 Apr 2016
18:31:31
zero-time intercept of 4%. For BZCY532, the time-dependent relative intensity at 700 °C can be approximatelydescribed by the exponential rise equation n�t�=nS�1−e−t/��with nS=17% and �=6 h as indicated by the solid curve.n�t� is the time-dependent BaCO3 concentration and � is therise time constant. The saturation concentration of nS=17%implies that the carbonate forms a protective layer that keepsCO2 from reacting with the interior of the powders.
IV. CONCLUSIONS
Ba�Zr0.8−xCexY0.2�O2.9 �x=0.0, 0.2, 0.3, and 0.4� ceram-ics exhibit a promising thermal stability below 550 °C with-
out apparent chemical decomposition in 1 atm CO2. As tem-perature rises, the low-cerium compoundsBa�Zr0.8−xCexY0.2�O2.9 �x�0.2� retain kinetic stability up to1000 °C after a long-duration exposure to CO2. Anorthorhombic-hexagonal structure transformation of BaCO3
was evidenced in the region of 810–850 °C in BZCY442and BZCY532 upon heating. Raman vibrations of 1057 and466 cm−1 exhibit high sensitivity to appearances of BaCO3
and �Zr,Ce,Y�O2, respectively. Both XRD spectra and Ra-man vibrations of ZrO2, CeO2, and Y2O3 powders were alsoobtained at room temperature and can be useful for identifi-cation of these compounds. This study suggests thatBa�Zr0.8−xCexY0.2�O2.9 ceramics with x�0.2 are promisingcandidates for proton-conducting SOFC applications at inter-mediate temperatures �700–850 °C�.
The authors would like to thank Dr. J. Liang �Fu JenCatholic University� for the Raman scattering apparatus.This work was supported by National Science Council ofTaiwan �Grant No. 96-2112-M-030-001� and DOE undersubcontract DE-AC06-76RL01830 from Battelle MemorialInstitute and Pacific Northwest National Laboratory.
1J. P. Trembly, R. S. Gemmen, and D. J. Bayless, J. Power Sources 163,986 �2007�.
2R. S. Gemmen and J. P. Trembly, J. Power Sources 161, 1084 �2006�.3M. Gong, X. Liu, J. P. Trembly, and C. Johnson, J. Power Sources 168,289 �2007�.
4S. McIntosh and R. J. Gorte, Chem. Rev. �Washington, D.C.� 104, 4845�2004�.
5S. M. Haile, Acta Mater. 51, 5981 �2003�.6C. W. Tanner and A. V. Virkar, J. Electrochem. Soc. 143, 1386 �1996�.7S. V. Bhide and A. V. Virkar, J. Electrochem. Soc. 146, 2038 �1999�.8N. Zakowsky, S. Williamson, and J. T. S. Irvine, Solid State Ionics 176,3019 �2005�.
9B. R. Sneha and V. Thangadurai, J. Solid State Chem. 180, 2661 �2007�.10F. Chen, O. T. Sorensen, G. Meng, and D. Peng, J. Mater. Chem. 7, 481
�1997�.11G. Ma, T. Shimura, and H. Iwahara, Solid State Ionics 110, 103 �1998�.12K. Katahira, Y. Kohchi, T. Shimura, and H. Iwahara, Solid State Ionics
138, 91 �2000�.13Z. Zhong, Solid State Ionics 178, 213 �2007�.14F. M. M. Snijkers, A. Buekenhoudt, J. Cooymans, and J. J. Luyten, Scr.
Mater. 50, 655 �2004�.15A. Magrez and T. Schober, Solid State Ionics 175, 585 �2004�.16K. H. Ryu and S. M. Haile, Solid State Ionics 125, 355 �1999�.17S. M. Haile, G. Staneff, and K. H. Ryu, J. Mater. Sci. 36, 1149 �2001�.18C. Zuo, S. Zha, M. Liu, M. Hatano, and M. Uchiyama, Adv. Mater. �Wein-
heim, Ger.� 18, 3318 �2006�.19A. S. Patnaik and A. V. Virkar, J. Electrochem. Soc. 153, A1397 �2006�.20P. Babilo, T. Uda, and S. M. Haile, J. Mater. Res. 22, 1322 �2007�.21P. Babilo and S. M. Haile, J. Am. Ceram. Soc. 88, 2362 �2005�.22A. K. Azad and J. T. S. Irvine, Solid State Ionics 178, 635 �2007�.23S. S. Bhella and V. Thangadurai, J. Power Sources 186, 311 �2009�.24L. A. Chick, L. R. Pederson, G. D. Maupin, J. L. Bates, L. E. Thomas, and
G. J. Exarhos, Mater. Lett. 10, 6 �1990�.25B. D. Cullity, Elements of X-ray Diffraction �Addison-Wesley, Reading,
MA, 1978�.26R. Strobel, M. Maciejewski, S. E. Pratsinis, and A. Baiker, Thermochim.
Acta 445, 23 �2006�.27C. R. M. Rao and P. N. Mehrotra, J. Therm. Anal. 17, 539 �1979�.28M. Yoshimura, Am. Ceram. Soc. Bull. 67, 1950 �1988�.29M. Yashima, D. Ishimura, Y. Yamaguchi, K. Ohoyama, and K. Kawachi,
Chem. Phys. Lett. 372, 784 �2003�.30K. S. Knight, Solid State Ionics 145, 275 �2001�.31I. Charrier-Cougoulic, T. Pagnier, and G. Lucazeau, J. Solid State Chem.
142, 220 �1999�.32B.-K. Kim and H.-O. Hamaguchi, Phys. Status Solidi B 203, 557 �1997�.33R. Q. Long, Y. P. Huang, and H. L. Wan, J. Raman Spectrosc. 28, 29
FIG. 9. �Color online� Time-dependent relative intensity between theBaCO3 peak �2��24°� and �110� peak at 500 and 700 °C. The solid bluecurve is the fitting of the exponential rise equation for BZCY532 at 700 °C.
FIG. 10. �Color online� Post-Raman spectra of �a� BZCY442, �b�BZCY532, and �c� BZCY622 powders after long-duration exposures in CO2
at 500 and 700 °C.
103504-6 Tu et al. J. Appl. Phys. 105, 103504 �2009�
Reuse of AIP Publishing content is subject to the terms at: https://publishing.aip.org/authors/rights-and-permissions. Download to IP: 153.90.170.56 On: Fri, 29 Apr 2016
18:31:31

�1997�.34R. L. Frost and J. M. Bouzaid, J. Raman Spectrosc. 38, 873 �2007�.35X. Wang, G. Lu, Y. Guo, Y. Xue, L. Jiang, Y. Guo, and Z. Zhang, Catal.
Today 126, 412 �2007�.
36B.-T. Melekh, V. M. Egorov, Y. M. Baikov, N. F. Kartenko, Y. N. Filin, M.E. Kompan, I. I. Novak, G. B. Venus, and V. B. Kulik, Solid State Ionics97, 465 �1997�.
37R. D. Shannon, Acta Crystallogr. A32, 751 �1976�.
103504-7 Tu et al. J. Appl. Phys. 105, 103504 �2009�
Reuse of AIP Publishing content is subject to the terms at: https://publishing.aip.org/authors/rights-and-permissions. Download to IP: 153.90.170.56 On: Fri, 29 Apr 2016
18:31:31


![cS^($(][X[+$T(ZR-]&*+(]!,[X#!R(T-*$+!]([#('-,+-#(N-([,(Z ...65 2014 0 A 55](https://img.pdfslide.us/doc/110x75/5f9a4b0411420c1de0100806/csxtzr-xrt-n-z-65-2014-0-a-55.jpg)