Embed Size (px)
Citation preview
Prague, 8-11 June 2009
X.T. Dong, R. Summer, and U. Kaltenborn - Germany RIF Session1 Paper 0637
Thermal Network Analysisin MV GIS Design
Areva Energietechnik GmbH – Sachsenwerk Medium Voltage, Germany
2 2
Prague, 8-11 June 2009
IntroductionThermal network method
Simulation procedure
Results & summary
3 3
Prague, 8-11 June 2009
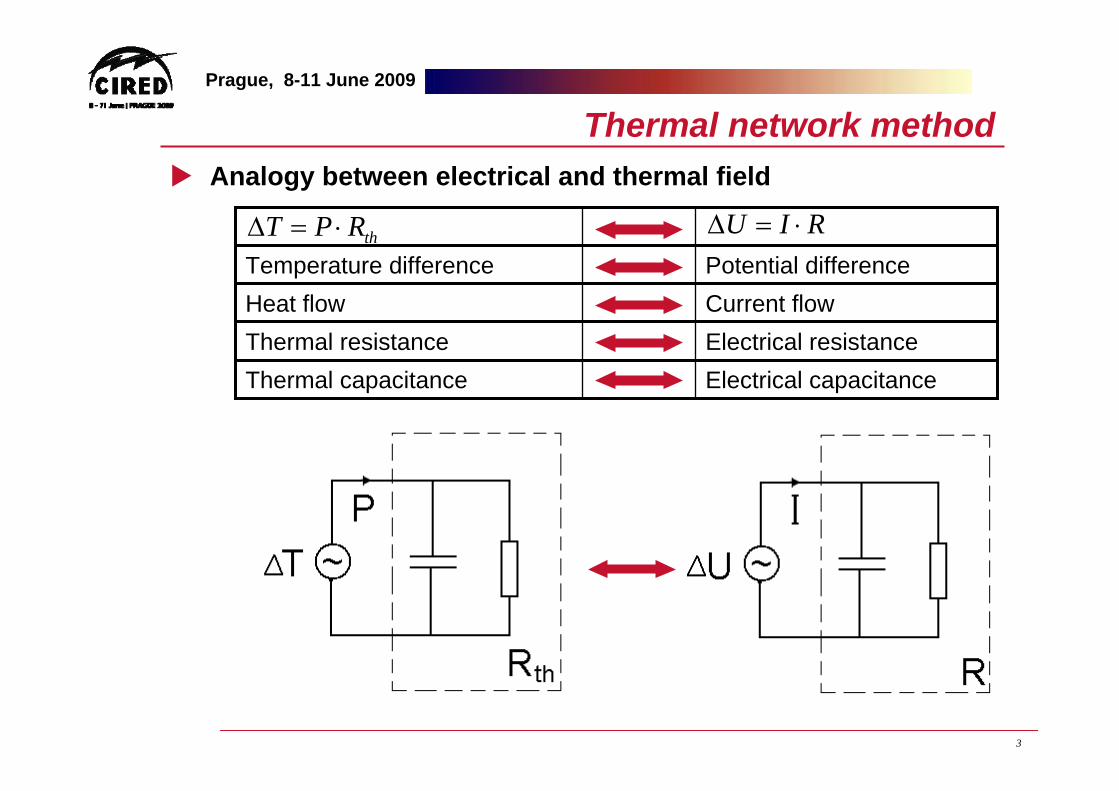
Thermal network methodAnalogy between electrical and thermal field
Potential differenceTemperature differenceCurrent flowHeat flowElectrical resistanceThermal resistanceElectrical capacitanceThermal capacitance
thRPT ⋅=Δ RIU ⋅=Δ
4 4
Prague, 8-11 June 2009
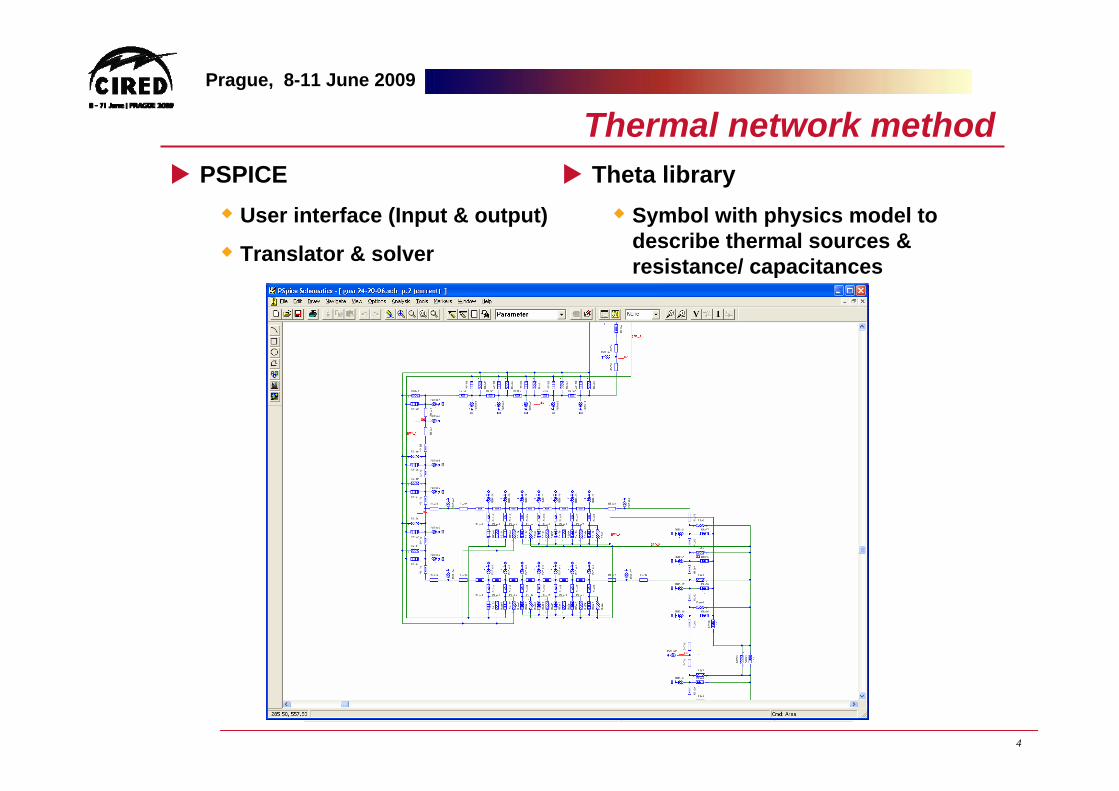
Thermal network methodPSPICE
User interface (Input & output)
Translator & solver
Theta librarySymbol with physics model to describe thermal sources & resistance/ capacitances
5 5
Prague, 8-11 June 2009
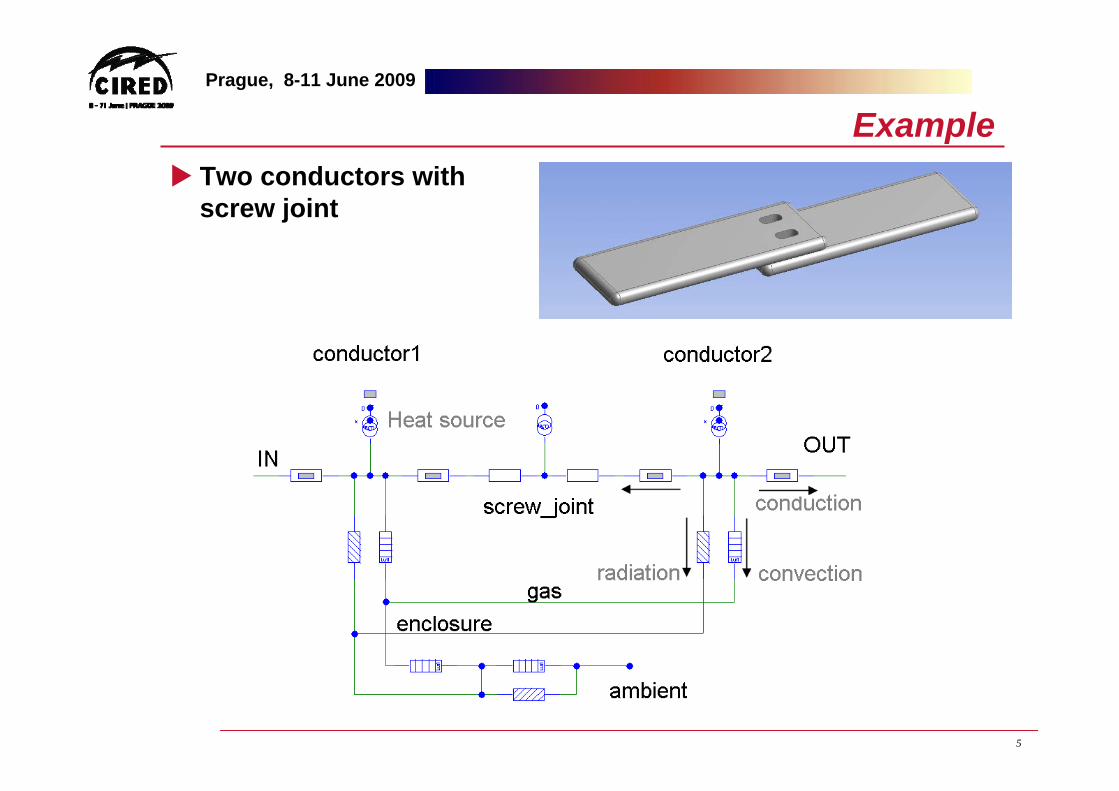
ExampleTwo conductors with screw joint
6 6
Prague, 8-11 June 2009
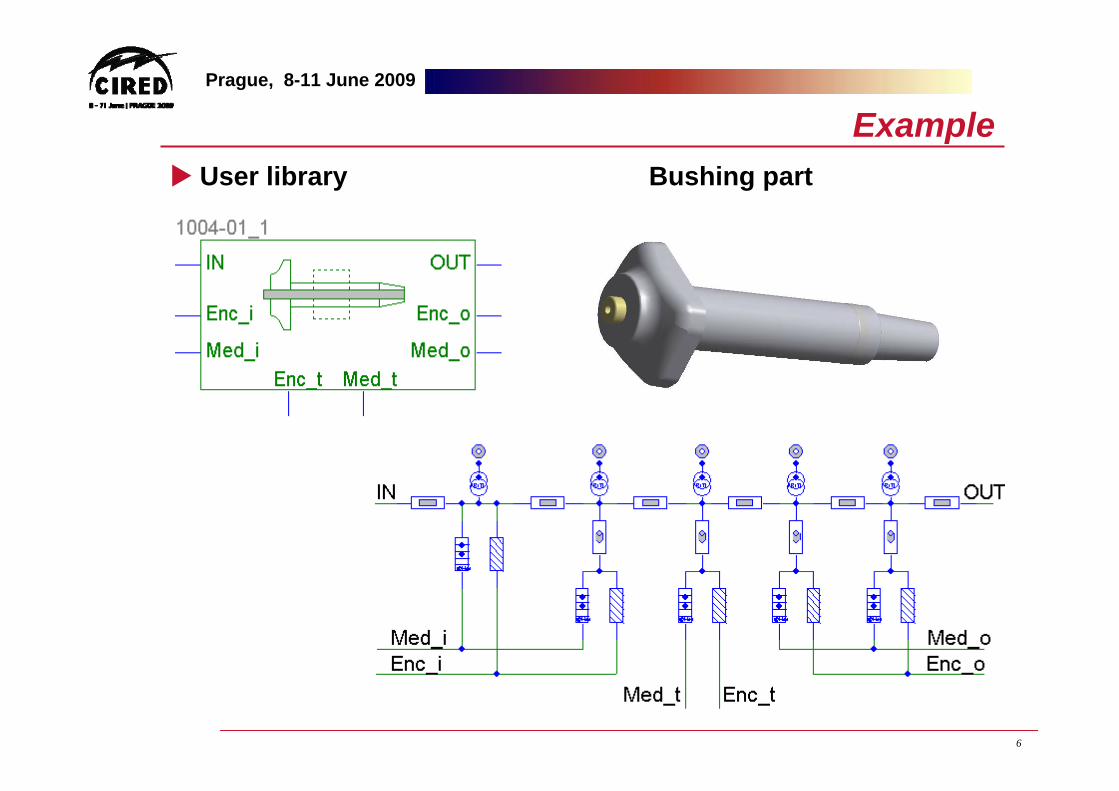
User library Bushing part
Example
7 7
Prague, 8-11 June 2009
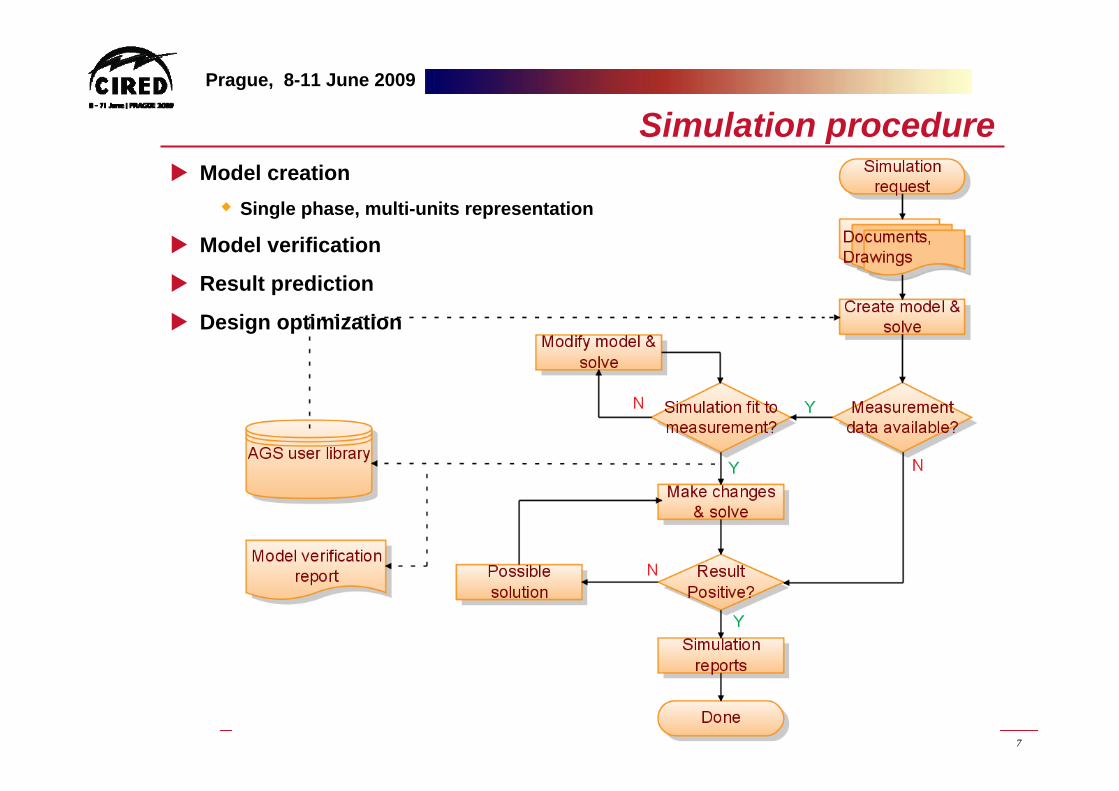
Simulation procedureModel creation
Single phase, multi-units representation
Model verification
Result prediction
Design optimization
8 8
Prague, 8-11 June 2009
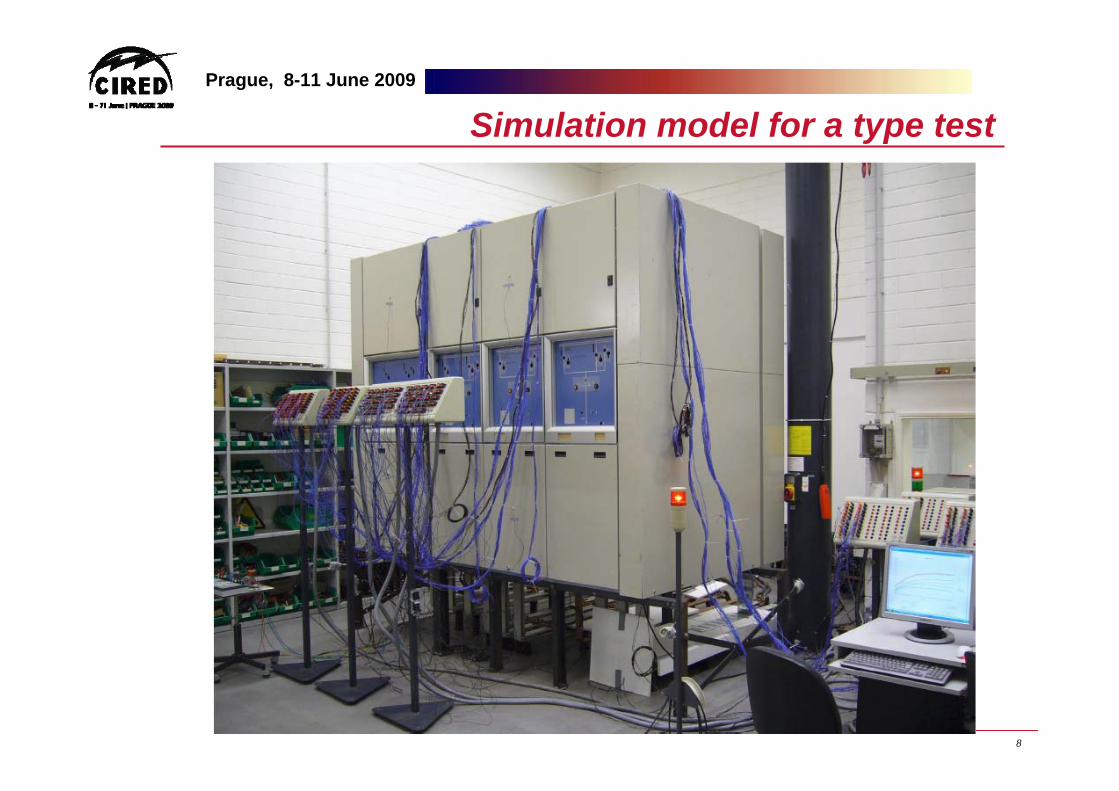
Simulation model for a type test
9 9
Prague, 8-11 June 2009
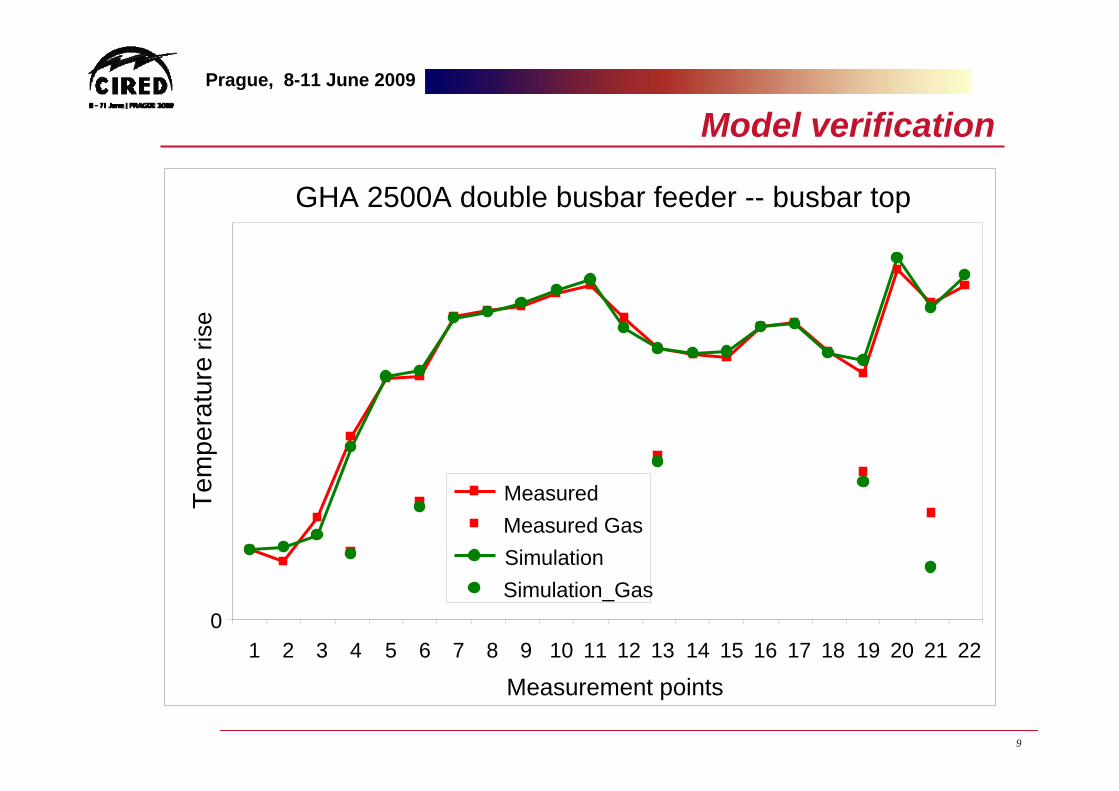
Model verification
GHA 2500A double busbar feeder -- busbar top
01 2 3 4 5 6 7 8 9 10 11 12 13 14 15 16 17 18 19 20 21 22
Measurement points
Tem
pera
ture
rise
MeasuredMeasured GasSimulationSimulation_Gas
10 10
Prague, 8-11 June 2009
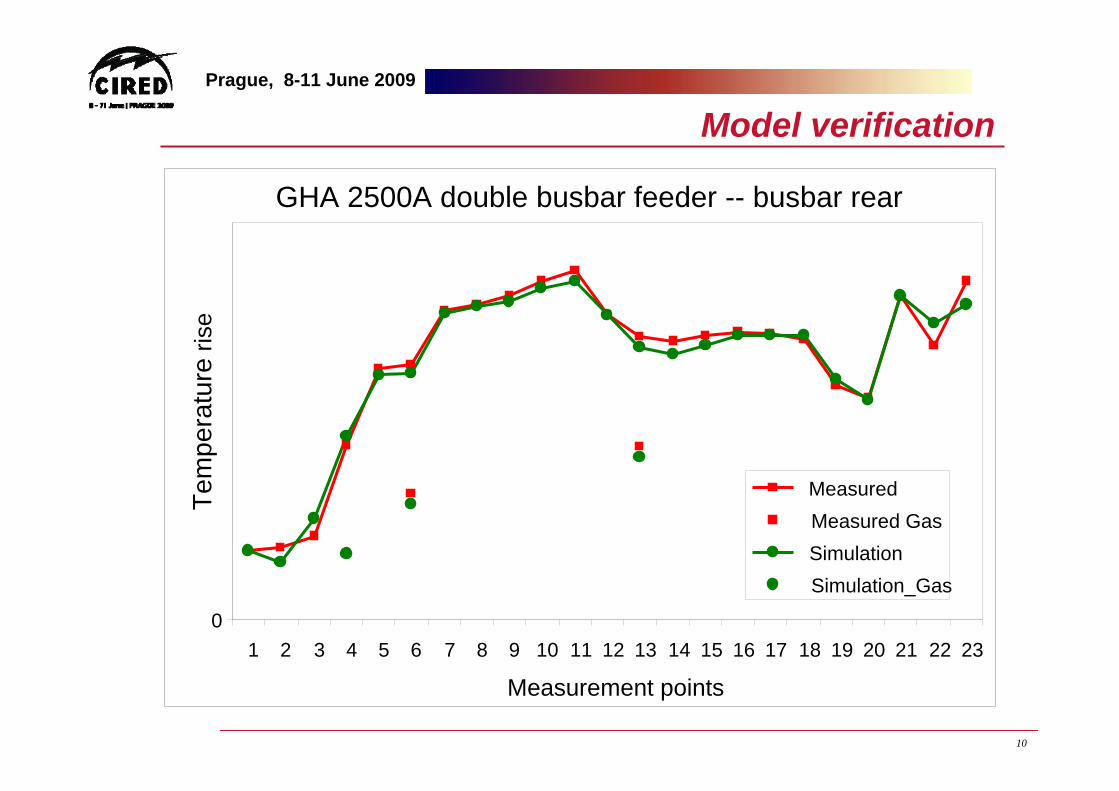
Model verification
GHA 2500A double busbar feeder -- busbar rear
01 2 3 4 5 6 7 8 9 10 11 12 13 14 15 16 17 18 19 20 21 22 23
Measurement points
Tem
pera
ture
rise
MeasuredMeasured GasSimulationSimulation_Gas
11 11
Prague, 8-11 June 2009
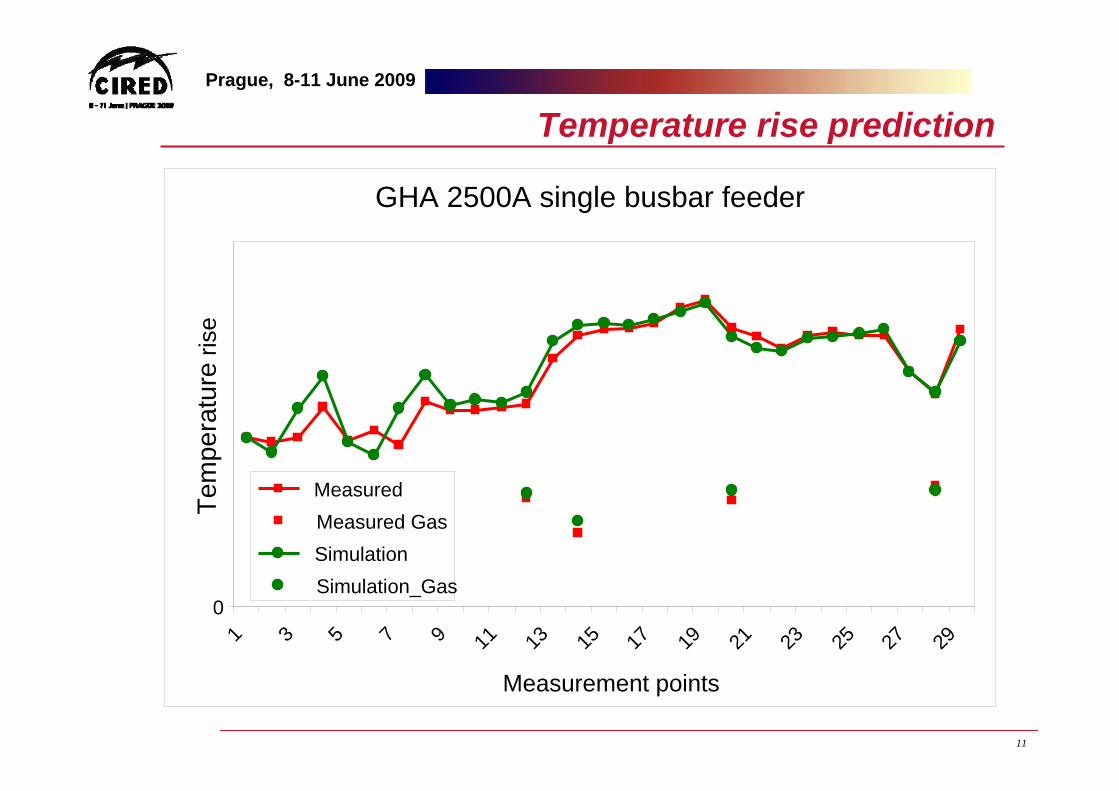
Temperature rise prediction
GHA 2500A single busbar feeder
0
1 3 5 7 9 11 13 15 17 19 21 23 25 27 29
Measurement points
Tem
pera
ture
rise
MeasuredMeasured GasSimulationSimulation_Gas
12 12
Prague, 8-11 June 2009
Conclusion
High modeling efficiency
Very Low computational cost
Good accuracy