Embed Size (px)
Citation preview
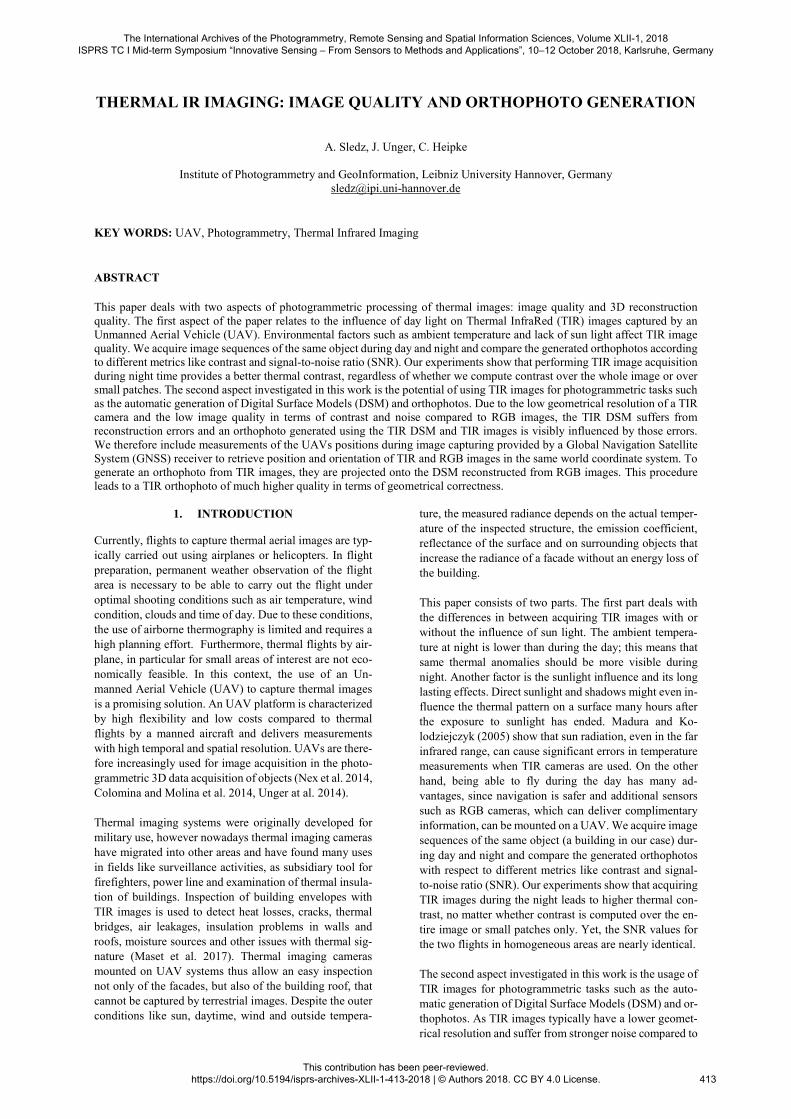
THERMAL IR IMAGING: IMAGE QUALITY AND ORTHOPHOTO GENERATION
A. Sledz, J. Unger, C. Heipke
Institute of Photogrammetry and GeoInformation, Leibniz University Hannover, Germany [email protected]
KEY WORDS: UAV, Photogrammetry, Thermal Infrared Imaging
ABSTRACT This paper deals with two aspects of photogrammetric processing of thermal images: image quality and 3D reconstruction quality. The first aspect of the paper relates to the influence of day light on Thermal InfraRed (TIR) images captured by an Unmanned Aerial Vehicle (UAV). Environmental factors such as ambient temperature and lack of sun light affect TIR image quality. We acquire image sequences of the same object during day and night and compare the generated orthophotos according to different metrics like contrast and signal-to-noise ratio (SNR). Our experiments show that performing TIR image acquisition during night time provides a better thermal contrast, regardless of whether we compute contrast over the whole image or over small patches. The second aspect investigated in this work is the potential of using TIR images for photogrammetric tasks such as the automatic generation of Digital Surface Models (DSM) and orthophotos. Due to the low geometrical resolution of a TIR camera and the low image quality in terms of contrast and noise compared to RGB images, the TIR DSM suffers from reconstruction errors and an orthophoto generated using the TIR DSM and TIR images is visibly influenced by those errors. We therefore include measurements of the UAVs positions during image capturing provided by a Global Navigation Satellite System (GNSS) receiver to retrieve position and orientation of TIR and RGB images in the same world coordinate system. To generate an orthophoto from TIR images, they are projected onto the DSM reconstructed from RGB images. This procedure leads to a TIR orthophoto of much higher quality in terms of geometrical correctness.
1. INTRODUCTION
Currently, flights to capture thermal aerial images are typ-ically carried out using airplanes or helicopters. In flight preparation, permanent weather observation of the flight area is necessary to be able to carry out the flight under optimal shooting conditions such as air temperature, wind condition, clouds and time of day. Due to these conditions, the use of airborne thermography is limited and requires a high planning effort. Furthermore, thermal flights by air-
plane, in particular for small areas of interest are not eco-nomically feasible. In this context, the use of an Un-manned Aerial Vehicle (UAV) to capture thermal images is a promising solution. An UAV platform is characterized by high flexibility and low costs compared to thermal flights by a manned aircraft and delivers measurements with high temporal and spatial resolution. UAVs are there-fore increasingly used for image acquisition in the photo-grammetric 3D data acquisition of objects (Nex et al. 2014, Colomina and Molina et al. 2014, Unger at al. 2014). Thermal imaging systems were originally developed for military use, however nowadays thermal imaging cameras have migrated into other areas and have found many uses
in fields like surveillance activities, as subsidiary tool for firefighters, power line and examination of thermal insula-tion of buildings. Inspection of building envelopes with TIR images is used to detect heat losses, cracks, thermal bridges, air leakages, insulation problems in walls and roofs, moisture sources and other issues with thermal sig-nature (Maset et al. 2017). Thermal imaging cameras mounted on UAV systems thus allow an easy inspection not only of the facades, but also of the building roof, that cannot be captured by terrestrial images. Despite the outer conditions like sun, daytime, wind and outside tempera-
ture, the measured radiance depends on the actual temper-ature of the inspected structure, the emission coefficient, reflectance of the surface and on surrounding objects that increase the radiance of a facade without an energy loss of the building. This paper consists of two parts. The first part deals with the differences in between acquiring TIR images with or without the influence of sun light. The ambient tempera-
ture at night is lower than during the day; this means that same thermal anomalies should be more visible during night. Another factor is the sunlight influence and its long lasting effects. Direct sunlight and shadows might even in-fluence the thermal pattern on a surface many hours after the exposure to sunlight has ended. Madura and Ko-lodziejczyk (2005) show that sun radiation, even in the far infrared range, can cause significant errors in temperature measurements when TIR cameras are used. On the other hand, being able to fly during the day has many ad-vantages, since navigation is safer and additional sensors such as RGB cameras, which can deliver complimentary information, can be mounted on a UAV. We acquire image sequences of the same object (a building in our case) dur-
ing day and night and compare the generated orthophotos with respect to different metrics like contrast and signal-to-noise ratio (SNR). Our experiments show that acquiring TIR images during the night leads to higher thermal con-trast, no matter whether contrast is computed over the en-tire image or small patches only. Yet, the SNR values for the two flights in homogeneous areas are nearly identical. The second aspect investigated in this work is the usage of TIR images for photogrammetric tasks such as the auto-matic generation of Digital Surface Models (DSM) and or-thophotos. As TIR images typically have a lower geomet-rical resolution and suffer from stronger noise compared to
The International Archives of the Photogrammetry, Remote Sensing and Spatial Information Sciences, Volume XLII-1, 2018 ISPRS TC I Mid-term Symposium “Innovative Sensing – From Sensors to Methods and Applications”, 10–12 October 2018, Karlsruhe, Germany
This contribution has been peer-reviewed. https://doi.org/10.5194/isprs-archives-XLII-1-413-2018 | © Authors 2018. CC BY 4.0 License.
413
RGB images, DSMs from TIR images are of lower quality than those from RGB images. We therefore combine both
image types by using GNSS measurements for the position of projection centres to reconstruct the scene using both image types within the same coordinate system. The TIR orthophoto is then generated by projecting TIR images on the RGB DSM instead of using the TIR DSM of low qual-ity. This approach allows us to combine the high resolution and geometric accuracy of RGB images with the thermal information derived from TIR images. In addition, this combination allows us to derive TIR orthophotos from dif-ferent flights (even at night) using the same RGB DSM, assuming that the absolute orientation of the image blocks is accurate enough and the captured object stays stable. The paper is organized as follows. In section 2, the related
work regarding noise estimation and 3D reconstruction from thermal images is presented. Section 3 briefly dis-cusses hardware and software that were used in the exper-iments. The methods that are involved in this work are ex-plained in section 4. Experimental results are shown in sec-tion 5, while section 6 consists of the conclusion and pos-sible future work.
2. RELATED WORK
One of the factors that influences the quality of TIR images is the presence of noise. Noise is always present in digital images during image acquisition, coding, transmission, and processing steps. It is common for TIR images that the SNR and the contrast are low, making processing of TIR
images difficult. Depending on the IR sensor technology the problem may be connected to photoelectric conversion (in photodetectors) or temperature fluctuation noise (in thermal detectors) as well as the influence of the manufac-turing process (Rogalski et al. 2011). The aforementioned problems cause TIR detector non-uniformity, which is re-vealed by varied response of the pixels. This non-uni-formity, if not properly corrected, may be the main source of noise in IR images. Also the environmental conditions during the measurement should be considered. The im-portant problem is thermal stabilization of the TIR camera as stated by Budzan and Wyżgolik (2014). The time re-quired to stabilize the thermal properties of an TIR camera differ according to the camera manufacturer. In most
cases, the non-uniformity of the Focal Plane Array (FPA) is reduced already in the camera software. But the output image still can be affected by noise, especially if the object temperature is similar to the environment. To overcome this issue a mechanical shutter is used for a Flat Field Cor-rection (FFC). FFC is a process whereby per-pixel offset terms are updated to improve image quality. This is done by presenting a uniform temperature plane (a flat field) to every detector element. At the same time as capturing this flat field, the camera updates correction coefficients, re-sulting in a more uniform array output. One of the key steps in a photogrammetric pipeline is the calculation of the parameters of the interior camera orien-
tation parameters, referred to as camera calibration. Com-pared to an RGB camera, the main challenge in thermal camera calibration is to produce a high thermal contrast target board. The geometric calibration to estimate interior orientation parameters of a TIR camera has been studied
in some works (Luhmann et al. 2013, Lagüela et al. 2011). The usage of a 3D test field with circular reflecting targets
instead of a board with heated lamps was found to produce much lower reprojection errors. The effect of reflecting cold sky radiation provides a sufficient image contrast in the thermal spectrum in a test field design. A method for automatic texturing of building facades from terrestrial TIR image sequences is described by Hoegner and Stilla (2015). A fully automatic method is presented to refine GPS based positions estimating relative orientations of the image sequences including a given building model in a bundle adjustment process. The resulting refined ori-entation parameters are used to extract partial facade tex-tures from all images and all sequences. Pech et al. (2013) analyse the problem of using a TIR camera on an UAV for
acquiring multi-temporal thermal images and generating thermal orthophotos. Data acquisition comprises three im-age flights at different times of day: 7 am, 2 pm and 9 pm. Furthermore, the radiation temperatures from the thermal images were compared to ground measurements to check the correctness of the camera measurements. It was shown that the mission at noon has a significant deviation in measured temperature compared to the ground measure-ments than missions from the morning and evening. Khodaei et al. (2015) demonstrate that DSM generated from aerial thermal imagery can have comparable accu-racy with respect to the one derived from visible images. The thermal camera is geometrically calibrated using a cal-ibration grid based on emissivity differences between the
background and the targets. A DSM generation from ther-mal video imagery is performed in standard photogram-metric manner. For quality assessment of the obtained DSM, two scenarios are proposed: a region wise scenario based on available DSMs, which are derived from visible imagery and a point wise scenario based on the coordinates of GCPs determined from an existing DSM. In the region based scenario, a histogram of the difference between the obtained DSM and the available DSM are computed. In the point based scenario, the positions of GCPs are meas-ured in the obtained DSM and compared with known co-ordinates. Obtained results show the comparable accuracy of a 3D model generated based on thermal images with re-spect to a DSM generated from visible images. Boesch et
al. (2017) present an investigation of the influence of inte-rior camera orientation, tie point matching and ground control points on the resulting accuracy of bundle adjust-ment and dense cloud generation with a typically used photogrammetric workflow for UAV based thermal im-agery in natural environments. High overlap (>= 80%) and many metal-coated ground control points are required for sufficient tie point matching in vegetation areas. Motion blur in the canopy region and low contrast at the sensor level make photogrammetric processing of thermal images challenging, as image matching for the whole project area may fail. In special cases, a later registration of generated orthophoto to an external registered dataset can help to properly georeference thermal orthophotos.
Due to low spatial resolution of thermal cameras and typi-cally low contrast of a captured scene, several researchers propose fusion techniques with other sensors to overcome those limitations. Hoegner et al. (2014) fuse time-of-flight depth images and TIR images to create an accurate 3D
The International Archives of the Photogrammetry, Remote Sensing and Spatial Information Sciences, Volume XLII-1, 2018 ISPRS TC I Mid-term Symposium “Innovative Sensing – From Sensors to Methods and Applications”, 10–12 October 2018, Karlsruhe, Germany
This contribution has been peer-reviewed. https://doi.org/10.5194/isprs-archives-XLII-1-413-2018 | © Authors 2018. CC BY 4.0 License.
414
point cloud for subsequent scene segmentation and people detection. Wang et al. (2012) introduce a hybrid method
for rapidly measuring thermal data and three-dimensional geometries of buildings using the developed hybrid light detection and ranging (LIDAR) system, allowing “virtual” representations of the energy and environmental perfor-mance of existing buildings. Moreover, the co-registration of images taken with both RGB and TIR cameras can give advantages in terms of ac-curacy and density of the resulting 3D point cloud (Hoegner and Stilla 2016, Hoegner et al. 2016). Maset et al. (2017) show that a commercial computer vision soft-ware can be used to automatically orient sequences of TIR images taken from an UAV and to generate 3D point clouds, without requiring any Global Navigation Satellite
System (GNSS) and Inertial Navigation System (INS) data about position and attitude of the images. The georeferenc-ing including scaling is done subsequently, exploiting at least three GCPs. Moreover, they use the Iterative Closest Point (ICP) algorithm to register dense clouds of RGB and TIR datasets. As a result, the created 3D model combines high resolution and geometric accuracy of RGB images with the thermal information derived from TIR images. The motivation for this work is to contribute on the topic of UAV-based photogrammetry using TIR images. De-spite the fact that fusion of TIR, RGB and other sensors had been carried out, we show that by using GNSS data of TIR and RGB images, a better result in TIR orthophoto
generation could be achieved compared to no RGB data. Further, we are interested to test the abilities (such as FCC and day/night performance) of a specific HW platform to understand its limitation. The knowledge of advantages and drawbacks will assist us in future research tasks.
3. HARDWARE
In our experiments, we used a DJI Matrice 100 UAV, a vertical take-off and landing (VTOL) quadcopter equipped with GNSS receiver, Inertial Measurement Unit (IMU) and barometer. It has a maximum payload of 1 kg. Two different cameras were in use (see detailed parameters at Table 1): the DJI Zenmuse X3 , consisting of 3-axis gim-bal and 4K RGB camera unit, and the FLIR TAU2 640
Long Wave InfraRed (LWIR) camera mounted on another 3-axis gimbal, as it is currently not possible to attach both cameras to the DJI gimbal. In addition, the TIR camera is equipped with a TEAX ThermalCapture 2.0 640 recording device that stores 14 bits raw images with GNSS data that are received from an additional GNSS receiver (not the one of the copter). Agisoft Photoscan was used as tool for the photogrammetric processing for both image types. The test flights were done above an historic building near the Herrenhäuser Gardens in Hannover, Germany. The covered area is approximately 35x90 meters. In the two-camera setup, the TIR camera was chosen as reference sen-sor for flight planning, because of lower ground resolution
as a result of lower geometrical resolution and correspond-ing focal length (see Table 1). Based on a pixel size of 17 µm, flying height was set to 30 meters above ground, lead-ing to a ground resolution of 3.9 cm and approximately 2.6
cm on the highest point of the scene per pixel of TIR im-ages. The flight stripes and speed were set to lead to at least
75% overlap in both directions for the TIR imagery. The RGB images have 1.3 cm per pixel ground resolution in this setup.
Parameters DJI Zenmuse X3 Camera
FLIR TAU2 640
Sensor size 4000x3000 640x512 Pixel size 1.56 µm 17 µm Wavelength Visible 7.5-13.5 µm Focal distance 3.6 mm 13 mm Aperture � 2.8⁄ � 1.25⁄ Field of view 94˚ 45°(H)x37°(V) Raw data support No 14 bits
Table 1: Sensor parameters
4. METHODS
4.1. Image Quality Measurement
One of the hypotheses of this work is that TIR data cap-tured without sun light interference will yield better TIR images regarding noise and contrast. First, we need to de-
fine a quality measurement for TIR images. Different types of noise exist in RGB and especially in TIR images. We selected the SNR as widely used indicator for image quality. The noise is characterized by its standard devia-tion (Young at al. 1995). The characterization of the signal can differ, thus there exist different definitions of SNR. If the signal is known and lies in between two boundaries, amin ≤ a ≤ amax, then the SNR of image I is defined by equa-tion (1).
��� = 20 ∙ �����
���(�) − ���(�)
�(�) (1)
If the signal is not bounded but has a statistical distribution, then next definitions is in use:
��� = 20 ∙ �����
�(�)
�(�) (2)
with �, � mean and standard deviation of pixel val-
ues
Due to the fact that we are dealing with noisy images we
extend equation (1). Instead of minimum and maximum, we use the percentiles (see equation (3)) as signal bounda-ries.
��� = 20 ∙ �����
��(�, ��) − ��(�, ��)
�(�) (3)
with ��(�, ��) percentile of image I,
�� and �� percentiles values A percentile is a measure used in statistics indicating the value below which a given percentage of observations in a group of observations fall. This approach excludes noisy pixels that are far from the pixel distribution of the pixel values histogram. Figure 1 shows an example histogram of a 14 bits TIR image and different percentile value posi-tions. The red line represents the position of percentiles for
different values. It should be mentioned, that when v1 and v2 are set to 100 and 0 respectively, equations (1) and (3)
The International Archives of the Photogrammetry, Remote Sensing and Spatial Information Sciences, Volume XLII-1, 2018 ISPRS TC I Mid-term Symposium “Innovative Sensing – From Sensors to Methods and Applications”, 10–12 October 2018, Karlsruhe, Germany
This contribution has been peer-reviewed. https://doi.org/10.5194/isprs-archives-XLII-1-413-2018 | © Authors 2018. CC BY 4.0 License.
415
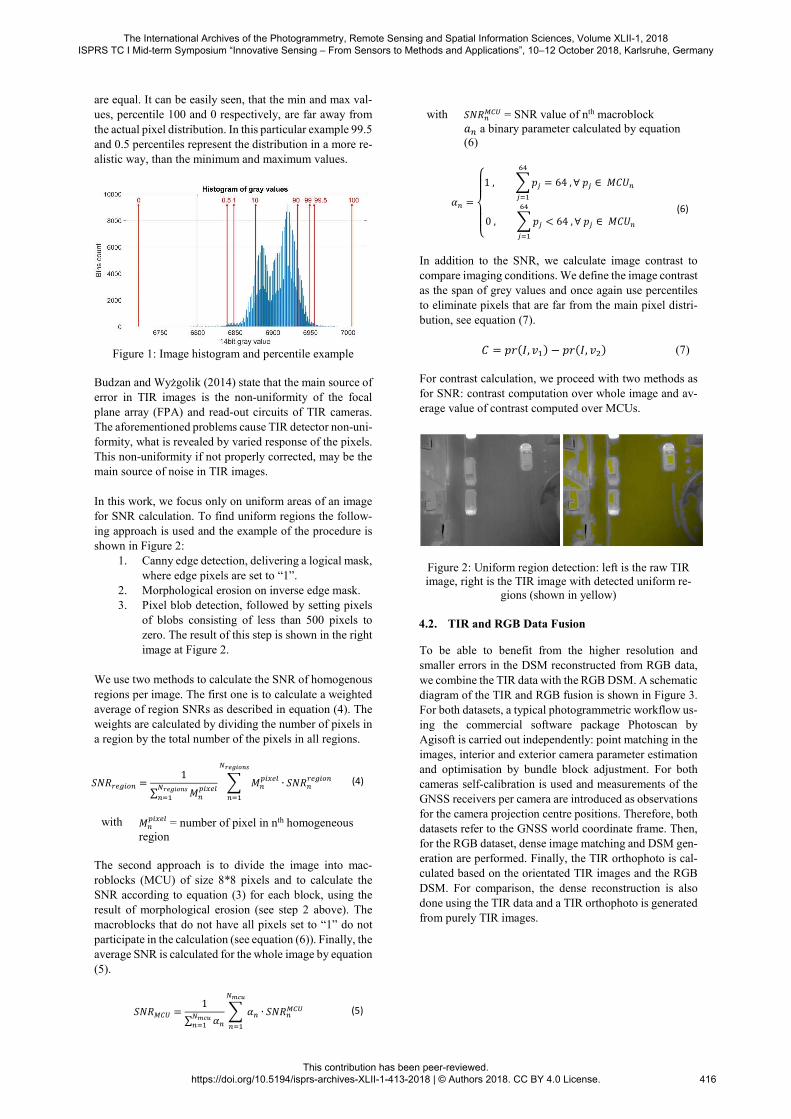
are equal. It can be easily seen, that the min and max val-ues, percentile 100 and 0 respectively, are far away from
the actual pixel distribution. In this particular example 99.5 and 0.5 percentiles represent the distribution in a more re-alistic way, than the minimum and maximum values.
Figure 1: Image histogram and percentile example
Budzan and Wyżgolik (2014) state that the main source of error in TIR images is the non-uniformity of the focal plane array (FPA) and read-out circuits of TIR cameras. The aforementioned problems cause TIR detector non-uni-formity, what is revealed by varied response of the pixels. This non-uniformity if not properly corrected, may be the main source of noise in TIR images.
In this work, we focus only on uniform areas of an image for SNR calculation. To find uniform regions the follow-ing approach is used and the example of the procedure is shown in Figure 2:
1. Canny edge detection, delivering a logical mask, where edge pixels are set to “1”.
2. Morphological erosion on inverse edge mask. 3. Pixel blob detection, followed by setting pixels
of blobs consisting of less than 500 pixels to zero. The result of this step is shown in the right image at Figure 2.
We use two methods to calculate the SNR of homogenous
regions per image. The first one is to calculate a weighted average of region SNRs as described in equation (4). The weights are calculated by dividing the number of pixels in a region by the total number of the pixels in all regions.
��������� =1
∑ ���������������
���
� �������
∙ ����������
��������
���
(4)
with ��
����� = number of pixel in nth homogeneous region
The second approach is to divide the image into mac-roblocks (MCU) of size 8*8 pixels and to calculate the SNR according to equation (3) for each block, using the result of morphological erosion (see step 2 above). The macroblocks that do not have all pixels set to “1” do not participate in the calculation (see equation (6)). Finally, the average SNR is calculated for the whole image by equation (5).
������ =1
∑ ���������
� �� ∙ �������
����
���
(5)
with ����
��� = SNR value of nth macroblock �� a binary parameter calculated by equation (6)
�� =
⎩⎪⎨
⎪⎧1 , � ��
��
���
= 64 , ∀ �� ∈ ����
0 , � ��
��
���
< 64 , ∀ �� ∈ ����
(6)
In addition to the SNR, we calculate image contrast to compare imaging conditions. We define the image contrast as the span of grey values and once again use percentiles to eliminate pixels that are far from the main pixel distri-bution, see equation (7).
� = ��(�, ��) − ��(�, ��) (7) For contrast calculation, we proceed with two methods as for SNR: contrast computation over whole image and av-erage value of contrast computed over MCUs.
Figure 2: Uniform region detection: left is the raw TIR image, right is the TIR image with detected uniform re-
gions (shown in yellow)
4.2. TIR and RGB Data Fusion
To be able to benefit from the higher resolution and smaller errors in the DSM reconstructed from RGB data,
we combine the TIR data with the RGB DSM. A schematic diagram of the TIR and RGB fusion is shown in Figure 3. For both datasets, a typical photogrammetric workflow us-ing the commercial software package Photoscan by Agisoft is carried out independently: point matching in the images, interior and exterior camera parameter estimation and optimisation by bundle block adjustment. For both cameras self-calibration is used and measurements of the GNSS receivers per camera are introduced as observations for the camera projection centre positions. Therefore, both datasets refer to the GNSS world coordinate frame. Then, for the RGB dataset, dense image matching and DSM gen-eration are performed. Finally, the TIR orthophoto is cal-culated based on the orientated TIR images and the RGB
DSM. For comparison, the dense reconstruction is also done using the TIR data and a TIR orthophoto is generated from purely TIR images.
The International Archives of the Photogrammetry, Remote Sensing and Spatial Information Sciences, Volume XLII-1, 2018 ISPRS TC I Mid-term Symposium “Innovative Sensing – From Sensors to Methods and Applications”, 10–12 October 2018, Karlsruhe, Germany
This contribution has been peer-reviewed. https://doi.org/10.5194/isprs-archives-XLII-1-413-2018 | © Authors 2018. CC BY 4.0 License.
416
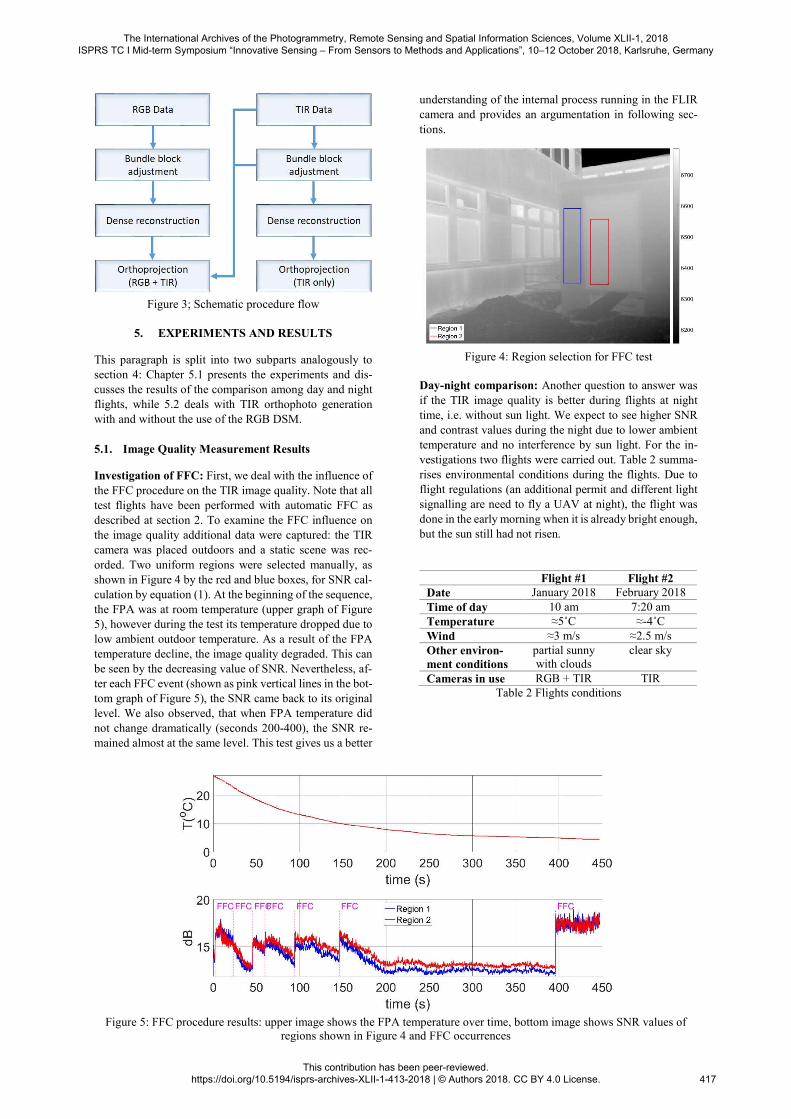
Figure 3; Schematic procedure flow
5. EXPERIMENTS AND RESULTS
This paragraph is split into two subparts analogously to section 4: Chapter 5.1 presents the experiments and dis-cusses the results of the comparison among day and night flights, while 5.2 deals with TIR orthophoto generation with and without the use of the RGB DSM.
5.1. Image Quality Measurement Results
Investigation of FFC: First, we deal with the influence of the FFC procedure on the TIR image quality. Note that all test flights have been performed with automatic FFC as described at section 2. To examine the FFC influence on the image quality additional data were captured: the TIR camera was placed outdoors and a static scene was rec-
orded. Two uniform regions were selected manually, as shown in Figure 4 by the red and blue boxes, for SNR cal-culation by equation (1). At the beginning of the sequence, the FPA was at room temperature (upper graph of Figure 5), however during the test its temperature dropped due to low ambient outdoor temperature. As a result of the FPA temperature decline, the image quality degraded. This can be seen by the decreasing value of SNR. Nevertheless, af-ter each FFC event (shown as pink vertical lines in the bot-tom graph of Figure 5), the SNR came back to its original level. We also observed, that when FPA temperature did not change dramatically (seconds 200-400), the SNR re-mained almost at the same level. This test gives us a better
understanding of the internal process running in the FLIR camera and provides an argumentation in following sec-
tions.
Figure 4: Region selection for FFC test
Day-night comparison: Another question to answer was if the TIR image quality is better during flights at night time, i.e. without sun light. We expect to see higher SNR and contrast values during the night due to lower ambient temperature and no interference by sun light. For the in-vestigations two flights were carried out. Table 2 summa-rises environmental conditions during the flights. Due to flight regulations (an additional permit and different light signalling are need to fly a UAV at night), the flight was done in the early morning when it is already bright enough, but the sun still had not risen.
Flight #1 Flight #2 Date January 2018 February 2018 Time of day 10 am 7:20 am Temperature ≈5˚C ≈-4˚C Wind ≈3 m/s ≈2.5 m/s Other environ-ment conditions
partial sunny with clouds
clear sky
Cameras in use RGB + TIR TIR Table 2 Flights conditions
Figure 5: FFC procedure results: upper image shows the FPA temperature over time, bottom image shows SNR values of
regions shown in Figure 4 and FFC occurrences
The International Archives of the Photogrammetry, Remote Sensing and Spatial Information Sciences, Volume XLII-1, 2018 ISPRS TC I Mid-term Symposium “Innovative Sensing – From Sensors to Methods and Applications”, 10–12 October 2018, Karlsruhe, Germany
This contribution has been peer-reviewed. https://doi.org/10.5194/isprs-archives-XLII-1-413-2018 | © Authors 2018. CC BY 4.0 License.
417
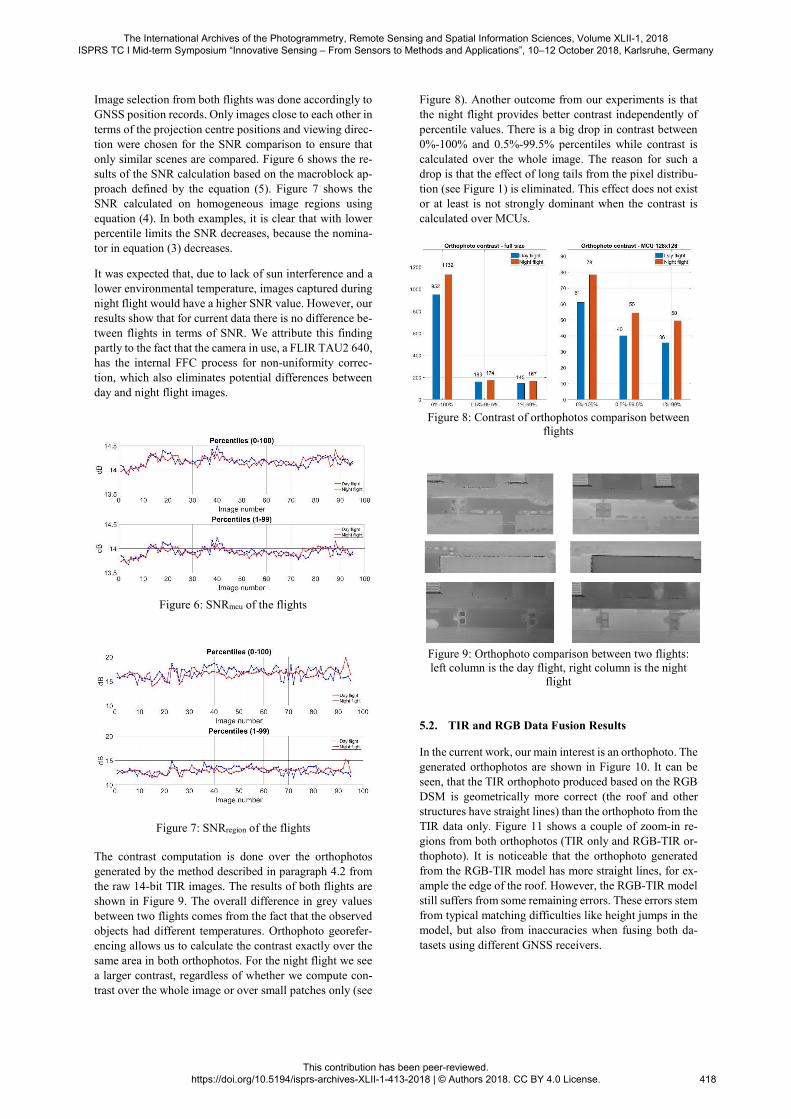
Image selection from both flights was done accordingly to GNSS position records. Only images close to each other in
terms of the projection centre positions and viewing direc-tion were chosen for the SNR comparison to ensure that only similar scenes are compared. Figure 6 shows the re-sults of the SNR calculation based on the macroblock ap-proach defined by the equation (5). Figure 7 shows the SNR calculated on homogeneous image regions using equation (4). In both examples, it is clear that with lower percentile limits the SNR decreases, because the nomina-tor in equation (3) decreases.
It was expected that, due to lack of sun interference and a lower environmental temperature, images captured during night flight would have a higher SNR value. However, our results show that for current data there is no difference be-tween flights in terms of SNR. We attribute this finding partly to the fact that the camera in use, a FLIR TAU2 640, has the internal FFC process for non-uniformity correc-tion, which also eliminates potential differences between day and night flight images.
Figure 6: SNRmcu of the flights
Figure 7: SNRregion of the flights The contrast computation is done over the orthophotos generated by the method described in paragraph 4.2 from the raw 14-bit TIR images. The results of both flights are shown in Figure 9. The overall difference in grey values
between two flights comes from the fact that the observed objects had different temperatures. Orthophoto georefer-encing allows us to calculate the contrast exactly over the same area in both orthophotos. For the night flight we see a larger contrast, regardless of whether we compute con-trast over the whole image or over small patches only (see
Figure 8). Another outcome from our experiments is that the night flight provides better contrast independently of
percentile values. There is a big drop in contrast between 0%-100% and 0.5%-99.5% percentiles while contrast is calculated over the whole image. The reason for such a drop is that the effect of long tails from the pixel distribu-tion (see Figure 1) is eliminated. This effect does not exist or at least is not strongly dominant when the contrast is calculated over MCUs.
Figure 8: Contrast of orthophotos comparison between
flights
Figure 9: Orthophoto comparison between two flights: left column is the day flight, right column is the night
flight
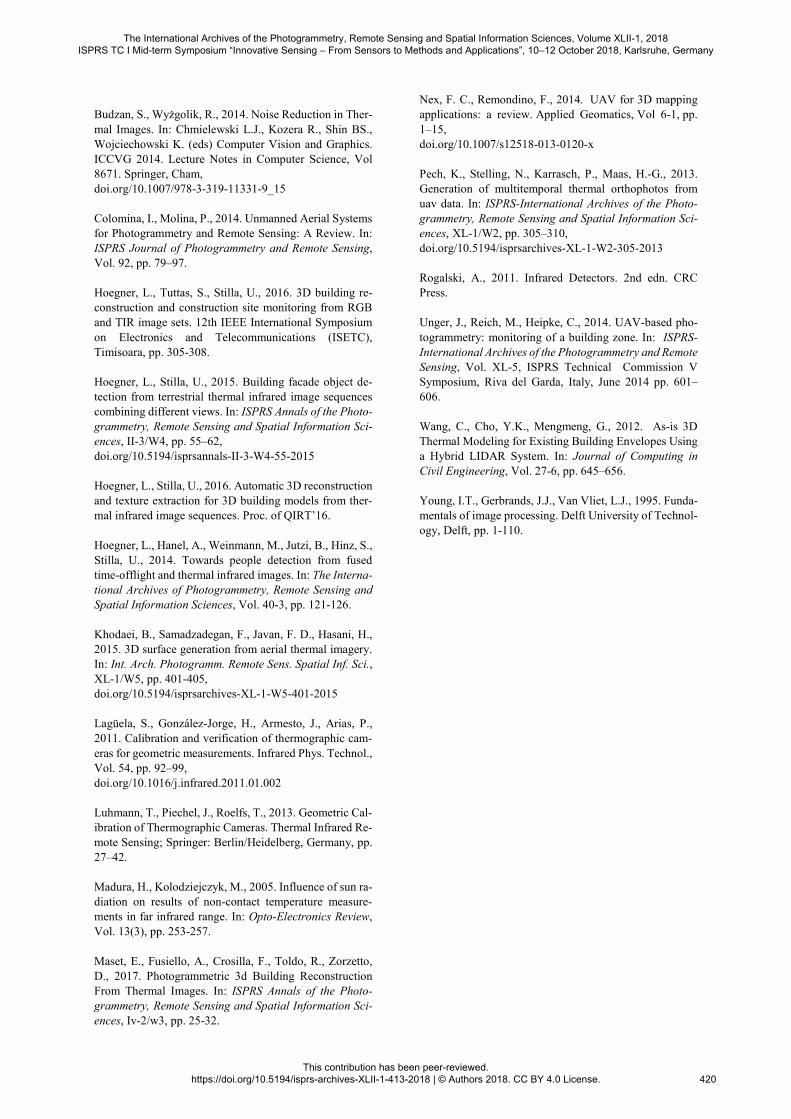
5.2. TIR and RGB Data Fusion Results
In the current work, our main interest is an orthophoto. The generated orthophotos are shown in Figure 10. It can be seen, that the TIR orthophoto produced based on the RGB DSM is geometrically more correct (the roof and other structures have straight lines) than the orthophoto from the TIR data only. Figure 11 shows a couple of zoom-in re-gions from both orthophotos (TIR only and RGB-TIR or-thophoto). It is noticeable that the orthophoto generated from the RGB-TIR model has more straight lines, for ex-ample the edge of the roof. However, the RGB-TIR model still suffers from some remaining errors. These errors stem from typical matching difficulties like height jumps in the model, but also from inaccuracies when fusing both da-
tasets using different GNSS receivers.
The International Archives of the Photogrammetry, Remote Sensing and Spatial Information Sciences, Volume XLII-1, 2018 ISPRS TC I Mid-term Symposium “Innovative Sensing – From Sensors to Methods and Applications”, 10–12 October 2018, Karlsruhe, Germany
This contribution has been peer-reviewed. https://doi.org/10.5194/isprs-archives-XLII-1-413-2018 | © Authors 2018. CC BY 4.0 License.
418
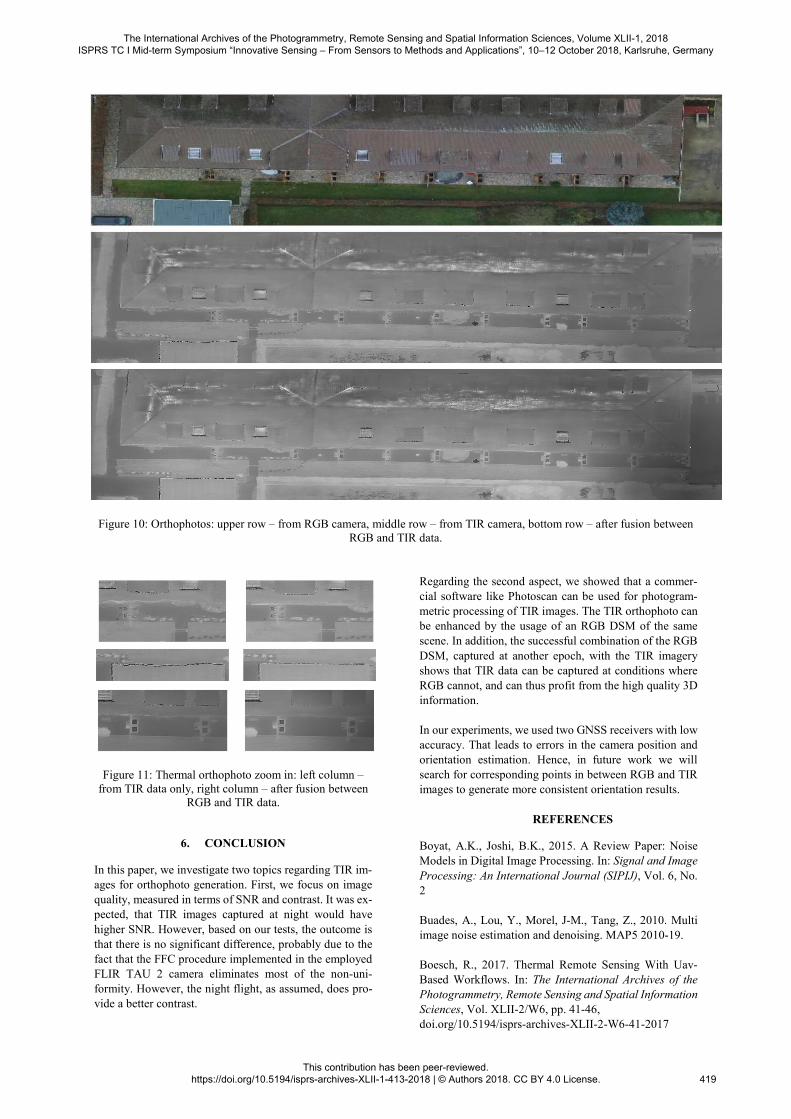
Figure 10: Orthophotos: upper row – from RGB camera, middle row – from TIR camera, bottom row – after fusion between
RGB and TIR data.
Figure 11: Thermal orthophoto zoom in: left column –
from TIR data only, right column – after fusion between RGB and TIR data.
6. CONCLUSION
In this paper, we investigate two topics regarding TIR im-ages for orthophoto generation. First, we focus on image quality, measured in terms of SNR and contrast. It was ex-pected, that TIR images captured at night would have
higher SNR. However, based on our tests, the outcome is that there is no significant difference, probably due to the fact that the FFC procedure implemented in the employed FLIR TAU 2 camera eliminates most of the non-uni-formity. However, the night flight, as assumed, does pro-vide a better contrast.
Regarding the second aspect, we showed that a commer-cial software like Photoscan can be used for photogram-metric processing of TIR images. The TIR orthophoto can be enhanced by the usage of an RGB DSM of the same scene. In addition, the successful combination of the RGB
DSM, captured at another epoch, with the TIR imagery shows that TIR data can be captured at conditions where RGB cannot, and can thus profit from the high quality 3D information. In our experiments, we used two GNSS receivers with low accuracy. That leads to errors in the camera position and orientation estimation. Hence, in future work we will search for corresponding points in between RGB and TIR images to generate more consistent orientation results.
REFERENCES
Boyat, A.K., Joshi, B.K., 2015. A Review Paper: Noise Models in Digital Image Processing. In: Signal and Image
Processing: An International Journal (SIPIJ), Vol. 6, No. 2 Buades, A., Lou, Y., Morel, J-M., Tang, Z., 2010. Multi image noise estimation and denoising. MAP5 2010-19. Boesch, R., 2017. Thermal Remote Sensing With Uav-Based Workflows. In: The International Archives of the Photogrammetry, Remote Sensing and Spatial Information Sciences, Vol. XLII-2/W6, pp. 41-46, doi.org/10.5194/isprs-archives-XLII-2-W6-41-2017
The International Archives of the Photogrammetry, Remote Sensing and Spatial Information Sciences, Volume XLII-1, 2018 ISPRS TC I Mid-term Symposium “Innovative Sensing – From Sensors to Methods and Applications”, 10–12 October 2018, Karlsruhe, Germany
This contribution has been peer-reviewed. https://doi.org/10.5194/isprs-archives-XLII-1-413-2018 | © Authors 2018. CC BY 4.0 License.
419
Budzan, S., Wyżgolik, R., 2014. Noise Reduction in Ther-
mal Images. In: Chmielewski L.J., Kozera R., Shin BS., Wojciechowski K. (eds) Computer Vision and Graphics. ICCVG 2014. Lecture Notes in Computer Science, Vol 8671. Springer, Cham, doi.org/10.1007/978-3-319-11331-9_15 Colomina, I., Molina, P., 2014. Unmanned Aerial Systems for Photogrammetry and Remote Sensing: A Review. In: ISPRS Journal of Photogrammetry and Remote Sensing, Vol. 92, pp. 79–97. Hoegner, L., Tuttas, S., Stilla, U., 2016. 3D building re-construction and construction site monitoring from RGB and TIR image sets. 12th IEEE International Symposium
on Electronics and Telecommunications (ISETC), Timisoara, pp. 305-308. Hoegner, L., Stilla, U., 2015. Building facade object de-tection from terrestrial thermal infrared image sequences combining different views. In: ISPRS Annals of the Photo-grammetry, Remote Sensing and Spatial Information Sci-ences, II-3/W4, pp. 55–62, doi.org/10.5194/isprsannals-II-3-W4-55-2015 Hoegner, L., Stilla, U., 2016. Automatic 3D reconstruction and texture extraction for 3D building models from ther-mal infrared image sequences. Proc. of QIRT’16.
Hoegner, L., Hanel, A., Weinmann, M., Jutzi, B., Hinz, S., Stilla, U., 2014. Towards people detection from fused time-offlight and thermal infrared images. In: The Interna-tional Archives of Photogrammetry, Remote Sensing and Spatial Information Sciences, Vol. 40-3, pp. 121-126. Khodaei, B., Samadzadegan, F., Javan, F. D., Hasani, H., 2015. 3D surface generation from aerial thermal imagery. In: Int. Arch. Photogramm. Remote Sens. Spatial Inf. Sci., XL-1/W5, pp. 401-405, doi.org/10.5194/isprsarchives-XL-1-W5-401-2015 Lagüela, S., González-Jorge, H., Armesto, J., Arias, P., 2011. Calibration and verification of thermographic cam-
eras for geometric measurements. Infrared Phys. Technol., Vol. 54, pp. 92–99, doi.org/10.1016/j.infrared.2011.01.002 Luhmann, T., Piechel, J., Roelfs, T., 2013. Geometric Cal-ibration of Thermographic Cameras. Thermal Infrared Re-mote Sensing; Springer: Berlin/Heidelberg, Germany, pp. 27–42. Madura, H., Kolodziejczyk, M., 2005. Influence of sun ra-diation on results of non-contact temperature measure-ments in far infrared range. In: Opto-Electronics Review, Vol. 13(3), pp. 253-257.
Maset, E., Fusiello, A., Crosilla, F., Toldo, R., Zorzetto, D., 2017. Photogrammetric 3d Building Reconstruction From Thermal Images. In: ISPRS Annals of the Photo-grammetry, Remote Sensing and Spatial Information Sci-ences, Iv-2/w3, pp. 25-32.
Nex, F. C., Remondino, F., 2014. UAV for 3D mapping applications: a review. Applied Geomatics, Vol 6-1, pp.
1–15, doi.org/10.1007/s12518-013-0120-x Pech, K., Stelling, N., Karrasch, P., Maas, H.-G., 2013. Generation of multitemporal thermal orthophotos from uav data. In: ISPRS-International Archives of the Photo-grammetry, Remote Sensing and Spatial Information Sci-ences, XL-1/W2, pp. 305–310, doi.org/10.5194/isprsarchives-XL-1-W2-305-2013 Rogalski, A., 2011. Infrared Detectors. 2nd edn. CRC Press. Unger, J., Reich, M., Heipke, C., 2014. UAV-based pho-
togrammetry: monitoring of a building zone. In: ISPRS-International Archives of the Photogrammetry and Remote Sensing, Vol. XL-5, ISPRS Technical Commission V Symposium, Riva del Garda, Italy, June 2014 pp. 601–606. Wang, C., Cho, Y.K., Mengmeng, G., 2012. As-is 3D Thermal Modeling for Existing Building Envelopes Using a Hybrid LIDAR System. In: Journal of Computing in Civil Engineering, Vol. 27-6, pp. 645–656. Young, I.T., Gerbrands, J.J., Van Vliet, L.J., 1995. Funda-mentals of image processing. Delft University of Technol-ogy, Delft, pp. 1-110.
The International Archives of the Photogrammetry, Remote Sensing and Spatial Information Sciences, Volume XLII-1, 2018 ISPRS TC I Mid-term Symposium “Innovative Sensing – From Sensors to Methods and Applications”, 10–12 October 2018, Karlsruhe, Germany
This contribution has been peer-reviewed. https://doi.org/10.5194/isprs-archives-XLII-1-413-2018 | © Authors 2018. CC BY 4.0 License.
420