Embed Size (px)
Citation preview
Leading Thermal Analysis
Analyzing & Testing
Thermal Characterization of PolymersThermoplastics, Thermoplastic Elastomers, Elastomers and Thermosets
2
The World of Polymers
rubber parts, but also to produce fibers, films, adhesives and glues, and varnishes and paints. And today, the possibility of recycling them makes them even more interesting from an ecological and economical point of view.
Henri Braconnot's work in the 1830s is perhaps the first modern example of polymer science. He, along with others, developed derivatives of the natural polymer cellulose, producing new, semi-synthetic materials, such as celluloid and cellulose acetate. Since that time, eight Nobel Prizes have been dedicated to polymer sciences.
Just 50 years ago, materials we now take for granted were non-existent. With further advances in the under-standing of polymers, and with new applications being researched all the time, there is no reason to believe that his revolution will stop any time soon.
Polymer materials have greatly changed the world we live in – without them, the world would not be as we know it today. There is something innately fascinating about them, yet we've become accustomed to their integral presence in our everyday lives. Polymersare used not only to create plastic and
The importance of polymers in our daily lives has not come about arbitrarily, but rather as a result of the distinct advantages that they offer. These advantages include:
� Light weight
� Good thermal and electrical insula-tion capacity
� Resistance to corrosion effects
� Chemically inert
� High strength and dimensional stability
� Absorption of mechanical shocks
� Resistance to abrasion effects
� Good dyeability
� Potential for decorative surface effects
� Low production costs
Coatings Films
Adhesives Fibers
Resins/Paints Thermoplastics
Thermosets
Polymers Foams Composites
Rubber Thermoplastic Elastomers
Elastomers
Additives
3
Thermal Analysis
During their production, processing and application, polymers are often subjected to temperature-dependent structural changes. Thermal analysis for characterization of polymers is widely practiced today in research and industry. More and more applications are being backed up by national and international standards (ISO, EN, ASTM, DIN, etc.).
Thermal analysis techniques measure the thermal transitions (DSC, DMA, DIL, LFA), chemical reactions and decompositions (TGA, DSC, DEA, rheology), viscoelastic properties (DMA, rheology), and thermal conductivity/diffusivity (HFM, GHP, LFA) as a function of temperature, heating rate, deformation, and atmosphere. These techniques give insight into the specific thermal properties of polymer materials and products, but more importantly, they can be used to determine the composition of plastic and rubbers compounds, and to gain information regarding the condition or processing history of specific samples relative to reference samples.
Thermal Analysis Measurement Tasks
The variety of thermoanalytical test methods opens a broad application range for polymer testing, e.g.:
� Specific heat
� Thermal transitions
� Melting, crystallization and reaction enthalpies
� Glass transition temperatures
� Degree of crystallinity
� Thermal stability
� Oxidation Induction Time / Oxidation Onset Temperature (O.I.T., O.O.T.)
� Viscoelastic behavior
� Young’s modulus
� Kinetics of reactions
� Compositional analysis
� Thermal expansion coefficient
� Filler content
� Thermal conductivity/diffusivity, etc.
This makes thermal analysis very well-suited for quality control and quality assurance. Incoming materials inspection as well as materials selection can be carried out safely and easily. Also for the research and development of new materials, thermal analysis is an indispensable tool for investigating a broad range of materials properties.
NETZSCH Analyzing & Testing has a product portfolio and applications in thermal analysis and thermophysical properties testing that rank among the best in the market as far as meeting the high demands associated with reliable manufacturing and state-of-the-art technologies.
Our solutions consist of well-proven test methods in R&D and quality control for studying nearly any kinds of material used in the various branches of the polymer industry.
4
Differential Scanning Calorimetry (DSC)
Differential Scanning Calorimetry
Differential Scanning Calorimetry (DSC) is the most frequently employed thermal analysis method. It can be used to analyze nearly any energetic effects occurring in a solid or liquid during thermal treatment. DSC analysis in accordance with ISO 11357 provides the following valuable information for the research and quality control of polymers:
� Thermophysical properties Specific heat
� Product Identification and Characterization Melting/crystallization temperatures Melting/crystallization enthalpies Cross-linking temperatures Cross-linking enthalpies Degree of crystallinity Glass transition temperatures
� Advanced Materials Analysis Decomposition effects Oxidative stability (O.I.T., O.O.T.) Reaction kinetics Degree of curing Purity determination of additives Curing by UV irradation Stability under pressure Peak separation
� Product/Process Information Incoming goods inspection Thermomechanical history Failure analysis Competitor product analysis Process optimization
� Thermokinetics Reaction behavior Predictions Process optimization
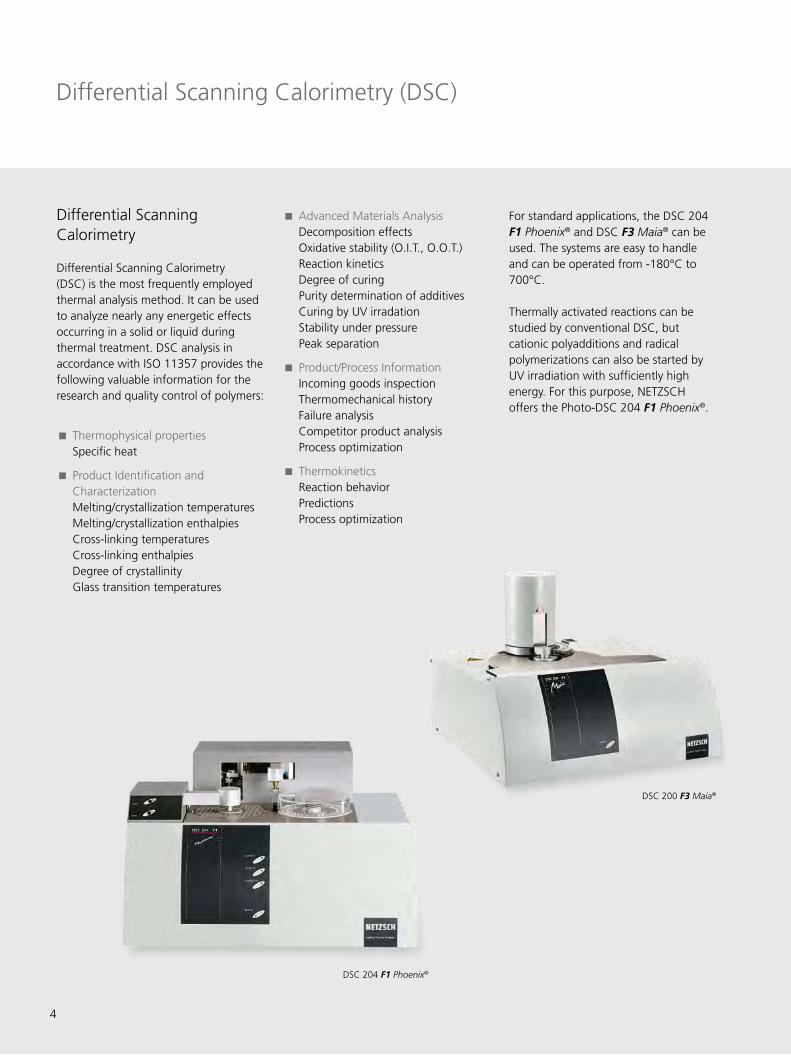
For standard applications, the DSC 204 F1 Phoenix® and DSC F3 Maia® can be used. The systems are easy to handle and can be operated from -180°C to 700°C.
Thermally activated reactions can be studied by conventional DSC, but cationic polyadditions and radical polymerizations can also be started by UV irradiation with sufficiently high energy. For this purpose, NETZSCH offers the Photo-DSC 204 F1 Phoenix®.
DSC 200 F3 Maia®
DSC 204 F1 Phoenix®
5
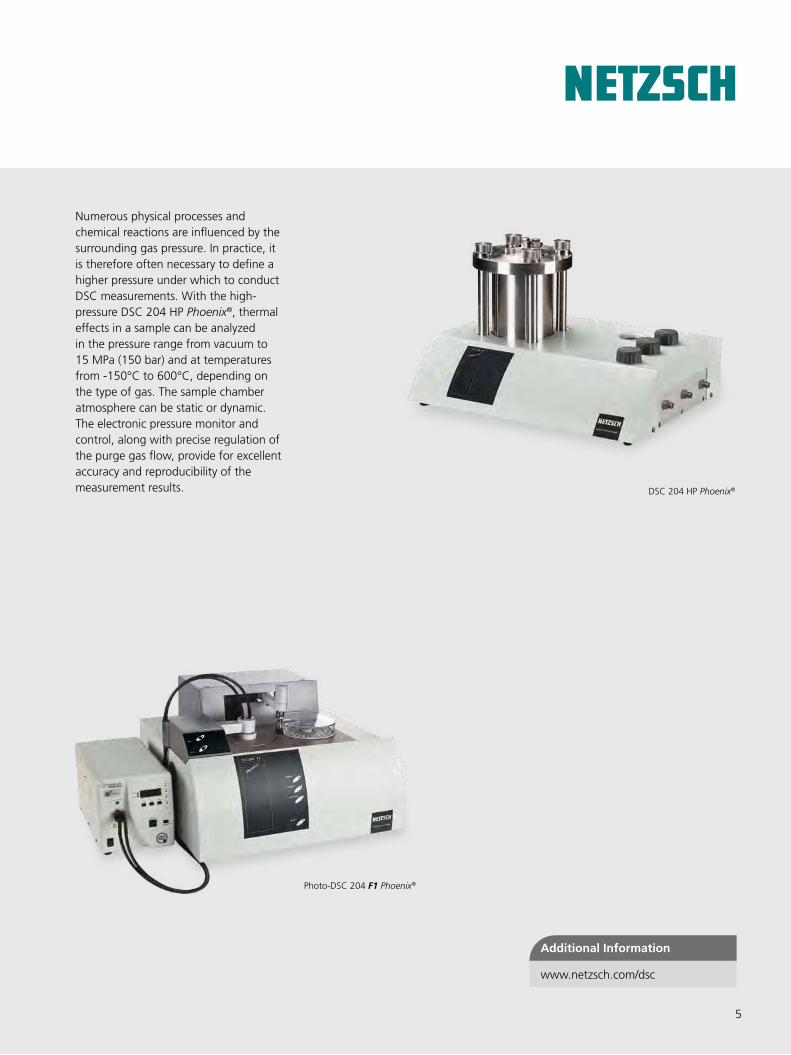
Numerous physical processes and chemical reactions are influenced by the surrounding gas pressure. In practice, it is therefore often necessary to define a higher pressure under which to conduct DSC measurements. With the high-pressure DSC 204 HP Phoenix®, thermal effects in a sample can be analyzed in the pressure range from vacuum to 15 MPa (150 bar) and at temperatures from -150°C to 600°C, depending on the type of gas. The sample chamber atmosphere can be static or dynamic. The electronic pressure monitor and control, along with precise regulation of the purge gas flow, provide for excellent accuracy and reproducibility of the measurement results. DSC 204 HP Phoenix®
Photo-DSC 204 F1 Phoenix®
Additional Information
www.netzsch.com/dsc
6
Thermogravimetric Analysis (TGA) and Simultaneous Thermal Analysis (STA)
Thermogravimetry
Thermogravimetry (TG), or Thermo-gravimetric Analysis (TGA), is a well proven thermal analysis method for measurements of mass changes versus temperature or time. TGA is used in the research & development of various substances and engineering materials – both solids and liquids – in order to obtain knowledge about their thermal stability and composition.
In recent decades, TGA has beenused increasingly in quality controland assurance for raw materials andincoming goods, as well as in the failureanalysis of finished parts, especiallyin the polymer-processing industry.
TGA provides complementary and supplementary characterization information to the most commonly used methods of thermal analysis.
Various international standards describethe general principles of thermogravim-etry for polymers (ISO 11358) or other specific applications, such as the TGA method for the compositional analysis of rubber (ASTM D 6370).
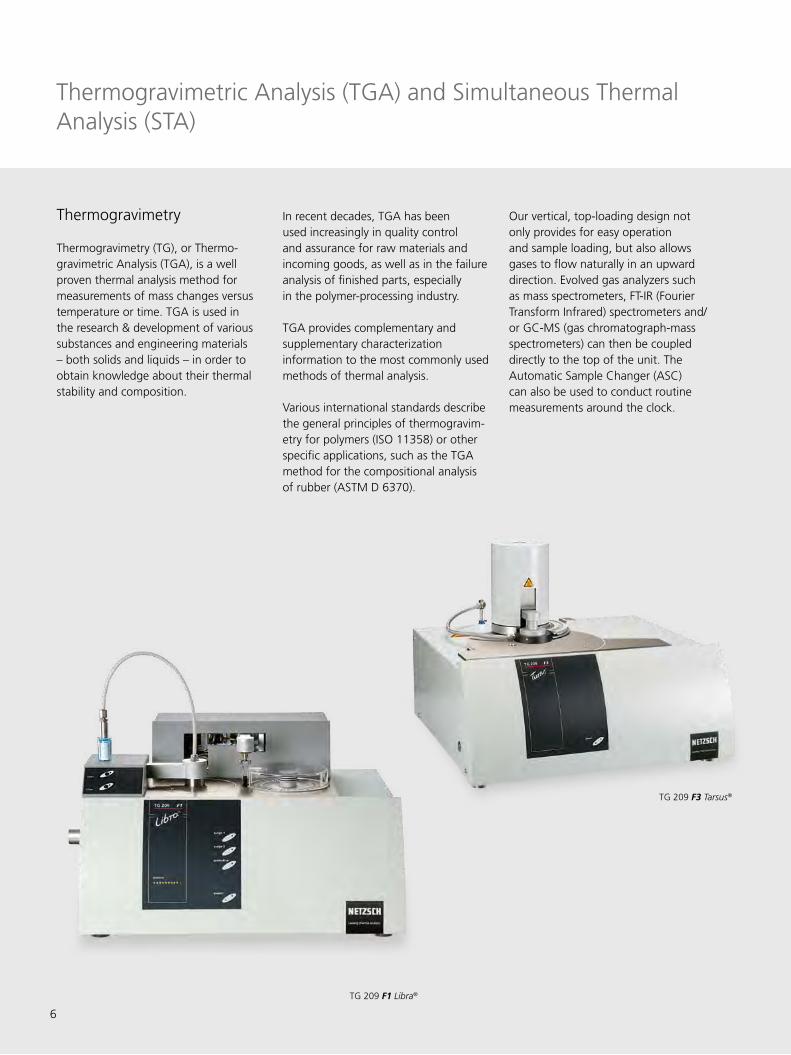
Our vertical, top-loading design not only provides for easy operation and sample loading, but also allows gases to flow naturally in an upward direction. Evolved gas analyzers such as mass spectrometers, FT-IR (Fourier Transform Infrared) spectrometers and/or GC-MS (gas chromatograph-mass spectrometers) can then be coupled directly to the top of the unit. The Automatic Sample Changer (ASC) can also be used to conduct routine measurements around the clock.
TG 209 F3 Tarsus®
TG 209 F1 Libra®
7
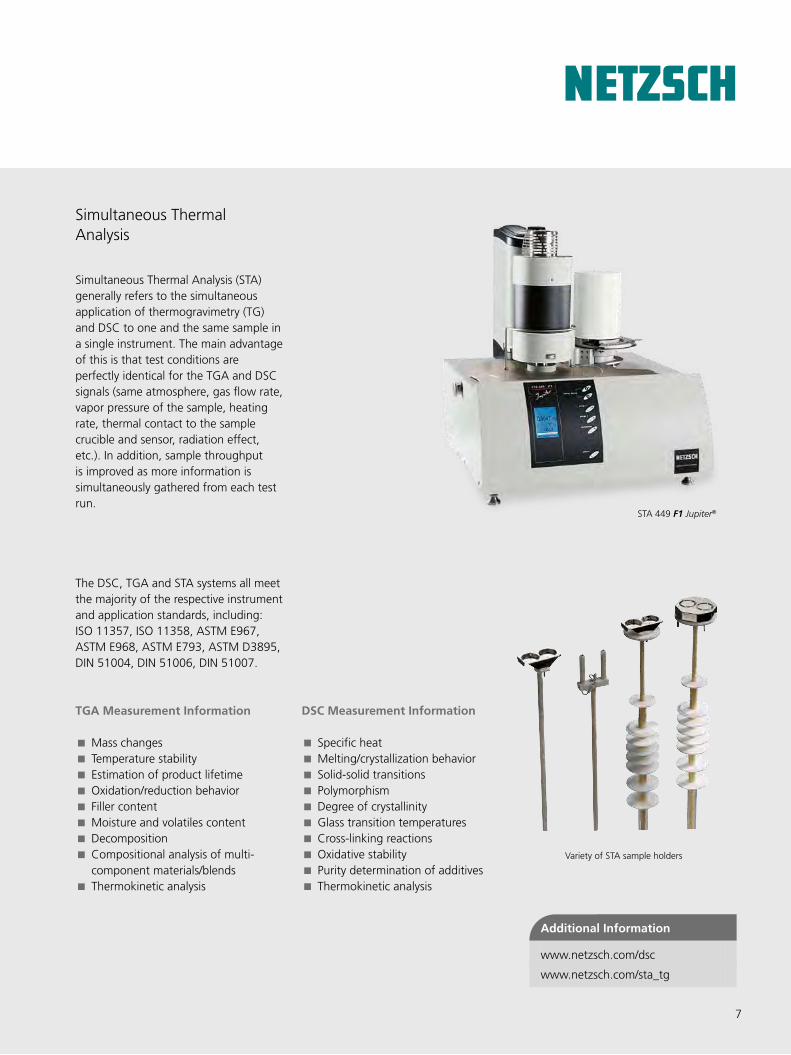
STA 449 F1 Jupiter®
Simultaneous Thermal Analysis
Simultaneous Thermal Analysis (STA) generally refers to the simultaneous application of thermogravimetry (TG) and DSC to one and the same sample in a single instrument. The main advantage of this is that test conditions are perfectly identical for the TGA and DSC signals (same atmosphere, gas flow rate, vapor pressure of the sample, heating rate, thermal contact to the sample crucible and sensor, radiation effect, etc.). In addition, sample throughput is improved as more information is simultaneously gathered from each test run.
The DSC, TGA and STA systems all meet the majority of the respective instrument and application standards, including: ISO 11357, ISO 11358, ASTM E967, ASTM E968, ASTM E793, ASTM D3895, DIN 51004, DIN 51006, DIN 51007.
TGA Measurement Information
� Mass changes � Temperature stability � Estimation of product lifetime � Oxidation/reduction behavior � Filler content � Moisture and volatiles content � Decomposition � Compositional analysis of multi- component materials/blends
� Thermokinetic analysis
DSC Measurement Information
� Specific heat � Melting/crystallization behavior � Solid-solid transitions � Polymorphism � Degree of crystallinity � Glass transition temperatures � Cross-linking reactions � Oxidative stability � Purity determination of additives � Thermokinetic analysis
Variety of STA sample holders
Additional Information
www.netzsch.com/sta_tg
Additional Information
www.netzsch.com/dsc
8
Thermal Analysis Coupled to Evolved Gas Analysis (EGA)
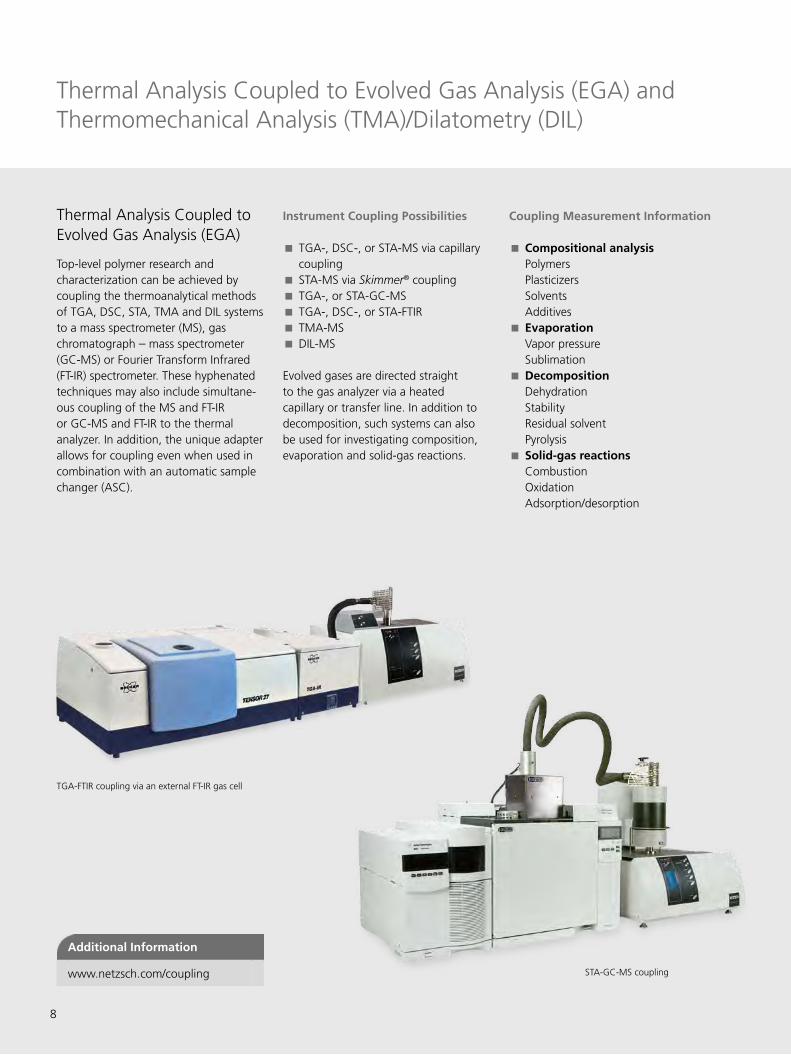
Top-level polymer research and characterization can be achieved by coupling the thermoanalytical methods of TGA, DSC, STA, TMA and DIL systems to a mass spectrometer (MS), gas chromatograph – mass spectrometer (GC-MS) or Fourier Transform Infrared (FT-IR) spectrometer. These hyphenated techniques may also include simultane-ous coupling of the MS and FT-IR or GC-MS and FT-IR to the thermal analyzer. In addition, the unique adapter allows for coupling even when used in combination with an automatic sample changer (ASC).
Instrument Coupling Possibilities
� TGA-, DSC-, or STA-MS via capillary coupling
� STA-MS via Skimmer® coupling � TGA-, or STA-GC-MS � TGA-, DSC-, or STA-FTIR � TMA-MS � DIL-MS
Evolved gases are directed straight to the gas analyzer via a heated capillary or transfer line. In addition to decomposition, such systems can also be used for investigating composition, evaporation and solid-gas reactions.
TGA-FTIR coupling via an external FT-IR gas cell
STA-GC-MS coupling
Coupling Measurement Information
� Compositional analysis Polymers Plasticizers Solvents Additives
� Evaporation Vapor pressure Sublimation
� Decomposition Dehydration Stability Residual solvent Pyrolysis
� Solid-gas reactions Combustion Oxidation Adsorption/desorption
Additional Information
www.netzsch.com/coupling
Thermal Analysis Coupled to Evolved Gas Analysis (EGA) and Thermomechanical Analysis (TMA)/Dilatometry (DIL)
9
Thermomechanical Analysis and Dilatometry
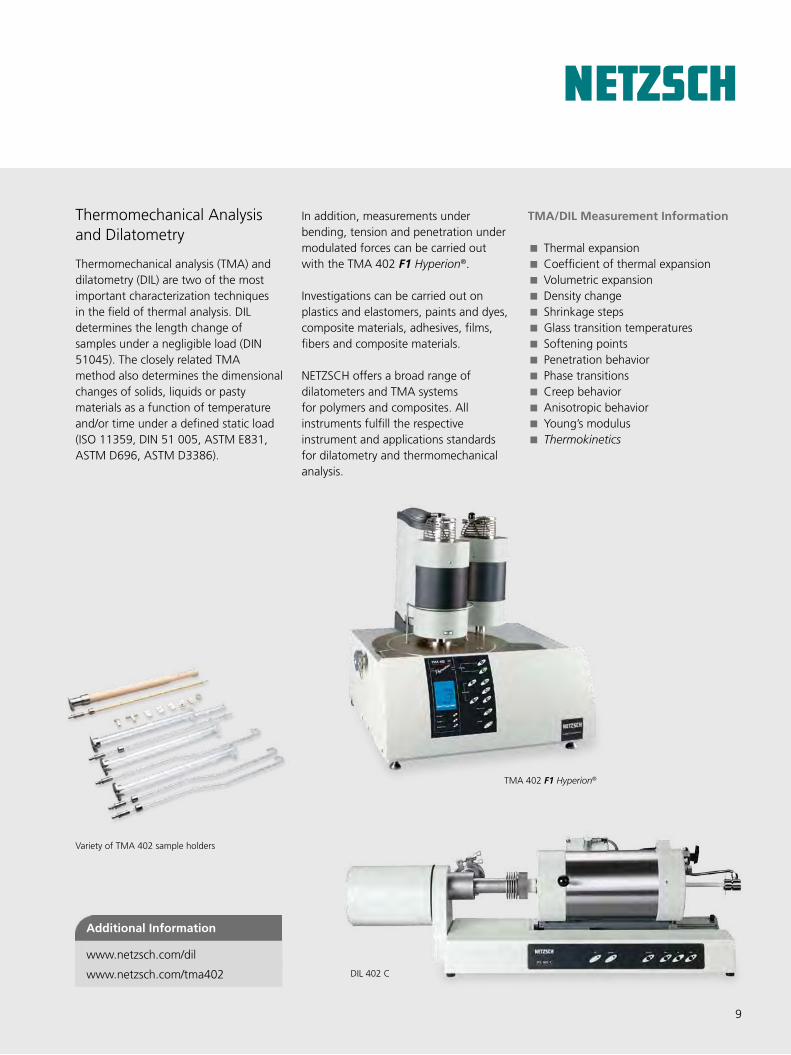
Thermomechanical analysis (TMA) and dilatometry (DIL) are two of the most important characterization techniques in the field of thermal analysis. DIL determines the length change of samples under a negligible load (DIN 51045). The closely related TMA method also determines the dimensional changes of solids, liquids or pasty materials as a function of temperature and/or time under a defined static load (ISO 11359, DIN 51 005, ASTM E831, ASTM D696, ASTM D3386).
In addition, measurements under bending, tension and penetration under modulated forces can be carried out with the TMA 402 F1 Hyperion®.
Investigations can be carried out on plastics and elastomers, paints and dyes, composite materials, adhesives, films, fibers and composite materials.
NETZSCH offers a broad range of dilatometers and TMA systems for polymers and composites. All instruments fulfill the respective instrument and applications standards for dilatometry and thermomechanical analysis.
TMA 402 F1 Hyperion®
DIL 402 C
Variety of TMA 402 sample holders
TMA/DIL Measurement Information
� Thermal expansion � Coefficient of thermal expansion � Volumetric expansion � Density change � Shrinkage steps � Glass transition temperatures � Softening points � Penetration behavior � Phase transitions � Creep behavior � Anisotropic behavior � Young’s modulus � Thermokinetics
Additional Information
www.netzsch.com/tma402
Additional Information
www.netzsch.com/dil
10
Dynamic Mechanical Analysis
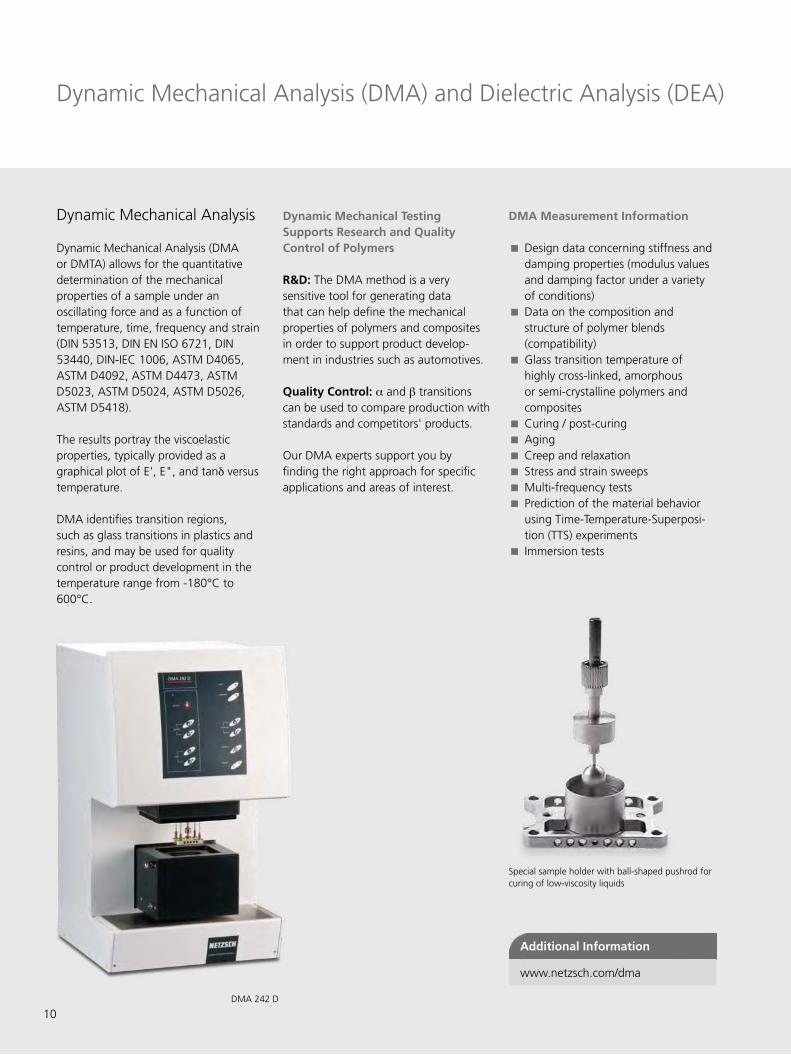
Dynamic Mechanical Analysis (DMA or DMTA) allows for the quantitative determination of the mechanical properties of a sample under an oscillating force and as a function of temperature, time, frequency and strain (DIN 53513, DIN EN ISO 6721, DIN 53440, DIN-IEC 1006, ASTM D4065, ASTM D4092, ASTM D4473, ASTM D5023, ASTM D5024, ASTM D5026, ASTM D5418).
The results portray the viscoelastic properties, typically provided as a graphical plot of E', E", and tand versus temperature.
DMA identifies transition regions, such as glass transitions in plastics and resins, and may be used for quality control or product development in the temperature range from -180°C to 600°C.
Special sample holder with ball-shaped pushrod for curing of low-viscosity liquids
DMA 242 D
Dynamic Mechanical Testing Supports Research and Quality Control of Polymers
R&D: The DMA method is a very sensitive tool for generating data that can help define the mechanical properties of polymers and composites in order to support product develop-ment in industries such as automotives.
Quality Control: a and b transitions can be used to compare production with standards and competitors' products.
Our DMA experts support you by finding the right approach for specific applications and areas of interest.
Additional Information
www.netzsch.com/dma
DMA Measurement Information
� Design data concerning stiffness and damping properties (modulus values and damping factor under a variety of conditions)
� Data on the composition and structure of polymer blends (compatibility)
� Glass transition temperature of highly cross-linked, amorphous or semi-crystalline polymers and composites
� Curing / post-curing � Aging � Creep and relaxation � Stress and strain sweeps � Multi-frequency tests � Prediction of the material behavior using Time-Temperature-Superposi-tion (TTS) experiments
� Immersion tests
Dynamic Mechanical Analysis (DMA) and Dielectric Analysis (DEA)
11
Dielectric Analysis
A variety of questions may arise during the curing process of reactive resins.
� At which temperature, or after how much time, does the resin begin to cure?
� How high is the reactivity?
� When is curing completed?
� Is the curing profile identical for every position in the mold?
� How can the curing cycle be opti-mized in order to save energy and costs?
� Is there any potential for post-curing?
For investigation of the curing behavior of thermosetting resin systems, composite materials, adhesives and paints, dielectric analysis (DEA) in accordance with ASTM E2038 or E2039 has stood the test of time.
DEA allows for the measurement of changes in the dielectric properties during curing. The liquid or pasty resin must be placed in direct contact with
two electrodes comprising the dielectric sensor. A sinusoidal voltage (excitation) is applied and the resulting current (response) is measured, along with the phase shift between voltage and current. These values are then used to determine the ion mobility (ion conductivity) and the alignment of dipoles. In turn, the dielectric properties of permittivity e’ and loss factor e"are calculated from these effects. Of primary interest with regard to curing is the ion viscosity. This is the reciprocal value of the ion conductivity, which is proportional to the loss factor.
Use of the DEA technique is not limited to the lab environment; it can also be applied to in-situ curing in the mold under processing conditions. For production monitoring and process control, a specific ion viscosity value can be programmed to trigger de-molding when the part being produced is sufficiently cured. This reduces cycle times and increases throughput, thereby lowering costs and potentially allowing lower prices to be charged for the finished part.
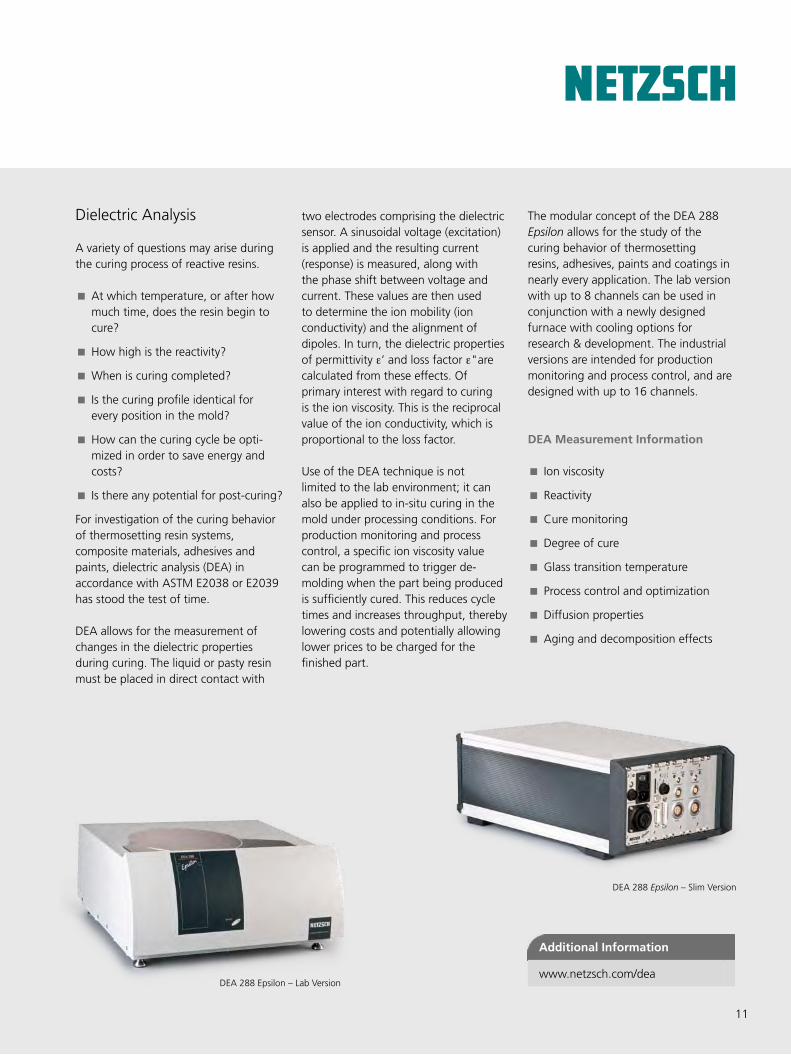
The modular concept of the DEA 288 Epsilon allows for the study of the curing behavior of thermosettingresins, adhesives, paints and coatings in nearly every application. The lab version with up to 8 channels can be used in conjunction with a newly designed furnace with cooling options for research & development. The industrial versions are intended for production monitoring and process control, and are designed with up to 16 channels.
DEA Measurement Information
� Ion viscosity
� Reactivity
� Cure monitoring
� Degree of cure
� Glass transition temperature
� Process control and optimization
� Diffusion properties
� Aging and decomposition effects
DEA 288 Epsilon – Lab Version
DEA 288 Epsilon – Slim Version
Additional Information
www.netzsch.com/dea
12
The Thermokinetics Advanced Software Module
Having an understanding of the behavior of various polymers under different temperature and pressure conditions is crucial when producing polymer materials which must have specific final properties, in order to ensure that material failure does not occur when used in its intended application.
Today, many different polymer types are appearing on the market which might be considered to exhibit improved behavior over former materials or to meet new application requirements. However, their thermal behavior might prove critical during the production process or later as a finished part. Time- and temperature-dependent
curing reactions play an important role. Fluctuations in the curing agent may occur and require special attention.
The NETZSCH Thermokinetics Advanced Software module is capable of creating kinetic models of any chemical processes for which the reaction (e.g., cross-linking, curing, decomposition) is a function of temperature and time. It can also be used to predict the behavior of chemical systems for user-defined temperature conditions and to achieve process optimization.
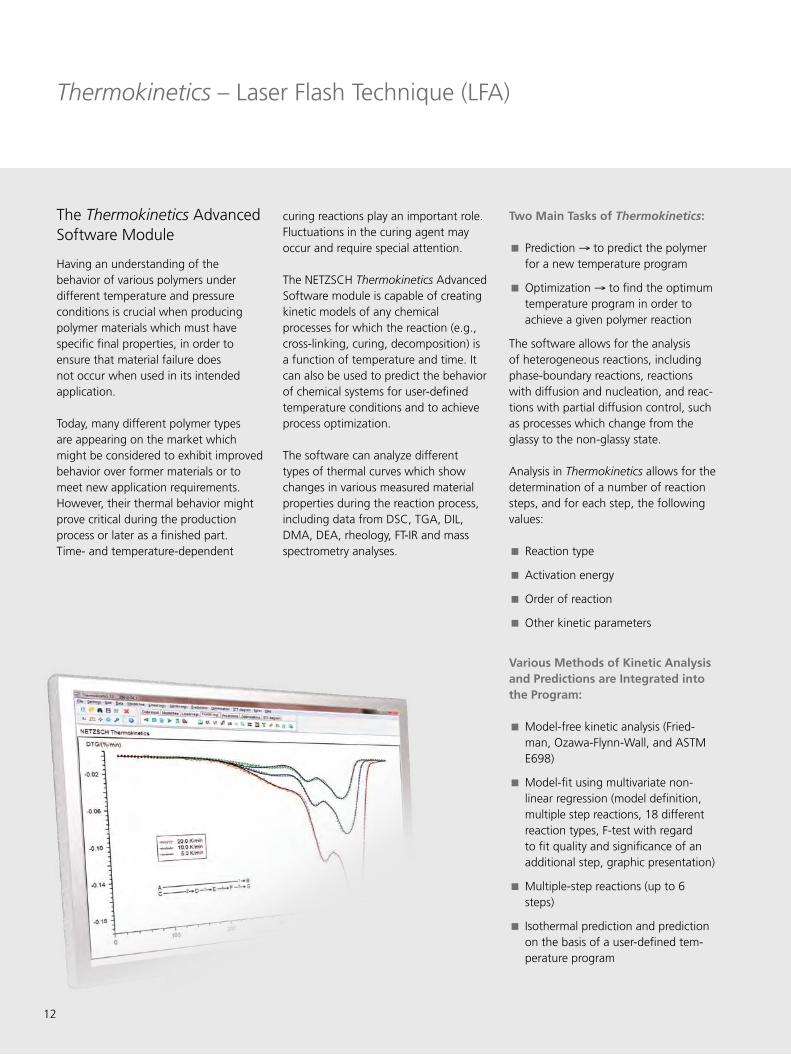
The software can analyze different types of thermal curves which show changes in various measured material properties during the reaction process, including data from DSC, TGA, DIL, DMA, DEA, rheology, FT-IR and mass spectrometry analyses.
Two Main Tasks of Thermokinetics:
� Prediction → to predict the polymer for a new temperature program
� Optimization → to find the optimum temperature program in order to achieve a given polymer reaction
The software allows for the analysis of heterogeneous reactions, including phase-boundary reactions, reactions with diffusion and nucleation, and reac-tions with partial diffusion control, such as processes which change from the glassy to the non-glassy state.
Analysis in Thermokinetics allows for the determination of a number of reaction steps, and for each step, the following values:
� Reaction type
� Activation energy
� Order of reaction
� Other kinetic parameters
Various Methods of Kinetic Analysis and Predictions are Integrated into the Program:
� Model-free kinetic analysis (Fried-man, Ozawa-Flynn-Wall, and ASTM E698)
� Model-fit using multivariate non-linear regression (model definition, multiple step reactions, 18 different reaction types, F-test with regard to fit quality and significance of an additional step, graphic presentation)
� Multiple-step reactions (up to 6 steps)
� Isothermal prediction and prediction on the basis of a user-defined tem-perature program
Thermokinetics – Laser Flash Technique (LFA)
13
Laser Flash Technique (LFA)
Thermal conductivity and thermal diffusivity are the most important thermophysical material parameters for describing the heat transport properties of a material or component.
During development and quality control, the extent to which materials fulfill their performance expectations is continuously scrutinized. Some of the questions which arise include:
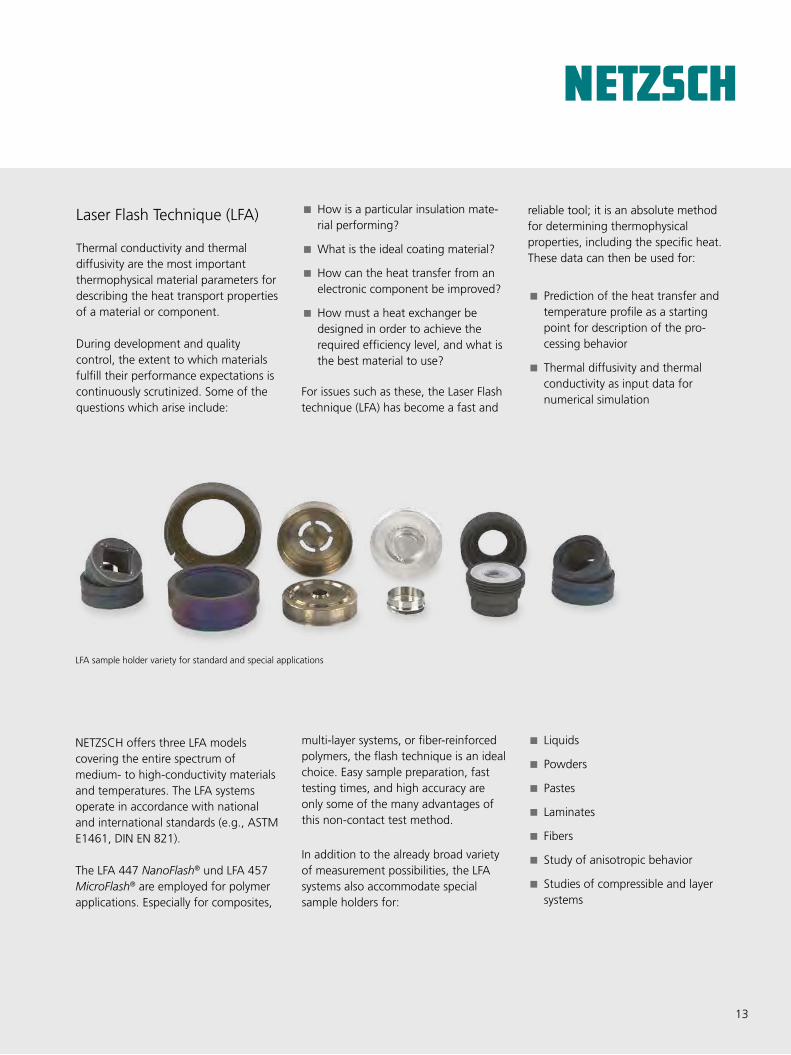
NETZSCH offers three LFA models covering the entire spectrum of medium- to high-conductivity materials and temperatures. The LFA systems operate in accordance with national and international standards (e.g., ASTM E1461, DIN EN 821).
The LFA 447 NanoFlash® und LFA 457 MicroFlash® are employed for polymer applications. Especially for composites,
multi-layer systems, or fiber-reinforced polymers, the flash technique is an ideal choice. Easy sample preparation, fast testing times, and high accuracy are only some of the many advantages of this non-contact test method.
In addition to the already broad variety of measurement possibilities, the LFA systems also accommodate special sample holders for:
LFA sample holder variety for standard and special applications
� Liquids
� Powders
� Pastes
� Laminates
� Fibers
� Study of anisotropic behavior
� Studies of compressible and layer systems
reliable tool; it is an absolute method for determining thermophysical properties, including the specific heat. These data can then be used for:
� Prediction of the heat transfer and temperature profile as a starting point for description of the pro-cessing behavior
� Thermal diffusivity and thermal conductivity as input data for numerical simulation
� How is a particular insulation mate-rial performing?
� What is the ideal coating material?
� How can the heat transfer from an electronic component be improved?
� How must a heat exchanger be designed in order to achieve the required efficiency level, and what is the best material to use?
For issues such as these, the Laser Flash technique (LFA) has become a fast and
14
LFA
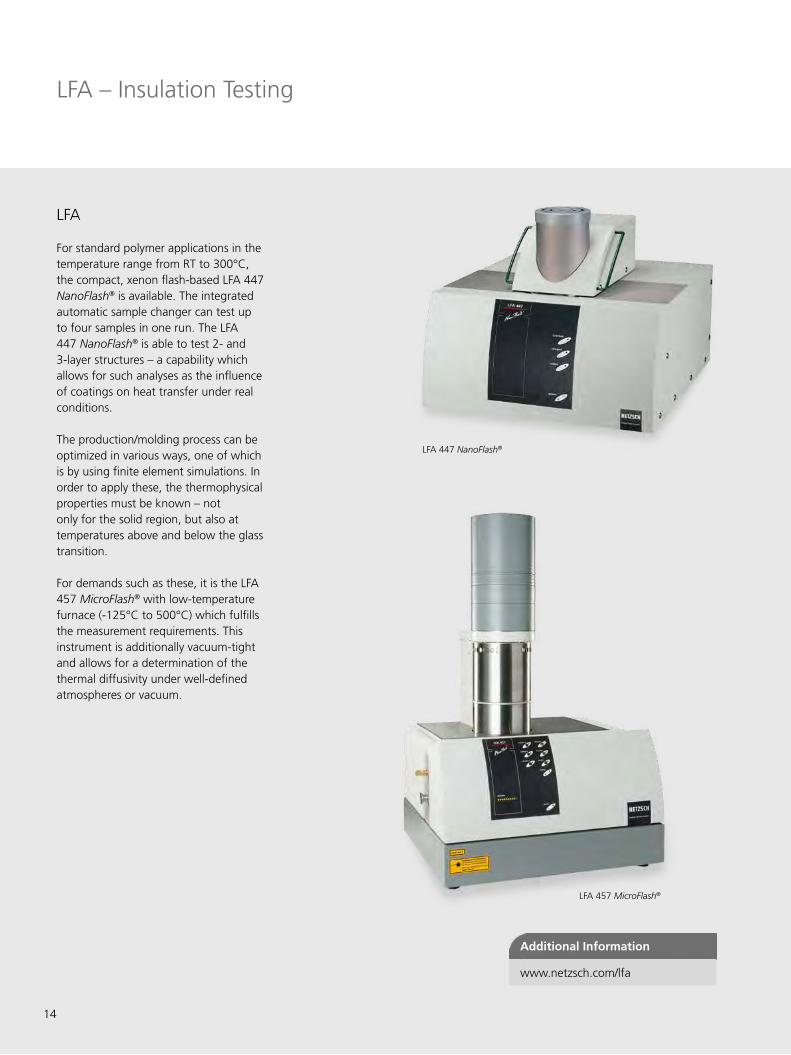
For standard polymer applications in the temperature range from RT to 300°C, the compact, xenon flash-based LFA 447 NanoFlash® is available. The integrated automatic sample changer can test up to four samples in one run. The LFA 447 NanoFlash® is able to test 2- and 3-layer structures – a capability which allows for such analyses as the influence of coatings on heat transfer under real conditions.
The production/molding process can be optimized in various ways, one of which is by using finite element simulations. In order to apply these, the thermophysical properties must be known – not only for the solid region, but also at temperatures above and below the glass transition.
For demands such as these, it is the LFA 457 MicroFlash® with low-temperature furnace (-125°C to 500°C) which fulfills the measurement requirements. This instrument is additionally vacuum-tight and allows for a determination of the thermal diffusivity under well-defined atmospheres or vacuum.
LFA 447 NanoFlash®
LFA 457 MicroFlash®
Additional Information
www.netzsch.com/lfa
LFA – Insulation Testing
15
Materials with low thermal conductivi-ties, such as insulators, can be tested in a Heat Flow Meter (HFM) or Guarded Hot Plate (GHP).
All NETZSCH HFM and GHP instruments are based on all respective application and industry standards:
� ASTM C177, ASTM C335-05Ae1, ASTM C1363-05, ASTM D5470-06, ASTM E1530-06, ASTM F433-02(2009), ASTM C1363-05
� DIN EN 12667/12939, DIN EN 13163
� ISO 8301, ISO 8302, ISO 8894-1 (EN 993-14), ISO 8894-2 (EN 993-15)
� JIS A 1412
Heat Flow Meters
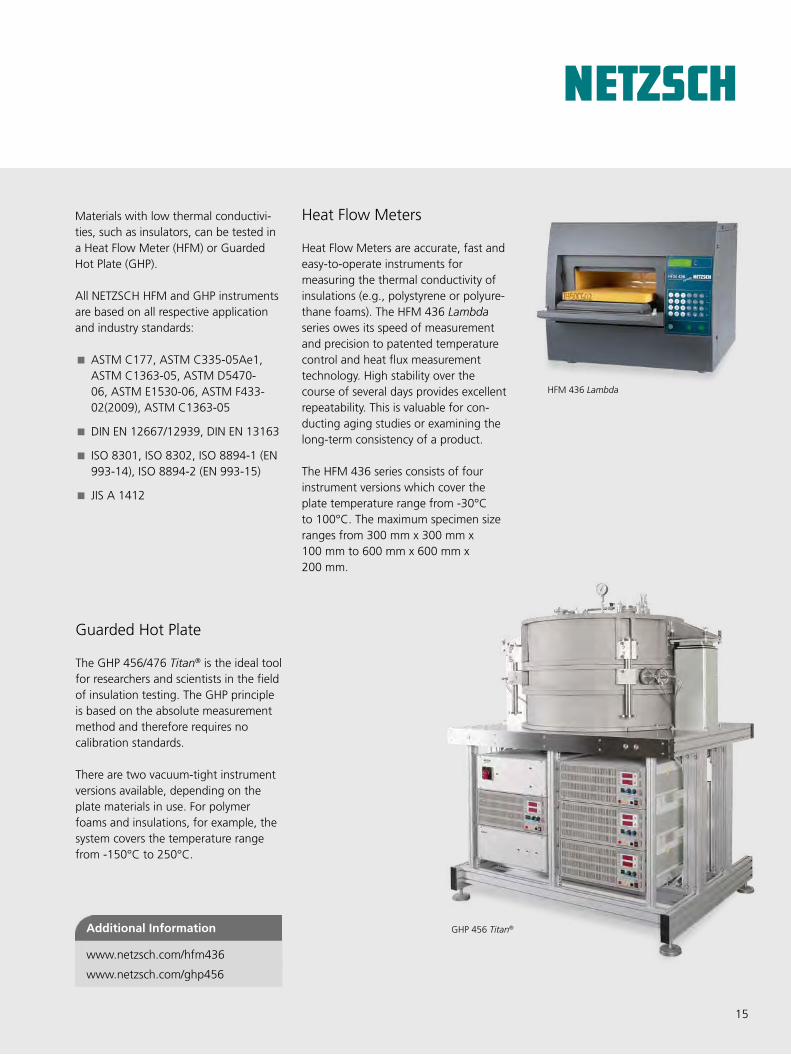
Heat Flow Meters are accurate, fast and easy-to-operate instruments for measuring the thermal conductivity of insulations (e.g., polystyrene or polyure-thane foams). The HFM 436 Lambda series owes its speed of measurement and precision to patented temperature control and heat flux measurement technology. High stability over the course of several days provides excellent repeatability. This is valuable for con-ducting aging studies or examining the long-term consistency of a product.
The HFM 436 series consists of four instrument versions which cover the plate temperature range from -30°C to 100°C. The maximum specimen size ranges from 300 mm x 300 mm x 100 mm to 600 mm x 600 mm x 200 mm.
HFM 436 Lambda
GHP 456 Titan®
Guarded Hot Plate
The GHP 456/476 Titan® is the ideal tool for researchers and scientists in the field of insulation testing. The GHP principle is based on the absolute measurement method and therefore requires no calibration standards.
There are two vacuum-tight instrument versions available, depending on the plate materials in use. For polymer foams and insulations, for example, the system covers the temperature range from -150°C to 250°C.
Additional Information
www.netzsch.com/ghp456
Additional Information
www.netzsch.com/hfm436
16
Thermoplastics
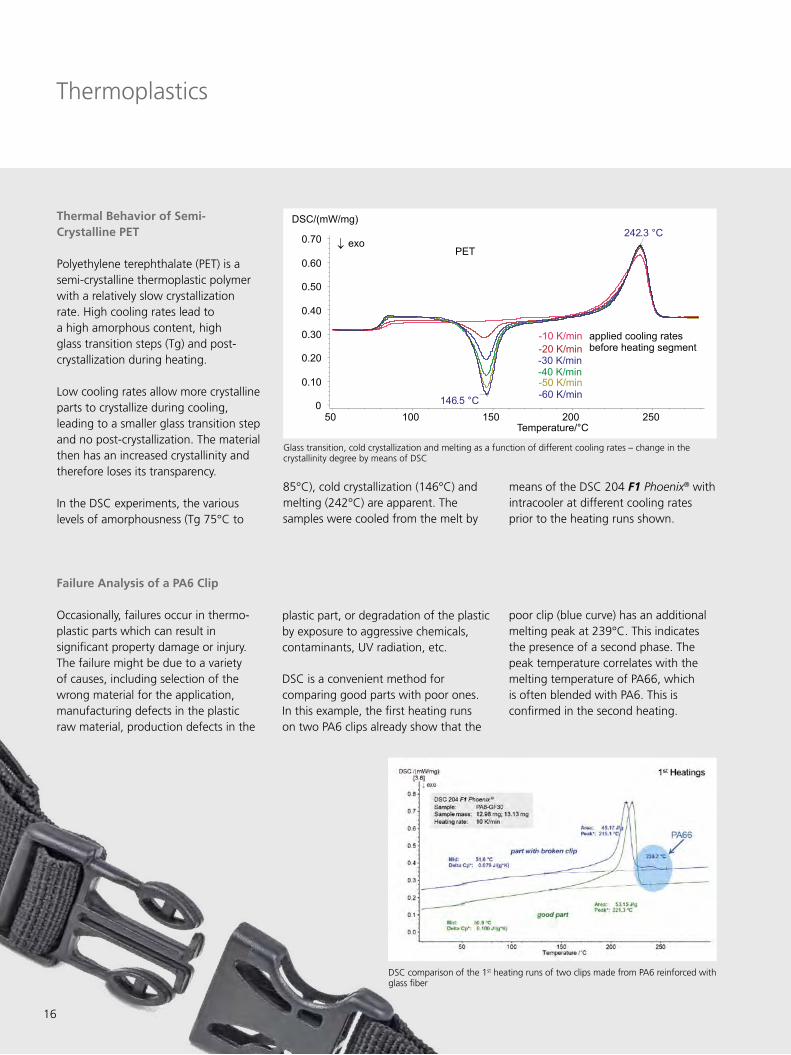
Failure Analysis of a PA6 Clip
Occasionally, failures occur in thermo-plastic parts which can result in significant property damage or injury. The failure might be due to a variety of causes, including selection of the wrong material for the application, manufacturing defects in the plastic raw material, production defects in the
DSC comparison of the 1st heating runs of two clips made from PA6 reinforced withglass fiber
plastic part, or degradation of the plastic by exposure to aggressive chemicals, contaminants, UV radiation, etc.
DSC is a convenient method for comparing good parts with poor ones. In this example, the first heating runs on two PA6 clips already show that the
Thermal Behavior of Semi-Crystalline PET
Polyethylene terephthalate (PET) is a semi-crystalline thermoplastic polymer with a relatively slow crystallization rate. High cooling rates lead to a high amorphous content, high glass transition steps (Tg) and post-crystallization during heating.
Low cooling rates allow more crystalline parts to crystallize during cooling, leading to a smaller glass transition step and no post-crystallization. The material then has an increased crystallinity and therefore loses its transparency.
In the DSC experiments, the various levels of amorphousness (Tg 75°C to
Glass transition, cold crystallization and melting as a function of different cooling rates – change in the crystallinity degree by means of DSC
means of the DSC 204 F1 Phoenix® with intracooler at different cooling rates prior to the heating runs shown.
85°C), cold crystallization (146°C) and melting (242°C) are apparent. The samples were cooled from the melt by
poor clip (blue curve) has an additional melting peak at 239°C. This indicates the presence of a second phase. The peak temperature correlates with the melting temperature of PA66, which is often blended with PA6. This is confirmed in the second heating.
17
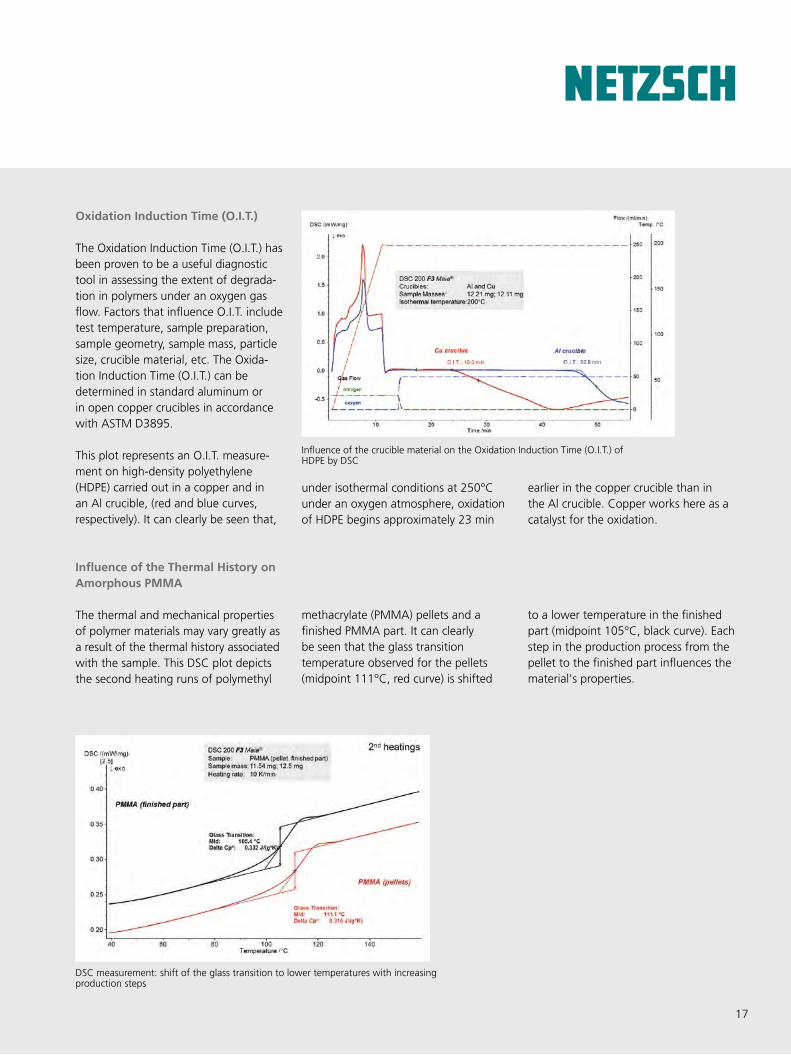
Oxidation Induction Time (O.I.T.)
The Oxidation Induction Time (O.I.T.) has been proven to be a useful diagnostic tool in assessing the extent of degrada-tion in polymers under an oxygen gas flow. Factors that influence O.I.T. include test temperature, sample preparation, sample geometry, sample mass, particle size, crucible material, etc. The Oxida-tion Induction Time (O.I.T.) can be determined in standard aluminum or in open copper crucibles in accordance with ASTM D3895.
This plot represents an O.I.T. measure-ment on high-density polyethylene (HDPE) carried out in a copper and in an Al crucible, (red and blue curves, respectively). It can clearly be seen that,
Influence of the crucible material on the Oxidation Induction Time (O.I.T.) of HDPE by DSC
Influence of the Thermal History on Amorphous PMMA
The thermal and mechanical propertiesof polymer materials may vary greatly as a result of the thermal history associatedwith the sample. This DSC plot depicts the second heating runs of polymethyl
DSC measurement: shift of the glass transition to lower temperatures with increasingproduction steps
under isothermal conditions at 250°C under an oxygen atmosphere, oxidation of HDPE begins approximately 23 min
earlier in the copper crucible than in the Al crucible. Copper works here as a catalyst for the oxidation.
methacrylate (PMMA) pellets and a finished PMMA part. It can clearly be seen that the glass transition temperature observed for the pellets (midpoint 111°C, red curve) is shifted
to a lower temperature in the finished part (midpoint 105°C, black curve). Each step in the production process from the pellet to the finished part influences the material's properties.
18
DSC / (mW/mg)
Mid: -28.3°C∆Cp: 0.205 J/(gK)
Mid: 55.1°C∆Cp: 0.179 J/(gK)
30.17 J/(gK)144.2°C
196.0°C-2.82 J/g
224.5°C
220.4°C
51.41 J/g
Temperature / °C
0.5
1.0
1.5
2.0
-50 50 100 150 200 2500
exoDSC 204 F1 Phoenix®
Sample: PA6Sample mass: 9.4 mgHeating rate: 20 K/minAtmosphere: N2
Thermoplastics
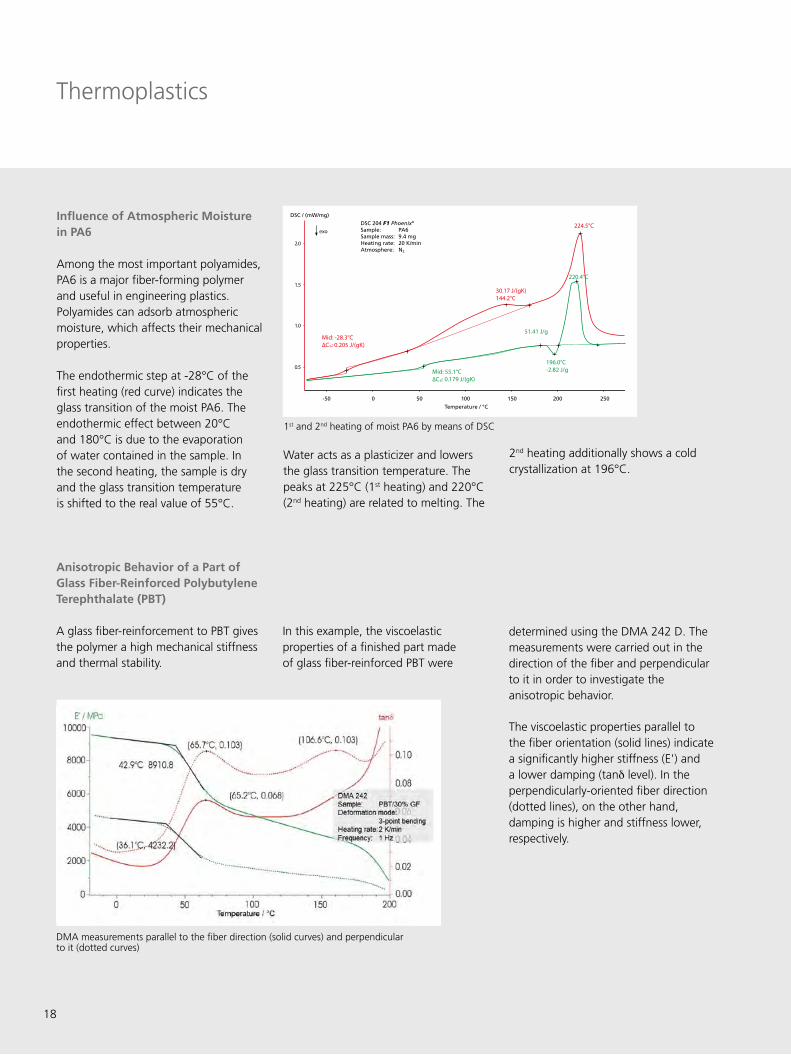
Influence of Atmospheric Moisture in PA6
Among the most important polyamides, PA6 is a major fiber-forming polymer and useful in engineering plastics. Polyamides can adsorb atmospheric moisture, which affects their mechanical properties.
The endothermic step at -28°C of the first heating (red curve) indicates the glass transition of the moist PA6. The endothermic effect between 20°C and 180°C is due to the evaporation of water contained in the sample. In the second heating, the sample is dry and the glass transition temperature is shifted to the real value of 55°C.
Anisotropic Behavior of a Part of Glass Fiber-Reinforced Polybutylene Terephthalate (PBT)
A glass fiber-reinforcement to PBT gives the polymer a high mechanical stiffness and thermal stability.
1st and 2nd heating of moist PA6 by means of DSC
DMA measurements parallel to the fiber direction (solid curves) and perpendicular to it (dotted curves)
Water acts as a plasticizer and lowers the glass transition temperature. The peaks at 225°C (1st heating) and 220°C (2nd heating) are related to melting. The
2nd heating additionally shows a cold crystallization at 196°C.
In this example, the viscoelastic properties of a finished part made of glass fiber-reinforced PBT were
determined using the DMA 242 D. The measurements were carried out in the direction of the fiber and perpendicular to it in order to investigate the anisotropic behavior.
The viscoelastic properties parallel to the fiber orientation (solid lines) indicate a significantly higher stiffness (E') and a lower damping (tand level). In the perpendicularly-oriented fiber direction (dotted lines), on the other hand, damping is higher and stiffness lower, respectively.
19
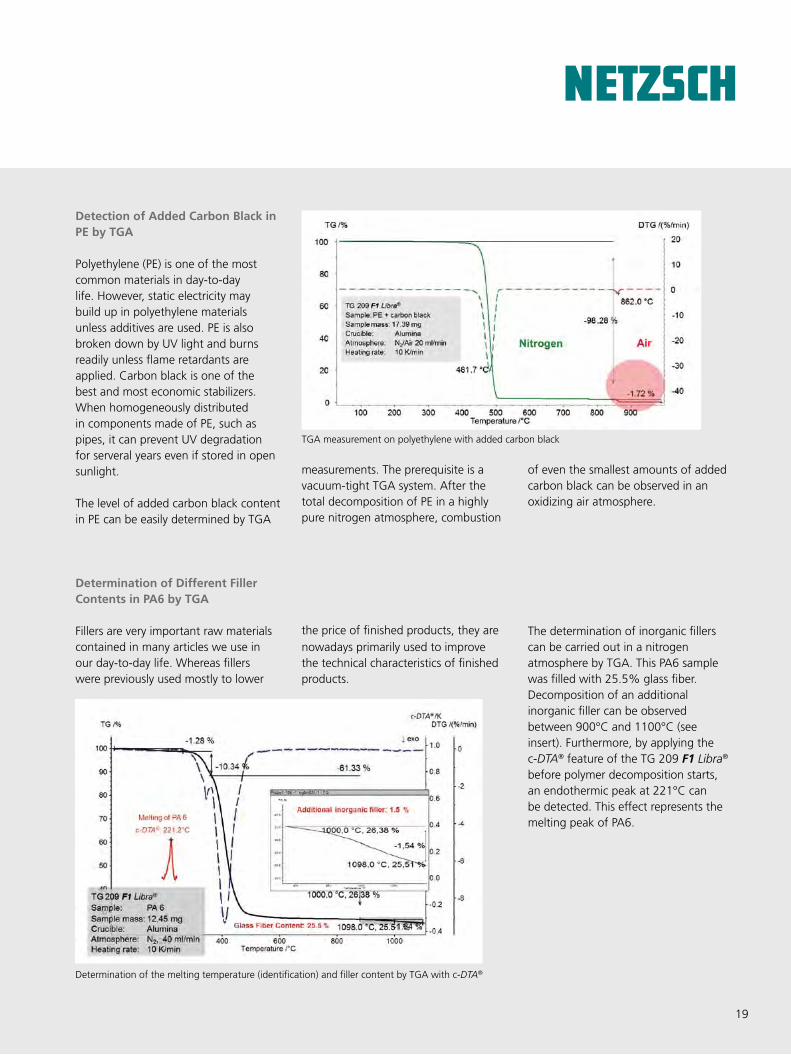
Detection of Added Carbon Black in PE by TGA
Polyethylene (PE) is one of the most common materials in day-to-day life. However, static electricity may build up in polyethylene materials unless additives are used. PE is also broken down by UV light and burns readily unless flame retardants are applied. Carbon black is one of the best and most economic stabilizers. When homogeneously distributed in components made of PE, such as pipes, it can prevent UV degradation for serveral years even if stored in open sunlight.
The level of added carbon black content in PE can be easily determined by TGA
Determination of Different Filler Contents in PA6 by TGA
Fillers are very important raw materialscontained in many articles we use inour day-to-day life. Whereas fillerswere previously used mostly to lower
TGA measurement on polyethylene with added carbon black
Determination of the melting temperature (identification) and filler content by TGA with c-DTA®
the price of finished products, they arenowadays primarily used to improvethe technical characteristics of finishedproducts.
The determination of inorganic fillerscan be carried out in a nitrogenatmosphere by TGA. This PA6 samplewas filled with 25.5% glass fiber.Decomposition of an additionalinorganic filler can be observedbetween 900°C and 1100°C (seeinsert). Furthermore, by applying thec-DTA® feature of the TG 209 F1 Libra® before polymer decomposition starts,an endothermic peak at 221°C canbe detected. This effect represents themelting peak of PA6.
measurements. The prerequisite is a vacuum-tight TGA system. After the total decomposition of PE in a highly pure nitrogen atmosphere, combustion
of even the smallest amounts of added carbon black can be observed in an oxidizing air atmosphere.
20
Thermoplastics
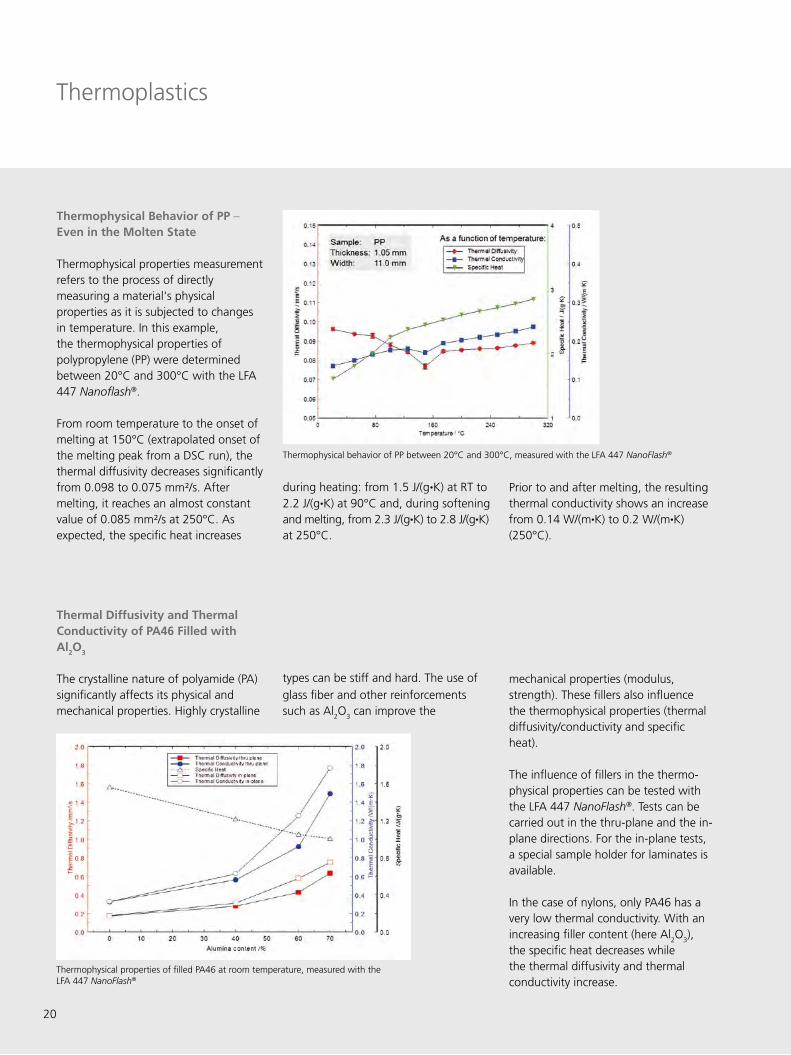
Thermophysical Behavior of PP – Even in the Molten State
Thermophysical properties measurementrefers to the process of directlymeasuring a material's physicalproperties as it is subjected to changesin temperature. In this example,the thermophysical properties ofpolypropylene (PP) were determinedbetween 20°C and 300°C with the LFA 447 Nanoflash®.
From room temperature to the onset ofmelting at 150°C (extrapolated onset ofthe melting peak from a DSC run), thethermal diffusivity decreases significantlyfrom 0.098 to 0.075 mm²/s. Aftermelting, it reaches an almost constantvalue of 0.085 mm²/s at 250°C. Asexpected, the specific heat increases
Thermal Diffusivity and Thermal Conductivity of PA46 Filled with Al2O3
The crystalline nature of polyamide (PA)significantly affects its physical andmechanical properties. Highly crystalline
Thermophysical behavior of PP between 20°C and 300°C, measured with the LFA 447 NanoFlash®
Thermophysical properties of filled PA46 at room temperature, measured with the LFA 447 NanoFlash®
during heating: from 1.5 J/(g•K) at RT to2.2 J/(g•K) at 90°C and, during softeningand melting, from 2.3 J/(g•K) to 2.8 J/(g•K)at 250°C.
Prior to and after melting, the resultingthermal conductivity shows an increasefrom 0.14 W/(m•K) to 0.2 W/(m•K) (250°C).
types can be stiff and hard. The use of
glass fiber and other reinforcementssuch as Al
2O
3 can improve the
mechanical properties (modulus,strength). These fillers also influencethe thermophysical properties (thermaldiffusivity/conductivity and specificheat).
The influence of fillers in the thermo-physical properties can be tested withthe LFA 447 NanoFlash®. Tests can becarried out in the thru-plane and the in-plane directions. For the in-plane tests,a special sample holder for laminates isavailable.
In the case of nylons, only PA46 has avery low thermal conductivity. With anincreasing filler content (here Al
2O
3),
the specific heat decreases whilethe thermal diffusivity and thermalconductivity increase.
21
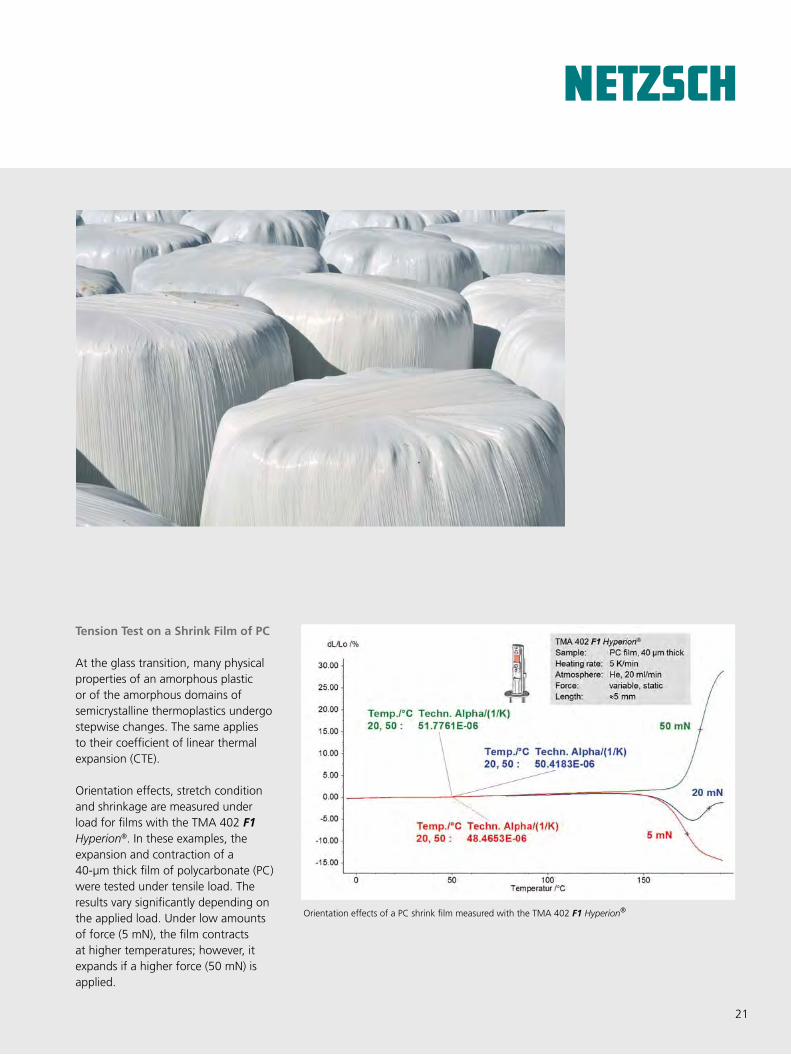
Tension Test on a Shrink Film of PC
At the glass transition, many physicalproperties of an amorphous plasticor of the amorphous domains ofsemicrystalline thermoplastics undergostepwise changes. The same appliesto their coefficient of linear thermalexpansion (CTE).
Orientation effects, stretch conditionand shrinkage are measured underload for films with the TMA 402 F1 Hyperion®. In these examples, theexpansion and contraction of a40-μm thick film of polycarbonate (PC)were tested under tensile load. Theresults vary significantly depending onthe applied load. Under low amountsof force (5 mN), the film contractsat higher temperatures; however, itexpands if a higher force (50 mN) isapplied.
Orientation effects of a PC shrink film measured with the TMA 402 F1 Hyperion®
2222
Thermoplastics – Thermoplastic Elastomers
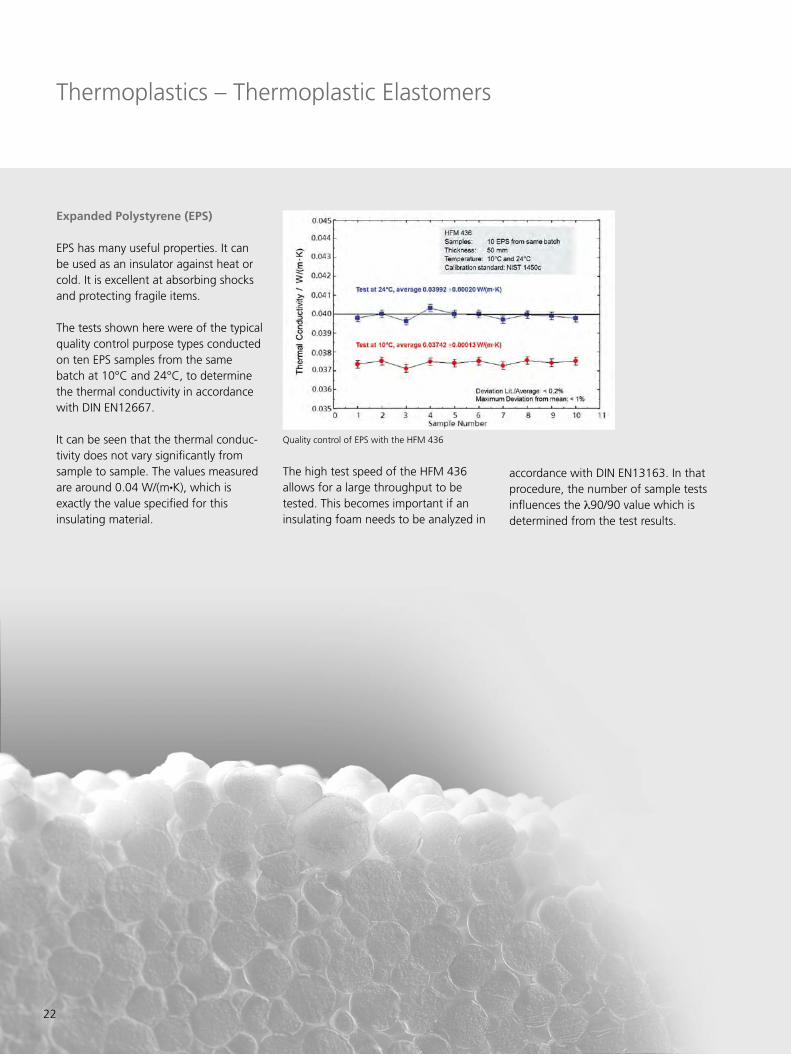
Expanded Polystyrene (EPS)
EPS has many useful properties. It canbe used as an insulator against heat orcold. It is excellent at absorbing shocksand protecting fragile items.
The tests shown here were of the typicalquality control purpose types conductedon ten EPS samples from the samebatch at 10°C and 24°C, to determinethe thermal conductivity in accordancewith DIN EN12667.
It can be seen that the thermal conduc-tivity does not vary significantly fromsample to sample. The values measuredare around 0.04 W/(m•K), which isexactly the value specified for thisinsulating material.
Quality control of EPS with the HFM 436
The high test speed of the HFM 436allows for a large throughput to betested. This becomes important if aninsulating foam needs to be analyzed in
accordance with DIN EN13163. In that procedure, the number of sample tests influences the l90/90 value which is determined from the test results.
23
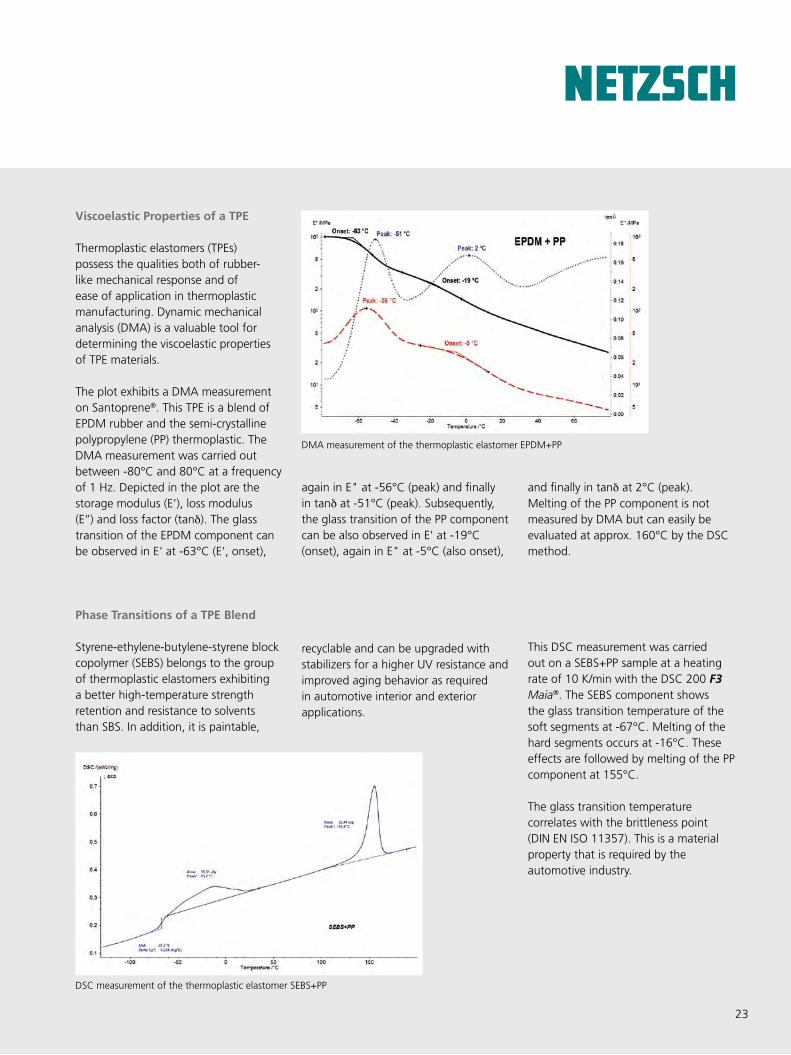
Viscoelastic Properties of a TPE
Thermoplastic elastomers (TPEs)possess the qualities both of rubber-like mechanical response and ofease of application in thermoplasticmanufacturing. Dynamic mechanicalanalysis (DMA) is a valuable tool fordetermining the viscoelastic propertiesof TPE materials.
The plot exhibits a DMA measurement on Santoprene®. This TPE is a blend ofEPDM rubber and the semi-crystallinepolypropylene (PP) thermoplastic. TheDMA measurement was carried outbetween -80°C and 80°C at a frequencyof 1 Hz. Depicted in the plot are thestorage modulus (E’), loss modulus(E’’) and loss factor (tand). The glasstransition of the EPDM component canbe observed in E' at -63°C (E’, onset),
Phase Transitions of a TPE Blend
Styrene-ethylene-butylene-styrene blockcopolymer (SEBS) belongs to the groupof thermoplastic elastomers exhibitinga better high-temperature strengthretention and resistance to solventsthan SBS. In addition, it is paintable,
DMA measurement of the thermoplastic elastomer EPDM+PP
DSC measurement of the thermoplastic elastomer SEBS+PP
again in E" at -56°C (peak) and finally in tand at -51°C (peak). Subsequently, the glass transition of the PP component can be also observed in E' at -19°C (onset), again in E" at -5°C (also onset),
and finally in tand at 2°C (peak). Melting of the PP component is not measured by DMA but can easily be evaluated at approx. 160°C by the DSC method.
recyclable and can be upgraded with stabilizers for a higher UV resistance and improved aging behavior as required in automotive interior and exterior applications.
This DSC measurement was carried out on a SEBS+PP sample at a heating rate of 10 K/min with the DSC 200 F3 Maia®. The SEBS component shows the glass transition temperature of the soft segments at -67°C. Melting of the hard segments occurs at -16°C. These effects are followed by melting of the PP component at 155°C.
The glass transition temperature correlates with the brittleness point (DIN EN ISO 11357). This is a material property that is required by the automotive industry.
24
DSC measurements on NBR with different plasticizer contents
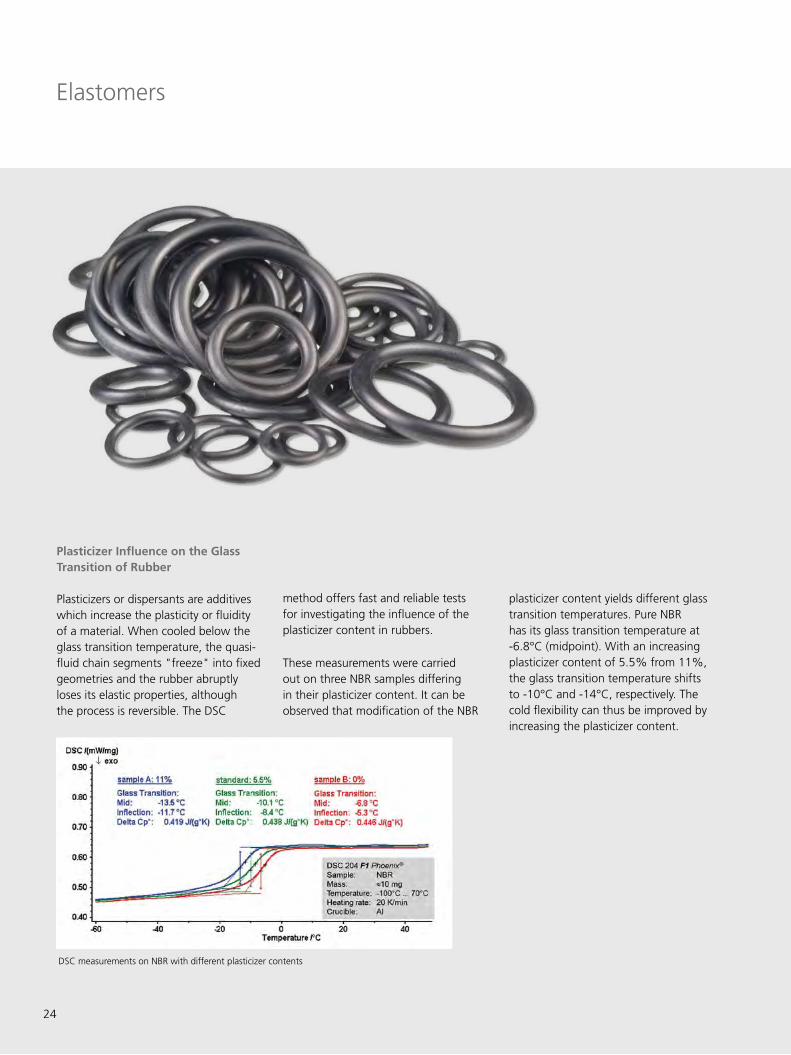
Plasticizer Influence on the Glass Transition of Rubber
Plasticizers or dispersants are additives which increase the plasticity or fluidity of a material. When cooled below the glass transition temperature, the quasi-fluid chain segments "freeze" into fixed geometries and the rubber abruptly loses its elastic properties, although the process is reversible. The DSC
method offers fast and reliable tests for investigating the influence of the plasticizer content in rubbers.
These measurements were carried out on three NBR samples differing in their plasticizer content. It can be observed that modification of the NBR
plasticizer content yields different glass transition temperatures. Pure NBR has its glass transition temperature at -6.8°C (midpoint). With an increasing plasticizer content of 5.5% from 11%, the glass transition temperature shifts to -10°C and -14°C, respectively. The cold flexibility can thus be improved by increasing the plasticizer content.
Elastomers
25
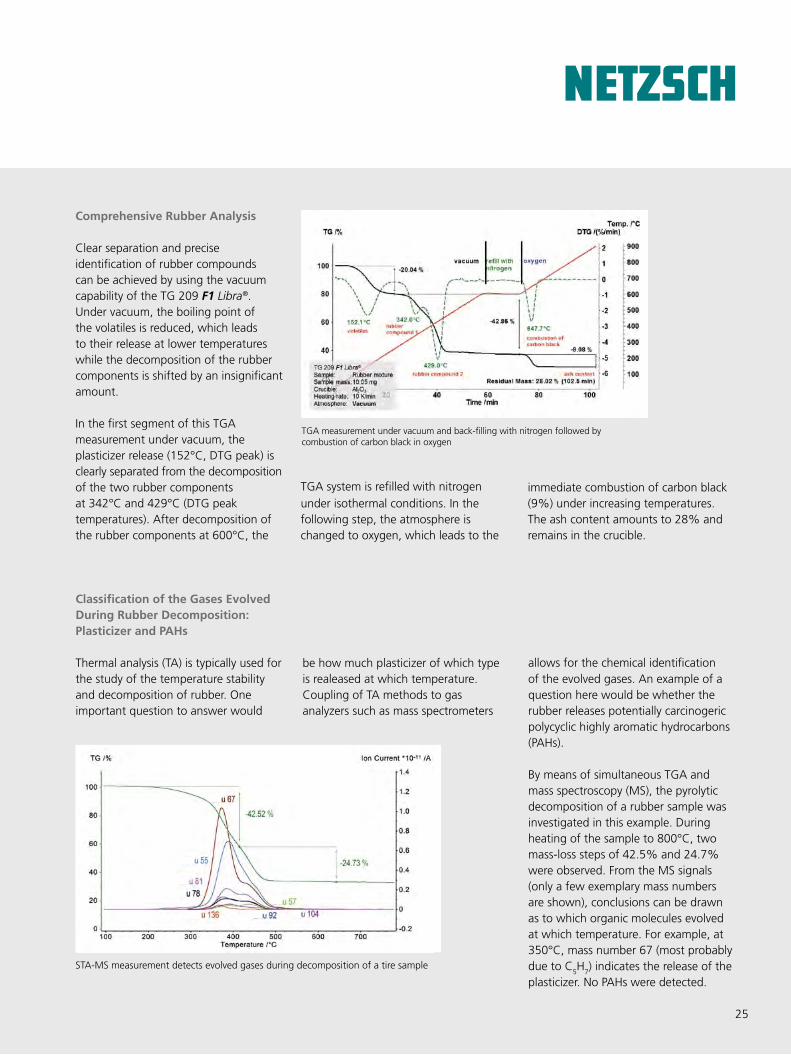
Comprehensive Rubber Analysis
Clear separation and preciseidentification of rubber compoundscan be achieved by using the vacuumcapability of the TG 209 F1 Libra®.Under vacuum, the boiling point ofthe volatiles is reduced, which leadsto their release at lower temperatureswhile the decomposition of the rubbercomponents is shifted by an insignificantamount.
In the first segment of this TGAmeasurement under vacuum, theplasticizer release (152°C, DTG peak) isclearly separated from the decompositionof the two rubber componentsat 342°C and 429°C (DTG peaktemperatures). After decomposition ofthe rubber components at 600°C, the
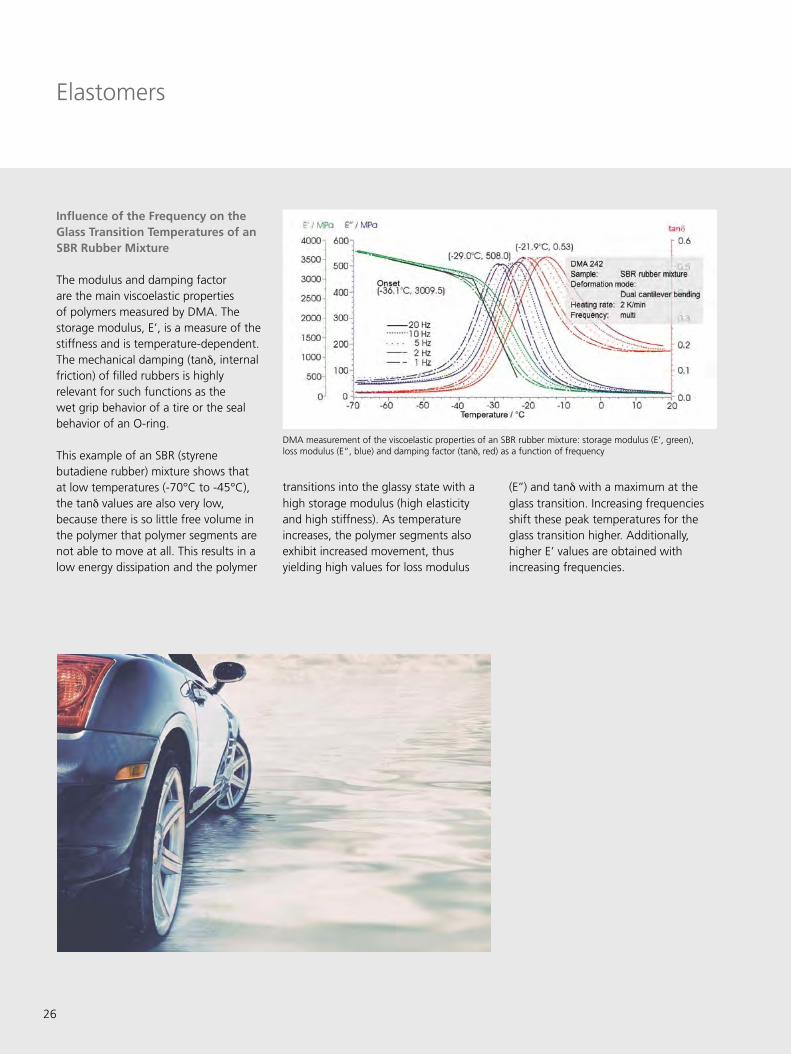
Classification of the Gases EvolvedDuring Rubber Decomposition:Plasticizer and PAHs
Thermal analysis (TA) is typically used forthe study of the temperature stabilityand decomposition of rubber. Oneimportant question to answer would
TGA measurement under vacuum and back-filling with nitrogen followed by combustion of carbon black in oxygen
STA-MS measurement detects evolved gases during decomposition of a tire sample
TGA system is refilled with nitrogen
under isothermal conditions. In thefollowing step, the atmosphere ischanged to oxygen, which leads to the
immediate combustion of carbon black(9%) under increasing temperatures.The ash content amounts to 28% andremains in the crucible.
be how much plasticizer of which typeis realeased at which temperature.Coupling of TA methods to gasanalyzers such as mass spectrometers
allows for the chemical identificationof the evolved gases. An example of aquestion here would be whether therubber releases potentially carcinogericpolycyclic highly aromatic hydrocarbons(PAHs).
By means of simultaneous TGA andmass spectroscopy (MS), the pyrolyticdecomposition of a rubber sample wasinvestigated in this example. Duringheating of the sample to 800°C, twomass-loss steps of 42.5% and 24.7%were observed. From the MS signals(only a few exemplary mass numbersare shown), conclusions can be drawnas to which organic molecules evolvedat which temperature. For example, at350°C, mass number 67 (most probablydue to C
5H
7) indicates the release of the
plasticizer. No PAHs were detected.
26
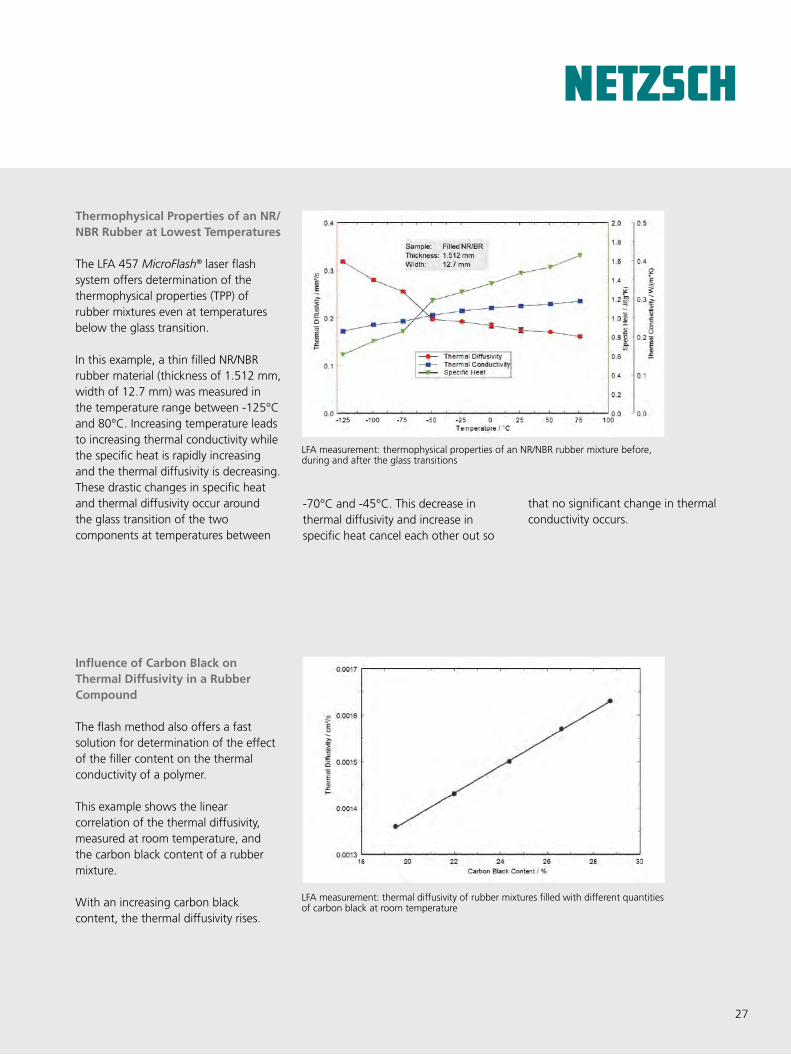
DMA measurement of the viscoelastic properties of an SBR rubber mixture: storage modulus (E‘, green),loss modulus (E“, blue) and damping factor (tand, red) as a function of frequency
Influence of the Frequency on the Glass Transition Temperatures of an SBR Rubber Mixture
The modulus and damping factorare the main viscoelastic propertiesof polymers measured by DMA. Thestorage modulus, E’, is a measure of thestiffness and is temperature-dependent.The mechanical damping (tand, internalfriction) of filled rubbers is highlyrelevant for such functions as thewet grip behavior of a tire or the sealbehavior of an O-ring.
This example of an SBR (styrenebutadiene rubber) mixture shows thatat low temperatures (-70°C to -45°C),the tand values are also very low,because there is so little free volume inthe polymer that polymer segments arenot able to move at all. This results in alow energy dissipation and the polymer
transitions into the glassy state with ahigh storage modulus (high elasticityand high stiffness). As temperatureincreases, the polymer segments alsoexhibit increased movement, thusyielding high values for loss modulus
Elastomers
(E’’) and tand with a maximum at theglass transition. Increasing frequenciesshift these peak temperatures for theglass transition higher. Additionally,higher E’ values are obtained withincreasing frequencies.
27
Influence of Carbon Black onThermal Diffusivity in a RubberCompound
The flash method also offers a fastsolution for determination of the effectof the filler content on the thermalconductivity of a polymer.
This example shows the linearcorrelation of the thermal diffusivity,measured at room temperature, andthe carbon black content of a rubbermixture.
With an increasing carbon blackcontent, the thermal diffusivity rises.
Thermophysical Properties of an NR/NBR Rubber at Lowest Temperatures
The LFA 457 MicroFlash® laser flash system offers determination of thethermophysical properties (TPP) ofrubber mixtures even at temperaturesbelow the glass transition.
In this example, a thin filled NR/NBRrubber material (thickness of 1.512 mm,width of 12.7 mm) was measured inthe temperature range between -125°Cand 80°C. Increasing temperature leadsto increasing thermal conductivity whilethe specific heat is rapidly increasingand the thermal diffusivity is decreasing.These drastic changes in specific heatand thermal diffusivity occur aroundthe glass transition of the twocomponents at temperatures between
LFA measurement: thermophysical properties of an NR/NBR rubber mixture before, during and after the glass transitions
LFA measurement: thermal diffusivity of rubber mixtures filled with different quantitiesof carbon black at room temperature
-70°C and -45°C. This decrease in thermal diffusivity and increase in specific heat cancel each other out so
that no significant change in thermal conductivity occurs.
28
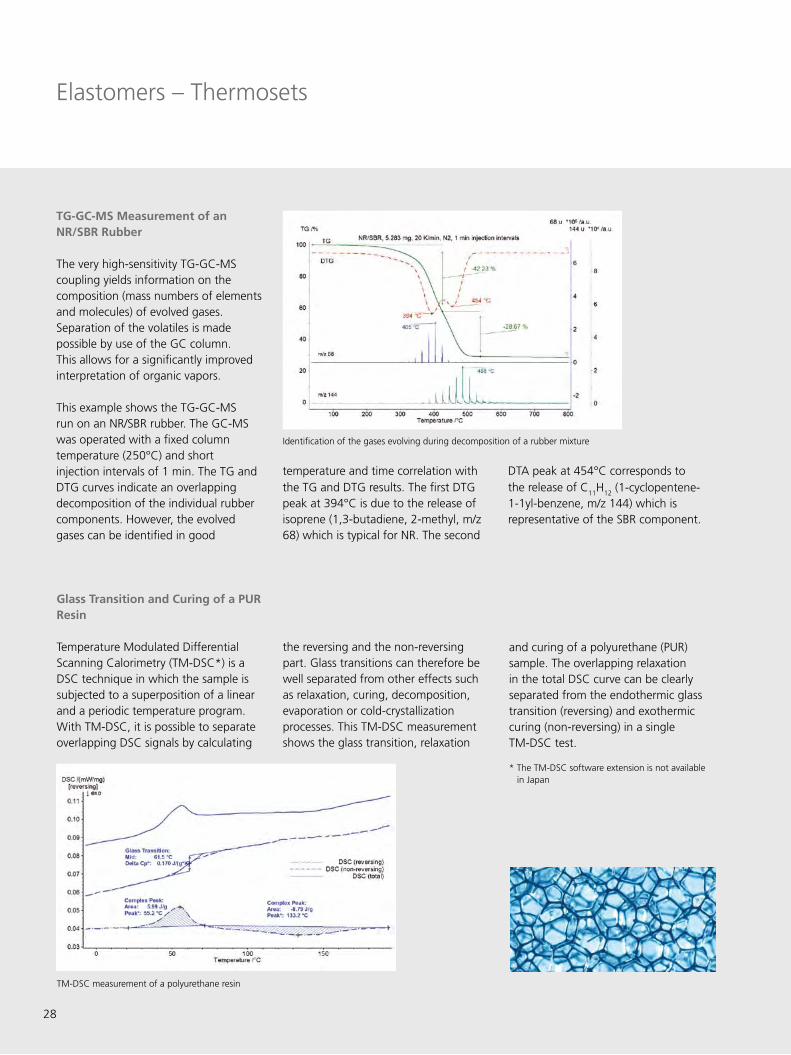
Identification of the gases evolving during decomposition of a rubber mixture
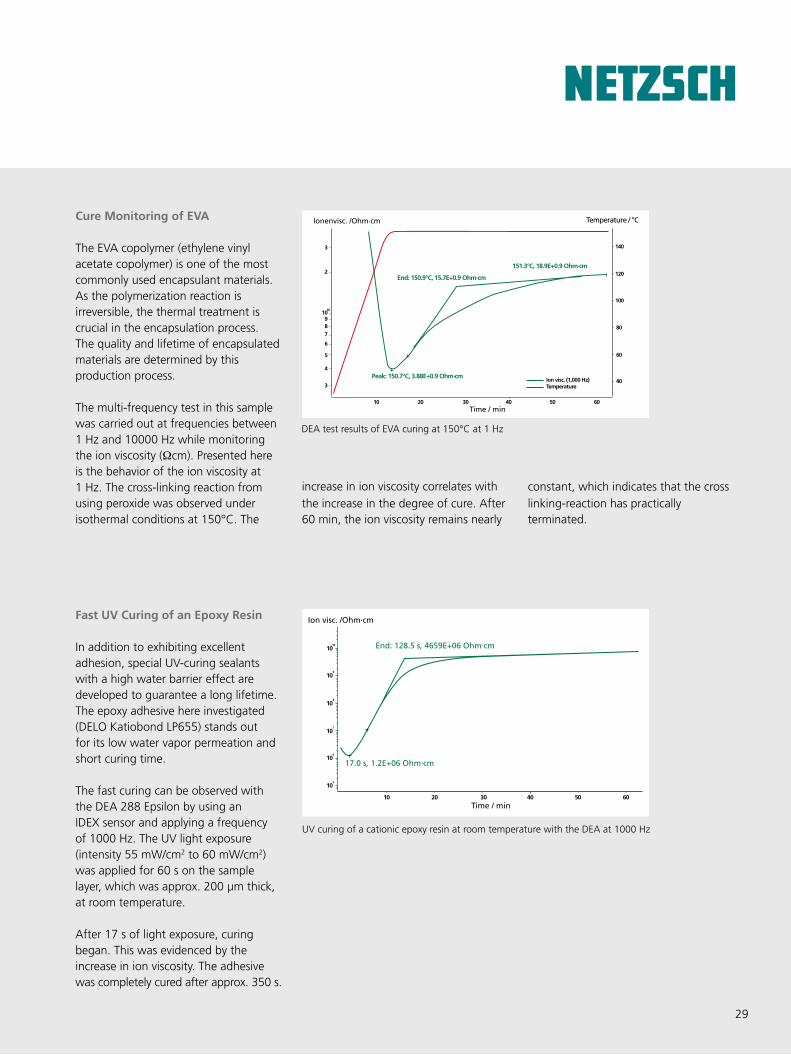
TM-DSC measurement of a polyurethane resin
TG-GC-MS Measurement of an NR/SBR Rubber
The very high-sensitivity TG-GC-MScoupling yields information on thecomposition (mass numbers of elementsand molecules) of evolved gases.Separation of the volatiles is madepossible by use of the GC column.This allows for a significantly improvedinterpretation of organic vapors.
This example shows the TG-GC-MSrun on an NR/SBR rubber. The GC-MSwas operated with a fixed columntemperature (250°C) and shortinjection intervals of 1 min. The TG andDTG curves indicate an overlappingdecomposition of the individual rubbercomponents. However, the evolvedgases can be identified in good
Glass Transition and Curing of a PURResin
Temperature Modulated DifferentialScanning Calorimetry (TM-DSC*) is aDSC technique in which the sample issubjected to a superposition of a linearand a periodic temperature program.With TM-DSC, it is possible to separate overlapping DSC signals by calculating
the reversing and the non-reversingpart. Glass transitions can therefore bewell separated from other effects suchas relaxation, curing, decomposition,evaporation or cold-crystallization processes. This TM-DSC measurement shows the glass transition, relaxation
temperature and time correlation withthe TG and DTG results. The first DTGpeak at 394°C is due to the release ofisoprene (1,3-butadiene, 2-methyl, m/z68) which is typical for NR. The second
DTA peak at 454°C corresponds tothe release of C
11H
12 (1-cyclopentene-
1-1yl-benzene, m/z 144) which isrepresentative of the SBR component.
and curing of a polyurethane (PUR) sample. The overlapping relaxation in the total DSC curve can be clearly separated from the endothermic glass transition (reversing) and exothermic curing (non-reversing) in a single TM-DSC test.
* The TM-DSC software extension is not available in Japan
Elastomers – Thermosets
29
Ionenvisc. /Ohm cm
Time / min10 20 30 40 50 60
140
120
100
80
60
40
Temperature / °C
Ion visc. (1,000 Hz)Temperature
End: 150.9°C, 15.7E+0.9 Ohm cm
Peak: 150.7°C, 3.88E+0.9 Ohm cm
151.3°C, 18.9E+0.9 Ohm cm
3
2
1010
987
6
4
3
5
.
.
.
.
Ion visc. /Ohm cm
Time / min10 20 30 40 50 60
End: 128.5 s, 4659E+06 Ohm.cm
17.0 s, 1.2E+06 Ohm.cm
108
109
1010
107
106
105
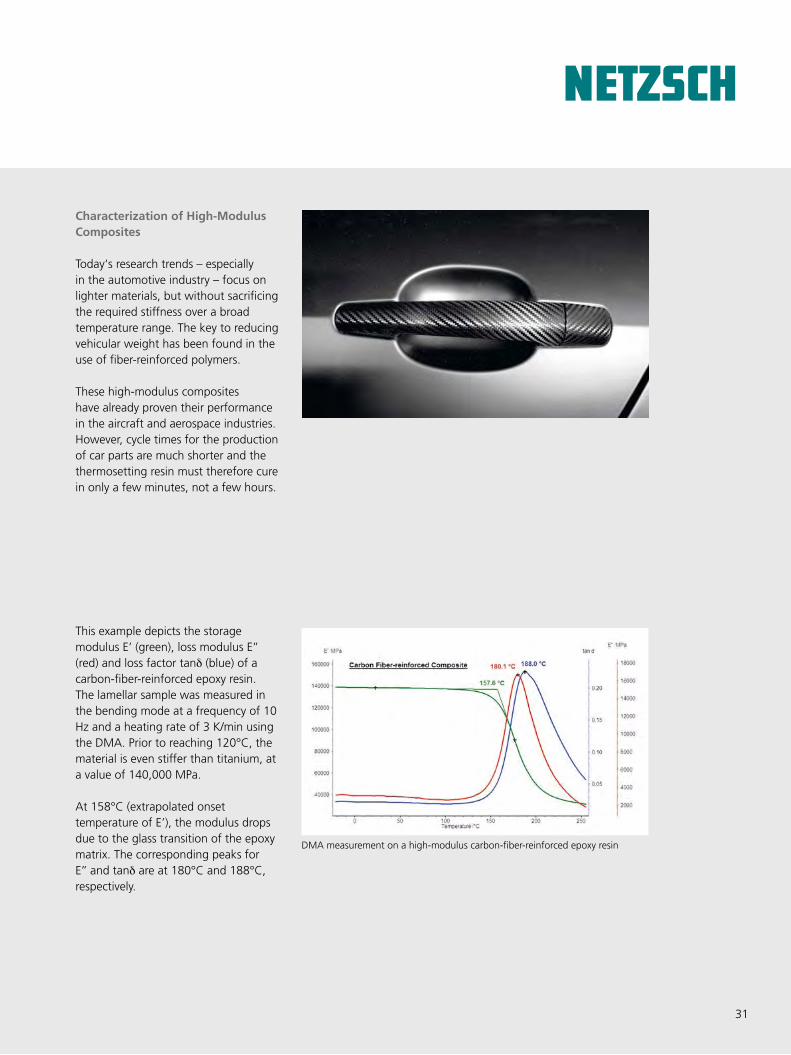
.Fast UV Curing of an Epoxy Resin
In addition to exhibiting excellentadhesion, special UV-curing sealantswith a high water barrier effect aredeveloped to guarantee a long lifetime.The epoxy adhesive here investigated(DELO Katiobond LP655) stands outfor its low water vapor permeation andshort curing time.
The fast curing can be observed withthe DEA 288 Epsilon by using anIDEX sensor and applying a frequencyof 1000 Hz. The UV light exposure(intensity 55 mW/cm2 to 60 mW/cm2)was applied for 60 s on the samplelayer, which was approx. 200 μm thick,at room temperature.
After 17 s of light exposure, curingbegan. This was evidenced by theincrease in ion viscosity. The adhesivewas completely cured after approx. 350 s.
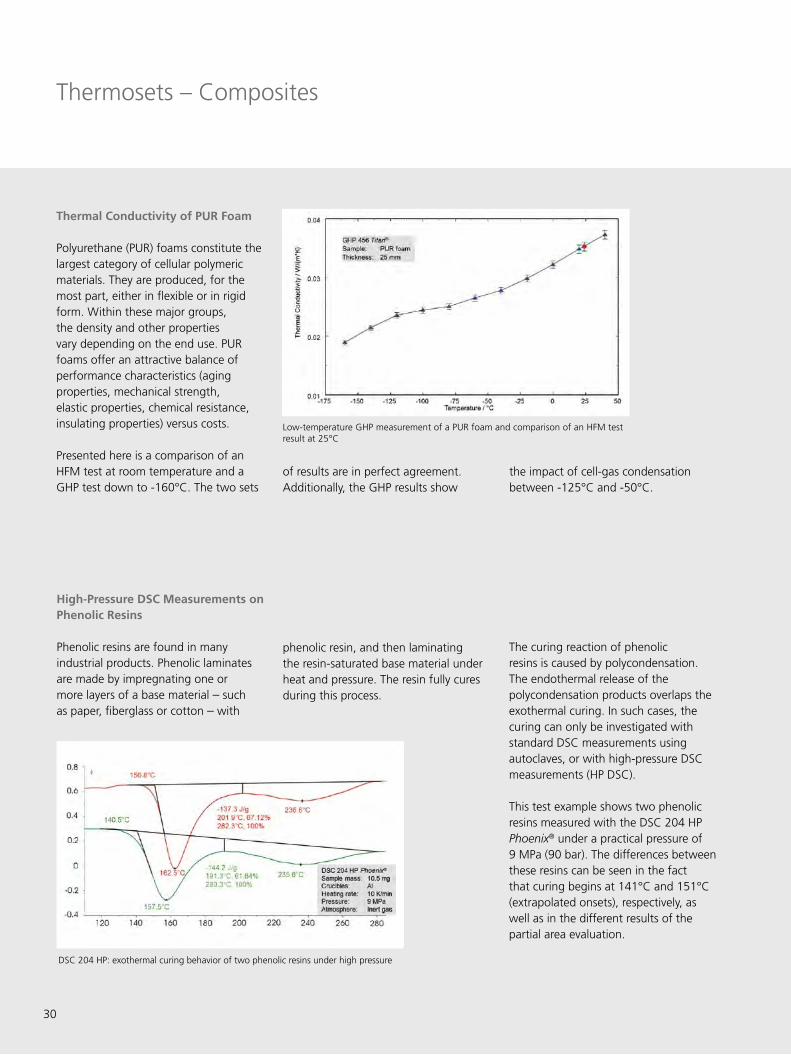
Cure Monitoring of EVA
The EVA copolymer (ethylene vinylacetate copolymer) is one of the mostcommonly used encapsulant materials.As the polymerization reaction isirreversible, the thermal treatment iscrucial in the encapsulation process.The quality and lifetime of encapsulatedmaterials are determined by thisproduction process.
The multi-frequency test in this samplewas carried out at frequencies between1 Hz and 10000 Hz while monitoringthe ion viscosity (Wcm). Presented hereis the behavior of the ion viscosity at1 Hz. The cross-linking reaction fromusing peroxide was observed underisothermal conditions at 150°C. The
DEA test results of EVA curing at 150°C at 1 Hz
UV curing of a cationic epoxy resin at room temperature with the DEA at 1000 Hz
increase in ion viscosity correlates with
the increase in the degree of cure. After60 min, the ion viscosity remains nearly
constant, which indicates that the crosslinking-reaction has practicallyterminated.
30
Low-temperature GHP measurement of a PUR foam and comparison of an HFM test result at 25°C
Thermal Conductivity of PUR Foam
Polyurethane (PUR) foams constitute thelargest category of cellular polymericmaterials. They are produced, for themost part, either in flexible or in rigidform. Within these major groups,the density and other propertiesvary depending on the end use. PURfoams offer an attractive balance ofperformance characteristics (agingproperties, mechanical strength,elastic properties, chemical resistance,insulating properties) versus costs.
Presented here is a comparison of anHFM test at room temperature and aGHP test down to -160°C. The two sets
Thermosets – Composites
of results are in perfect agreement. Additionally, the GHP results show
the impact of cell-gas condensation between -125°C and -50°C.
High-Pressure DSC Measurements on Phenolic Resins
Phenolic resins are found in many industrial products. Phenolic laminates are made by impregnating one or more layers of a base material – such as paper, fiberglass or cotton – with
DSC 204 HP: exothermal curing behavior of two phenolic resins under high pressure
phenolic resin, and then laminating the resin-saturated base material under heat and pressure. The resin fully cures during this process.
The curing reaction of phenolicresins is caused by polycondensation.The endothermal release of thepolycondensation products overlaps theexothermal curing. In such cases, thecuring can only be investigated withstandard DSC measurements usingautoclaves, or with high-pressure DSCmeasurements (HP DSC).
This test example shows two phenolicresins measured with the DSC 204 HPPhoenix® under a practical pressure of9 MPa (90 bar). The differences betweenthese resins can be seen in the factthat curing begins at 141°C and 151°C(extrapolated onsets), respectively, aswell as in the different results of thepartial area evaluation.
31
This example depicts the storagemodulus E’ (green), loss modulus E’’(red) and loss factor tand (blue) of acarbon-fiber-reinforced epoxy resin.The lamellar sample was measured inthe bending mode at a frequency of 10Hz and a heating rate of 3 K/min usingthe DMA. Prior to reaching 120°C, thematerial is even stiffer than titanium, ata value of 140,000 MPa.
At 158°C (extrapolated onsettemperature of E’), the modulus dropsdue to the glass transition of the epoxymatrix. The corresponding peaks forE’’ and tand are at 180°C and 188°C,respectively.
Characterization of High-ModulusComposites
Today‘s research trends – especiallyin the automotive industry – focus onlighter materials, but without sacrificingthe required stiffness over a broadtemperature range. The key to reducingvehicular weight has been found in theuse of fiber-reinforced polymers.
These high-modulus compositeshave already proven their performancein the aircraft and aerospace industries.However, cycle times for the productionof car parts are much shorter and thethermosetting resin must therefore curein only a few minutes, not a few hours.
DMA measurement on a high-modulus carbon-fiber-reinforced epoxy resin
32
Composites – Thermokinetics
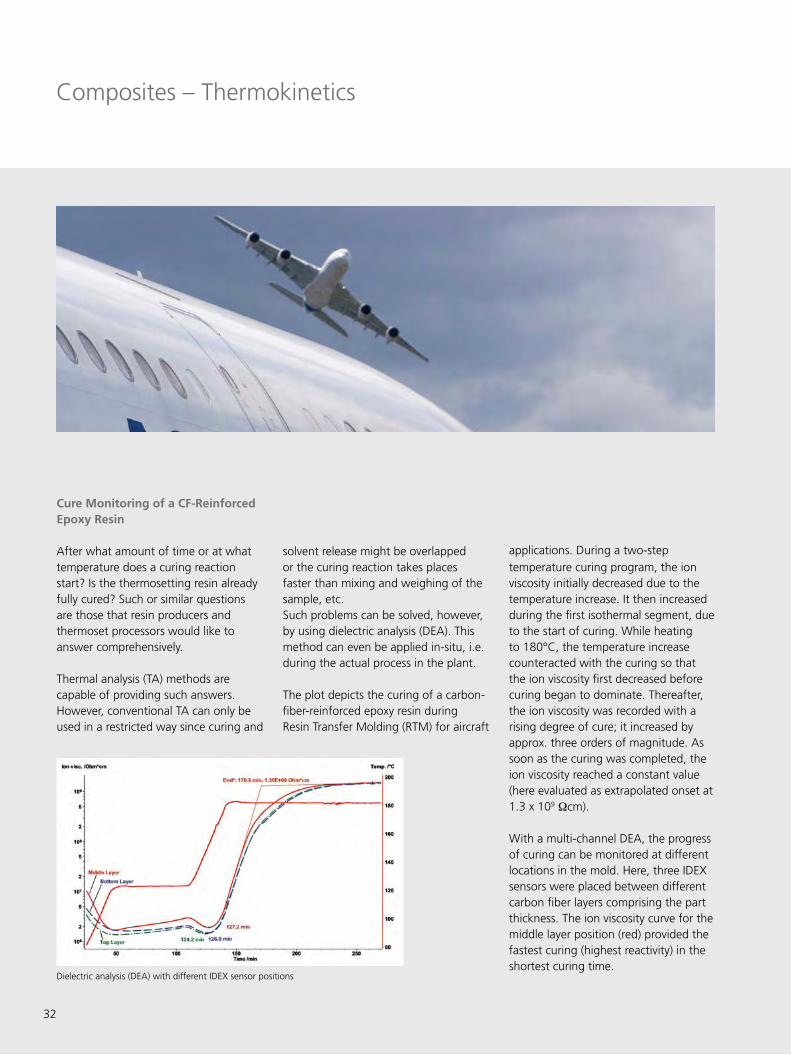
Cure Monitoring of a CF-Reinforced Epoxy Resin
After what amount of time or at whattemperature does a curing reactionstart? Is the thermosetting resin alreadyfully cured? Such or similar questionsare those that resin producers andthermoset processors would like toanswer comprehensively.
Thermal analysis (TA) methods arecapable of providing such answers.However, conventional TA can only beused in a restricted way since curing and
Dielectric analysis (DEA) with different IDEX sensor positions
solvent release might be overlappedor the curing reaction takes placesfaster than mixing and weighing of thesample, etc.Such problems can be solved, however,by using dielectric analysis (DEA). Thismethod can even be applied in-situ, i.e.during the actual process in the plant.
The plot depicts the curing of a carbon-fiber-reinforced epoxy resin duringResin Transfer Molding (RTM) for aircraft
applications. During a two-step
temperature curing program, the ionviscosity initially decreased due to thetemperature increase. It then increasedduring the first isothermal segment, dueto the start of curing. While heatingto 180°C, the temperature increasecounteracted with the curing so thatthe ion viscosity first decreased beforecuring began to dominate. Thereafter,the ion viscosity was recorded with arising degree of cure; it increased byapprox. three orders of magnitude. Assoon as the curing was completed, theion viscosity reached a constant value(here evaluated as extrapolated onset at 1.3 x 10⁹ Wcm).
With a multi-channel DEA, the progressof curing can be monitored at differentlocations in the mold. Here, three IDEXsensors were placed between differentcarbon fiber layers comprising the partthickness. The ion viscosity curve for themiddle layer position (red) provided thefastest curing (highest reactivity) in theshortest curing time.
33
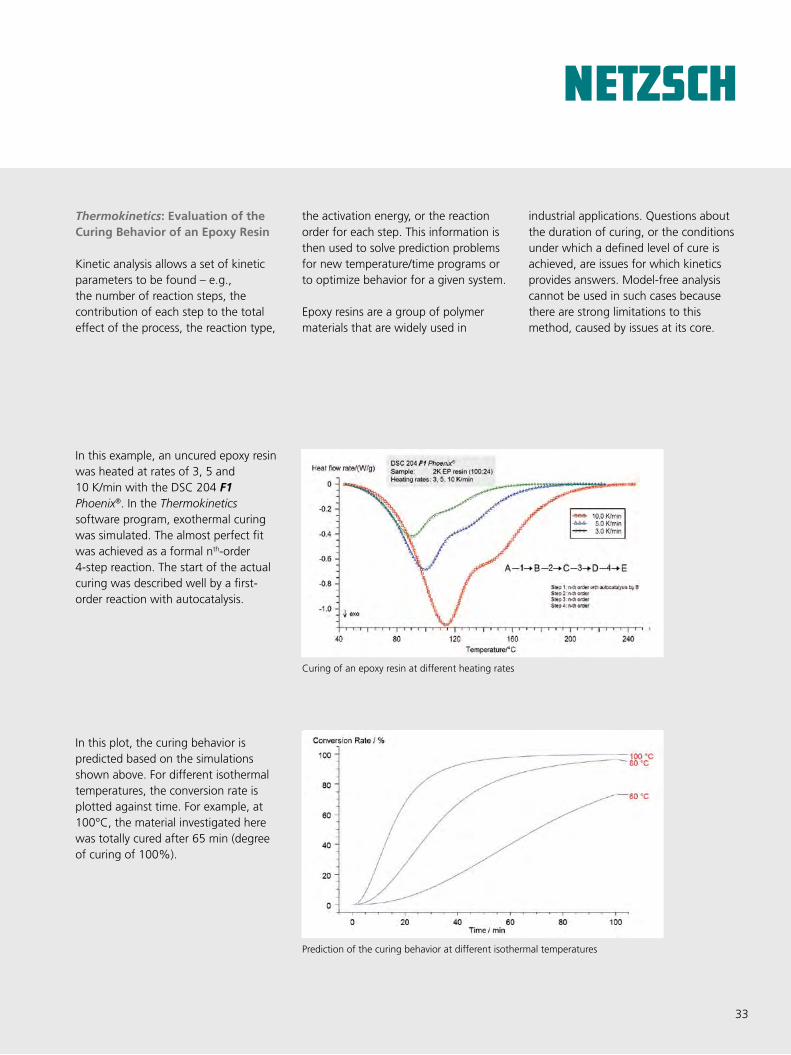
Thermokinetics: Evaluation of the Curing Behavior of an Epoxy Resin
Kinetic analysis allows a set of kineticparameters to be found – e.g.,the number of reaction steps, thecontribution of each step to the totaleffect of the process, the reaction type,
Prediction of the curing behavior at different isothermal temperatures
Curing of an epoxy resin at different heating rates
In this example, an uncured epoxy resin was heated at rates of 3, 5 and 10 K/min with the DSC 204 F1 Phoenix®. In the Thermokinetics software program, exothermal curing was simulated. The almost perfect fit was achieved as a formal nth-order 4-step reaction. The start of the actual curing was described well by a first-order reaction with autocatalysis.
In this plot, the curing behavior is predicted based on the simulations shown above. For different isothermal temperatures, the conversion rate is plotted against time. For example, at 100°C, the material investigated here was totally cured after 65 min (degree of curing of 100%).
the activation energy, or the reactionorder for each step. This information isthen used to solve prediction problemsfor new temperature/time programs orto optimize behavior for a given system.
Epoxy resins are a group of polymermaterials that are widely used in
industrial applications. Questions aboutthe duration of curing, or the conditionsunder which a defined level of cure isachieved, are issues for which kineticsprovides answers. Model-free analysiscannot be used in such cases becausethere are strong limitations to thismethod, caused by issues at its core.

34
Expertise in Service
Our Expertise – Service
All over the world, the name NETZSCH stands for comprehensive support and expert, reliable service, before and after sale. Our qualified personnel from the technical service and application departments are always available for consultation.
In special training programs tailored for you and your employees, you will learn to tap the full potential of your instrument.
To maintain and protect your investment, you will be accompanied by our experienced service team over the entire life span of your instrument.
Summary of Our Services
� Installation and commissioning � Hotline service � Preventive maintenance � Calibration service � IQ / OQ / PQ � On-site repairs with emergency service for NETZSCH components
� Moving / exchange service � Technical information service � Spare parts assistance

35
Our Expertise – Applications Laboratories
The NETZSCH Analyzing & Testing applications laboratories are proficient partners for nearly any Thermal Analysis issue. Our diverse measuring methods and over 30 different state-of-the-art test stations will provide ready solutions for all your thermal needs.
Measurements can be carried out on samples of the most varied of geometries and configurations. You will receive high-precision measurement results and valuable interpretations from our expert team. This will enable you to precisely define new materials and components before actual deployment, minimize risks of failure, and gain decisive advantages over your competitors.
For production problems, we can work with you to analyze causal issues and work out solution concepts. The option of commercial testing is a relatively low investment which generally pays itself off in a few days or weeks and provides fast and reliable support for research on new materials or resolving any kinds of production issues.

www.netzsch.com
NETZSCH-Gerätebau GmbHWittelsbacherstraße 42 95100 SelbGermanyTel.: +49 9287 881-0 Fax: +49 9287 881 [email protected] N
GB
· PO
LYM
ERS
· E ·
3000
· 03
12 ·
LH ·
Tec
hnic
al s
peci
fica
tion
s ar
e su
bjec
t to
cha
nge.
When it comes to Thermal Analysis, Adiabatic Reaction Calorimetry and the determination of Thermophysical Properties, NETZSCH has it covered. Our 50 years of applications experience, broad state-of-the-art product line and comprehensive service offerings ensure that our solutions will not only meet your every requirement but also exceed your every expectation.
The NETZSCH Group is an owner-managed, internationally operating technology company headquartered in Germany. The three Business Units – Analyzing & Testing, Grinding & Dispersing and Pumps & Systems – provide tailored solutions for highest-level needs. Over 2,500 employees at 130 sales and production centers in 23 countries across the globe guarantee that expert service is never far from our customers.
![Physical Origins of Thermal Properties of Cement Paste · are inversely proportional to the thermal diffusivity of cement paste [1]. During the use phase, the thermophysical characteristics](https://img.pdfslide.us/doc/110x75/5e7f3dbd4d823774c40e3e75/physical-origins-of-thermal-properties-of-cement-paste-are-inversely-proportional.jpg)