Embed Size (px)
Citation preview
Int J Thermophys (2013) 34:763–777DOI 10.1007/s10765-012-1209-x
International Comparison on Thermal-DiffusivityMeasurements for Iron and Isotropic Graphite Usingthe Laser Flash Method in CCT-WG9
M. Akoshima · B. Hay · J. Zhang · L. Chapman ·T. Baba
Received: 14 October 2011 / Accepted: 4 May 2012 / Published online: 3 June 2012© Springer Science+Business Media, LLC 2012
Abstract The first international pilot study of thermal-diffusivity measurementsusing the laser flash (LF) method was organized by the working group 9 (WG9) of theConsultative Committee for Thermometry (CCT) of the Bureau International des Poidset Mesures (BIPM). Four National Metrology Institutes (NMIs) participated in thiscomparison. Thermal-diffusivity measurements on the Armco iron and the isotropicgraphite IG-110 were carried out from room temperature to about 1200 K. The samplesets consist of five disk-shaped specimens of 10 mm in diameter and (1.0, 1.4, 2.0, 2.8,and 4.0) mm in thickness, each cut from the same block of material. These sample setswere specifically prepared for the comparison and sent to the participants. In the pilotcomparison, the thermal diffusivity of each sample was estimated using the LF methodwith a specific extrapolating procedure. This procedure has the advantage of determin-ing the inherent thermal diffusivity of the material. The extrapolated value in a plotof measured apparent thermal-diffusivity values versus the amplitude of the outputsignal corresponding to the temperature rise during each measurement is defined as
M. Akoshima (B) · T. BabaNational Metrology Institute of Japan (NMIJ), AIST, Japan, Tsukuba Central 3, 1-1-1 Umezono,Tsukuba, Ibaraki, 305-8563, Japane-mail: [email protected]
B. HayScientific and Industrial Metrology Centre, Laboratoire National de Métrologie et d’Essais (LNE),1 rue Gaston Boissier, 75015, Paris, France
J. ZhangNational Institute of Metrology (NIM),Bei San Huan Dong Lu 18, Beijing 100013, China
L. ChapmanNational Physical Laboratory (NPL),Teddington, Middlesex, TW11 0LW, UK
123
764 Int J Thermophys (2013) 34:763–777
the inherent thermal diffusivity. The overall results showed good agreement betweenindependent laboratories, measurement equipment, and specimen thicknesses. Thethermal diffusivities of the materials were determined using our measured results. Aquantitative evaluation of the variability of the data obtained by the participants hasbeen done, by evaluating the deviations from the reference value, the Z -value, andthe En-number. Some data showed a large deviation from the reference value. It wasconcluded that these are caused by an insufficient time response of the measurementequipment and some difficulties with changing the pulsed heating energy. The effectof the thermal expansion on the thermal diffusivity was checked. It was found that thethermal-expansion effect was very small and negligible in this case.
Keywords Thermal diffusivity · Laser flash method · International comparison ·Graphite · Iron · National metrology institutes
1 Introduction
Thermophysical properties of solids are interesting because of enhancing the perfor-mance of various apparatus, electronic devices, and home electronics. There is a trendfor the expectation of reliability and traceability in the field of thermophysical propertymeasurements. In general, the reliability in the field of measurement is estimated quan-titatively by uncertainty evaluation. Traceability in the field of measurements meansto be traceable to the International System of Units (SI units) [1] supplied by BureauInternational des Poids et Mesures (BIPM) [2] managed by Comité International desPoids et Mesures (CIPM) [3]. The value which satisfies both of these terms has ameaning of the absolute value.
The laser flash (LF) method [4] is a well-known method to measure the thermaldiffusivity of solids. The thermal diffusivity of solids of a typical size of about 1 mm to5 mm in thickness may be measured using this method from room temperature to wellabove 1000 K. Thermal-diffusivity values measured by this method are widely usedin industry. Various types of apparatus and many varieties of data analysis proceduresare used to calculate thermal-diffusivity values from temperature-rise curves for theLF method. The method is very popular for practical measurements. There is a needto confirm the reliability of thermal diffusivities measured by the LF method since thethermal problem is a hot topic in view of energy-saving and enhancing performancein various applications. The LF thermal-diffusivity measurement can be evaluatedanalytically because the principle of the method is very simple, one-dimensional heatdiffusion phenomena. Thus, the method is preferable to use as the standard method toobtain the thermal diffusivity. In fact, the National Metrology Institute of Japan (NMIJ)and the Laboratoire National de Métrologie et d’Essais (LNE) have established theSI traceable thermal-diffusivity measurement and the uncertainty evaluation as thenational standard [5,6]. NMIJ is supplying the reference material using the technique[7].
Thermophysical properties are discussed in the Working Group 9 of the Consulta-tive Committee for Thermometry (CCT-WG9) [3] of CIPM. The term of reference ofCCT-WG9 is “to advise the CCT on matters related to thermophysical properties, and
123
Int J Thermophys (2013) 34:763–777 765
to assess the need in this subject field for a key comparison.” The CCT-WG9 membersdiscuss thermophysical properties with respect to the standard and application. Threekinds of international comparisons were carried out within this community: thermal-conductivity measurements of insulating materials using the guarded hot-plate method(CCT-P01), thermal-diffusivity measurements of solids using the LF method (CCT-P02), and normal spectral emissivity measurements of solids (CCT-P03).
The first LF thermal-diffusivity comparison was proposed at the CCT-WG9 Meet-ing in September 2005 in Bratislava, Slovakia. We discussed the plan for this com-parison including the schedule, samples, and measurement conditions at the WG9meeting in August 2006 in Boulder, CO, USA. LNE, the National Institute of Metrol-ogy (NIM), NMIJ, and the National Physical Laboratory (NPL) agreed to participatein the comparison. NMIJ was the pilot laboratory of this comparison. The samples forthe comparison were sent to these participants in January 2007, and the measurementswere started at each laboratory. The measurements were carried out over a period ofabout 10 months. The measured data were sent to the pilot in February 2008. Thepreliminarily results was summarized by the pilot and reported at the WG9 meetingin May 2008. We also showed the preliminary results at an international conference[8]. After the continuous discussions and the data evaluation, we summarized the finalresults of the comparison in 2011.
The objective of this comparison was to investigate the state of the art for thermal-diffusivity measurements using the LF method in NMIs and to find common under-standing about measurement procedures, data analysis procedures, and the evaluationof uncertainty in thermal-diffusivity measurements.
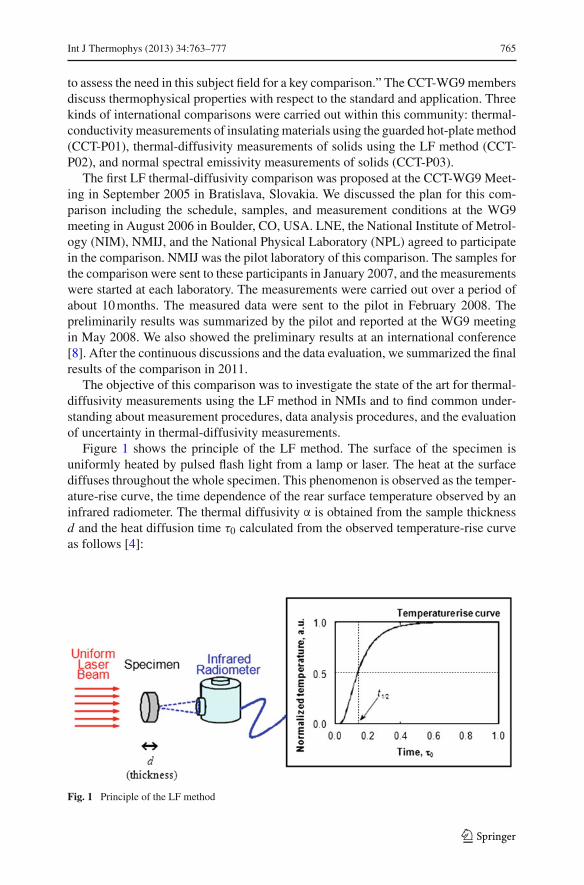
Figure 1 shows the principle of the LF method. The surface of the specimen isuniformly heated by pulsed flash light from a lamp or laser. The heat at the surfacediffuses throughout the whole specimen. This phenomenon is observed as the temper-ature-rise curve, the time dependence of the rear surface temperature observed by aninfrared radiometer. The thermal diffusivity α is obtained from the sample thicknessd and the heat diffusion time τ0 calculated from the observed temperature-rise curveas follows [4]:
Fig. 1 Principle of the LF method
123
766 Int J Thermophys (2013) 34:763–777
α = d2
τ0(1)
This study, which is an inter-comparison of NMIs, aims to discuss thermal-diffu-sivity measurements from the viewpoint based on the SI units and inherent materialproperties. The thermal diffusivity is just one of the physical properties dependenton temperature. It is given as a function of length and time in the case of the LFmethod. Thermal diffusivity is a derived quantity consisting of length, time, and tem-perature. Therefore, thermal diffusivity can be traced back to the SI units [5]. In thefield of metrology, uncertainty evaluations based on the “Guide to the expression ofuncertainty in measurement” (GUM) [9] are preferable.
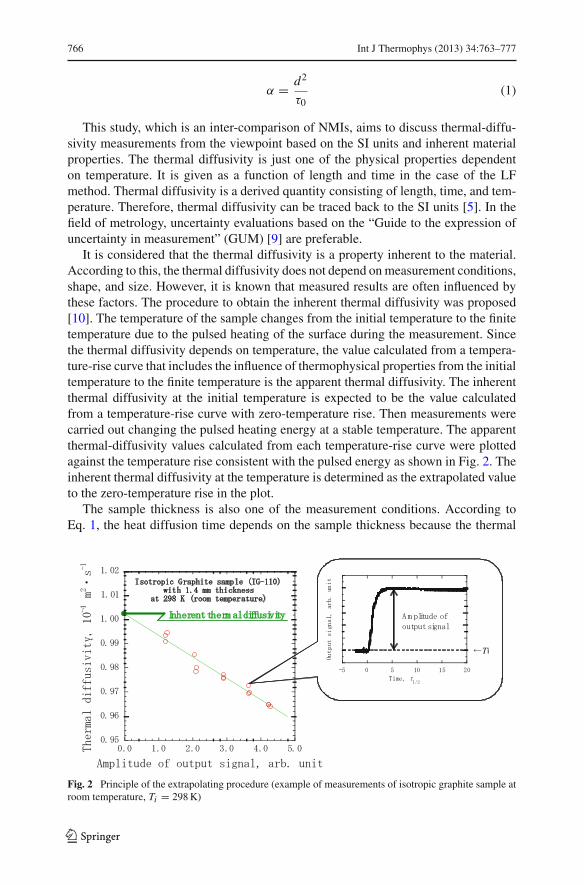
It is considered that the thermal diffusivity is a property inherent to the material.According to this, the thermal diffusivity does not depend on measurement conditions,shape, and size. However, it is known that measured results are often influenced bythese factors. The procedure to obtain the inherent thermal diffusivity was proposed[10]. The temperature of the sample changes from the initial temperature to the finitetemperature due to the pulsed heating of the surface during the measurement. Sincethe thermal diffusivity depends on temperature, the value calculated from a tempera-ture-rise curve that includes the influence of thermophysical properties from the initialtemperature to the finite temperature is the apparent thermal diffusivity. The inherentthermal diffusivity at the initial temperature is expected to be the value calculatedfrom a temperature-rise curve with zero-temperature rise. Then measurements werecarried out changing the pulsed heating energy at a stable temperature. The apparentthermal-diffusivity values calculated from each temperature-rise curve were plottedagainst the temperature rise consistent with the pulsed energy as shown in Fig. 2. Theinherent thermal diffusivity at the temperature is determined as the extrapolated valueto the zero-temperature rise in the plot.
The sample thickness is also one of the measurement conditions. According toEq. 1, the heat diffusion time depends on the sample thickness because the thermal
T
Fig. 2 Principle of the extrapolating procedure (example of measurements of isotropic graphite sample atroom temperature, Ti = 298 K)
123
Int J Thermophys (2013) 34:763–777 767
diffusivity is inherent in the material. By measuring various thicknesses of samples cutfrom a block of solid, at the same temperature and changing the pulsed heating energy,we will confirm the agreement of the extrapolated value in the plot of the amplitudeof the output signal dependence with apparent thermal-diffusivity values.
2 Experimental
2.1 Samples
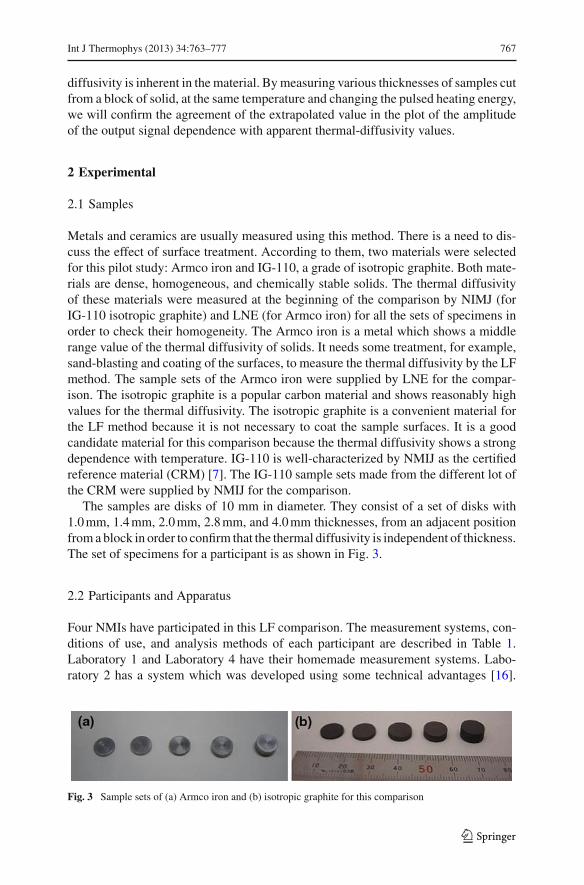
Metals and ceramics are usually measured using this method. There is a need to dis-cuss the effect of surface treatment. According to them, two materials were selectedfor this pilot study: Armco iron and IG-110, a grade of isotropic graphite. Both mate-rials are dense, homogeneous, and chemically stable solids. The thermal diffusivityof these materials were measured at the beginning of the comparison by NIMJ (forIG-110 isotropic graphite) and LNE (for Armco iron) for all the sets of specimens inorder to check their homogeneity. The Armco iron is a metal which shows a middlerange value of the thermal diffusivity of solids. It needs some treatment, for example,sand-blasting and coating of the surfaces, to measure the thermal diffusivity by the LFmethod. The sample sets of the Armco iron were supplied by LNE for the compar-ison. The isotropic graphite is a popular carbon material and shows reasonably highvalues for the thermal diffusivity. The isotropic graphite is a convenient material forthe LF method because it is not necessary to coat the sample surfaces. It is a goodcandidate material for this comparison because the thermal diffusivity shows a strongdependence with temperature. IG-110 is well-characterized by NMIJ as the certifiedreference material (CRM) [7]. The IG-110 sample sets made from the different lot ofthe CRM were supplied by NMIJ for the comparison.
The samples are disks of 10 mm in diameter. They consist of a set of disks with1.0 mm, 1.4 mm, 2.0 mm, 2.8 mm, and 4.0 mm thicknesses, from an adjacent positionfrom a block in order to confirm that the thermal diffusivity is independent of thickness.The set of specimens for a participant is as shown in Fig. 3.
2.2 Participants and Apparatus
Four NMIs have participated in this LF comparison. The measurement systems, con-ditions of use, and analysis methods of each participant are described in Table 1.Laboratory 1 and Laboratory 4 have their homemade measurement systems. Labo-ratory 2 has a system which was developed using some technical advantages [16].
Fig. 3 Sample sets of (a) Armco iron and (b) isotropic graphite for this comparison
123

768 Int J Thermophys (2013) 34:763–777
Table 1 Participants and their apparatus, measurement conditions, and analysis methods
Participant Apparatus Pulsed heatsource
Rear surfaceobservation
Atmosphere Analysismethod
Lab.1 Homemade [6] Nd-glass(1054 nm)
InSb sensorMCT sensor
Ar flow Partial-timemomentmethod [11]
Lab.2 LFA-502N(customizedmodel forthe standard)[12,16]
Nd-YAG(1064 nm)
InSb sensor Vacuum Curve fittingwith equal-area method[13–15]
Lab.3 LFA-427(commercialmodel)
Nd-YAG(1064 nm)
InSb sensor Ar flow Curve-fittingmethod[13,14]
Lab.4 Homemade Nd-YAG(1064 nm)
Thermocouple Ar flow Half-timemethod [4]
The apparatus of Laboratory 3 is a manufacturing model. Laboratory 1 and Labora-tory 2 have SI traceable thermal-diffusivity measurement techniques.
2.3 Measurement Procedure
The measurements were carried out during two heating cycles from room temperature(RT) to 1200 K as follows: RT (300 K), 600 K, 900 K, 1200 K, RT (300 K), 600 K,900 K, 1200 K, and RT (300 K), respectively.
For each temperature, the pulsed heating energy dependence of the apparent ther-mal diffusivity was investigated to determine the inherent thermal diffusivity. Theapparent thermal diffusivity and the temperature rise were estimated for each tem-perature-rise curve. The apparent thermal-diffusivity values were plotted against thetemperature rise consistent with the pulsed energy. The inherent thermal diffusivity atthe temperature test (initial temperature) was determined as the extrapolating value tothe zero-temperature rise in the plot as shown in Fig. 2.
2.4 Uncertainty Evaluation
The uncertainty of the thermal diffusivity was reported from each participant with themeasured thermal diffusivity. The uncertainty evaluation was carried out according tothe respective method [6,10,17]. Laboratory 3 had some difficulties with evaluatingthe uncertainty in this study.
3 Results and Discussion
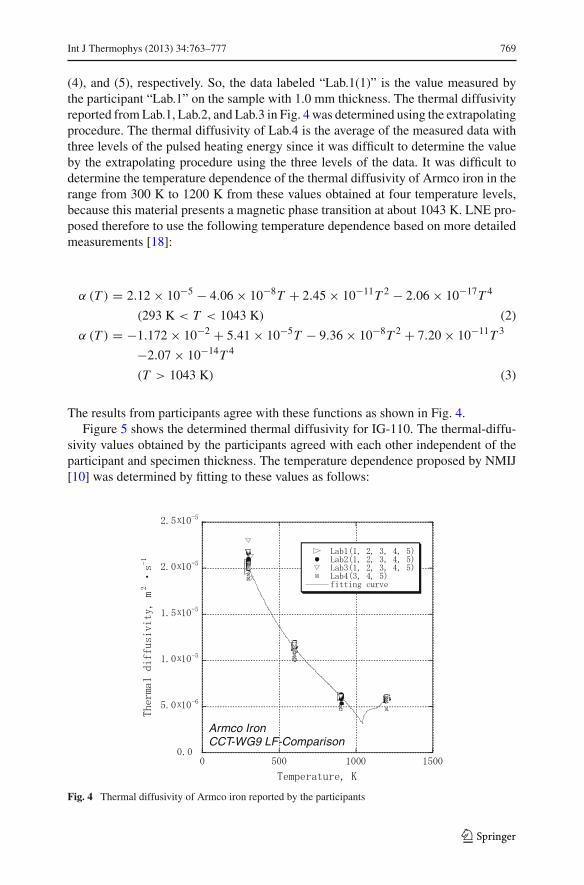
The thermal diffusivity of Armco iron measured by the participants is shown in Fig. 4.The participants are identified by Lab.1, Lab.2, Lab.3, and Lab.4. The data of thesamples with (1.0, 1.4, 2.0, 2.8, and 4.0) mm thicknesses are plotted as (1), (2), (3),
123
Int J Thermophys (2013) 34:763–777 769
(4), and (5), respectively. So, the data labeled “Lab.1(1)” is the value measured bythe participant “Lab.1” on the sample with 1.0 mm thickness. The thermal diffusivityreported from Lab.1, Lab.2, and Lab.3 in Fig. 4 was determined using the extrapolatingprocedure. The thermal diffusivity of Lab.4 is the average of the measured data withthree levels of the pulsed heating energy since it was difficult to determine the valueby the extrapolating procedure using the three levels of the data. It was difficult todetermine the temperature dependence of the thermal diffusivity of Armco iron in therange from 300 K to 1200 K from these values obtained at four temperature levels,because this material presents a magnetic phase transition at about 1043 K. LNE pro-posed therefore to use the following temperature dependence based on more detailedmeasurements [18]:
α (T ) = 2.12 × 10⁻⁵ − 4.06 × 10⁻⁸T + 2.45 × 10⁻¹¹T 2 − 2.06 × 10⁻¹⁷T 4
(293 K < T < 1043 K) (2)
α (T ) = −1.172 × 10⁻² + 5.41 × 10⁻⁵T − 9.36 × 10⁻⁸T 2 + 7.20 × 10⁻¹¹T 3
−2.07 × 10⁻¹⁴T 4
(T > 1043 K) (3)
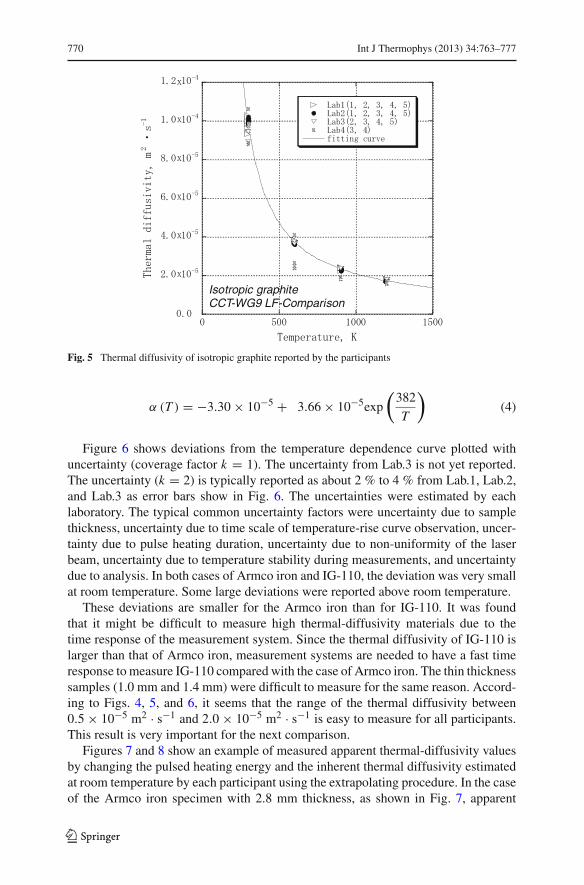
The results from participants agree with these functions as shown in Fig. 4.Figure 5 shows the determined thermal diffusivity for IG-110. The thermal-diffu-
sivity values obtained by the participants agreed with each other independent of theparticipant and specimen thickness. The temperature dependence proposed by NMIJ[10] was determined by fitting to these values as follows:
Armco IronCCT-WG9 LF-Comparison
Fig. 4 Thermal diffusivity of Armco iron reported by the participants
123
770 Int J Thermophys (2013) 34:763–777
Isotropic graphiteCCT-WG9 LF-Comparison
Fig. 5 Thermal diffusivity of isotropic graphite reported by the participants
α (T ) = −3.30 × 10⁻⁵ + 3.66 × 10⁻⁵exp
(382
T
)(4)
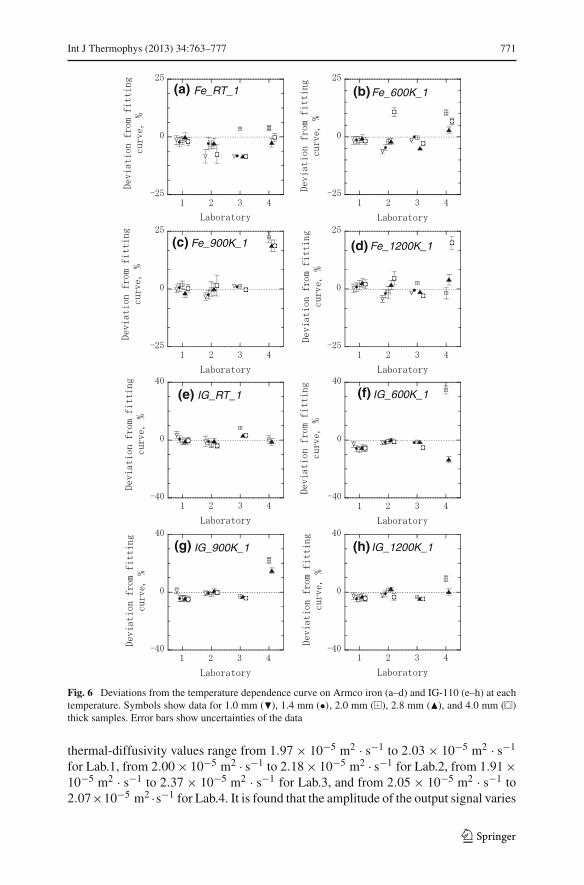
Figure 6 shows deviations from the temperature dependence curve plotted withuncertainty (coverage factor k = 1). The uncertainty from Lab.3 is not yet reported.The uncertainty (k = 2) is typically reported as about 2 % to 4 % from Lab.1, Lab.2,and Lab.3 as error bars show in Fig. 6. The uncertainties were estimated by eachlaboratory. The typical common uncertainty factors were uncertainty due to samplethickness, uncertainty due to time scale of temperature-rise curve observation, uncer-tainty due to pulse heating duration, uncertainty due to non-uniformity of the laserbeam, uncertainty due to temperature stability during measurements, and uncertaintydue to analysis. In both cases of Armco iron and IG-110, the deviation was very smallat room temperature. Some large deviations were reported above room temperature.
These deviations are smaller for the Armco iron than for IG-110. It was foundthat it might be difficult to measure high thermal-diffusivity materials due to thetime response of the measurement system. Since the thermal diffusivity of IG-110 islarger than that of Armco iron, measurement systems are needed to have a fast timeresponse to measure IG-110 compared with the case of Armco iron. The thin thicknesssamples (1.0 mm and 1.4 mm) were difficult to measure for the same reason. Accord-ing to Figs. 4, 5, and 6, it seems that the range of the thermal diffusivity between0.5 × 10−5 m2 · s−1 and 2.0 × 10⁻⁵ m2 · s−1 is easy to measure for all participants.This result is very important for the next comparison.
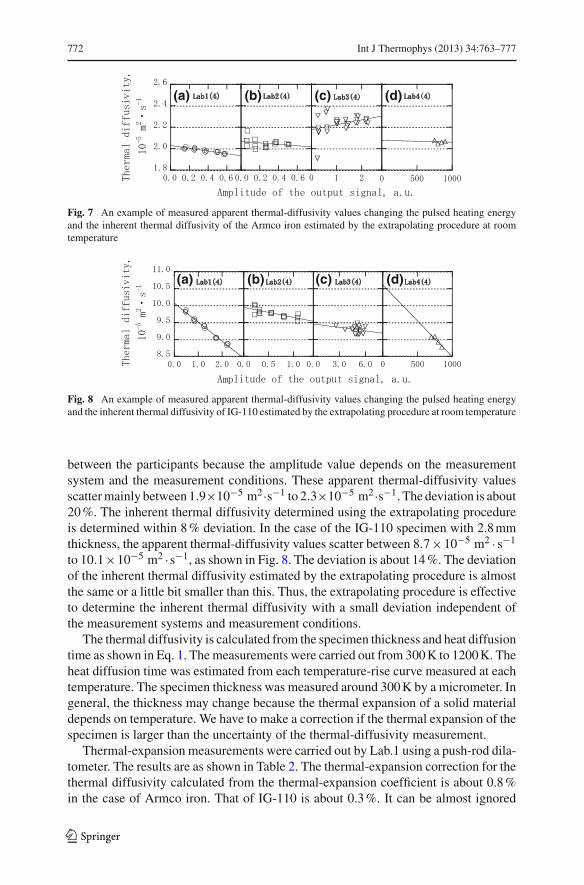
Figures 7 and 8 show an example of measured apparent thermal-diffusivity valuesby changing the pulsed heating energy and the inherent thermal diffusivity estimatedat room temperature by each participant using the extrapolating procedure. In the caseof the Armco iron specimen with 2.8 mm thickness, as shown in Fig. 7, apparent
123
Int J Thermophys (2013) 34:763–777 771
Fe_1200K_1 Fe_900K_1
Fe_600K_1 Fe_RT_1
IG_RT_1 IG_600K_1
IG_900K_1 IG_1200K_1
(a) (b)
(c) (d)
(e) (f)
(h)(g)
Fig. 6 Deviations from the temperature dependence curve on Armco iron (a–d) and IG-110 (e–h) at eachtemperature. Symbols show data for 1.0 mm (�), 1.4 mm (•), 2.0 mm ( ), 2.8 mm (�), and 4.0 mm ( )thick samples. Error bars show uncertainties of the data
thermal-diffusivity values range from 1.97 × 10⁻⁵ m2 · s−1 to 2.03 × 10⁻⁵ m2 · s−1
for Lab.1, from 2.00 × 10⁻⁵ m2 · s−1 to 2.18 × 10⁻⁵ m2 · s−1 for Lab.2, from 1.91 ×10⁻⁵ m2 · s−1 to 2.37 × 10⁻⁵ m2 · s−1 for Lab.3, and from 2.05 × 10⁻⁵ m2 · s−1 to2.07×10−5 m2 ·s−1 for Lab.4. It is found that the amplitude of the output signal varies
123
772 Int J Thermophys (2013) 34:763–777
(a) (b) (c) (d)
Fig. 7 An example of measured apparent thermal-diffusivity values changing the pulsed heating energyand the inherent thermal diffusivity of the Armco iron estimated by the extrapolating procedure at roomtemperature
(a) (b) (c) (d)
Fig. 8 An example of measured apparent thermal-diffusivity values changing the pulsed heating energyand the inherent thermal diffusivity of IG-110 estimated by the extrapolating procedure at room temperature
between the participants because the amplitude value depends on the measurementsystem and the measurement conditions. These apparent thermal-diffusivity valuesscatter mainly between 1.9×10⁻⁵ m2·s−1 to 2.3×10⁻⁵ m2·s−1. The deviation is about20 %. The inherent thermal diffusivity determined using the extrapolating procedureis determined within 8 % deviation. In the case of the IG-110 specimen with 2.8 mmthickness, the apparent thermal-diffusivity values scatter between 8.7×10⁻⁵ m2 · s−1
to 10.1×10⁻⁵ m2 ·s−1, as shown in Fig. 8. The deviation is about 14 %. The deviationof the inherent thermal diffusivity estimated by the extrapolating procedure is almostthe same or a little bit smaller than this. Thus, the extrapolating procedure is effectiveto determine the inherent thermal diffusivity with a small deviation independent ofthe measurement systems and measurement conditions.
The thermal diffusivity is calculated from the specimen thickness and heat diffusiontime as shown in Eq. 1. The measurements were carried out from 300 K to 1200 K. Theheat diffusion time was estimated from each temperature-rise curve measured at eachtemperature. The specimen thickness was measured around 300 K by a micrometer. Ingeneral, the thickness may change because the thermal expansion of a solid materialdepends on temperature. We have to make a correction if the thermal expansion of thespecimen is larger than the uncertainty of the thermal-diffusivity measurement.
Thermal-expansion measurements were carried out by Lab.1 using a push-rod dila-tometer. The results are as shown in Table 2. The thermal-expansion correction for thethermal diffusivity calculated from the thermal-expansion coefficient is about 0.8 %in the case of Armco iron. That of IG-110 is about 0.3 %. It can be almost ignored
123

Int J Thermophys (2013) 34:763–777 773
Table 2 Thermal-expansion coefficient of Armco iron and isotropic graphite measured by push-rod dila-tometer
Temperature (K) Thermal-expansion coefficient Thermal-expansion correction for(10−6 K−1) thermal diffusivity
Armco iron IG-110 Armco iron IG-110
296 – – – –
600 12.9 3.8 1.0079 1.0023
900 14.1 4.3 1.0086 1.0026
1200 12.2 4.7 1.0074 1.0029
because uncertainties of thermal-diffusivity measurements were about 3 %. The ther-mal-expansion effect is not large in this study.
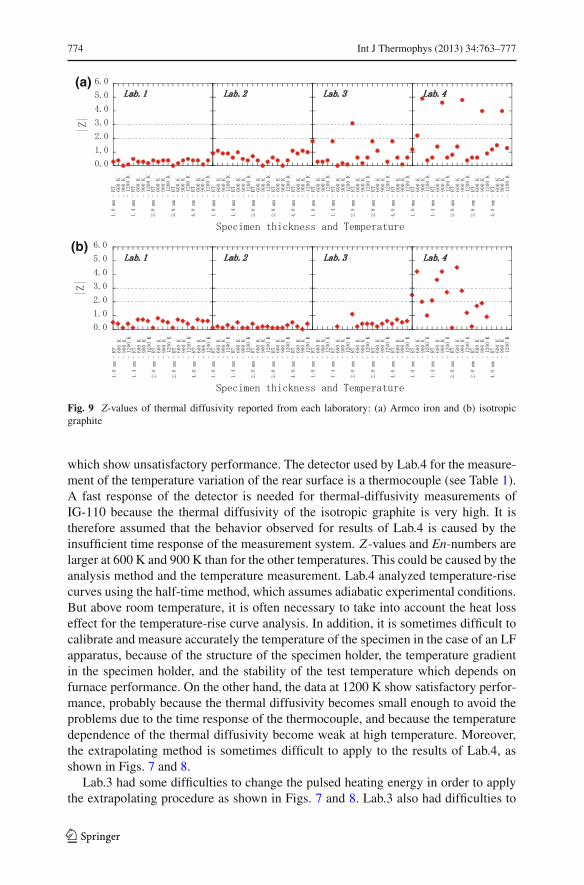
In order to study the deviation of these measured thermal-diffusivity values indetail, we calculated the Z -value and En-number. We can check the performance ofthe measured results according to ISO/IEC 17043 Annex A [19].
The Z -test is a statistical method used to test the normal distribution. This methodaims to test whether the differences in results are statistically significant for the samplemean and population mean. (It enables us to examine whether the difference betweenthe average of results for a sample and the average of results for the whole popu-lation is significant or not, in the statistics authorization method that uses a normaldistribution.) The Z -value is expressed as follows:
Z = x − X
s(5)
Here, x is the measured value and X is the mean value, for example, the average ofmeasured values and values of fitted function s is the estimated variance, for example,the standard deviation of X . |Z | � 2 indicates “satisfactory” performance. In the caseof “2 < |Z | � 3,” the data are questionable. And outlier results show |Z | > 3. Figure 9shows Z -values of our measured thermal diffusivity.
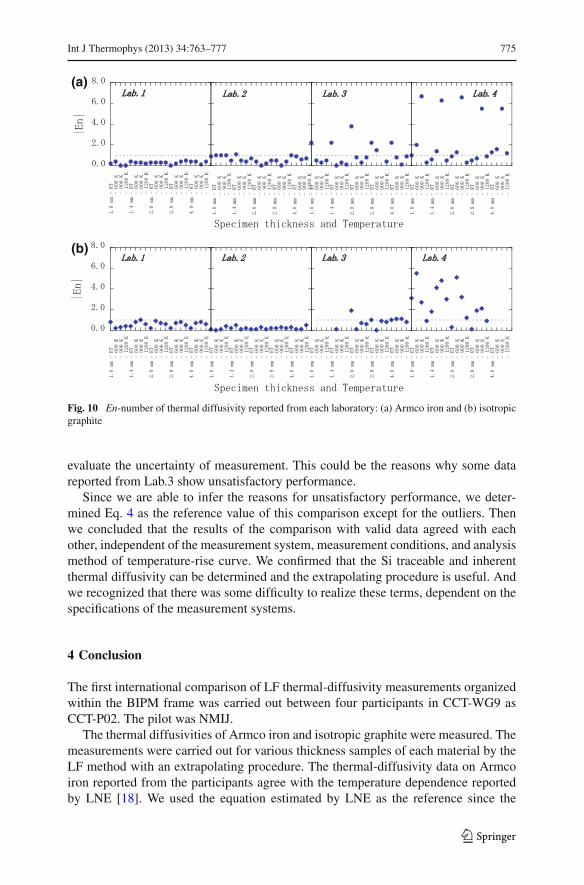
The En-number is derived by dividing the difference between a participant’s testdata and the test artifact’s assigned value by the square root of the sum of the squares(RSS) of the participant laboratories’ test data uncertainty and the reference labora-tory’s test artifact’s assigned value uncertainty.
En = x − Xref√U 2
lab + U 2ref
(6)
where x is the measured value by the participant laboratory, Xref is the reference value(proposed by the organized laboratory), Ulab is the expanded uncertainty of x , and Urefis the expanded uncertainty of Xref . The data whose En-number satisfied |En| � 1 isjudged as satisfactory performance. “|En| > 1” means unsatisfactory performance.
We found that some data reported from Lab.3 and Lab.4 shows |Z | > 3 and|En| > 1 in Figs. 9 and 10. In Fig 10b, there are many data reported from Lab.4
123
774 Int J Thermophys (2013) 34:763–777
(a)
(b)
Fig. 9 Z-values of thermal diffusivity reported from each laboratory: (a) Armco iron and (b) isotropicgraphite
which show unsatisfactory performance. The detector used by Lab.4 for the measure-ment of the temperature variation of the rear surface is a thermocouple (see Table 1).A fast response of the detector is needed for thermal-diffusivity measurements ofIG-110 because the thermal diffusivity of the isotropic graphite is very high. It istherefore assumed that the behavior observed for results of Lab.4 is caused by theinsufficient time response of the measurement system. Z -values and En-numbers arelarger at 600 K and 900 K than for the other temperatures. This could be caused by theanalysis method and the temperature measurement. Lab.4 analyzed temperature-risecurves using the half-time method, which assumes adiabatic experimental conditions.But above room temperature, it is often necessary to take into account the heat losseffect for the temperature-rise curve analysis. In addition, it is sometimes difficult tocalibrate and measure accurately the temperature of the specimen in the case of an LFapparatus, because of the structure of the specimen holder, the temperature gradientin the specimen holder, and the stability of the test temperature which depends onfurnace performance. On the other hand, the data at 1200 K show satisfactory perfor-mance, probably because the thermal diffusivity becomes small enough to avoid theproblems due to the time response of the thermocouple, and because the temperaturedependence of the thermal diffusivity become weak at high temperature. Moreover,the extrapolating method is sometimes difficult to apply to the results of Lab.4, asshown in Figs. 7 and 8.
Lab.3 had some difficulties to change the pulsed heating energy in order to applythe extrapolating procedure as shown in Figs. 7 and 8. Lab.3 also had difficulties to
123
Int J Thermophys (2013) 34:763–777 775
(a)
(b)
Fig. 10 En-number of thermal diffusivity reported from each laboratory: (a) Armco iron and (b) isotropicgraphite
evaluate the uncertainty of measurement. This could be the reasons why some datareported from Lab.3 show unsatisfactory performance.
Since we are able to infer the reasons for unsatisfactory performance, we deter-mined Eq. 4 as the reference value of this comparison except for the outliers. Thenwe concluded that the results of the comparison with valid data agreed with eachother, independent of the measurement system, measurement conditions, and analysismethod of temperature-rise curve. We confirmed that the Si traceable and inherentthermal diffusivity can be determined and the extrapolating procedure is useful. Andwe recognized that there was some difficulty to realize these terms, dependent on thespecifications of the measurement systems.
4 Conclusion
The first international comparison of LF thermal-diffusivity measurements organizedwithin the BIPM frame was carried out between four participants in CCT-WG9 asCCT-P02. The pilot was NMIJ.
The thermal diffusivities of Armco iron and isotropic graphite were measured. Themeasurements were carried out for various thickness samples of each material by theLF method with an extrapolating procedure. The thermal-diffusivity data on Armcoiron reported from the participants agree with the temperature dependence reportedby LNE [18]. We used the equation estimated by LNE as the reference since the
123
776 Int J Thermophys (2013) 34:763–777
measurements of the comparison were carried out at just four temperature levels. Itwas difficult to determine the temperature dependence of the thermal diffusivity ofthe Armco iron in the range from 300 K to 1200 K from just this study, because thismaterial presents a magnetic phase transition in this temperature range. In the case ofisotropic graphite, we determined the thermal diffusivity as a function of temperatureusing the measured data from this comparison.
We validated the results evaluating the deviations from the reference value, theZ -value, and the En-number. It was found that some data reported from Lab.3 andLab.4 show large deviations, |Z | > 3 and |En| > 1. We supposed that these are causedby insufficient time response of the measurement system, the analysis method, andsome difficulties in changing the pulsed heating energy for the extrapolating proce-dure. Since the reason for large deviations was known, we determined the referencevalues as the result of this comparison except for these outliers. Then we concludedthat the results show fairly good agreement from room temperature to 1200 K amongthe participants in spite of their different measurement systems. It is also found that theinherent thermal diffusivity of the material is able to be determined independent of thespecimen thickness and measurement conditions using the extrapolating procedure.We confirmed that the SI traceable and inherent thermal diffusivity can be determinedand that the extrapolating procedure is useful. On the other hand, we recognized thatthere was some difficulty to realize these terms, depending on the specifications ofthe measurement systems. It is necessary to keep discussing and studying for estab-lishment of a method to obtain the thermal diffusivity that is traceable to SI units andinherent by the LF method.
We considered the effect of the thermal expansion on thermal diffusivity. It wasfound that the thermal-expansion effect was very small and negligible in this caseaccording to the calculation of thermal-expansion correction coefficients using thethermal-expansion coefficients of Armco iron and isotropic graphite measured byLNE.
We have a plan in the future to develop a metrology system for the thermophys-ical properties by CCT-WG9. For example, calibration and measurement capability(CMC) registration may be realized. We are discussing where we go as the next stepon thermal-diffusivity measurements according to the results of this comparison inCCT-WG9.
References
1. Bureau International des poids et Mesures, The International System of Units (SI), 8th edn. http://www.bipm.org/utils/common/pdf/si_brochure_8.pdf. Accessed 16 May 2012.
2. http://www.bipm.org/en/home/. Accessed 16 May 20123. http://www.bipm.org/en/committees/cc/cct/. Accessed 16 May 20124. W.J. Parker, R.J. Jenkins, C.P. Butler, G.L. Abbott, J. Appl. Phys. 32, 1679 (1961)5. M. Akoshima, T. Baba, Int. J. Thermophys. 26, 151 (2005)6. B. Hay, J.R. Filtz, J. Hameury, L. Rongione, Int. J. Thermophys. 26, 883 (2005)7. NMIJ Certified Reference Materials Catalog 2011–2012, http://www.nmij.jp/service/C/
CRM_Catalogue20120315.pdf and http://www.nmij.jp/english/service/C/8. M. Akoshima, B. Hay, J. Zhang, L. Chapman, T. Baba, in Proceedings of Thermal Conductivity 30/Ther-
mal Expansion 18, ed. by D.S. Gaal, P.S. Gaal (DEStech Publications, Lancaster, 2010), p. 367–3779. ISO/IEC Guide98:1995 “Guide to the expression of uncertainty in measurement” (GUM)
123
Int J Thermophys (2013) 34:763–777 777
10. M. Akoshima, T. Baba, in Proceedings of Thermal Conductivity 28/Thermal Expansion 16, ed. by R.B.Dinwiddie, M.A. White, L. McElroy (DEStech Publications, Lancaster, 2006), p. 497–506
11. A. Degiovanni, M. Laurent, Rev. Phys. Appl. 21, 229 (1986) [in French]12. K. Shinzato, T. Baba, J. Therm. Anal. Calorim. 64, 413 (2001)13. J.A. Cape, G.W. Lehman, J. Appl. Phys. 34, 1909 (1963)14. D. Josell, J. Warren, A. Cezairliyan, J. Appl. Phys. 78, 6867 (1995)15. http://www.nmij.jp/~mprop-stats/thermophys/homepage/research/cfp32/index.html. Accessed 16
May 201216. T. Baba, A. Ono, Meas. Sci. Technol. 12, 2046 (2001)17. J. Zhang, “Uncertainty_report_NIM” (for the comparison), private comunication18. B. Hay, J.-R. Filtz, J.-C. Batsale, Mesure de la diffusivité thermique par la méthode flash. Techniques
de l’Ingénieur, R2955 (Paris, 2004) [in French]19. ISO/IEC 17043:2010, “Conformity assessment—general requirements for proficiency testing”
123


![STRUCTURAL FLUCTUATIONS AND THERMOPHYSICAL PROPERTIES … · A dynamic measurement of thermal diffusivity using the laser flash method [6, 7] has been employed previously to determine](https://img.pdfslide.us/doc/110x75/5f0ec9a77e708231d440f018/structural-fluctuations-and-thermophysical-properties-a-dynamic-measurement-of-thermal.jpg)