Embed Size (px)
Citation preview
To Promote the production and application of ductile iron castings Issue 1, 2002
Thermal AnalysisGiven at the Ductile Iron Society Meeting 6/14/01By W.F, Shaw & B.T. Blatzer
The graphics in this article are imported from a Powerpoint presentation which wasshown on a large projector. Some of them are not clear enough to clearly showthe small numbers and text. If you would like a paper copy of this presentation,please email the Ductile Iron Society.
With this presentation being the first part of this session on thermal analysis, we feltit would be good to review a bit of the history behind this technique or tool that hasbeen available for routine application for over 35 years. Let me first note that, whilewe often use the term "cooling curves", our preferred title for this topic is thermalanalysis or TA, which we'll use for the rest of our presentation.
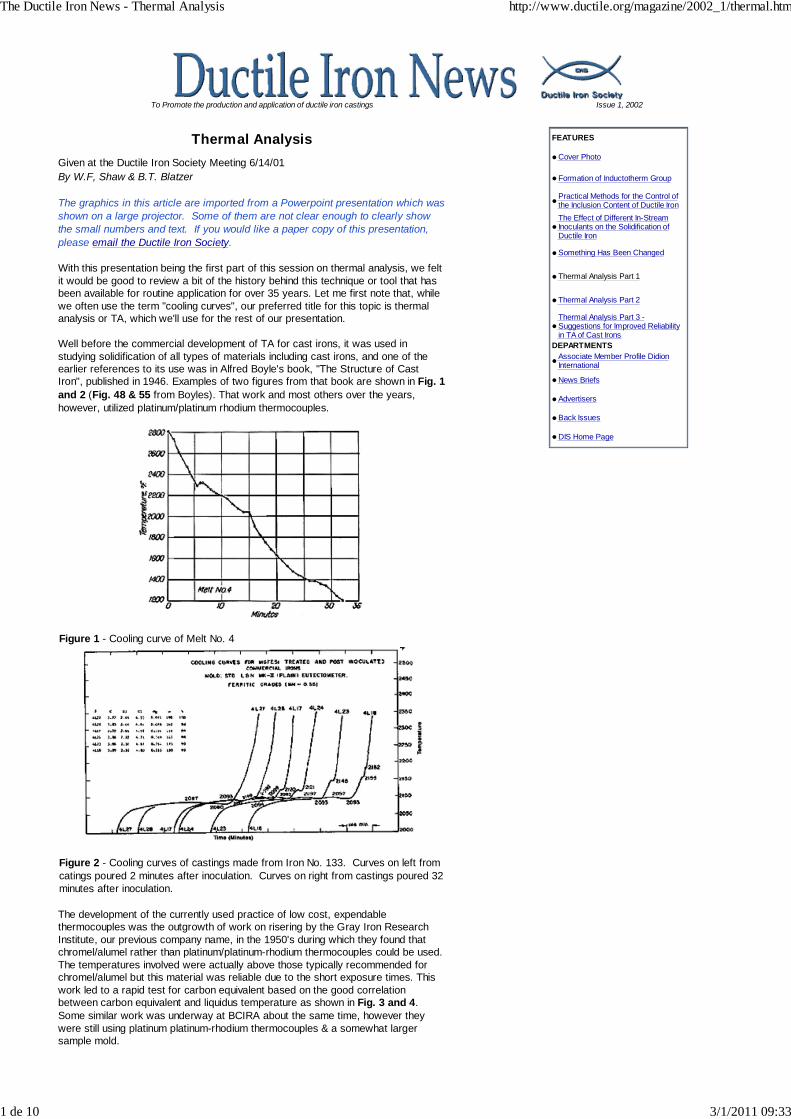
Well before the commercial development of TA for cast irons, it was used instudying solidification of all types of materials including cast irons, and one of theearlier references to its use was in Alfred Boyle's book, "The Structure of CastIron", published in 1946. Examples of two figures from that book are shown in Fig. 1and 2 (Fig. 48 & 55 from Boyles). That work and most others over the years,however, utilized platinum/platinum rhodium thermocouples.
Figure 1 - Cooling curve of Melt No. 4
Figure 2 - Cooling curves of castings made from Iron No. 133. Curves on left fromcatings poured 2 minutes after inoculation. Curves on right from castings poured 32minutes after inoculation.
The development of the currently used practice of low cost, expendablethermocouples was the outgrowth of work on risering by the Gray Iron ResearchInstitute, our previous company name, in the 1950's during which they found thatchromel/alumel rather than platinum/platinum-rhodium thermocouples could be used.The temperatures involved were actually above those typically recommended forchromel/alumel but this material was reliable due to the short exposure times. Thiswork led to a rapid test for carbon equivalent based on the good correlationbetween carbon equivalent and liquidus temperature as shown in Fig. 3 and 4.Some similar work was underway at BCIRA about the same time, however theywere still using platinum platinum-rhodium thermocouples & a somewhat largersample mold.
FEATURES
•Cover Photo
• Formation of Inductotherm Group
•Practical Methods for the Control ofthe Inclusion Content of Ductile Iron
•The Effect of Different In-StreamInoculants on the Solidification ofDuctile Iron
•Something Has Been Changed
• Thermal Analysis Part 1
• Thermal Analysis Part 2
•Thermal Analysis Part 3 -Suggestions for Improved Reliabilityin TA of Cast Irons
DEPARTMENTS
•Associate Member Profile DidionInternational
•News Briefs
•Advertisers
•Back Issues
•DIS Home Page
The Ductile Iron News - Thermal Analysis http://www.ductile.org/magazine/2002_1/thermal.htm
1 de 10 3/1/2011 09:33
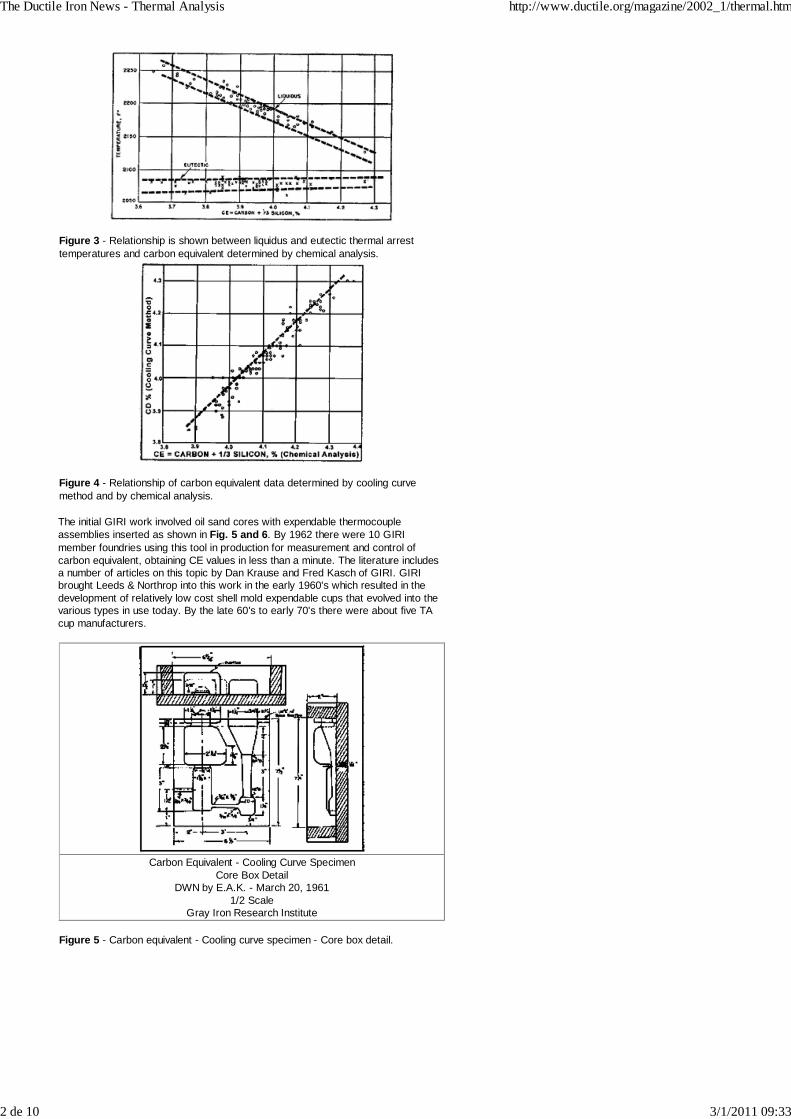
Figure 3 - Relationship is shown between liquidus and eutectic thermal arresttemperatures and carbon equivalent determined by chemical analysis.
Figure 4 - Relationship of carbon equivalent data determined by cooling curvemethod and by chemical analysis.
The initial GIRI work involved oil sand cores with expendable thermocoupleassemblies inserted as shown in Fig. 5 and 6. By 1962 there were 10 GIRImember foundries using this tool in production for measurement and control ofcarbon equivalent, obtaining CE values in less than a minute. The literature includesa number of articles on this topic by Dan Krause and Fred Kasch of GIRI. GIRIbrought Leeds & Northrop into this work in the early 1960's which resulted in thedevelopment of relatively low cost shell mold expendable cups that evolved into thevarious types in use today. By the late 60's to early 70's there were about five TAcup manufacturers.
Carbon Equivalent - Cooling Curve SpecimenCore Box Detail
DWN by E.A.K. - March 20, 19611/2 Scale
Gray Iron Research Institute
Figure 5 - Carbon equivalent - Cooling curve specimen - Core box detail.
The Ductile Iron News - Thermal Analysis http://www.ductile.org/magazine/2002_1/thermal.htm
2 de 10 3/1/2011 09:33
Figure 6 - Core mold and test casting.
Then in the early 1970's Alan Moore at BCIRA carried out further work that led tothe fairly reliable calculation of carbon from TA curves utilizing the addition oftellurium to the cups. The tellurium caused the iron to solidify as white iron, providinga white iron eutectic temperature, which, combined with the liquidus temperature ofthe iron, allowed for rapid carbon calculation and even an estimated silicon analysis.This provided another highly useful tool for melting that almost all of you probablyuse today.
This also led, however, to some initial problems regarding reliability of this method.When L&N produced the first BCIRA Carbon Calculator (Fig. 7), it provided carbonvalues in North American foundries approximately 0.04% lower than combustioncarbons from the same sample. This difference was confirmed during a joint visit toa number of our member plants by Dan Krause of GIRL and some BCIRA andLeeds & Northrop staff. They determined that the reason for this difference was dueto the fact that the work by GIRI and other groups was based on the 1948 IPTSwhile the new BCIRA work utilized the new 1968 IPTS. This quickly resulted inproduction of a new carbon calculator for U.S. foundries as shown in Fig. 8. As faras I know, this potential problem was seldom, if ever, noted in the literature exceptin our reports, although today the option of 1948, 1968 or the newer 1990 IPTSscale is available on some TA units.
Figure 7
Figure 8
Although this problem was resolved, the different IPTS temperature scalescontinued to cause some problems since the U.S. iron and steel industry primarilyretained the 1948 scale while most other countries have since converted to the 1968or even the newer 1990 IPTS. In our temperature range, however, there areextremely small differences between the 1968 and 1990 scales.
The Ductile Iron News - Thermal Analysis http://www.ductile.org/magazine/2002_1/thermal.htm
3 de 10 3/1/2011 09:33
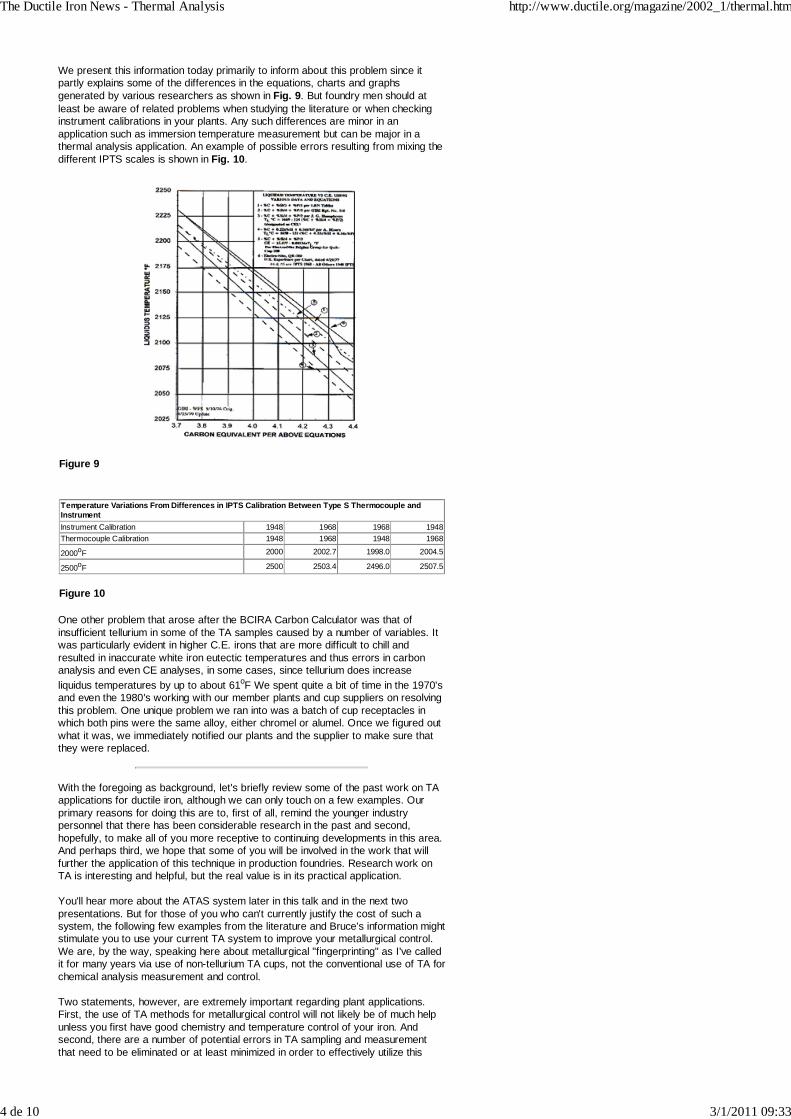
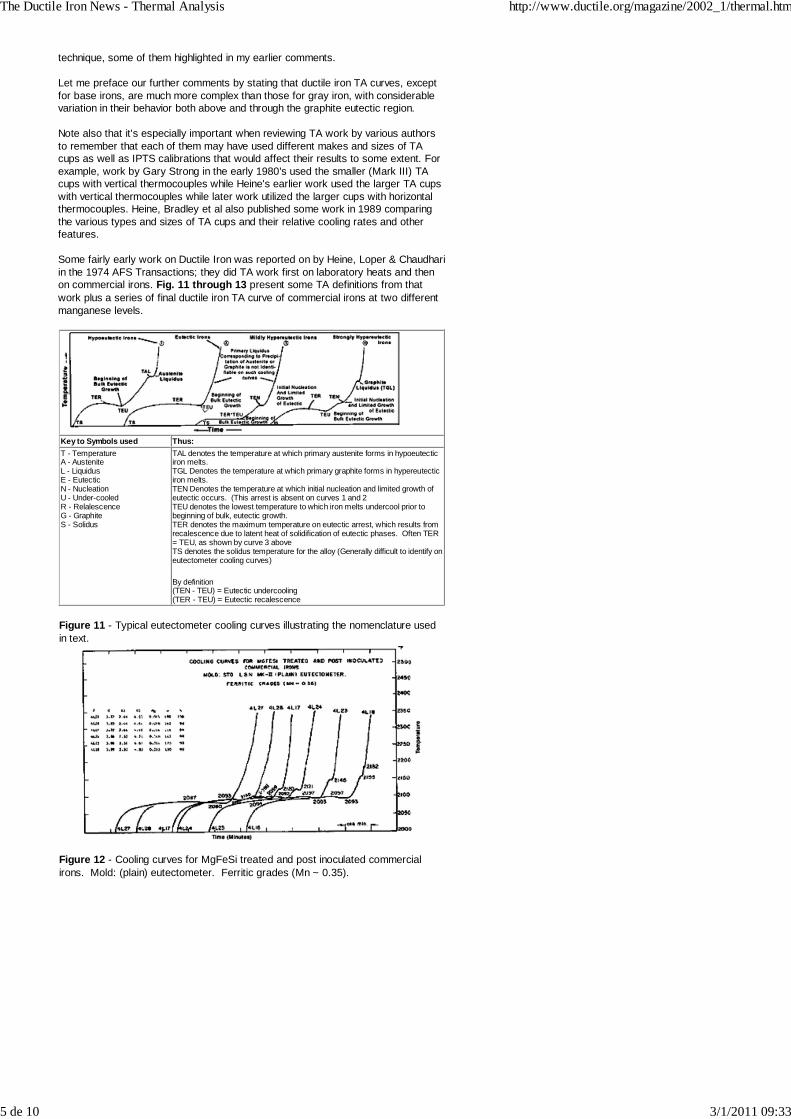
We present this information today primarily to inform about this problem since itpartly explains some of the differences in the equations, charts and graphsgenerated by various researchers as shown in Fig. 9. But foundry men should atleast be aware of related problems when studying the literature or when checkinginstrument calibrations in your plants. Any such differences are minor in anapplication such as immersion temperature measurement but can be major in athermal analysis application. An example of possible errors resulting from mixing thedifferent IPTS scales is shown in Fig. 10.
Figure 9
Temperature Variations From Differences in IPTS Calibration Between Type S Thermocouple andInstrument Instrument Calibration 1948 1968 1968 1948Thermocouple Calibration 1948 1968 1948 1968
2000oF 2000 2002.7 1998.0 2004.5
2500oF 2500 2503.4 2496.0 2507.5
Figure 10
One other problem that arose after the BCIRA Carbon Calculator was that ofinsufficient tellurium in some of the TA samples caused by a number of variables. Itwas particularly evident in higher C.E. irons that are more difficult to chill andresulted in inaccurate white iron eutectic temperatures and thus errors in carbonanalysis and even CE analyses, in some cases, since tellurium does increaseliquidus temperatures by up to about 61oF We spent quite a bit of time in the 1970'sand even the 1980's working with our member plants and cup suppliers on resolvingthis problem. One unique problem we ran into was a batch of cup receptacles inwhich both pins were the same alloy, either chromel or alumel. Once we figured outwhat it was, we immediately notified our plants and the supplier to make sure thatthey were replaced.
With the foregoing as background, let's briefly review some of the past work on TAapplications for ductile iron, although we can only touch on a few examples. Ourprimary reasons for doing this are to, first of all, remind the younger industrypersonnel that there has been considerable research in the past and second,hopefully, to make all of you more receptive to continuing developments in this area.And perhaps third, we hope that some of you will be involved in the work that willfurther the application of this technique in production foundries. Research work onTA is interesting and helpful, but the real value is in its practical application.
You'll hear more about the ATAS system later in this talk and in the next twopresentations. But for those of you who can't currently justify the cost of such asystem, the following few examples from the literature and Bruce's information mightstimulate you to use your current TA system to improve your metallurgical control.We are, by the way, speaking here about metallurgical "fingerprinting" as I've calledit for many years via use of non-tellurium TA cups, not the conventional use of TA forchemical analysis measurement and control.
Two statements, however, are extremely important regarding plant applications.First, the use of TA methods for metallurgical control will not likely be of much helpunless you first have good chemistry and temperature control of your iron. Andsecond, there are a number of potential errors in TA sampling and measurementthat need to be eliminated or at least minimized in order to effectively utilize this
The Ductile Iron News - Thermal Analysis http://www.ductile.org/magazine/2002_1/thermal.htm
4 de 10 3/1/2011 09:33
technique, some of them highlighted in my earlier comments.
Let me preface our further comments by stating that ductile iron TA curves, exceptfor base irons, are much more complex than those for gray iron, with considerablevariation in their behavior both above and through the graphite eutectic region.
Note also that it's especially important when reviewing TA work by various authorsto remember that each of them may have used different makes and sizes of TAcups as well as IPTS calibrations that would affect their results to some extent. Forexample, work by Gary Strong in the early 1980's used the smaller (Mark III) TAcups with vertical thermocouples while Heine's earlier work used the larger TA cupswith vertical thermocouples while later work utilized the larger cups with horizontalthermocouples. Heine, Bradley et al also published some work in 1989 comparingthe various types and sizes of TA cups and their relative cooling rates and otherfeatures.
Some fairly early work on Ductile Iron was reported on by Heine, Loper & Chaudhariin the 1974 AFS Transactions; they did TA work first on laboratory heats and thenon commercial irons. Fig. 11 through 13 present some TA definitions from thatwork plus a series of final ductile iron TA curve of commercial irons at two differentmanganese levels.
Key to Symbols used Thus:T - TemperatureA - AusteniteL - LiquidusE - EutecticN - NucleationU - Under-cooledR - RelalescenceG - GraphiteS - Solidus
TAL denotes the temperature at which primary austenite forms in hypoeutecticiron melts.TGL Denotes the temperature at which primary graphite forms in hypereutecticiron melts.TEN Denotes the temperature at which initial nucleation and limited growth ofeutectic occurs. (This arrest is absent on curves 1 and 2TEU denotes the lowest temperature to which iron melts undercool prior tobeginning of bulk, eutectic growth.TER denotes the maximum temperature on eutectic arrest, which results fromrecalescence due to latent heat of solidification of eutectic phases. Often TER= TEU, as shown by curve 3 aboveTS denotes the solidus temperature for the alloy (Generally difficult to identify oneutectometer cooling curves)
By definition(TEN - TEU) = Eutectic undercooling(TER - TEU) = Eutectic recalescence
Figure 11 - Typical eutectometer cooling curves illustrating the nomenclature usedin text.
Figure 12 - Cooling curves for MgFeSi treated and post inoculated commercialirons. Mold: (plain) eutectometer. Ferritic grades (Mn ~ 0.35).
The Ductile Iron News - Thermal Analysis http://www.ductile.org/magazine/2002_1/thermal.htm
5 de 10 3/1/2011 09:33
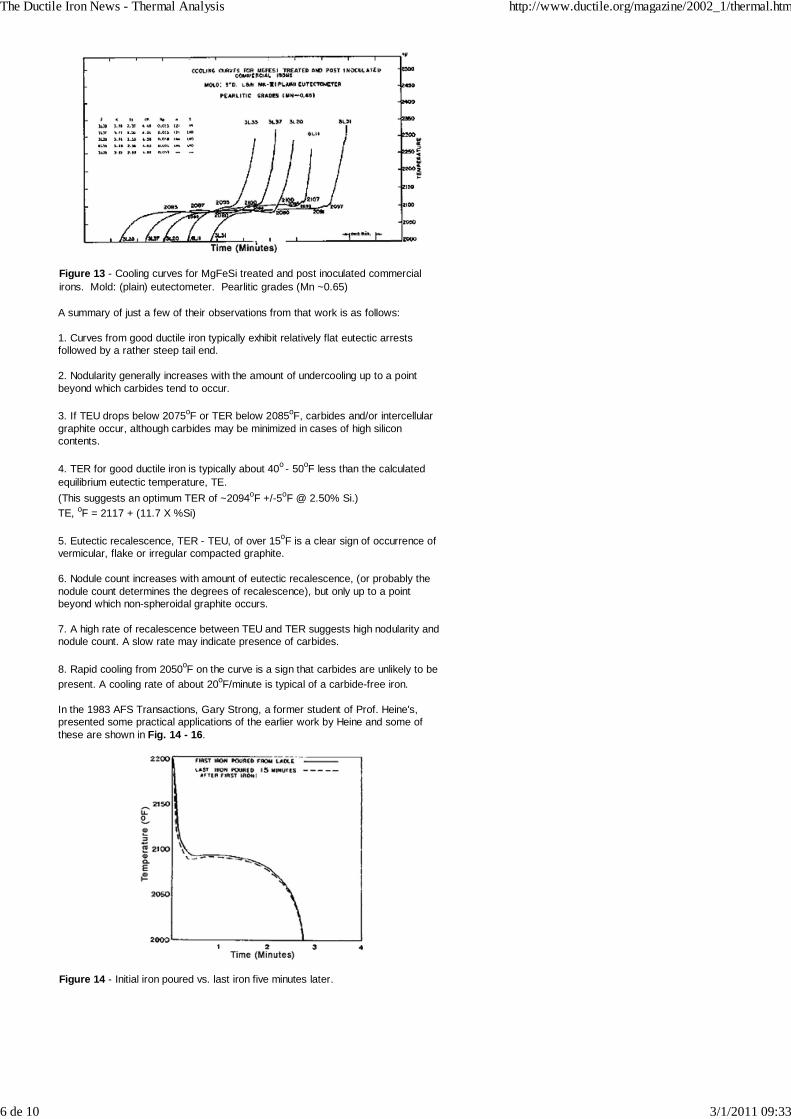
Figure 13 - Cooling curves for MgFeSi treated and post inoculated commercialirons. Mold: (plain) eutectometer. Pearlitic grades (Mn ~0.65)
A summary of just a few of their observations from that work is as follows:
1. Curves from good ductile iron typically exhibit relatively flat eutectic arrestsfollowed by a rather steep tail end.
2. Nodularity generally increases with the amount of undercooling up to a pointbeyond which carbides tend to occur.
3. If TEU drops below 2075oF or TER below 2085oF, carbides and/or intercellulargraphite occur, although carbides may be minimized in cases of high siliconcontents.
4. TER for good ductile iron is typically about 40o - 50oF less than the calculatedequilibrium eutectic temperature, TE. (This suggests an optimum TER of ~2094oF +/-5oF @ 2.50% Si.) TE, oF = 2117 + (11.7 X %Si)
5. Eutectic recalescence, TER - TEU, of over 15oF is a clear sign of occurrence ofvermicular, flake or irregular compacted graphite.
6. Nodule count increases with amount of eutectic recalescence, (or probably thenodule count determines the degrees of recalescence), but only up to a pointbeyond which non-spheroidal graphite occurs.
7. A high rate of recalescence between TEU and TER suggests high nodularity andnodule count. A slow rate may indicate presence of carbides.
8. Rapid cooling from 2050oF on the curve is a sign that carbides are unlikely to bepresent. A cooling rate of about 20oF/minute is typical of a carbide-free iron.
In the 1983 AFS Transactions, Gary Strong, a former student of Prof. Heine's,presented some practical applications of the earlier work by Heine and some ofthese are shown in Fig. 14 - 16.
Figure 14 - Initial iron poured vs. last iron five minutes later.
The Ductile Iron News - Thermal Analysis http://www.ductile.org/magazine/2002_1/thermal.htm
6 de 10 3/1/2011 09:33
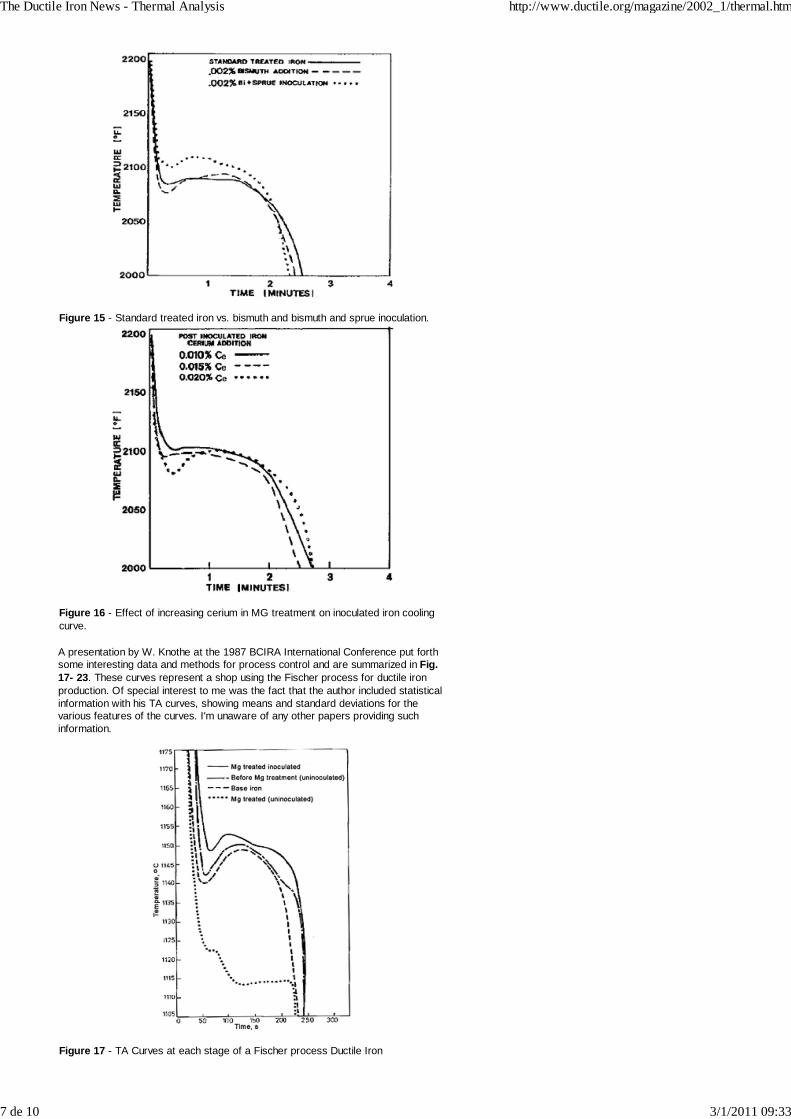
Figure 15 - Standard treated iron vs. bismuth and bismuth and sprue inoculation.
Figure 16 - Effect of increasing cerium in MG treatment on inoculated iron coolingcurve.
A presentation by W. Knothe at the 1987 BCIRA International Conference put forthsome interesting data and methods for process control and are summarized in Fig.17- 23. These curves represent a shop using the Fischer process for ductile ironproduction. Of special interest to me was the fact that the author included statisticalinformation with his TA curves, showing means and standard deviations for thevarious features of the curves. I'm unaware of any other papers providing suchinformation.
Figure 17 - TA Curves at each stage of a Fischer process Ductile Iron
The Ductile Iron News - Thermal Analysis http://www.ductile.org/magazine/2002_1/thermal.htm
7 de 10 3/1/2011 09:33
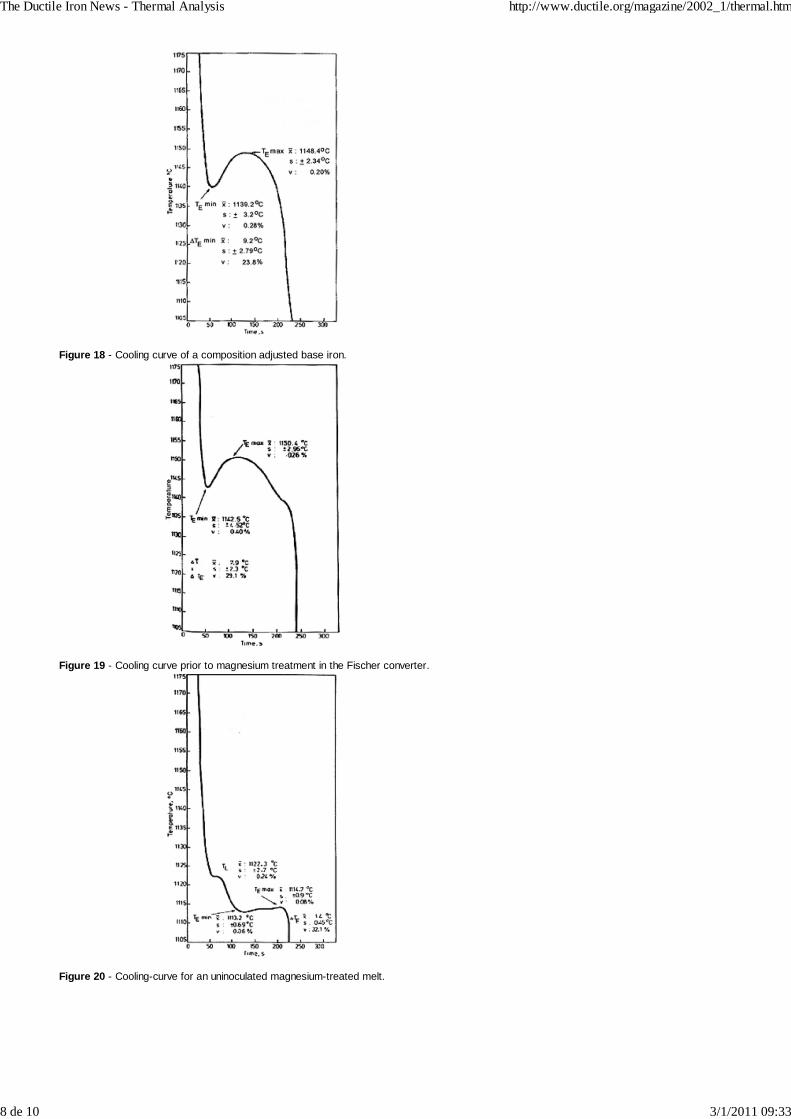
Figure 18 - Cooling curve of a composition adjusted base iron.
Figure 19 - Cooling curve prior to magnesium treatment in the Fischer converter.
Figure 20 - Cooling-curve for an uninoculated magnesium-treated melt.
The Ductile Iron News - Thermal Analysis http://www.ductile.org/magazine/2002_1/thermal.htm
8 de 10 3/1/2011 09:33
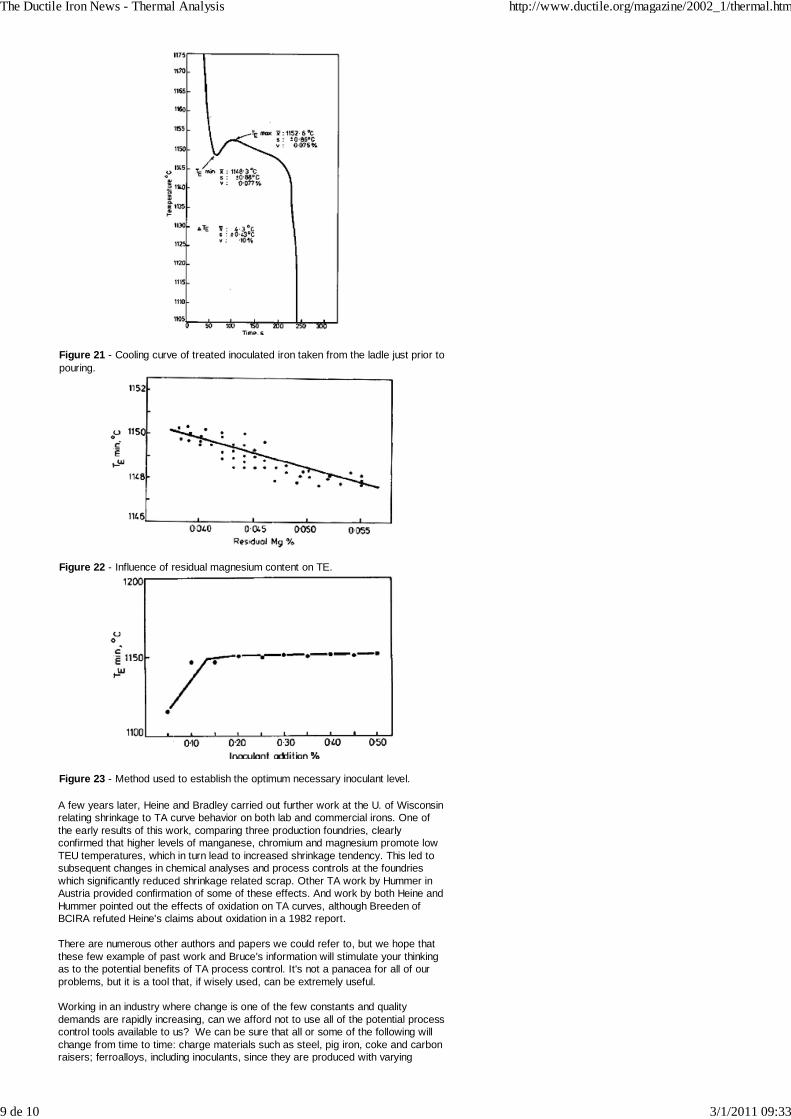
Figure 21 - Cooling curve of treated inoculated iron taken from the ladle just prior topouring.
Figure 22 - Influence of residual magnesium content on TE.
Figure 23 - Method used to establish the optimum necessary inoculant level.
A few years later, Heine and Bradley carried out further work at the U. of Wisconsinrelating shrinkage to TA curve behavior on both lab and commercial irons. One ofthe early results of this work, comparing three production foundries, clearlyconfirmed that higher levels of manganese, chromium and magnesium promote lowTEU temperatures, which in turn lead to increased shrinkage tendency. This led tosubsequent changes in chemical analyses and process controls at the foundrieswhich significantly reduced shrinkage related scrap. Other TA work by Hummer inAustria provided confirmation of some of these effects. And work by both Heine andHummer pointed out the effects of oxidation on TA curves, although Breeden ofBCIRA refuted Heine's claims about oxidation in a 1982 report.
There are numerous other authors and papers we could refer to, but we hope thatthese few example of past work and Bruce's information will stimulate your thinkingas to the potential benefits of TA process control. It's not a panacea for all of ourproblems, but it is a tool that, if wisely used, can be extremely useful.
Working in an industry where change is one of the few constants and qualitydemands are rapidly increasing, can we afford not to use all of the potential processcontrol tools available to us? We can be sure that all or some of the following willchange from time to time: charge materials such as steel, pig iron, coke and carbonraisers; ferroalloys, including inoculants, since they are produced with varying
The Ductile Iron News - Thermal Analysis http://www.ductile.org/magazine/2002_1/thermal.htm
9 de 10 3/1/2011 09:33

charge materials; and nodulizing and inoculating methods. All of these potentiallyaffect our ductile iron process and the resultant metallurgy and consistency of ouriron.
With the foregoing as background, Bruce Blatzer will now summarize some of theTA work on Ductile Iron that we've been doing with our member companies,although recently we've been doing more with Gray Irons. It's far from complete orexhaustive, but we feel that we need to continue encouraging our members and ourindustry to use every tool available to improve the consistency of our iron andcastings.
Thermal Analysis article Part 2
View Ductile Iron Related Publications
Located in Strongsville, Ohio, USA15400 Pearl Road, Suite 234; Strongsville,Ohio 44136 Billing Address: 2802 Fisher Road, Columbus, Ohio 43204Phone (440) 665-3686; Fax (440) 878-0070email:[email protected]
The Ductile Iron News - Thermal Analysis http://www.ductile.org/magazine/2002_1/thermal.htm
10 de 10 3/1/2011 09:33


![MSI 900 Manual - Foundry Gatefoundrygate.com/upload/artigos/MSI 900 Manual[1].pdf · 5.2 Dosing for nodular graphite iron 5.3 Calculation of inoculant addition percentage 5.4 Inoculant](https://img.pdfslide.us/doc/110x75/5b5a9aa57f8b9ab8578c397e/msi-900-manual-foundry-900-manual1pdf-52-dosing-for-nodular-graphite-iron.jpg)