Embed Size (px)
Citation preview
Printed in the Philippines
Asian Development Bank6 ADB Avenue, Mandaluyong City1550 Metro Manila, Philippineswww.adb.org/economicsISSN: 1655-5252Publication Stock No. 050407
About the Asian Development Bank
The work of the Asian Development Bank (ADB) is aimed at improving the welfare of the people in Asiaand the Pacific, particularly the 1.9 billion who live on less than $2 a day. Despite many success stories,Asia and the Pacific remains home to two thirds of the world’s poor. ADB is a multilateral developmentfinance institution owned by 67 members, 48 from the region and 19 from other parts of the globe.ADB’s vision is a region free of poverty. Its mission is to help its developing member countries reducepoverty and improve the quality of life of their citizens.
ADB’s main instruments for providing help to its developing member countries are policy dialogue, loans,technical assistance, grants, guarantees, and equity investments. ADB’s annual lending volume is typicallyabout $6 billion, with technical assistance usually totaling about $180 million a year.
ADB’s headquarters is in Manila. It has 26 offices around the world and has more than 2,000 employeesfrom over 50 countries.
About the PaperJuzhong Zhuang, Zhihong Liang, Tun Lin, and Franklin De Guzman survey theories and practicesin the choice of the social discount rate for cost-benefit analysis of public projects. The issue of choosing an appropriate discount rate for intergenerational projects is also highlighted in light of recent debates on the economics of climate change.
May 2007
ERDECONOMICS AND RESEARCH DEPARTMENT
Working PaperSERIESNo.94
Juzhong Zhuang, Zhihong Liang, Tun Lin, and Franklin De Guzman
Theory and Practice in the Choiceof Social Discount Rate for Cost-Benefit Analysis:A Survey
Theory and Practice in the Choiceof Social Discount Rate for Cost-Benefit Analysis:A Survey
< 0 0 50 4 0 72 >


ERD Working Paper No. 94
Theory and PracTice in The choice of Social diScounT raTe
for coST-benefiT analySiS: a Survey
Juzhong zhuang, zhihong liang, Tun lin, and franklin de guzman
may 2007
Juzhong Zhuang, Tun Lin, and Franklin De Guzman are Assistant Chief Economist, Economist, and Economics Officer, respectively, at the Economic Analysis and Operations Support Division, Economics and Research Department, Asian Development Bank (ADB); and Zhihong Liang is a Ph.D. candidate in Economics at the University of Guelph (Canada). The authors thank Ifzal Ali for guidance in preparing this paper and suggestions in finalizing it; David Dole for initiating this work; and Anneli Lagman-Martin for research assistance. Comments from Ramesh Adhikari, Richard Bolt, Eunkyung Kwon, Herath Gunatilake, Muhammad Ehsan Khan, Donghyun Park, Nigel Rayner, and Hyun Hwa Son are gratefully acknowledged.

Asian Development Bank6 ADB Avenue, Mandaluyong City1550 Metro Manila, Philippineswww.adb.org/economics
©2007 by Asian Development BankMay 2007ISSN 1655-5252
The views expressed in this paperare those of the author(s) and do notnecessarily reflect the views or policiesof the Asian Development Bank.

FoREWoRD
The ERD Working Paper Series is a forum for ongoing and recently completed research and policy studies undertaken in the Asian Development Bank or on its behalf. The Series is a quick-disseminating, informal publication meant to stimulate discussion and elicit feedback. Papers published under this Series could subsequently be revised for publication as articles in professional journals or chapters in books.


CoNtENts
Abstract vii
I. IntroductionI. Introduction 1
II. Theoretical �oundations for the Choice of a Social Discount RateII. Theoretical �oundations for the Choice of a Social Discount Rate 2
A. Approaches to Discounting �uture Bene��ts and Costs��A. Approaches to Discounting �uture Bene��ts and Costs�� Unsettled Debate 2 B. Social Rate of Time Preference 4 C. Marginal Social Opportunity Cost of Capital 9 D. Weighted Average Approach 10 E. Shadow Price of Capital Approach 12 �. Discounting Intergenerational Projects 14
III. The Social Discount Rate in Practice around the World 1III. The Social Discount Rate in Practice around the World 16
A. Countries around the World 1A. Countries around the World 16 B. MDBs and other Supra-National Agencies 19
I�. Concluding Remarks 2I�. Concluding Remarks 21
Appendix�� Estimating the Social Discount Rate Using theAppendix�� Estimating the Social Discount Rate Using the Weighted Average Approach 24
References 2References 26


AbstRACt
The choice of an appropriate social discount rate for cost–bene��t analysis of public projects has long been a contentious issue and subject to intense debate among economists. This debate has gained new impetus from the recent discussions on the economics of climate change. The purpose of this paper is to survey theories and practices in the choice of the social discount rate. More speci��cally, the paper examines economic arguments for discounting future bene��ts and costs and analytical approaches to the choice of the social discount rate, including how a social discount rate can be estimated empirically under each approach; and policy practices followed by countries around the world in the choice of the social discount rate. This paper is intended as a reference material on project economic analysis for ADB staff, consultants, and concerned government of��cials in developing member countries.


I. INtRoDuCtIoN
The choice of an appropriate social discount rate1 for cost–bene��t analysis of public investment projects has long been a contentious issue and subject to intense debate in the economics literature. The recently released The Economics of Climate Change: The Stern Review has added new impetus to this debate (Stern 2006). The Review issued a stunning warning that failing to invest 1 percent of world gross domestic product (GDP) now to reduce global warming could risk a future reduction of up to 20% in global GDP. Critics have argued that these results, dramatically different from earlier studies using the same basic data and analytical structure, depend crucially on a very low social discount rate—1.4%—used in economic modeling. If a higher discount rate more in line with its usual range had been applied, the estimated cost of not acting now would be reduced by an order of magnitude (Nordhaus 2006 and Dasgupta 2006).
A social discount rate reflects a society’s relative valuation on today’s well-being versus well-being in the future. Choosing an appropriate social discount rate is crucial for cost–bene��t analysis, and has important implications for resource allocations. Setting the social discount rate too high could preclude many socially desirable public projects from being undertaken, while setting it too low risks making a lot of economically inef��cient investments. �urther, a relatively high social discount rate, by attaching less weight to bene��t and cost streams that occur in the distant future, favors projects with bene��ts occurring at earlier dates; while a relatively low social discount rate favors projects with bene��ts occurring at later dates. Choice of the social discount rate affects not only the ex ante decision of whether a speci��c public sector project deserves the funding, but also the ex post evaluation of its performance.
Economic ef��ciency requires that the social discount rate measure the marginal social opportunity cost of funds allocated to public investment. In a perfectly competitive world without market distortions, the market interest rate is the appropriate social discount rate. In the real world where markets are distorted, the market interest rate will no longer reflect marginal social opportunity cost of public funds. Economists have proposed several alternative approaches to the choice of the social discount rate in the presence of market distortions, but there has been no consensus on which is the most appropriate. The differences among these approaches reflect largely differing views on how public investment affects domestic consumption, private investment, and the cost of international borrowing. In cases of very long-term projects with impacts lasting for more than one generation or even hundreds of years, such as those addressing climate changes and other environment problems, many have argued that the choice of the social discount rate should not only consider economic ef��ciency, but also intergenerational equity.
There are signi��cant variations in public discount rate policies practised by countries around the world, with developing countries in general applying higher social discount rates (8–15%) than developed countries (3–7%). These variations reflect the different analytical approaches followed by various countries in choosing the social discount rate. But more fundamentally, it can be argued
1 The social discount rate is sometimes also referred to as the cut-off economic internal rate of return (EIRR).

that the divergence reflects differences in the perceived social opportunity cost of public funds across countries and in the extent to which the issue of intergenerational equity is taken into consideration in setting the social discount rate.
The purpose of this paper is to provide a survey of the vast literature on the social discount rate that the decades of debate have generated, covering theory, estimation methods, and policy practices.2 More speci��cally, the rest of the paper attempts to ask and answer the following questions��
(i) What are the economic arguments for discounting future bene��ts and costs and analytical approaches to the choice of the social discount rate?
(ii) How can a social discount rate be estimated empirically under each approach?
(iii) What are the policy practices followed by countries around the world and by multilateral development banks (MDBs) in the choice of the social discount rate?
The choice of social discount rate is also an important issue for MDBs, including the Asian Development Bank (ADB), and has signi��cant relevance for their operations. In both ex ante project economic analysis and ex post project performance evaluation, most MDBs estimate and evaluate bene��ts and costs of development projects using a uniform cut-off discount rate, also called economic internal rate of return (EIRR), of 10–12 percent. This paper is intended not only to provide a reference material on project economic analysis for ADB staff, consultants, and concerned government of��cials of ADB’s developing member countries (DMCs), but also to stimulate discussions among MDBs on whether the current practice of applying a uniform social discount rate of 10–12% to all development projects in all countries is still appropriate in a changing world.
II. thEoREtICAl FouNDAtIoNs FoR thE ChoICE oF A soCIAl DIsCouNt RAtE
A. Approaches to Discounting Future benefits and Costs: unsettled Debate
A public investment project typically incurs costs and generates bene��ts at different points of time. A common practice in cost–bene��t analysis, called discounting, is to express all costs and bene��ts in terms of their present value by assigning smaller weights to those that occur further away in the future than to those occurring more recently. Discounting, a critical step in determining whether or not a public project is socially desirable, makes costs and bene��ts with different time paths comparable.3
There are two arguments why costs and bene��ts with different time pro��les may not be comparable if not properly discounted. The ��rst is that consumers (or savers) prefer to receive the same amount of goods and services sooner rather than later. There are two standard textbook explanations for this time preference (Dasgupta and Pearce 1972). The ��rst is that individuals expect their level of consumption to increase in the future, hence, marginal utility of consumption will diminish. With this expectation, individuals would have to be paid more than one unit in the future to compensate for sacri��cing (saving) one unit of consumption now. The second explanation, which
2 There have been a number of surveys and reviews of this subject in the literature (Stiglitz 1994, Spackman 2004, Evans 2005). Most of these focus either on theory, empirical estimation, or policy practices; not many look at all the three aspects at the same time.
3 Discounting is also required in investment decision making in the private sector where the present value of ��nancial bene��ts of a project is compared with that of ��nancial costs.
� May 2007
Theory and PracTice in The choice of Social diScounT raTe for coST–BenefiT analySiS: a SurveyJuzhong zhuang, zhihong liang, Tun lin, and franklin de guzMan

SecTion iiTheoreTical foundaTionS for The choice of a Social diScounT raTe
has been a subject of great controversy (see Box 1), is that individuals have a positive pure time preference, that is, even if levels of future consumption are not expected to change, they would still discount the future. Two reasons are often quoted in explaining the pure time preference. One is that consumers are generally “impatient” or “myopic.” The other is the risk of not being alive in the future. According to these lines of reasoning, the rate to discount future bene��ts and costs should be the marginal social rate of time preference (SRTP), that is, the rate at which society is willing to postpone a marginal unit of current consumption in exchange for more future consumption.4
The second argument for discounting future costs and bene��ts takes the perspective of a producer (or an investor). According to this, capital is productive and resources acquired for a particular project can be invested elsewhere, generate returns, and so have an opportunity cost. Therefore, to persuade an investor to invest in a project, the expected return from the investment should be at least as high as the opportunity cost of funding, which is the expected return from the next best investment alternative. �ollowing this logic, the rate the investor should use in discounting bene��ts and costs of a project is the marginal rate of return on investment in the private sector. In the absence of market distortions, this is equivalent to the marginal social rate of return on private investment, also termed marginal social opportunity cost of capital (SOC).
In a perfectly competitive economy without distortions, prices of inputs and outputs would reflect their economic or social values. The supply and demand prices of investible funds are given by SRTP and SOC, respectively. The capital market clears at an interest rate that equates the supply of and demand for investible funds. Both SRTP and SOC are equal to the market interest rate. The market interest rate reflects marginal social opportunity cost of investible funds, which is then the appropriate social discount rate to achieve an ef��cient allocation of resources in the economy.
In reality, the market is often distorted due to various imperfections. A typical example of imperfection is the taxes imposed on corporate incomes and individuals’ interest earnings. Other examples are risks, information asymmetry, and externalities. These imperfections create a wedge between SRTP and SOC (with the former generally lower than the latter), and make both deviate from the market interest rate. Under such circumstances, the market interest rate will not reflect the marginal social opportunity cost of public funds, and the latter will vary depending on whether it is measured in terms of SRTP or SOC. What rate then should be used to discount future bene��ts and costs in cost–bene��t analysis? The debate on this has been ongoing for many decades. �our alternative approaches have been put forward�� (i) SRTP, (ii) SOC, (iii) weighted average approach, and (iv) shadow price of capital (SPC) approach. However, there has been no consensus on which is the most appropriate (Boardman et al. 2001). In essence, these different approaches reflect differing views on how public projects affect domestic consumption, private investment, and cost of international borrowing.
Earlier discussions on public sector discounting coincided with the rise of cost–bene��t analysis in the 1960s and 1970s. In the 1990s, the choice of the social discount rate was brought up again in the context of ��nding a rate to discount the long-term environmental bene��ts and costs, such as those related to addressing climate changes and global warming. Here, the problem of choosing an appropriate discount rate is further complicated by the consideration of intergenerational equity. In the following subsections, we review in some detail how the social discount rate can be estimated under each of the four approaches, and the latest debate on how to choose a discount rate for very long-lived environmental projects.
4 Here we disregard the issues involved in aggregating individual preferences into the social preference. See Dasgupta and Pearce (1972) for discussions on these issues.
erd Working PaPer SerieS no. 94 �

b. social Rate of time Preference
The social rate of time preference is the rate at which a society is willing to postpone a unit of current consumption in exchange for more future consumption. The use of SRTP as the social discount rate, supported by Sen (1961), Marglin (1963a and b), Diamond (1968), and Kay (1972), is based on the argument that public projects displace current consumption, and streams of costs and bene��ts to be discounted are essentially streams of consumption goods either postponed or gained. Two alternative methods have been suggested for empirical estimation of SRTP. One is to approximate it by the after-tax rate of return on government bonds or other low-risk marketable securities. Although this is straightforward, a major concern is that individuals may not express all their preferences concerning the future in the marketplace and, even if they do, their preferences expressed as individuals may not be the same as their preferences expressed when they see themselves as part of a society. Society as a whole would have a lower rate of discount in its collective attitude than the observed market rates, which could reflect individuals’ myopia (Dasgupta and Pearce 1972).
The other method is to use a formula named after the renowned British economist �rank P. Ramsey. According to Ramsey’s formula derived from a growth model, SRTP is the sum of two terms�� the ��rst is a utility discount rate reflecting the pure time preference and the second is the product of two parameters—the elasticity of the marginal utility of consumption5 and the annual rate of growth of per capita real consumption (Ramsey 1928). The second term of the formula reflects the fact that, when consumption is expected to grow in the future, people will be less willing to save in the current period to obtain more in the future, because of diminishing marginal utility of consumption. Using the Ramsey formula to empirically estimate SRTP requires information on the utility discount rate (ρ), elasticity of marginal utility of consumption (θ), and annual rate of per capita real consumption growth (g). The choice of g is relatively straightforward while the choice of ρ and θ is more dif��cult, as it involves normative value judgments, and has been a subject of intense debate, as discussed in Box 1.
The utility discount rate, ρ, is conceptually considered as consisting of two components, one related to individuals’ impatience or myopia and the other related to the risk of death or human race extinction.6 Many empirical studies set the ��rst component to zero often on the ethical ground (see, for example, Kula 1984, 1987, and 2004; Cline 1992; Stern 2006). It has also been argued that considering myopia in estimating SRTP implies introducing irrationality into the decision-making process, which is inconsistent with the principle of cost–bene��t analysis, i.e., to bring rationality into investment decisions (Kula 1984). The dif��culty in empirically estimating this ��rst component of pure time preference could also be a reason why many studies have ignored it. On the other hand, setting this to zero does lead to some paradoxical results (see Box 1). Among empirical studies that consider this to be positive, the suggested range is 0–0.5% (OXERA 2002). Scott (1977 and 1989) argues that the long-run savings behavior in the United Kingdom (UK) is consistent with a value of 0.3–0.5% for this component of ρ. Table 1 provides a survey of some of the empirical studies on the utility discount rate including both of its two components. The suggested range is 1–3 percent.5 The elasticity of marginal utility of consumption is the percentage change in individuals’ marginal utility corresponding
to each percentage change in consumption.6 In the literature, some authors relate the pure time preference only to the ��rst component while most relate it to
both. In this paper, we follow the convention used by most authors�� pure time preference reflects both individuals’ impatience and risk of not being alive in the future.
4 May 2007
Theory and PracTice in The choice of Social diScounT raTe for coST–BenefiT analySiS: a SurveyJuzhong zhuang, zhihong liang, Tun lin, and franklin de guzMan
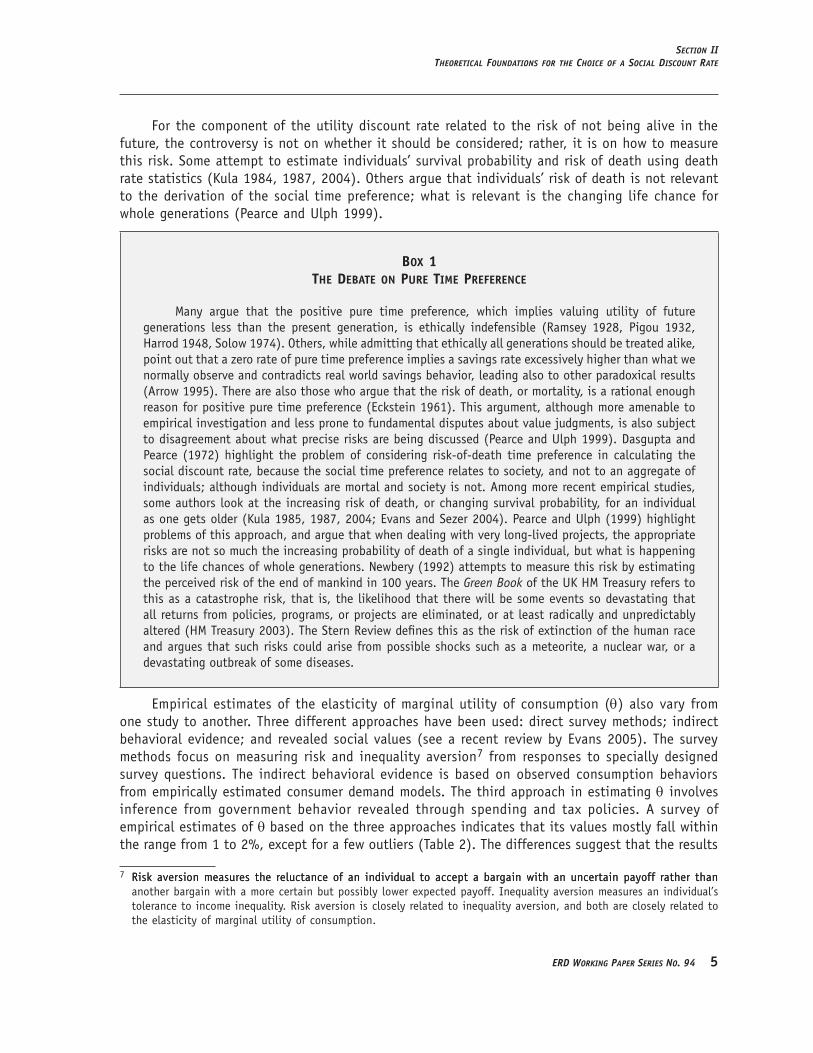
�or the component of the utility discount rate related to the risk of not being alive in the future, the controversy is not on whether it should be considered; rather, it is on how to measure this risk. Some attempt to estimate individuals’ survival probability and risk of death using death rate statistics (Kula 1984, 1987, 2004). Others argue that individuals’ risk of death is not relevant to the derivation of the social time preference; what is relevant is the changing life chance for whole generations (Pearce and Ulph 1999).
box 1The debaTe on Pure Time Preference
Many argue that the positive pure time preference, which implies valuing utility of future generations less than the present generation, is ethically indefensible (Ramsey 1928, Pigou 1932, Harrod 1948, Solow 1974). Others, while admitting that ethically all generations should be treated alike, point out that a zero rate of pure time preference implies a savings rate excessively higher than what we normally observe and contradicts real world savings behavior, leading also to other paradoxical results (Arrow 1995). There are also those who argue that the risk of death, or mortality, is a rational enough reason for positive pure time preference (Eckstein 1961). This argument, although more amenable to empirical investigation and less prone to fundamental disputes about value judgments, is also subject to disagreement about what precise risks are being discussed (Pearce and Ulph 1999). Dasgupta and Pearce (1972) highlight the problem of considering risk-of-death time preference in calculating the social discount rate, because the social time preference relates to society, and not to an aggregate of individuals; although individuals are mortal and society is not. Among more recent empirical studies, some authors look at the increasing risk of death, or changing survival probability, for an individual as one gets older (Kula 1985, 1987, 2004; Evans and Sezer 2004). Pearce and Ulph (1999) highlight problems of this approach, and argue that when dealing with very long-lived projects, the appropriate risks are not so much the increasing probability of death of a single individual, but what is happening to the life chances of whole generations. Newbery (1992) attempts to measure this risk by estimating the perceived risk of the end of mankind in 100 years. The Green Book of the UK HM Treasury refers to this as a catastrophe risk, that is, the likelihood that there will be some events so devastating that all returns from policies, programs, or projects are eliminated, or at least radically and unpredictably altered (HM Treasury 2003). The Stern Review de��nes this as the risk of extinction of the human race and argues that such risks could arise from possible shocks such as a meteorite, a nuclear war, or a devastating outbreak of some diseases.
Empirical estimates of the elasticity of marginal utility of consumption (θ) also vary from one study to another. Three different approaches have been used�� direct survey methods; indirect behavioral evidence; and revealed social values (see a recent review by Evans 2005). The survey methods focus on measuring risk and inequality aversion7 from responses to specially designed survey questions. The indirect behavioral evidence is based on observed consumption behaviors from empirically estimated consumer demand models. The third approach in estimating θ involves inference from government behavior revealed through spending and tax policies. A survey of empirical estimates of θ based on the three approaches indicates that its values mostly fall within the range from 1 to 2%, except for a few outliers (Table 2). The differences suggest that the results
7 Risk aversion measures the reluctance of an individual to accept a bargain with an uncertain payoff rather thanRisk aversion measures the reluctance of an individual to accept a bargain with an uncertain payoff rather than another bargain with a more certain but possibly lower expected payoff. Inequality aversion measures an individual’s tolerance to income inequality. Risk aversion is closely related to inequality aversion, and both are closely related to the elasticity of marginal utility of consumption.
SecTion iiTheoreTical foundaTionS for The choice of a Social diScounT raTe
erd Working PaPer SerieS no. 94 �

are sensitive to model speci��cation, level of aggregation in the data, choice of estimators, sample size, and the length of sample periods.
Table 1emPirical eSTimaTeS of The uTiliTy diScounT raTe
Source emPirical eSTimaTeS TheoreTical baSiS
Scott (1977) 1.5% Component reflecting myopia is 0.5%, and that reflecting the changing life chance due to the risk of total destruction of a society is 1.0%
Kula (1985) 2.2% Reflecting average annual survival probability in the UK during 1900−1975
Kula (1987) 1.2% Reflecting average annual probability of death in the UK in 1975
Scott (1989) 1.3% Component reflecting myopia is 0.3%, and that reflecting the changing life chance due to the risk of total destruction of a society is 1.0%
Newbery (1992) 1.0% Perceived risk of the end of mankind in 100 years
Dynamic Integrated Model of Climate and the Economy (DICE) model (Nordhaus 1993)
3% per year Utility discount rate reflecting pure social time preference, determined by calibrating the DICE model to match actual data
Pearce and Ulph (1995) 1.1% Reflecting the average annual probability of death in the UK in 1991
Arrow (1995) 1% Utility discount rate reflecting pure social time preference, and matching the observed savings behavior
OXERA (2002) Myopia = 0-0.5%Risk of death = 1.1% with a projected change in the near future to 1.0%
Based on previous studies and projected and recent average annual death rates in the UK
Evans and Sezer (2004) 1.0–1.5% 1% for EU countries and 1.5% for non-EU countries, reflecting catastrophe risks
Kula (2004) 1.3% Reflecting the average annual death rate in India during 1965–1995
Evans (2006) 1% Based on the approximate average annual death rate in 2002–2004 in 15 countries of the European Union
Stern Review (2006) 0.1% Probability of human race extinction per year
Sources�� Compiled by authors.
� May 2007
Theory and PracTice in The choice of Social diScounT raTe for coST–BenefiT analySiS: a SurveyJuzhong zhuang, zhihong liang, Tun lin, and franklin de guzMan

Table 2emPirical eSTimaTeS of The elaSTiciTy of marginal uTiliTy of conSumPTion
Source emPirical eSTimaTeS daTeS
A. survey Method
Barsky et al. (1995)
Amiel et al. (1999)
Approximately 4.0
0.2−0.8
Reflecting risk aversion of the US middle-aged who were surveyed
Reflecting inequality aversion of US students who were surveyed
b. Indirect behavioral Evidence
Constant elasticity demand modelsKula (1984) Kula (1984)Evans and Sezer (2002)Evans (2004a) Kula (2004) Evans et al. (2005) Percoco (2006)
Almost ideal demand systemBlundell (1988)Evans (2004b)
Lifetime consumption modelBlundell et al. (1994)
Quadratic almost ideal demand system Blundell et al. (1993)
Banks et al. (1997)
1.561.891.641.61.641.61.28
1.971.33
1.2−1.4
1.061.06–1.371.07
Canada�� 1954–1976 dataUS�� 1954–1976 dataUK�� 1967–1997 dataUK�� 1965–2001 dataIndia�� 1965–1995 dataUK�� 1963–2002 dataItaly�� 1980–2004 data
UK�� 1970–1984 data�rance�� 1970–2001 data
UK�� 1970–1986 data
UK�� 1970–1984 dataAggregate modelMicro modelsUK�� 1970-1986 data
C. Revealed social Values
Cowell and Gardiner (1999) Evans and Sezer (2004)Evans (2005)
1.28-1.411.51.25-1.45
UK�� 1999–2000 dataUK�� 2001–2002 data�ive major OECD countries (�rance, Germany, Japan, UK, US)�� 2002–2003 data
Sources�� Evans (2005); compiled by authors.
SecTion iiTheoreTical foundaTionS for The choice of a Social diScounT raTe
erd Working PaPer SerieS no. 94 �
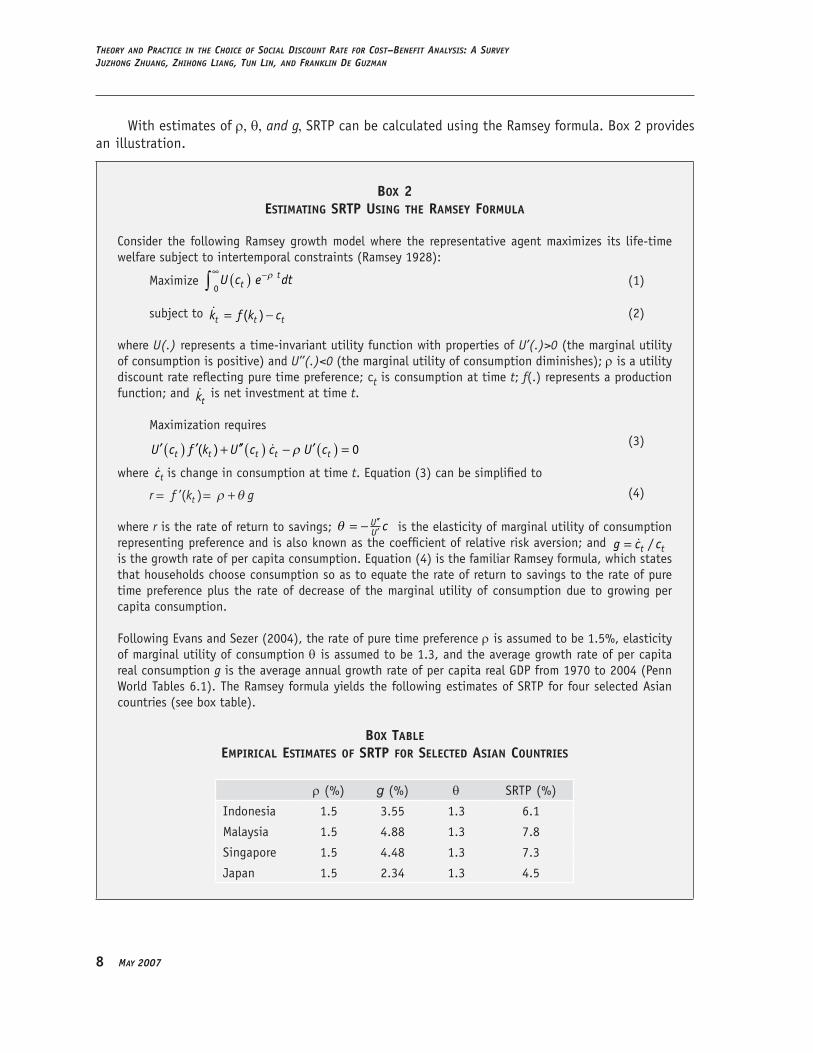
With estimates of ρ, θ, and g, SRTP can be calculated using the Ramsey formula. Box 2 provides an illustration.
box 2eSTimaTing SrTP uSing The ramSey formula
Consider the following Ramsey growth model where the representative agent maximizes its life-time welfare subject to intertemporal constraints (Ramsey 1928)��
Maximize U c e dttt( )∞ −∫
0ρ (1)
subject to k f k ct t t= −( ) (2)
where U(.) represents a time-invariant utility function with properties of U’(.)>0 (the marginal utility of consumption is positive) and U’’(.)<0 (the marginal utility of consumption diminishes); ρ is a utility discount rate reflecting pure time preference; ct is consumption at time t; f(.) represents a production function; and kt
is net investment at time t.
Maximization requires
′( ) ′ + ′′( ) − ′( ) =U c f k U c c U ct t t t t( ) ρ 0 (3)
where ct is change in consumption at time t. Equation (3) can be simpli��ed to
r f k gt= = +’( ) ρ θ (4)
where r is the rate of return to savings; θ = − ′′′
UU c is the elasticity of marginal utility of consumption
representing preference and is also known as the coef��cient of relative risk aversion; and g c ct t= / is the growth rate of per capita consumption. Equation (4) is the familiar Ramsey formula, which states that households choose consumption so as to equate the rate of return to savings to the rate of pure time preference plus the rate of decrease of the marginal utility of consumption due to growing per capita consumption.
�ollowing Evans and Sezer (2004), the rate of pure time preference ρ is assumed to be 1.5%, elasticity of marginal utility of consumption θ is assumed to be 1.3, and the average growth rate of per capita real consumption g is the average annual growth rate of per capita real GDP from 1970 to 2004 (Penn World Tables 6.1). The Ramsey formula yields the following estimates of SRTP for four selected Asian countries (see box table).
box TableemPirical eSTimaTeS of SrTP for SelecTed aSian counTrieS
ρ (%) g (%) θ SRTP (%)
Indonesia 1.5 3.55 1.3 6.1
Malaysia 1.5 4.88 1.3 7.8
Singapore 1.5 4.48 1.3 7.3
Japan 1.5 2.34 1.3 4.5
� May 2007
Theory and PracTice in The choice of Social diScounT raTe for coST–BenefiT analySiS: a SurveyJuzhong zhuang, zhihong liang, Tun lin, and franklin de guzMan

A major criticism on using SRTP as the social discount rate is that it is purely a measure of the social opportunity cost in terms of foregone consumption and ignores the fact that public projects could displace or crowd out private sector investment if they cause the market interest rate to rise (Baumol 1968 and Harberger 1972). If additional public investment is made at the cost of displacing private investment, its marginal social opportunity cost should also reflect what the displaced private investment would otherwise bring to the society, which can be measured by the marginal social rate of return on private sector investment (SOC).8 Since SRTP is generally lower than SOC because of the wedge created by market distortions such as taxes, this raises the possibility that too many low-return investments in the public sector would be undertaken when SRTP is used as the social discount rate.
C. Marginal social opportunity Cost of Capital
The proposal for using the marginal social opportunity cost of capital (SOC) as the social discount rate, advocated by Mishan (1967), Baumol (1968), and Diamond and Mirrlees (1971a and b), among others, is based on the argument that resources in any economy are scarce; that government and private sector compete for the same pool of funds; that public investment displaces private investment dollar by dollar; and those devoted to public sector projects could be invested in the private sector. Therefore, public investment should yield at least the same return as private investment. If not, total social welfare can be increased by reallocating resources to the private sector, which yields higher returns.
It has been suggested that SOC could be approximated by the marginal pretax rate of return on riskless private investments. A good proxy for this is the real pretax rate on top-rated corporate bonds (Moore et al. 2004). Box 3 provides an illustration of estimating the marginal rate of return based on Moody’s AAA bonds. Some have argued that SOC, as estimated in Box 3 should be adjusted downward for a number of reasons (Lind 1982, Boardman et al. 2001). �irst, in theory, the marginal pretax rate of return, rather than the average rate, should be used in estimating SOC. The marginal rate of return will be lower than the average rate as rational businessmen will make their best deal ��rst. Second, the rate of return on private investment includes premiums to compensate investors for risks that are generally higher than those for public sector investment. Third, returns on private investment as social opportunity cost of capital may also be contaminated by market distortions such as externalities and monopolistic pricing.
box 3eSTimaTing Soc from yieldS on corPoraTe bondS
Based on the method used by Boardman et al. (2001), the average annual yield on Moody’s AAA long-term corporate bonds was estimated at 6.81% from January 1947 to December 2005 in the United States (US). Applying the 2004 corporate tax rate of 40% (KPMG 2004), the nominal pre-tax return on bonds was calculated at [0.0681 / (1- 0.38)] = 11.35 percent. A proxy for the expected rate of inflation is the average annual inflation rate, which was 3.78% between 1947 and 2005 in the United States. Therefore, the real pretax rate of return on top-rated corporate bonds in the US is [(0.1135 – 0.0378) / (1+0.0378)] = 7.29%, which approximates SOC.
8 This can be approximated by the pretax rate of return on private investment. See discussions in the next subsection.
SecTion iiTheoreTical foundaTionS for The choice of a Social diScounT raTe
erd Working PaPer SerieS no. 94 9

Dasgupta, Marglin, and Sen (1972), on the other hand, note that the argument for using SOC as the social discount rate is only justi��ed in the context of a two-period model where the total amount of capital available for investment is ��xed independently of project choice in the public sector. In this case, the public investment displaces (or crowds out) private investment dollar for dollar, and the marginal rate of return on private investment (inclusive of taxes) provides an adequate measure of SOC. But when either assumption (two-period model or ��xed amount of capital) is dropped, the argument would not hold anymore. If capital needed for ��nancing public projects is partially satis��ed by consumers postponing their current consumption, the return required by consumers usually is less than the marginal rate of return on private investment; hence, the social discount rate should be lower than SOC.
D. Weighted Average Approach
Previous discussions suggest that using SRTP to discount future costs and benefits is problematic since it does not take into account impacts of public projects on funds available for private investment. Using SOC as the social discount rate, on the other hand, assumes that public investment only displaces private investment and not private consumption, which is also not always true in reality. The weighted average approach, associated with contributions by, among others, Harberger (1972), Sandmo and Drèze (1971), and Burgess (1988), attempts to reconcile the SRTP approach with that of SOC.
Proponents of the weighted average approach recognize that sources of funds available to public projects may come from displacing private investment, inducing consumers to postpone current consumption, and, in the case of an open economy, borrowing from international capital markets. The social opportunity costs of funds from these various sources are different because of market distortions such as taxes. Thus, the social discount rate should be the weighted average of SOC, SRTP, and the cost of foreign borrowing, with weights reflecting proportions of funds obtained from their respective sources. Harberger (1972) argues that SOC may differ from one productive sector to another and SRTP could also vary among different groups of savers (reflecting, for instance, different tax brackets); therefore, SOC and SRTP themselves should be the weighted average of those of various productive sectors or saver groups. Burgess (1988) suggests that the weights depend also on the degree of complementarity or substitutability between public and private investment, but points out that the positive externalities of public investment due to its complementarity can be considered as part of bene��t streams and, in that case, no adjustments to the weights are necessary.
�or a closed economy, if the supply of funds is perfectly inelastic, a public sector project will displace only private investment, so the weight for SRTP will be zero and the social discount rate will be equal to SOC. If, on the other hand, the demand for funds is perfectly inelastic, a public project will only displace current consumption, the weight for SOC will be zero, and the social discount rate will be equal to SRTP. In general, it is believed that both the supply and demand of investible funds respond to changes in the market interest rate, so the social discount rate will lie somewhere between the two extremes. Harberger (1972), however, argues that the accumulated econometric evidence on investment functions clearly shows that many categories of investment are quite sensitive to changes in the interest rate, while evidence that savings are responsive to interest rate changes is only scanty. Hence, there is a reasonable presumption that the relevant weighted average will be reasonably close, if not precisely equal, to SOC.
10 May 2007
Theory and PracTice in The choice of Social diScounT raTe for coST–BenefiT analySiS: a SurveyJuzhong zhuang, zhihong liang, Tun lin, and franklin de guzMan

�or an open economy where capital is mobile across countries, it is expected that the domestic interest rate will be related in some way to the interest rate at which the country can borrow in the world capital market (Sandmo and Drèze 1971, Edwards 1986, Lind 1990). In the extreme case of a small open economy with perfect capital mobility, risk neutrality, pegged exchange rate (with zero expected devaluation), and an in��nitely elastic supply of foreign capital, public projects will displace neither domestic consumption nor private investment. The weights for SOC and SRTP will, therefore, both be zero and the social discount rate will be equal to the international borrowing rate. However, Edwards (1986) argues that even a small economy with perfect capital mobility will face an upward-sloping supply curve of foreign capital. One justi��cation is that a higher level of foreign indebtedness could be related to a higher probability of default as perceived by lenders, and to a higher cost at which this particular country can borrow from the international capital market. In this case, a public project that is (partially) ��nanced with additional foreign debt will result in a higher rate charged on foreign loans, and perhaps, higher domestic interest rates as well since the two are linked. Therefore, a public project will be ��nanced partially by an increase in foreign debt, and partially by an increase in private savings and a reduction in private investment. Then, in the presence of country risk premiums, the social discount rate will be a weighted average of SOC, SRTP, and the international borrowing rate inclusive of risk premiums.9 In another extreme, if a country faces credit rationing from abroad, the new demand for public funds will be met fully by additional domestic private savings and displaced private investment. Then, the social discount rate will be a weighted average of only SOC and SRTP.
A key challenge in the empirical estimation of the social discount rate using the weighted average approach is to determine the weights attached to SRTP, SOC, and the international borrowing rate, as well as weights for SRTPs of various saver groups and for SOCs of various productive sectors. Harberger (1972) provides a formula for calculating the social discount rate using the weighted average approach in the case of a closed economy, where the weights are estimated from interest derivatives (the responses of private investment and savings to changes in market interest rates), which can also be expressed in terms of elasticities. Sandmo and Drèze (1971) expands the formula to an open economy context by incorporating the international borrowing rate, with weights being estimated from the interest derivatives of the domestic and foreign supplies of funds. Based on Harberger and Jenkins (2002), Box 4 provides an example using the weighted average approach to estimate the social discount rate, assuming varying SRTP among saver groups, varying SOC among productive sectors, taxation on interest earnings (including withholding tax for foreign savers) and on investment returns, and an upward-sloping supply curve of foreign capital.
A major criticism on the weighted average approach is that, while it recognizes that costs of public investment can displace private investment, it assumes that bene��ts will be consumed immediately and ignores the fact that they could also be reinvested in the private sector, generate future consumption, and bring more social value than if they were consumed immediately. Recognizing higher social cost of displaced private investment than displaced consumption, while ignoring the higher social value of project bene��ts that are reinvested than immediately consumed, leads to overdiscounting of project bene��ts. This overdiscounting will be higher the farther in the future 9 Edwards (1986) argued that whether this higher interest rate should be considered as a higher cost of borrowing
will depend on the relationship between the probability of default as perceived by the lenders and by borrowers. If the perceived probability of default is the same for lenders and borrowers, the higher interest rate charged to the developing country will not represent a higher economic cost of foreign funds. But in general, the perceived probability of default is different between lenders and borrowers (the former is mostly greater than the latter); the risk premium does constitute economic cost for a borrowing country.
SecTion iiTheoreTical foundaTionS for The choice of a Social diScounT raTe
erd Working PaPer SerieS no. 94 11
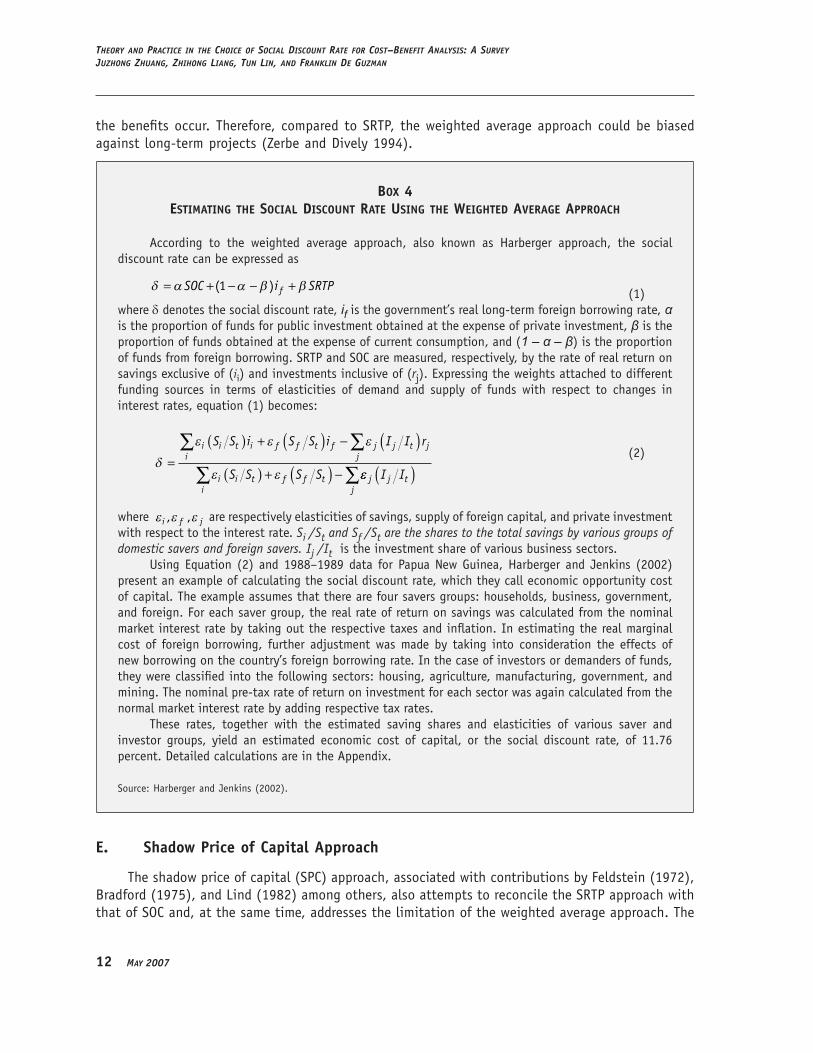
the bene��ts occur. Therefore, compared to SRTP, the weighted average approach could be biased against long-term projects (Zerbe and Dively 1994).
box 4eSTimaTing The Social diScounT raTe uSing The WeighTed average aPProach
According to the weighted average approach, also known as Harberger approach, the social discount rate can be expressed as
δ α α β β= + − − +SOC i SRTPf( )1 (1)where δ denotes the social discount rate, if is the government’s real long-term foreign borrowing rate, α is the proportion of funds for public investment obtained at the expense of private investment, β is the proportion of funds obtained at the expense of current consumption, and (1 – α – β) is the proportion of funds from foreign borrowing. SRTP and SOC are measured, respectively, by the rate of real return on savings exclusive of (ii) and investments inclusive of (rj). Expressing the weights attached to different funding sources in terms of elasticities of demand and supply of funds with respect to changes in interest rates, equation (1) becomes��
δ
ε ε ε
ε ε=
( ) + ( ) − ( )( ) + ( ) −
∑ ∑
∑
i i t ii
f f t f j j t jj
i i ti
f f t
S S i S S i I I r
S S S S εε j j tj
I I( )∑ (2)
where ε ε εi f j, , are respectively elasticities of savings, supply of foreign capital, and private investment with respect to the interest rate. Si /St and Sf /St are the shares to the total savings by various groups of domestic savers and foreign savers. Ij /It is the investment share of various business sectors.
Using Equation (2) and 1988–1989 data for Papua New Guinea, Harberger and Jenkins (2002) present an example of calculating the social discount rate, which they call economic opportunity cost of capital. The example assumes that there are four savers groups�� households, business, government, and foreign. �or each saver group, the real rate of return on savings was calculated from the nominal market interest rate by taking out the respective taxes and inflation. In estimating the real marginal cost of foreign borrowing, further adjustment was made by taking into consideration the effects of new borrowing on the country’s foreign borrowing rate. In the case of investors or demanders of funds, they were classi��ed into the following sectors�� housing, agriculture, manufacturing, government, and mining. The nominal pre-tax rate of return on investment for each sector was again calculated from the normal market interest rate by adding respective tax rates.
These rates, together with the estimated saving shares and elasticities of various saver and investor groups, yield an estimated economic cost of capital, or the social discount rate, of 11.76 percent. Detailed calculations are in the Appendix.
Source�� Harberger and Jenkins (2002).
E. shadow Price of Capital Approach
The shadow price of capital (SPC) approach, associated with contributions by �eldstein (1972), Bradford (1975), and Lind (1982) among others, also attempts to reconcile the SRTP approach with that of SOC and, at the same time, addresses the limitation of the weighted average approach. The
1� May 2007
Theory and PracTice in The choice of Social diScounT raTe for coST–BenefiT analySiS: a SurveyJuzhong zhuang, zhihong liang, Tun lin, and franklin de guzMan

SPC approach recognizes that while costs of a public project can displace private investment, its bene��ts can also be reinvested in the private sector. In terms of generated future consumption streams, these bene��ts are worth more to society than if they are consumed immediately. Thus, the total cost of a public project is the sum of the current consumption that is directly displaced and those future consumption streams that are foregone due to the displacement of private investment. Similarly, the total bene��t of a public project is the sum of those immediately consumed and those future consumption streams generated from reinvestment.
The SPC approach involves four steps. The ��rst is estimating SPC, which is the present value of streams of future consumption foregone arising from displacing one unit of private investment or the present value of future consumption streams generated from reinvesting one unit of project bene��ts in the private sector. The second step involves, for each time period, converting all the costs and bene��ts that either displace or generate private investment into consumption equivalents by multiplying them by SPC. The third step is adding these costs and bene��ts to the other portions of costs (in the form of directly displaced consumption) and of bene��ts (in the form of immediate consumption), respectively. �inally, discount the total cost and bene��t streams at SRTP to calculate the net present value (NP�) (see Box 5).
Zerbe and Dively (1994) discussed a number of situations where costs and bene��ts need not be adjusted by SPC��
(i) �or a closed economy, if the fraction of bene��ts that return to private capital is equal to the fraction of costs that displace private investment, adjusting the costs and bene��ts by SPC does not change the sign of the NP� of a project. In this case, a project is socially desirable if the NP� is positive when applying SRTP as a discount rate to the ordinary costs and bene��ts. This is likely the case for many environmental projects where bene��ts are costs avoided whose ��nancing is similar to initial costs.
(ii) �or an open economy, if the supply of capital is highly or perfectly elastic, the displaced and generated private investment will be small and be similar in size, or both, will be zero, and it is then suf��cient to discount bene��ts and costs by the international borrowing rate without adjusting them by SPC.
(iii) �or least-cost analysis (also referred to as cost-effectiveness analysis), the goal is to compare the costs of alternative methods of producing the same output. As long as the ��nancing of the various alternatives is similar, adjustment by SPC is not warranted.
When project costs and bene��ts need to be adjusted by SPC, empirical estimation of SPC is warranted, which requires information on the following parameters�� SOC, SRTP, depreciation rate, and marginal propensity to save. Lyon (1990) provides two alternative formulas to calculate SPC. One applies when the savings rate is expressed in terms of the gross return, and the other applies when the savings rate is expressed in terms of the return net of depreciation. Box 5 provides these formulas. The application of the SPC approach requires further information on proportions of displaced consumption and private investment due to project costs, and proportions of generated consumption and reinvestment due to project bene��ts.
The SPC approach, although theoretically attractive (see �eldstein 1972, Bradford 1975, Lind 1982) is dif��cult to implement. The value of SPC is very sensitive to the values of SRTP and SOC, to how depreciation and reinvestment are assumed, and to the length of life of a project. Lyon (1990) shows that the value of SPC could vary from about one to in��nity, depending on different
SecTion iiTheoreTical foundaTionS for The choice of a Social diScounT raTe
erd Working PaPer SerieS no. 94 1�

assumptions on the values of the various parameters. Harberger and Jenkins (2002) argue that if the SPC approach is employed, a different shadow price of capital has to be estimated for every project according to the length of life of the project. This could be very confusing for policymakers in the government decision-making process, many of whom are noneconomists.
box 5The ShadoW Price of caPiTal aPProach
Consider a project with a lifespan of n years, bene��t streams, Bt, and cost streams, Ct. The net present value of the project will be
NP� = B C
i
B V C V
it t
tt
nt b b t c c
t
* *
( ) ( )
−+
=+ −( ) − + −( )
+=∑
1
1 1
10
φ φ φ φ
tt
n
=∑
0 (1)
where Bt* is the consumption equivalents of bene��ts at time t; Ct
* is the consumption equivalents of costs at time t; φb is the fraction of bene��ts that return to the private sector for investment; φc is the fraction of costs that displace private investment; i is SRTP; and V is SPC. Lyon (1990) provides two alternative formulas to calculate V��
Vr sr
i d sr= −
+ − (2)where r is the gross rate of return on private investment prior to depreciation, d is the depreciation rate, and s is the rate of savings from the gross return; and
Vi
= −−
λ σλσλ
(3)where λ is the rate of return from private investment net of depreciation, and σ is the rate of saving from the net return.
Source�� Zerbe and Dively (1994).
F. Discounting Intergenerational Projects
�rom the mid-1990s, with the growing concerns over climate changes, global warming, and other environmental problems, there has been a renewed interest on whether and how discounting should be applied to long-term projects, the effects of which spread over more than one generation (more than 30–40 years) or even hundreds of years, and whose present values are extremely sensitive to the choice of the discount rate. In evaluating intragenerational projects, it could be argued that the main issue is to achieve ef��cient allocation of scarce resources, thus the discount rate should reflect the economic opportunity cost of capital. When evaluating intergenerational projects, identifying an appropriate discount rate involves an additional challenge of considering intergenerational equity.
What is common to the four approaches described above is that the discount rate, whatever it is, is time-invariant, implying that discounting would be exponential. With a constant discount rate, bene��ts and costs that occur in the distant future will become very small in terms of their
14 May 2007
Theory and PracTice in The choice of Social diScounT raTe for coST–BenefiT analySiS: a SurveyJuzhong zhuang, zhihong liang, Tun lin, and franklin de guzMan

present value. Thus, it seems not worth investing even a little to avoid potential catastrophic consequences of some environment problems if they will occur only far into the future. Since bene��ciaries of projects dealing with such type of problems will be future generations, attaching very small weights to future bene��ts implied by exponential discounting does pose a question of whether it is “ethically indefensible.” Put simply�� why should the well-being derived from the same level of consumption of any future generation be given less weight than for the current generation on the grounds of individuals being impatient? Many believe that this is not ethical, and the pure rate of time preference should be zero. Others argue that weighting generations equally leads to paradoxical and even nonsensical results (see Box 1). Apart from the ethical issue, exponential discounting implies that the importance of a cataclysmic event happening four centuries from now is much less signi��cant relative to that of a cataclysmic event occurring, say, three centuries from now. Weitzman (1998) argues that “almost no one really feels this way about the distant future.”
Some have proposed a solution to the problem, which involves using a declining discount rate, namely, “hyperbolic discounting” (Weitzman 1994, 1998, 2001; Henderson and Langford 1998; Cropper and Laibson 1998). Hyperbolic discounting hypothesizes that the discount function with regard to time is shaped like a hyperbola, thus allowing the discount rate to decline with time according to some predetermined trajectory and raising the weight attached to the welfare of future generations. According to Weitzman (1998), “near future” and “far future” should be viewed differently because of different levels of uncertainties involved. Compared to the near future, the far distant future has much greater uncertainties about economic growth, rate of capital accumulation, state of the environment, pace of technological progress, rate of pure time preference, etc. As a result, there is a wide range of possible discount rates for the far future, and a “certainty equivalent discount rate” should be calculated as a weighted average of these possible discount rates. He shows that the “certainty equivalent discount rate” equals the lowest possible discount rate.10 This way he explains why different discount rates should be used for near future projects and far distant future ones. Over the past decades, there has also been increasing evidence from experiments conducted by economists and psychologists, which suggests that people do use a declining discount rate in making intertemporal choices (Weitzman 2001).
A conceptual problem with time-declining discounting is that it leads to time-inconsistent planning�� a person who applies a hyperbolic discount rate will not carry out the consumption plans made today and reverse the decisions in the future even though no new information emerges (Cropper and Laibson 1998). Due to this type of problem, some have suggested that intergenerational equity should be treated directly rather than through adjusting the discount rate (Lesser and Zerbe 1995, Schelling 1995). More speci��cally, some argue that in the context of global warming mitigation, one should not simply lower the discount rate used to evaluate costs and bene��ts of projects; in cases where there may be signi��cant irreversibility and potential questions of intergenerational equity, one should not rely on the project discount rate alone. Instead, a full analysis of all these concerns and options should be carried out separately and explicitly for informed choice and decision-making (Lind 1997, Nordhaus 1999, Kopp and Portney 1999, and Toman 1999). Henderson and Bateman (1995) suggest that discount rate sensitivity analysis may include hyperbolic discount rate results
10 This is best illustrated through an example (Spackman 2004). Suppose in the long term that the discount rate is believed to be either 2% or 4%, with equal likelihood. The project bene��ts are worth $1 million in 500 years. The present value of the $1 million in 500 years would be $50 using 2% discount rate, and almost $0 using 4% discount rate. Since two discount rates have an equal likelihood to occur, the expected present value of the project is about $25, the average of $50 and $0. This gives an “effective discount rate” of 2.1%, close to the lower end of two possibilities.
SecTion iiTheoreTical foundaTionS for The choice of a Social diScounT raTe
erd Working PaPer SerieS no. 94 1�
along with classical constant discount rate results for intergenerational projects. There is also a suggestion that the dilemma in the choice of the social discount rate for intergenerational projects could be resolved by realizing that the problem is one of concern over missing values to ignoring ethical values. This de��ciency could be overcome by incorporating moral values directly into the cost–bene��t analysis and, inter alia, recognizing all values for which there is a willingness to pay (Zerbe 2005).
Despite the debates, there appears a general agreement that the SRTP should be used in discounting intergenerational projects. The Stern Review applies an SRTP of 1.4% to discount damages of global warming, estimated using the Ramsey formula. It is the sum of two numbers�� 0.1%, which is the rate of pure time preference reflecting solely the assumed risk of human race extinction,11 and 1.3%, which is the product of a unity elasticity of marginal utility of consumption and an expected annual growth rate of per capita real consumption reflecting the diminishing marginal utility of consumption. Nordhaus (2006), in his critique of the Stern Review, argues that the near-zero rate of pure time preference combined with the unity elasticity of the marginal utility of consumption is inconsistent with key economic variables observable in the real world such as the real interest rate and saving rate. To match the observed values of these variables, either a higher rate of pure time preference or higher elasticity of marginal utility of consumption has to be assumed, implying a much higher social discount. Using the Dynamic Integrated Model of Climate and the Economy (DICE), he shows that if the rate of pure time preference is raised from 0.1% (as assumed by the Stern Review) to 3% at the beginning, then declining slowly to about 1% in 300 years (matching key economic variables observable in the real world), the optimal base year (2005) carbon price would decrease from $159 to $17–20 per ton.12 He concluded that the radical revision of the economics of climate change proposed by the Stern Review depends decisively on the assumption of a near-zero rate of social time preference.
III. thE soCIAl DIsCouNt RAtE IN PRACtICE ARouND thE WoRlD
Since there is no consensus as to which approach is the most appropriate for the choice of a social discount rate, it is not surprising that there are signi��cant variations in public discount rate policies in different countries around the world. This section provides a survey of the social discount rate policies in practice used by countries around the world and by multilateral development banks.
A. Countries around the World
A survey of social discount rate policies of individual countries around the world show signi��cant variations. Even within a country, different government agencies may have their own policy. Table 4 summarizes the discount approaches and rates adopted in selected countries.
11 The Stern Review therefore disregards the “impatience” related argument for discounting.12 Developed by William D. Nordhaus, the DICE model is one of the economic models widely used to estimate costs and
bene��ts of different paths for slowing climate change and for analyzing the impact of control strategies over time (Nordhaus 1994). The optimal carbon price, or carbon tax, sometimes also called the “social cost of carbon”, is the calculated price of carbon emissions that will balance the incremental costs of reducing carbon emissions with the incremental bene��ts of reducing climate damages.
1� May 2007
Theory and PracTice in The choice of Social diScounT raTe for coST–BenefiT analySiS: a SurveyJuzhong zhuang, zhihong liang, Tun lin, and franklin de guzMan

SecTion iiiThe Social diScounT raTe in PracTice around The World
Table 4Social diScounT raTeS in SelecTed counTrieS
counTry/ agency diScounT raTe TheoreTical baSiS
Australia 1991�� 8%; current�� SOC rate annually reviewed
SOC approach
Canada 10% SOC approach
People’s Republic of China
8% for short and medium term projects; lower than 8% rate for long-term projects
Weighted average approach
�rance Real discount rate set since 1960; set at 8% in 1985 and 4% in 2005
1985�� To keep a balance between public and private sector investment2005�� SRTP approach
Germany 1999�� 4%2004�� 3%
Based on federal re��nancing rate, which over the late 1990s was 6% nominal; average GDP deflator (2%) was subtracted giving 4% real
India 12% SOC approach
Italy 5% SRTP approach
New Zealand (Treasury)
10% as a standard rate whenever there is no other agreed sector discount rate
SOC approach
Norway 1978�� 7% 1998�� 3.5%
Government borrowing rate in real terms
Pakistan 12% SOC approach
Philippines 15% SOC approach
Spain 6% for transport; 4% for water SRTP approach
United Kingdom 1967�� 8%1969�� 10%1978�� 5%1989�� 6%2003�� 3.5%Different rates lower than 3.5% for long-term projects over 30 years
SOC approach until early 1980s; thereafter SRTP approach
continued.
erd Working PaPer SerieS no. 94 1�

US (Of��ce of Management and Budget)
Before 1992�� 10%; after 1992�� 7% Mainly SOC approach with the rate being derived from pretax return to private sector investment
Other approaches (SPC, Treasury borrowing rates) are also mentioned
US (Congressional Budget Of��ce and General Accounting Of��ce)
Rate of marketable Treasury debt with maturity comparable to project span
SRTP approach
US (Environmental Protection Agency)
Intragenerational discounting�� 2–3% subject to sensitivity analysis in the range of 2–3% and at 7%, as well as presentation of undiscounted cost and bene��t streams
Intergenerational discounting�� presentation of undiscounted cost and bene��t streams subject to sensitivity analysis in the range of 0.5–3% and at 7%
SRTP approach
Sources�� Compiled by ADB staff.
In North America, Canada uses a rate of 10% based on the SOC approach, while in the US, the situation is more complicated. The US Of��ce of Management and Budget (OMB) uses a discount rate that approximates the marginal pretax rate of return on private investment, thus following the SOC approach. In the 1970s and 1980s, it was speci��ed at 10 percent. In 1992, OMB revised the discount rate to 7% (OMB 2003). The OMB also takes the view that the SPC discounting is “the analytically preferred means of capturing the effects of government projects on resource allocation in the private sector.” In its Circular A-94, OMB indicates that the Treasury borrowing rates should be used as the discount rate in cost-effectiveness analysis, lease-purchase analysis, internal government investments, and asset sale analysis.
The US Congressional Budget Of��ce and the General Accounting Of��ce (1991) favor the use of discount rates based on government bond rates (Lyon 1990, Hartman 1990). They use the interest rate for marketable Treasury debt with maturity comparable to the program being evaluated as a base case discount rate for cost bene��t analysis, thus favoring the SRTP approach.
The US Environmental Protection Agency supports using the SRTP approach in evaluating environmental projects (EPA 2000). It recommends that for intragenerational discounting, a rate of 2–3% be used, which is reckoned to be the market interest rate after tax. The EPA further recommends undertaking sensitivity analysis of alternative discount rates in the range of 2–3% as well as at 7% (prescribed by OMB), as this may provide useful information to decisionmakers. In addition, all analyses are required to present undiscounted bene��t and cost streams. �or intergenerational
Table 4. conTinued.
1� May 2007
Theory and PracTice in The choice of Social diScounT raTe for coST–BenefiT analySiS: a SurveyJuzhong zhuang, zhihong liang, Tun lin, and franklin de guzMan

projects or policies with intergenerational effects, the EPA prescribes that economic analyses should generally include a “no discounting” scenario by displaying undiscounted cost and bene��t streams over time. The economic analysis should also present a sensitivity analysis of alternative discount rates, including discounting at 2–3% and 7% as in the intragenerational case, as well as scenarios using rates in the range of 0.5–3% as prescribed by optimal growth models. The discussion of the sensitivity analysis is required to include appropriate caveats regarding the state of the literature with respect to discounting for very long time horizons.
In Europe, there is now a near convergence among of��cial social discount rates (Evans 2006). Germany uses 3%, based on values of real long-term government bond rate. Norway has been using a 3.5% discount rate after 1998—also based on real government borrowing rate. �rance’s Commissariat General du Plan in 2005 lowered its project discount rate to 4% based on the SRTP approach. Italy uses the SRTP approach to derive a 5% discount rate, while Spain adopts 4–6% for different sectors.
The UK government indicates in the Green Book, Appraisal and Evaluation in Central Government (HM Treasury 2003) that an SRTP of 3.5% should be used to discount future bene��ts and costs of public projects with a lifespan below 30 years. This ��gure is calculated on the basis of the estimates of the following three parameters�� (i) the rate of pure time preference at 1.5%; (ii) the elasticity of the marginal utility of consumption at around 1; and (iii) the output growth per capita over the period 1950–1998 in the UK at 2.1 percent. �or projects with very long-term impacts (over 30 years), the discount rate will depend on the length of their lifespan�� 3.0% for projects with a lifespan of 31–75 years; 2.5% with 76–125 years; 2.0% with 126–200 years; 1.5% with 201–300 years; and 1.0% with 301 years and beyond.
In Asia, the social discount rates adopted are generally higher. The Philippines and Pakistan use 15% and 12%, respectively, both based on the SOC approach. India currently uses 12 percent. In the PRC, according to National Development and Reform Commission and Ministry of Construction (2006), the economic cost of capital is a weighted average of social time preference and returns on capital. The former is estimated to be around 4.5–6% and the latter around 9–11 percent. The suggested social discount rate is 8% for short- and medium-term projects. The document also recommends that a lower than 8% discount rate be adopted for projects with a long time horizon. In Australia, the mandated discount rate was 8% before 1991 and, since then, there has been no prescribed benchmark social discount rate on the basis that the appropriate discount rate may vary from one year to another, and should be under continuous review. The New Zealand Treasury has a long-standing discount rate of 10%, which was reaf��rmed in its 2005 Cost Benefit Analysis primer (Rose 2006).
b. MDbs and other supra-National Agencies
The World Bank’s Handbook on Economic Analysis of Investment Operations provides guidance on how to calculate the social discount rate (Belli et al. 1998). The handbook states that the discount rate used should reflect not only the likely returns of funds in their best relevant alternative use (i.e., the opportunity cost of capital or “investment rate of interest”), but also the marginal rate at which savers are willing to save in the country (i.e., the rate at which the value of consumption falls over time, or “consumption rate of interest”). Therefore, the World Bank prescribes the weighted
SecTion iiiThe Social diScounT raTe in PracTice around The World
erd Working PaPer SerieS no. 94 19

average approach. The World Bank traditionally has not calculated a discount rate but has used 10–12% as a notional ��gure for cost–bene��t analysis. The handbook further advises that task managers may use a different discount rate as long as departures from the 10–12% rate have been justi��ed in the Country Assistance Strategy.
ADB’s policy on the social discount rate, speci��ed in its Guidelines for the Economic Analysis of Projects (ADB 1997), follows the World Bank approach. Although the Guidelines state that “economic rates of return differ considerably between sectors and countries”, and “from time to time, an appropriate discount rate for economic analysis should be calculated for each country to compare with the existing practice”, in practice, a single minimum rate of 10–12% has been used to calculate the net present value of a project, or to compare with the internal rate of return, for economic analysis for all countries and all projects all the time. ADB would expect to
(i) accept all independent projects and subprojects with an EIRR of at least 12%;
(ii) accept independent projects and subprojects with an EIRR between 10 and 12% for which additional unvalued bene��ts can be demonstrated, and where they are expected to exceed unvalued costs;
(iii) reject independent projects and subprojects with an EIRR between 10 and 12% for which no additional unvalued bene��ts can be demonstrated, or where unvalued costs are expected to be signi��cant; and
(iv) reject independent projects and subprojects with an EIRR below 10 percent.
Other MDBs have chosen a social discount rate more or less in the range similar to those of the World Bank and ADB. In the case of the Inter-American Development Bank, a 12% discount rate is being used as a measure of the economic opportunity cost of capital while the European Bank for Reconstruction and Development uses 10 percent. The African Development Bank, based on a review of various project appraisal reports, also uses a project discount rate ranging from 10 to 12 percent.
Among supranational governmental agencies, the European Commission advocates a benchmark discount rate of 5% in real terms for cost–bene��t analysis in the case of member countries of the European Union. This is a compromise ��gure based on market interest rate, cost of capital, and time preference considerations. However, the European Commission encourages member states to provide their own benchmark for the project discount rate, which must then be applied consistently to all projects (see Evans 2006 and European Commission 2006).
In sum, there are signi��cant variations in the social discount rate policy around the world. Most MDBs apply a rate of 10–12%, following the weighted average approach. Among individual countries, most developed countries follow the SRTP approach and apply much lower discount rates, mostly in the range of 3–7%, with many revising the rates downward in recent years. On the other hand, the three Asian developing countries surveyed (India, Pakistan, and Philippines) follow the SOC approach, and apply a much higher rate, in the range of 12–15%, and the PRC uses 8 percent. As shown in Table 4, these differences in the social discount rate policies in practice are due to different analytical approaches followed. The various approaches reflect differing views on how public investment affects domestic consumption, private investment, and cost of international borrowing. At a deeper level, however, the divergence reflects the differences in the perceived marginal social opportunity cost of public funds, and in the extent to which the issue of intergenerational equity
�0 May 2007
Theory and PracTice in The choice of Social diScounT raTe for coST–BenefiT analySiS: a SurveyJuzhong zhuang, zhihong liang, Tun lin, and franklin de guzMan

SecTion ivconcluding reMarkS
is taken into consideration in setting the social discount rate. Public funds, in general, have a higher marginal social opportunity cost in developing countries than in developed countries for a number of reasons, such as more scarcity of capital, poorer ��nancial intermediation, greater market distortions, and greater impediments in accessing international capital markets. Intergenerational equity is a newer issue in the public domain of developing countries than that of developed countries. Therefore, it is not surprising to see that developing countries generally use a higher social discount rate than developed countries.
IV. CoNCluDINg REMARks
The choice of the social discount rate plays a critical role in cost–bene��t analysis and project evaluation, and has been a subject of intense debate for the last several decades. In a perfectly competitive world without market distortions, the market interest rate is the appropriate social discount rate. In the real world where markets are distorted, there are four alternative approaches in the choice of the social discount rate�� SRTP, SOC, weighted average of SRTP and SOC, and SPC. Economists have not reached a consensus as to which is the most appropriate.
The difference among the four approaches reflects largely the different views on how public projects affect the domestic economy�� whether public investment displaces current consumption, or private investment, or both, and whether bene��ts of projects are consumed immediately, or reinvested to generate more future consumption (see Table 5 for a summary). In cases of very long-term projects, an additional consideration is intergenerational equity, where the debate has centered on whether or not one should assume a positive pure time preference on the grounds that individuals are “impatient”, and whether a declining discount rate should be used to avoid problems associated with exponential discounting as implied by a constant discount rate. The recent controversy over the Stern Review focuses largely on what discount rate should be used in cost–bene��t analysis of policies to control global warming, which impacts on future generations.
There are signi��cant variations in public discount rate policies in practice around the world, with developed countries applying lower rates (3–7%) than the developing countries surveyed (8–15%). These variations largely reflect different theoretical approaches to the choice of the discount rate followed by various countries. At a deeper level, however, the divergence also reflects differences in the perceived marginal social opportunity cost of public funds that the social discount rate tries to measure in order to ensure ef��cient allocation of resources, and differences in the extent to which the issue of intergenerational equity is considered.
What conclusion can we draw from this survey? �irst, there is no one-size-��ts-all solution to the choice of the social discount rate. Countries differ in economic structure, capital scarcity, stage of ��nancial development, ef��ciency of ��nancial intermediation, impediments faced in accessing the international capital market, and social time preference. All these factors together determine a country’s social opportunity cost of capital, and should be taken into consideration in the choice of the social discount rate. Second, there is need for each country to regularly review the appropriateness of its social discount rate policy in light of changing domestic economic circumstances and international capital market conditions, and to adjust the social discount rate as necessary. Third, there is a strong case for considering the equity issue in discounting bene��ts and costs of intergenerational projects (e.g., those designed to address climate changes and other environmental problems) in addition to the economic ef��ciency issue, as opposed to intragenerational projects where ef��ciency should be the primary concern. �inally, for MDBs that provide development assistance to developing
erd Working PaPer SerieS no. 94 �1

countries through capital investment, there could be a case for reviewing their decades-old practice of applying a uniform discount rate of 10–12% to all projects to see whether this practice is still appropriate in a changing world.
Table 5alTernaTive aPProacheS To The choice of The Social diScounT raTe
aPProach imPlied aSSumPTion Who uSeS iT meThod of emPirical eSTimaTion
maJor criTiciSm
Social Rate of Time Preference(SRTP)
Time-invariant
Public projects only displace current consumption
Mostly developed countries
Apply “Ramsey formula” with the following parameters�� (i) utility discount rate, (ii) elasticity of marginal utility of consumption, and (iii) growth rate of real per capita consumption
Approximated by after-tax rate of return on government bonds
Ignores the fact that public investment could displace private investment
Choice of utility discount rate involves normative value judgment, and estimation of the elasticity of marginal utility of consumption is sensitive to data and methodology
Time-declining
Public projects only displace current consumption, and discount rate declines over time as uncertainty increases. There is need to consider intergenerational equity.
Mostly academic and policy researchers
Typically estimated through experiments
Leads to time-inconsistent planning
Social Opportunity Cost of Capital (SOC)
Public projects only displace current private investment
Mostly developing countries
Approximated by pretax rate of return on riskless private investments, such as top-rated corporate bonds
Ignores the fact that public investment also displaces current consumption
continued.
�� May 2007
Theory and PracTice in The choice of Social diScounT raTe for coST–BenefiT analySiS: a SurveyJuzhong zhuang, zhihong liang, Tun lin, and franklin de guzMan

Weighted Average
Closed economy or open economy with foreign capital rationing
Public projects displace current consumption and private investment
Mostly MDBs Weighted average of SRTP and SOC
Ignores the possibility that project bene��ts could be reinvested
Determining the weights attached to SRTP, SOC, and international borrowing rate could be dif��cult
Open economy with upward sloping supply curve of foreign capital
Public projects funded by displaced current domestic consumption, displaced domestic private investment, and foreign borrowings
Weighted average of SRTP, SOC, and foreign borrowing rate
Open economy with perfectly elastic supply of foreign capital
Displacement of domestic consumption and investments would be small or negligible; the weighted average approach uses a discount rate equal to foreign borrowing rate
International borrowing rate
Shadow Price of Capital
Appropriate when public investments displace current consumption and investment and generate not only future consumption, but also future investment
Converts all costs and bene��ts into consumption equivalents using the SPC. Discount total cost and bene��t flows with SRTP to calculate NP�
When the effects of displacement and generation of investments are the same, the SPC approach is equivalent to using SRTP as the discount rate
Although considered as theoretically the most attractive approach, practical application could be dif��cult
SecTion ivconcluding reMarkS
Table 5. conTinued.
aPProach imPlied aSSumPTion Who uSeS iT meThod of emPirical eSTimaTion
maJor criTiciSm
erd Working PaPer SerieS no. 94 ��

APPENDIx EstIMAtINg thE soCIAl DIsCouNt RAtE
usINg thE WEIghtED AVERAgE APPRoACh1�
According to the weighted average approach, also known as Harberger approach, the social discount rate can be expressed as
δ α α β β= + − − +SOC i SRTPf( )1 (1)
where δ denotes the social discount rate, if is the government’s real long-term foreign borrowing rate, α is the proportion of funds for public investment obtained at the expense of private investment, β is the proportion of funds obtained at the expense of current consumption, and (1 – α – β) is the proportion of funds from foreign borrowing. SRTP and SOC are measured, respectively, by the rate of real return on savings exclusive of (ii) and investments inclusive of (rj). Expressing the weights attached to different funding sources in terms of elasticities of demand and supply of funds with respect to changes in interest rates, equation (1) becomes��
δ
ε ε ε
ε ε=
( ) + ( ) − ( )( ) + ( ) −
∑ ∑
∑
i i t ii
f f t f j j t jj
i i ti
f f t
S S i S S i I I r
S S S S εε j j tj
I I( )∑ (2)
where εi, εf, εj are respectively elasticities of savings, supply of foreign capital, and private investment with respect to the interest rate. Si /St and Sf /St are the shares to the total savings by various groups of domestic savers and foreign savers. Ij /It is the investment share of various business sectors.
Using Equation (2) and 1988–1989 data for Papua New Guinea, Harberger and Jenkins (2002) present an example of calculating the social discount rate, which they call economic opportunity cost of capital. The example assumes that there are four savers groups�� households, business, government, and foreign. The assumptions and results of calculations are given in Appendix Table 1 below��
aPPendix Table 1SaverS
assumpTions houSeholdS buSineSS governmenT foreign
Share (Si/St) 33.70% 44.90% 7.80% 13.60%
Elasticity (εs, εf) 0.5 0.5 0 2
Nominal market interest rate (im) 14.50% 14.50% 14.50%
Nominal cost of foreign borrowing (if) 18.00%
Tax rate (ti, tw) 9.30% 30.00% 0% 17.00%
Rate of inflation (g) 5.00% 5.00% 5.00% 5.00%
Real return on savings(ii) 7.76% 4.90% 9.05%
Real marginal cost of foreign borrowing 12.31%
13 This Appendix draws from Harberger and Jenkins (2002).
�4 May 2007
Theory and PracTice in The choice of Social diScounT raTe for coST–BenefiT analySiS: a SurveyJuzhong zhuang, zhihong liang, Tun lin, and franklin de guzMan
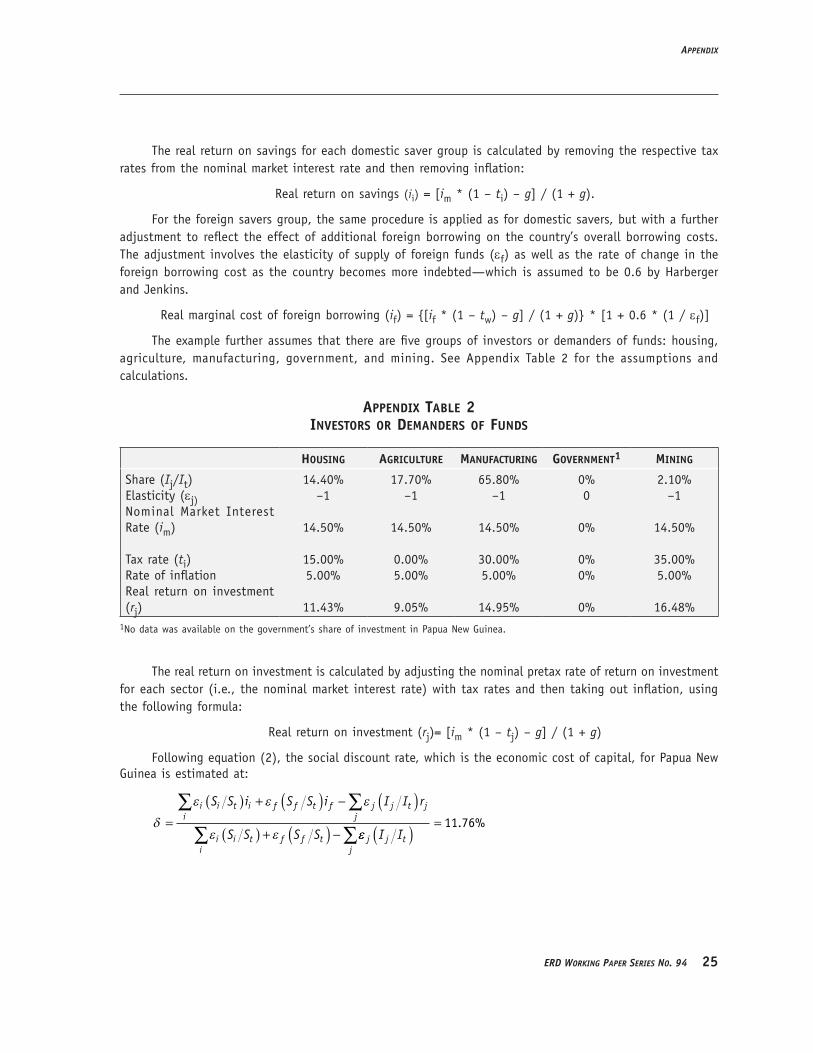
aPPendix
The real return on savings for each domestic saver group is calculated by removing the respective tax rates from the nominal market interest rate and then removing inflation��
Real return on savings (ii) = [im * (1 – ti) – g] / (1 + g).
�or the foreign savers group, the same procedure is applied as for domestic savers, but with a further adjustment to reflect the effect of additional foreign borrowing on the country’s overall borrowing costs. The adjustment involves the elasticity of supply of foreign funds (εf) as well as the rate of change in the foreign borrowing cost as the country becomes more indebted—which is assumed to be 0.6 by Harberger and Jenkins.
Real marginal cost of foreign borrowing (if) = {[if * (1 – tw) – g] / (1 + g)} * [1 + 0.6 * (1 / εf)]
The example further assumes that there are ��ve groups of investors or demanders of funds�� housing, agriculture, manufacturing, government, and mining. See Appendix Table 2 for the assumptions and calculations.
aPPendix Table 2 inveSTorS or demanderS of fundS
houSing agriculTure manufacTuring governmenT1 mining
Share (Ij/It)Elasticity (εj)Nominal Market Interest Rate (im) Tax rate (ti)Rate of inflationReal return on investment (rj)
14.40%–1
14.50%
15.00%5.00%
11.43%
17.70%–1
14.50%
0.00%5.00%
9.05%
65.80%–1
14.50%
30.00%5.00%
14.95%
0%0
0%
0%0%
0%
2.10%–1
14.50%
35.00%5.00%
16.48%1No data was available on the government’s share of investment in Papua New Guinea.
The real return on investment is calculated by adjusting the nominal pretax rate of return on investment for each sector (i.e., the nominal market interest rate) with tax rates and then taking out inflation, using the following formula��
Real return on investment (rj)= [im * (1 – tj) – g] / (1 + g)
�ollowing equation (2), the social discount rate, which is the economic cost of capital, for Papua New Guinea is estimated at��
δ
ε ε ε
ε ε=
( ) + ( ) − ( )( ) + ( ) −
∑ ∑
∑
i i t ii
f f t f j j t jj
i i ti
f f t
S S i S S i I I r
S S S S εε j j tj
I I( ) =∑
11 76. %
erd Working PaPer SerieS no. 94 ��

REFERENCEs
Amiel, Y., J. Creedy, and S. Hurn, S. 1999. “Measuring Attitudes Towards Inequality.” Scandinavian Journal of Economics 101��83–96.
Arrow, K. 1995. “Intergenerational Equity and the Rate of Discount in Long-Term Social Investment.” Paper presented at the IEA World Congress, December, Tunis, Tunisia.
Asian Development Bank. 1997. Guidelines for the Economic Analysis of Projects. Manila.Banks, J., R. Blundell, and A. Lewbell. 1997. “Quadratic Engel Curves and Consumer Demand.” Review of
Economics and Statistics 79(4)��527–40.Barsky, R., M. Kimball, T. Juster, and M. Shapiro. 1995. Preference Parameters and Behavioral Heterogeneity��
An Experimental Approach in the Health and Retirement Survey. NBER Working Paper No. 5213, National Bureau of Economic Research, Massachusetts.
Baumol, W. 1968. “On the Social Rate of Discount.” American Economic Review 58��788–802.Belli P., J. Anderson, H. Barnum, J. Dixon, and J. Tan. 1998. Handbook on Economic Analysis of Investment
Operations. World Bank, Washington, DC.Blundell, R. 1988. “Consumer Behaviour�� Theory and Empirical Evidence—A Survey.” Economic Journal
98��16–65.Blundell, R., M. Browning, and C. Meghir. 1994. “Consumer Demand and the Life-Cycle Allocation of Household
Expenditures.” Review of Economic Studies 61��57–80.Blundell, R., P. Pashardes, and G. Weber. 1993. “What Do We Learn About Consumer Demand Patterns from
Micro Data?” American Economic Review 83(3)��570–97.Boardman, A., D. Greenberg, A. �ining, and D. Weimer. 2001. Cost–Benefit Analysis: Concepts and Practice,
2nd ed. Upper Saddle River, NJ�� Prentice-Hall.Bradford, D. 1975. ”Constraints on Government Investment Opportunities and the Choice of Discount Rate.”
American Economic Review 65(5)��887–99.Burgess, D. 1988. “Complementarity and the Discount Rate for Public Investment.” The Quarterly Journal of
Economics August 1988��527–41.Cline, W. 1992. The Economics of Global Warming. Institute for International Economics, Washington, DC.Cowell, �., and K. Gardiner. 1999. Welfare Weights. STICERD Research Paper No. 20, London School of Economics,
London.Cropper, M., and D. Laibson. 1998. The Implications of Hyperbolic Discounting for Project Evaluation. World
Bank Policy Research Working Paper Series 1943, Washington, DC.Dasgupta, P. 2006. “Comments on the Stern Review’s Economics of Climate Change.” Paper prepared for a seminar
on the Stern Review’s Economics of Climate Change at the Royal Society, 8 November, London.Dasgupta, A., and D. Pearce. 1972. Cost–Benefit Analysis. UK�� Palgrave Macmillan.Dasgupta, P., S. Marglin, and A. Sen. 1972. Guidelines for Project Evaluation. United Nations Industrial
Development Organization, �ienna.Diamond, P. 1968. “Opportunity Cost of Public Investment�� Comment.” Quarterly Journal of Economics
84��682–8.Diamond, P., and J. Mirrlees. 1971a. “Optimal Taxation and Public Production I�� Production Ef��ciency.”
American Economic Review 61��8–27.. 1971b. “Optimal Taxation and Public Production II�� Tax Rules.” American Economic Review
61��261–78.Eckstein, O. 1961. “A Survey of the Theory of Public Expenditure and Criteria.” In Buchanan, J., ed., Public
Finance: Needs, Sources and Utilization. Princeton, NJ�� Princeton University Press.
�� May 2007
Theory and PracTice in The choice of Social diScounT raTe for coST–BenefiT analySiS: a SurveyJuzhong zhuang, zhihong liang, Tun lin, and franklin de guzMan
referenceS
Edwards, S. 1986. “Country Risk, �oreign Borrowing and the Social Discount Rate in an Open Developing Economy.” Journal of International Money and Finance 5��S79–S96.
European Commission. 2006. Guidance on the Methodology for Carrying Out Cost–Benefit Analysis. Working Document No. 4�� The New Programming Period 2007–2013, Brussels. Available�� http��//ec.europa.eu/regional_policy/sources/docof��c/2007/working/wd4_cost_en.pdf.
Evans, D. 2004a. “The Elevated Status of the Elasticity of Marginal Utility of Consumption.” Applied Economics Letters 11��443–7.
———. 2004b. “A Social Discount Rate for �rance.” Applied Economics Letters 11��803–808.———. 2005. “The Elasticity of Marginal Utility of Consumption�� Estimates for 20 OECD Countries.” Fiscal
Studies 26(2)��197–224.———. 2006. Social Discount Rates for the European Union. Working Paper No. 2006–20, �ifth Milan European
Economy Workshop, Universita degli Studi di Milano, Italy.Evans, D., and H. Sezer. 2002. “A Time Preference Measure of the Social Discount Rate for the UK.” Applied
Economics Letters 34��1925–34.———. 2004. “Social Discount Rates for Six Major Countries.” Applied Economics Letters 11��557–60.Evans, D., E. Kula, and H. Sezer. 2005. “Regional Welfare Weights for the UK�� England, Scotland, Wales and
Northern Ireland.” Regional Studies 39��923–37.�eldstein, M. 1972. “The Inadequacy of Weighted Discount Rates.” In R. Layard, ed., Cost–Benefit Analysis.
Middlesex, UK�� Penguin Books.Harberger, A. 1972. Project Evaluation: Collected Papers. Chicago�� The University of Chicago Press.Harberger, A., and G. Jenkins. 2002. Cost–Benefit Analysis for Investment Decisions. Queen’s University,
Canada.Hartman, R. 1990. “One Thousand Points of Light Seeking a Number�� A Case Study of CBO’s Search for a
Discount Rate Policy.” Journal of Environmental Economics and Management 18(2)��S3–S7.Harrod, R. 1948. Towards a Dynamic Economics. London�� Macmillan.Henderson, N., and I. Bateman. 1995. “Empirical and Public Choice Evidence for Hyperbolic Social Discount
Rates and the Implications for Intergenerational Discounting.” Environmental and Resource Economics 5��413–23.
Henderson, N., and I. Langford. 1998. “Cross-Disciplinary Evidence for Hyperbolic Social Discount Rates.” Management Science 44(11)��1493–500.
HM Treasury. 2003. Appraisal and Evaluation in Central Government (The Green Book). HM Treasury, London.Kay, J. 1972. “Social Discount Rates.” Journal of Public Economics 1��359–78.Kopp, R., and P. Portney. 1999. “Mock Referenda for Intergenerational Decision Making.” In P. Portney and J.
Weyant, eds., Discounting and Intergenerational Equity. Resources for the �uture, Washington, DC.KPMG. 2004. Corporate Tax Rates Survey. Klynveld, Peat, Marwick, Goerdeler International, Switzerland. Available��
http��//www.us.kpmg.com/microsite/Global_Tax/CTR_Survey/2004CTRS.pdf.Kula, E. 1984. “Derivation of Social Time Preference Rates for the United States and Canada.” The Quarterly
Journal of Economics November 1984��873–82.———. 1985. “An Empirical Investigation on the Social Time Preference Rate for the UK.” Environment and
Planning 17��199–217.———. 1987. “Social Interest Rate for Public Sector Project Appraisal in the UK, USA and Canada.” Project
Appraisal 2��169–74.———. 2004. “Estimation of a Social Rate of Interest for India.” Journal of Agricultural Economics 55(1)��91–
9.Lesser, J., and R. Zerbe. 1995. “What Can Economic Analysis Contribute to the Sustainability Debate?”
Contemporary Economic Policy 13(3)��88–100.
erd Working PaPer SerieS no. 94 ��
Lind, R. 1982. “A Primer on the Major Issues Relating to the Discount Rate for Evaluating National Energy Option.” In R. Lind, ed., Discounting for Time and Risk in Energy Policy. Resources for the �uture, Washington, DC.
———. 1990. “Reassessing the Government’s Discount Rate Policy in Light of New Theory and Data in a World Economy with a High Degree of Capital Mobility.” Journal of Environmental Economics and Management 18��S8–S28.
———. 1997. “Intertemporal Equity, Discounting, and Economic Ef��ciency in Water Policy Evaluation.” Climatic Change 37��41–62.
Little, I. M. D., and J. A. Mirrlees. 1974. Project Appraisal and Planning for Developing Countries. New York�� Basic Books.
Lyon, R. 1990. “�ederal Discount Rate Policy, the Shadow Price of Capital, and Challenges for Reforms.” Journal of Environmental Economics and Management 18��S29–S50.
Marglin, S. 1963a. “The Opportunity Costs of Public Investment.” The Quarterly Journal of Economics 77(2)��274–89.
———. 1963b. “The Social Rate of Discount and the Optimal Rate of Investment.” The Quarterly Journal of Economics 77(1)��95–111.
Mishan, E. 1967. “Criteria for Public Investment�� Some Simplifying Suggestions.” Journal of Political Economy 75��139–46.
Moore, M., A. Boardman, A. �ining, D. Weimer, and D. Greenberg. 2004. “‘Just Give Me a Number!’ Practical �alues for the Social Discount Rate.” Journal of Policy Analysis and Management 23(4)��789–812.
National Development and Reform Commission (NDRC) of the People’s Republic of China and Ministry of Construction. 2006. The Economic Analysis of Construction Projects: Methods and Parameters, 3rd version. Unpublished.
Newbery, D. 1992. Long- Term Discount Rates for the Forest Enterprise. Paper commissioned by The Department of �orestry, �orestry Commission, Edinburgh.
Nordhaus, W. 1993. “Rolling the ‘DICE’�� An Optimal Transition Path for Controlling Greenhouse Gases.” Resource and Energy Economics 15��27–50.
———. 1994. Managing The Global Commons�� The Economics of Climate Change. Cambridge, MA�� The MIT Press.
———. 1999. “Discounting and Public Policies that Affect the Distant �uture.” In P. Portney, P. and J. Weyant, eds., Discounting and Intergenerational Equity. Resources for the �uture, Washington, DC.
———. 2006. The Stern Review on the Economics of Climate Change. NBER Working Paper No. W12741, National Bureau of Economic Research, Cambridge.
OXERA. 2002. “A Social Time Preference Rate for Use in Long-Term Discounting.” Report for the Of��ce of the Deputy Prime Minister, Department for Transport, and Department of the Environment, �ood and Rural Affairs, Oxford Economic Research Associates, Ltd., Oxford, UK.
Pearce, D., and D. Ulph. 1995. A Social Discount Rate for the United Kingdom. CSERGE Working Paper GEC 95–01, Centre for Social and Economic Research on the Global Environment, University of East Anglia, Norwich, UK.
———. 1999. “A Social Discount Rate for the United Kingdom.” In D. Pearce, D., ed., Environmental Economics: Essays in Ecological Economics and Sustainable Development. Cheltenham�� Edward Elgar Publishing.
Penn World Tables 6.1. Available�� http��//pwt.econ.upenn.edu/php_site/pwt61_form.php.Percoco, M. 2006. “A Social Discount Rate for Italy.” Applied Economics Letters. �orthcoming.Pigou, A. 1932. The Economics of Welfare. London�� Macmillan.Ramsey, �. 1928. “A Mathematical Theory of Saving.” Economic Journal 38��543–59.
�� May 2007
Theory and PracTice in The choice of Social diScounT raTe for coST–BenefiT analySiS: a SurveyJuzhong zhuang, zhihong liang, Tun lin, and franklin de guzMan

referenceS
Rose, D. 2006. “The Public Sector Discount Rate.” Paper presented at the New Zealand Association of Economists Annual Conference, 26 June, Christchurch, New Zealand.
Sandmo, A., and J. Drèze. 1971. “Discount Rates for Public Investments in Closed and Open Economies.” Economica 38��395–412.
Sen, A. 1961. “On Optimizing the Rate of Saving.” Economic Journal 71��479–96.Schelling, T. 1995. “Intergenerational Discounting.” Energy Policy 23(4–5)��395–401.Scott, M. 1977. “The Test Rate of Discount and Changes in Base Level Income in the United Kingdom.” The
Economic Journal 87(346)��219–41.. 1989. A New View of Economic Growth. Oxford, UK�� Clarendon Press.
Solow, R. 1974. “Intergenerational Equity and Exhaustible Resources.” Review of Economic Studies 41��29–45.
Spackman, M. 2004. “Time Discounting and of the Cost of Capital in Government.” Fiscal Studies 25(4)��467–518.
———. 2006. Social Discount Rates for the European Union: An Overview. Working Paper No. 2006–33, �ifth Milan European Economy Workshop, Universita degli Studi di Milano, Italy. Available�� http��//www.economia.unimi.it/uploads/wp/SPACKMAN-2006_33.pdf.
Squire, L., and H. van der Tak. 1975. Economic Analysis of Projects. Baltimore�� The Johns Hopkins University Press.
Stern, N. 2006. The Economics of Climate Change: The Stern Review. Cambridge, UK�� Cambridge University Press.
Stiglitz, J. 1994. “Discount Rates�� the Rate of Discount for Cost–Bene��t Analysis and the Theory of the Second Best.” In R. Layard and S. Glaister, eds., Cost–Benefit Analysis. Cambridge University Press.
Toman, M. 1999. “Reconciling Philosophy and Economics in Long Term Discounting.” In P. Portney and J. Weyant, eds., Discounting and Intergenerational Equity. Resources for the �uture, Washington, DC.
US Environmental Protection Agency. 2000. Guidelines for Preparing Economic Analyses. Washington, DC. Available�� http��//yosemite.epa.gov/ee/epa/eerm.nsf/vwRepNumLookup/EE-0228C? OpenDocument.
US General Accounting Of��ce. 1991. Discounting Policy. Washington, DC.US Of��ce of Management and Budget. 1992. Circular No. A-94: Guidelines and Discount Rates for Benefit-Cost
Analysis of Federal Programs. Revised January 2003. Washington, DC.United Nations International Development Organization (UNIDO) 1978. A Guide to Practical Project Appraisal.
New York.Weitzman, M. 1994. “On the Environmental Discount Rate.” Journal of Environmental Economics and Management
26(2)��200–09.. 1998. “Why the �ar-Distant �uture Should be Discounted at its Lowest Possible Rate.” Journal of
Environmental Economics and Management 36(3)��201–08.. 2001. “Gamma Discounting.” American Economic Review 91(1)��261–71.
Zerbe, Jr., R. 2005. “Should Moral Sentiments Be Incorporated into Bene��t-Cost Analysis? An Example of Long-Term Discounting.” Policy Sciences 37(3–4)��305–18.
Zerbe, Jr., R., and D. Dively. 1994. Benefit-Cost Analysis: In Theory and Practice. New York�� Harper Collins.
erd Working PaPer SerieS no. 94 �9

30
PUBLICATIONS FROM THEECONOMICS AND RESEARCH DEPARTMENT
ERD WORKING PAPER SERIES (WPS)(Published in-house; Available through ADB Office of External Relations; Free of Charge)
No. 1 Capitalizing on Globalization—Barry Eichengreen, January 2002
No. 2 Policy-based Lending and Poverty Reduction:An Overview of Processes, Assessmentand Options—Richard Bolt and Manabu Fujimura, January2002
No. 3 The Automotive Supply Chain: Global Trendsand Asian Perspectives—Francisco Veloso and Rajiv Kumar, January 2002
No. 4 International Competitiveness of Asian Firms:An Analytical Framework—Rajiv Kumar and Doren Chadee, February 2002
No. 5 The International Competitiveness of AsianEconomies in the Apparel Commodity Chain—Gary Gereffi, February 2002
No. 6 Monetary and Financial Cooperation in EastAsia—The Chiang Mai Initiative and Beyond—Pradumna B. Rana, February 2002
No. 7 Probing Beneath Cross-national Averages: Poverty,Inequality, and Growth in the Philippines—Arsenio M. Balisacan and Ernesto M. Pernia,March 2002
No. 8 Poverty, Growth, and Inequality in Thailand—Anil B. Deolalikar, April 2002
No. 9 Microfinance in Northeast Thailand: Who Benefitsand How Much?—Brett E. Coleman, April 2002
No. 10 Poverty Reduction and the Role of Institutions inDeveloping Asia—Anil B. Deolalikar, Alex B. Brilliantes, Jr.,Raghav Gaiha, Ernesto M. Pernia, Mary Raceliswith the assistance of Marita Concepcion Castro-Guevara, Liza L. Lim, Pilipinas F. Quising, May2002
No. 11 The European Social Model: Lessons forDeveloping Countries—Assar Lindbeck, May 2002
No. 12 Costs and Benefits of a Common Currency forASEAN—Srinivasa Madhur, May 2002
No. 13 Monetary Cooperation in East Asia: A Survey—Raul Fabella, May 2002
No. 14 Toward A Political Economy Approachto Policy-based Lending—George Abonyi, May 2002
No. 15 A Framework for Establishing Priorities in aCountry Poverty Reduction Strategy—Ron Duncan and Steve Pollard, June 2002
No. 16 The Role of Infrastructure in Land-use Dynamicsand Rice Production in Viet Nam’s Mekong RiverDelta—Christopher Edmonds, July 2002
No. 17 Effect of Decentralization Strategy onMacroeconomic Stability in Thailand—Kanokpan Lao-Araya, August 2002
No. 18 Poverty and Patterns of Growth—Rana Hasan and M. G. Quibria, August 2002
No. 19 Why are Some Countries Richer than Others?A Reassessment of Mankiw-Romer-Weil’s Test of
the Neoclassical Growth Model—Jesus Felipe and John McCombie, August 2002
No. 20 Modernization and Son Preference in People’sRepublic of China—Robin Burgess and Juzhong Zhuang, September2002
No. 21 The Doha Agenda and Development: A View fromthe Uruguay Round—J. Michael Finger, September 2002
No. 22 Conceptual Issues in the Role of EducationDecentralization in Promoting Effective Schooling inAsian Developing Countries—Jere R. Behrman, Anil B. Deolalikar, and Lee-Ying Son, September 2002
No. 23 Promoting Effective Schooling through EducationDecentralization in Bangladesh, Indonesia, andPhilippines—Jere R. Behrman, Anil B. Deolalikar, and Lee-Ying Son, September 2002
No. 24 Financial Opening under the WTO Agreement inSelected Asian Countries: Progress and Issues—Yun-Hwan Kim, September 2002
No. 25 Revisiting Growth and Poverty Reduction inIndonesia: What Do Subnational Data Show?—Arsenio M. Balisacan, Ernesto M. Pernia, and Abuzar Asra, October 2002
No. 26 Causes of the 1997 Asian Financial Crisis: WhatCan an Early Warning System Model Tell Us?—Juzhong Zhuang and J. Malcolm Dowling,October 2002
No. 27 Digital Divide: Determinants and Policies withSpecial Reference to Asia—M. G. Quibria, Shamsun N. Ahmed, TedTschang, and Mari-Len Reyes-Macasaquit, October2002
No. 28 Regional Cooperation in Asia: Long-term Progress,Recent Retrogression, and the Way Forward—Ramgopal Agarwala and Brahm Prakash,October 2002
No. 29 How can Cambodia, Lao PDR, Myanmar, and VietNam Cope with Revenue Lost Due to AFTA TariffReductions?—Kanokpan Lao-Araya, November 2002
No. 30 Asian Regionalism and Its Effects on Trade in the1980s and 1990s—Ramon Clarete, Christopher Edmonds, andJessica Seddon Wallack, November 2002
No. 31 New Economy and the Effects of IndustrialStructures on International Equity MarketCorrelations—Cyn-Young Park and Jaejoon Woo, December2002
No. 32 Leading Indicators of Business Cycles in Malaysiaand the Philippines—Wenda Zhang and Juzhong Zhuang, December2002
No. 33 Technological Spillovers from Foreign DirectInvestment—A Survey—Emma Xiaoqin Fan, December 2002

31
No. 34 Economic Openness and Regional Development inthe Philippines—Ernesto M. Pernia and Pilipinas F. Quising,January 2003
No. 35 Bond Market Development in East Asia:Issues and Challenges—Raul Fabella and Srinivasa Madhur, January2003
No. 36 Environment Statistics in Central Asia: Progressand Prospects—Robert Ballance and Bishnu D. Pant, March2003
No. 37 Electricity Demand in the People’s Republic ofChina: Investment Requirement andEnvironmental Impact—Bo Q. Lin, March 2003
No. 38 Foreign Direct Investment in Developing Asia:Trends, Effects, and Likely Issues for theForthcoming WTO Negotiations—Douglas H. Brooks, Emma Xiaoqin Fan,and Lea R. Sumulong, April 2003
No. 39 The Political Economy of Good Governance forPoverty Alleviation Policies—Narayan Lakshman, April 2003
No. 40 The Puzzle of Social CapitalA Critical Review—M. G. Quibria, May 2003
No. 41 Industrial Structure, Technical Change, and theRole of Government in Development of theElectronics and Information Industry inTaipei,China—Yeo Lin, May 2003
No. 42 Economic Growth and Poverty Reductionin Viet Nam—Arsenio M. Balisacan, Ernesto M. Pernia, andGemma Esther B. Estrada, June 2003
No. 43 Why Has Income Inequality in ThailandIncreased? An Analysis Using 1975-1998 Surveys—Taizo Motonishi, June 2003
No. 44 Welfare Impacts of Electricity Generation SectorReform in the Philippines—Natsuko Toba, June 2003
No. 45 A Review of Commitment Savings Products inDeveloping Countries—Nava Ashraf, Nathalie Gons, Dean S. Karlan,and Wesley Yin, July 2003
No. 46 Local Government Finance, Private Resources,and Local Credit Markets in Asia—Roberto de Vera and Yun-Hwan Kim, October2003
No. 47 Excess Investment and Efficiency Loss DuringReforms: The Case of Provincial-level Fixed-AssetInvestment in People’s Republic of China—Duo Qin and Haiyan Song, October 2003
No. 48 Is Export-led Growth Passe? Implications forDeveloping Asia—Jesus Felipe, December 2003
No. 49 Changing Bank Lending Behavior and CorporateFinancing in Asia—Some Research Issues—Emma Xiaoqin Fan and Akiko Terada-Hagiwara,December 2003
No. 50 Is People’s Republic of China’s Rising ServicesSector Leading to Cost Disease?—Duo Qin, March 2004
No. 51 Poverty Estimates in India: Some Key Issues—Savita Sharma, May 2004
No. 52 Restructuring and Regulatory Reform in the PowerSector: Review of Experience and Issues—Peter Choynowski, May 2004
No. 53 Competitiveness, Income Distribution, and Growthin the Philippines: What Does the Long-runEvidence Show?—Jesus Felipe and Grace C. Sipin, June 2004
No. 54 Practices of Poverty Measurement and PovertyProfile of Bangladesh—Faizuddin Ahmed, August 2004
No. 55 Experience of Asian Asset ManagementCompanies: Do They Increase Moral Hazard?—Evidence from Thailand—Akiko Terada-Hagiwara and Gloria Pasadilla,September 2004
No. 56 Viet Nam: Foreign Direct Investment andPostcrisis Regional Integration—Vittorio Leproux and Douglas H. Brooks,September 2004
No. 57 Practices of Poverty Measurement and PovertyProfile of Nepal—Devendra Chhetry, September 2004
No. 58 Monetary Poverty Estimates in Sri Lanka:Selected Issues—Neranjana Gunetilleke and DinushkaSenanayake, October 2004
No. 59 Labor Market Distortions, Rural-Urban Inequality,and the Opening of People’s Republic of China’sEconomy—Thomas Hertel and Fan Zhai, November 2004
No. 60 Measuring Competitiveness in the World’s SmallestEconomies: Introducing the SSMECI—Ganeshan Wignaraja and David Joiner, November2004
No. 61 Foreign Exchange Reserves, Exchange RateRegimes, and Monetary Policy: Issues in Asia—Akiko Terada-Hagiwara, January 2005
No. 62 A Small Macroeconometric Model of the PhilippineEconomy—Geoffrey Ducanes, Marie Anne Cagas, Duo Qin,Pilipinas Quising, and Nedelyn Magtibay-Ramos,January 2005
No. 63 Developing the Market for Local Currency Bondsby Foreign Issuers: Lessons from Asia—Tobias Hoschka, February 2005
No. 64 Empirical Assessment of Sustainability andFeasibility of Government Debt: The PhilippinesCase—Duo Qin, Marie Anne Cagas, Geoffrey Ducanes,Nedelyn Magtibay-Ramos, and Pilipinas Quising,February 2005
No. 65 Poverty and Foreign AidEvidence from Cross-Country Data—Abuzar Asra, Gemma Estrada, Yangseom Kim,and M. G. Quibria, March 2005
No. 66 Measuring Efficiency of Macro Systems: AnApplication to Millennium Development GoalAttainment—Ajay Tandon, March 2005
No. 67 Banks and Corporate Debt Market Development—Paul Dickie and Emma Xiaoqin Fan, April 2005
No. 68 Local Currency Financing—The Next Frontier forMDBs?—Tobias C. Hoschka, April 2005
No. 69 Export or Domestic-Led Growth in Asia?—Jesus Felipe and Joseph Lim, May 2005
No. 70 Policy Reform in Viet Nam and the AsianDevelopment Bank’s State-owned EnterpriseReform and Corporate Governance Program Loan—George Abonyi, August 2005
No. 71 Policy Reform in Thailand and the AsianDevelopment Bank’s Agricultural Sector ProgramLoan—George Abonyi, September 2005
No. 72 Can the Poor Benefit from the Doha Agenda? TheCase of Indonesia—Douglas H. Brooks and Guntur Sugiyarto,October 2005
No. 73 Impacts of the Doha Development Agenda onPeople’s Republic of China: The Role ofComplementary Education Reforms
32
—Fan Zhai and Thomas Hertel, October 2005No. 74 Growth and Trade Horizons for Asia: Long-term
Forecasts for Regional Integration—David Roland-Holst, Jean-Pierre Verbiest, andFan Zhai, November 2005
No. 75 Macroeconomic Impact of HIV/AIDS in the Asianand Pacific Region—Ajay Tandon, November 2005
No. 76 Policy Reform in Indonesia and the AsianDevelopment Bank’s Financial Sector GovernanceReforms Program Loan—George Abonyi, December 2005
No. 77 Dynamics of Manufacturing Competitiveness inSouth Asia: ANalysis through Export Data—Hans-Peter Brunner and Massimiliano Calì,December 2005
No. 78 Trade Facilitation—Teruo Ujiie, January 2006
No. 79 An Assessment of Cross-country FiscalConsolidation—Bruno Carrasco and Seung Mo Choi,February 2006
No. 80 Central Asia: Mapping Future Prospects to 2015—Malcolm Dowling and Ganeshan Wignaraja,April 2006
No. 81 A Small Macroeconometric Model of the People’sRepublic of China—Duo Qin, Marie Anne Cagas, Geoffrey Ducanes,Nedelyn Magtibay-Ramos, Pilipinas Quising, Xin-Hua He, Rui Liu, and Shi-Guo Liu, June 2006
No. 82 Institutions and Policies for Growth and PovertyReduction: The Role of Private Sector Development—Rana Hasan, Devashish Mitra, and MehmetUlubasoglu, July 2006
No. 83 Preferential Trade Agreements in Asia:Alternative Scenarios of “Hub and Spoke”—Fan Zhai, October 2006
No. 84 Income Disparity and Economic Growth: Evidencefrom People’s Republic of China— Duo Qin, Marie Anne Cagas, Geoffrey Ducanes,Xinhua He, Rui Liu, and Shiguo Liu, October 2006
No. 85 Macroeconomic Effects of Fiscal Policies: EmpiricalEvidence from Bangladesh, People’s Republic ofChina, Indonesia, and Philippines— Geoffrey Ducanes, Marie Anne Cagas, Duo Qin,Pilipinas Quising, and Mohammad AbdurRazzaque, November 2006
No. 86 Economic Growth, Technological Change, andPatterns of Food and Agricultural Trade in Asia— Thomas W. Hertel, Carlos E. Ludena, and AllaGolub, November 2006
No. 87 Expanding Access to Basic Services in Asia and thePacific Region: Public–Private Partnerships forPoverty Reduction— Adrian T. P. Panggabean, November 2006
No. 88 Income Volatility and Social Protection inDeveloping Asia—Vandana Sipahimalani-Rao, November 2006
No. 89 Rules of Origin: Conceptual Explorations andLessons from the Generalized System ofPreferences—Teruo Ujiie, December 2006
No. 90 Asia’s Imprint on Global Commodity Markets—Cyn-Young Park and Fan Zhai, December 2006
No. 91 Infrastructure as a Catalyst for RegionalIntegration, Growth, and Economic Convergence:Scenario Analysis for Asia—David Roland-Holst, December 2006
No. 92 Measuring Underemployment: Establishing theCut-off Point—Guntur Sugiyarto, March 2007
No. 93 An Analysis of the Philippine Business ProcessOutsourcing Industry—Nedelyn Magtibay-Ramos, Gemma Estrada, andJesus Felipe, March 2007
No. 94 Theory and Practice in the Choice of SocialDiscount Rate for Cost–Benefit Analysis: A Survey—Juzhong Zhuang, Zhihong Liang, Tun Lin, andFranklin De Guzman, May 2007
ERD TECHNICAL NOTE SERIES (TNS)(Published in-house; Available through ADB Office of External Relations; Free of Charge)
No. 1 Contingency Calculations for EnvironmentalImpacts with Unknown Monetary Values—David Dole, February 2002
No. 2 Integrating Risk into ADB’s Economic Analysisof Projects—Nigel Rayner, Anneli Lagman-Martin,
and Keith Ward, June 2002No. 3 Measuring Willingness to Pay for Electricity
—Peter Choynowski, July 2002No. 4 Economic Issues in the Design and Analysis of a
Wastewater Treatment Project—David Dole, July 2002
No. 5 An Analysis and Case Study of the Role ofEnvironmental Economics at the AsianDevelopment Bank—David Dole and Piya Abeygunawardena,September 2002
No. 6 Economic Analysis of Health Projects: A Case Studyin Cambodia—Erik Bloom and Peter Choynowski, May 2003
No. 7 Strengthening the Economic Analysis of NaturalResource Management Projects—Keith Ward, September 2003
No. 8 Testing Savings Product Innovations Using anExperimental Methodology—Nava Ashraf, Dean S. Karlan, and Wesley Yin,November 2003
No. 9 Setting User Charges for Public Services: Policiesand Practice at the Asian Development Bank—David Dole, December 2003
No. 10 Beyond Cost Recovery: Setting User Charges forFinancial, Economic, and Social Goals—David Dole and Ian Bartlett, January 2004
No. 11 Shadow Exchange Rates for Project EconomicAnalysis: Toward Improving Practice at the AsianDevelopment Bank—Anneli Lagman-Martin, February 2004
No. 12 Improving the Relevance and Feasibility ofAgriculture and Rural Development OperationalDesigns: How Economic Analyses Can Help—Richard Bolt, September 2005
No. 13 Assessing the Use of Project Distribution andPoverty Impact Analyses at the Asian DevelopmentBank—Franklin D. De Guzman, October 2005
No. 14 Assessing Aid for a Sector Development Plan:Economic Analysis of a Sector Loan—David Dole, November 2005

33
No. 15 Debt Management Analysis of Nepal’s Public Debt—Sungsup Ra, Changyong Rhee, and Joon-HoHahm, December 2005
No. 16 Evaluating Microfinance Program Innovation withRandomized Control Trials: An Example fromGroup Versus Individual Lending—Xavier Giné, Tomoko Harigaya,Dean Karlan, andBinh T. Nguyen, March 2006
No. 17 Setting User Charges for Urban Water Supply: ACase Study of the Metropolitan Cebu WaterDistrict in the Philippines—David Dole and Edna Balucan, June 2006
No. 18 Forecasting Inflation and GDP Growth: AutomaticLeading Indicator (ALI) Method versus Macro
Econometric Structural Models (MESMs)—Marie Anne Cagas, Geoffrey Ducanes, NedelynMagtibay-Ramos, Duo Qin and Pilipinas Quising,July 2006
No. 19 Willingness-to-Pay and Design of Water Supplyand Sanitation Projects: A Case Study—Herath Gunatilake, Jui-Chen Yang, SubhrenduPattanayak, and Caroline van den Berg,December 2006
No. 20 Tourism for Pro-Poor and Sutainable Growth:Economic Analysis of ADB Tourism Projects—Tun Lin and Franklin D. De Guzman,January 2007
No. 21 Critical Issues of Fiscal Decentralization—Norio Usui, February 2007
No. 1 Is Growth Good Enough for the Poor?—Ernesto M. Pernia, October 2001
No. 2 India’s Economic ReformsWhat Has Been Accomplished?What Remains to Be Done?—Arvind Panagariya, November 2001
No. 3 Unequal Benefits of Growth in Viet Nam—Indu Bhushan, Erik Bloom, and Nguyen MinhThang, January 2002
No. 4 Is Volatility Built into Today’s World Economy?—J. Malcolm Dowling and J.P. Verbiest,February 2002
No. 5 What Else Besides Growth Matters to PovertyReduction? Philippines—Arsenio M. Balisacan and Ernesto M. Pernia,February 2002
No. 6 Achieving the Twin Objectives of Efficiency andEquity: Contracting Health Services in Cambodia—Indu Bhushan, Sheryl Keller, and Brad Schwartz,March 2002
No. 7 Causes of the 1997 Asian Financial Crisis: WhatCan an Early Warning System Model Tell Us?—Juzhong Zhuang and Malcolm Dowling,June 2002
No. 8 The Role of Preferential Trading Arrangementsin Asia—Christopher Edmonds and Jean-Pierre Verbiest,July 2002
No. 9 The Doha Round: A Development Perspective—Jean-Pierre Verbiest, Jeffrey Liang, and LeaSumulong, July 2002
No. 10 Is Economic Openness Good for RegionalDevelopment and Poverty Reduction? ThePhilippines—E. M. Pernia and Pilipinas Quising, October2002
No. 11 Implications of a US Dollar Depreciation for AsianDeveloping Countries—Emma Fan, July 2002
No. 12 Dangers of Deflation—D. Brooks and Pilipinas Quising, December 2002
No. 13 Infrastructure and Poverty Reduction—What is the Connection?—Ifzal Ali and Ernesto Pernia, January 2003
No. 14 Infrastructure and Poverty Reduction—Making Markets Work for the Poor—Xianbin Yao, May 2003
No. 15 SARS: Economic Impacts and Implications—Emma Xiaoqin Fan, May 2003
No. 16 Emerging Tax Issues: Implications of Globalizationand Technology—Kanokpan Lao Araya, May 2003
No. 17 Pro-Poor Growth: What is It and Why is ItImportant?—Ernesto M. Pernia, May 2003
No. 18 Public–Private Partnership for Competitiveness—Jesus Felipe, June 2003
No. 19 Reviving Asian Economic Growth Requires FurtherReforms—Ifzal Ali, June 2003
No. 20 The Millennium Development Goals and Poverty:Are We Counting the World’s Poor Right?—M. G. Quibria, July 2003
No. 21 Trade and Poverty: What are the Connections?—Douglas H. Brooks, July 2003
No. 22 Adapting Education to the Global Economy—Olivier Dupriez, September 2003
No. 23 Avian Flu: An Economic Assessment for SelectedDeveloping Countries in Asia—Jean-Pierre Verbiest and Charissa Castillo,March 2004
No. 25 Purchasing Power Parities and the InternationalComparison Program in a Globalized World—Bishnu Pant, March 2004
No. 26 A Note on Dual/Multiple Exchange Rates—Emma Xiaoqin Fan, May 2004
No. 27 Inclusive Growth for Sustainable Poverty Reductionin Developing Asia: The Enabling Role ofInfrastructure Development—Ifzal Ali and Xianbin Yao, May 2004
No. 28 Higher Oil Prices: Asian Perspectives andImplications for 2004-2005—Cyn-Young Park, June 2004
No. 29 Accelerating Agriculture and Rural Development forInclusive Growth: Policy Implications forDeveloping Asia—Richard Bolt, July 2004
No. 30 Living with Higher Interest Rates: Is Asia Ready?—Cyn-Young Park, August 2004
No. 31 Reserve Accumulation, Sterilization, and PolicyDilemma—Akiko Terada-Hagiwara, October 2004
No. 32 The Primacy of Reforms in the Emergence ofPeople’s Republic of China and India—Ifzal Ali and Emma Xiaoqin Fan, November2004
ERD POLICY BRIEF SERIES (PBS)(Published in-house; Available through ADB Office of External Relations; Free of charge)

34
1. Improving Domestic Resource Mobilization ThroughFinancial Development: Overview September 1985
2. Improving Domestic Resource Mobilization ThroughFinancial Development: Bangladesh July 1986
3. Improving Domestic Resource Mobilization ThroughFinancial Development: Sri Lanka April 1987
4. Improving Domestic Resource Mobilization ThroughFinancial Development: India December 1987
5. Financing Public Sector Development Expenditurein Selected Countries: Overview January 1988
6. Study of Selected Industries: A Brief ReportApril 1988
7. Financing Public Sector Development Expenditurein Selected Countries: Bangladesh June 1988
8. Financing Public Sector Development Expenditurein Selected Countries: India June 1988
9. Financing Public Sector Development Expenditurein Selected Countries: Indonesia June 1988
10. Financing Public Sector Development Expenditurein Selected Countries: Nepal June 1988
11. Financing Public Sector Development Expenditurein Selected Countries: Pakistan June 1988
12. Financing Public Sector Development Expenditurein Selected Countries: Philippines June 1988
13. Financing Public Sector Development Expenditurein Selected Countries: Thailand June 1988
14. Towards Regional Cooperation in South Asia:ADB/EWC Symposium on Regional Cooperationin South Asia February 1988
15. Evaluating Rice Market Intervention Policies:Some Asian Examples April 1988
16. Improving Domestic Resource Mobilization ThroughFinancial Development: Nepal November 1988
17. Foreign Trade Barriers and Export Growth September1988
18. The Role of Small and Medium-Scale Industries in theIndustrial Development of the Philippines April 1989
19. The Role of Small and Medium-Scale ManufacturingIndustries in Industrial Development: The Experience ofSelected Asian Countries January 1990
20. National Accounts of Vanuatu, 1983-1987 January1990
21. National Accounts of Western Samoa, 1984-1986February 1990
22. Human Resource Policy and Economic Development:Selected Country Studies July 1990
23. Export Finance: Some Asian Examples September 199024. National Accounts of the Cook Islands, 1982-1986
September 199025. Framework for the Economic and Financial Appraisal of
Urban Development Sector Projects January 199426. Framework and Criteria for the Appraisal and
Socioeconomic Justification of Education ProjectsJanuary 1994
27. Investing in Asia 1997 (Co-published with OECD)28. The Future of Asia in the World Economy 1998 (Co-
published with OECD)29. Financial Liberalisation in Asia: Analysis and Prospects
1999 (Co-published with OECD)30. Sustainable Recovery in Asia: Mobilizing Resources for
Development 2000 (Co-published with OECD)31. Technology and Poverty Reduction in Asia and the Pacific
2001 (Co-published with OECD)32. Asia and Europe 2002 (Co-published with OECD)33. Economic Analysis: Retrospective 200334. Economic Analysis: Retrospective: 2003 Update 200435. Development Indicators Reference Manual: Concepts and
Definitions 200435. Investment Climate and Productivity Studies
Philippines: Moving Toward a Better Investment Climate2005The Road to Recovery: Improving the Investment Climatein Indonesia 2005Sri Lanka: Improving the Rural and Urban InvestmentClimate 2005
SPECIAL STUDIES, COMPLIMENTARY(Available through ADB Office of External Relations)
No. 33 Population Health and Foreign Direct Investment:Does Poor Health Signal Poor GovernmentEffectiveness?—Ajay Tandon, January 2005
No. 34 Financing Infrastructure Development: AsianDeveloping Countries Need to Tap Bond MarketsMore Rigorously—Yun-Hwan Kim, February 2005
No. 35 Attaining Millennium Development Goals inHealth: Isn’t Economic Growth Enough?—Ajay Tandon, March 2005
No. 36 Instilling Credit Culture in State-owned Banks—Experience from Lao PDR—Robert Boumphrey, Paul Dickie, and SamiuelaTukuafu, April 2005
No. 37 Coping with Global Imbalances and AsianCurrencies—Cyn-Young Park, May 2005
No. 38 Asia’s Long-term Growth and Integration:Reaching beyond Trade Policy Barriers—Douglas H. Brooks, David Roland-Holst, and FanZhai, September 2005
No. 39 Competition Policy and Development—Douglas H. Brooks, October 2005
No. 40 Highlighting Poverty as Vulnerability: The 2005Earthquake in Pakistan—Rana Hasan and Ajay Tandon, October 2005
No. 41 Conceptualizing and Measuring Poverty asVulnerability: Does It Make a Difference?—Ajay Tandon and Rana Hasan, October 2005
No. 42 Potential Economic Impact of an Avian FluPandemic on Asia—Erik Bloom, Vincent de Wit, and Mary JaneCarangal-San Jose, November 2005
No. 43 Creating Better and More Jobs in Indonesia: ABlueprint for Policy Action—Guntur Sugiyarto, December 2005
No. 44 The Challenge of Job Creation in Asia—Jesus Felipe and Rana Hasan, April 2006
No. 45 International Payments Imbalances—Jesus Felipe, Frank Harrigan, and AashishMehta, April 2006
No. 46 Improving Primary Enrollment Rates among thePoor—Ajay Tandon, August 2006
35
OLD MONOGRAPH SERIES(Available through ADB Office of External Relations; Free of charge)
EDRC REPORT SERIES (ER)
No. 1 ASEAN and the Asian Development Bank—Seiji Naya, April 1982
No. 2 Development Issues for the Developing Eastand Southeast Asian Countriesand International Cooperation—Seiji Naya and Graham Abbott, April 1982
No. 3 Aid, Savings, and Growth in the Asian Region—J. Malcolm Dowling and Ulrich Hiemenz,
April 1982No. 4 Development-oriented Foreign Investment
and the Role of ADB—Kiyoshi Kojima, April 1982
No. 5 The Multilateral Development Banksand the International Economy’s MissingPublic Sector—John Lewis, June 1982
No. 6 Notes on External Debt of DMCs—Evelyn Go, July 1982
No. 7 Grant Element in Bank Loans—Dal Hyun Kim, July 1982
No. 8 Shadow Exchange Rates and StandardConversion Factors in Project Evaluation—Peter Warr, September 1982
No. 9 Small and Medium-Scale ManufacturingEstablishments in ASEAN Countries:Perspectives and Policy Issues—Mathias Bruch and Ulrich Hiemenz, January1983
No. 10 A Note on the Third Ministerial Meeting of GATT—Jungsoo Lee, January 1983
No. 11 Macroeconomic Forecasts for the Republicof China, Hong Kong, and Republic of Korea—J.M. Dowling, January 1983
No. 12 ASEAN: Economic Situation and Prospects—Seiji Naya, March 1983
No. 13 The Future Prospects for the DevelopingCountries of Asia—Seiji Naya, March 1983
No. 14 Energy and Structural Change in the Asia-Pacific Region, Summary of the ThirteenthPacific Trade and Development Conference—Seiji Naya, March 1983
No. 15 A Survey of Empirical Studies on Demandfor Electricity with Special Emphasis on PriceElasticity of Demand—Wisarn Pupphavesa, June 1983
No. 16 Determinants of Paddy Production in Indonesia:1972-1981–A Simultaneous Equation ModelApproach—T.K. Jayaraman, June 1983
No. 17 The Philippine Economy: EconomicForecasts for 1983 and 1984—J.M. Dowling, E. Go, and C.N. Castillo, June1983
No. 18 Economic Forecast for Indonesia—J.M. Dowling, H.Y. Kim, Y.K. Wang,
and C.N. Castillo, June 1983No. 19 Relative External Debt Situation of Asian
Developing Countries: An Applicationof Ranking Method—Jungsoo Lee, June 1983
No. 20 New Evidence on Yields, Fertilizer Application,and Prices in Asian Rice Production—William James and Teresita Ramirez, July 1983
No. 21 Inflationary Effects of Exchange RateChanges in Nine Asian LDCs
—Pradumna B. Rana and J. Malcolm Dowling, Jr.,December 1983
No. 22 Effects of External Shocks on the Balanceof Payments, Policy Responses, and DebtProblems of Asian Developing Countries—Seiji Naya, December 1983
No. 23 Changing Trade Patterns and Policy Issues:The Prospects for East and Southeast AsianDeveloping Countries—Seiji Naya and Ulrich Hiemenz, February 1984
No. 24 Small-Scale Industries in Asian EconomicDevelopment: Problems and Prospects—Seiji Naya, February 1984
No. 25 A Study on the External Debt IndicatorsApplying Logit Analysis—Jungsoo Lee and Clarita Barretto, February 1984
No. 26 Alternatives to Institutional Credit Programsin the Agricultural Sector of Low-IncomeCountries—Jennifer Sour, March 1984
No. 27 Economic Scene in Asia and Its Special Features—Kedar N. Kohli, November 1984
No. 28 The Effect of Terms of Trade Changes on theBalance of Payments and Real NationalIncome of Asian Developing Countries—Jungsoo Lee and Lutgarda Labios, January 1985
No. 29 Cause and Effect in the World Sugar Market:Some Empirical Findings 1951-1982—Yoshihiro Iwasaki, February 1985
No. 30 Sources of Balance of Payments Problemin the 1970s: The Asian Experience—Pradumna Rana, February 1985
No. 31 India’s Manufactured Exports: An Analysisof Supply Sectors—Ifzal Ali, February 1985
No. 32 Meeting Basic Human Needs in AsianDeveloping Countries—Jungsoo Lee and Emma Banaria, March 1985
No. 33 The Impact of Foreign Capital Inflowon Investment and Economic Growthin Developing Asia—Evelyn Go, May 1985
No. 34 The Climate for Energy Developmentin the Pacific and Asian Region:Priorities and Perspectives—V.V. Desai, April 1986
No. 35 Impact of Appreciation of the Yen onDeveloping Member Countries of the Bank—Jungsoo Lee, Pradumna Rana, and Ifzal Ali,May 1986
No. 36 Smuggling and Domestic Economic Policiesin Developing Countries—A.H.M.N. Chowdhury, October 1986
No. 37 Public Investment Criteria: Economic InternalRate of Return and Equalizing Discount Rate—Ifzal Ali, November 1986
No. 38 Review of the Theory of Neoclassical PoliticalEconomy: An Application to Trade Policies—M.G. Quibria, December 1986
No. 39 Factors Influencing the Choice of Location:Local and Foreign Firms in the Philippines—E.M. Pernia and A.N. Herrin, February 1987
No. 40 A Demographic Perspective on DevelopingAsia and Its Relevance to the Bank—E.M. Pernia, May 1987

36
No. 1 International Reserves:Factors Determining Needs and Adequacy—Evelyn Go, May 1981
No. 2 Domestic Savings in Selected DevelopingAsian Countries—Basil Moore, assisted by A.H.M. NuruddinChowdhury, September 1981
No. 3 Changes in Consumption, Imports and Exportsof Oil Since 1973: A Preliminary Survey ofthe Developing Member Countriesof the Asian Development Bank—Dal Hyun Kim and Graham Abbott, September1981
No. 4 By-Passed Areas, Regional Inequalities,and Development Policies in SelectedSoutheast Asian Countries—William James, October 1981
No. 5 Asian Agriculture and Economic Development—William James, March 1982
No. 6 Inflation in Developing Member Countries:An Analysis of Recent Trends—A.H.M. Nuruddin Chowdhury and J. MalcolmDowling, March 1982
No. 7 Industrial Growth and Employment inDeveloping Asian Countries: Issues and
ECONOMIC STAFF PAPERS (ES)
Perspectives for the Coming Decade—Ulrich Hiemenz, March 1982
No. 8 Petrodollar Recycling 1973-1980.Part 1: Regional Adjustments andthe World Economy—Burnham Campbell, April 1982
No. 9 Developing Asia: The Importanceof Domestic Policies—Economics Office Staff under the direction of SeijiNaya, May 1982
No. 10 Financial Development and HouseholdSavings: Issues in Domestic ResourceMobilization in Asian Developing Countries—Wan-Soon Kim, July 1982
No. 11 Industrial Development: Role of SpecializedFinancial Institutions—Kedar N. Kohli, August 1982
No. 12 Petrodollar Recycling 1973-1980.Part II: Debt Problems and an Evaluationof Suggested Remedies—Burnham Campbell, September 1982
No. 13 Credit Rationing, Rural Savings, and FinancialPolicy in Developing Countries—William James, September 1982
No. 41 Emerging Issues in Asia and Social CostBenefit Analysis—I. Ali, September 1988
No. 42 Shifting Revealed Comparative Advantage:Experiences of Asian and Pacific DevelopingCountries—P.B. Rana, November 1988
No. 43 Agricultural Price Policy in Asia:Issues and Areas of Reforms—I. Ali, November 1988
No. 44 Service Trade and Asian Developing Economies—M.G. Quibria, October 1989
No. 45 A Review of the Economic Analysis of PowerProjects in Asia and Identification of Areasof Improvement—I. Ali, November 1989
No. 46 Growth Perspective and Challenges for Asia:Areas for Policy Review and Research—I. Ali, November 1989
No. 47 An Approach to Estimating the PovertyAlleviation Impact of an Agricultural Project—I. Ali, January 1990
No. 48 Economic Growth Performance of Indonesia,the Philippines, and Thailand:The Human Resource Dimension—E.M. Pernia, January 1990
No. 49 Foreign Exchange and Fiscal Impact of a Project:A Methodological Framework for Estimation—I. Ali, February 1990
No. 50 Public Investment Criteria: Financialand Economic Internal Rates of Return—I. Ali, April 1990
No. 51 Evaluation of Water Supply Projects:An Economic Framework—Arlene M. Tadle, June 1990
No. 52 Interrelationship Between Shadow Prices, ProjectInvestment, and Policy Reforms:An Analytical Framework—I. Ali, November 1990
No. 53 Issues in Assessing the Impact of Projectand Sector Adjustment Lending—I. Ali, December 1990
No. 54 Some Aspects of Urbanizationand the Environment in Southeast Asia—Ernesto M. Pernia, January 1991
No. 55 Financial Sector and EconomicDevelopment: A Survey—Jungsoo Lee, September 1991
No. 56 A Framework for Justifying Bank-AssistedEducation Projects in Asia: A Reviewof the Socioeconomic Analysisand Identification of Areas of Improvement—Etienne Van De Walle, February 1992
No. 57 Medium-term Growth-StabilizationRelationship in Asian Developing Countriesand Some Policy Considerations—Yun-Hwan Kim, February 1993
No. 58 Urbanization, Population Distribution,and Economic Development in Asia—Ernesto M. Pernia, February 1993
No. 59 The Need for Fiscal Consolidation in Nepal:The Results of a Simulation—Filippo di Mauro and Ronald Antonio Butiong,July 1993
No. 60 A Computable General Equilibrium Modelof Nepal—Timothy Buehrer and Filippo di Mauro, October1993
No. 61 The Role of Government in Export Expansionin the Republic of Korea: A Revisit—Yun-Hwan Kim, February 1994
No. 62 Rural Reforms, Structural Change,and Agricultural Growth inthe People’s Republic of China—Bo Lin, August 1994
No. 63 Incentives and Regulation for Pollution Abatementwith an Application to Waste Water Treatment—Sudipto Mundle, U. Shankar, and ShekharMehta, October 1995
No. 64 Saving Transitions in Southeast Asia—Frank Harrigan, February 1996
No. 65 Total Factor Productivity Growth in East Asia:A Critical Survey—Jesus Felipe, September 1997
No. 66 Foreign Direct Investment in Pakistan:Policy Issues and Operational Implications—Ashfaque H. Khan and Yun-Hwan Kim, July1999
No. 67 Fiscal Policy, Income Distribution and Growth—Sailesh K. Jha, November 1999

37
No. 14 Small and Medium-Scale ManufacturingEstablishments in ASEAN Countries:Perspectives and Policy Issues—Mathias Bruch and Ulrich Hiemenz, March 1983
No. 15 Income Distribution and EconomicGrowth in Developing Asian Countries—J. Malcolm Dowling and David Soo, March 1983
No. 16 Long-Run Debt-Servicing Capacity ofAsian Developing Countries: An Applicationof Critical Interest Rate Approach—Jungsoo Lee, June 1983
No. 17 External Shocks, Energy Policy,and Macroeconomic Performance of AsianDeveloping Countries: A Policy Analysis—William James, July 1983
No. 18 The Impact of the Current Exchange RateSystem on Trade and Inflation of SelectedDeveloping Member Countries—Pradumna Rana, September 1983
No. 19 Asian Agriculture in Transition: Key Policy Issues—William James, September 1983
No. 20 The Transition to an Industrial Economyin Monsoon Asia—Harry T. Oshima, October 1983
No. 21 The Significance of Off-Farm Employmentand Incomes in Post-War East Asian Growth—Harry T. Oshima, January 1984
No. 22 Income Distribution and Poverty in SelectedAsian Countries—John Malcolm Dowling, Jr., November 1984
No. 23 ASEAN Economies and ASEAN EconomicCooperation—Narongchai Akrasanee, November 1984
No. 24 Economic Analysis of Power Projects—Nitin Desai, January 1985
No. 25 Exports and Economic Growth in the Asian Region—Pradumna Rana, February 1985
No. 26 Patterns of External Financing of DMCs—E. Go, May 1985
No. 27 Industrial Technology Developmentthe Republic of Korea—S.Y. Lo, July 1985
No. 28 Risk Analysis and Project Selection:A Review of Practical Issues—J.K. Johnson, August 1985
No. 29 Rice in Indonesia: Price Policy and ComparativeAdvantage—I. Ali, January 1986
No. 30 Effects of Foreign Capital Inflowson Developing Countries of Asia—Jungsoo Lee, Pradumna B. Rana, and YoshihiroIwasaki, April 1986
No. 31 Economic Analysis of the EnvironmentalImpacts of Development Projects—John A. Dixon et al., EAPI, East-West Center,August 1986
No. 32 Science and Technology for Development:Role of the Bank—Kedar N. Kohli and Ifzal Ali, November 1986
No. 33 Satellite Remote Sensing in the Asianand Pacific Region—Mohan Sundara Rajan, December 1986
No. 34 Changes in the Export Patterns of Asian andPacific Developing Countries: An EmpiricalOverview—Pradumna B. Rana, January 1987
No. 35 Agricultural Price Policy in Nepal—Gerald C. Nelson, March 1987
No. 36 Implications of Falling Primary CommodityPrices for Agricultural Strategy in the Philippines—Ifzal Ali, September 1987
No. 37 Determining Irrigation Charges: A Framework—Prabhakar B. Ghate, October 1987
No. 38 The Role of Fertilizer Subsidies in AgriculturalProduction: A Review of Select Issues
—M.G. Quibria, October 1987No. 39 Domestic Adjustment to External Shocks
in Developing Asia—Jungsoo Lee, October 1987
No. 40 Improving Domestic Resource Mobilizationthrough Financial Development: Indonesia—Philip Erquiaga, November 1987
No. 41 Recent Trends and Issues on Foreign DirectInvestment in Asian and Pacific DevelopingCountries—P.B. Rana, March 1988
No. 42 Manufactured Exports from the Philippines:A Sector Profile and an Agenda for Reform—I. Ali, September 1988
No. 43 A Framework for Evaluating the EconomicBenefits of Power Projects—I. Ali, August 1989
No. 44 Promotion of Manufactured Exports in Pakistan—Jungsoo Lee and Yoshihiro Iwasaki, September1989
No. 45 Education and Labor Markets in Indonesia:A Sector Survey—Ernesto M. Pernia and David N. Wilson,September 1989
No. 46 Industrial Technology Capabilitiesand Policies in Selected ADCs—Hiroshi Kakazu, June 1990
No. 47 Designing Strategies and Policiesfor Managing Structural Change in Asia—Ifzal Ali, June 1990
No. 48 The Completion of the Single European CommunityMarket in 1992: A Tentative Assessment of itsImpact on Asian Developing Countries—J.P. Verbiest and Min Tang, June 1991
No. 49 Economic Analysis of Investment in Power Systems—Ifzal Ali, June 1991
No. 50 External Finance and the Role of MultilateralFinancial Institutions in South Asia:Changing Patterns, Prospects, and Challenges—Jungsoo Lee, November 1991
No. 51 The Gender and Poverty Nexus: Issues andPolicies—M.G. Quibria, November 1993
No. 52 The Role of the State in Economic Development:Theory, the East Asian Experience,and the Malaysian Case—Jason Brown, December 1993
No. 53 The Economic Benefits of Potable Water SupplyProjects to Households in Developing Countries—Dale Whittington and Venkateswarlu Swarna,January 1994
No. 54 Growth Triangles: Conceptual Issuesand Operational Problems—Min Tang and Myo Thant, February 1994
No. 55 The Emerging Global Trading Environmentand Developing Asia—Arvind Panagariya, M.G. Quibria, and NarhariRao, July 1996
No. 56 Aspects of Urban Water and Sanitation inthe Context of Rapid Urbanization inDeveloping Asia—Ernesto M. Pernia and Stella LF. Alabastro,September 1997
No. 57 Challenges for Asia’s Trade and Environment—Douglas H. Brooks, January 1998
No. 58 Economic Analysis of Health Sector Projects-A Review of Issues, Methods, and Approaches—Ramesh Adhikari, Paul Gertler, and AnneliLagman, March 1999
No. 59 The Asian Crisis: An Alternate View—Rajiv Kumar and Bibek Debroy, July 1999
No. 60 Social Consequences of the Financial Crisis inAsia—James C. Knowles, Ernesto M. Pernia, and MaryRacelis, November 1999

38
No. 1 Estimates of the Total External Debt ofthe Developing Member Countries of ADB:1981-1983—I.P. David, September 1984
No. 2 Multivariate Statistical and GraphicalClassification Techniques Appliedto the Problem of Grouping Countries—I.P. David and D.S. Maligalig, March 1985
No. 3 Gross National Product (GNP) MeasurementIssues in South Pacific Developing MemberCountries of ADB—S.G. Tiwari, September 1985
No. 4 Estimates of Comparable Savings in SelectedDMCs—Hananto Sigit, December 1985
No. 5 Keeping Sample Survey Designand Analysis Simple—I.P. David, December 1985
No. 6 External Debt Situation in AsianDeveloping Countries—I.P. David and Jungsoo Lee, March 1986
No. 7 Study of GNP Measurement Issues in theSouth Pacific Developing Member Countries.Part I: Existing National Accountsof SPDMCs–Analysis of Methodologyand Application of SNA Concepts—P. Hodgkinson, October 1986
STATISTICAL REPORT SERIES (SR)
No. 8 Study of GNP Measurement Issues in the SouthPacific Developing Member Countries.Part II: Factors Affecting IntercountryComparability of Per Capita GNP—P. Hodgkinson, October 1986
No. 9 Survey of the External Debt Situationin Asian Developing Countries, 1985—Jungsoo Lee and I.P. David, April 1987
No. 10 A Survey of the External Debt Situationin Asian Developing Countries, 1986—Jungsoo Lee and I.P. David, April 1988
No. 11 Changing Pattern of Financial Flows to Asianand Pacific Developing Countries—Jungsoo Lee and I.P. David, March 1989
No. 12 The State of Agricultural Statistics inSoutheast Asia—I.P. David, March 1989
No. 13 A Survey of the External Debt Situationin Asian and Pacific Developing Countries:1987-1988—Jungsoo Lee and I.P. David, July 1989
No. 14 A Survey of the External Debt Situation inAsian and Pacific Developing Countries: 1988-1989—Jungsoo Lee, May 1990
No. 15 A Survey of the External Debt Situationin Asian and Pacific Developing Countries: 1989-1992
No. 1 Poverty in the People’s Republic of China:Recent Developments and Scopefor Bank Assistance—K.H. Moinuddin, November 1992
No. 2 The Eastern Islands of Indonesia: An Overviewof Development Needs and Potential—Brien K. Parkinson, January 1993
No. 3 Rural Institutional Finance in Bangladeshand Nepal: Review and Agenda for Reforms—A.H.M.N. Chowdhury and Marcelia C. Garcia,November 1993
No. 4 Fiscal Deficits and Current Account Imbalancesof the South Pacific Countries:A Case Study of Vanuatu—T.K. Jayaraman, December 1993
No. 5 Reforms in the Transitional Economies of Asia—Pradumna B. Rana, December 1993
No. 6 Environmental Challenges in the People’s Republicof China and Scope for Bank Assistance—Elisabetta Capannelli and Omkar L. Shrestha,December 1993
No. 7 Sustainable Development Environmentand Poverty Nexus—K.F. Jalal, December 1993
No. 8 Intermediate Services and EconomicDevelopment: The Malaysian Example—Sutanu Behuria and Rahul Khullar, May 1994
No. 9 Interest Rate Deregulation: A Brief Surveyof the Policy Issues and the Asian Experience—Carlos J. Glower, July 1994
No. 10 Some Aspects of Land Administrationin Indonesia: Implications for Bank Operations—Sutanu Behuria, July 1994
No. 11 Demographic and Socioeconomic Determinantsof Contraceptive Use among Urban Women inthe Melanesian Countries in the South Pacific:A Case Study of Port Vila Town in Vanuatu—T.K. Jayaraman, February 1995
No. 12 Managing Development throughInstitution Building— Hilton L. Root, October 1995
No. 13 Growth, Structural Change, and OptimalPoverty Interventions—Shiladitya Chatterjee, November 1995
No. 14 Private Investment and MacroeconomicEnvironment in the South Pacific IslandCountries: A Cross-Country Analysis—T.K. Jayaraman, October 1996
No. 15 The Rural-Urban Transition in Viet Nam:Some Selected Issues—Sudipto Mundle and Brian Van Arkadie, October1997
No. 16 A New Approach to Setting the FutureTransport Agenda—Roger Allport, Geoff Key, and Charles Melhuish,June 1998
No. 17 Adjustment and Distribution:The Indian Experience—Sudipto Mundle and V.B. Tulasidhar, June 1998
No. 18 Tax Reforms in Viet Nam: A Selective Analysis—Sudipto Mundle, December 1998
No. 19 Surges and Volatility of Private Capital Flows toAsian Developing Countries: Implicationsfor Multilateral Development Banks—Pradumna B. Rana, December 1998
No. 20 The Millennium Round and the Asian Economies:An Introduction—Dilip K. Das, October 1999
No. 21 Occupational Segregation and the GenderEarnings Gap—Joseph E. Zveglich, Jr. and Yana van der MeulenRodgers, December 1999
No. 22 Information Technology: Next Locomotive ofGrowth?—Dilip K. Das, June 2000
OCCASIONAL PAPERS (OP)

39
—Min Tang, June 1991No. 16 Recent Trends and Prospects of External Debt
Situation and Financial Flows to Asianand Pacific Developing Countries—Min Tang and Aludia Pardo, June 1992
No. 17 Purchasing Power Parity in Asian DevelopingCountries: A Co-Integration Test
—Min Tang and Ronald Q. Butiong, April 1994No. 18 Capital Flows to Asian and Pacific Developing
Countries: Recent Trends and Future Prospects—Min Tang and James Villafuerte, October 1995
FROM OXFORD UNIVERSITY PRESS:Oxford University Press (China) Ltd18th Floor, Warwick House EastTaikoo Place, 979 King’s RoadQuarry Bay, Hong KongTel (852) 2516 3222Fax (852) 2565 8491E-mail: [email protected]: www.oupchina.com.hk
1. Informal Finance: Some Findings from AsiaPrabhu Ghate et. al., 1992$15.00 (paperback)
2. Mongolia: A Centrally Planned Economyin TransitionAsian Development Bank, 1992$15.00 (paperback)
3. Rural Poverty in Asia, Priority Issues and PolicyOptionsEdited by M.G. Quibria, 1994$25.00 (paperback)
4. Growth Triangles in Asia: A New Approachto Regional Economic CooperationEdited by Myo Thant, Min Tang, and Hiroshi Kakazu1st ed., 1994 $36.00 (hardbound)Revised ed., 1998 $55.00 (hardbound)
5. Urban Poverty in Asia: A Survey of Critical IssuesEdited by Ernesto Pernia, 1994$18.00 (paperback)
6. Critical Issues in Asian Development:Theories, Experiences, and PoliciesEdited by M.G. Quibria, 1995$15.00 (paperback)$36.00 (hardbound)
7. Financial Sector Development in AsiaEdited by Shahid N. Zahid, 1995$50.00 (hardbound)
8. Financial Sector Development in Asia: Country StudiesEdited by Shahid N. Zahid, 1995$55.00 (hardbound)
9. Fiscal Management and Economic Reformin the People’s Republic of ChinaChristine P.W. Wong, Christopher Heady, and Wing T.Woo, 1995$15.00 (paperback)
10. From Centrally Planned to Market Economies:The Asian ApproachEdited by Pradumna B. Rana and Naved Hamid, 1995Vol. 1: Overview$36.00 (hardbound)Vol. 2: People’s Republic of China and Mongolia$50.00 (hardbound)Vol. 3: Lao PDR, Myanmar, and Viet Nam$50.00 (hardbound)
11. Current Issues in Economic Development:An Asian Perspective
SPECIAL STUDIES, CO-PUBLISHED(Available commercially through Oxford University Press Offices, Edward Elgar Publishing, andPalgrave MacMillan)
Edited by M.G. Quibria and J. Malcolm Dowling, 1996$50.00 (hardbound)
12. The Bangladesh Economy in TransitionEdited by M.G. Quibria, 1997$20.00 (hardbound)
13. The Global Trading System and Developing AsiaEdited by Arvind Panagariya, M.G. Quibria,and Narhari Rao, 1997$55.00 (hardbound)
14. Social Sector Issues in Transitional Economies of AsiaEdited by Douglas H. Brooks and Myo Thant, 1998$25.00 (paperback)$55.00 (hardbound)
15. Intergovernmental Fiscal Transfers in Asia: CurrentPractice and Challenges for the FutureEdited by Yun-Hwan Kim and Paul Smoke, 2003$15.00 (paperback)
16. Local Government Finance and Bond MarketsEdited by Yun-Hwan Kim, 2003$15.00 (paperback)
FROM EDWARD ELGAR:Marston Book Services LimitedPO Box 269, AbingdonOxon OX14 4YN, United KingdomTel +44 1235 465500Fax +44 1235 465555Email: [email protected]: www.marston.co.uk
1. Reducing Poverty in Asia: Emerging Issues in Growth,Targeting, and MeasurementEdited by Christopher M. Edmonds, 2003
FROM PALGRAVE MACMILLAN:Palgrave Macmillan LtdHoundmills, BasingstokeHampshire RG21 6XS, United KingdomTel: +44 (0)1256 329242Fax: +44 (0)1256 479476Email: [email protected]: www.palgrave.com/home/
1. Labor Markets in Asia: Issues and PerspectivesEdited by Jesus Felipe and Rana Hasan, 2006
2. Competition Policy and Development in AsiaEdited by Douglas H. Brooks and Simon Evenett, 2005
3. Managing FDI in a Globalizing EconomyAsian ExperiencesEdited by Douglas H. Brooks and Hal Hill, 2004
4. Poverty, Growth, and Institutions in Developing AsiaEdited by Ernesto M. Pernia and Anil B. Deolalikar,2003

40
1. Rural Poverty in Developing AsiaEdited by M.G. QuibriaVol. 1: Bangladesh, India, and Sri Lanka, 1994$35.00 (paperback)Vol. 2: Indonesia, Republic of Korea, Philippines,and Thailand, 1996$35.00 (paperback)
2. Gender Indicators of Developing Asian and PacificCountriesAsian Development Bank, 1993$25.00 (paperback)
3. External Shocks and Policy Adjustments: Lessons fromthe Gulf CrisisEdited by Naved Hamid and Shahid N. Zahid, 1995$15.00 (paperback)
4. Indonesia-Malaysia-Thailand Growth Triangle:Theory to PracticeEdited by Myo Thant and Min Tang, 1996$15.00 (paperback)
5. Emerging Asia: Changes and ChallengesAsian Development Bank, 1997$30.00 (paperback)
6. Asian ExportsEdited by Dilip Das, 1999$35.00 (paperback)$55.00 (hardbound)
7. Development of Environment Statistics in DevelopingAsian and Pacific CountriesAsian Development Bank, 1999$30.00 (paperback)
8. Mortgage-Backed Securities Markets in AsiaEdited by S.Ghon Rhee & Yutaka Shimomoto, 1999$35.00 (paperback)
9. Rising to the Challenge in Asia: A Study of FinancialMarketsAsian Development BankVol. 1: An Overview, 2000 $20.00 (paperback)Vol. 2: Special Issues, 1999 $15.00 (paperback)Vol. 3: Sound Practices, 2000 $25.00 (paperback)Vol. 4: People’s Republic of China, 1999 $20.00(paperback)Vol. 5: India, 1999 $30.00 (paperback)Vol. 6: Indonesia, 1999 $30.00 (paperback)Vol. 7: Republic of Korea, 1999 $30.00 (paperback)Vol. 8: Malaysia, 1999 $20.00 (paperback)Vol. 9: Pakistan, 1999 $30.00 (paperback)Vol. 10: Philippines, 1999 $30.00 (paperback)Vol. 11: Thailand, 1999 $30.00 (paperback)Vol. 12: Socialist Republic of Viet Nam, 1999 $30.00(paperback)
10. Corporate Governance and Finance in East Asia:A Study of Indonesia, Republic of Korea, Malaysia,Philippines and ThailandJ. Zhuang, David Edwards, D. Webb, & Ma. VirginitaCapulongVol. 1: A Consolidated Report, 2000 $10.00 (paperback)Vol. 2: Country Studies, 2001 $15.00 (paperback)
11. Financial Management and Governance IssuesAsian Development Bank, 2000Cambodia $10.00 (paperback)People’s Republic of China $10.00 (paperback)Mongolia $10.00 (paperback)Pakistan $10.00 (paperback)Papua New Guinea $10.00 (paperback)Uzbekistan $10.00 (paperback)Viet Nam $10.00 (paperback)Selected Developing Member Countries $10.00 (paperback)
12. Government Bond Market Development in AsiaEdited by Yun-Hwan Kim, 2001$25.00 (paperback)
13. Intergovernmental Fiscal Transfers in Asia: Current Practiceand Challenges for the FutureEdited by Paul Smoke and Yun-Hwan Kim, 2002$15.00 (paperback)
14. Guidelines for the Economic Analysis of ProjectsAsian Development Bank, 1997$10.00 (paperback)
15. Guidelines for the Economic Analysis ofTelecommunications ProjectsAsian Development Bank, 1997$10.00 (paperback)
16. Handbook for the Economic Analysis of Water Supply ProjectsAsian Development Bank, 1999$10.00 (hardbound)
17. Handbook for the Economic Analysis of Health Sector ProjectsAsian Development Bank, 2000$10.00 (paperback)
18. Handbook for Integrating Povery Impact Assessment inthe Economic Analysis of ProjectsAsian Development Bank, 2001$10.00 (paperback)
19. Handbook for Integrating Risk Analysis in the EconomicAnalysis of ProjectsAsian Development Bank, 2002$10.00 (paperback)
20. Handbook on Environment StatisticsAsian Development Bank, 2002$10.00 (hardback)
21. Defining an Agenda for Poverty Reduction, Volume 1Edited by Christopher Edmonds and Sara Medina, 2002$15.00 (paperback)
22. Defining an Agenda for Poverty Reduction, Volume 2Edited by Isabel Ortiz, 2002$15.00 (paperback)
23. Economic Analysis of Policy-based Operations: KeyDimensionsAsian Development Bank, 2003$10.00 (paperback)
SPECIAL STUDIES, IN-HOUSE(Available commercially through ADB Office of External Relations)

Printed in the Philippines
Asian Development Bank6 ADB Avenue, Mandaluyong City1550 Metro Manila, Philippineswww.adb.org/economicsISSN: 1655-5252Publication Stock No. 050407
About the Asian Development Bank
The work of the Asian Development Bank (ADB) is aimed at improving the welfare of the people in Asiaand the Pacific, particularly the 1.9 billion who live on less than $2 a day. Despite many success stories,Asia and the Pacific remains home to two thirds of the world’s poor. ADB is a multilateral developmentfinance institution owned by 67 members, 48 from the region and 19 from other parts of the globe.ADB’s vision is a region free of poverty. Its mission is to help its developing member countries reducepoverty and improve the quality of life of their citizens.
ADB’s main instruments for providing help to its developing member countries are policy dialogue, loans,technical assistance, grants, guarantees, and equity investments. ADB’s annual lending volume is typicallyabout $6 billion, with technical assistance usually totaling about $180 million a year.
ADB’s headquarters is in Manila. It has 26 offices around the world and has more than 2,000 employeesfrom over 50 countries.
About the PaperJuzhong Zhuang, Zhihong Liang, Tun Lin, and Franklin De Guzman survey theories and practicesin the choice of the social discount rate for cost-benefit analysis of public projects. The issue of choosing an appropriate discount rate for intergenerational projects is also highlighted in light of recent debates on the economics of climate change.
May 2007
ERDECONOMICS AND RESEARCH DEPARTMENT
Working PaperSERIESNo.94
Juzhong Zhuang, Zhihong Liang, Tun Lin, and Franklin De Guzman
Theory and Practice in the Choiceof Social Discount Rate for Cost-Benefit Analysis:A Survey
Theory and Practice in the Choiceof Social Discount Rate for Cost-Benefit Analysis:A Survey
< 0 0 50 4 0 72 >