Embed Size (px)
Citation preview
For free distribution
104
06
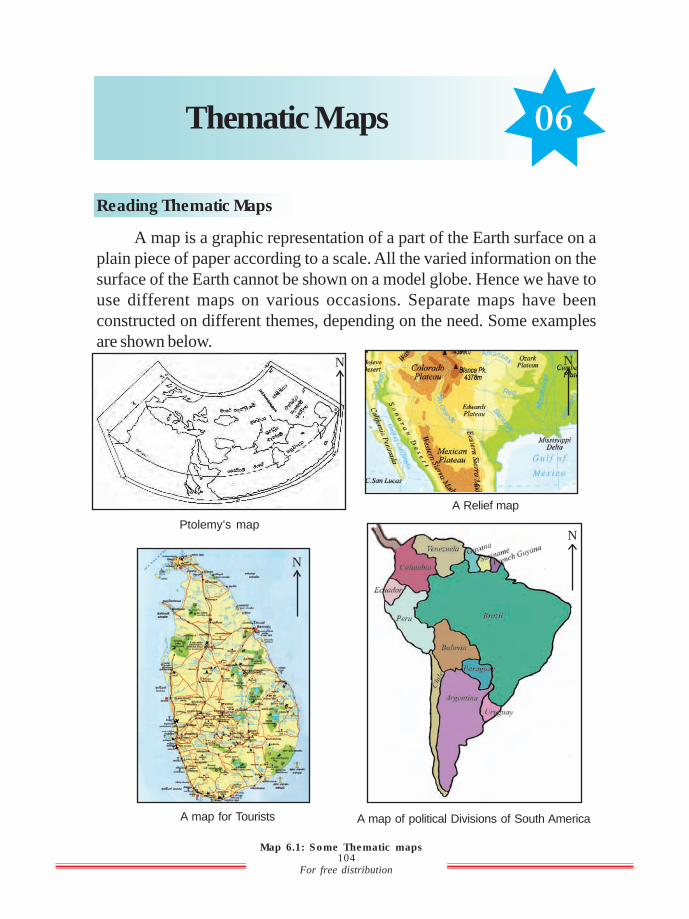
Reading Thematic Maps
A map is a graphic representation of a part of the Earth surface on a
plain piece of paper according to a scale. All the varied information on the
surface of the Earth cannot be shown on a model globe. Hence we have to
use different maps on various occasions. Separate maps have been
constructed on different themes, depending on the need. Some examples
are shown below.
Ptolemy’s map
A Relief map
A map for Tourists A map of political Divisions of South America
Map 6.1: Some Thematic maps
N
N N
N
Thematic Maps
For free distribution
105
Geographers mostly use maps to show relief, climatic characteristics
and varied human activities. But many people use maps for various purposes.
Hence, today the map has become a tool or instrument used in day to day
life of the people.
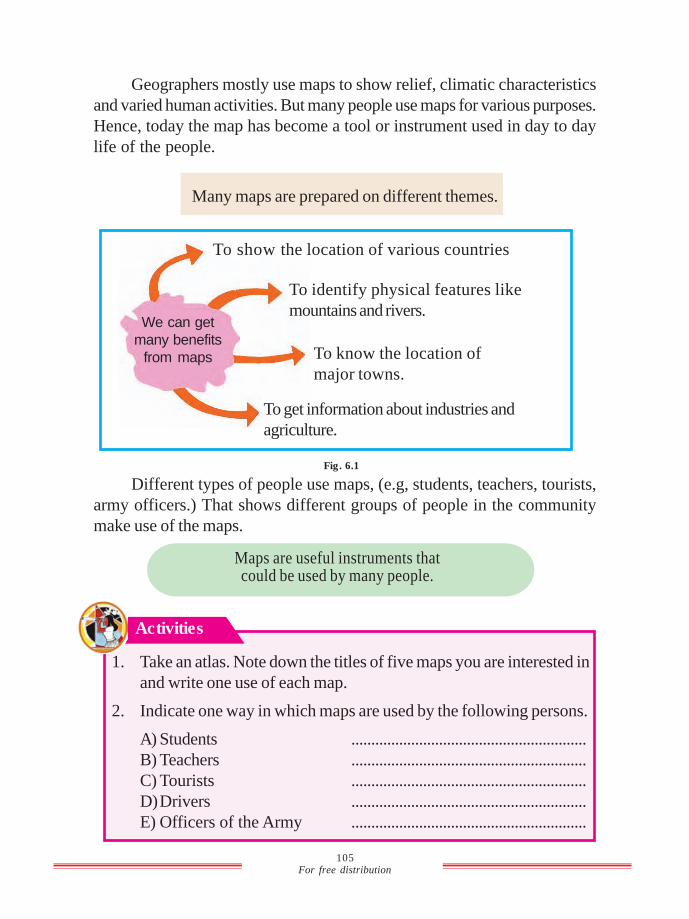
Many maps are prepared on different themes.
We can get
many benefits
from maps
To show the location of various countries
To identify physical features like
mountains and rivers.
To know the location of
major towns.
To get information about industries and
agriculture.
Fig. 6.1
Different types of people use maps, (e.g, students, teachers, tourists,
army officers.) That shows different groups of people in the community
make use of the maps.
Maps are useful instruments thatcould be used by many people.
1. Take an atlas. Note down the titles of five maps you are interested in
and write one use of each map.
2. Indicate one way in which maps are used by the following persons.
A) Students ...........................................................
B) Teachers ...........................................................
C) Tourists ...........................................................
D)Drivers ...........................................................
E) Officers of the Army ...........................................................
Activities
For free distribution
106
In order to make use of a map one should be able to read it. To
read a book you must have the knowledge of letters. Similarly in order to
read a map you must have a knowledge about how the maps are prepared.
Maps are prepared in many ways. A knowledge about reading a map is useful
to improve your knowledge and to spend your free time in an enjoyable way.
There are some common features in all the maps.
Direction
Theme Scale
Symbols
Colours
Map
Fig. 6.2 Common features of amap.
Direction
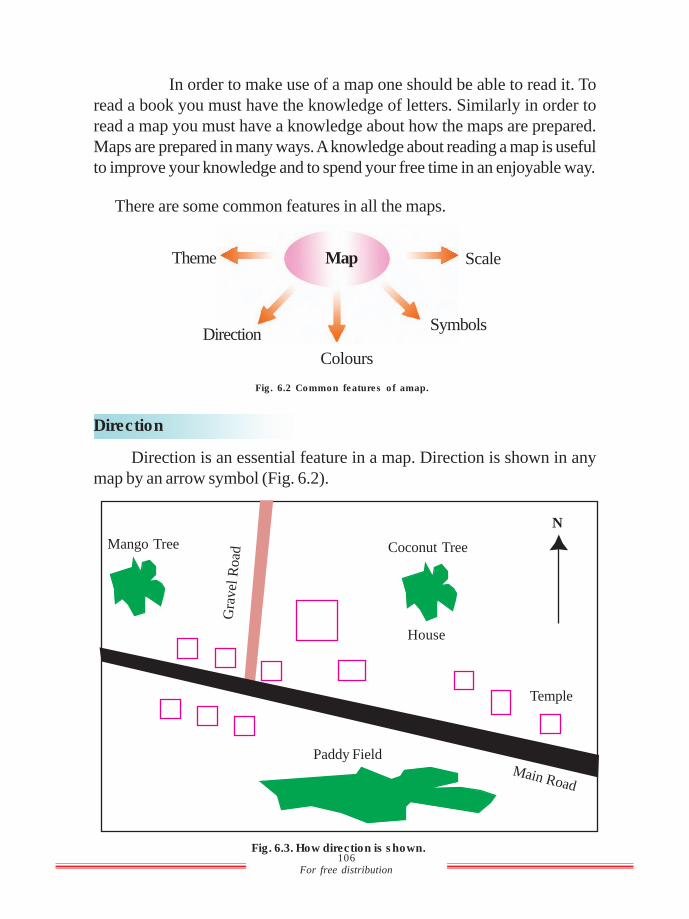
Direction is an essential feature in a map. Direction is shown in any
map by an arrow symbol (Fig. 6.2).
Fig. 6.3. How direction is shown.
rEmh 6'3 - ÈYdj ±laùu
House
Gra
vel
Road
Main Road
N
Temple
Coconut TreeMango Tree
Paddy Field
For free distribution
107
You may be knowing that there are four major directions and four sub
directions.
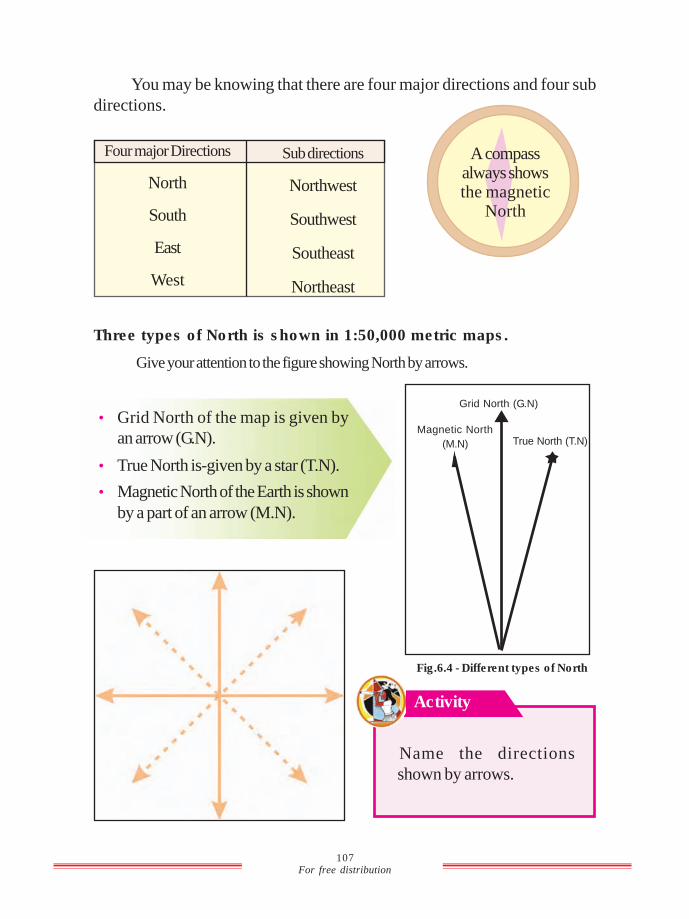
Three types of North is shown in 1:50,000 metric maps.
Give your attention to the figure showing North by arrows.
• Grid North of the map is given by
an arrow (G.N).
• True North is-given by a star (T.N).
• Magnetic North of the Earth is shown
by a part of an arrow (M.N).
Grid North (G.N)
True North (T.N)Magnetic North
(M.N)
Fig.6.4 - Different types of North
A compassalways showsthe magnetic
North
Four major Directions
North
South
East
West
Sub directions
Northwest
Southwest
Southeast
Northeast
Name the directions
shown by arrows.
Activity
For free distribution
108
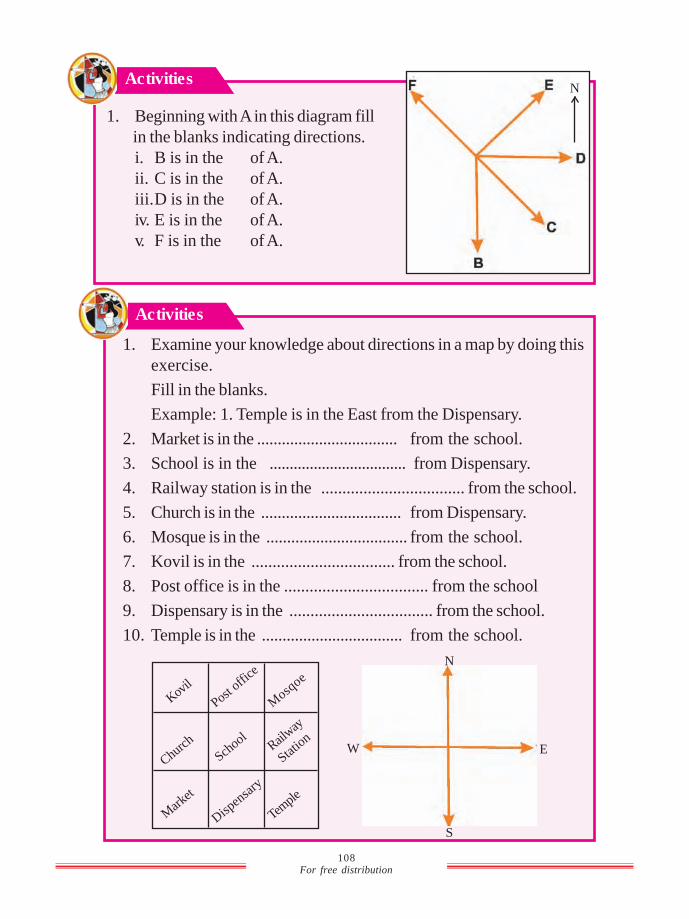
1. Beginning with A in this diagram fill
in the blanks indicating directions.
i. B is in the of A.
ii. C is in the of A.
iii.D is in the of A.
iv. E is in the of A.
v. F is in the of A.
ActivitiesN
Activities
1. Examine your knowledge about directions in a map by doing this
exercise.
Fill in the blanks.
Example: 1. Temple is in the East from the Dispensary.
2. Market is in the .................................. from the school.
3. School is in the .................................. from Dispensary.
4. Railway station is in the .................................. from the school.
5. Church is in the .................................. from Dispensary.
6. Mosque is in the .................................. from the school.
7. Kovil is in the .................................. from the school.
8. Post office is in the .................................. from the school
9. Dispensary is in the .................................. from the school.
10. Temple is in the .................................. from the school.
Kovil
Post offi
ce
Mosq
oe
Church
School
Railway
Statio
n
Mar
ket
Disp
ensa
ry
Templ
e
N
S
EW
For free distribution
109
Draw a sketch diagram of your home graden. Mark the North
direction in it. Write the directions of other objects in the garden
from your house. Take it to the class and discuss with the others.
Activities
Direction is useful to find the location of a particular place.
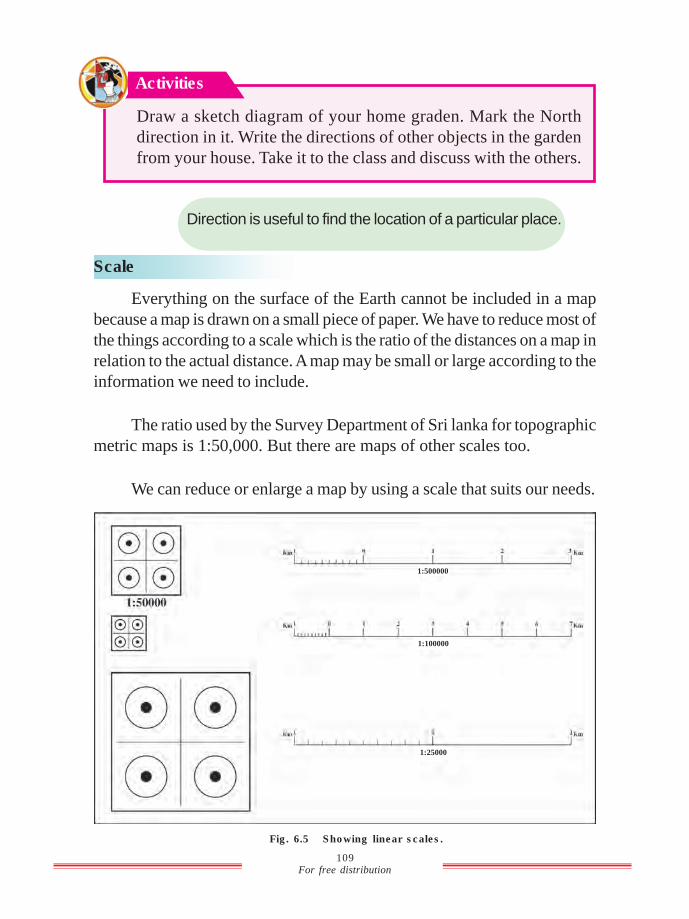
Scale
Everything on the surface of the Earth cannot be included in a map
because a map is drawn on a small piece of paper. We have to reduce most of
the things according to a scale which is the ratio of the distances on a map in
relation to the actual distance. A map may be small or large according to the
information we need to include.
The ratio used by the Survey Department of Sri lanka for topographic
metric maps is 1:50,000. But there are maps of other scales too.
We can reduce or enlarge a map by using a scale that suits our needs.
Fig. 6.5 Showing linear scales.
1:100000
1:500000
1:25000
For free distribution
110
1. Draw a picture of a room with 20m in length and 10m in width.
2. Measure the length and breadth of your classroom in metres.
Draw the sketch of the class room space on 1 cm = 5m scale.
3. Measure the length and breadth of your house. Draw the sketsh
of the floor area according to the scale given above.
4. Using the scales given in fig.6.5 reduce the plans you have drawn
to half the size and enlarge them two times.
Activities
Now you have already learned how the different scales are used to
draw maps or sketches. Let us see how scales are used for reading maps.
You can find the distance between two places according to the scale given in
the map. Imagine the length is given in the scale as one centimetre is equal
to two kilometres. If the distance between two places is 5cm on the map
actual distance between the two places is ten kilometres.
All the maps are drawn on a scaleto show the actual distances.
The distance between two
places could be calculated
by using the linear scale.
Colours and Symbols
Teacher informed the students that she is going to teach colours and
symbols in a map as the next lesson. And she has instructed the students to
find information on colours and symbols used in maps when they come
back. After coming home Amal ran to his sister who is offering Geography
as a subject for Advanced Level to find information.
Amal:
Excuse me sister, we are learning how to read maps these days. Now we can
find the direction and use the scale to find distances. Teacher said that the
next lesson is on colours and symbols of maps. Can you please explain a little
about colours and symbols of a map ?Sister:
Right, 1 can help you. Please bring your atlas and turn to any map that
you are interested in. Then tell me what are the colours you see in it.
For free distribution
111
Amal
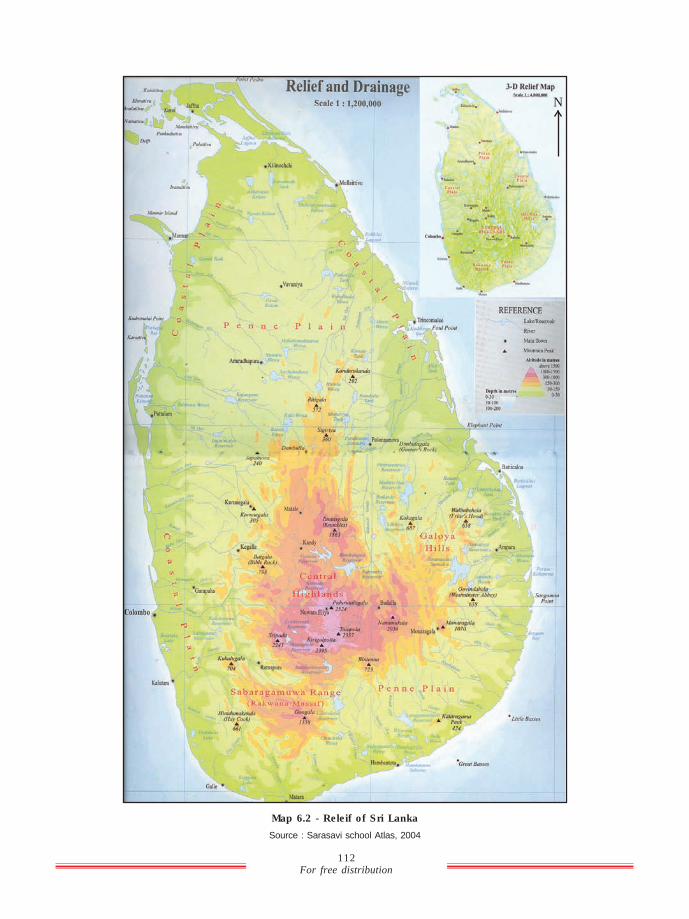
I have turned to the physical map of Sri Lanka. I can see light green, dark
green, dark brown and light brown, and the sea is shaded in dark blue and
light blue ...........
Sister
See how rivers and lagoons are marked. Those are also in blue, aren’t they?
Amal
Yes! Sister. So how can we get to know the things in different colours?
Sister
Please, look carefully at the map again. There is a key to the map on a
side. Colours, letters and symbols are explained in the key. Can you see
the height of mountains and depth of the sea shown there?
Sister
See what features are in blue.
Amal
Sister, rivers and seas are in blue colour.Sister
Oh good. Now you know the lowlands are shaded in green, highlands are
shaded in brown and all the water bodies are shaded in blue. Isn’t that so?
Amal
Sister, then what are symbols?
Amal
Yes, the height is given in metres. Light green shows the land between 0- 100 m.Dark brown is for land between 2000-3000 m.
Sister
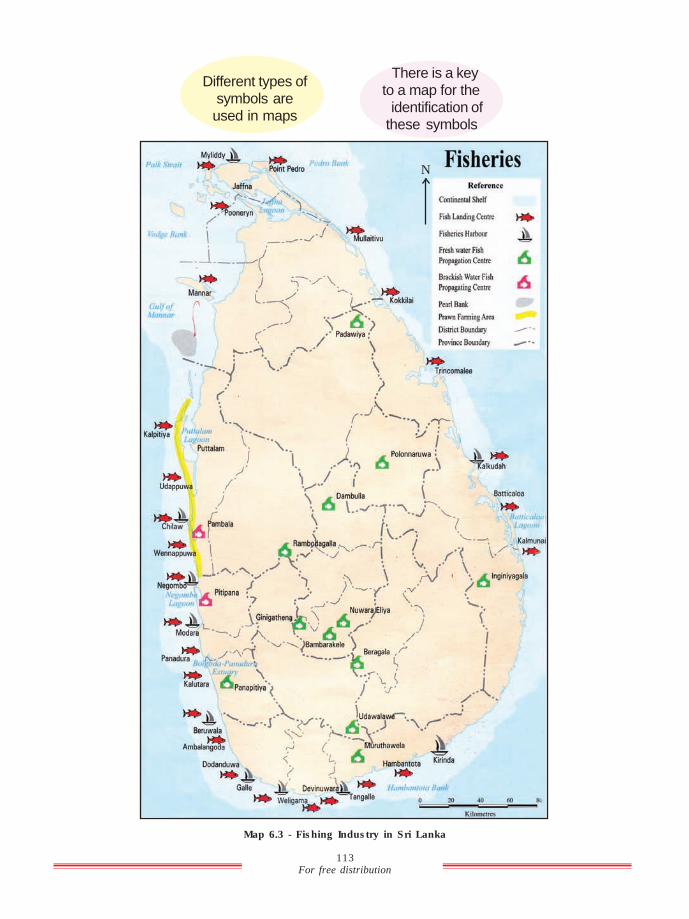
What we want to know, in a map, are shown by small pictures, English lettersor numbers. We call those as symbols. Look at the fisheries map of Sri Lanka.There, fishery harbours are shown by a symbol of a ship. The symbol of a fishis shown in the fishing area.
Amal
Thank you very much. Enough for the day. Teacher will give more details.
For free distribution
112
Map 6.2 - Releif of Sri Lanka
Source : Sarasavi school Atlas, 2004
N
For free distribution
113
Different types ofsymbols areused in maps
There is a keyto a map for the
identification ofthese symbols
Map 6.3 - Fishing Industry in Sri Lanka
N
For free distribution
114
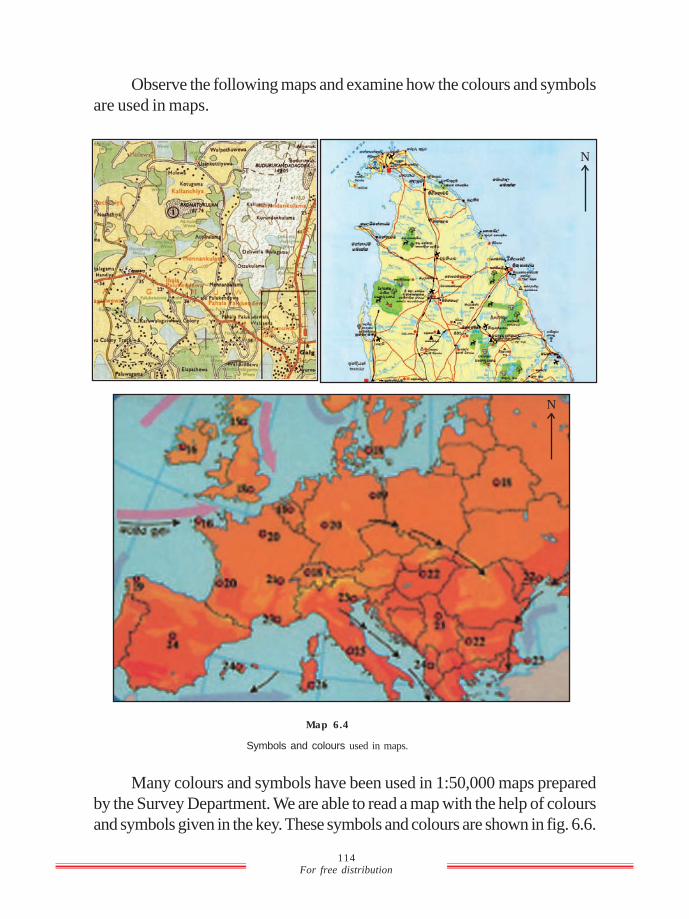
Observe the following maps and examine how the colours and symbols
are used in maps.
Map 6.4
Symbols and colours used in maps.
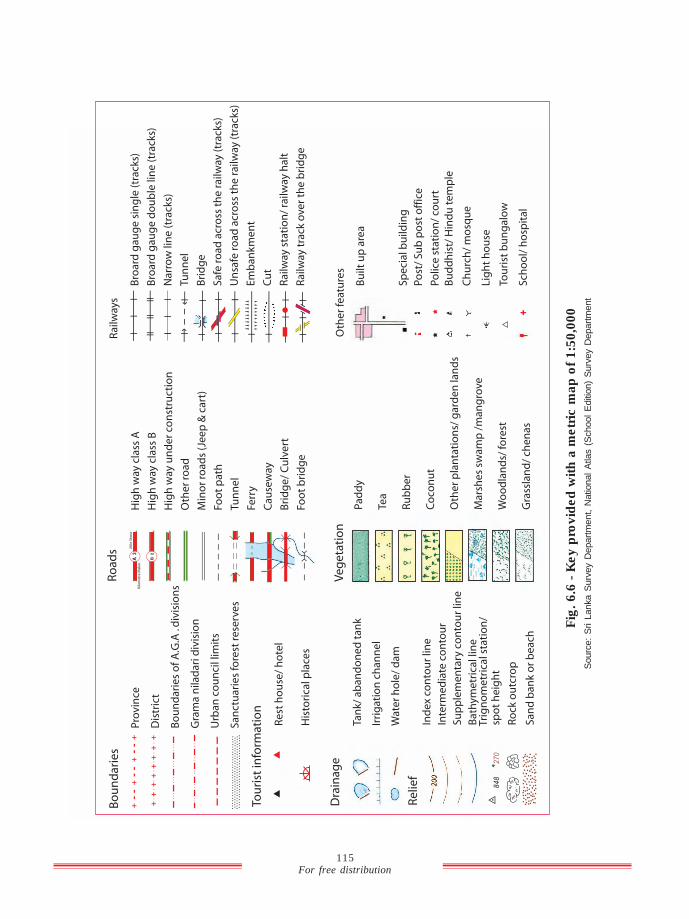
Many colours and symbols have been used in 1:50,000 maps prepared
by the Survey Department. We are able to read a map with the help of colours
and symbols given in the key. These symbols and colours are shown in fig. 6.6.
NN
N
For free distribution
115
Fig
. 6.6
- K
ey p
rovid
ed
wit
h a
metr
ic m
ap
of
1:5
0,0
00
Sourc
e:
Sri L
anka S
urv
ey D
epart
ment, N
atio
nal
Atla
s (
School
Editi
on)
Surv
ey D
epart
ment
Bo
un
da
rie
s
Pro
vin
ce
Dis
tric
t
Bo
un
da
rie
s o
f A
.G.A
. d
ivis
ion
s
Gra
ma
nila
da
ri d
ivis
ion
Urb
an
co
un
cil l
imit
s
Sa
nct
ua
rie
s fo
rest
re
serv
es
Tou
rist
info
rma
tio
n
Re
st h
ou
se/
ho
tel
His
tori
cal p
lace
s
Dra
ina
ge
Tan
k/ a
ba
nd
on
ed
ta
nk
Irri
ga
tio
n c
ha
nn
el
Wa
ter
ho
le/
da
m
Re
lief
Ind
ex
con
tou
r lin
e
Inte
rme
dia
te c
on
tou
r
Su
pp
lem
en
tary
co
nto
ur
line
Ba
thym
etr
ica
l lin
e
spo
t h
eig
ht
Ro
ck o
utc
rop
Sa
nd
ba
nk
or
be
ach
Trig
no
me
tric
al s
tati
on
/
Ro
ad
s
Kilo
me
tre
Ma
ke
r
Hig
h w
ay c
lass
A
Hig
h w
ay c
lass
B
Hig
h w
ay u
nd
er
con
stru
ctio
n
Oth
er
roa
d
Min
or
roa
ds
(Je
ep
& c
art
)
Foo
t p
ath
Tun
ne
l
Ferr
y
Ca
use
way
Bri
dg
e/
Cu
lve
rt
Foo
t b
rid
ge
Mile
Sto
ne
Ve
ge
tati
on
Pa
dd
y
Tea
Ru
bb
er
Co
con
ut
Oth
er
pla
nta
tio
ns/
ga
rde
n la
nd
s
Ma
rsh
es
swa
mp
/m
an
gro
ve
Wo
od
lan
ds/
fo
rest
Gra
ssla
nd
/ ch
en
as
Ra
ilway
s
Bro
ard
ga
ug
e s
ing
le (
tra
cks)
Bro
ard
ga
ug
e d
ou
ble
lin
e (
tra
cks)
Na
rro
w li
ne
(tr
ack
s)
Tun
ne
l
Bri
dg
e
Sa
fe r
oa
d a
cro
ss t
he
ra
ilway
(tr
ack
s)
Un
safe
ro
ad
acr
oss
th
e r
ailw
ay (
tra
cks)
Em
ba
nk
me
nt
Cu
t
Ra
ilway
sta
tio
n/
railw
ay h
alt
Ra
ilway
tra
ck o
ver
the
bri
dg
e
Oth
er
fea
ture
s
Bu
ilt u
p a
rea
Sp
eci
al b
uild
ing
Po
st/
Su
b p
ost
off
ice
Po
lice
sta
tio
n/
cou
rt
Bu
dd
his
t/ H
ind
u t
em
ple
Ch
urc
h/
mo
squ
e
Lig
ht
ho
use
Tou
rist
bu
ng
alo
w
Sch
oo
l/ h
osp
ita
l
For free distribution
116
See Fig. 6.6 carefully and answer the following questions.
1 ................... colour is used to show the provincial boundary.
2. Draw the symbol used to mark the provincial boundary ...................
3 ................... colour is used to show the minor road.
4 ................... colour denotes paddy cultivation.
5. Draw the symbol used to show coconut cultivation ...................
6. Draw the symbol used to show rubber cultivation ...................
7. The railway line is shown by the symbol ...................
8. The symbol used to show a school is ...................
9. What is the symbol used to show the temple ? ...................
10. What is the symbol used to show the dispensary ? ...................
Activities
Road network is a major feature in maps. There are some maps
showing only the roads. All types of roads are included in 1:50,000 metric
maps. When you observe these roads you will come across some other
symbols along the roads e.g. symbols for bridges, culverts, railway stations,
railway crossing, tunnel are some of them.
The roads shown in metric maps are:
• Main Road
• Minor Roads
• Cart Track
• Foot path
• Railway
For free distribution
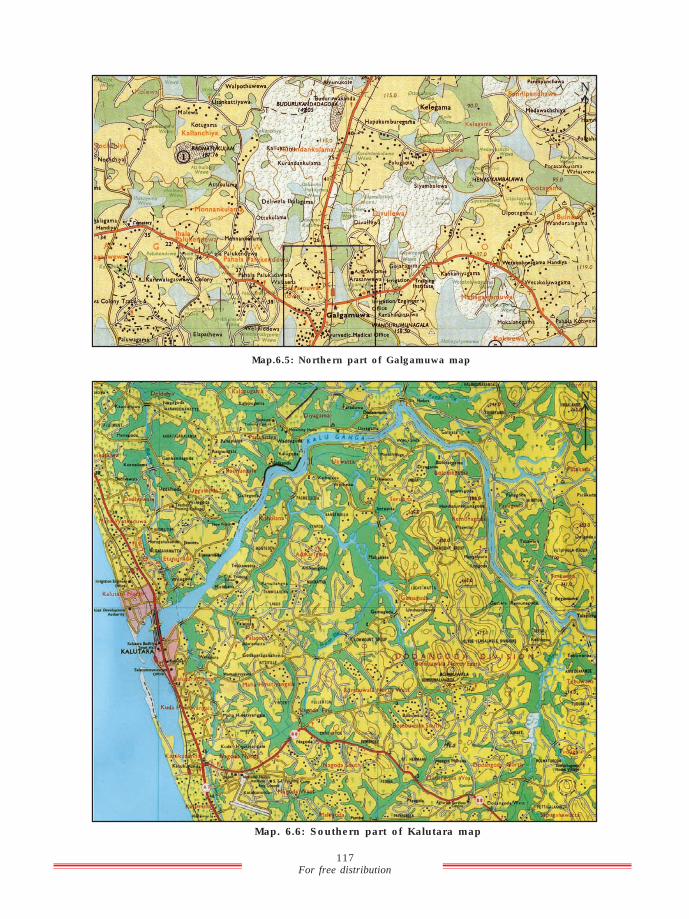
117
Map.6.5: Northern part of Galgamuwa map
Map. 6.6: Southern part of Kalutara map
N
N
For free distribution
118
Activities
1. Name the types of roads in the map of Galgamuwa.
2. Identify the cultural features located around the Glagamuwa
Town.
3. In what direction is the Railway station from the town?
4. There are three roads running from Galgamuwa town. What is the
distance of the road leading towards East from the town ?
Settlements
Settlement is a place where people live. Settlements differ according
to occupations and modes of living. We can identify some settlement
patterns in Sri Lanka.
Some of those settlement patterns are,
Junction settlements :- Places where many roads meet.
Tank settlements :- Places associated with a reservoir.
Eastate settlements :- Places in tea or rubber estates.
Fisheries settlements :- Places along the sea coast.
Linear settlements :- Places along the roads, rivers and canals
or sea coast.
Dispersed settlements :- Settlements found scattered.
Look at the Maps 6.5 and 6.6 carefully and answer the following.
1. What is the major junction settlement in the map of Galgamuwa ?
2. Name two major features of a Tank settlement.
3. Name three crops indicated in the map of Kalutara.
4. Name the administrative boundary that falls along Kaluganga.
Activities
For free distribution
119
Rivers and other water surfaces
You have learned that rivers and other water surfaces are shown in blue
in a map. Seas , rivers, canals, tanks and marshes are shown in blue with
different symbols.
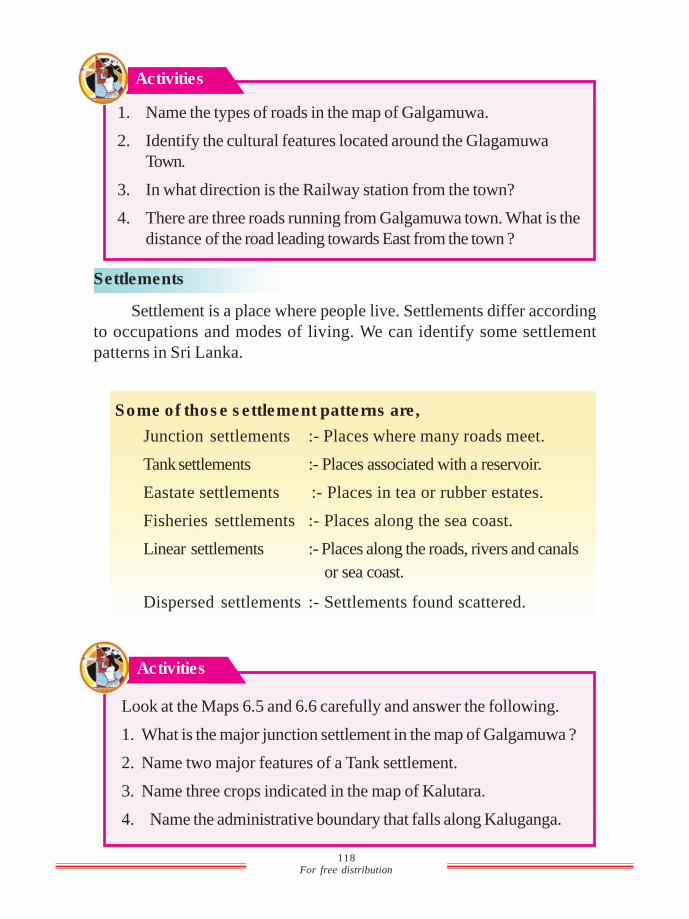
Contour lines
Surface of land is not same everywhere. You can observe plain flat
surfaces, slopes, highlands ect. When you walk in your school garden, home
garden or elsewhere in the country. These different levels of the land surface
is called relief. Map makers use contour lines to show the height. Contour
lines are drawn by joining the similar heights measured.
Major contour lines in metric maps are drawn in dark brown as a thick
line. Minor contour lines in between major contours are drawn in light brown.
The nature of the land can be understood by the pattern of contours.
The easiest way to understand the height and morphologicalfeatures is by studying contour lines.
Fig. 6.7 - Contour lines.
20
20
20
2020
20
20
4040
40
40
40
40
4060
60
60
6080
80
For free distribution
120
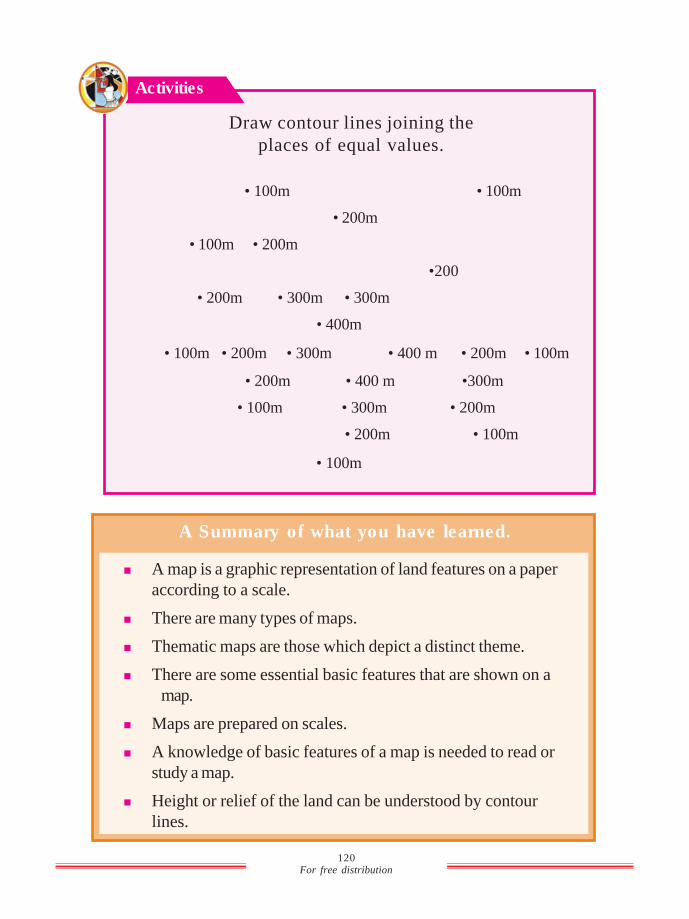
Activities
Draw contour lines joining the
places of equal values.
A Summary of what you have learned.
n A map is a graphic representation of land features on a paper
according to a scale.
n There are many types of maps.
n Thematic maps are those which depict a distinct theme.
n There are some essential basic features that are shown on a
map.
n Maps are prepared on scales.
n A knowledge of basic features of a map is needed to read or
study a map.
n Height or relief of the land can be understood by contour
lines.
• 100m • 100m
• 200m
• 100m • 200m
•200
• 200m • 300m • 300m
• 400m
• 100m • 200m • 300m • 400 m • 200m • 100m
• 200m • 400 m •300m
• 100m • 300m • 200m
• 200m • 100m
• 100m
For free distribution
121
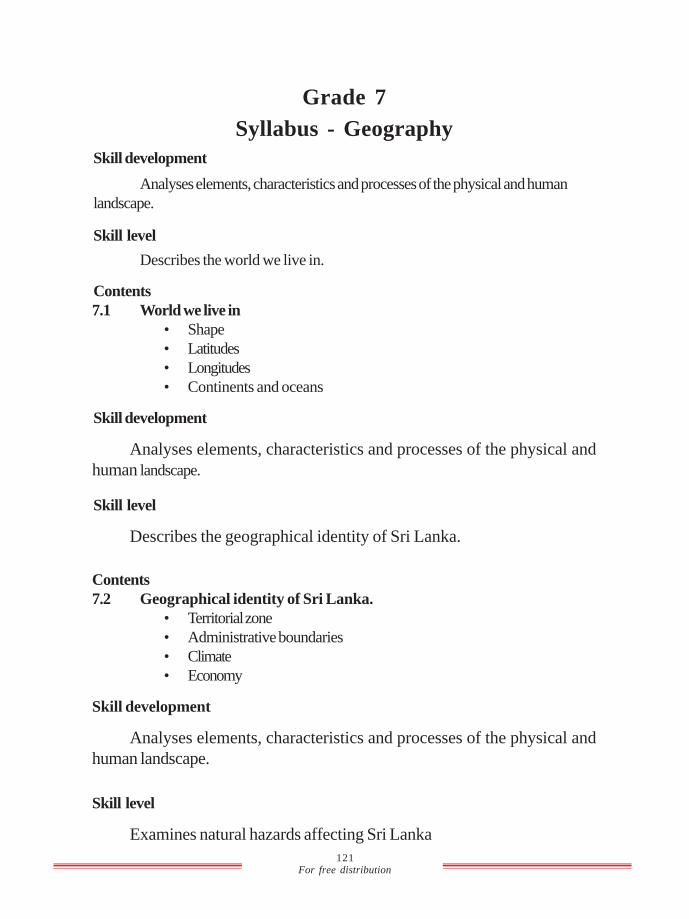
Grade 7
Syllabus - Geography
Skill development
Analyses elements, characteristics and processes of the physical and human
landscape.
Skill level
Describes the world we live in.
Contents
7.1 World we live in
• Shape
• Latitudes
• Longitudes
• Continents and oceans
Skill development
Analyses elements, characteristics and processes of the physical and
human landscape.
Skill level
Describes the geographical identity of Sri Lanka.
Contents
7.2 Geographical identity of Sri Lanka.
• Territorial zone
• Administrative boundaries
• Climate
• Economy
Skill development
Analyses elements, characteristics and processes of the physical and
human landscape.
Skill level
Examines natural hazards affecting Sri Lanka
For free distribution
122
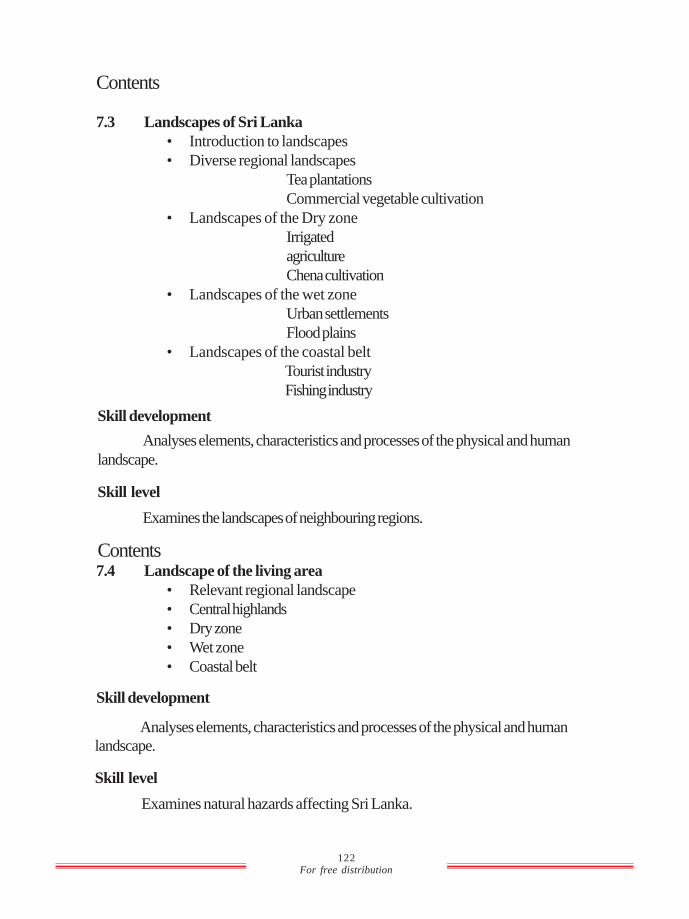
Contents
7.3 Landscapes of Sri Lanka
• Introduction to landscapes
• Diverse regional landscapes
Tea plantations
Commercial vegetable cultivation
• Landscapes of the Dry zone
Irrigated
agriculture
Chena cultivation
• Landscapes of the wet zone
Urban settlements
Flood plains
• Landscapes of the coastal belt
Tourist industry
Fishing industry
Skill development
Analyses elements, characteristics and processes of the physical and human
landscape.
Skill level
Examines the landscapes of neighbouring regions.
Contents7.4 Landscape of the living area
• Relevant regional landscape
• Central highlands
• Dry zone
• Wet zone
• Coastal belt
Skill development
Analyses elements, characteristics and processes of the physical and human
landscape.
Skill level
Examines natural hazards affecting Sri Lanka.
For free distribution
123
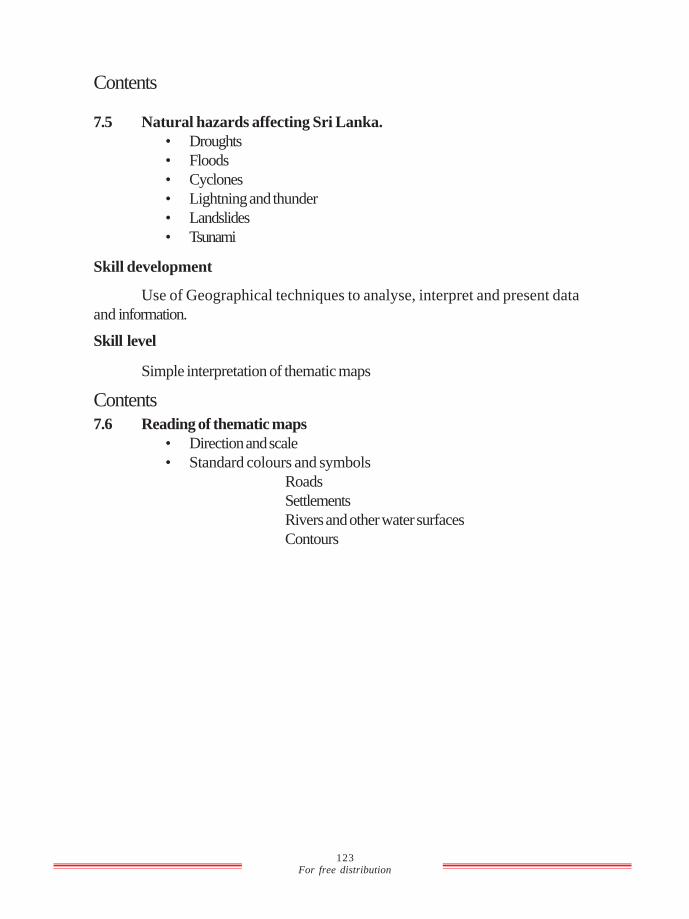
Contents
7.5 Natural hazards affecting Sri Lanka.
• Droughts
• Floods
• Cyclones
• Lightning and thunder
• Landslides
• Tsunami
Skill development
Use of Geographical techniques to analyse, interpret and present data
and information.
Skill level
Simple interpretation of thematic maps
Contents
7.6 Reading of thematic maps
• Direction and scale
• Standard colours and symbols
Roads
Settlements
Rivers and other water surfaces
Contours

![graph twoway contour — Twoway contour plot with area shading · 2020. 9. 18. · 4graph twoway contour— Twoway contour plot with area shading (see[G-3] added line options) and](https://img.pdfslide.us/doc/110x75/610458b6ac101a5cb068e089/graph-twoway-contour-a-twoway-contour-plot-with-area-shading-2020-9-18-4graph.jpg)


![VALUE€¦ · Contour Drawing [Project One] Contour Drawing. Contour Line: In drawing, is an outline sketch of an object. [Project One]: Layered Contour Drawing The purpose of contour](https://img.pdfslide.us/doc/110x75/60363a1e4c7d150c4824002e/value-contour-drawing-project-one-contour-drawing-contour-line-in-drawing-is.jpg)