Embed Size (px)
Citation preview

Winter 2019 – Volume 21 Issue 3 | JAI.iprjournals.com
Official Publication of the CAIA Association®
Fund Flows as Country Allocator
Vikram K. Srimurthy, Steven Shen,
The ofJournal
and Matthew Smalbach
FOR INDIVID
UAL USE O
NLY—NOT FOR D
ISTRIBUTIO
N
Vikram Srimurthy
Vikram Srimurthy joined Informa in 2016 and conducts quantitative research for Informa Finan-cial Intelligence, EPFR. He is primarily responsible for research behind EPFR’s FX and stock f lows products. Prior to joining Informa, for over ten years, Vik was a portfolio manager at Lee Munder Capital Group, using a quantitative approach to trade equities. Vik also held the position of Vice President at Evergreen Investments from 2000-2006, where he focused on the buy-side for Global Structured Products. Vik graduated with a doctorate in Mathematics from University of California, San Diego and currently resides in Brookline, Massachusetts.
SteVen Shen
Steven Shen specializes in quantitative strategies, new data product development, and research consultation. Steven joined Informa Financial Services in 2013, as an analyst in the EPFR quan-titative research team. In his role as a manager of quantitative strategies, he focuses on global/regional macro strategy, fund level strategy, and stock level strategy. Steven was previously a guest speaker at FundForum Asia and CFA Society events.
It is
ille
gal t
o m
ake
unau
thor
ized
cop
ies
of th
is a
rticl
e, fo
rwar
d to
an
unau
thor
ized
use
r, or
to p
ost e
lect
roni
cally
with
out P
ublis
her p
erm
issi
on.
FOR INDIVID
UAL USE O
NLY—NOT FOR D
ISTRIBUTIO
N
The Journal of Alternative Investments 1Winter 2019
Vikram k. Srimurthy
is a consultant at EPFR Global in Cambridge, [email protected]
SteVen Shen
is a manager of quantitative strategies at EPFR Global in Cambridge, [email protected]
matthew Smalbach
is a quantitative analyst at EPFR Global in Cambridge, [email protected]
Fund Flows as Country AllocatorVikram k. Srimurthy, SteVen Shen, and matthew Smalbach
We are not the first researchers to look at fund f lows. Fund f lows have been used exten-sively as a measure of sen-
timent. Ippolito (1992), Sirri and Tufano (1993), and Hendricks, Patel, and Zeckhauser (1990) found that investors move cash into funds with high past returns. Other research relates to the “smart money” hypothesis of Gruber (1996) and Zheng (1999), who pos-tulated that some fund managers have skill, some individual investors can detect that skill, and these investors send money to the skilled managers. Gruber (1996) and Zheng (1999) showed that the short-term perfor-mance of funds receiving inf lows is better than that of those suffering outf lows. Other researchers, such as Frazzini and Lamont (2008), have found that this smart-money effect is confined to return horizons of a quarter or less and that at longer horizons, the dumb-money effect dominates. All these studies used quarterly or annual fund f lows; the effects of shorter-term fund f lows were not investigated. Although Warther (1995) used monthly fund-f low data to find evidence of a positive relation between f lows and subsequent returns, he was not interested in country allocation, but in the selection of individual securities.
Other research has been focused on country allocation. Keppler showed the importance of dividend yield (1991a) and cash
f low to price (1991b) in country selection. Bhojraj and Swaminathan (2006) and Balvers and Wu (2006) investigated the momentum effect for countries, while Keppler and Traub (1993) and Keppler and Encinosa (2011) documented the size effect. Macedo (1995) showed the benefits of switching country-selection styles between relative value and relative strength depending on volatility. Zaremba (2015) looked at various country-selection strategies.
However, no one has yet looked at fund f lows, particularly daily fund f lows, to predict country returns. We use a dataset that captures f lows daily, compiled by EPFR. Fratzscher (2012) used weekly EPFR data to study the market collapse of 2008; Jotikasthira, Lundblad, and Ramadorai (2012) used monthly EPFR f low data to study financial shocks; Miao and Pant (2012) use this database to estimate gross portfolio f lows for EM regional aggregates. But no one has yet tried to forecast country returns using EPFR data, particularly daily f low data.
The timeliness and frequency of EPFR’s daily f low data enable us to investigate the effects of shorter-term f low horizons. We combine these f low data with another dataset of fund country allocations to build a senti-ment indicator for countries. We find that countries that have attracted the highest indirect investment in terms of equity fund f lows tend to outperform countries that
It is
ille
gal t
o m
ake
unau
thor
ized
cop
ies
of th
is a
rticl
e, fo
rwar
d to
an
unau
thor
ized
use
r, or
to p
ost e
lect
roni
cally
with
out P
ublis
her p
erm
issi
on.
FOR INDIVID
UAL USE O
NLY—NOT FOR D
ISTRIBUTIO
N
2 Fund Flows as Country Allocator Winter 2019
have attracted the lowest indirect investment over the following month.
DATA: FUND FLOWS
This article uses a dataset of portfolio capital f lows and performance at the fund level, compiled by EPFR. It contains daily, weekly, and monthly f lows from more than 16,000 equity funds and more than 8,000 bond funds. There is some difference in coverage, with the data at a daily frequency covering a slightly smaller number of funds.
Funds f lows are net f lows, contributions, and redemptions into the fund by investors in aggregate over a specified time window. As such, these f lows exclude portfolios’ performance and currency f luctuations. EPFR data also contain information on the total assets under management (AUM) at the beginning as well as the end of each period over which f lows are reported (daily/weekly/monthly).
EPFR covers mutual funds and exchange-traded funds (ETF) only. Furthermore, most of these funds are domiciled in advanced countries. Thus, the f low data represent a subset of total portfolio f lows. Jotikasthira, Lundblad, and Ramadorai (2012) show that this subset is representative by demonstrating in detail a close match between EPFR portfolio f lows and portfolio f lows stemming from total balance-of-payments data.
EPFR classifies funds by fund type, whether they are equity funds, bond funds, muni funds, and so on. In this article, we look only at equity funds. EPFR also classifies funds into fund groups, such as global funds, global emerging market funds, U.S. funds, Japan funds, Pacific funds. We do not consider single-country funds but focus exclusively on funds with a cross-border focus.
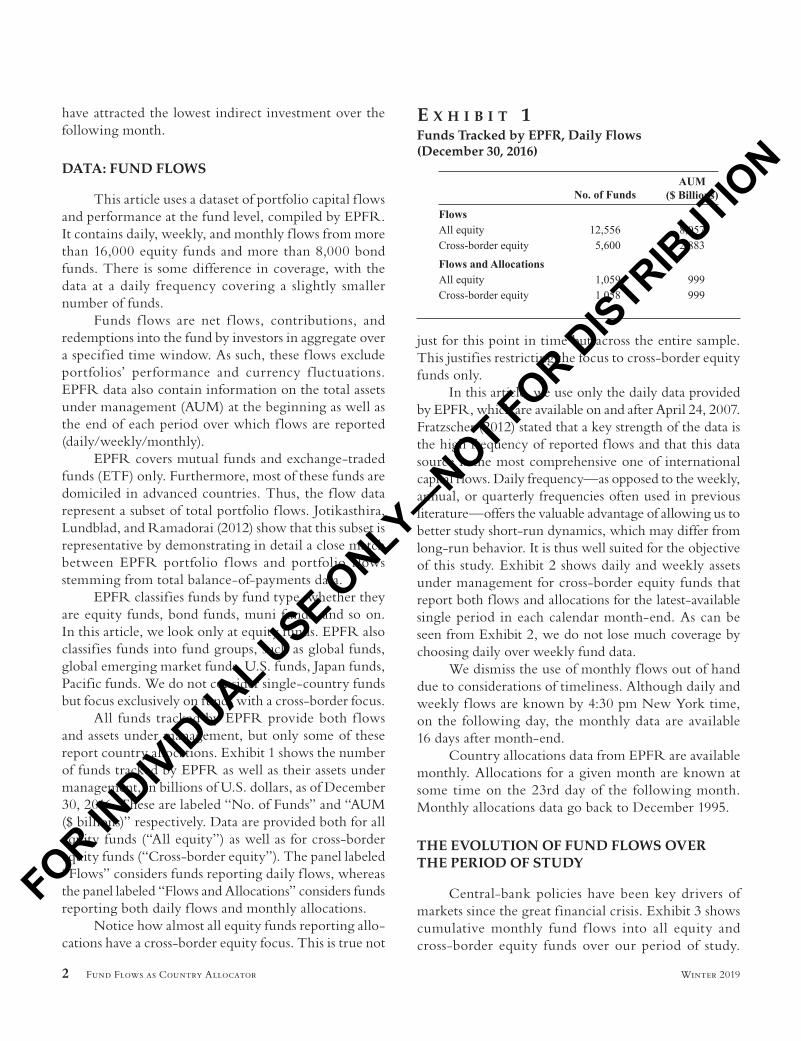
All funds tracked by EPFR provide both f lows and assets under management, but only some of these report country allocations. Exhibit 1 shows the number of funds tracked by EPFR as well as their assets under management, in billions of U.S. dollars, as of December 30, 2016. These are labeled “No. of Funds” and “AUM ($ billions)” respectively. Data are provided both for all equity funds (“All equity”) as well as for cross-border equity funds (“Cross-border equity”). The panel labeled “Flows” considers funds reporting daily f lows, whereas the panel labeled “Flows and Allocations” considers funds reporting both daily f lows and monthly allocations.
Notice how almost all equity funds reporting allo-cations have a cross-border equity focus. This is true not
just for this point in time but across the entire sample. This justifies restricting the focus to cross-border equity funds only.
In this article, we use only the daily data provided by EPFR, which are available on and after April 24, 2007. Fratzscher (2012) stated that a key strength of the data is the high frequency of reported f lows and that this data source is the most comprehensive one of international capital f lows. Daily frequency—as opposed to the weekly, annual, or quarterly frequencies often used in previous literature—offers the valuable advantage of allowing us to better study short-run dynamics, which may differ from long-run behavior. It is thus well suited for the objective of this study. Exhibit 2 shows daily and weekly assets under management for cross-border equity funds that report both f lows and allocations for the latest-available single period in each calendar month-end. As can be seen from Exhibit 2, we do not lose much coverage by choosing daily over weekly fund data.
We dismiss the use of monthly f lows out of hand due to considerations of timeliness. Although daily and weekly f lows are known by 4:30 pm New York time, on the following day, the monthly data are available 16 days after month-end.
Country allocations data from EPFR are available monthly. Allocations for a given month are known at some time on the 23rd day of the following month. Monthly allocations data go back to December 1995.
THE EVOLUTION OF FUND FLOWS OVER THE PERIOD OF STUDY
Central-bank policies have been key drivers of markets since the great financial crisis. Exhibit 3 shows cumulative monthly fund f lows into all equity and cross-border equity funds over our period of study.
e x h i b i t 1Funds Tracked by EPFR, Daily Flows (December 30, 2016)
It is
ille
gal t
o m
ake
unau
thor
ized
cop
ies
of th
is a
rticl
e, fo
rwar
d to
an
unau
thor
ized
use
r, or
to p
ost e
lect
roni
cally
with
out P
ublis
her p
erm
issi
on.
FOR INDIVID
UAL USE O
NLY—NOT FOR D
ISTRIBUTIO
N

The Journal of Alternative Investments 3Winter 2019
As shown in Exhibit 3, net overall f lows tend to be more a delayed response to equity market returns than anything else.
Returns
This research is based on returns of international stock market indexes from 50 countries. All source
data are obtained from the Bloomberg database. Daily time series are implemented to better study short-term forward-return effects.
Following Zaremba (2015), we adopted Morgan Stanley Capital International (MSCI) indexes for all the countries to maintain a consistent return computation methodology. Zaremba (2015) aside, many other studies (e.g., Heston and Rouwenhorst 1995; Khorana, Nelling,
e x h i b i t 2Cross-Border Equity Fund AUM
e x h i b i t 3Cumulative Monthly Flows
It is
ille
gal t
o m
ake
unau
thor
ized
cop
ies
of th
is a
rticl
e, fo
rwar
d to
an
unau
thor
ized
use
r, or
to p
ost e
lect
roni
cally
with
out P
ublis
her p
erm
issi
on.
FOR INDIVID
UAL USE O
NLY—NOT FOR D
ISTRIBUTIO
N

4 Fund Flows as Country Allocator Winter 2019
and Trester 1998; Bonanno, Vandewalle, and Mantegna 2000; and Erb, Harvey, and Viskanta 1995) have used MSCI return indexes.
Olienyk, Schwebach, and Zumwalt (1999) used iShares ETFs, formerly known as World Equity Bench-mark Shares, to avoid the problems associated with non-synchronous trading, f luctuating foreign exchange rates, non-liquidity, trading restrictions, and index replication. These are real-world financial instruments representing national equity markets that are designed to track MSCI indexes in respective countries. Khorana, Nelling, and Trester (1998) found that the iShares instruments do, indeed, closely track the underlying MSCI country index. Thus, MSCI return indexes are real, in the sense that they can be replicated easily.
These return indexes represent commonly tracked capitalization-weighted benchmarks that are commonly used all over the world. Therefore, the decision to adopt MSCI also aims at aligning this research with the invest-ment practice. These indexes are constructed and man-aged with a view to being fully investable from the perspective of the international institutional investor and cover about 85% of stock market capitalizations in countries they represent.
The returns are computed based on cap-weighted net total return indexes; that is, the returns are adjusted for corporate actions (splits, reverse splits, issuance rights etc.) and cash distributions to investors (dividends). The “net” technique of computation ensures that the returns account for country-specif ic dividend tax rates. The sample period for returns runs from December 31, 1999 to May 31, 2017, as available.
The total sample includes 50 country equity mar-kets. These are the countries that were ever in the MSCI All Country World index between April 24, 2007 and May 31, 2017. These dates correspond, respectively, to the beginning of EPFR’s daily f low data and the ending of our sample period for returns.
Countries Tradable at Each Point in Time
MSCI also maintains broad, multi-country indexes. One such is the All Country World Index, which contains all countries that MSCI considers to be developed or emerging. For MSCI to consider a country to be at least emerging, the country needs to have at least three companies that each have full market cap over $1.26 billion, f loat market cap above $630 million, and
an annual traded value of at least 15% of f loat market cap. In addition, that country needs to have significant openness to foreign ownership, significant ease of capital f lows, good and tested operational eff iciency, and at least a modest institutional stability. The requirements to be considered developed are even more stringent. Thus, we use a country’s membership in the MSCI All Country World Index, at each point in time, as a proxy for investability.
Between April 24, 2007 and May 31, 2017, this index experienced the following changes:
• Jordan was removed after November 2008.• Pakistan was removed after December 2008.• Argentina was removed after May 2009.• Morocco was removed after November 2013.• The United Arab Emirates came in after May 2014.• Qatar came in after May 2014.
We consider a country investable if it would be in the MSCI All Country World Index on the day fol-lowing the trade date. This is known on the trade date because MSCI telegraphs index changes in advance.
The backtests in this article are conducted only on investable countries as defined in this section.
The Distribution of Fund Flows across Countries
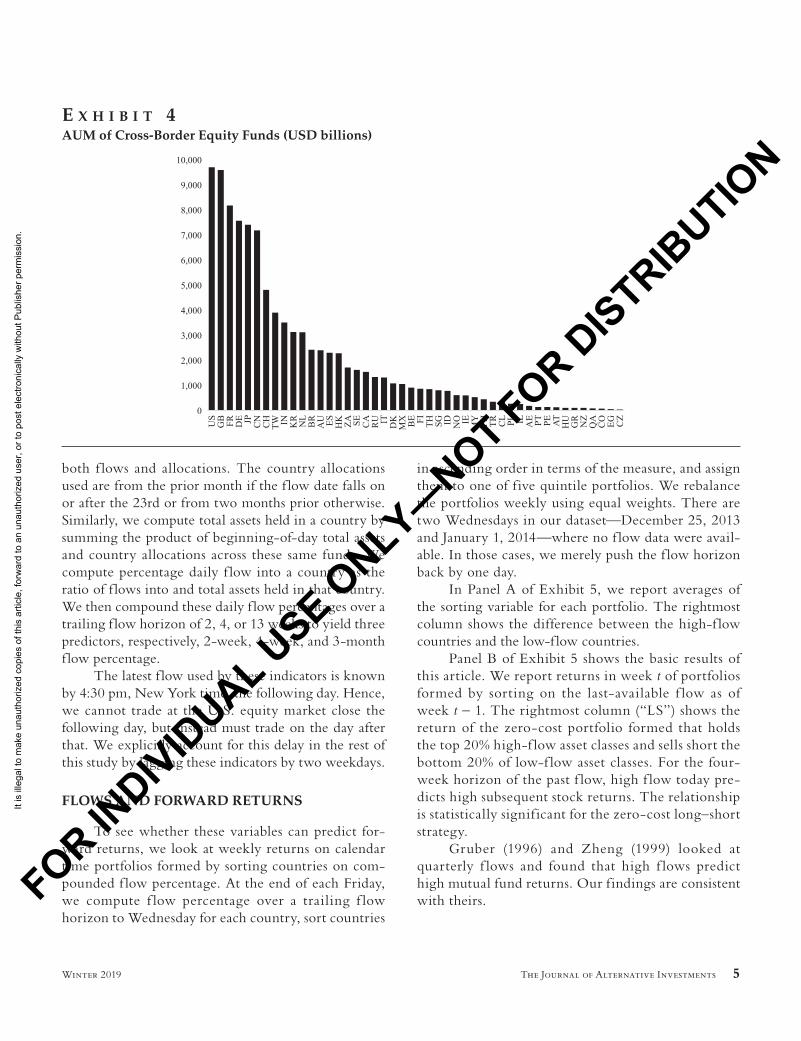
To give the reader an idea of the coverage and scope of the EPFR dataset, Exhibit 4 shows assets under management, in billions of USD, by cross-border equity funds in the 46 countries that were in the MSCI All Country World Index at the end of 2016. We use assets, rather than f lows, as a measure because, at a point in time, f lows could be small even though a country’s equity market is large.
Notice that most of the assets of cross-border equity funds are concentrated in a few countries. For this reason, later in this article, we will consider size as an investment factor in its own right, as well as a risk factor to be controlled for.
Flow Percentage Predictors
First, we compute fund f lows into a country by summing the product of fund f lows and country allo-cations across all cross-border equity funds that report
It is
ille
gal t
o m
ake
unau
thor
ized
cop
ies
of th
is a
rticl
e, fo
rwar
d to
an
unau
thor
ized
use
r, or
to p
ost e
lect
roni
cally
with
out P
ublis
her p
erm
issi
on.
FOR INDIVID
UAL USE O
NLY—NOT FOR D
ISTRIBUTIO
N
The Journal of Alternative Investments 5Winter 2019
both f lows and allocations. The country allocations used are from the prior month if the f low date falls on or after the 23rd or from two months prior otherwise. Similarly, we compute total assets held in a country by summing the product of beginning-of-day total assets and country allocations across these same funds. We compute percentage daily f low into a country as the ratio of f lows into and total assets held in that country. We then compound these daily f low percentages over a trailing f low horizon of 2, 4, or 13 weeks to yield three predictors, respectively, 2-week, 4-week, and 3-month f low percentage.
The latest f low used by these indicators is known by 4:30 pm, New York time, the following day. Hence, we cannot trade at the U.S. equity market close the following day, but instead must trade on the day after that. We explicitly account for this delay in the rest of this study by lagging these indicators by two weekdays.
FLOWS AND FORWARD RETURNS
To see whether these variables can predict for-ward returns, we look at weekly returns on calendar time portfolios formed by sorting countries on com-pounded f low percentage. At the end of each Friday, we compute f low percentage over a trailing f low horizon to Wednesday for each country, sort countries
in ascending order in terms of the measure, and assign them to one of f ive quintile portfolios. We rebalance the portfolios weekly using equal weights. There are two Wednesdays in our dataset—December 25, 2013 and January 1, 2014—where no f low data were avail-able. In those cases, we merely push the f low horizon back by one day.
In Panel A of Exhibit 5, we report averages of the sorting variable for each portfolio. The rightmost column shows the difference between the high-f low countries and the low-f low countries.
Panel B of Exhibit 5 shows the basic results of this article. We report returns in week t of portfolios formed by sorting on the last-available f low as of week t - 1. The rightmost column (“LS”) shows the return of the zero-cost portfolio formed that holds the top 20% high-f low asset classes and sells short the bottom 20% of low-f low asset classes. For the four-week horizon of the past f low, high f low today pre-dicts high subsequent stock returns. The relationship is statistically signif icant for the zero-cost long–short strategy.
Gruber (1996) and Zheng (1999) looked at quarterly f lows and found that high f lows predict high mutual fund returns. Our findings are consistent with theirs.
e x h i b i t 4AUM of Cross-Border Equity Funds (USD billions)
It is
ille
gal t
o m
ake
unau
thor
ized
cop
ies
of th
is a
rticl
e, fo
rwar
d to
an
unau
thor
ized
use
r, or
to p
ost e
lect
roni
cally
with
out P
ublis
her p
erm
issi
on.
FOR INDIVID
UAL USE O
NLY—NOT FOR D
ISTRIBUTIO
N

6 Fund Flows as Country Allocator Winter 2019
Four-Week Past-Flow Horizon Lagged k Weeks
We now give an overview of how f lows predict returns at various forward time horizons. We report returns in week t of portfolios formed by sorting on the last-available four-week f low as of week t - k. These are the returns of the zero-cost portfolio that holds the top 20% high-f low asset classes and sells short the bottom 20% of low-f low asset classes, where the past-f low horizon used is four weeks. As shown in Exhibit 6, four-week f low percentage has residual predictive power out to one or two months.
ROBUSTNESS TESTS
Controlling for Momentum
Frazzini and Lamont (2008) suggested that inf lows are associated with high past returns. So, it is useful to know whether f lows have incremental forecasting powers independent of momentum. Thus, we follow them in controlling for the price momentum effect of Jegadeesh and Titman (1993). Given that we are dealing with around 50 countries, we cannot control for the momentum effect the way they have done, by subtracting off the average return of each asset class’s momentum
e x h i b i t 5Panel Regressions
Notes: This exhibit shows the average past f low percentage and excess returns for calendar-time portfolios sorted on f low percentage compounded over the past 2, 4, and 13 weeks. Countries are ranked in ascending order based on the last-available indicator and assigned to one of five quintile portfolios. LS is a zero-cost portfolio that holds the top fifth of countries and sells short the bottom fifth. Portfolios are rebalanced weekly to maintain equal weights. In Panel A, we report averages of the sorting variable for each cell. In Panel B, we report average portfolio returns minus the return of the equal-weight universe. Returns are weekly percentages. Returns are in bold font whenever the associated t-statistic is significant and light grey font otherwise; t-statistics are in parentheses.
e x h i b i t 6Four-Week Past-Flow Horizon Lagged k Weeks
Notes: This exhibit shows average returns in week t to the zero-cost portfolio that holds the top fifth and sells short the bottom fifth of asset classes in terms of the last-available four-week f low percentage as of week t – k. Countries are ranked in ascending order based on the last-available four-week f low percentage as of week t – k and assigned to one of five quintile portfolios. Portfolios are rebalanced weekly to maintain equal weights. Returns are weekly percentages. Returns are in bold font whenever the associated t-statistic is significant and light grey font otherwise; t-statistics are in parentheses.
It is
ille
gal t
o m
ake
unau
thor
ized
cop
ies
of th
is a
rticl
e, fo
rwar
d to
an
unau
thor
ized
use
r, or
to p
ost e
lect
roni
cally
with
out P
ublis
her p
erm
issi
on.
FOR INDIVID
UAL USE O
NLY—NOT FOR D
ISTRIBUTIO
N
The Journal of Alternative Investments 7Winter 2019
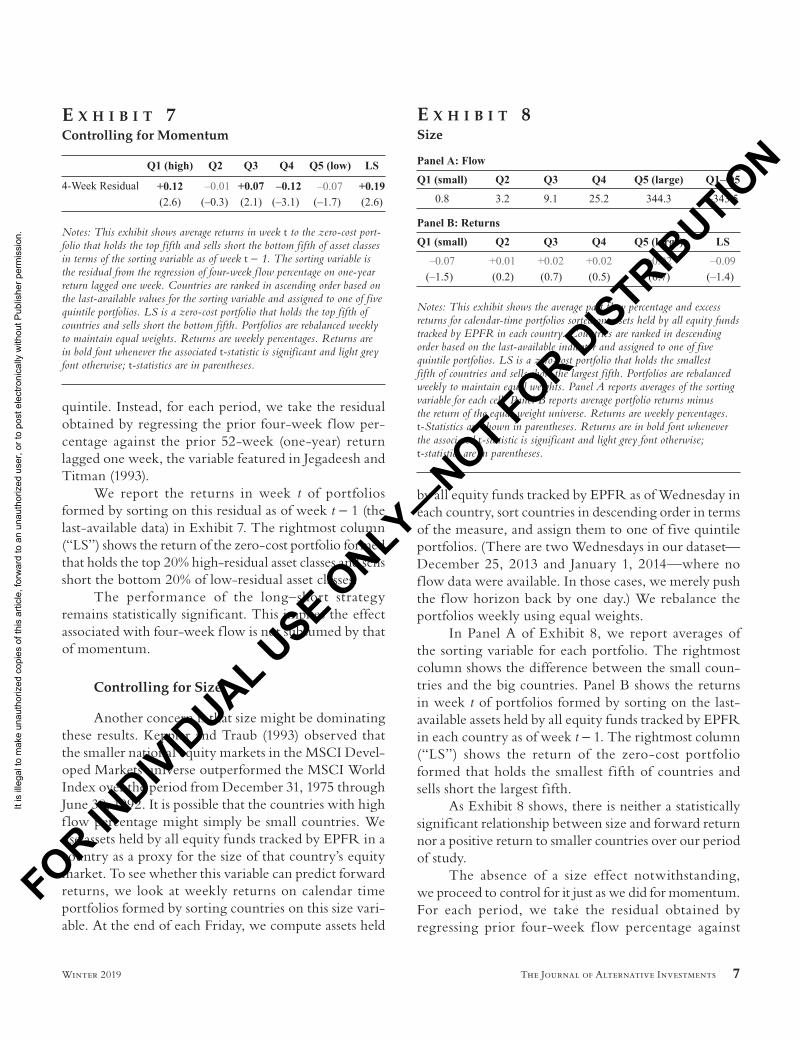
quintile. Instead, for each period, we take the residual obtained by regressing the prior four-week f low per-centage against the prior 52-week (one-year) return lagged one week, the variable featured in Jegadeesh and Titman (1993).
We report the returns in week t of portfolios formed by sorting on this residual as of week t - 1 (the last-available data) in Exhibit 7. The rightmost column (“LS”) shows the return of the zero-cost portfolio formed that holds the top 20% high-residual asset classes and sells short the bottom 20% of low-residual asset classes.
The performance of the long–short strategy remains statistically significant. This implies the effect associated with four-week f low is not subsumed by that of momentum.
Controlling for Size
Another concern is that size might be dominating these results. Keppler and Traub (1993) observed that the smaller national equity markets in the MSCI Devel-oped Markets universe outperformed the MSCI World Index over the period from December 31, 1975 through June 30, 1992. It is possible that the countries with high f low percentage might simply be small countries. We use assets held by all equity funds tracked by EPFR in a country as a proxy for the size of that country’s equity market. To see whether this variable can predict forward returns, we look at weekly returns on calendar time portfolios formed by sorting countries on this size vari-able. At the end of each Friday, we compute assets held
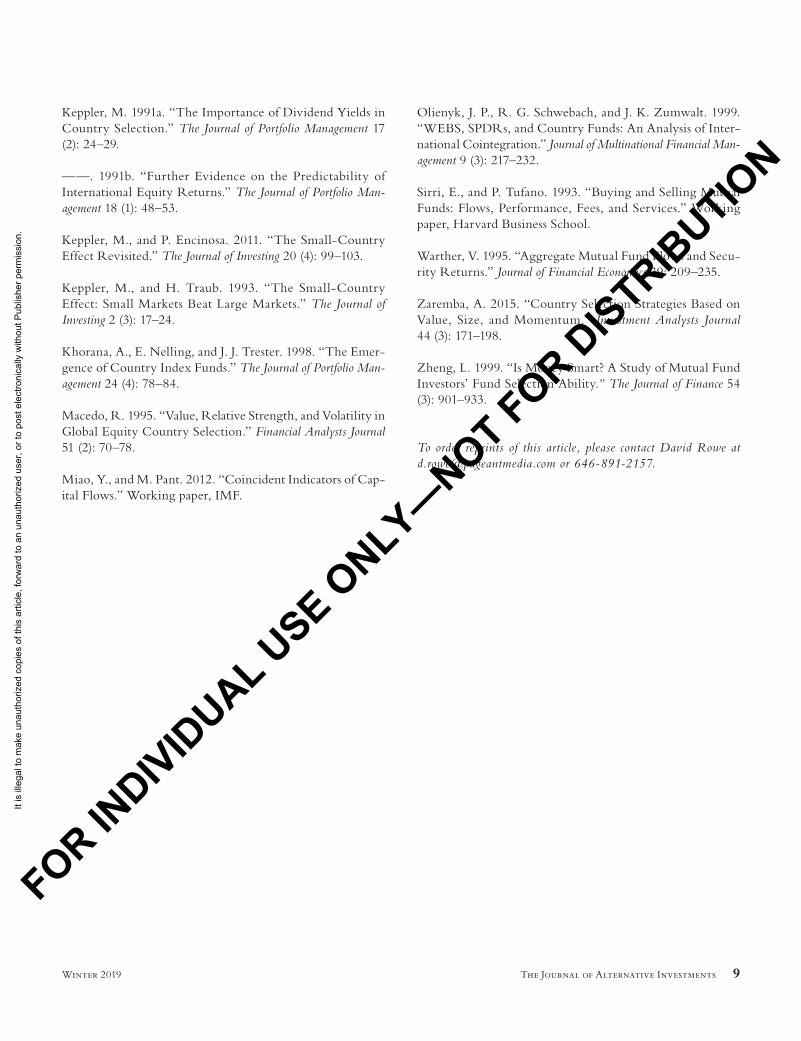
by all equity funds tracked by EPFR as of Wednesday in each country, sort countries in descending order in terms of the measure, and assign them to one of five quintile portfolios. (There are two Wednesdays in our dataset—December 25, 2013 and January 1, 2014—where no f low data were available. In those cases, we merely push the f low horizon back by one day.) We rebalance the portfolios weekly using equal weights.
In Panel A of Exhibit 8, we report averages of the sorting variable for each portfolio. The rightmost column shows the difference between the small coun-tries and the big countries. Panel B shows the returns in week t of portfolios formed by sorting on the last-available assets held by all equity funds tracked by EPFR in each country as of week t - 1. The rightmost column (“LS”) shows the return of the zero-cost portfolio formed that holds the smallest f ifth of countries and sells short the largest fifth.
As Exhibit 8 shows, there is neither a statistically significant relationship between size and forward return nor a positive return to smaller countries over our period of study.
The absence of a size effect notwithstanding, we proceed to control for it just as we did for momentum. For each period, we take the residual obtained by regressing prior four-week f low percentage against
e x h i b i t 7Controlling for Momentum
Notes: This exhibit shows average returns in week t to the zero-cost port-folio that holds the top fifth and sells short the bottom fifth of asset classes in terms of the sorting variable as of week t - 1. The sorting variable is the residual from the regression of four-week f low percentage on one-year return lagged one week. Countries are ranked in ascending order based on the last-available values for the sorting variable and assigned to one of five quintile portfolios. LS is a zero-cost portfolio that holds the top fifth of countries and sells short the bottom fifth. Portfolios are rebalanced weekly to maintain equal weights. Returns are weekly percentages. Returns are in bold font whenever the associated t-statistic is significant and light grey font otherwise; t-statistics are in parentheses.
e x h i b i t 8Size
Notes: This exhibit shows the average past f low percentage and excess returns for calendar-time portfolios sorted on assets held by all equity funds tracked by EPFR in each country. Countries are ranked in descending order based on the last-available indicator and assigned to one of five quintile portfolios. LS is a zero-cost portfolio that holds the smallest fifth of countries and sells short the largest fifth. Portfolios are rebalanced weekly to maintain equal weights. Panel A reports averages of the sorting variable for each cell. Panel B reports average portfolio returns minus the return of the equal-weight universe. Returns are weekly percentages. t-Statistics are shown in parentheses. Returns are in bold font whenever the associated t-statistic is significant and light grey font otherwise; t-statistics are in parentheses.
It is
ille
gal t
o m
ake
unau
thor
ized
cop
ies
of th
is a
rticl
e, fo
rwar
d to
an
unau
thor
ized
use
r, or
to p
ost e
lect
roni
cally
with
out P
ublis
her p
erm
issi
on.
FOR INDIVID
UAL USE O
NLY—NOT FOR D
ISTRIBUTIO
N

8 Fund Flows as Country Allocator Winter 2019
the latest-available prior logarithm of assets held by all equity funds tracked by EPFR in each country.
We report the returns in week t of portfolios formed by sorting on this residual as of week t - 1 (the last-available data) in Exhibit 9. The rightmost column (“LS”) shows the return of the zero-cost port-folio formed that holds the top 20% high-residual asset classes and sells short the bottom 20% of low-residual asset classes.
The performance of the long–short strategy remain statistically significant, implying that the effect associated with four-week f low is not subsumed by that of size.
CONCLUSION
Flow percentage turns out to be predictive of for-ward return. A zero-cost strategy that goes long and short the countries in the top and bottom quintiles of four-week f low percentage produces returns that are sta-tistically significantly different from zero. Furthermore, this strategy is subsumed by neither the price momentum effect of Jegadeesh and Titman (1993) nor the size effect of Keppler and Traub (1993). When either the prior one-year return lagged one week or prior latest-available equity-market size, as tracked by EPFR, is regressed out of prior four-week f low percentage, the zero-cost strategy produces returns that remain significantly dif-ferent from zero.
REFERENCES
Balvers, R. J., and Y. Wu. 2006. “Momentum and Mean Reversion across National Equity Markets.” The Journal of Empirical Finance 13 (1): 24–48.
Bhojraj, S., and B. Swaminathan. 2006. “Macromomentum: Returns Predictability in International Equity Indices.” Journal of Business 79 (1): 429–451.
Bonanno, G., N. Vandewalle, and R. N. Mantegna. 2000. “Taxonomy of Stock Market Indices.” Physical Review E 62 (6): R7615.
Erb, C. B., C. R. Harvey, and T. E. Viskanta. 1995. “Country Risk and Global Equity Selection.” The Journal of Portfolio Management 21 (2): 74–83.
Fratzscher, M. 2012. “Capital Flows, Push versus Pull Factors, and the Global Financial Crisis.” Journal of International Eco-nomics 88 (2): 341–356.
Frazzini, A., and O. Lamont. 2008. “Dumb Money: Mutual Fund Flows and the Cross-Section of Stock Returns.” Journal of Financial Economics 88 (2): 299–322.
Gruber, M. 1996. “Another Puzzle: The Growth in Actively Managed Mutual Funds.” The Journal of Finance 51 (3): 783–810.
Hendricks, D., J. Patel, and R. Zeckhauser. 1990. “Hot Hands in Mutual Funds: The Persistence of Performance, 1974–87.” National Bureau of Economic Research Working paper w3389.
Heston, S. L., and K. G. Rouwenhorst. 1995. “Industry and Country Effects in International Stock Returns.” The Journal of Portfolio Management 21 (3): 53–58.
Ippolito, R. 1992. “Consumer Reaction to Measures of Poor Quality: Evidence from the Mutual Fund Industry.” Journal of Law and Economics 35 (1): 45–70.
Jegadeesh, N., and S. Titman. 1993. “Returns to Buying Winners and Selling Losers: Implications for Stock Market Efficiency.” The Journal of Finance 48 (1): 65–91.
Jotikasthira, C., C. Lundblad, and T. Ramadorai. 2012. “Asset Fire Sales and Purchases and the International Transmission of Funding Shocks.” The Journal of Finance 67 (6): 2015–2050.
e x h i b i t 9Controlling for Size
Notes: This exhibit shows average returns in week t to the zero-cost port-folio that holds the top fifth and sells short the bottom fifth of asset classes in terms of the sorting variable as of week t – 1. The sorting variable is the residual from the regression of four-week f low percentage on the loga-rithm of assets held by all equity funds tracked by EPFR in each country. Countries are ranked in ascending order based on the last-available values for the sorting variable and assigned to one of five quintile portfolios. LS is a zero-cost portfolio that holds the top fifth of countries and sells short the bottom fifth. Portfolios are rebalanced weekly to maintain equal weights. Returns are weekly percentages. Returns are in bold font whenever the associated t-statistic is significant and light grey font otherwise; t-statistics are in parentheses.
It is
ille
gal t
o m
ake
unau
thor
ized
cop
ies
of th
is a
rticl
e, fo
rwar
d to
an
unau
thor
ized
use
r, or
to p
ost e
lect
roni
cally
with
out P
ublis
her p
erm
issi
on.
FOR INDIVID
UAL USE O
NLY—NOT FOR D
ISTRIBUTIO
N
The Journal of Alternative Investments 9Winter 2019
Keppler, M. 1991a. “The Importance of Dividend Yields in Country Selection.” The Journal of Portfolio Management 17 (2): 24–29.
——. 1991b. “Further Evidence on the Predictability of International Equity Returns.” The Journal of Portfolio Man-agement 18 (1): 48–53.
Keppler, M., and P. Encinosa. 2011. “The Small-Country Effect Revisited.” The Journal of Investing 20 (4): 99–103.
Keppler, M., and H. Traub. 1993. “The Small-Country Effect: Small Markets Beat Large Markets.” The Journal of Investing 2 (3): 17–24.
Khorana, A., E. Nelling, and J. J. Trester. 1998. “The Emer-gence of Country Index Funds.” The Journal of Portfolio Man-agement 24 (4): 78–84.
Macedo, R. 1995. “Value, Relative Strength, and Volatility in Global Equity Country Selection.” Financial Analysts Journal 51 (2): 70–78.
Miao, Y., and M. Pant. 2012. “Coincident Indicators of Cap-ital Flows.” Working paper, IMF.
Olienyk, J. P., R. G. Schwebach, and J. K. Zumwalt. 1999. “WEBS, SPDRs, and Country Funds: An Analysis of Inter-national Cointegration.” Journal of Multinational Financial Man-agement 9 (3): 217–232.
Sirri, E., and P. Tufano. 1993. “Buying and Selling Mutual Funds: Flows, Performance, Fees, and Services.” Working paper, Harvard Business School.
Warther, V. 1995. “Aggregate Mutual Fund Flows and Secu-rity Returns.” Journal of Financial Economics 39: 209–235.
Zaremba, A. 2015. “Country Selection Strategies Based on Value, Size, and Momentum.” Investment Analysts Journal 44 (3): 171–198.
Zheng, L. 1999. “Is Money Smart? A Study of Mutual Fund Investors’ Fund Selection Ability.” The Journal of Finance 54 (3): 901–933.
To order reprints of this article, please contact David Rowe at [email protected] or 646-891-2157.
It is
ille
gal t
o m
ake
unau
thor
ized
cop
ies
of th
is a
rticl
e, fo
rwar
d to
an
unau
thor
ized
use
r, or
to p
ost e
lect
roni
cally
with
out P
ublis
her p
erm
issi
on.
FOR INDIVID
UAL USE O
NLY—NOT FOR D
ISTRIBUTIO
N