Embed Size (px)
Citation preview

The Welfare Consequences of Mergers with Product Repositioning
Michael Mazzeo
Kellogg School of Management
Katja Seim
The Wharton School
Mauricio Varela∗
University of Arizona
December 2012
Abstract
Merger simulations focus on the price changes that may occur once previously independent competitors set
prices jointly and other market participants respond. This paper considers an additional e�ect � the possibility
that market participants will choose to change their product o�erings after a merger. Using a model that
endogenizes both product choice and pricing, we conduct equilibrium market simulations for mergers including
the potential for o�ering changes in a variety of scenarios. We �nd that allowing for repositioning can have
substantial e�ects, particularly in cases where the merging parties o�ered relatively similar products prior to the
merger. Cost synergies may also a�ect product o�ering decisions, potentially leading to increases in consumer
welfare if more products are introduced. The results suggest that analysts carefully consider the impacts of
product choice, along with prices, when simulating potential welfare changes associated with mergers.
1 Introduction
Over the past several decades, advances in industrial organization economics have had an increasing impact on
the analysis of horizontal mergers. In particular, much progress has been made in developing new econometric
techniques for estimating demand functions. Applying these methods, along with data from the industry of the
proposed merger, can allow an analyst to assess the relationship between market concentration and price changes,
providing critical information about market de�nition. In addition, economists can make a prediction regarding how
prices would adjust following the merger of two industry participants. The process of empirical demand elasticity
and marginal cost estimation followed by merger simulation (i.e., simulated with the proposed ownership change
and the estimated parameters) has been increasingly used as suggestive evidence of the likely e�ects of a merger on
prices charged to consumers.1
Crucially, the prices charged by industry participants are endogenized in estimating the demand models. Valid
econometric instruments are needed to ensure that quantity di�erences that accompany price di�erences are caused
by fundamental consumer preferences rather than supply-side factors. Indeed, appropriately endogenizing prices is
among the most di�cult challenges involved with applying these methods to actual merger scenarios. Such instru-
ments are di�cult to �nd in practice, particularly in a complex market where competing �rms o�er di�erentiated
products. Without them estimated price elasticities can potentially contain serious bias. In the context of merger
simulation, furthermore, the industry participants' optimal response to the proposed change in market structure
∗Corresponding Author: [email protected] and Ruhmer (2010) provide a recent survey of the use of merger simulation in competition policy.
1
resulting from the merger can be captured if prices are endogenized in the demand model. Once the �identity� of
the various players are modi�ed in the simulation, (i.e. the proposed merging �rms are treated as a single pro�t
maximizing �rm for the purpose of price-setting) prices will adjust, generating a more realistic prediction regarding
post-merger consumer surplus.
This paper focuses on an important potential shortcoming inherent in this approach to estimating demand and
marginal cost and simulating the e�ects of mergers. While prices are explicitly included as choice variables of the
industry participants, their product characteristics are treated as exogenous � they cannot adjust after the merger.
This abstraction has consequences for the accuracy of some merger simulations to the extent that merged �rms
may cull duplicate products or competitors may introduce new varieties post-merger. Simulating mergers using
the method sketched above constrains the set of di�erential products o�ered by market participants to be identical
pre- and post-merger. Actual �rm behavior and its e�ect on consumer surplus may well be more complex. If the
resulting product variety in the industry exhibits more overall di�erentiation, price competition may be softened
beyond the e�ect of removing one competitor. Alternatively, industry participants may choose to expand their
product o�erings given the new market structure. Reductions in consumer welfare associated with price increases
can potentially be o�set if consumers value characteristics of products that are made more available after a merger.
The analysis and discussion presented here proceeds in three parts. First, we will present some background
from the economics literature on horizontal combinations that indicates the potential importance of accounting for
endogenous product choice among industry participants. In addition, we will provide some context on the issue by
referencing a series of merger cases in which the issue of post-merger product repositioning was considered by the
court or regulatory body evaluating the proposed merger. Second, we will outline an empirical modeling approach
that estimates product di�erentiated demand parameters while allowing �rms to have �exibility regarding their
product o�erings. As such, the approach endogenizes both price and product varieties, allowing both to update
as a result of changed industry structure in the context of a merger simulation.2 In the last part of the paper, we
show how merger simulations can be carried out using such a model, allowing for both pricing and product o�ering
changes post-merger. The results from simulations demonstrate the tradeo�s described above and indicate the key
factors that a�ect the welfare implications of allowing product choice.
2 Background
This section will proceed in two parts. First, we will review some of the relevant literature from economics on the
relationship between market concentration and product variety. A small number of papers have focused directly on
the e�ects of mergers on �rm choice and market heterogeneity � these papers are highlighted. Then, we provide
a brief survey of merger cases in which positioning of products after a proposed merger �gured into the court's
decision. Both the academic literature and the court records suggest a potentially important role for an analytical
framework that endogenizes product choice.
2The approach here is based on the work of Draganska, Mazzeo, and Seim (2009) and is part of a growing literature proposingapproaches for endogenizing product choice in empirical models of product di�erentiated demand. Crawford (2011) is a good summaryof this growing literature.
2
2.1 Economics Literature
In the economics literature, a small number of empirical studies have addressed the related questions of (1) what is
the relationship between product characteristics o�ered by competing �rms and their industry's market structure
and (2) what e�ect do mergers (i.e., changes in market structure) have on the set of products that competing �rms
o�er. Evidence of a relationship between product o�erings and market structure suggests that empirical analyses of
mergers that do not allow �rms to optimally adjust their product portfolios may be incomplete. This issue may be
particularly serious in di�erentiated product industries, where consumers have heterogeneous preferences over the
range of product characteristics that �rms could potentially o�er. In such environments, price changes can either
be mitigated or exacerbated by di�erences in product o�erings when calculating consumer welfare. While not an
exhaustive collection, the papers described below provide a �avor of the sort of empirical evidence researchers have
compiled that relates to this problem.
To begin, a series of papers has investigated the relationship between observed market structure in a particular
industry and the product o�erings of competing �rms.3 For example, Alexander (1997) presents data from the music
recording industry that suggests a nonmonotonic relationship between competition indices/concentration ratios in
the market for music distribution and overall variety (on various technical dimensions) of the hit songs produced by
the studios. In his study, high and low levels of concentration were associated with lower levels of product variety,
while there was less product variety overall in industries under intermediate levels of concentration. A similar paper
by George (2007) examines the e�ect of market structure on product positioning and product variety in the market
for US daily newspapers. Again, the data analyzed include detailed measures (e.g., papers' assignment of reporters
to particular topical areas) of product o�erings of competing �rms. In terms of both the variety of topics and the
number of topics covered, more concentrated markets tend to have more variety. Interestingly, the di�erence in
product o�erings is not associated with any changes in newspaper readership. This suggests that merging �rms
would have more strategic instruments available to them � beyond just price � when maximizing pro�ts after an
increase in market concentration.
These papers examine the relationship between market structure and the overall level of di�erentiation and
product availability in an industry; the product characteristic choices of individual �rms underlie such market-level
measures. A series of recent papers (e.g., Mazzeo (2002); Seim (2006)) have developed new methods for endogenizing
the product choice decisions of �rms in equilibrium; this literature has expanded to treat more detailed product
characteristics in the �rms' choice set. Watson (2008) is an excellent example � his paper focuses on the product
variety decision, in terms of the number of product o�erings sold by retailers (in his case, eyewear retailers).4 As
in the case of recorded music when measured industry-wide, Watson �nds that per-�rm product variety has a
nonmonotonic relationship with competition. When facing a closer rival in geographic space, �rms tend to o�er
more options but the number of product varieties does eventually decline with more competition. This �nding again
suggests that the optimal response following a merger could be either to increase or decrease product variety, each
of which would have an e�ect on consumer surplus calculations.
3This literature is not nearly as extensive as the one examining correlations between prices and market structure. Weiss (1989)provides an extensive review of this literature and Whinston (2006) discusses the role of such studies in the literature as evidence in aregulatory/antitrust context. See Manuszak and Moul (2008) for a recent contribution, that revisits the price-concentration relationshipin the o�ce supply retail industry using structural methods (e.g., Mazzeo (2002a)) to address market structure endogeneity.
4In retail environments, the number of product o�erings (or product variety) is often used as a summary measure or proxy of the�rm's quality. �Quality� can also be a �rm characteristic that competitors optimally adjust depending on market structure. See Mazzeo(2003) for an example of an analysis of competition and product quality, and also a discussion of the challenges associated with empiricalwork in this area.
3

A small number of papers have directly addressed the issue of product variety and optimal di�erentiation in
response to merger activity. The most in�uential study is by Berry and Waldfogel (2001) who document the e�ect of
mergers on station format choice in the radio broadcasting industry. The 1996 Telecommunications Act prompted
a merger wave in the broadcasting industry; this provided an instrumental variables identi�cation strategy for
measuring the e�ect of concentration on variety (as measured by the number of di�erent radio �formats� represented
in the market).5 The results of the paper indicate that industry consolidation � that is, the decrease in the number
of stations that followed from the Telecom Act � increased both variety per station and overall variety in the market.
Mergers appear to have motivated competitors to span larger portions of product space with their o�erings, as pairs
of jointly-owned local stations are more likely to be in di�erent formats. While suggestive, their analysis does not
constitute a formal model of product choice, as the authors state �our approach in this paper is to obtain qualitative
empirical results that may guide more detailed subsequent modeling.�
In a similar vein, Sweeting (2010)'s paper uses micro-level data on the programming of individual radio stations
to look directly at how the stations vary their playlists following mergers. In Fan (2012)'s study of the newspaper
industry, competing �rms choose prices (both circulation and advertising) and certain product characteristics rela-
tive to news quality and type of coverage. These product characteristics are measured as continuous indices, which
are allowed to �uctuate after �rms merge.6 The results from these initial papers do seem to indicate that �rms
make distinct changes to their product characteristics, with potentially important competitive consequences.7
The empirical papers cited above are partially motivated by the theoretical literature which (not surprisingly)
can make almost any prediction about the optimal product di�erentiation behavior of competing �rms depending on
the assumptions in the model. The recent theoretical contribution by Gandhi, Froeb, Tschantz, and Werden (2008),
however, is notable for its direct focus on post-merger product repositioning and in its use of novel computational
methods for solving out market equilibria in both price and product space location. The paper employs a traditional
Hotelling (1929) set-up, with four stores in a unit-length product space and a standard speci�cation for consumer
utility. Initially, the stores are independently owned and play a simultaneous-move game in prices and product
space locations. The analysis then compares the outcome with a potential �merger� scenario in which two of the
establishments become jointly owned.
In particular � and in direct response to the gaps in existing merger simulation methodology � the paper
compares outcomes in simulations in which industry participants reoptimize on price but are not allowed to change
their product-space locations and with new equilibria computed for both price and location choice. While, again, the
results are sensitive to the parameterization of the model (the authors go into detail regarding the e�ects of altering
each of the parameters), the analysis highlights the impact of including product space location as a choice variable
of the �rms. Merging parties that previously o�ered similar products tend to move further away from each other
in product space, as it is more pro�table to avoid cannibalization. In addition, the remaining industry participants
5Chu (2010) uses the entry of satellite broadcasting as a �natural experiment� and documents the changes in products o�ered (channelline-ups) by cable �rms in response. The analysis is hampered a bit by the fact that all geographic markets experience satellite entry atthe same time, which makes it di�cult to separate the e�ect of competition on product choice from other exogenous factors. However,Chu's study does demonstrate substantial changes in the cable �rms' o�erings over time, which again provides evidence that modelingoptimal product choice in the context of mergers would give a more complete picture of the relevant competitive e�ects.
6Richard (2003) endogenizes the �ight frequency decision of airlines and predicts changes in �ight frequency in a merger simulation;however, the model estimated is only a single-�rm optimization � the �rst order conditions of optimal �ight frequency do not includethe decisions made by competitors.
7Interestingly, the qualitative results in another paper (Gotz and Gugler (2006)) in a di�erent industry (the Austrian retail gasolinemarket) generate the opposite inference � mergers that result in more concentrated markets tend to display less product variety. Basedon the theoretical results in the literature, it is not surprising that the e�ect of concentration on product variety could go either way.These authors also note that their results highlight the gap left by structural demand analyses that �neglect a key feature of marketpower in di�erentiated markets, namely that a merger between formerly competing �rms may change product variety.�
4

also alter their product space locations. The authors conclude that �the merged �rm's product repositioning both
mitigates the reduction in consumer welfare the merger otherwise would produce and allows the merged �rm to
capture a much larger portion of the pro�ts the merger generates.� While the results cannot be extrapolated directly
to any particular industry, the analysis does frame the important issues that an empirical model of this sort should
address.
In concluding this subsection, it is worth noting that authors who have proposed the use of product di�erentiated
demand models for merger simulation were well aware of the abstraction from post-merger product selection inherent
in their approach. For example, Nevo (2000) states, �this approach is not consistent with �rms changing their
strategies in other (than price) dimensions that may in�uence demand. . . .this implies that characteristics, observed
and unobserved, and the value of the outside good are assumed to stay the same pre- and postmerger.� Peters (2006)
suggests that real-world violation of this assumption might be the source of di�erences between economically-based
merger simulation results and price e�ects of actual mergers. His paper is among the �rst to compare actual
postmerger prices with the predictions made by models based on ex ante structural demand estimates.8 His
analysis uncovers substantial di�erences between the simulated and actual price changes associated with several
airline industry mergers in the 1980s, and goes on to decompose these di�erences based on other post-merger data
from the industry. In particular, Peters attributes a substantial portion of the post-merger price e�ect to observed
changes such as entry/exit, �ight frequency and airport presence, as well as unobserved post-merger changes in
demand and costs. Again, the takeaway is �while merger simulation can be useful in understanding the e�ect of
a merger on unilateral pricing incentives, such methods are likely to yield unsatisfactory predictions of a merger's
overall e�ect. . . unless richer models of �rm conduct are incorporated into the methodology.�9
2.2 Merger Cases
Courts and regulatory agencies have taken some consideration of changes in the product o�erings of di�erentiated
competitors in the process of merger evaluation. However (perhaps because of the lack of an appropriate framework
to simulate product changes), speci�c �ndings are not often cited as part of the merger case rulings. The discussion
that follows is not meant to represent an exhaustive summary of the legal landscape on this issue, but instead
includes a survey of the cases and decisions where postmerger product repositioning is explicitly referenced.
One recent relevant case involves the merger between Whole Foods Market and Wild Oats Market � two su-
permarkets that specialize in organic foods (FTC v. Whole Foods Market, Inc. 533 F.3d 869 (C.A.D.C.,2008.)).
The government's expert testimony in this case argued that the merged �rm would close a number of currently
existing stores, resulting in a reduction of competition on non-price dimensions (over and above the anticipated
price e�ects), with a loss of consumer surplus as a consequence. However, the identity and number of stores to
be closed was not projected by a formal economic model or econometric analysis; instead, plans for the status of
particular establishments in the merged company was obtained through discovery. Along with the price e�ects of
the merger, assertions were made regarding consumer harm due to changes in �quality, service, and importantly,
8Papers by Ashenfelter and Hosken (2010) and Weinberg and Hosken (2012) perform similar analyses on a variety of industries inwhich recent mergers have been approved by regulators and have actually occurred.
9Similar concerns continue to be associated with mergers in the airline industry. For example, more than 40 percent of travel managerssurveyed anticipated that the 2008 merger between Delta and Northwest would negatively impact access to smaller US markets and�ight schedules/frequencies (Avery (2008)). Policy makers in Montana elicited an ex ante response � executives from the merging airlineswrote a letter to the Montana Senate delegation promising not to cut the total number of �ights servicing the state after the merger.Senator Baucus of Montana promised to �keep an eye of this merger if it goes through� and �hold the NWA-Delta CEOs feet to the �reto make sure they follow through on their promises.� (Bond (2008)).
5

the breadth of product o�erings available to consumers.�10
The district court, however, focused on the potential repositioning of competitors in response to the merger
as mitigating these price and non-price e�ects in its decision, observing that several supermarkets �have already
repositioned themselves to compete vigorously with Whole Foods andWild Oats for the consumers' premium natural
and organic food business.� Whole Foods, 502 F.Supp.2d at 48. In particular, the court decided that Whole Foods
and Wild Oats competed among supermarkets generally and that the cost of other supermarkets expanding their
product lines to include organic foods would not be prohibitive. While this conclusion was based on observations
of the product lines of existing supermarkets, there was not an underlying empirical analysis on which it was based
or an assessment of which markets would be more or less likely to experience supermarkets changing their product
lines to become more direct competitors.11
Indeed, in several cases, the court seems more inclined to focus on the endogenous repositioning response of
competitors following a merger. For example, in approving the merger between Oracle and PeopleSoft (U.S. v.
Oracle Corp., 331 F.Supp.2d 1098 (N.D.Cal. 2004.)), the court found that �plainti�s have not proved that SAP,
Microsoft, and Lawson would not be able to reposition themselves in the market so as to constrain an anticompetitive
price increase or reduction in output by a post-merger Oracle.� This suggests opposing considerations associated with
exploring issues of product choice endogeneity and post-merger product repositioning in the context of antitrust.
While only formally considering pricing and constraining merging parties to o�er the same products after a merger
necessarily understates producer surplus gains, (and potentially underestimates consumer surplus declines if product
variety is reduced post-merger) anticipating the consequences of product portfolio changes for merging parties
invites consideration of the ability of other market participants to mitigate the merger's e�ects through their own
repositioning following a merger in their industry. In addition, optimal post-merger repositioning could conceivably
result in more product heterogeneity, generating a positive e�ect on consumer surplus that nets away some of the
harm done to consumers by higher prices.
From that perspective, an important issue becomes the relative ability of various industry participants � due to
scale economies, sunk costs, or perhaps based on their market power � to introduce new products. For example,
in the market for facial tissues (U.S. v. Kimberly-Clark Corp., No. CIV. A. 3:95-CV-3055-P., 1996 WL 351145
(N.D.Tex. April 04, 1996)), the court's decision stated that �because entry into the facial tissue market is di�cult,
requiring a signi�cant investment in plant equipment and brand building, successful new entry or repositioning
after the merger is unlikely to restore the competition lost through Kimberly-Clark's removal of Scott from the
marketplace.� However, the court appears to have been swayed that the merger of the second and third largest
manufacturers of jarred baby food would permit additional product innovation in the industry (FTC v. H.J. Heinz
Co. 116 F.Supp.2d 190 (D.D.C.,2000)). The court cites the fact that �xed marketing and distribution costs are
required to launch new products and �the conditions for increased competition in the form of product innovation
and product di�erentiation will be enhanced by the merger, because the distribution of the combined entities
will add Heinz's all commodity volume to Beech-Nut's all commodity volume.� The court cites testimony from the
defendants' expert that posited a particular volume threshold at which new product introductions would be pursued
in the industry (though it is not clear how such a threshold was derived, or what the speci�c consequences of the
product innovation ability would be).
10Cited from the expert report of Kevin M. Murphy, PhD, downloaded from the FTC website.11In early 2009, a settlement was ultimately reached in this case � Whole Foods is required to sell a prescribed list of stores as a result
of the settlement.
6

This brief summary suggests that the e�ect of mergers on the extent of product di�erentiation in an industry
is potentially quite important for courts in judging their competitive impact and ruling on whether they should
be permitted. Evidence regarding post-merger product repositioning has been used in a variety of ways � to
argue that merging �rms will cause competitive harm over and above price e�ects, to justify a merger based on
enhanced ability to introduce products against a more formidable competitor, or to dismiss concerns regarding
anticompetitive behavior of merged parties based on the product di�erentiation of other industry participants.
Indeed, section 6.1 of the most recent revision of the Horizontal Merger Guidelines suggests that the DOJ and
FTC consider competitor repositioning when evaluating potential merger e�ects. However, consideration seems
to be limited to exclude repositioning by the merging parties and techniques for repositioning analyses are not
speci�ed. As such, evidence may be limited to circumstances in which explicit product di�erentiation strategies
can be obtained through discovery or else may be speculative in practice. A more formal economic framework
through which analysts can simulate how a merger might a�ect optimal product choice, industry heterogeneity, and
ultimately consumer surplus may well assist the agencies and/or courts in addressing this question in a systematic
and more comprehensive manner.
3 The N-Product Model with Three �rms
We now pose a model of competition under di�erentiated products. While the model is restricted to three �rms for
simplicity of exposition it can be easily expanded to include any number of �rms.
Consider an industry with three �rms identi�ed by i ∈ {A,B,C} ≡ I. Each �rm is in posession of a set of
products with prede�ned characteristics. Ji represents the set of products �rm i is endowed with and j represents
one of these products.12 The game has two stages: in the �rst stage �rms simultaneously choose which products to
o�er and incur an entry fee for each product. This entry fee may be product speci�c and can be considered either
as a �xed cost of carrying the product or as a sunk cost of o�ering the product or as a combination of both. In the
second stage, after observing which products are o�ered, �rms choose simultaneously prices for each of its o�ered
products.
An equilibrium is a vector of o�ering choices and of prices (x?,p?). In this context, x? is the entry decisions for
each �rm: x? ≡ (x?A,x?B ,x
?C) where xA = (x1A, x2A, ..., xjA)′ and x1A is one if the product is o�ered and zero if it
is not. The price vector p? ≡ (p?A,p?B ,p
?C) are the prices that will arise given x? is the set of o�ered products. If
a product is not o�ered, let its price be de�ned as ∅. Such a de�nition of an equilibrium implies we focus only on
pure strategy equilibria.
We characterize the equilibrium by solving the game through backward induction. For a given o�ering choice
x we �nd the equilibrium prices of the subgame and calculate the subsequent pro�ts and consumer surplus. Using
these pro�ts we then model the entry game and characterize the equilibrium in the entry game. We give more
details on the pro�t functions and the �xed costs in the next subsections.
12Games in which �rms choose location on a continuous variable (i.e., quality) can be accomodated under the framework presentedhere by discretizing the continous variable into buckets and having all �rms endowed with all buckets of such variable. We believe,however, that products with prede�ned characteristics represent a useful characterization of post-merger activity insofar as industryparticipants can easily add or subtract existing products in response to the merger. Designing new products optimally may be alonger-term prospect.
7

3.1 The Pricing Game
The o�ering choices are given by x and are taken as �xed in this subsection. Here we characterize the pricing game
given the o�ering x. We de�ne Ki to be the set of active products of �rm i, so that Ki ⊆ Ji and K be all the
products o�ered in the market: K ≡ ∪i∈IKi.We model the pricing game under discrete choice demand functions. A consumer s has a speci�c preference for
each product and has a utility from each product given by
ujs = θjs − αspj + εjs (3.1)
where αs is the consumers price coe�cient (his utility of income) and (θjs, εjs) are two idiosyncratic taste shocks.
The distinction between the two is in that εjs is drawn from a Type 1 Extreme Value distribution with variance
σ and θjs is drawn from an arbitrary distribution that allows for correlated shocks across products and non-zero
means: θs ≡ (θ1s, θ2s, ..., θJs)′ ∼ F (θ|µ,Σ).13 The utility of not purchasing is given by u0s = εjs and the total
market size is M .
The additivity and independence assumptions between the two idiosyncratic shocks allows us to integrate the
probability of purchase in two steps, where the demand for good j will be given by
sj(p) = M
ˆe
1σ (θjs−αspj)
1 +∑n∈K e
1σ (θns−αspn)
dF (θs|µF ,ΣF ) (3.2)
Equation 3.2 is very informative: θjs can be interpreted as a random coe�cient on the intercept of each product.
It can also be thought of as the transportation cost for an individual travelling to product j in a Hotelling model.14
The variance σ plays two roles in this model: on the one hand, it de�nes how important price and the correlations
across products are relative to other unobersved characteristics. On the other hand, it controls how �smooth� the
integrand is. In this sense, one can think of the idionsyncratic shock ε as a convenience tool that allows to form a
Kernel to approximate the outer integral (the integral over random coe�cients: θjs) and in which the variance σ
controls the bandwidth of such Kernel.
Assuming a product-speci�c constant marginal cost cj , pro�ts in the pricing game are then given by
πi(p) =∑j∈Ki
sj(p) (pj − cj) (3.3)
and the equilibrium prices are de�ned as the solution to
∂πi(p)
∂pj= 0 ∀j ∈ Ki i = {A,B,C} (3.4)
Conditions for existence and uniqueness of equilibrium are given in Nevo (2000).
Let px de�ne the equilibrium prices when the o�ering choice is x and let πx denote the associated equilibrium
variable pro�t. Before moving on to the entry game, we present the calculations for consumer surplus. Given the
13Since many distributions will be used throughout the model, we subscript µ and Σ by 'F ' to denote they refer to the distributionF .
14Any Hotelling model in which all consumers can reach all products without having to travel over another product can be representedwith this model by specifying an appropriate distribution F and setting σ (from the T1EV distribution) to zero. Two examples of suchhotelling models are Salop (1979)'s circular city model with two �rms and a spherical city with three �rms.
8

current setup, for an o�ering vector x, consumer surplus can be de�ned as
CSx =
ˆM ln
[1 +
∑n∈K
e1σ (θns−αspn,x)
]dF (θs|µF ,ΣF ) (3.5)
which is a measurement of the equivalent variation, as given as in McFadden (1973) and slightly modi�ed to account
for the random coe�cients. We now solve the entry game given pro�ts πx.
3.2 The Entry Game
We model a simultaneous move entry game. For this game, we take the vector of pro�ts πx as the subgame outcomes
of the entry game and assume no discounting. Firms incur a cost gji of o�ering product j, which we group together
in the vector gi ≡ (g1i, g2i, ..., gJi)′. In summary, the ex-post net pro�ts for �rm i of o�ering products xi are
Πi(xi,x−i) = π(xi,x−i) − g′i · xi
All players know πx but do not know rivals per-product �xed costs gji. These assumptions imply the game is
of incomplete information. Firms prior beliefs on these �xed cost coincide with the population distribution of �xed
costs and are given by G(gi|µG,ΣG). This distribution allows costs to be correlated across products of the same
�rm but assumes they are independent across products of di�erent �rms.15
The game described above is very similar to traditional games of incomplete information as in Seim (2006).
We modify this traditional game by introducing new information. We allow all �rms to observe a public signal of
each other's �xed cost. If this public signal is uniformative, then the game proceeds unchanged. If the signal is
fully informative, then the game converts to one of complete information. If the signal is somewhat informative,
the game will be a mixture of the two as we show next. The advantage of this approach is that it lets us nest
both complete information and incomplete information models into a single model. This way we can do sensitivity
analysis to the information structure of the game relatively easily.
To the best of our knowledge Greico (2012) is the only other work that has bridged both complete and incomplete
information entry games into a single model. Greico allows for �rms to have two distinct and additive pro�t
shocks, one of which is common knowledge; the other is private information. Both Greico's model and ours deliver
qualitatively similar results. The advantage of our model is that we model the degree of information assymetry (the
variance on the public signals) separately from the pro�tability of the industry (the variance in the �xed cost shocks).
In Greico's model a change in the variance of the private shock a�ects both the degree of information assymetry
and the pro�tability of the �rms. Thus, in his model, the public pro�t shocks have to be resized appropriately so
that the pro�tability of the industry remains constant when chaning the degree of information assymetry.
The degree of information assymetry (the noise in the public signal) can be identi�ed from the coordination
in entry decisions. In a complete information game �rms coordinate entry decisions on both observable and un-
observable (to the econometrician) factors, so as to not have negative post-entry pro�ts. In the fully incomplete
information entry game �rms coordinate only on observable factors, but not on unobservable factors. In a par-
tially incomplete information game �rms will coordinate on the observable factors and partially coordinate on the
15This last assumption simpli�es signi�cantly the model as �rms cannot learn about rivals' costs by observing their own costs. Themodel can be easily extended to have common observed factors a�ect �rms pro�tability (i.e., common labor costs), but these need tobe non-random and known to all �rms.
9

unobserved factors (the coordination will not be as strong as it would be in a complete information game). It is
also important to note that coordination on entry also depends on the degree of competition. Thus, information
assymetry and competition cannot both be estimated solely from entry/exit decisions without strict structural
assumptions.16 An alternative approach to identi�cation is to use price and quantity data to identify the degree of
competition and entry/exit patterns to identify the degree of information assymetry.
Getting back to our model, we model the public signal as a draw from a distribution centered at the true values:
ηji ∼ H(gji, νH) where νH is the variance in the signal. All players update their beliefs given the realization of
signals and prior beliefs. Let the updated beliefs be given by the distribution G(G,H, η, νH) which is a function of
prior distributions G and H, signals η, and commonly known variance νH . Since the signals are public information,
all �rms can form the updated beliefs G.These signals can be interpreted as publicly available information that �rms know but not the econometrician.
Examples include local labor costs, real estate and utility costs, or permits and government fees, with which �rms
can estimate rivals' costs without knowing them with certainty.
Firms use the signals to calculate the probability of entry of each rival given rivals' assesment of the �rm's own
probability of entry. Formally, let Pxi be the probability that all �rms give to �rm i's entry decision xi given the
posterior distribution G. Let Px−i = Πn 6=iPxn . A �rm's entry decision is then given by:
x̂i(gi,Px−i) = arg maxxi
∑x−i∈Πn 6=iJn
Px−iπ(xi,x−i) − g′i · xi (3.6)
and the entry probabilities Pxi are given by:
Pxi = EG[x̂i(gi,Px−i)
]∀i (3.7)
Equation 3.7 is a �xed point equation whose solution (P?xi) is used to determine entry decisions by each �rm.
These entry decisions are given by x̂i
(gi,P?x−i
)in which the �xed point P?x−i is a function of the realized signals
ηij . This �xed point equation may have more than one �xed point. That would be the case when there is multiple
equilibria. An equilibrium selection rule will need to be applied to obtain a unique solution, although that rule may
depend on the public signals. It may not depend on the �xed costs since then the equilibrium selection rule would
reveal to other players more information about rivals' costs.
3.2.1 Expected Entry Patterns and Market Outcomes
The expected entry patterns di�er from the entry probabilities in that they are not a function of the signals ηji.
To obtain the expected entry probabilities one must integrate over the distribution of signals and the distribution
of �xed costs. Since the distribution of signals is a function of the realized �xed costs, one must solve the integral
x̄i =
ˆ ˆx̂i
(gi,P?x−i
)dH(η|g, νH)dG(g) (3.8)
to obtain the expected entry patterns x̄i.
16One such structural assumption could be that the competitive pressure a rival entrant imposes on an incumbent is the same asthat of a rival entrant imposing on two incumbents. This competitive pressure can then be estimated from the coordination on entrybetween two �rms deciding to enter and the degree of information assymetry from the coordination between these two �rms and a third�rm.
10

Similarly, one can obtain the expected consumer surplus, producer surplus, and other market outcomes by
engaging in a similar procedure:
CS =
ˆ ˆCSx̂x̂dH(η|g, ν)dG(g) (3.9)
PSi =
ˆ ˆΠi(x̂i, x̂−i)dH(η|g, ν)dG(g) (3.10)
3.3 Merger Analysis
A merger between two �rms has many e�ects. A �rst and well known e�ect is the price e�ect. Holding product
o�ering constant merged �rms increase their prices. Since competition is in strategic complements, the fringe �rm
would also raise price. The net e�ect is that, holding product o�ering �xed, average prices rise with the merger.
This rise in pricings may induce more entry, as the merging �rms may now �nd it pro�table to o�er a product that
wouldn't have been pro�table under the lower prices pre-merger. This increase in entry may reduce the price e�ect
as new products provide more price competition.
A second major e�ect arises from the merging �rms internalizing the e�ect their entry decisions have on each
others' pro�tability. To the extent that products are partial substitutes of each other, the merging �rm might
want to reduce its o�ering (the number of products o�ered), decreasing the cannibalization on their own products,
increasing price on the remaining products and saving on the �xed costs of the products being cut back. In response
to this reduction in o�ering by the merging parties, the fringe �rm will o�er its products more often.17 The net
e�ect would be a reduction in total product o�ering. This is the basic rationale behind competition in strategic
substitutes.
A third e�ect the merger has is that it changes the information structure. The merged �rm shares information
on its �xed cost across all potential products - in other words, the previously unknown �xed cost of the merger
partner becomes known (since they are now the same �rm). This allows the merged �rm to coordinate entry better,
especially when information on �xed costs is vague. As coordination improves, entry increases: the merged �rm
can decrease the mis-matching post entry and thus have a higher incentive to enter. For example, holding the
fringe �rm's entry decision constant, pre-merger each merging �rm has, for each potential product, a cuto� for �xed
costs below which it o�ers the product. At exactly this cuto� value, the expected losses due to a mis-match (both
merging parties o�ering the product) exactly equal the expected gains from a correct match (the other merging
party not o�ering the product). Since a mis-match causes the �rm to lose money, the cuto� is such that a correct
match implies strictly positive pro�ts. Thus, �xed costs have to be strcitly lower than variable pro�ts obtained
when the other merging party does not enter. Improving coordination decreases the probability of a mis-match,
thus the expected losses are lower. This implies the cut-o� for �xed costs has to be higher (�xed costs can be higher
and still justify entry).
Additionally, the merger will allow the merging parties to coordinate their entry decisions. This can help the
merging parties crowd-out the remaining �rms: by o�ering two products jointly, the merging �rm may prevent
the fringe's entry. Thus, the merging parties crowd-out rival �rms and bene�t from joint-pricing. Although the
total number of products o�ered doesn't necesarily change, joint pricing instead of competitive pricing may hurt
consumers and bene�t the merging �rm.
17In an incomplete information game as the one modeled here, a �rm has a cuto� for �xed costs below which it o�ers a product (when�xed costs are low enough, the �rm o�ers the product). Increasing this threshold results in the �rm o�er the product more often. Thisis what we imply when we state that the �rm o�ers its product more often.
11

Finally, along with the pricing e�ects, mergers may generate cost synergies for merging parties. As suggested
in Section 2.2, such synergies be in the form of reductions in the �xed costs of o�ering a product. Depending on
the size of this reduction, entry may increase post mergero�setting any negative e�ects on consumer welfare.
We illustrate the signi�cance of these forces in a set of simulations involving three �rms with one product each.
The next section lays out these simulations.
4 The Three Product Example
Our simulation results are organized around demonstrating the merger e�ects discussed above. We do this in a
setting where each of the three �rms is endowed with a single product each. The simulation results show how key
market outcomes change as a result of a merger between �rms A and B. The presence of the fringe �rm, �rm C,
allows for some competition to exist even after the merger. It also allows for some information assymetry to exist
after the merger.
For all simulations we measure the change in consumer surplus and in producer surplus. To normalize the scale
values, we measure percentage changes. We also measure the expected number of products in the market and the
change in this value. This allows us to observe how market structure changes due to the merger. We also calculate
the above measures when �rms are not allowed to change their product o�ering. Doing so allows us to observe how
important allowing for product repositioning is in merger analysis.
We run three sets of simulations. In the �rst set we have products equally spaced out - that is, each product is
the same distance from each of the other two. This allows us to see the e�ect of mergers when all products, those of
the merging parties and those of the fringe �rm, are similar substitutes to each other. In the second set we have the
products of the merging �rm be closer substitutes to each other than to the product of the fringe �rm. This allows
us to analyze the e�ect of a merger when the two merging parties are o�ering relatively similar products and there
are no potential strong substitutes in the market. In the third set of simulations we model one of the products of
the merging �rm as being close to the product of the fringe �rm, while the other product of the merging �rm being
a poor substitute to the other two products. This allows us to analyze the e�ect of a merger when the merging
parties don't o�er close substitutes to each other and there exists other products in the market that can rival the
merging �rm.
4.1 Primitives
The entry model described above is characterized by a large set of primitives. We �x these primitives to reasonable
values. Speci�cally, we set price elasticities, market shares, and entry probabilities so as to resemble those of
the literature (???). The complete list of primitives and their values are given in the appendix. The cross price
elasticities, market shares, and entry probabilities for the base speci�cation are:
∇ps(p) =
−1.82 0.43 0.43
0.43 −1.82 0.43
0.43 0.43 −1.82
s(p) =
0.22
0.22
0.22
x̄ =
0.88
0.88
0.88
Among other key primitives, we use a censored normal distribution for the distribution of �xed costs ( G(·)
), with censoring at zero and positive mean value. The signal distribution (H(·) ) is a normal distribution. This
12

allows for the updated distribution G(·) to be a censored normal distribution (for which a closed form solution is
known). The use of a signal variance of 0.5 units and of a �xed cost variance of 0.07 implies the game is very close
to the classical incomplete information game.
As to selecting equilibrium, we use iterative best responses to �nd the equilibrium and order players movements
according to who is most pro�table if no one else were to enter. With two players, this would choose the e�cient
equilibrium; with three players it has the same �avor but it is not guaranteed.
For the random coe�cients and the T1EV draw, we use a variance on the T1EV of 0.1 and a variance of all
random coe�cients of 1. This implies that most variation comes from the random coe�cients and the T1EV shock is
used mostly as a smoothing kernel for the numerical integration. The covariances on random coe�cients are varied
across simulations to show how results di�er if products are closer or farther apart. We discuss these covariances
more in detail below.
4.2 Equally Spaced Products (The 111 Model)
In the �rst set of simulations, products are always equally spaced and assumed to be symmetric in every way
(i.e. �xed costs, variable costs, ...). Table 1 shows the consumer surplus and producer surplus change caused by a
merger between �rm A and �rm B. This table contains results for both cases: when allowing �rms to reposition
their products (rede�ne their entry decisions) post merger, and when not allowing for product repositioning.
Not surprisingly, the merger induces a loss of consumer surplus, as prices are increased and products are cut
back. What is surprising is the importance that product repositioning has in this loss of consumer surplus. The
average number of products in the market drops by 14%. The drop in product o�ering mitigates the price e�ect
as the merging party does not increase price as much when cutting back on one of the products being o�ered (to
attract some of the consumers who previously purchased the culled product). The magnitude of this e�ect can be
seen when contrasting the change in average market price: when allowing for product repositioning, average market
price increases by a modest 2.7% after the merger. If product repositioning is not allowed, price increases almost
twice as much: 4.8%.
More importantly, the reduction in the products being o�ered has large repercusions on consumer surplus.
Consumers favor variety, and having a reduction in the o�ering a�ects their welfare. We see that consumer surplus
drops by 16% post merger when allowing for product repositioning. Not allowing for repositioning results in a
more modest drop of 10% in consumer surplus. This 6 point di�erence is driven by the reduction in the number of
products being o�ered.
Moreover, the ability to reposition bene�ts the �rms hugely and might be a huge driver of the merger. We see
that pro�ts for the merging parties (producer surplus) increases by 10% post merger when product repositioning is
allowed, and increases by only 6.7% when repositioning is not allowed. Interestingly, the most a�ected �rm is the
fringe �rm and not the merging �rms. Its pro�ts increase by 44% when allowing for repositioning. This increase
in pro�ts is drawn from increasing its market share and price, both driven from two sources: (a) conditional on
the product o�ering, the merging �rm raises price post-merger, allowing for the fringe �rm to gain market share
and increase its price -competition is in strategic complements-; (b) in response to the merging party reducing its
product o�ering, the fringe �rm o�ers its product more often.18 Past merger analysis tends to omit this second
18Formally, the fringe �rm increases the cuto� below which �xed costs must be to justify entry; thus increasing the probability thatit will recieve a �xed cost that justi�es entry and making entry more often.
13

Table 1: Base SimualtionsModel 111 Model 110 Model 011
With
Repositioning
∆CS -16.3% -22.4% -9.0%
∆p̄ 2.7% 4.6% 2.5%
∆PSA 10.1% 49.7% 5.2%
∆PSB 10.1% 49.7% -23.5%
∆PSC 43.7% 18.2% 54.5%
N pre-merger 2.7 2.6 2.6
∆N -14.3% -22.7% -5.8%
Without
Repositioning ∆CS -9.8% -14.9% -5.7%
∆p̄ 4.8% 7.2% 2.7%
∆PSA 6.7% 19.6% 1.7%
∆PSB 6.7% 19.6% 3.0%
∆PSC 19.1% 12.5% 13.4%
* Model 111 uses a correlation value (ρ) of zero for the base speci�cation. Models 110 and 011
use a correlation value of 0.5 in the base speci�cation since using a correlation of zero would
result in identical results as in model 111.
e�ect or just mention it in passing. In this particular setting, the fringe �rm more than doubles its gains in pro�ts
from allowing for repositioning (44% increase in pro�ts compared to 19%).
The merging �rm has a huge incentive to cut back on product o�ering when �xed costs are very large and
products are close enough substitutes that the remaining product can capture a sign�cant portion of the market
that the product being cut back was obtaining. Under what conditions are �xed costs large? We can infer that �xed
costs must be large in cases where not all products are o�ered all the time. To the extent that products have some
di�erentiation (cross-price elasticities are moderate) �rms can always make at least some small variable pro�ts. The
only justi�cation then for not o�ering the product is �xed costs that are at least as large as those variable pro�ts.
In the current setting, average �xed costs are 0.28 units19 (cfr. Appendix) while the variable pro�ts a �rm would
earn if all products were o�ered is 0.35 units. Thus, �xed costs represent ~80% of operating income. As a reference,
WalMart's number for 2012 is 75%.20
4.2.1 Bringing Products Closer Together
So far we have described the e�ects of the merger under the assumption that products are partial substitutes for
each other. How would our results be a�ected if products were very strong substitutes? We now vary the distance
between products, to allow for products to be closer or farther apart. We continue to retain equal distance between
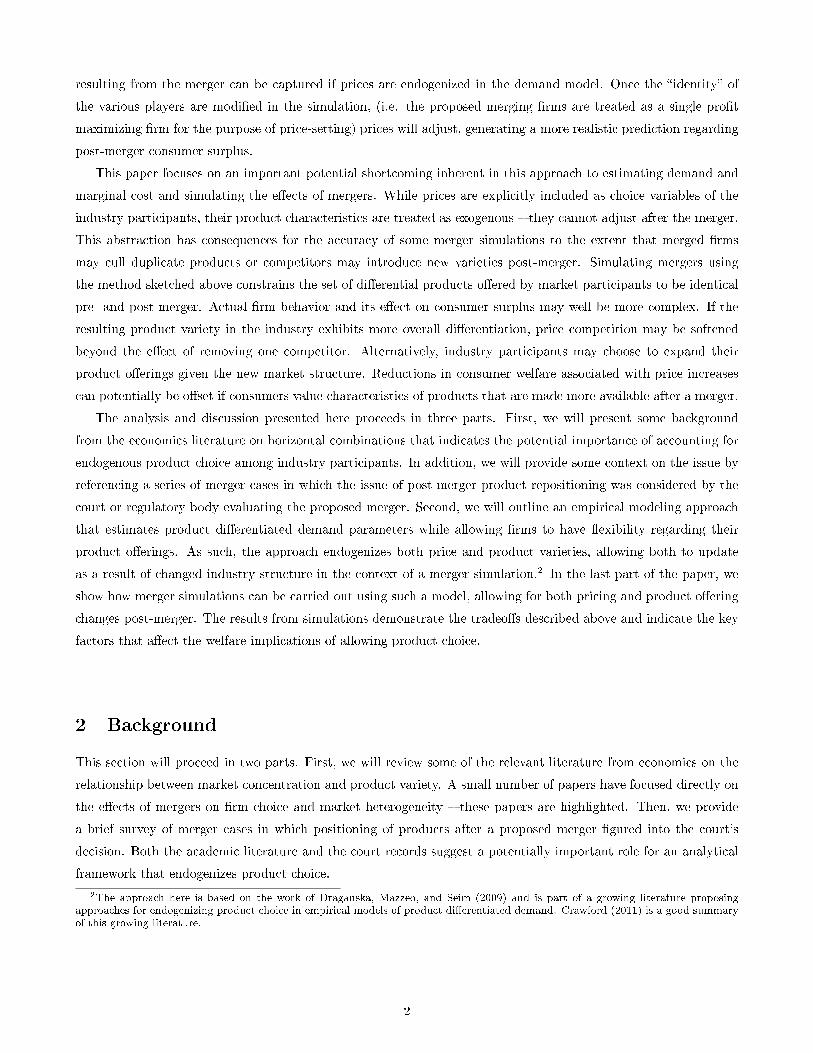
products, though. Figure 4.1 plots the change in consumer surplus caused by the merger for di�erent values of
distance between products. The horizontal axis in these plots shows how close or far substitutes products are
from each other by plotting the pre-merger cross-price elasticity21 when all products are o�ered in the market.
The parameter that varies across simulations is the correlation factor (ρ) in ΣF , which translates into a cross-
price elasticity.22 Since varying ρ also changes the own-price elasticity, when plotting the cross-price elasticity we
normalize it by the own-price elasticity (in absolute terms).
For low values of cross-price elasticity (when the products are highly di�erentiated) the merger causes consumer
19Fixed costs are measured relative to market size: M and µG are not separately identi�ed in the entry game. Thus, pro�ts (variableand net), �xed costs, prices, and variable costs are all referred to in terms of units.
20From WalMart's 5-year �nancial summary (http://www.walmartstores.com/sites/annual-report/2012/�nancials.aspx): Gross pro�tis 24.5% and operating pro�t is 6%. Thus, of total gross pro�t, 75% goes to operating expenses.
21Due to symmetry, the cross price elasticity between any two products is the same.22ΣF has the form [1 ρ ρ ; ρ 1 ρ ; ρ ρ 1]
14
Figure 4.1: Model 111 (Equally Spaced Products): Changes in Consumer and Producer Surplus
15

Figure 4.2: Number of Products and Change in Number of Products for Model 111
surplus to drop by only 8%. This is because products are so di�erentiated that they almost don't compete against
each other, as if each product served a distinct market. As such, the merger changes �rms' market power only
slightly, so prices and o�erings change little.
In markets where products are closer substitutes they compete more strongly against each other and the merging
�rms increase prices and reduce o�ering more heavily. This happens more strongly where we see the solid curve dip.
Note how modeling the change in consumer surplus without allowing �rms to reposition signi�cantly underestimates
the negative e�ects of the merger. The welfare loss without repositioning is only 10% while allowing for repositioning
implies welfare losses of 18%.
As we continue to move towards the right, where products are even closer substitutes, we see the trend reverse
and the drop in consumer surplus is not as strong. This is because the amount by which the merging �rms cutback
on product o�ering decreases. This is counterintuitive, as the closer products are to each other the higher the
bene�ts from cutting back on a product: you save on the �xed cost and the remaining product absorbs most of the
demand. The reason the trend reverses is that pre-merger very few products are being o�ered, so there isn't a lot
of space to cut back on. In the extreme, when products are so close substitutes to each other that only one product
�ts in the market, the merging �rm would never cut back on a product because it was already only o�ering one
product to begin with. Figure 4.2 shows this in more detail.
It is surprising to see consumer surplus increase post-merger when products are close substitutes. This happens
for normalized-cross-price elasticities of ~0.4. In these simulations we see the merging �rm increase the average
number of products o�ered post merger (Fig 4.1, second plot). This increase can arise from two causes: (a) by
joint pricing, the merging party will do better whenever a mismatch happens and will thus be more willing to incur
such mismatch; (b) the merger allows for the merging party to share information (on each others' �xed costs), thus
16

Figure 4.3: Change in Number of Products under Alternative Game Structures
improving the coordination in product o�ering, decreasing miss-matches, and increasing the thresholds at which
the �rm o�ers a product. Figure 4.3 disentagles these e�ects. It plots the change in the merging �rms expected
number of products, but does so under three di�erent models: the incomplete information model described above,
a quasi-complete information model where the variance in the public signal, νH , is set to 0.005; and a mixed merger
model where �rms make entry decisions as if they hadn't merged but use the variable pro�ts under joint pricing
when making these decisions. This last scenario captures the �rst e�ect described above. The second e�ect is
captured in the di�erences between the incomplete and quasi-complete information games.
It is clear from �gure 4.3 that the increase in product o�ering is from being able to mitigate the e�ects of miss-
matched entry through joint pricing. The mixed-merger model shows a sign�cant increase in the number of products
post merger when the cross price elasticity is ~0.4. This mixed merger model has �rms decide on their entry decisions
as if they hadn't merged (no �rm internalizes the pro�tability of a rival when making its entry decision), but has
�rms use the duopoly variable pro�ts (joint pricing pro�ts) instead of the triopoly variable pro�ts when making
their entry decisions. As the merging parties can use pricing to mitigate the pro�t loss from mismatching after
entry, they enter even when �xed costs are not as favorable.
In the quasi-complete information game, a merger never results in increased o�ering. This is because with
complete information, there is never the risk of a mis-match: all �rms know what the other �rms will do.
Notice that this increase in product o�ering by the merging �rm a�ects the fringe �rm's pro�ts. The fringe
17

�rm's pro�tability drops post merger (�g. 4.1, second plot), contrary to what had been happening for all other
values of cross-price elasticities. As the merging �rm coordinates better and o�ers more often the best response for
the fringe �rm is to decrease its o�ering so as to decrease the probability of a mis-match, but this just induces the
merging �rm to o�er more often. Without product repositioning, we would never observe the merger have negative
e�ects on the fringe �rm.
Finally, when products are almost homogenous (at the extreme right in the graphs), the merger has a very small
e�ect on consumer surplus as the market can only support a single product. Allowing �rms to merge will not change
the number of products being o�ered, which is just one. Since there is only one product being o�ered there is no
price e�ect either. Thus, even without product repositioning, the welfare consequences of the merger are minimal.
4.3 Merging Products are Strong Substitutes (Model 110)
We now study the e�ect of a merger when the fringe �rm does not o�er a suitable substitute to the products of the
merging �rms. Speci�cally, we assume a correlation matrix of
ΣF =
1 ρ −ρρ 1 −ρ−ρ −ρ 1
so that a higher value for ρ implies the products of the merging �rm are closer to each other and farther from that
of the fringe �rm. The second column in table 1 shows the results of this simulation for a correlation value (ρ)
of 0.5.23 Figure 4.4 shows selected results for the whole span of ρ.24 As before, we express the horizontal axis in
terms of the cross-price elasticity between the two products of the merging �rm. Values to the far right signify
the merging �rms have very similar products that are radically di�erent than those of the fringe �rm. Values to
the far left signify the merging �rms have products that are located as far aways from each other as possible while
simultaneously being near the fringe �rm's product.
The graph illustrates how harmful a merger between two close substitutes can be when no fringe rival exists.
We see consumer surplus loss of up to 24%, in which half of that loss arises from the merging �rms increasing price
signi�cantly (∆CS no repositioning). The other half arises from the merging �rms cutting back on product o�ering.
These e�ects are strongest for cross-price elasticity values of 0.3-0.6. It is in this range where the merging �rms
have products that are close to each other without being so close that they wouldn't be able to compete and make
a pro�t. That is, the merger is worst for consumer surplus when the two products are as close as possible while still
being o�ered.
It is in this mid-range where most products are being o�ered pre-merger. For extremely high values of cross-
price elasticity only one of the products of the merging �rm is ever o�ered pre-merger. For extremely low values of
cross-price elasticities a completely di�erent analysis applies: the products of the merging �rm are close to that of
the fringe �rm but far from each other. The merger results in modest increases in prices and cutbacks in product
o�ering because the merging parties are serving quasi-di�erent markets.
At high values of ρ, the fringe �rm's product is very far away from those of the merging �rms. This lack of
23The �rst column reports the results when the correlation value is 0.24We vary this value from -0.5 to 1, which is the full range in which the matrix retains positive de�niteness. ρ cannot take a value less
than -0.5 since it would imply the products of the merging �rm are far away from each other but to close to the fringe �rm's product:A cannot be far away from B and close to C when B is close to C too.
18

Figure 4.4: Model 110 (Merging Products are Strong Substitutes)Change in Consumer Surplus and in Number of Products
*Cross-price elasticity of product A wrt product B's price, normalized by product A's own price elasticity
a substitute to contest the merger signi�cantly a�ects consumer surplus. Contrasting �gure 4.4 with �gure 4.1
we see anywhere between a 5% decrease to a 10% increase in consumer welfare post-merger when the fringe �rm
can contest it, compared to a 15-20% drop when the fringe �rm cannot contest the merger. This sharp contrast
highlights the importance of fringe �rms in contesting mergers.
We now look at the case when the fringe �rm does exist and the merger is between products that are not close
substitutes.
4.4 Merging Products are Weak Substitutes (Model 011)
Now the merging parties o�er radically di�erent products, while the fringe �rm o�ers a product that is very similar
to one of the products of the merging �rm. Thus, we illustrate the case when the merging parties are poor substitutes
to each other and there exists a fringe �rm that challenges one of the merging �rms. Speci�cally, the correlation
matrix used is
ΣF =
1 −ρ −ρ−ρ 1 ρ
−ρ ρ 1
Column three of table 1 shows the results of this simulation for a ρ of 0.5. Figure 4.5 shows selected results for
the whole span of ρ. The normalized-cross-price elasticity used for the x-axis is the elasticity that exists between
products of �rm B and �rm C normalized by the own-price elasticity of �rm B's product. Values to the far right
signify that �rm B's product is very close to that of the fringe �rm while �rm A's product is very far away.
19

Figure 4.5: Model 011 (Merging Products are Weak Substitutes)Change in Consumer Surplus and in Number of Products
*Cross-price elasticity of product B wrt product C's price, normalized by product B's own price elasticity
The welfare consequences of the merger are more modest. The worst drop in welfare occurs at values near
0.15, which is were both products of the merging �rm are actually closer to each other than to the fringe �rm (the
correlation factor ρ is negative for this value of cross-price elasticity). As we move to the right of the graph, in which
the products of the merging parties are far from each other, we see very modest losses in consumer surplus; and for
some values we even see gains. Welfare is not signi�cantly a�ected from the merger because the merging parties
o�er highly di�erentiated products, thus post-merger prices do not increase signi�cantly nor does the merging �rm
cutback on product o�ering.
It is also interesting to see how calculating the welfare loss with or without repositioning results in very similar
estimates (the dotted blue line and the solid blue line are not too far apart). This is driven by the fact that the
merging �rm does not cutback on its o�ering post merger, and the price e�ect dominates. The merging �rm does
not cutback because the two forces described previously cancel each other: on one hand the merging �rm would
save on �xed costs from cutting back a product, on the other hand it can mitigate its losses after a mis-match and
increases the cuto� on �xed costs below which it decides to enter. Because the merging products are far substitutes,
both forces are modest: the �rm cannot use the remaining product to recoup sales of the product it cuts back, and
mis-matches will not happen too often because the products do not cannibalize signi�cantyl each other's sales.
20

Figure 5.1: Change in Consumer Surplus when Mergers causea X% Cost Reduction for Merging Parties (Model 111)
5 Cost E�ciencies
It is natural to ask: how large must cost e�ciencies induced by the merger be so that the merger be bene�cial to
consumers? Farrell and Shapiro (1990) take a �rst stance at this question, calculating the size of the cost e�ciencies
in a symmetric Cournot setting.25 We follow a similar analysis, and show the consumer surplus change post merger
for three di�erent levels of cost e�ciencies: 5%, 15%, and 25% cost reductions in �xed costs. Figure 5.1 shows these
results. We use Model 111 (equally spaced products) throughout this section.
Even a modest 5% cost reduction results in substantial mitigation of the welfare loss post-merger for most values
of cross-price elasticities. This is because a huge driver of consumer welfare is the number of products being o�ered
in the market. A moderate cost e�ciency induces a large increase in �rms' probability of o�ering their products.
This is mainly due to the fact that the variance in �xed costs is not large and this distribution is two-sided. Pre-
merger, the probability of o�ering a product is neither large nor small, thus a small change in �xed costs can induce
a huge change in this probability as the cuto� at which �rms are using for their decision to enter or not is close
to the median of the distribution. Given that the distribution has two tails, shifting the distribution down a �xed
amount will move a large probability mass across this cuto� value. If the cuto� value where in the tails of the
distribution, the same shift in the distribution would have a small repercusion in terms of probability mass being
moved across the cuto�.
What is very interesting to note is that when products are highly di�erentiated, even signi�cant drops in the
cost of o�ering a product have a very small impact on the change in consumer surplus. This is because products
are so distinct, that they are being o�ered regardless of the cost savings. The merger does not change the number
25Other work in this question is Levin (1990) and McAfee and Williams (1992)
21

of products o�ered, but does change the pricing. This becomes clear when observing the far left of �gure 4.2. The
cost e�ciencies have the highest impact on consumer surplus when products are close substitutes without being
perfect substitutes. This is in the same region where the merging �rm would increase its product o�ering regardless
of the cost e�ciencies. The rationale behind having the largest e�ect here follows the same lines as the previous
arguments. It is at these levels of cross-price elasticities that on average half of the potential products are being
o�ered (�g. 4.2). Thus, this is when the probability of o�ering a product is neither large nor small, but exactly
half: the cuto�s for deciding weather to o�er a product or not or very close to the median of the distributions.
6 Discussion
...
7 Conclusions
In this paper, we have begun to analyze the potential welfare impacts of post-merger product repositioning. While
the industrial organization literature has documented a relationship between di�erentiation and market concentra-
tion and the potential for repositioning has been qualitatively considered by courts and regulatory agencies, merger
simulations have almost entirely focused on price e�ects. We demostrate that post-merger repositioining can have a
substantial impact on industry equilibrium, exacerbating or diminshing the impact on consumer welfare depending
on the circumstances. The impacts are particularly acute in cases where the merging �rms o�ered relatively similar
products prior to the merger. A simulation that allows for repositioning can also accomodate the impact of �xed
cost synergies, which tend to be positive for consumer welfare because the merged �rm will o�er their products
more often when �xed costs are lower.
In future work, we will develop alternative scenarios that may represent industries where mergers may actually
occur. The modeling strategy employed here could also, in principle, be adapted to compute post-merger repo-
sitioning impacts in an actual merger simulation. As mention in Section 2, a number of researchers have been
developing empirical techniques to accomodate product choice into merger analysis - our approach makes most
sense for a shorter-run analysis in which the industry's �rms can change their minds about which existing product
varities are optimal to o�er after a merger. Incorporating these e�ects, along with pricing impacts, should make
merger simulations more information to regulatory agencies trying to judge the impact of mergers on consumers.
References
Alexander, P. (1997): �Product Variety and Market Structure: A New Measure and a Simple Test,� Journal of
Economic Behavior & Organization, 32, 207�214.
Ashenfelter, O., and D. Hosken (2010): �The E�ects of Mergers on Consumer Welfare: Evidence from Five
Mergers on the Enforcement margin,� Journal of Law and Economics, 53, 417�466.
Avery, S. (2008): �Buyers Concerned About Delta-Northwest merger's Impact on Service,� posted on purchas-
ing.com.
22

Berry, S. T., and J. Waldfogel (2001): �Do Mergers Increase Product Variety? Evidence from Radio Broad-
casting,� Quarterly Journal of Economics, pp. 1009�1025.
Bond, J. (2008): �Airline Merger Should Not A�ect Montana Travel,� posted online.
Budzinski, O., and I. Ruhmer (2010): �Merger Simulation in Competition Policy: A Survey,� Journal of Com-
petition, Law & Economics, 6, 277�319.
Chu, S. (2010): �The E�ect of Satellite Entry on Cable Television Prices and Product Quality,� RAND Journal of
Economics, 41, 730�754.
Crawford, G. S. (2011): �Endogenous Product Choice: A Progress Report,� working paper.
Draganska, M., M. J. Mazzeo, and K. Seim (2009): �Beyond Plain Vanilla: Modeling Joint Product Assortment
and Pricing Decisions,� Quantitative Marketing and Economics, 7, 105�146.
Fan, Y. (2012): �Ownership Consolidation and Product Characteristics: A study of the US Daily Newspaper
Market,� American Economic Review, forthcoming.
Farrell, J., and C. Shapiro (1990): �Horizontal Mergers: An equilibrium analysis,� American Economic Review,
80, 107�126.
Gandhi, A., L. Froeb, S. Tschantz, and G. J. Werden (2008): �Post-Merger Product Repositioning,� Journal
of Industrial Economics, 56, 49�67.
George, L. (2007): �What's Fit to Print: The E�ect of Ownership Concentration on Product Variety in Daily
Newspaper Markets,� Information Economics and Policy, 19, 285 � 303.
Gotz, G., and K. Gugler (2006): �Market Concentration and Product Variety under Spatial Competition:
Evidence from Retail Gasoline,� Journal of Industrial Competition and Trade, 6, 225�235.
Greico, P. (2012): �Discrete Games with Flexible Information Structures: An Application to Local Grocery
Markets,� working paper.
Hotelling, H. (1929): �Stability in Competition,� Economic Journal, 39, 41�57.
Levin, D. (1990): �Horizontal Mergers: The 50-percent benchmark,� American Economic Review, 80, 1238�1245.
Manuszak, M., and C. C. Moul (2008): �Prices and Endogenous Market Structure in O�ce Supply Stores,�
Journal of Information Economics, 56, 94�112.
Mazzeo, M. J. (2002): �Product Choice and Oligopoly Market Structure,� The RAND Journal of Economics,
33(2), 221�242.
(2002a): �Competitive Outcomes in Product Di�erentiated Oligopoly,� Review of Economics and Statistics,
84, 716�728.
(2003): �Competition and Service Quality in the U.S. Airline Industry,� Review of Industrial Organization,
22, 275�296.
23

McAfee, R. P., and M. A. Williams (1992): �Horizontal Mergers and Antitrust Policy,� Journal of Industrial
Economics, 40, 181�186.
McFadden, D. (1973): Frontiers of Econometricschap. Conditional Logit Analysis of Qualitative Choice Behavior,
pp. 105�142. Academic Press.
Nevo, A. (2000): �Mergers with Di�erentiated Products: The Case of the Ready-to-Eat Cereal Industry,� Rand
Journal of Economics, 31, 395�421.
Peters, C. (2006): �Evaluating the Performance of Merger Simulation: Evidence from the U.S. Airline Industry,�
Journal of Law and Economics, 69, 627�649.
Richard, O. (2003): �Flight Frequency and Mergers in Airline Markets,� International Journal of Industrial
Organization, 21, 907�922.
Salop, S. (1979): �Monopolistic Competition with Outside Goods,� Bell Journal of Economics, 10, 141�156.
Seim, K. (2006): �An Empirical Model of Firm Entry with Endogenous Product-Type Choices,� The RAND Journal
of Economics, 37(3), 619�640.
Sweeting, A. (2010): �The E�ects of Horizontal Mergers on Product Positioning: Evidence for the Music Radio
Industry,� RAND Journal of Economics, 41, 372�397.
Watson, R. (2008): �Product Variety and Competition in the Retail Market for Eyeglasses,� Journal of Industrial
Economics.
Weinberg, M., and D. Hosken (2012): �Evidence of the Accuracy of Merger Simulations,� working paper.
Weiss, L. W. (1989): Concentration and Price. MIT Press.
Whinston, M. D. (2006): Lectures on Antitrust Economics. MIT Press.
A Primitives of the Model
The pricing game is characterized by price coe�cients (α), the distribution of random coe�cients ( F (µF ,ΣF ) ),
market size (M) and variable costs (cji). The price coe�cient is set to e−0.75, which is approximately 0.47. The
random coe�cients distribution is a multi-variate normal with mean µF = (1.2, 1.2, 1.2)′. The covariance matrix,
ΣF , is detailed in the text, has a variance of one, and covariance elements that vary between -0.5 and 1. Market size
is 0.76 units and variable costs are c = (1.5, 1.5, 1.5)′. The T1EV distribution uses a variance of σ = 0.1 and the
integrals over the distribution of random coe�cients are solved using numerical integration, taking twenty thousand
draws from a Sobol sequence.
If all products are present in the market, these primitives imply pre-merger prices of 3.32,26 market shares of
26Due to symmetry, all prices, market shares, and variable pro�ts are identical.
24

24.4%, variable pro�ts of 0.35 and price elasticities of:
∇ps(p) =
−1.82 0.43 0.43
0.43 −1.82 0.43
0.43 0.43 −1.82
The prices and variable costs described here imply gross margins of 55%.
The entry game is characterized by a distribution over �xed costs (G ) and a distribution over signals (H). We
use a censored normal distribution for �xed costs, with censoring at zero, a mean value of 0.28, and a standard
deviation of 0.07.27 H is a normal distribution with variance 0.5. The mean value is given by the realization of
the draw of �xed costs. All integrals regarding either H or G are executed through numerical integration. We use
ten thousand draws for the G distribution integrals and one thousand draws for the H distribution. All draws are
taken from Sobol sequences so as to increase the accuracy of the integrals.
The large variance in the distribution of signals, H, compared to the more modest variance of G, imply the
game is close to the classical game of incomplete information: the standard deviation of the updated distributions
G is 0.069 � calculated as: σ2G =
((σ2G
)−1+(σ2H
)−1)−1
. With these distributions, the expected pre-merger entry
probability for a given product is 0.88, which implies the expected number of products o�ered is 2.64. The expected
net pro�ts are 0.09 units (a net margin of 15% using pre-merger prices of 3.32 and market shares of 24.4%).
All plots in which the covaraince element, ρ, is varied are drawn using two hundred distinct values of ρ, equally
spaced between -0.5 and 1.
27This mean and standard deviation does not coincide with the µG and σG parameters of the distribution since G is a censored-normaldistribution. In this particualr case, since the censoring is at zero and zero is more than two standard deviations below the mean value(0.28), µG and σG are almost identical to the mean and standard deviation values.
25