Embed Size (px)
Citation preview

The Wall of Worry:U.S. Economic and Market OutlookMay 5, 2008
Samuel A. Wardwell, CFASenior Vice PresidentDirector of Investment CommunicationsPioneer Investment Management, Inc.
The views expressed in this presentation are those of the investment professional and are subject to change at any time. These views donot necessarily reflect the views of Pioneer or others in thePioneer organization.
Not FDIC insured May lose value No bank guarantee
19220-21-0508 | May 2008 | Page 2
There is no guarantee that forecasts discussed will be realized.Past performance is no guarantee of future results.
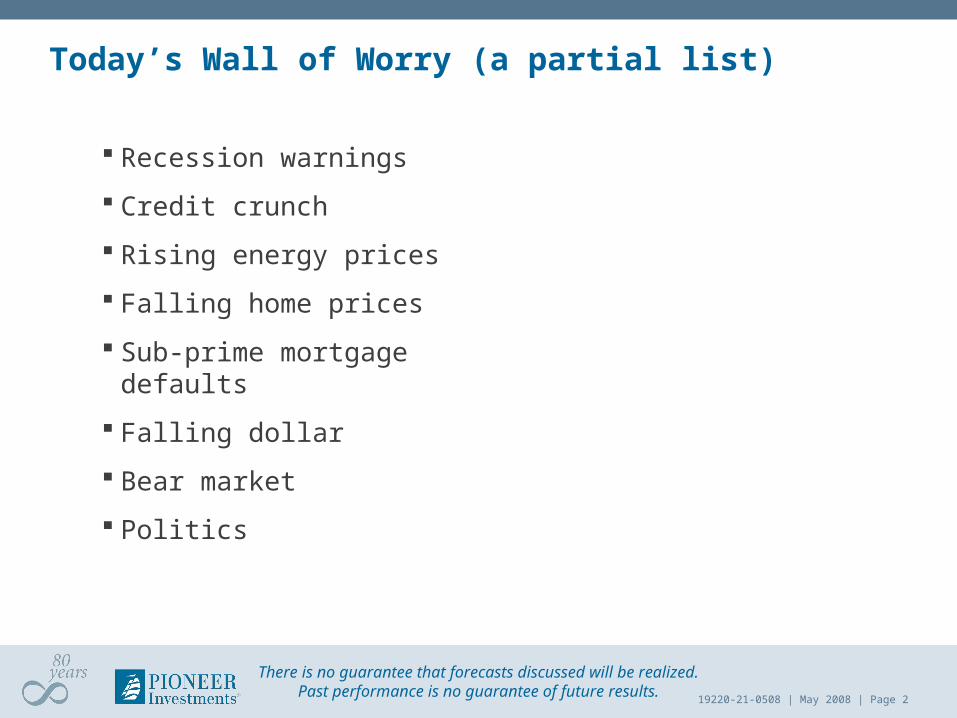
Today’s Wall of Worry (a partial list)
Recession warnings
Credit crunch
Rising energy prices
Falling home prices
Sub-prime mortgage defaults
Falling dollar
Bear market
Politics
19220-21-0508 | May 2008 | Page 3
There is no guarantee that forecasts discussed will be realized.Past performance is no guarantee of future results.
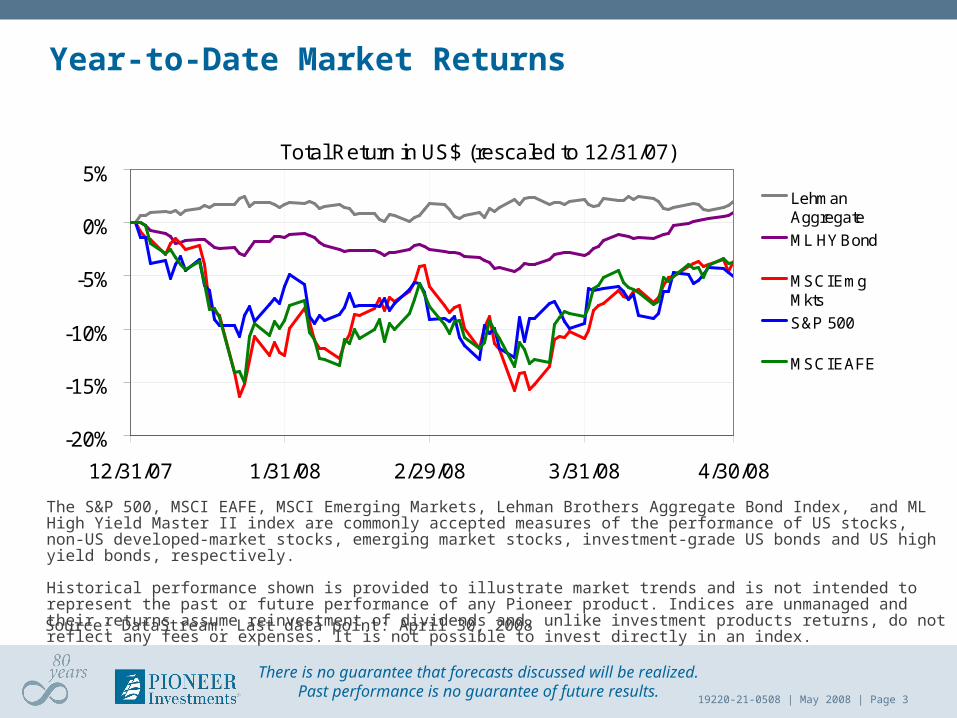
Year-to-Date Market Returns
Source: DataStream. Last data point: April 30, 2008
The S&P 500, MSCI EAFE, MSCI Emerging Markets, Lehman Brothers Aggregate Bond Index, and ML High Yield Master II index are commonly accepted measures of the performance of US stocks, non-US developed-market stocks, emerging market stocks, investment-grade US bonds and US high yield bonds, respectively.
Historical performance shown is provided to illustrate market trends and is not intended to represent the past or future performance of any Pioneer product. Indices are unmanaged and their returns assume reinvestment of dividends and, unlike investment products returns, do not reflect any fees or expenses. It is not possible to invest directly in an index.
Total Return in US$ (rescaled to 12/31/07)
-20%
-15%
-10%
-5%
0%
5%
12/31/07 1/31/08 2/29/08 3/31/08 4/30/08
LehmanAggregate
ML HY Bond
MSCI EmgMkts
S&P 500
MSCI EAFE
19220-21-0508 | May 2008 | Page 4
There is no guarantee that forecasts discussed will be realized.Past performance is no guarantee of future results.
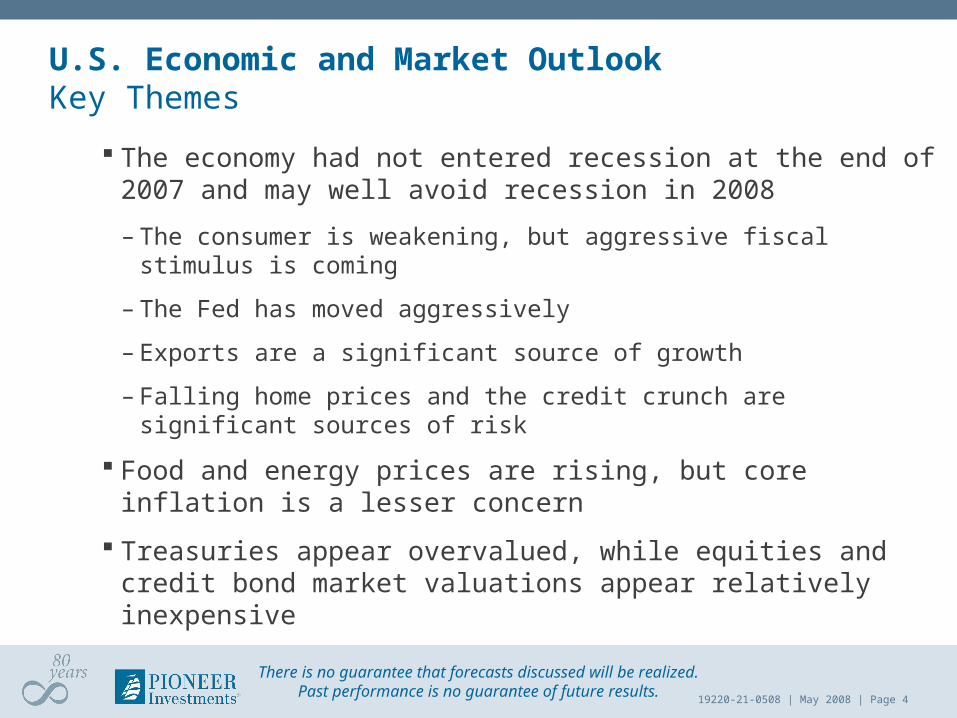
U.S. Economic and Market OutlookKey Themes
The economy had not entered recession at the end of 2007 and may well avoid recession in 2008
– The consumer is weakening, but aggressive fiscal stimulus is coming
– The Fed has moved aggressively
– Exports are a significant source of growth
– Falling home prices and the credit crunch are significant sources of risk
Food and energy prices are rising, but core inflation is a lesser concern
Treasuries appear overvalued, while equities and credit bond market valuations appear relatively inexpensive

19220-21-0508 | May 2008 | Page 5
There is no guarantee that forecasts discussed will be realized.Past performance is no guarantee of future results.
First Quarter GDP Growth (Advance Reading) Was 0.6%Growth Has Slowed…But Is it a Recession?
Source: DataStream. Last data point: 4th quarter 2007 (Advance)
Change in U.S. Real Gross Domestic Product
-4
-2
0
2
4
6
8
Q4 1985 Q4 1990 Q4 1995 Q4 2000 Q4 2005
Quarterly (annualized) Rolling 4 Quarter
19220-21-0508 | May 2008 | Page 6
There is no guarantee that forecasts discussed will be realized.Past performance is no guarantee of future results.
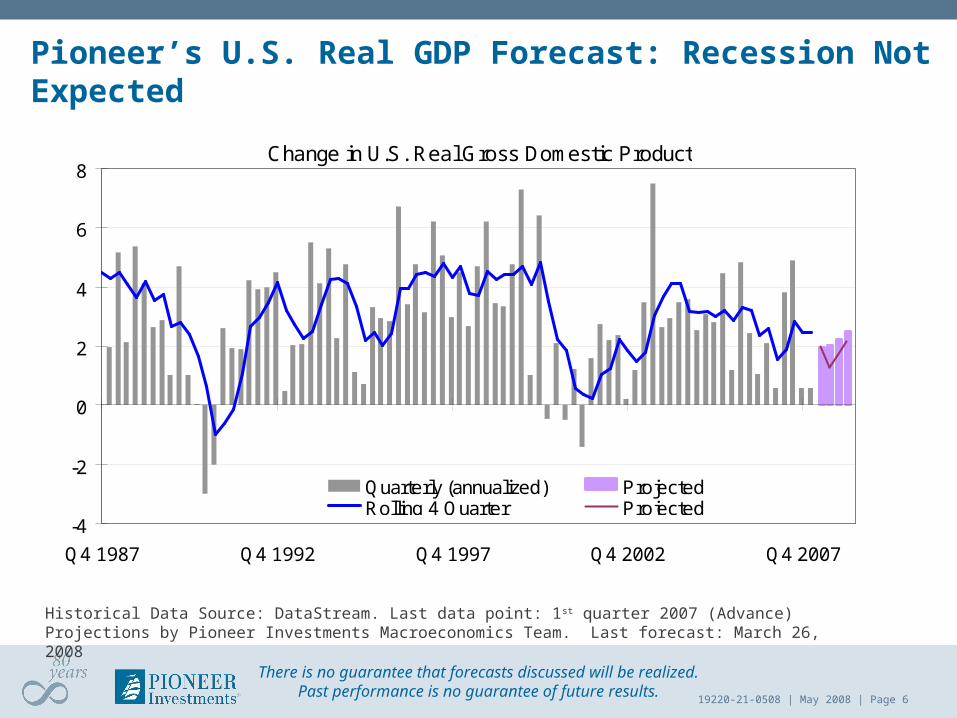
Pioneer’s U.S. Real GDP Forecast: Recession Not Expected
Historical Data Source: DataStream. Last data point: 1st quarter 2007 (Advance)Projections by Pioneer Investments Macroeconomics Team. Last forecast: March 26, 2008
Change in U.S. Real Gross Domestic Product
-4
-2
0
2
4
6
8
Q4 1987 Q4 1992 Q4 1997 Q4 2002 Q4 2007
Quarterly (annualized) ProjectedRolling 4 Quarter Projected

19220-21-0508 | May 2008 | Page 7
There is no guarantee that forecasts discussed will be realized.Past performance is no guarantee of future results.
Components of GDP GrowthPioneer’s 2008 U.S. Real GDP Forecast: 1.9%
Source: Pioneer Investments Macroeconomics Team. Last forecast: March 26, 2008
US GDP Components
-2
-1
0
1
2
3
4
5
6
1999 2000 2001 2002 2003 2004 2005 2006 2007 2008 E
Investment Consumption Government Inventories Net Trade
19220-21-0508 | May 2008 | Page 8
There is no guarantee that forecasts discussed will be realized.Past performance is no guarantee of future results.
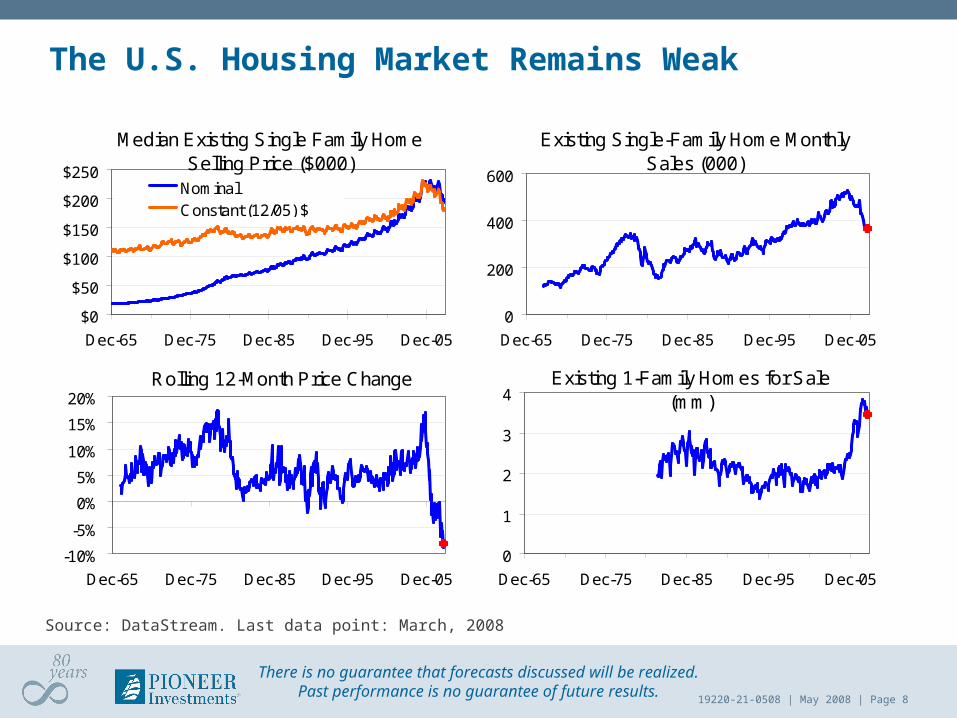
The U.S. Housing Market Remains Weak
Source: DataStream. Last data point: March, 2008
Median Existing Single Family Home Selling Price ($000)
$0
$50
$100
$150
$200
$250
Dec-65 Dec-75 Dec-85 Dec-95 Dec-05
NominalConstant (12/05) $
Rolling 12-Month Price Change
-10%
-5%
0%
5%
10%
15%
20%
Dec-65 Dec-75 Dec-85 Dec-95 Dec-05
`̀̀
Existing Single-Family Home Monthly Sales (000)
0
200
400
600
Dec-65 Dec-75 Dec-85 Dec-95 Dec-05
Existing 1-Family Homes for Sale (mm)
0
1
2
3
4
Dec-65 Dec-75 Dec-85 Dec-95 Dec-05
19220-21-0508 | May 2008 | Page 9
There is no guarantee that forecasts discussed will be realized.Past performance is no guarantee of future results.
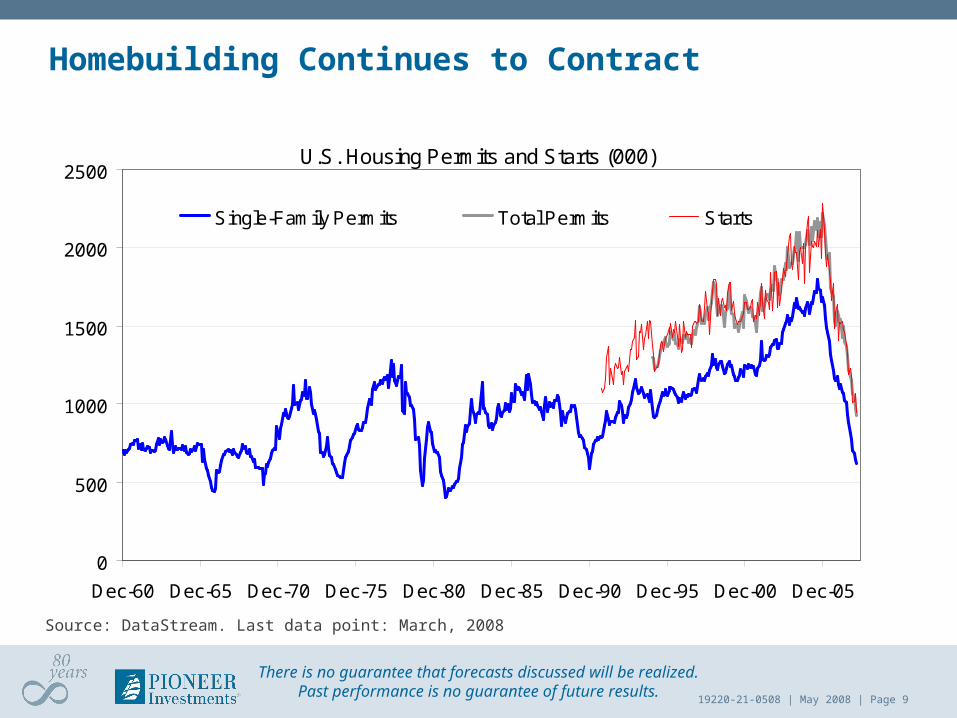
Homebuilding Continues to Contract
Source: DataStream. Last data point: March, 2008
U.S. Housing Permits and Starts (000)
0
500
1000
1500
2000
2500
Dec-60 Dec-65 Dec-70 Dec-75 Dec-80 Dec-85 Dec-90 Dec-95 Dec-00 Dec-05
Single-Family Permits Total Permits Starts
19220-21-0508 | May 2008 | Page 10
There is no guarantee that forecasts discussed will be realized.Past performance is no guarantee of future results.
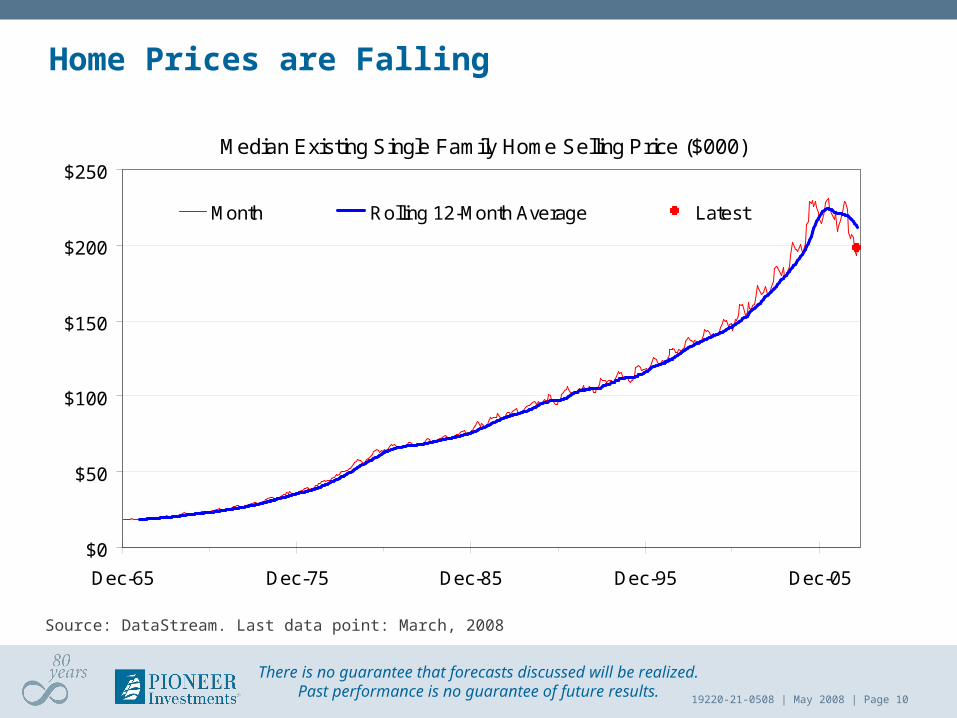
Home Prices are Falling
Source: DataStream. Last data point: March, 2008
Median Existing Single Family Home Selling Price ($000)
$0
$50
$100
$150
$200
$250
Dec-65 Dec-75 Dec-85 Dec-95 Dec-05
Month Rolling 12-Month Average Latest
19220-21-0508 | May 2008 | Page 11
There is no guarantee that forecasts discussed will be realized.Past performance is no guarantee of future results.
Elements of the Credit Market Crisis
Securitization
Relying on ratings
Greed
Leverage
Mark-to-market
Margin calls
Fear
Panic

19220-21-0508 | May 2008 | Page 12
There is no guarantee that forecasts discussed will be realized.Past performance is no guarantee of future results.
Source: FactSet. Last data point: April 30, 2008
Fear and Illiquidity in Interbank Lending Markets
Spread Between LIBOR and Treasury Bill Yields
0.0
0.5
1.0
1.5
2.0
2.5
12/31/02 12/31/03 12/31/04 12/31/05 12/31/06 12/31/07
3 Month Latest

19220-21-0508 | May 2008 | Page 13
There is no guarantee that forecasts discussed will be realized.Past performance is no guarantee of future results.
A Flight to Quality
Source: DataStream. Last data point: April 30, 2008
Difference Between 1-Month T-Bill Yield and Fed Funds (%)
-3
-2
-1
0
1
12/31/01 12/31/02 12/31/03 12/31/04 12/31/05 12/31/06 12/31/07
Yield Spread Latest
19220-21-0508 | May 2008 | Page 14
There is no guarantee that forecasts discussed will be realized.Past performance is no guarantee of future results.
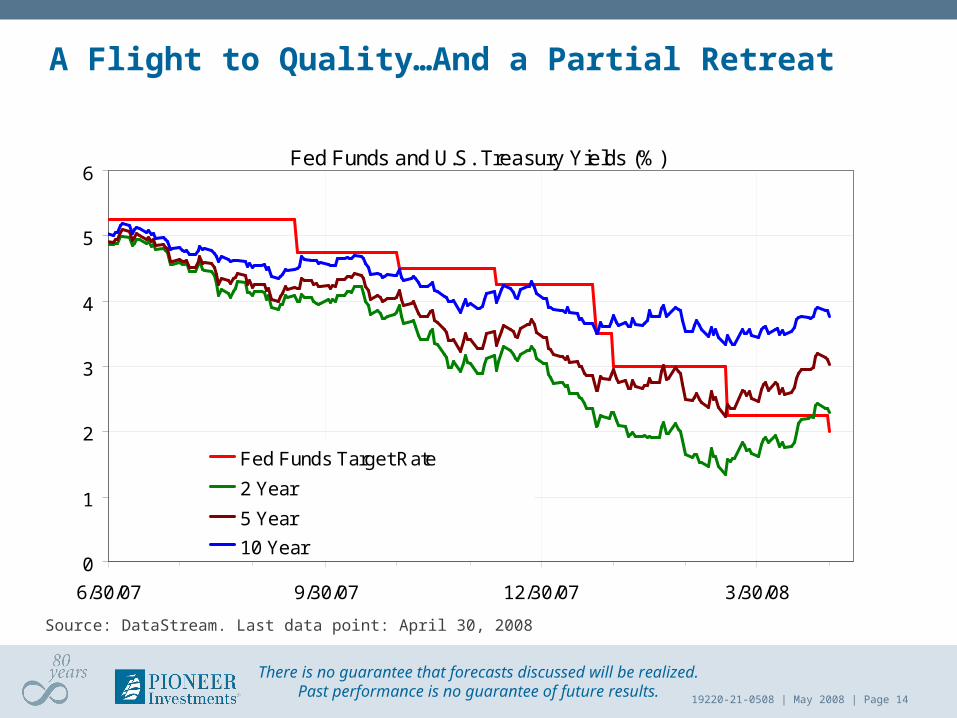
A Flight to Quality…And a Partial Retreat
Source: DataStream. Last data point: April 30, 2008
Fed Funds and U.S. Treasury Yields (%)
0
1
2
3
4
5
6
6/30/07 9/30/07 12/30/07 3/30/08
Fed Funds Target Rate
2 Year
5 Year
10 Year
19220-21-0508 | May 2008 | Page 15
There is no guarantee that forecasts discussed will be realized.Past performance is no guarantee of future results.
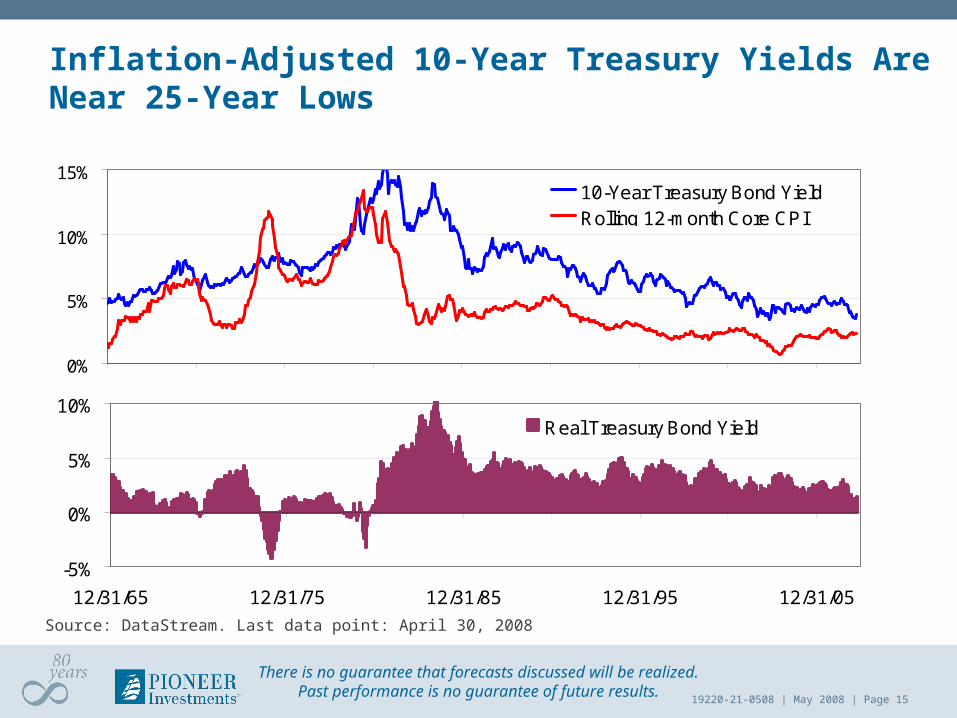
Inflation-Adjusted 10-Year Treasury Yields Are Near 25-Year Lows
Source: DataStream. Last data point: April 30, 2008
0%
5%
10%
15%10-Year Treasury Bond YieldRolling 12-month Core CPI
-5%
0%
5%
10%
12/31/65 12/31/75 12/31/85 12/31/95 12/31/05
Real Treasury Bond Yield
19220-21-0508 | May 2008 | Page 16
There is no guarantee that forecasts discussed will be realized.Past performance is no guarantee of future results.
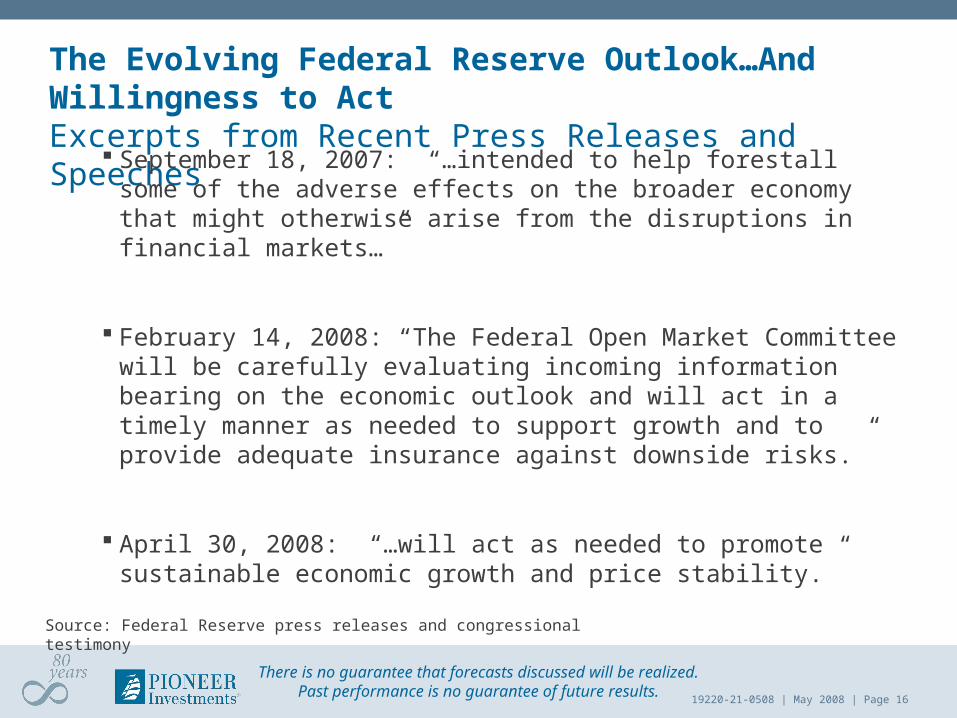
The Evolving Federal Reserve Outlook…And Willingness to ActExcerpts from Recent Press Releases and Speeches
September 18, 2007: “…intended to help forestall some of the adverse effects on the broader economy that might otherwise arise from the disruptions in financial markets…”
February 14, 2008: “The Federal Open Market Committee will be carefully evaluating incoming information bearing on the economic outlook and will act in a timely manner as needed to support growth and to provide adequate insurance against downside risks.”
April 30, 2008: “…will act as needed to promote sustainable economic growth and price stability.”
Source: Federal Reserve press releases and congressional testimony
19220-21-0508 | May 2008 | Page 17
There is no guarantee that forecasts discussed will be realized.Past performance is no guarantee of future results.
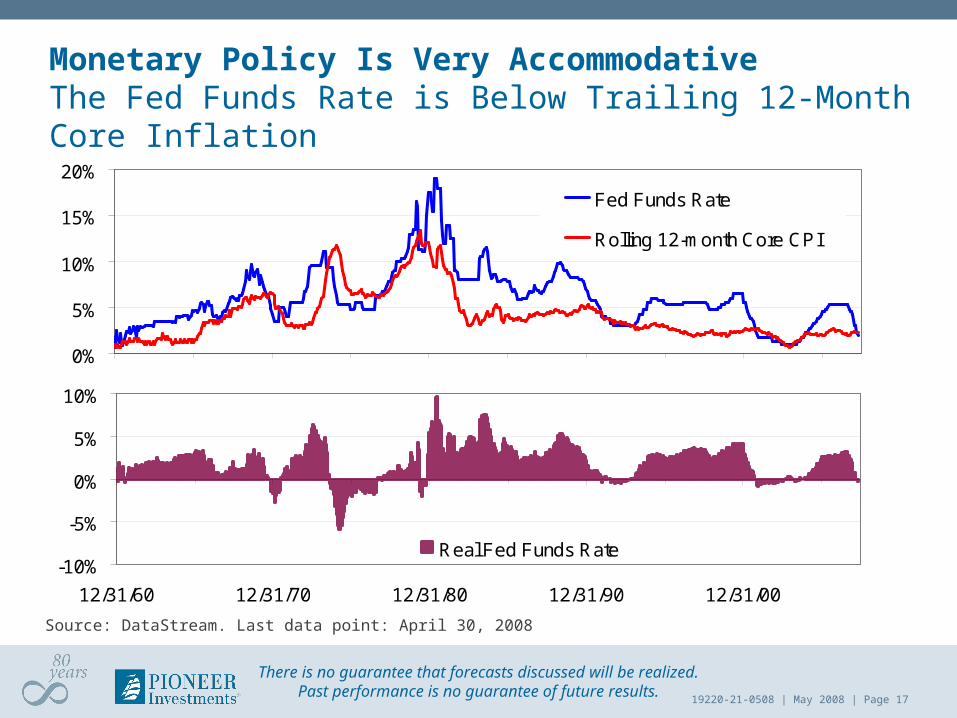
Monetary Policy Is Very AccommodativeThe Fed Funds Rate is Below Trailing 12-Month Core Inflation
Source: DataStream. Last data point: April 30, 2008
0%
5%
10%
15%
20%
Fed Funds Rate
Rolling 12-month Core CPI
-10%
-5%
0%
5%
10%
12/31/60 12/31/70 12/31/80 12/31/90 12/31/00
Real Fed Funds Rate

19220-21-0508 | May 2008 | Page 18
There is no guarantee that forecasts discussed will be realized.Past performance is no guarantee of future results.
Oil Prices Increases are Accelerating…And Food Prices are in the Headlines
Source: DataStream. Last data point: April 30, 2008
Oil (WTI in $US)
0
10
20
30
40
50
60
70
80
90
100
110
120
130
Dec-99 Dec-00 Dec-01 Dec-02 Dec-03 Dec-04 Dec-05 Dec-06 Dec-07
19220-21-0508 | May 2008 | Page 19
There is no guarantee that forecasts discussed will be realized.Past performance is no guarantee of future results.
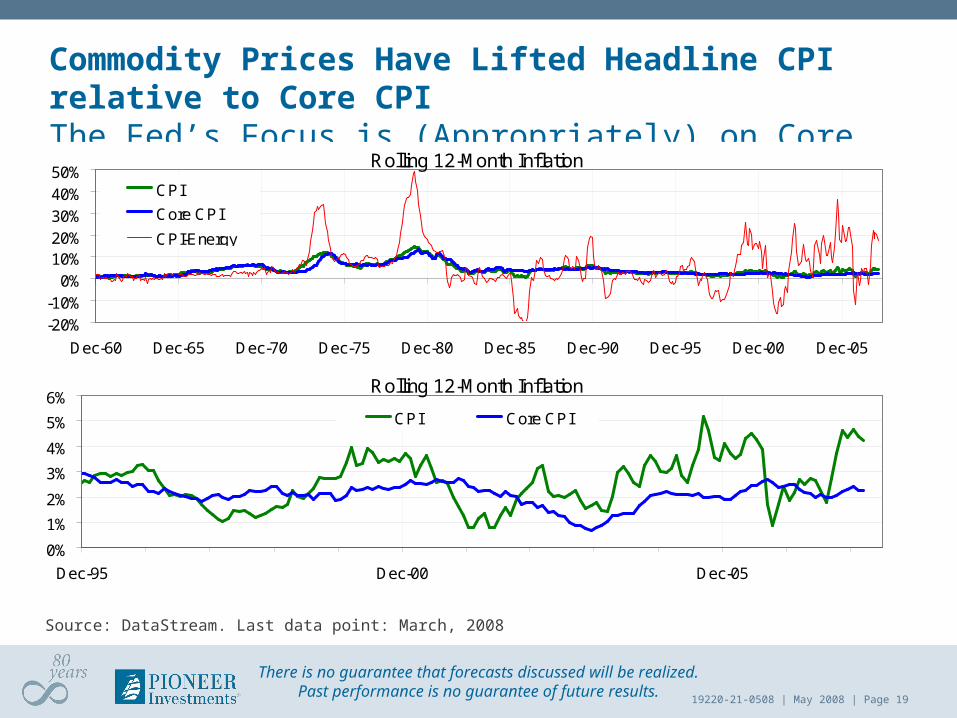
Commodity Prices Have Lifted Headline CPI relative to Core CPIThe Fed’s Focus is (Appropriately) on Core CPI
Source: DataStream. Last data point: March, 2008
Rolling 12-Month Inflation
-20%-10%
0%10%20%30%40%50%
Dec-60 Dec-65 Dec-70 Dec-75 Dec-80 Dec-85 Dec-90 Dec-95 Dec-00 Dec-05
CPI
Core CPI
CPI-Energy
Rolling 12-Month Inflation
0%
1%
2%
3%
4%
5%
6%
Dec-95 Dec-00 Dec-05
CPI Core CPI
19220-21-0508 | May 2008 | Page 20
There is no guarantee that forecasts discussed will be realized.Past performance is no guarantee of future results.
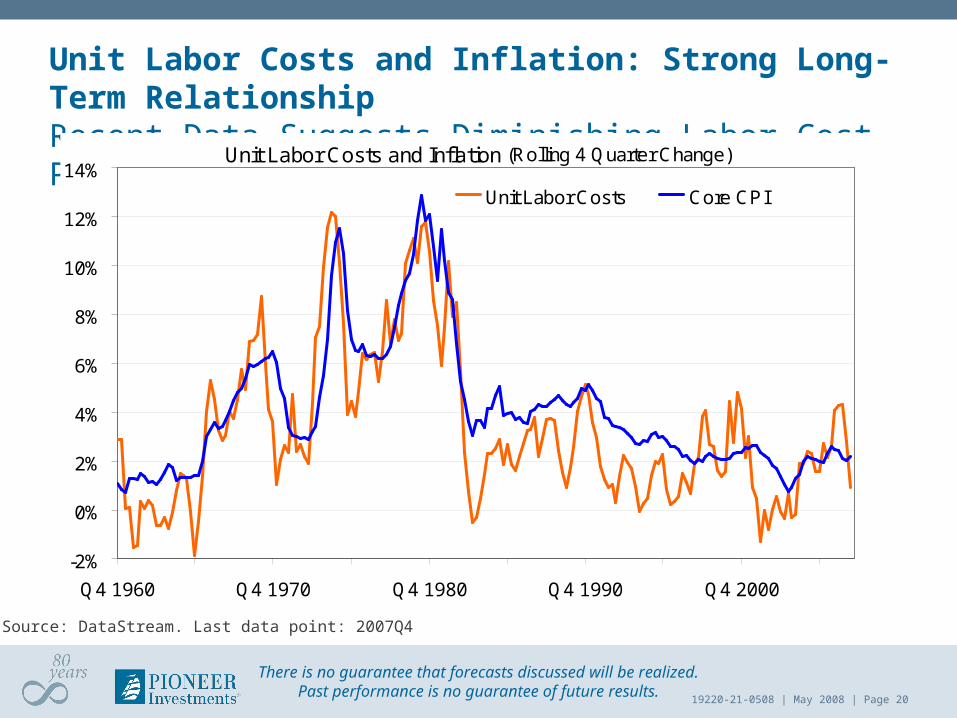
Unit Labor Costs and Inflation: Strong Long-Term RelationshipRecent Data Suggests Diminishing Labor Cost Pressures on Core CPI
Source: DataStream. Last data point: 2007Q4
Unit Labor Costs and Inflation (Rolling 4 Quarter Change)
-2%
0%
2%
4%
6%
8%
10%
12%
14%
Q4 1960 Q4 1970 Q4 1980 Q4 1990 Q4 2000
Unit Labor Costs Core CPI

19220-21-0508 | May 2008 | Page 21
There is no guarantee that forecasts discussed will be realized.Past performance is no guarantee of future results.
The Unemployment Rate Stands at 5.0%Unemployment is Not Rising as Rapidly as in Past Recessions
Source: DataStream. Last data point: April, 2008
U.S. Unemployment Rate
0
1
2
3
4
5
6
7
8
9
10
11
Dec-60 Dec-65 Dec-70 Dec-75 Dec-80 Dec-85 Dec-90 Dec-95 Dec-00 Dec-05
19220-21-0508 | May 2008 | Page 22
There is no guarantee that forecasts discussed will be realized.Past performance is no guarantee of future results.
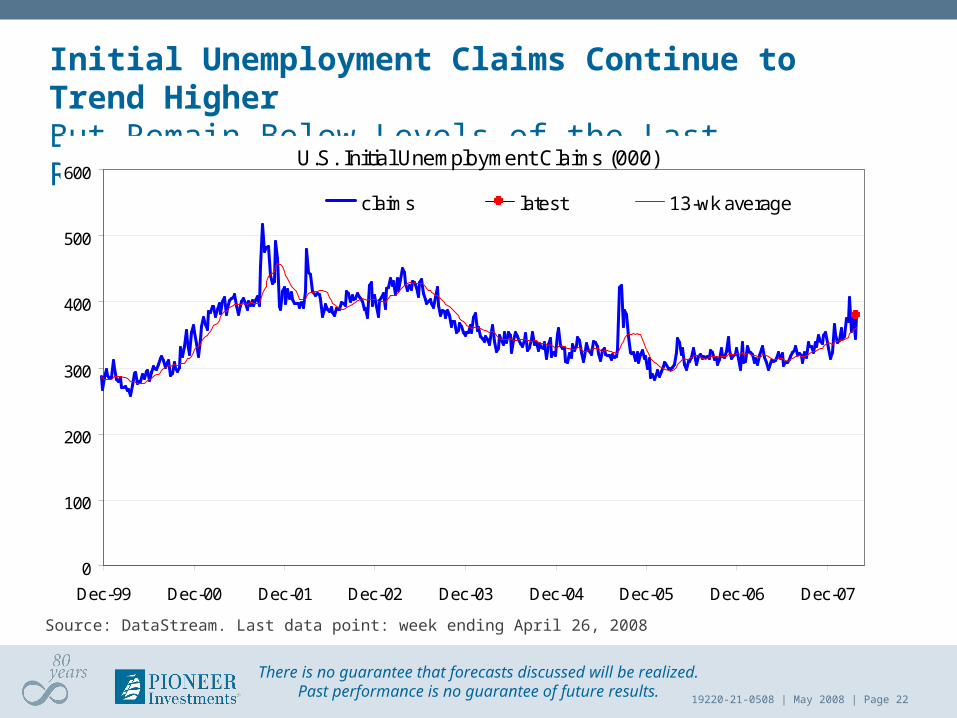
Initial Unemployment Claims Continue to Trend HigherBut Remain Below Levels of the Last Recession
Source: DataStream. Last data point: week ending April 26, 2008
U.S. Initial Unemployment Claims (000)
0
100
200
300
400
500
600
Dec-99 Dec-00 Dec-01 Dec-02 Dec-03 Dec-04 Dec-05 Dec-06 Dec-07
claims latest 13-wk average
19220-21-0508 | May 2008 | Page 23
There is no guarantee that forecasts discussed will be realized.Past performance is no guarantee of future results.
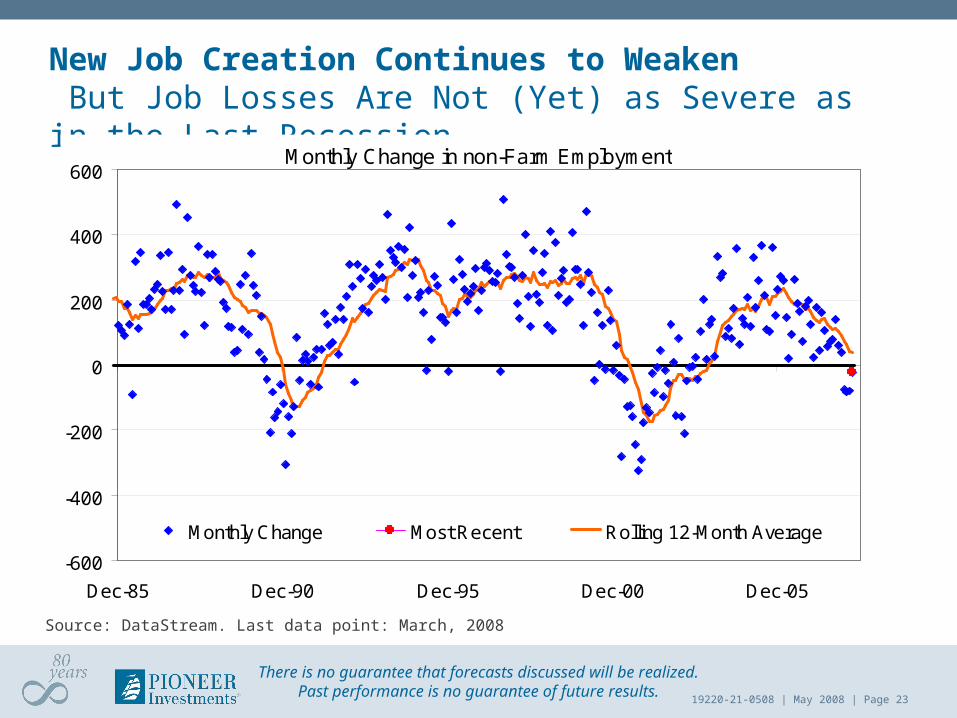
New Job Creation Continues to Weaken But Job Losses Are Not (Yet) as Severe as in the Last Recession
Source: DataStream. Last data point: March, 2008
Monthly Change in non-Farm Employment
-600
-400
-200
0
200
400
600
Dec-85 Dec-90 Dec-95 Dec-00 Dec-05
Monthly Change Most Recent Rolling 12-Month Average
19220-21-0508 | May 2008 | Page 24
There is no guarantee that forecasts discussed will be realized.Past performance is no guarantee of future results.
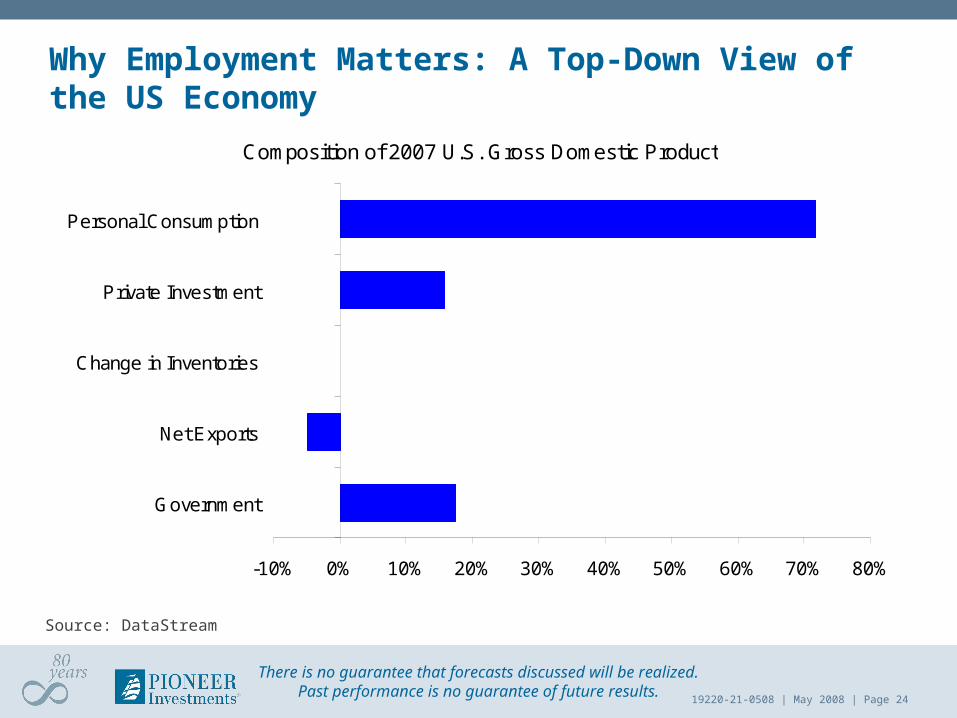
Why Employment Matters: A Top-Down View of the US Economy
Source: DataStream
Composition of 2007 U.S. Gross Domestic Product
-10% 0% 10% 20% 30% 40% 50% 60% 70% 80%
Government
Net Exports
Change in Inventories
Private Investment
Personal Consumption
19220-21-0508 | May 2008 | Page 25
There is no guarantee that forecasts discussed will be realized.Past performance is no guarantee of future results.
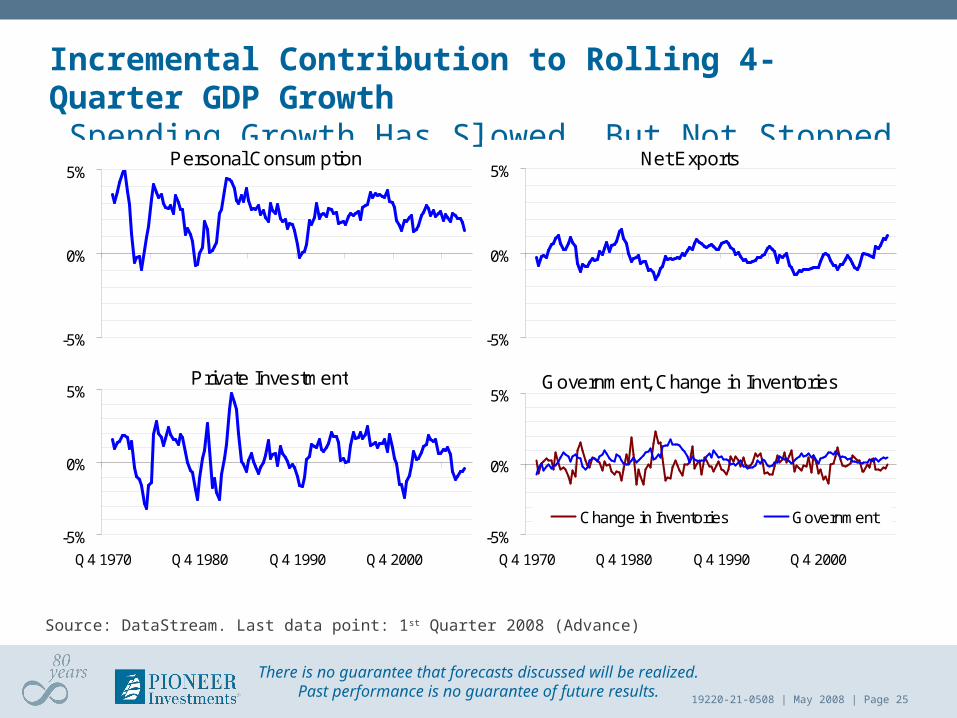
Incremental Contribution to Rolling 4-Quarter GDP Growth Spending Growth Has Slowed, But Not Stopped
Source: DataStream. Last data point: 1st Quarter 2008 (Advance)
Personal Consumption
-5%
0%
5%
Private Investment
-5%
0%
5%
Q4 1970 Q4 1980 Q4 1990 Q4 2000
Government, Change in Inventories
-5%
0%
5%
Q4 1970 Q4 1980 Q4 1990 Q4 2000
Change in Inventories Government
Net Exports
-5%
0%
5%
19220-21-0508 | May 2008 | Page 26
There is no guarantee that forecasts discussed will be realized.Past performance is no guarantee of future results.
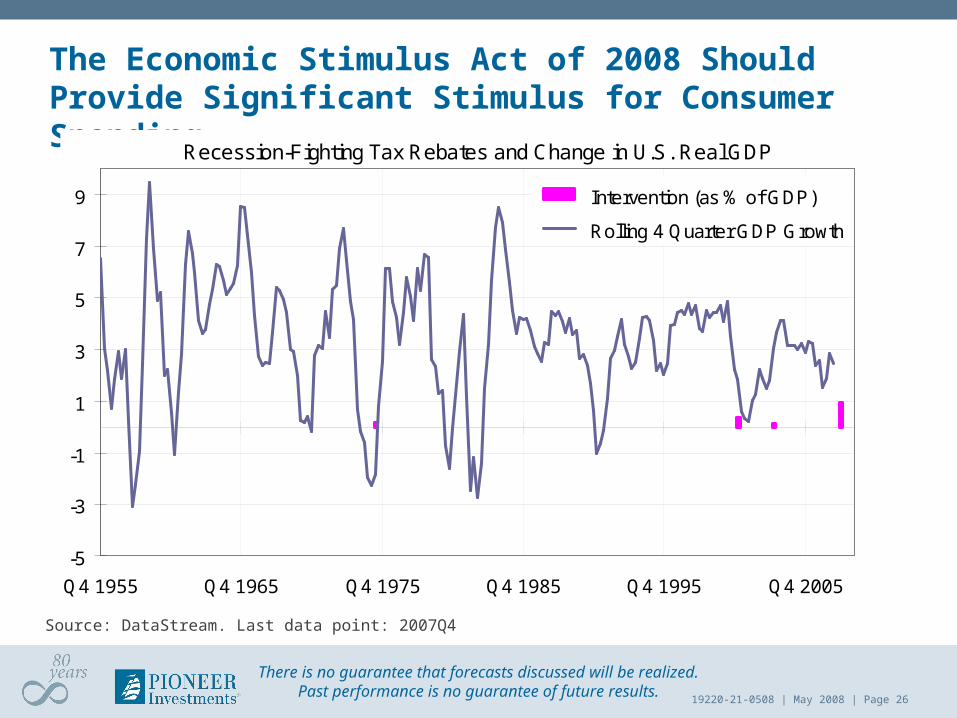
The Economic Stimulus Act of 2008 Should Provide Significant Stimulus for Consumer Spending
Source: DataStream. Last data point: 2007Q4
Recession-Fighting Tax Rebates and Change in U.S. Real GDP
-5
-3
-1
1
3
5
7
9
Q4 1955 Q4 1965 Q4 1975 Q4 1985 Q4 1995 Q4 2005
Intervention (as % of GDP)
Rolling 4 Quarter GDP Growth
19220-21-0508 | May 2008 | Page 27
There is no guarantee that forecasts discussed will be realized.Past performance is no guarantee of future results.
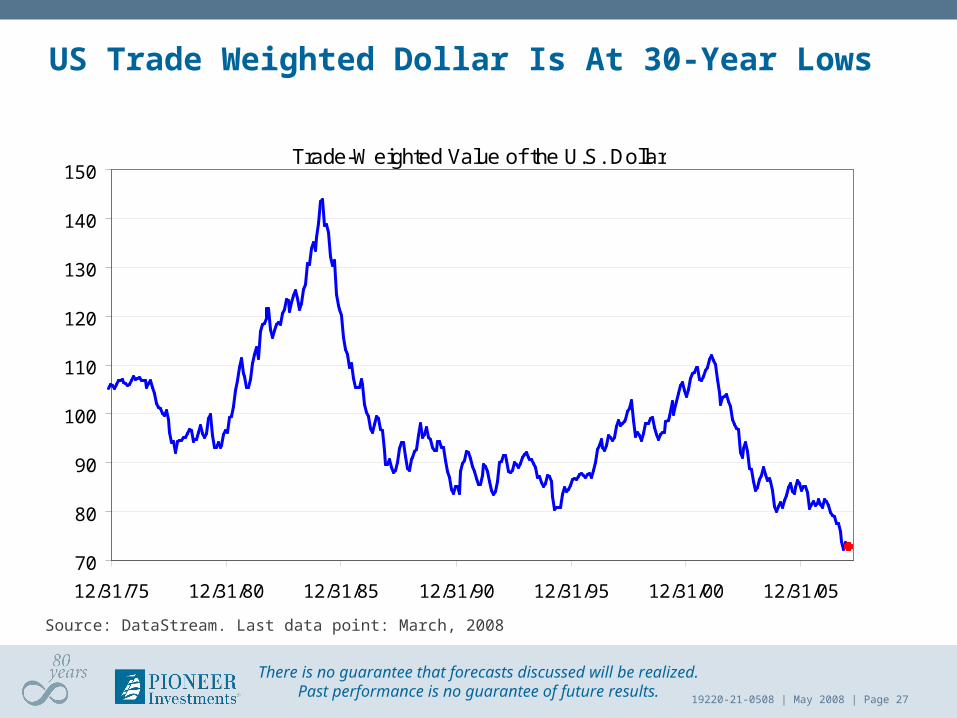
US Trade Weighted Dollar Is At 30-Year Lows
Source: DataStream. Last data point: March, 2008
Trade-Weighted Value of the U.S. Dollar
70
80
90
100
110
120
130
140
150
12/31/75 12/31/80 12/31/85 12/31/90 12/31/95 12/31/00 12/31/05
19220-21-0508 | May 2008 | Page 28
There is no guarantee that forecasts discussed will be realized.Past performance is no guarantee of future results.
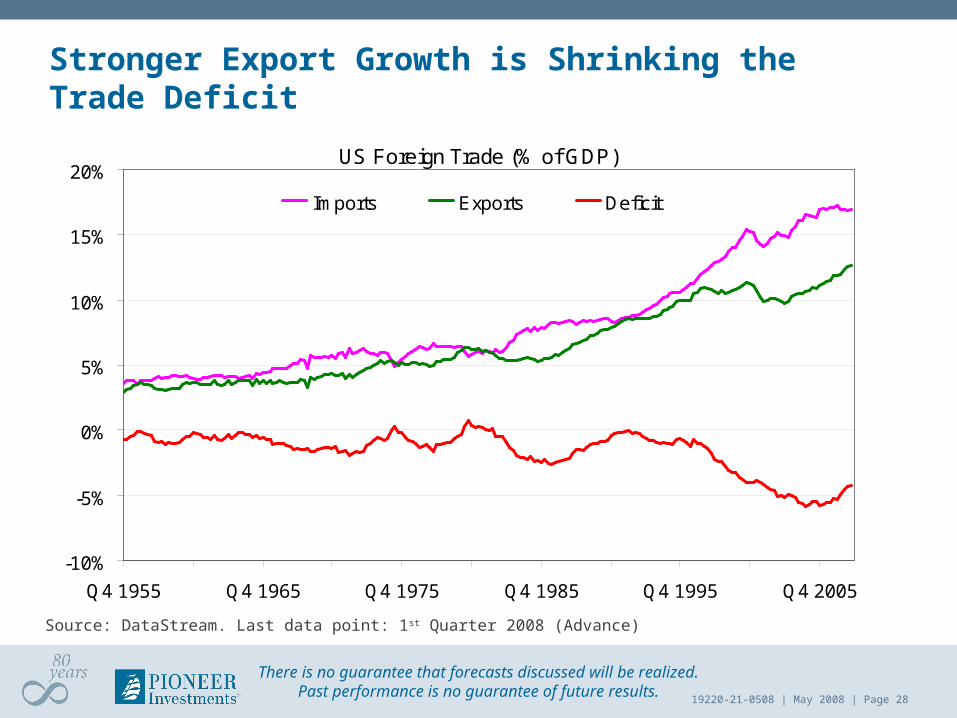
Stronger Export Growth is Shrinking the Trade Deficit
Source: DataStream. Last data point: 1st Quarter 2008 (Advance)
US Foreign Trade (% of GDP)
-10%
-5%
0%
5%
10%
15%
20%
Q4 1955 Q4 1965 Q4 1975 Q4 1985 Q4 1995 Q4 2005
Imports Exports Deficit
19220-21-0508 | May 2008 | Page 29
There is no guarantee that forecasts discussed will be realized.Past performance is no guarantee of future results.
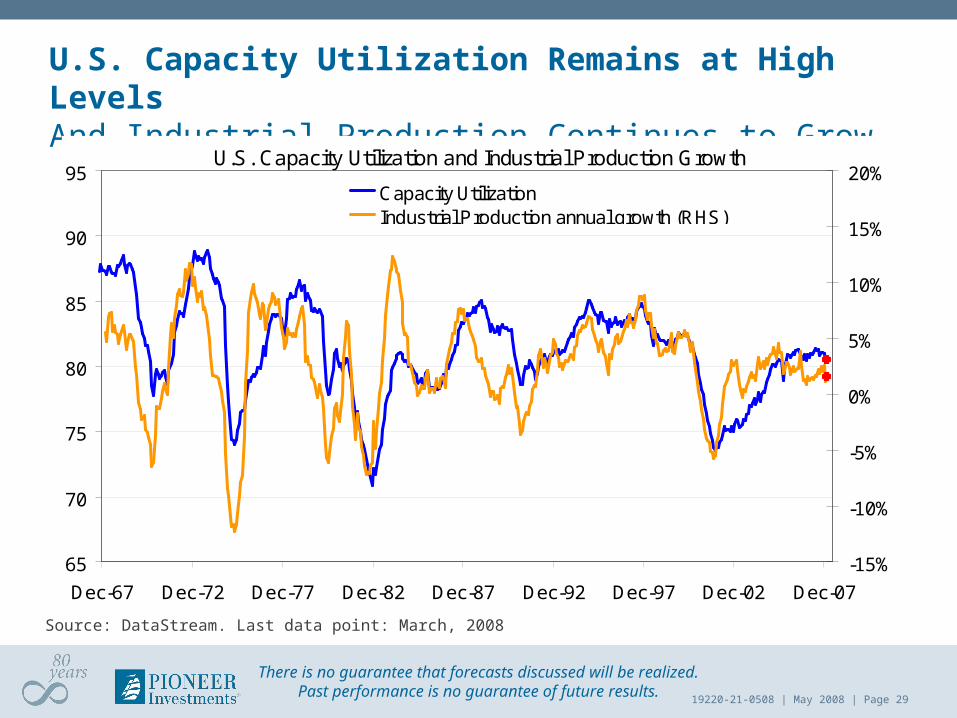
U.S. Capacity Utilization Remains at High Levels And Industrial Production Continues to Grow
Source: DataStream. Last data point: March, 2008
U.S. Capacity Utilization and Industrial Production Growth
65
70
75
80
85
90
95
Dec-67 Dec-72 Dec-77 Dec-82 Dec-87 Dec-92 Dec-97 Dec-02 Dec-07
-15%
-10%
-5%
0%
5%
10%
15%
20%Capacity UtilizationIndustrial Production annual growth (RHS)

19220-21-0508 | May 2008 | Page 30
There is no guarantee that forecasts discussed will be realized.Past performance is no guarantee of future results.
Losses in the Financial Sector Have Stalled Profit GrowthProfit Growth Outside the Financial Sector Remains Solid
Source: DataStream. Last data point: 4th Quarter 2007
U.S. After-Tax Corporate Profits (log scale)
Q4 1950 Q4 1960 Q4 1970 Q4 1980 Q4 1990 Q4 2000
19220-21-0508 | May 2008 | Page 31
There is no guarantee that forecasts discussed will be realized.Past performance is no guarantee of future results.
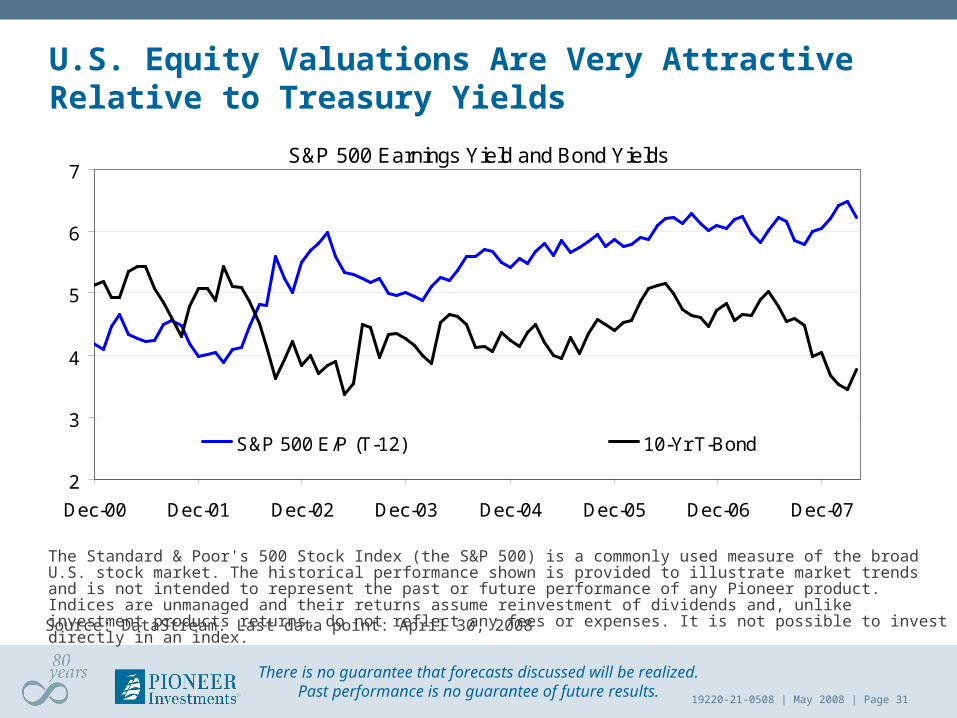
U.S. Equity Valuations Are Very Attractive Relative to Treasury Yields
The Standard & Poor's 500 Stock Index (the S&P 500) is a commonly used measure of the broad U.S. stock market. The historical performance shown is provided to illustrate market trends and is not intended to represent the past or future performance of any Pioneer product. Indices are unmanaged and their returns assume reinvestment of dividends and, unlike investment products returns, do not reflect any fees or expenses. It is not possible to invest directly in an index. Source: DataStream. Last data point: April 30, 2008
S&P 500 Earnings Yield and Bond Yields
2
3
4
5
6
7
Dec-00 Dec-01 Dec-02 Dec-03 Dec-04 Dec-05 Dec-06 Dec-07
S&P 500 E/P (T-12) 10-Yr T-Bond
19220-21-0508 | May 2008 | Page 32
There is no guarantee that forecasts discussed will be realized.Past performance is no guarantee of future results.
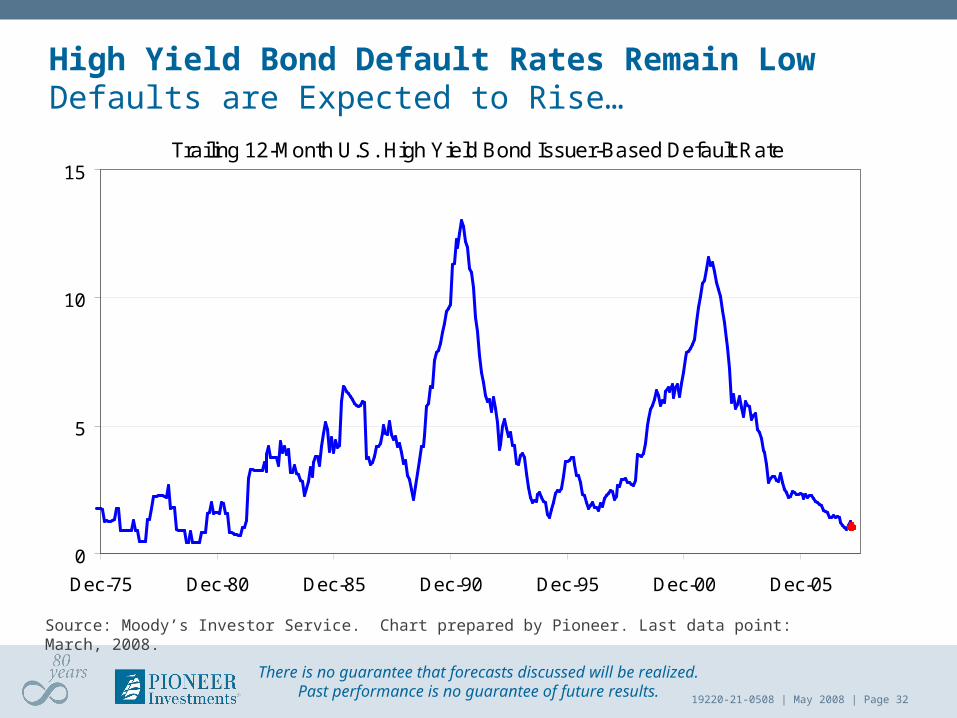
High Yield Bond Default Rates Remain LowDefaults are Expected to Rise…
Source: Moody’s Investor Service. Chart prepared by Pioneer. Last data point: March, 2008.
Trailing 12-Month U.S. High Yield Bond Issuer-Based Default Rate
0
5
10
15
Dec-75 Dec-80 Dec-85 Dec-90 Dec-95 Dec-00 Dec-05

19220-21-0508 | May 2008 | Page 33
There is no guarantee that forecasts discussed will be realized.Past performance is no guarantee of future results.
Credit Spreads Remain Extremely Wide After the Flight to QualitySpreads Have Narrowed Slightly Since Mid-March
Source: Bloomberg. Last data point: April 30, 2008
US Investment Grade
0
50
100
150
200
250
300
Dec-88 Dec-92 Dec-96 Dec-00 Dec-04
Mortgages
0
50
100
150
200
Dec-97 Dec-00 Dec-03 Dec-06
US High Yield
0
300
600
900
Dec-89 Dec-93 Dec-97 Dec-01 Dec-05
Global HY, ex-US
0
300
600
900
1200
Dec-99 Dec-02 Dec-05
+3 sd
+2 sd
+1 sd
Average
-1 sd
-2 sd

19220-21-0508 | May 2008 | Page 34
There is no guarantee that forecasts discussed will be realized.Past performance is no guarantee of future results.
Wider Spreads Were Largely the Product of Lower Treasury Yields Investment-Grade Corporate Bond Yields Have Not Risen Dramatically
Source: Bloomberg. Last data point: April 30, 2008
US Bond Index Yields
0
1
2
3
4
5
6
7
8
9
Dec-04 Dec-05 Dec-06 Dec-07
10-yr Treasury Lehman BAA Credit
Lehman AA Credit Merill Lynch BB Corporate
19220-21-0508 | May 2008 | Page 35
There is no guarantee that forecasts discussed will be realized.Past performance is no guarantee of future results.
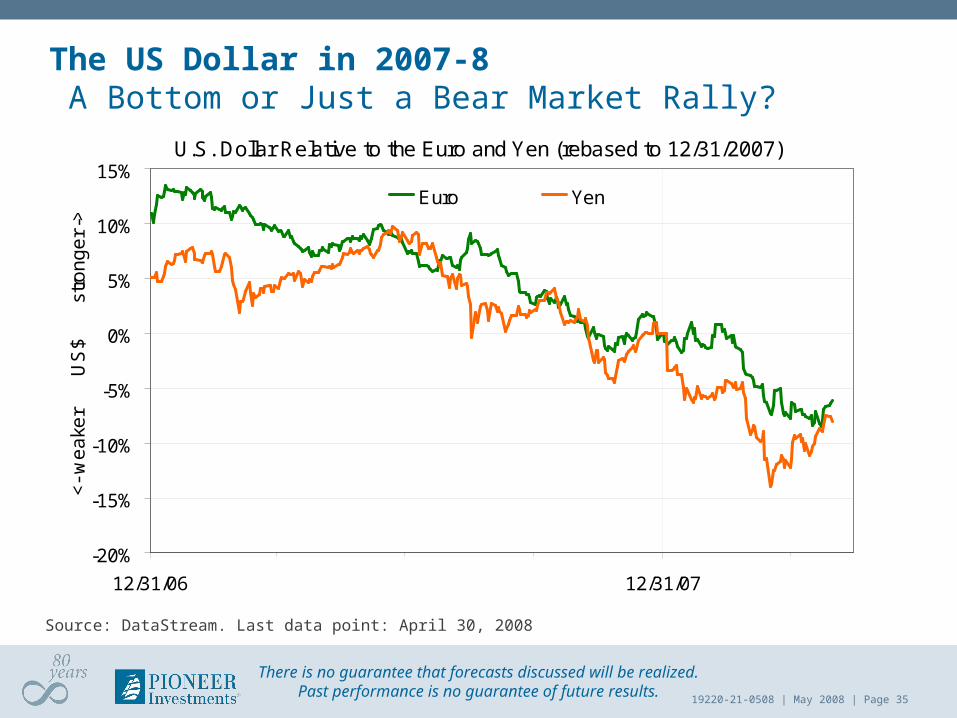
The US Dollar in 2007-8 A Bottom or Just a Bear Market Rally?
Source: DataStream. Last data point: April 30, 2008
U.S. Dollar Relative to the Euro and Yen (rebased to 12/31/2007)
-20%
-15%
-10%
-5%
0%
5%
10%
15%
12/31/06 12/31/07
<-
we
ake
r
U
S$
str
on
ge
r ->
Euro Yen

19220-21-0508 | May 2008 | Page 36
There is no guarantee that forecasts discussed will be realized.Past performance is no guarantee of future results.
U.S. Economic and Market OutlookSummary
The economy can avoid recession in 2008
+ weak dollar, fiscal stimulus, accommodative monetary policy
- House prices, credit availability, systemic risk
Home prices are a key source of risk
There is elevated risk of systemic failures in the financial system
Investor psychology remains dominated by fear
Valuations appear to reflect market technical conditions more than underlying fundamentals

19220-21-0508 | May 2008 | Page 37
There is no guarantee that forecasts discussed will be realized.Past performance is no guarantee of future results.
Global Tactical Asset Allocation Outlook – April 24, 2008
Global Equities
– US
– Europe
– Japan
– Emerging Markets
Bonds– US Government
– European Government
– Japanese Government
– US Inv. Grade Corporate
– US High Yield Corporate
– European Corporate
US Cash/Liquidity
U.S. Dollar
Yen
Euro
Source: Pioneer Investments Global Asset Allocation Committee. Last update: April 24, 2008
19220-21-0508 | May 2008 | Page 38
There is no guarantee that forecasts discussed will be realized.Past performance is no guarantee of future results.
Investment Suitability Is Important
Pioneer Investment Management USA, Inc. 60 State Street
Boston, Massachusettswww.pioneerinvestments.com
2008 Pioneer Investments
There is no guarantee that forecasts discussed will be realized.
The views expressed in this presentation are those of the investment professional and are subject to change at any time. These views do not necessarily reflect the views of Pioneer or others in the Pioneer organization.
Learn MoreFor information about Pioneer Investments or Pioneer products and services, visit us at www.pioneerinvestments.com
19220-21-0508 | May 2008 | Page 39
There is no guarantee that forecasts discussed will be realized.Past performance is no guarantee of future results.
Glossary of TermsThe consumer price index (CPI) is a statistical time-series measure of a weighted average of prices of a specified set of goods and services purchased by consumers. The CPI measure of core inflation systematically excludes food and energy prices because they are highly volatile.
The federal funds rate is the interest rate at which depository institutions lend balances (federal funds) at the Federal Reserve to other depository institutions overnight.
The Goldman Sachs Commodity Index is a composite index of commodity sector returns, representing an unleveraged, long-only investment in commodity futures that is broadly diversified across the spectrum of commodities. The returns are calculated on a fully-collateralized basis with full reinvestment. The combination of these attributes provides investors with a representative and realistic picture of realizable returns attainable in the commodities markets.
Government Bonds and Treasury Bills are guaranteed by the US government as to the timely payment of principal and interest and, if held to maturity, offer a fixed rate of return and fixed principal value.
A Treasury Inflation-Protected Security (TIPS) is identical to a treasury bond except that principal and coupon payments are adjusted to eliminate the effects of inflation.
The Standard & Poor's 500 Stock Index (the S&P 500) is a commonly used measure of the broad U.S. stock market.
Indices are unmanaged and it is not possible to invest directly in an index.