Embed Size (px)
Citation preview

The Value of Time and Banner Ad Click-through
Euijin Ahn Yeungnam University
Steven Edwards
Michigan State University
Prepared for the 2002 International Communication Association Conference
November 1, 2001
The Value of Time and Banner Ad Click-through
ABSTRACT
The paper reports on if and when banner ad affects click-through. Two 2 x 2 between-subjects
factorial designs employing 121 student participants were used to test specific hypotheses. In
Study 1, the factors are speed of modem connection (fast vs. slow) and involvement (high vs.
low). In Study 2, the factors are time for task (rush vs. no rush) and involvement (high vs. low).
This study found that involvement and connection speed affected click-through, but they did so
additively. Implications for web advertisers are discussed.

1
The Value of Time and Banner Ad Click-through
The death of the ubiquitous banner ad may have been overstated. Even with the recent
turbulence surrounding e-businesses, advertising expenditures on the World Wide Web have
climbed to $8.2 billion in less than seven years (IAB 2001). It appears that companies still view
the web as a viable advertising medium. In particular, the banner generates the greatest online
advertising revenues, accounting for over 48% in 2000. However, given that banners have
become so commonplace and click-through rates have fallen to under .5% (Rossiter and Bellman
1999), an understanding of why consumers fail to click-through is needed.
Both industry researchers and scholars note that waiting time is a significant barrier to the
future success of the Internet as a commercial medium. The literature on service evaluation
suggests a negative relationship between waiting time and service quality evaluations (Katz,
Larson, & Larson, 1991; Taylor, 1994). Within a computer-based context, it has been shown that
system response time is negatively related to computer user satisfaction (Schleifer & Amick,
1989).
It is expected that this waiting time also affect viewers’ click-through on banner ads.
Waiting time during Web surfing can be defined as the download time needed before surfers can
process requested information. Because time is considered by many to be a scarce resource
(Leclerc, Schmitt, & Dubé, 1995), waiting time in the Web process may also imply a resource
investment (or additional cost) to viewers. Understanding perceptions of these costs may help
explain whether consumers are willing to click-through banner ads.
Banner Advertising
Banner ads are generally hyperlinked to an advertiser’s website (Hoffman, Novak, and
Chatterjee 1995) and have been defined by Ellsworth and Ellsworth (1997) as, “small graphic
buttons or images containing tempting information, inviting users to click for more information”
2
(p 87). Since AT&T first advertised on HotWired.com in 1994 (Zeff and Aronson 1999), there
has been tremendous growth in the use of banner ads. In 2000, banner ad revenue ($3.8 billion)
surpassed outdoor ad revenue ($1.8 billion), and is quickly approaching the $4.8 billion spent in
business newspapers (IAB 2001).
Even with this predominant status, banner ads have been criticized for declining click
through rates. Considering that banners had been generating click through rates around 25%
when first introduced, it seems that web viewers are no longer as motivated or as curious as they
once were about banner ads (Gimein 1999). This phenomenon may be a dilemma for web
advertisers (e.g., online retailers) who had placed great importance on the banner as a means of
generating site traffic.
However, Briggs and Hollis (1997) argue that banner ads can also be effective in building
brands. They reported that a single exposure to a banner produces up to a 50% increase in
consumer loyalty and as high as a 200% increase in brand awareness. Savitz (1999) warns that
the effectiveness of banner ads to build brands might be limited, because advertisers of low
involvement products such as soft drinks, toothpaste, and laundry detergent will have a hard time
differentiating their brands from the competition by relying on small rectangular boxes.
Therefore, Savitz (1999) argues that, “banner ads make more sense for advertisers seeking an
immediate response-an online purchase or registration-than for brand advertising.”
From the currently available research, banner ads seem to have problems with both click-
through and brand building. To overcome these problems, banner advertisers have been
experimenting with various techniques for displaying banner ads using advanced rich media
technology. For example, Microsoft recently introduced “enRiched,” a company that has created
banner ads that allow for increased information display without leaving the current page. This
technology allows users to “mouse-over” the banner and reveal new information, or use the
3
cursor to expand the size of the banner on top of the current page (enRiched Media 2001). These
techniques do not open a new window, and do not request new information. That means there is
no download time and thus no waiting time for consumers.
Brand Building Versus Click-through
Banner ads are conceptually similar to direct response advertising using traditional
media. According to Rossiter and Percy (1997), direct response advertising calls for “immediate
behavioral action and is directed at a relatively narrow target audience” (p. 439). If banner
advertising is conceptualized as a form of direct response, then we can consider the goal as click-
through. However, Rossiter and Percy also suggest that direct response advertising requires a
narrowly defined target audience, because list quality accounts for 40% of direct mail
effectiveness. This requirement distinguishes banner advertising from other forms of direct
response advertising, as most banners are posted on search engines or other popular sites without
sophisticated methods of targeting (The Economist 1999). So as currently practiced, banner ads
serve double duty, seeking to enhance company or brand attitudes, as well as to induce a direct
response (Rossiter and Percy). However, as both attitude shift (brand building) and click-through
(direct response) effects as described by Harvey (1997) can be seen in response to banner ads,
one has to wonder why there is such a weak relationship between advertising exposure and click-
through.
To answer this question, we must first understand the relationship between attitude and
behavior. For advertisements in traditional media, it may be reasonable to expect a strong
relationship between brand attitude and purchase behavior. Thus, if an advertisement can create a
favorable brand attitude, it is likely to increase attitude toward purchase and purchase behavior.
For banner advertising, however, click-through is an action requiring an immediate response.
When faced with traditional ads, purchase of the brand generally occurs with a time delay.

4
However, click-through must occur immediately. For example, a viewer may believe that “the
NextCard Visa advertised by a banner ad is a low-APR credit card” whereas she may also
believe that “clicking the banner ad for NextCard will interrupt web surfing.” Viewers may have
a compelling motivation to process web materials which might suppress their immediate
responses to banner ads. As Fishbein and Ajzen (1975) argue, an explanation for a person’s
behavior may differ from the reasons she has a particular attitude toward the target. Particularly,
this conceptual framework might explain why viewers do not click banner ads even when faced
with persuasive banner ads that elicit favorable attitudes.
Banner Ads, Involvement, and Click-through
The relationship between attitude formation and behavior when faced with banner ads
may be moderated by the degree to which people are involved with their activity while online.
Involvement is particularly relevant to the effectiveness of brand building and click through
behavior, as: (1) involvement has been found to moderate the effects of various advertising
executional cues (Petty, Cacioppo, and Schumann 1983), and (2) involvement itself is reported to
explain up to 80 % of the variance in advertising recall (Ducoffe 1996). Further, consumers have
been found to process advertising messages differently when involved to different degrees. Thus
involvement can be used to explain why and when banner ads are an effective indicator of
attitude change and click-through behavior.
The heuristic-systematic model (HSM) assumes “that the primary processing goal of
accuracy-motivated recipients is to assess the validity of persuasive messages, and that there are
two mediational paths to persuasion” (Eagly and Chaiken 1993, p. 326). Chaiken and her
colleagues (1989) define systematic processing as a logical, analytical, and comprehensive
processing of information to gain accurate attitudes whereas heuristic processing is “a more
limited mode of information processing that requires less cognitive effort and fewer cognitive
5
resources than systematic processing” (Eagly and Chaiken 1993, p. 327). The HSM provides a
useful theoretical framework in which to examine when banner ads affect click-through.
Industry studies that report much of the research on banner advertising is difficult to
assess due to their focus on results and recommendations without reporting the methods and
analyses. However, a few studies are found in the academic literature that report on the
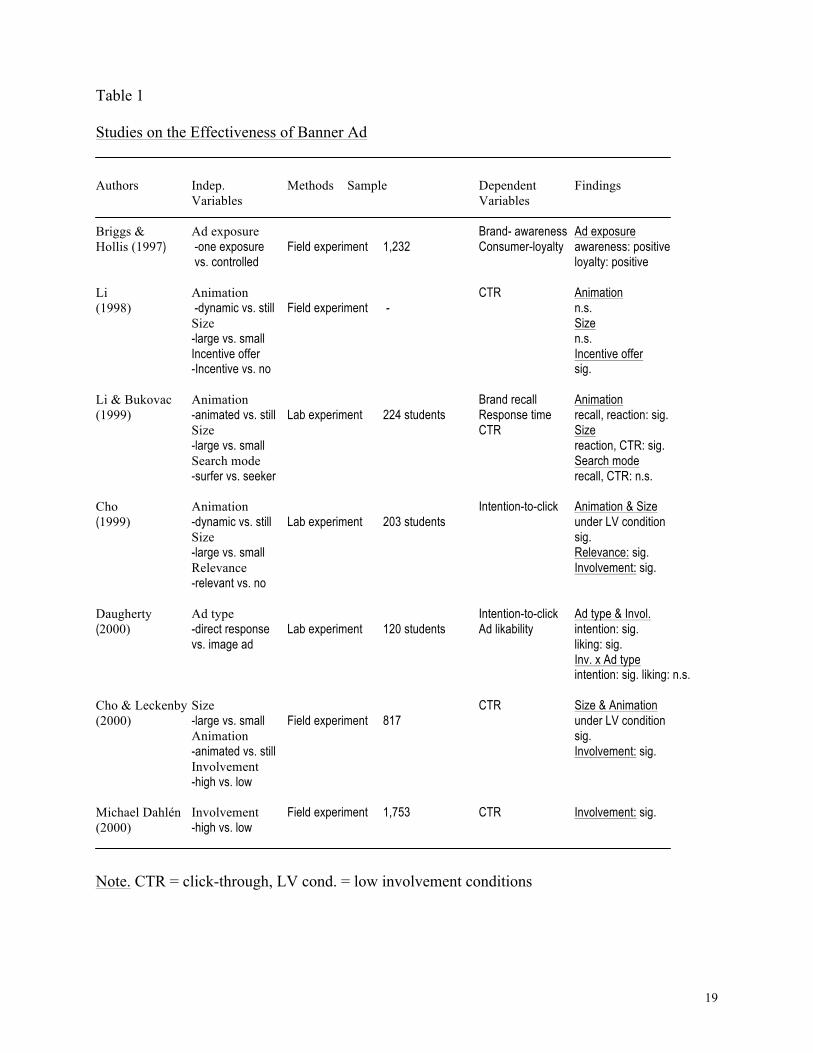
effectiveness of banner advertising. Most of the research focused on click-through behavior as
the major dependent variable. Although brand building is another important aspect of banner
advertising as a criterion of the industry evaluation of banner ads (see an example at
http://www.adrelevance.com), 6 of 7 academic studies examined the effectiveness of banner
advertising using only click-through (see Table 2 for a review).
Interestingly, several studies (Cho 1999; Dahlén 2000; Daugherty 2000) consistently
found a main effect of product involvement on click-through behavior. The studies concluded
that banner ads for high involvement products were clicked more than banner ads for low
involvement products. According to the HSM, people are motivated to assess message validity or
to have a correct attitude when they process a persuasive message. Thus, people continue to
invest whatever amount of effort is required to attain a sufficiently confident assessment of
message validity. Sufficient confidence is achieved when people’s actual confidence equals or
exceeds a sufficiency threshold, which is a desired amount of judgmental confidence (see Eagly
and Chaiken 1993).
In order to meet a high sufficiency threshold, highly involved viewers might be more
motivated to invest their resources, and might be more likely to click banner ads compared with
less involved viewers. Because click-through brings more information, which in turn requires
further cognitive effort, less involved viewers would not be motivated to click banner ads as they
do not need more information about the brand. Consequently:

6
H1: Viewers are more likely to click banner ads when they are in high involvement conditions than when they are in low involvement conditions.
Highly involved viewers might be motivated to click banner ads due to their increased
need for confidence. However, click-through generally requires viewers’ time (i.e., waiting time
to download material and processing time of the downloaded material) and cognitive effort to
process the downloaded material. The relative value of time resources is likely to affect click-
through behavior on banner ads. For example, viewers may have slow Internet connections and
therefore perceive greater costs in click-through than people with faster connections. An
alternative conceptualization of time costs may be related to situational variables. Viewers who
have enough time to complete their online task are not likely to perceive time as a significant
resource and feel no need to rush. On the other hand, when the time for an assigned Web task is
limited, viewers may feel rushed and place a premium on time as a resource. For each condition,
a relative time value might vary remarkably. Regardless of the conceptualization of time
pressure, clicking on a banner ad may be an economical or psychological investment that
viewers are just not willing to make.
H2: Viewers who perceive the cost of clicking as high (i.e., slow speed of modem connection or completing a task when rushed) should be less likely to click on banner ads, than those who do not perceive the cost as high.
Method
Design and Participants
Two experiments were conducted to test the two conceptualizations of waiting time
described in the literature review. The experiments used 2 x 2 between-subjects factorial designs.
The design of the first study consisted of 2 factors: waiting time (long vs. short) and involvement
(high vs. low). The design of the second study consisted of 2 factors: Perceived waiting time
7
(rush vs. no rush) and involvement (high vs. low). A total 121 students participated in the
experiments on a voluntary basis.
Procedure, Stimuli, and Manipulation
Participants were assigned randomly to a computer, and instructed to read the screen. The
first page varied depending on whether they were in the high or low involvement group (see
Involvement Induction section below). Next, subjects were instructed to click the Web page to
see a second page designed to induce a normal viewing environment (MacInnis and Park 1991).
There, participants were instructed to read all the content on a site built for the experiment titled
PsychWeb 2001, and were told that they could scroll or click when they wanted to do so.
After they read the second page, they were asked to click the mouse to begin the
session. The web site dealt with how people judge the attractiveness of human faces. The content
was designed to attract viewers’ attention and interest to simulate web surfing behavior. When
finished, an instruction page popped up guiding them to respond to a print questionnaire.
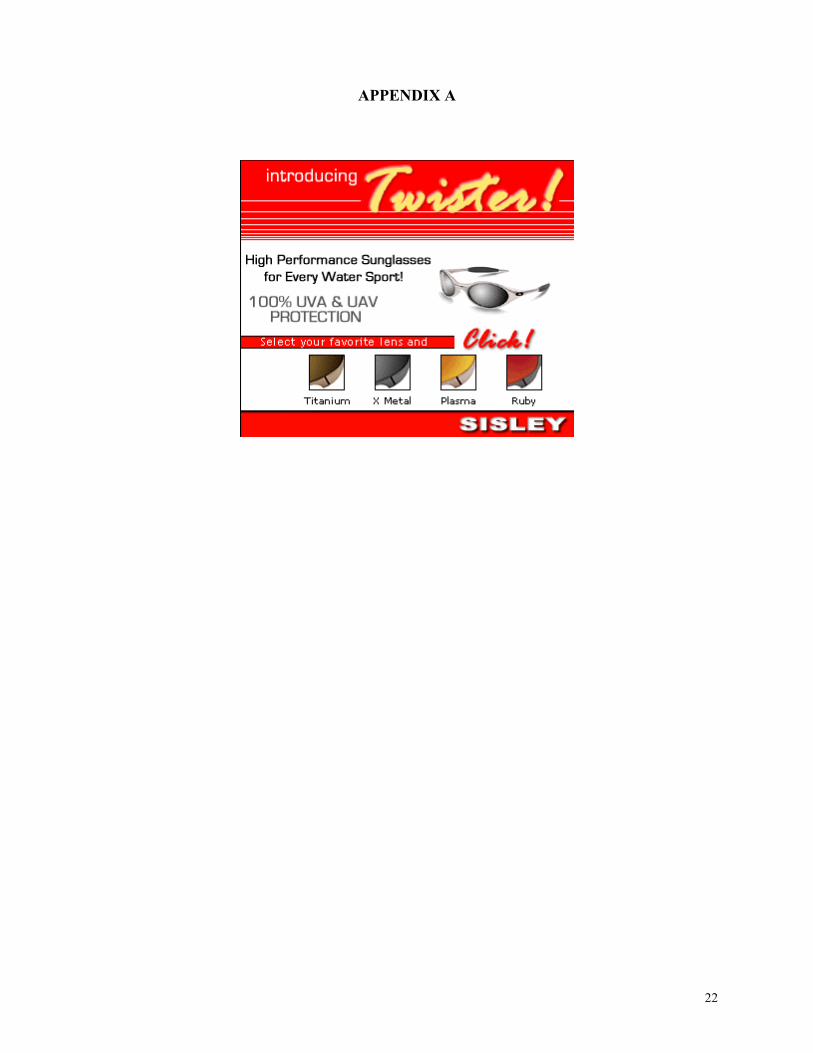
Banner Ad for Study 1 & 2
At the PsychWeb site, viewers had the opportunity to click on a banner ad that was
created for the experiment. A test banner ad for a fictitious brand of sunglasses was
professionally prepared. Sunglasses were selected for the study because it was salient for student
consumers. Similar to most banner ads in reality, each test banner ad had 5 elements (i.e.,
product picture, company logo, brand name, body copy, and call-to-action message). The size of
the banner ad was 336 by 280 pixels and was executed on a red background (see Appendix A).
Study 1 Manipulation of Slow vs. Fast Internet Connection
Given the importance of maintaining precise control over waiting time, a professional
Web designer developed a personal Web site. The delivery speed of information was altered
8
using the Adobe Photoshop™ software package. Because it is technically difficult to vary
modem speed of the computers in the computer lab, speed of connection was defined by the
number of invisible (i.e., a transparent color that viewers cannot actually recognize) snow balls
designed to activate the experimental web pages. The average file size of the fast connection
condition was 6,784 bytes (i.e., the connection speed of a cable modem: the speed of data going
through the cable modem is about 100 times faster than in a standard 56K computer) whereas the
size of the slow connection condition was 10,647 bytes (i.e., the average waiting time of the
three web pages was around 14 seconds to download). Simply put, the large file web page loads
more slowly simulating a slower modem speed, but is otherwise identical to the small file web
page. Half of the participants were assigned to the fast connection conditions, and the other half
to the slow connection conditions.
Study 2 Manipulation of Rush vs. No Rush Condition
The time for task was varied by different instructions during the participants’ processing
of the Web site. To induce the rush conditions, the following two instructions were inserted
between the Web pages:
• Between the first page and the second page of the experimental Web site. Sorry to interrupt your Web viewing. Your processing speed is somewhat slower than the average speed of other students. Your reading speed is a very important factor in this study. Can you please try to read more quickly.
• Between the second page and the third (last) page of the Web site.
Sorry again! Your Web processing is still slow compared the average of other students. Please try to read more quickly.
To induce the no-rush conditions, the instructions read:
• Between the first page and the second page of the Web site. Sorry to interrupt your Web viewing. Your processing speed is somewhat faster than the average speed of other students. Your reading speed is a very important factor in this study. Please take your time and read more carefully.
• Between the second page and the third (last) page of the Web site.

9
Sorry again! Your Web processing is still fast compared the average of other students. Please take your time and read more carefully.
Involvement Induction
Involvement was varied by outcome-relevance instructions because “they make salient to
message recipients the relevance of an issue to their currently important goals or outcomes
(Johnson and Eagly 1989, p. 292).” First of all, participants were told that the purpose of the
experiment was to obtain their responses to a new brand of sunglasses. However, to induce high
involvement, half of the participants were told that: (1) the sunglasses will be introduced during
the summer to the local area, (2) according to Consumer Reports, there are substantial
differences in quality and style among leading brands of sunglasses (see Park and Young 1986),
and (3) Their responses to the brand would provide critical information to the marketer and
researchers. Participants in this high involvement condition were also informed they would make
a choice between $1 cash payment as compensation for participation, or a chance to win the
advertised sunglasses.
For the low involvement condition, participants were told that: (1) the sunglasses would
be introduced next year in a different region of the country, (2) according to Consumer Reports,
there are few differences in quality among leading brands of sunglasses, and (3) They would be
given a chance to be selected as a winner of one of three $10 cash gifts among three hundred
participants.
The banner ad for the sunglasses was expected to be more personally relevant to
participants who anticipated that they could immediately purchase the brand. Also, involvement
was expected to be high (or low) when emphasizing critical differences (or no differences)
among leading brands of sunglasses (Park and Young 1986). In addition, the sunglasses ad was
expected to be more personally relevant to participants who anticipated making a choice if they
10
received either the cash or the product than to those expecting to receive only a low probability
chance to win a small cash gift (see Celsi and Olson 1988; Miniard, Bhatla, Lord, Dickson, and
Unnava 1991; Petty, Cacioppo, and Schumann 1983). A pretest using 30 students confirmed that
the involvement induction worked as intended (t(28)=2.40, p=.023).
Dependent Measures
Click-through was measured by differentiating ID numbers that were self- reported on the
print questionnaire. If the participant clicked on the concluding text, a new web page opened up
with the assigned ID number. If the participant instead clicked on the banner ad, a page opened
assigning a different ID number. Involvement was measured to check if the induction worked. As
high-involvement viewers should attend to a banner ad more than low-involvement viewers
(MacInnis and Park 1991), involvement is assessed by a two-item scale that asked whether they
paid not much (1) or very much (7) attention to the banner ad and whether they concentrated
very little (1) or very hard (7). Finally, Demographic and Use Variables were measured such as:
age, gender, Internet-surfing hours, web content involvement, perceived mouse functionality,
perceived modem speed, and product familiarity.
Results
Data from study 1 (n=61) and study 2 (n=60) revealed that participants consisted of 37%
and 35% males and 62% and 65% females, respectively. The ages ranged from 18 to 31 years
old (M = 20.08) in study 1 and from 18 to 24 years old (M = 20.55) in study 2. Confirmatory
factor analyses were performed to assess the uni-dimensionality of each scale. The data were
fitted with the posited four-construct model (i.e., web involvement, banner ad involvement,
product knowledge, and mouse functionality). Inspection of the factor loadings and errors
produced from the discrepancy between the obtained and predicted correlations resulted in the
exclusion of no items.

11
For all participants, an average-scale score on each construct was computed. Web
involvement was represented by three items. The mean score was 4.51 (SD =1.30) and 4.51 (SD
=1.30). The reliability of this scale was assessed using coefficient alpha, and was α = .80 and
.86. Banner ad involvement was measured by two items. The mean scale score was 2.88 (SD
=1.55) and 3.10 (SD =1.74) with a reliability of α = .96 and .93. Product knowledge was
measured with two items. The mean scale score was 3.63 (SD =1.55) and 3.68 (SD =1.63) with
a reliability of α = .86 and .90. Mouse functionality also was measured with two items. The
mean scale score was 4.36 (SD =1.99) and 4.71 (SD =1.85)with a reliability of α = .77 and .70.
Each of four scales formed uni-dimensional solutions in which both checks for internal
consistency and parallelism yielded trivial errors. The other scales--perceived connection speed
(M=5.41 & 5.52), and average web surfing hours (M=2.18 & 2.77)-- were represented by a
single item.
Manipulation Checks
T-tests suggested that the involvement inductions were successful in both studies,
t(59)=2.75, r=.34, p<.01 in study 1 and t(59)=2.27, r=.29, p<.05 in study 2. The results revealed
that high involvement participants paid more attention and concentration to the banner ad
(M=3.38 and 3.60) than did low involvement participants (M=2.35 and 2.63).
A manipulation check for study 1 also showed that the participants assigned to the fast
modem speed conditions perceived a faster connection speed (M=6.00) than those assigned to
the slow modem speed conditions (M=4.88), t(59)=3.67, r=.43, p<.001.
A manipulation check for study 2 also showed that the participants who were assigned to
the rush conditions perceived faster reading speed (M=5.31) than those who were assigned to the
no-rush conditions (M=2.79), t(58)=6.29, r=.64, p<.001.

12
Two-way ANOVAs were used to assess differences among the treatment groups in the
two studies on the control variables. No differences were found in either study one or two,
p>.05.
Test of Hypotheses - Study 1
The hypotheses were tested using ANOVA to look for differences between the waiting
time and involvement groups on click-through behavior. It was expected that greater
involvement would lead to greater click-through, while greater waiting time would lead to less
click-through.
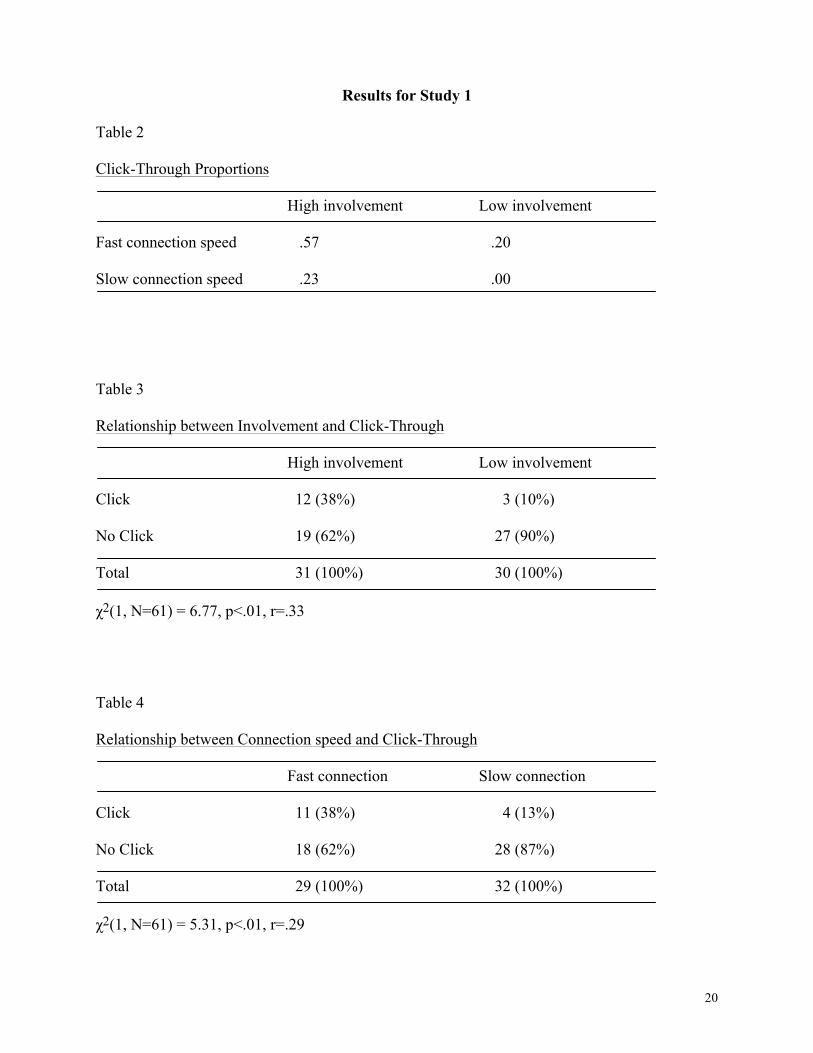
Table 2 shows no interaction effect on click-through between involvement (high vs. low)
and modem speed (long waiting vs. short waiting time for downloading). A two-way
independent groups analysis of variance also revealed no interaction effect (F(1,60)=.45, p>.10).
Because there was no interaction, a chi-square analysis was performed to assess the
relationship between involvement and click-through (see Table 3). There is a substantial effect
for involvement, χ2(1, n=61)=6.78, p<.05. The odds of someone clicking through in the high
involvement conditions is 5.68 times that of the odds of someone clicking through in the low
involvement conditions. There is also a substantial effect for waiting time, χ2(1, N=61)=5.31,
r=.29 (see Table 4). The odds of someone clicking through when the waiting time is short are
4.28 times greater than the odds of someone clicking through when the waiting time is long.
Therefore, there was support for hypotheses one and two.
Test of Hypotheses - Study 2
An identical series of analyses was conducted for the second study. The hypotheses were
tested using ANOVA to look for differences between perceived waiting time and involvement
groups on click-through behavior. It was expected that greater involvement would lead to greater
click-through, while greater task urgency would lead to less click-through.
13
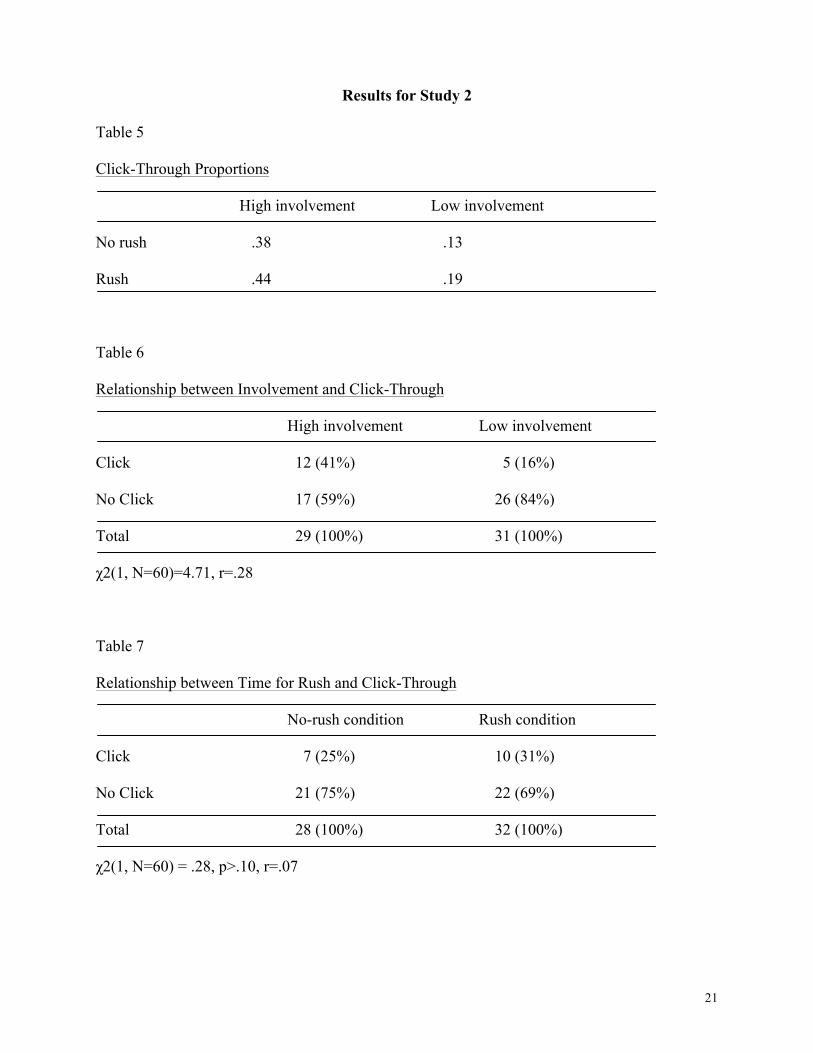
Table 5 shows no interaction effect on click-through of involvement (high vs. low) and
time for task (rush vs. no-rush). A two-way independent groups analysis of variance also
revealed no interaction effect, F(1,59) <.01, p >.10.
Because there is no interaction, a chi-square analysis was performed to examine the
relationship between involvement and click-through (see Table 6). There is a substantial effect
for involvement, χ2(1, N=60)=4.71, r=.28. The odds of someone clicking through in the high
involvement conditions is 3.44 times that of the odds of someone clicking through in the low
involvement conditions. There is no significant effect for time under rush conditions (χ2(1,
N=60) = .28, p>.10, r=.07) (see Table 7). In sum, the data are consistent with hypothesis one,
but not two or three. Only involvement affected click-through.
Discussion
Consistent with previous studies (Cho 1999; Dahlén 2000; Daugherty 2000), participants
in study one and study two were more likely to click banner ads when they were in high
involvement conditions than when they were in low involvement conditions. The findings from
study one also support literature that suggests waiting time affects viewers’ surfing behavior
(Dellaert & Kahn, 1999; Weinberg, 2000). In the context of banner advertising, study one
provided evidence that viewers are more likely to click through banner ads when they are in
short waiting time conditions than when they are in long waiting time conditions. However,
study two did not reveal similar findings. There were no differences between rush and no-rush
conditions in click-through behavior. Therefore we have mixed results.
One may raise a question, “why are viewers averse to waiting for a few seconds in their
Web surfing process?” A time cost of downloading may not be a big waste in terms of the
absolute time spent. One click-through may take only a few seconds. In addition, waiting time
does not demand any cognitive effort from viewers. Compared with waiting time in off-line
14
service process (e.g., waiting time for riding an airplane), it might be a minimal time cost.
However, it seems that waiting time in Web environments is treated with greater importance than
that in off-line service process. Interestingly, waiting time in the Web surfing process may
require something more than the actual time cost to viewers.
Understanding what that something else is, remains to be discovered. That is why further
research is needed on the ubiquitous banner ad. Some experts have claimed banner ads do not
work (e.g., click-through is .05%), however, if a lesson, or a strategy for future development of
web ad technology exists, it may be learned from our previous failures. If we understand why
most people do not click banner ads, then we gain valuable insight for future web ad
development. Also, Web advertising technology has shown remarkable speed in its
development. As a result, many academicians and practitioners in the web-advertising field
seem to be interested in new technologies and their practical applications. However, few have
raised questions of the conceptual issues of why some advertising techniques do (or do not) work
in the new medium. To fill a void in the research literature, and to establish a strong theoretical
foundation, studies questioning conceptual issues are essential to advertising research.
One interesting trend in web advertising research is that most studies investigate a direct
relationship between stimulus (ad technique) and behavioral response (click-through) without
examining intervening hypothetical constructs, e.g., brand attitude and click-through attitude.
This is because the new advertising medium provides easy-to-use online tracking software, and
click-through is a critical concern for web advertisers. However, to have a rich understanding of
the phenomenon of web ad processing, researchers need to investigate the attitude construct
“which has been postulated to motivate behavior and to exert selective effects at various stages
of information processing” (Eagley & Chaiken, 1993, p.1). In particular, the attitude toward
click-through may be a key construct to understand why people click or not click. The
15
conceptual base is derived from the idea of Fishbein and Ajzen; actions can be explained via
attitude toward the actions rather than attitude toward targets. The findings in this study also
emphasize the importance of attitude toward behavior (i.e., click-through attitude).
The findings of a waiting time effect on click-through in these studies explain one aspect
of interactive technology applications in web advertising. Recent developments of rich media
technology help viewers to save downloading or extra time effort (e.g., a drop-down menu or
direct links to a specific page, not a initial home page). In addition, the technology lets viewers
interact with banner ads without ever having to leave their current site (e.g., see examples at
http:// www.enliven.com). The greatest strength of these rich media banners may be to lessen
viewers’ processing efforts on banner ads as well as to provide rich information.
To extend the scope of this study’s findings, future research needs to employ diverse
types of products, banner shapes, and banner ad positions. Because this study used only one
product, one shape and one position of banners as the stimulus, the findings are limited to the
product, shape and position tested.
16
References
Adams, H. F. (1926), Advertising and Its Mental Laws, New York: The Macmillan Company. Briggs, R. and N. Hollis (1997), “Advertising on the Web: Is There Response before Click
-through?” Journal of Advertising Research, 37 (March/April), 33-45. Burtt, H. E. (1938), Psychology of Advertising, Cambridge, MA: The Riverside Press. Celsi, R. L. and J. C. Olson (1988), “The Role of Involvement in Attention and Comprehension
Processes,” Journal of Consumer Research, 15 (September), 210-224. Chaiken, S., A. Liberman, and A. H. Eagly (1989), “Heuristic and Systematic Information
Processing Within and Beyond the Persuasion Context,” in Unintended Thought, J. S. Uleman and J. A. Bargh, eds., New York: Guilford Press, 212-252.
Cho, C. (1999), “How Advertising Works on the WWW: Modified Elaboration Likelihood Model,” Journal of Current Issues and Research in Advertising, 21 (1), 33-50.
Cho, C. and J. D. Leckenby (1998), “Copytesting of Advertising on the WWW: Clicking Motivation Profile,” Proceedings of the 1998 Conference of the American Academy of Advertising, 26-36.
Cho, C. and J. D. Leckenby (2000), “The Effectiveness of Banner Advertisements: Involvement and Click-Through,” Paper presented at the meeting of the Association for Education in Journalism and Mass Communication, Phoenix, AZ.
Dahlén, M. (2000), “To Click or Not to Click: An Empirical Study of Response to Banner Ads for High and Low Involvement Products,” Consumption, Markets and Culture, 4 (0), 1-20.
Daugherty, T. (2000), “An Experimental Analysis of Banner Advertising: Exploring the Impact of Advertising Message Involvement. [online]. Available: http//www.ad-tech.com.
Ducoffe, R. H. (1996), “Advertising Value and Advertising on the Web,” Journal of Advertising Research, 5 (September/October), 21-34.
Eagly, A. H. and S. Chaiken (1993), The Psychology of Attitudes, Orlando, FL: Harcourt Brace Jovanovich.
Enriched Media (2001), Available online: http://advantage.msn.com/docs/case%20studies/ enriched/enriched_page1.html
Franken, R. B. (1925), The Attention-Value of Newspaper Advertisements, New York: Association of National Advertisers.
Fishbein, Martin and Icek Ajzen (1975), Belief, Attitude, Intention, and Behavior: An Introduction to Theory and Research, Reading, MA: Addison-Wesley Publishing Company.
Gimein, M. (1999), “Animating the Ad,” Industry Standard Magazine [On-line]. Available: http://www.thestandard.com
Harvey, B. (1997), “The Expanded ARF Model: Bridge to the Accountable Advertising Future,” Journal of Advertising Research, 37 (March/April), 11-20.
Hendon, D. W. (1973), “How Mechanical Factors Affect Ad Perception,” Journal of Advertising Research, 13 (August), 39-45.
Hoffman, D. L. and T. P. Novak (1996), “Marketing in Hypermedia Computer-Mediated Environments: Conceptual Foundations,” Journal of Marketing, 60 (July), 50-68.
_________ , _________ , and P. Chatterjee (1995), “Commercial Scenarios for the Web: Opportunities and Challenges,” Journal of Computer-Mediated Communication, Special Issue on Electronic Commerce, 1 (December).
Homer, P. M. (1995), “Ad Size As an Indicator of Perceived Advertising Costs and Effort: The

17
Effects on Memory and Perceptions,” Journal of Advertising, 24 (Winter), 1-12. Hoque, A. Y. and G. L. Lohse (1999), “An Information Search Cost Perspective for Designing
Interfaces for Electronic Commerce,” Journal of Marketing Research, 36 (3), 387-394. Internet Advertising Bureau (2001), “IAB Internet Advertising Revenue Report,” [online].
Available: http//www.iab.net. Internet Advertising Bureau (2001), “Internet Advertising Bureau (IAB) Issues Voluntary
Guidelines for New Interactive Marketing Units,” [online]. Available: http//www.iab.net. Johnson, B. T. and A. H. Eagly (1989), “Effects of Involvement on Persuasion: Meta-Analysis,”
Psychological Bulletin, 106 (2), 290-314. Kahneman, D. (1973), Attention and Effort, Englewood Cliffs, NJ: Prentice Hall. Kirmani, A. (1990), “The Effect of Perceived Advertising Costs on Brand Perceptions,” Journal
of Consumer Research, 17 (2), 160-171. ________ and P. Wright (1989), “Money Talks: Perceived Advertising Expense and Expected
Product Quality,” Journal of Consumer Research, 16 (December), 344-353. ________ and Valarie A. Zeithaml (1993), “Advertising, Perceived Quality, and Brand Image,”
in Brand Equity & Advertising, D. A. Aaker and A. L. Biel, eds., Hillsdale, NJ: Lawrence Erlbaum Associates, Inc., 143-161.
Li, H. (1998), “What Makes the User Click on a Banner Ad: Two Field Experimental Studies of Banner Ad Size, Type, and Incentive,” Proceedings of the 1998 Conference of the American Academy of Advertising, 183-184.
________ and J. Bukovac (1999), “Cognitive Impact of Banner Ad Characteristics: An Experimental Study,” Journalism and Mass Communication Quarterly, 76 (Summer), 341-353.
_______, S. Edwards, and J. Lee (2001), “Measuring the Intrusiveness of Internet Advertising: Scale Development and Validation,” Proceedings of the 2001 Conference of the American Academy of Advertising, 25-26.
MacInnis, D. J. and C. Park (1991), “The Differential Role of Characteristics of Music on High- and Low-Involvement Consumers’ Processing of Ads,” Journal of Consumer Research, 18 (September), 161-173.
Miniard, P. W., S. Bhatla, K. R. Lord, P. R. Dickson, and H. R. Unnava (1991), “Picture-Based Persuasion Processes and the Moderating Role of Involvement,” Journal of Consumer Research, 18 (June), 92-.
Moriarty, S. E. (1986), Creative Advertising: Theory and Practice, Englewood Cliffs, NJ: Prentice-Hall.
Park, C. and S. M. Young (1986), “Consumer Response to Television Commercials: The Impact of Involvement and Background Music on Brand Attitude Formation,” Journal of Marketing Research, 23 (February), 11-24.
Petty, R. E., J. T. Cacioppo, and D. Schumann (1983), “Central and Peripheral Routes to Advertising Effectiveness: The Moderating Role of Involvement,” Journal of Consumer Research, 10 (September), 135-146.
Rosenthal, R. and R. L. Rosnow (1985), Contrast Analysis: Focused Comparisons in the Analysis of Variance, New York: Cambridge University Press
Rossiter, J. R. and S. Bellman (1999), “A Proposed Model for Explaining and Measuring Web Ad Effectiveness,” Journal of Current Issues and Research in Advertising, 21 (Spring), 13-31.
________ and L. Percy (1997), Advertising Communications & Promotion Management, Boston, MA: McGraw-Hill.
18
Savitz, E. (1999), “Web Advertisers Search for the Promised Land,” Industry Standard Magazine, [On-line]. Available: http://www.thestandard.com
Stiff, J. B. (1994), Persuasive Communication, New York, NY: The Guilford Press. Zaichkowsky, J. (1994), “The Personal Involvement Inventory: Reduction, Revision, and
Application to Advertising,” Journal of Advertising, 23 (4), 59-70. Zeff, R. and B. Aronson (1999), Advertising on the Internet, New York: John Wiley & Sons.
19
Table 1
Studies on the Effectiveness of Banner Ad
Authors Indep. Methods Sample Dependent Findings
Variables Variables
Briggs & Ad exposure Brand- awareness Ad exposure Hollis (1997) -one exposure Field experiment 1,232 Consumer-loyalty awareness: positive vs. controlled loyalty: positive
Li Animation CTR Animation (1998) -dynamic vs. still Field experiment - n.s.
Size Size -large vs. small n.s. Incentive offer Incentive offer -Incentive vs. no sig. Li & Bukovac Animation Brand recall Animation (1999) -animated vs. still Lab experiment 224 students Response time recall, reaction: sig.
Size CTR Size -large vs. small reaction, CTR: sig.
Search mode Search mode -surfer vs. seeker recall, CTR: n.s.
Cho Animation Intention-to-click Animation & Size (1999) -dynamic vs. still Lab experiment 203 students under LV condition
Size sig. -large vs. small Relevance: sig.
Relevance Involvement: sig. -relevant vs. no
Daugherty Ad type Intention-to-click Ad type & Invol. (2000) -direct response Lab experiment 120 students Ad likability intention: sig.
vs. image ad liking: sig. Inv. x Ad type intention: sig. liking: n.s.
Cho & Leckenby Size CTR Size & Animation (2000) -large vs. small Field experiment 817 under LV condition
Animation sig. -animated vs. still Involvement: sig. Involvement -high vs. low
Michael Dahlén Involvement Field experiment 1,753 CTR Involvement: sig. (2000) -high vs. low
Note. CTR = click-through, LV cond. = low involvement conditions
20
Results for Study 1
Table 2
Click-Through Proportions
High involvement Low involvement
Fast connection speed .57 .20
Slow connection speed .23 .00
Table 3
Relationship between Involvement and Click-Through
High involvement Low involvement
Click 12 (38%) 3 (10%)
No Click 19 (62%) 27 (90%)
Total 31 (100%) 30 (100%)
χ2(1, N=61) = 6.77, p<.01, r=.33
Table 4
Relationship between Connection speed and Click-Through
Fast connection Slow connection
Click 11 (38%) 4 (13%)
No Click 18 (62%) 28 (87%)
Total 29 (100%) 32 (100%)
χ2(1, N=61) = 5.31, p<.01, r=.29
21
Results for Study 2
Table 5
Click-Through Proportions
High involvement Low involvement
No rush .38 .13
Rush .44 .19
Table 6
Relationship between Involvement and Click-Through
High involvement Low involvement
Click 12 (41%) 5 (16%)
No Click 17 (59%) 26 (84%)
Total 29 (100%) 31 (100%)
χ2(1, N=60)=4.71, r=.28
Table 7
Relationship between Time for Rush and Click-Through
No-rush condition Rush condition
Click 7 (25%) 10 (31%)
No Click 21 (75%) 22 (69%)
Total 28 (100%) 32 (100%)
χ2(1, N=60) = .28, p>.10, r=.07
22
APPENDIX A