Embed Size (px)
Citation preview
The use of SPOT and CIR aerial photography for urban planning
P. Lohmann, G. Altrogge
1. Abstract
Institute for Photogrammetry and Engineering Surveys
University of Hannover, Nienburger Strasse 1
o 3000 Hannover, Fed. Rep. of Germany
Commission VII Working Group 7
Environmental factors influencing the air, water, soil and biosphere of
a city are mainly due to the structure of the urban areas and the land use. In order to map and characterize this process an environmental description of the spatial structure of a city and its land use is required.
In this sense the use of SPOT multispectral data is evaluated in combi
nation with high altitude photography and thematic maps. Color transformations are used to differentiate between sealed and vegetation areas
together with hierarchical classification methods for the city of Hanno
ver in the north of Germany.
2. I nt roduct ion
Remote sensing as a tool for regional planning has been applied frequently
in the past using satellite imagery like Landsat MSS or Thematic Mapper.
Interpretation of this imagery yielded thematic maps of small or medium
scales. In addition traditional methods of photointerpretation of large
scale aerial photography have been applied in the field of urban planning
(Schneider 1984). This has been done normally by the use of manual interpretation of color
infrared aerial photography at scales ranging from 1 : 4.000 to 1 : 25.000.
In the city of Hannover the interpretation of CrR - photography of a scale
of 1 : 4.000 resulted in the production of a thematic map showing bio
topes with 17 major classes being further divided into 126 subgroups at a scale of 1 ; 10.000 with a resolution of better than 50 cm. As an
example part of this map is shown as a black and white reproduction in
figure 1. These maps are updated at regular intervals with actual CIR -
photography.
VII ... 196
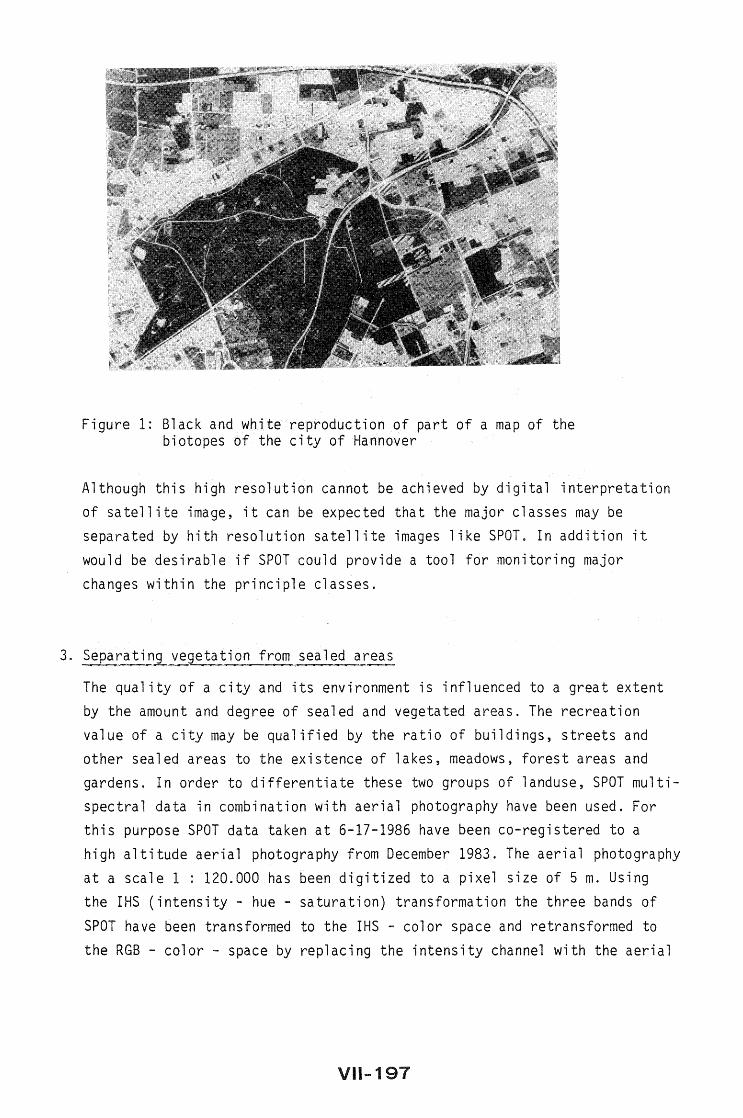
Figure 1: Black and white reproduction of part of a map of the biotopes of the city of Hannover
Although this high resolution cannot be achieved by digital interpretation of satellite image, it can be expected that the major classes may be separated by hith resolution satellite images like SPOT. In addition it would be desirable if SPOT could provide a tool for monitoring major
changes within the principle classes.
3. Separating vegetation from sealed areas
The quality of a city and its environment is influenced to a great extent by the amount and degree of sealed and vegetated areas. The recreation value of a city may be qualified by the ratio of buildings, streets and other sealed areas to the existence of lakes, meadows, forest areas and gardens. In order to differentiate these two groups of landuse, SPOT multispectral data in combination with aerial photography have been used. For this purpose SPOT data taken at 6-17-1986 have been co-registered to a high altitude aerial photography from December 1983. The aerial photography at a scale 1 : 120.000 has been digitized to a pixel size of 5 m. Using the IHS (intensity - hue - saturation) transformation the three bands of
SPOT have been transformed to the IHS - color space and retransformed to
the RGB - color - space by replacing the intensity channel with the aerial
VIl .... 197
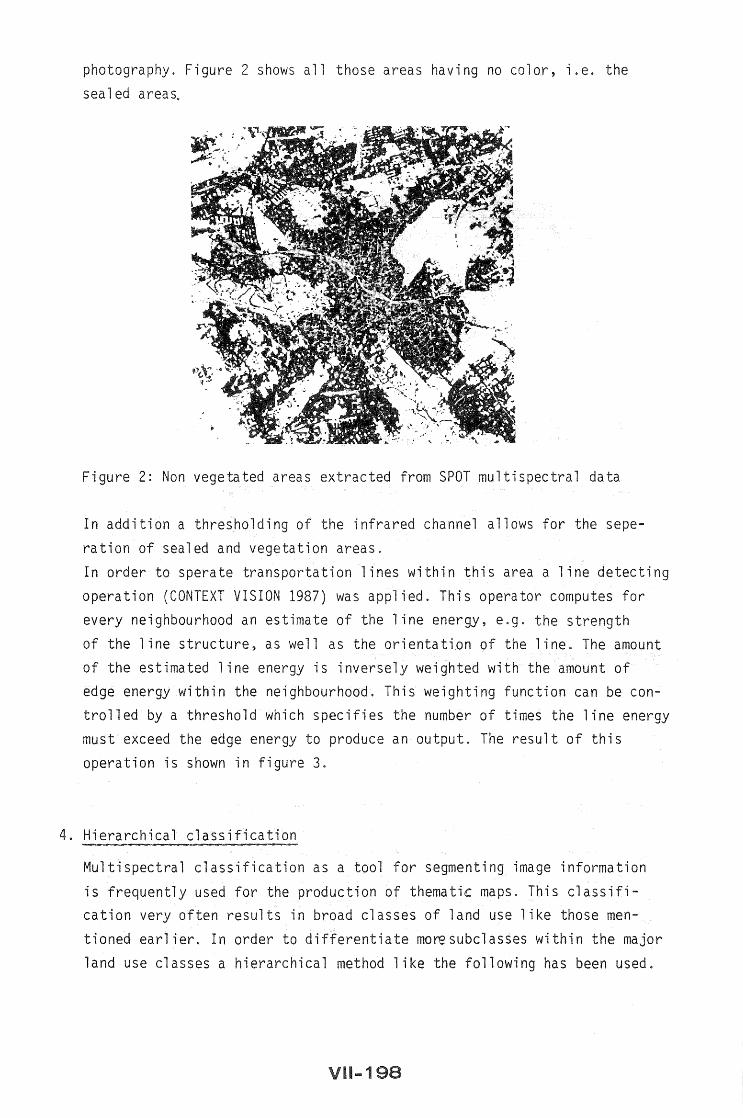
photography. Figure 2 shows all those area having no color, i.e the
sealed areas.
Figure 2: Non vegetated areas extracted from SPOT multispectral data
In addition a thresholding of the infrared channel allows for the sepe
ration of sealed and vegetation areas.
In order to sperate transportation lines within this area a line detecting
operation (CONTEXT VISION 1987) was applied. This operator computes for every neighbourhood an estimate of the line energy, e.g. the strength
of the line structure, as well as the orientation of the line. The amount
of the estimated line energy is inversely weighted with the amount of edge energy within the neighbourhood. This weighting function can be controlled by a threshold which specifies the number of times the line energy must exceed the edge energy to produce an output. The result of this
operation is shown in figure 3.
4. Hierarchical classification 8! Ji
Multispectral classification as a tool for segmenting image information
is frequently used for the production of thematic maps. This classification very often results in broad classes of land use like those men
tioned earlier. In order to differentiate mo~subclasses within the major
land use classes a hierarchical method like the lowing has been used.
1 ... 1
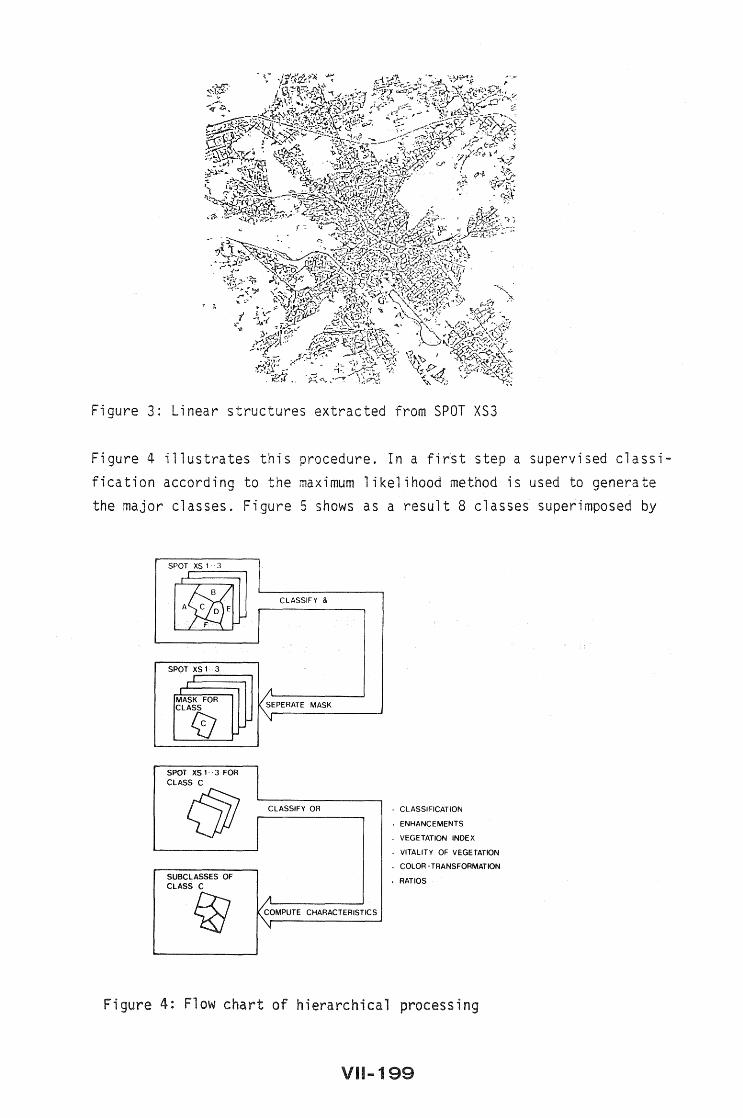
Figure 3: Linear structures extracted from SPOT XS3
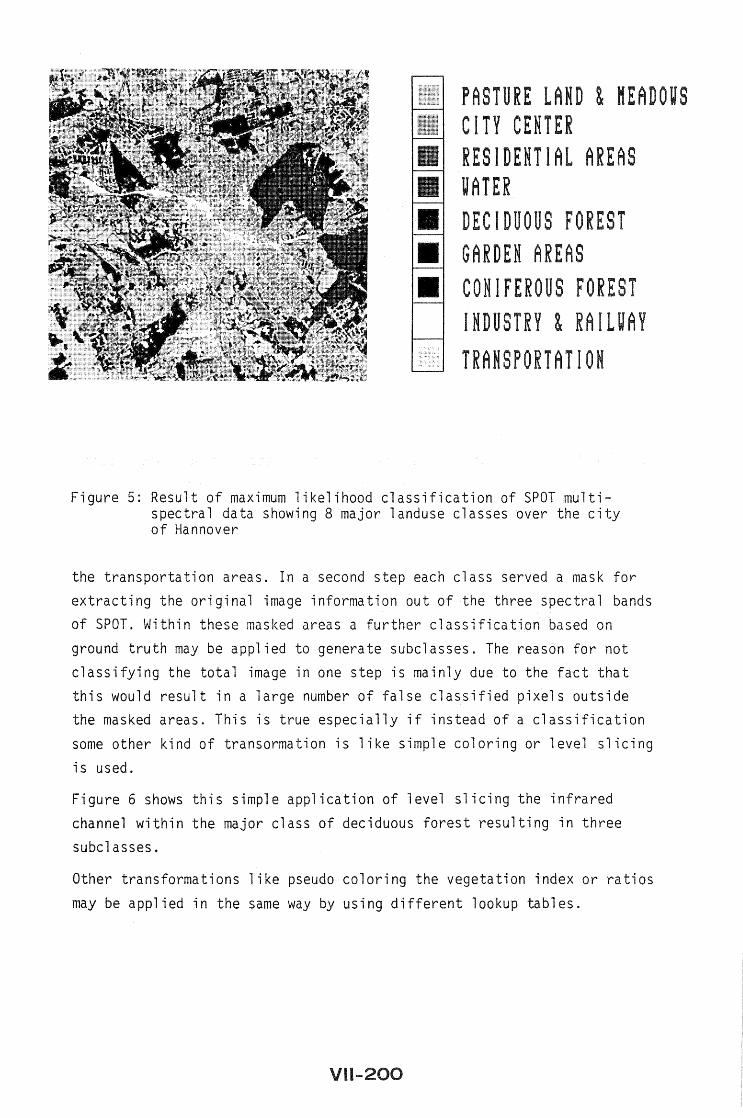
Figure 4 illustrates this procedure. In a first step a supervised classification according to the maximum likelihood method is used to generate the major classes. Figure 5 shows as a result 8 classes superimposed by
SPOT XS 13
~ SPOT XS 1·3
MASK FOR CLASS
0 SPOT XS 1 . ·3 FOR CLASS C
(JjJ SUBCLASSES OF CLASS C
!jIJ
CLASSIFY &
~PERATE MASK
CLASSIFY OR
~MPUTE CHARACTERISTICS
. CLASSIFICATION
ENHANCEMENTS
VEGETATION INDEX
VITALITY OF VEGETATION
COLOR· TRANSFORMATION
. RATIOS
Figure 4: Flow chart of hierarchical processing
VU ... 199
PASTURE LAND & MEADOUS CITY CENTER RESIDENTIAL AREAS UATER
II DECIDUOUS FOREST II GARDEN AREAS II CONIFEROUS FOREST
INDUSTRY & RAILUAY
TRANSPORTATION
Figure 5: Result of maximum likelihood classification of SPOT multispectral data showing 8 major landuse classes over the city of Hannover
the transportation areas. In a second step each class served a mask for extracting the original image information out of the three spectral bands
of SPOT. Within these masked areas a further classification based on
ground truth may be applied to generate subclasses. The reason for not
classifying the total image in one step is mainly due to the fact that this would result in a large number of false classified pixels outside the masked areas. This is true especially if instead of a classification
some other kind of transormation is like simple coloring or level slicing
is used.
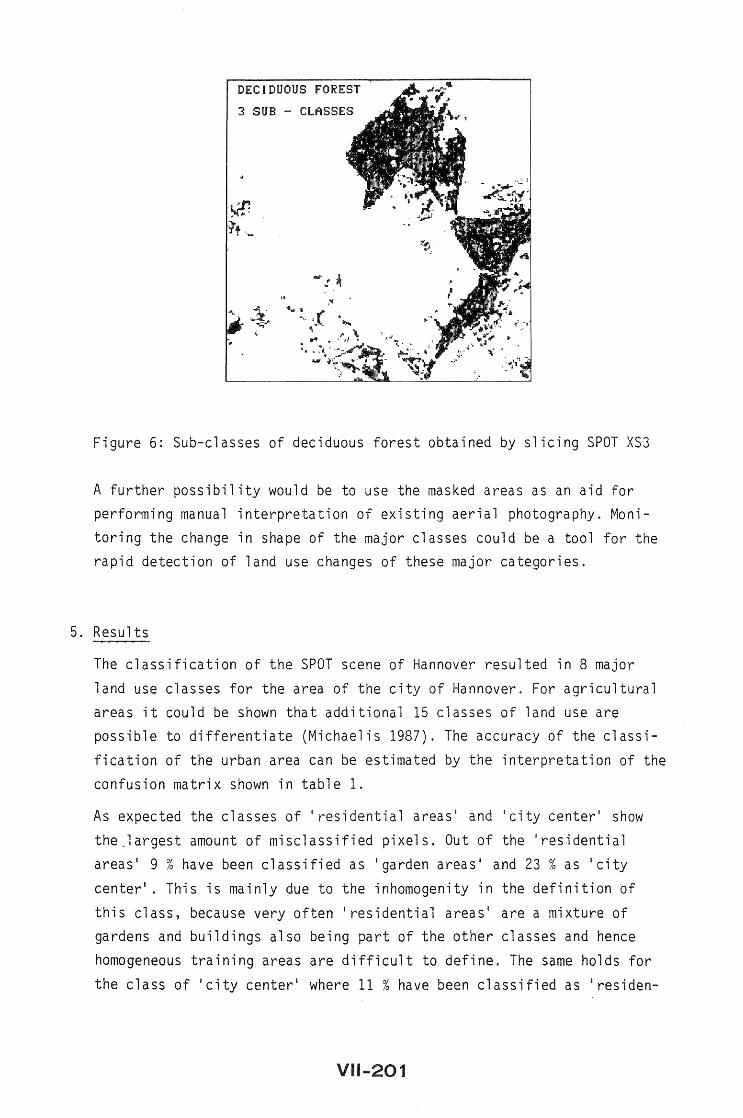
Figure 6 shows this simple application of level slicing the infrared
channel within the major class of deciduous forest resulting in three
subclasses.
Other transformations like pseudo coloring the vegetation index or ratios
may be applied in the same way by using different lookup tables.
VII-200
DECIDUOUS FOREST
3 SUB - CLASSES
......
Figure 6: Sub-classes of deciduous forest obtained by slicing SPOT XS3
A further possibility would be to use the masked areas as an aid for performing manual interpretation of existing aerial photography. Moni
toring the change in shape of the major classes could be a tool for the rapid detection of land use changes of these major categories.
5. Results
The classification of the SPOT scene of Hannover resulted in 8 major
land use classes for the area of the city of Hannover. For agricultural
areas it could be shown that additional 15 classes of land use are possible to differentiate (Michaelis 1987). The accuracy of the classi
fication of the urban area can be estimated by the interpretation of the
confusion matrix shown in table 1.
As expected the classes of lresidential areas' and 'city center' show
the.largest amount of misclassified pixels. Out of the 'residential areas' 9 % have been classified as 'garden areas' and 23 % as 'city
center'. This is mainly due to the inhomogenity in the definition of
this class, because very often 'residential areas' are a mixture of gardens and buildings also being part of the other classes and hence
homogeneous training areas are difficult to define. The same holds for
the class of 'city center' where 11 % have been classified as 'residen-
VII ... 201
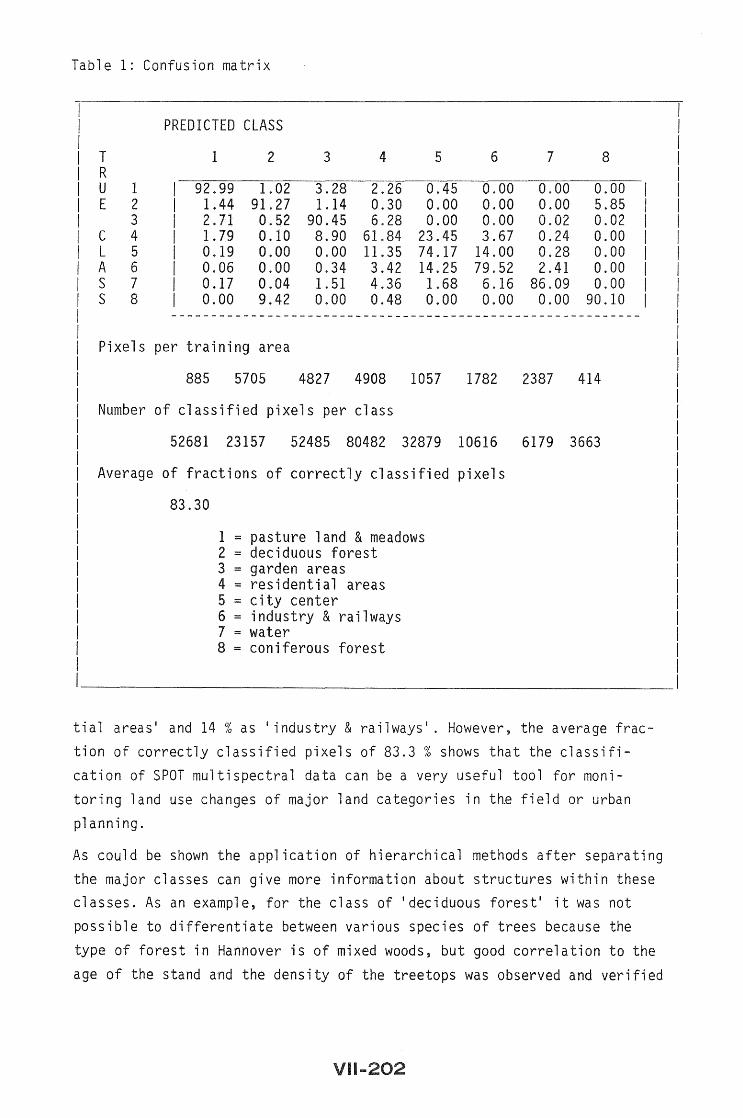
Table 1: Confusion matrix
PREDICTED CLASS
T 1 2 3 4 5 6 7 8 R U 1 92.99 1.02 3.28 2.26 0.45 0.00 0.00 0.00 E 2 1.44 91.27 1.14 0.30 0.00 0.00 0.00 5.85
3 2.71 0.52 90.45 6.28 0.00 0.00 0.02 0.02 C 4 1.79 0.10 8.90 61.84 23.45 3.67 0.24 0.00 L 5 0.19 0.00 0.00 11.35 74.17 14.00 0.28 0.00 A 6 0.06 o 00 0.34 3.42 14.25 79.52 2.41 0.00 S 7 0.17 0.04 1.51 4.36 1.68 6.16 86.09 0.00 S 8 0.00 9.42 0.00 0.48 0.00 0.00 0.00 90.10
---_ ..... __ ..... _----- ----------------------------- ----_ ..... _--_ .... _-
Pixels per training area
885 5705 4827 4908 1057 1782 2387 414
Number of classified pixels per class
52681 23157 52485 80482 32879 10616 6179 3663
Average of fractions of correctly classified pixels
83.30
1 = pasture land & meadows 2 = deciduous forest 3 garden areas 4 = residential areas 5 = city center 6 = industry & railways 7 = water 8 = coniferous forest
tial areas' and 14 % as I industry & railways'. However, the average frac
tion of correctly classified pixels of 83.3 % shows that the classification of SPOT multispectral data can be a very useful tool for monitoring land use changes of major land categories in th.e field or urban
planning.
As could be shown the application of hierarchical methods after separating
the major classes can give more information about structures within these classes. As an example, for the class of 'deciduous forest' it was not
possible to differentiate between various species of trees because the
type of forest in Hannover is of mixed woods, but good correlation to the
age of the stand and the density of the treetops was observed and verified
by ground truth. This forms a good potential for the conduction of forest
inventories even in an urban environment.
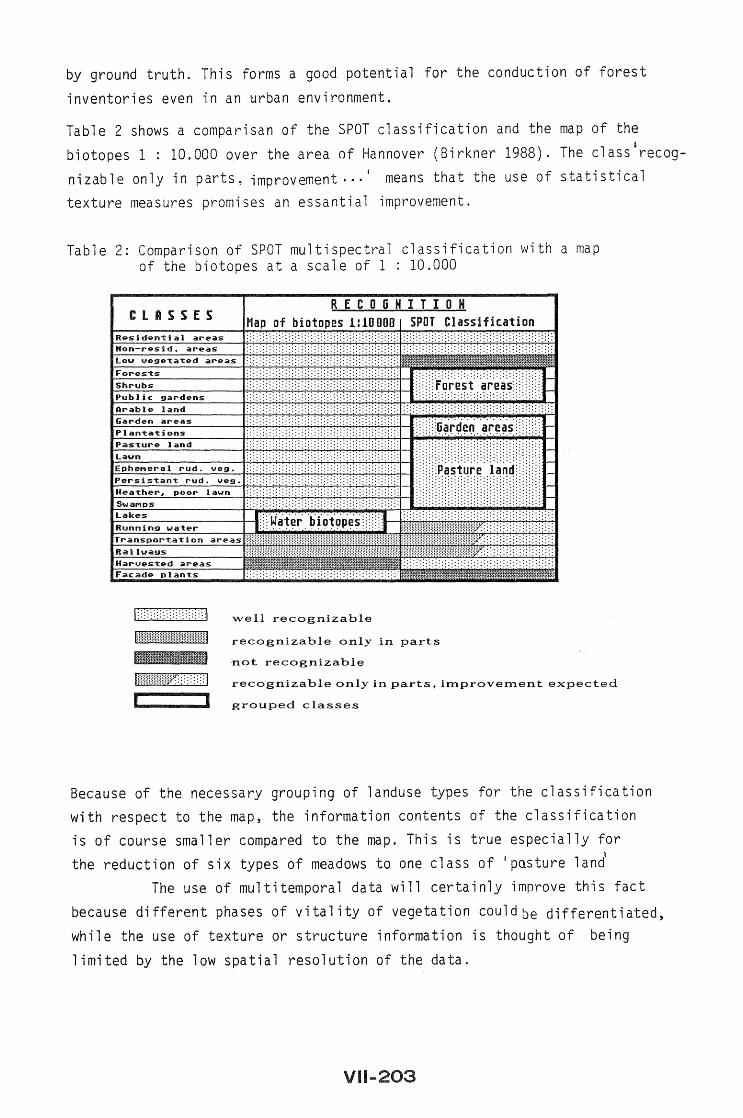
Table 2 shows a comparisan of the SPOT classification and the map of the l
biotopes 1 : 10.000 over the area of Hannover (Birkner 1988). The class recog-
nizable only in parts, improvement ... I means that the use of statistical
texture measures promises an essantial improvement.
Table 2: Comparison of SPOT multispectral classification with a map of the biotopes at a scale of 1 : 10.000
1::::::::::::::::::::: :\
liiiiiiiimmiiiiHiiiiiiiiiiiiiiiiiiiiml
llli_lllllMl
R E COG " I T I 0 " Map of biotopes 1:10000 SPOT Classification
""veIl recognizable
recognizable only in parts
not recognizable
recognizable only in parts, improvement expected
grouped classes
Because of the necessary grouping of landuse types for the classification with respect to the map, the information contents of the classification is of course smaller compared to the map. This is true especially for , the reduction of six types of meadows to one class of 'pnsture land
The use of multitemporal data will certainly improve this fact
because different phases of vitality of vegetation couldbe differentiated, while the use of texture or structure information is thought of being
limited by the low spatial resolution of the data.
1 .... 203

In comparison to table 2, table 3 shows the situation in the case of
classification of a CIR-photography at a scale of 1 6.000.
Table 3: Comparison of multispectral classification of CIR aerial photography at a scale of 1 : 6.000 with a map of the biotopes of the area of Hannover at a scale of 1 : 5 .000
1::::::::::::::::::::::1
t\ml\\\ll\\\l\\l\\l\\\l\l\l\\\\l\HH\\l\!
IIUUBl!lljill!1l1l
R E COG HIT I 0 H
"Well recognizable
recognizable only in parts
not suited as class
grouped, but single classes still "Well to differentiate
grouped classes
Three classes of the map of the biotopes are because of their inhomogenety not useful for automatic classification even after feature extraction. The results in general are comparable to the map of the biotopes as could be shown by BIRKNER. This fact in combination of taking the results of
SPOT classification as an indicator for the presence of a major class leads to an economic way of producing maps of the biotopes of a city,
which are an essential tool for planners and policy makers.
VII ... 204
6. References
- H.-J. Birkner: Klassifizierung von Luft- und Satellitenaufnahmen fUr die Zwecke der Stadtplanung unter besonderer BerUcksichtigung von Textur- und Strukturinformation. Unveroffentlichte Diplomarbeit, Hannover 1988
- CONTEXT VISION: Image operations reference manual 1987
- R. Haydn, S. Slivnsky, T. Wintges: Interpretation des Vitalitaetszustandes von Baeumen aus digitalisierten Farbinfrarotluftbildern. Das Gartenamt 34, H 10/85, S. 687 - 695
- M. Michaelis: SPOT image processing on the GOP 300 System, proceeding: seminar on photogrammetric mapping from SPOT imagery, Hannover 1987
- S. Schneider: Angewandte Fernerkundung, Methoden und Beispiel, Curt R. Vincentz Verlag, Hannover 1984
VIl .... 205