Embed Size (px)
Citation preview

JOURNAL OF ARCHITECTURAL RESEARCH AND DESIGN STUDIES
Correspondence:
The Use of Landsat Image and Census Data for Modelling Population Density and Urban Density in Palembang, IndonesiaMuhammad Fajri Romdhoni University of Kansas School of Architecture and Design, Lawrence Kansas, United States of America
This research is to understand the condition of population Density concentration in the city of Palembang. According to the 2018 United nations booklet (United Nations, 2018), Palembang's city is dimmed to be one of the fastest-growing cities in Indonesia. Palembang has an annual growth rate between 2.4% to 6%, and according to the research, the exponential growth will impact its urban fabric conditions. The researcher's problem in urban growth is the limitation of datasets available from the government, and mostly the datasets are not tailored for urban designers need. The statistical datasets available are often linked to the administrative area called "kecamatan" without knowing the true population density in that particular area. This paper is using Landsat images and population density data, acquired respectively from Earth Explorer USGS and Balai Pusat Statistik to verify the morphological changes that has happened in Palembang between the year 2001, 2007, and 2016. The result output shows the LUDI / Land use dynamic Index and also verifying the density of each "kecamatan" as and administrative area in Palembang. The research output may contribute in the development of spatial research in urban design in Palembang. It could also help future research for urban development and population density verification in the city of Palembang.
Keywords: Administrative area; Landsat images; Population density; Urban.
Muhammad Fajri RomdhoniUniversity of Kansas School of Architecture and Design, Lawrence Kansas, United States of AmericaE-mail: [email protected]
Article HistoryReceived : 04 August 2020Accepted : 28 September 2020Published : 05 October 2020
Abstract
Introduction
The urban population has been essential data for planning in urban design. However, developing countries often lack a quality geographical scaled dataset or even old and do not meet the current update data. Also, if the census data are available, usually the data are not scaled down in an exact size, and often it is created in larger zones. Population density and the population's distribution are essential to represent the economic activity in an urban environment (Wang, 2006). It is also a necessary tool for urban designers to assess the development of an urban area. The problem in acquiring the dataset in developing countries
is that the census data is a large administrative zone with large scale areas; however, such data could not evaluate density in smaller urban areas.
The case study used for this paper is the City of Palembang, as the oldest city in Indonesia with a total population of 1,623,099 people in area size of 369.22 km². The overall density of the city is 4,400/km² for the 2017 population census data. The population in 1986 is 878,732, and the population has grown doubled since then, this has an impact on the growth of the urban area of the city. Although it is a developing country, the census data is collected continuously annually to measure the increase in the city. The problem is that the census data is being published only in a spreadsheet format of the 16 administrative zones without any information of map to show the census unit of the city. Therefore, it
Muhammad Fajri Romdhoni

http://journal.uii.ac.id/index.php/jards
68
is essential to develop a reasonable way to create a model for estimating the population into a geographical map that could acquire detailed density in the urban area Palembang.
There is a correlation between urban population density with the intensity of changes on the earth's surface. The modification on earth's surface is known as Land use and Land Cover or LULC in the geographical term. Even though LULC is not directly linked with biophysical attributes or information about housing and population models. A VIS (Vegetable, Impervious Surface, Soil) model was created in 1995 (Ridd, 1995) The term VIS is used to distinguish the geographical composition between impervious surface, Vegetation, and Soil. The Impervious surface is the solid surface or defined as materials that are not absorbed to the soil/earth surface. Information about urban density can also be determined from the presence of this impervious materials. This paper seeks to produce urban density modeling for Palembang, Indonesia, using remote sensing, explicitly using the Landsat ETM+ data extracted from USGS datasets. The urban population density model generated from this research will have the potential for future research on estimating the population patterns and urban population density with the limited census data in developing countries.
Case Study Area
The study area used in this research is Palembang, it is the capital of South Sumatera Indonesia, and the oldest existing city in Indonesia dated back to the 6th century. According to the Balai Pusat Statistik (BPS), an Indonesian government office branch that collects the population data, the city of Palembang has a population in 2017 of 1,600,000 within the area of 338.49 km².
The administrative area of the city was divided into 16 administrative counties. With the limited use of open source technology, the BPS works in collecting the statistical data in the form of the spreadsheet without regarding the density of land use and land cover of the administrative area. Each of the administrative counties in Palembang has a wide range of sizes with the smallest county is 6.22 km2, and the largest county is 68.78 km² with density respectfully of 11,457/km² and 930/km². BPS in Indonesia
only released a one-dimensional dataset. The population data spreadsheets do not have any spatial data information or even any socio-demographic information attributes suitable in GIS format. Data sources were downloaded from http://tanahair.indonesia.go.id/portal-web/login To reconstruct the GIS shapefile for the urban density. The website is an integrated Indonesian GIS database for any specific administrative zone, providing a digitized shapefile of the ArcGIS platform's polygon unit.
Figure 1. The map shows the density of each administrative area in Palembang according to the census data. Map by author in 2019
This map is showing the 16 administrative areas in the city of Palembang, and the collected data is added to the table of attributes in ArcMap to create a visual population density of each administrative area. The population density is the ratio between person per km² by dividing the number of census data divided by the size of the area, and the map of Palembang shows that there are areas that have a high density of 22780 people/km² and the lowest area show a density of 2000 person/km².
Figure 2. The map shows the main feature and historical morphological phases of Palembang. Map by author in 2018
The Use of Landsat Image and Census Data for Modelling Population Density and Urban Density in
Palembang, Indonesia Muhammad Fajri Romdhoni

Journal of Architectural Research and Design Studies Volume 4 Number 2 October 2020
69
The city boundaries of Palembang have changed over time, the earliest source of city boundary was created around the 1820s, and today the city has since used the latest city boundary, with the total administrative size of 338.49 km2. With the rapid city growth, the city has expanded merging with the neighboring administrative area, and the sum size of the city has double the size of its administrative area. This has raised a question if the administrative area of Palembang has used the maximum growth of its administrative boundary?
From the study area, the urban growth could be studied to analyze the growth of the urban built area in Palembang. In Figure 3 we could see the census data collected from BPS that show the number of people and the size of the administrative zone in km². The census spreadsheet data is than added to the attribute of the shape file in ArcGIS to show the density of each administrative zone compared to the area size shown in Figure 1.
Figure 3. Census datasheet provided by the BPS in Palembang 2018
Literature review
The remote sensing has been widespread among geographers. The method has been adopted for population estimation by correlating population data with classified urban areas with the allometric growth model using the mean ratio from reflectance values. The multispectral bands from this remote sensing are very suitable for population estimation. Multispectral bands in remote sensing have been available for the high-resolution Landsat images with Landsat Thematic Mapper/TM presented in the early research (Langford, 1991; Yuan et al.,
1997) The revised and added spectrum from the ETM+/Landsat Enhanced Thematic Mapper is being used to measure the population density presented in (Li & Weng, 2005; Lu et al., 2006; Wu & Murray, 2003) . It is possible to use the method by classifying the Multispectral band to precisely define the city's dense urban areas.
Urban Mapping with Landsat Enhanced Thematic Mapper (ETM+) has numerous challenges, including the diverse land cover components within the pixels, spectral confusion with other land cover features, and defining different urban classes for the Urban Land Cover / ULC category. Nevertheless, previous research has provided a consistency method and provides an accuracy of 78% to 73% using Landsat imagery (Guindon et al., 2004). The Landsat images could define the urban residential and commercial/ industrial classes based on the impervious surface pixel consistent value. Other research has also proven that urban density analysis is a straightforward approach and an effective way to describe a city's urban growth (Bagan & Yamagata, 2012; Bonafoni & Keeratikasikorn, 2018). Although it is impossible to get a 100 % accurate assessment of Urban density, these researches using two-approach such as conventional comparison with independent ground reference data and classification consistency analysis is quite promising. The Landsat Urban Mapping is an effective way to visualize inference of land use, detection of land sprawl, and understanding its urban growth.
Methods
The method to define the LULC data is adopting the population census data of 2018. The satellite images use Landsat images that have been continually monitoring the earth since 1972; this continuation of information is beneficial for validating the model's long-term evaluation. The satellite image data in a high-resolution GeoTIFF image is obtained from the U.S. Geological Survey (USGS). The website is also known as Earth Explorer resources: https://earthexplorer.usgs.gov/ and the specific image was chosen for site uses 5% as the lowest percentage of cloud cover available for this case study. In this research, I used four methods to determine the study area's impervious surface to identify urban land use
Muhammad Fajri Romdhoni

http://journal.uii.ac.id/index.php/jards
70
in Palembang.
The first method used in the images is the remote sensing process using the rational linear regression method. The linear regression is applied to produce the LSMA / Linear Spectral Mixture Analysis. That is effective in distinguishing the impervious surface materials (Wu & Murray, 2003) in combination with the ETM+ linear regression method is also used to determine the VIS / Vegetable, impervious material, and soil model (Bauer et al., 2007). This process will allow us to predict the Built urban density pixel related to the impervious surface material. The Landsat ETM+ image data is processed using the LSMA method to obtain the VIS image fraction. The regression is the value of tasseled cap transformation in each band's amount on the remote sensing data. This research has been applied and tested by Joseph to verify the population density value in Port-au-Prince, Haiti (Joseph et al., 2012).
Impervious Surface Measurement
The second method on verifying the impervious surfaces is using the vegetation indices from Landsat imagery. The popular indices are the NDVI / Normalized vegetation that uses two band from red near infrared with the red band.
The indices also used the Soil adjusted vegetation index / SAVI. The SAVI could later be converted to Impervious Surface indices / IS fractions by creating the fraction of the vegetation cover.
NDVI index is the technique using multispectral bands from the remote sensing data, i.e. Landsat Image, with the purpose to find the index ration between vegetation, water bodies, open areas, scrub, urban land cover, forest, etc. The NDVI equation uses combination of multispectral band from the red band and near infrared band to produce new image pixels that is strong on the vegetation reflectance properties.
SAVI is the technique using multispectral bands from remote sensing data that influences the soil background color using the near infrared and red bands relations to distinguish between vegetation cover and earth soil. The equation shown above includes the factor L, where L in this case is the adjustment factor for SAVI. The value of L varies from 0 to 1 using the LAI / Leaf Area Index or the vegetation density. The SAVI and NDVI have a similar structure, and the main difference is the addition of a “soil brightness correction factor” used in SAVI. In the equation used, RED is the reflectance of the red band, NIR is the reflectance value of the near-infrared band, and L is the soil brightness correction factor. The cost of L varies by the amount of cover of green vegetation: in very high vegetation regions, L=0, in this case, SAVI = NDVI; and in areas with no green vegetation, L=1. The general use of L=0.5 works well in most situations where the ratio between green and soil is qual and is the default value used.
FR is the sub-pixel fractional vegetation cover. It is a measurement for the NDVI where the vegetation value is the primary value. The equation used in FR is the relationship between dense vegetation index / NDVIs with the bare soil index / NDVIo. The amount of dense vegetation and bare soil is not constant, and a spatiotemporal value must be applied when using the FR equation for different cities. The topography determines the values of NDVIs and NDVIo, and the color of the non-vegetated surface received in the satellite sensor.
To quantify the value of Impervious Surface is be subtracting 1 with the value of the fractional cover of the NDVI, assuming that urban areas are comprised of the combination of the vegetation cover and IS and calculating the impervious surface fractions.
The third method on verifying the impervious surface / built urban area is by estimating the continuous imperviousness index using
The Use of Landsat Image and Census Data for Modelling Population Density and Urban Density in
Palembang, Indonesia Muhammad Fajri Romdhoni

Journal of Architectural Research and Design Studies Volume 4 Number 2 October 2020
71
linear combination of image bands or ratios. The dependent variable is the multivariate regression model to estimate continuous imperviousness index from the ETM+ image. The independent variables were derived from the six ETM+ bands with the array of blue, green, red, NIR, SWIR1 and SWIR2 with the three image ratios of NDVI, brightness, and
greenness.
The Tasseled cap indices in Table 1 is used for the measurement value of Brightness, Greenness, and Wetness of each pixel in the multispectral image. Each multispectral bands' value using a linear combination of 6 Landsat bands (From 2nd band to 7th band). The
ETM+ Index Blue Band 2
Green Band 3
Red Band 4
NIR Band 5
SWIR 1 Band
6
SWIR 2 Band
7
Brightness 0.3029 0.2786 0.4733 0.5599 0.508 0.1872
Greenness −0.2941 −0.243 −0.5424 0.7276 0.0713 −0.1608
Wetness 0.1511 0.1973 0.3283 0.3407 −0.7117 −0.4559
Table 1. ETM+ tasseled cap indices measurement
Tasseled cap indices are then calculated by the equation shown below. Where Tas_cap from table 1 is the calculated tasseled cap index coefficient value. Then a statistical model can be built using stepwise multivariate regression (Yang, 2006).
Where IS is the imperviousness or Impervious surface index and B and G is the brightness and greenness derived from the tasseled cap transformation of the ETM+ image or using the Band 2 and Band 3. The adjusted R square value of this model is 0.91 and the standard error of the estimation is 8.5%. The imperviousness index map is represented in continuous with diverging sequential color scheme.
Population Density and Analysis of Urban Expansion
The fourth method is population density; in this research is the dependent variable in the regression model. The population density is the measurement of the number of persons per km2. There have been several transformations of population density to maximize the model's fitness. The transformation of the dataset's purpose is to show the built urban area density using the dependent population datasets. A particular value of the dependent variable is being used to view the density value's standard deviation. The density will show the percentage of the value estimating the study area's density, and the models will be modified to visually show the difference in the density between the
census data model with the built area density model. The estimation of this model is taking account of the independent variable of the location, also affect the relative condition of the study area and giving weight as a neighbor part of the study area.
This research will also analyze the value of urban expansion with the dynamic change of the urban built of the spatial structure in the city. The value of change in the spatiotemporal data, with the dynamics of land use that represents the change in the quantity of land use in a unit time. The dynamics of land use with the extent of the urban expansion can be compared quantitatively according to the following formula:
Ua and Ub is the value of urban built areas at time a and b respectively, and T denotes the length of time from time a and time b and T is the unit value in year. LUDI is the Land Use Dynamic Index and show the annual rate of change in the area for the land use class.
Muhammad Fajri Romdhoni
http://journal.uii.ac.id/index.php/jards
72
Result and Research Findings
Figure 4. The result map of Palembang using Tesseled indices with 4 different land use and land cover 2018
The initial identification for this research is to compare the Land use and Land Cover / LULC in Palembang into four categories of water, vegetation, urban, and soul defined by the administrative city boundaries. To identify each area, this result uses the tasseled indices value of each land-use provided in previous research of (Joseph et al., 2012). Each index is calculated using the raster calculator and each band from the ETM+ Landsat 7 images, and creating new tif with various low and high value that shows the corrected images for Vegetation, Soil and Urban built area/house. Based on the identification on the 2018 Landsat Image we could see the proportion of area in Palembang with the value of the urban area of 26.43% and the total value of vegetation, soil, and water of 73.57% from 338.49 km² of the administrative area in Palembang.
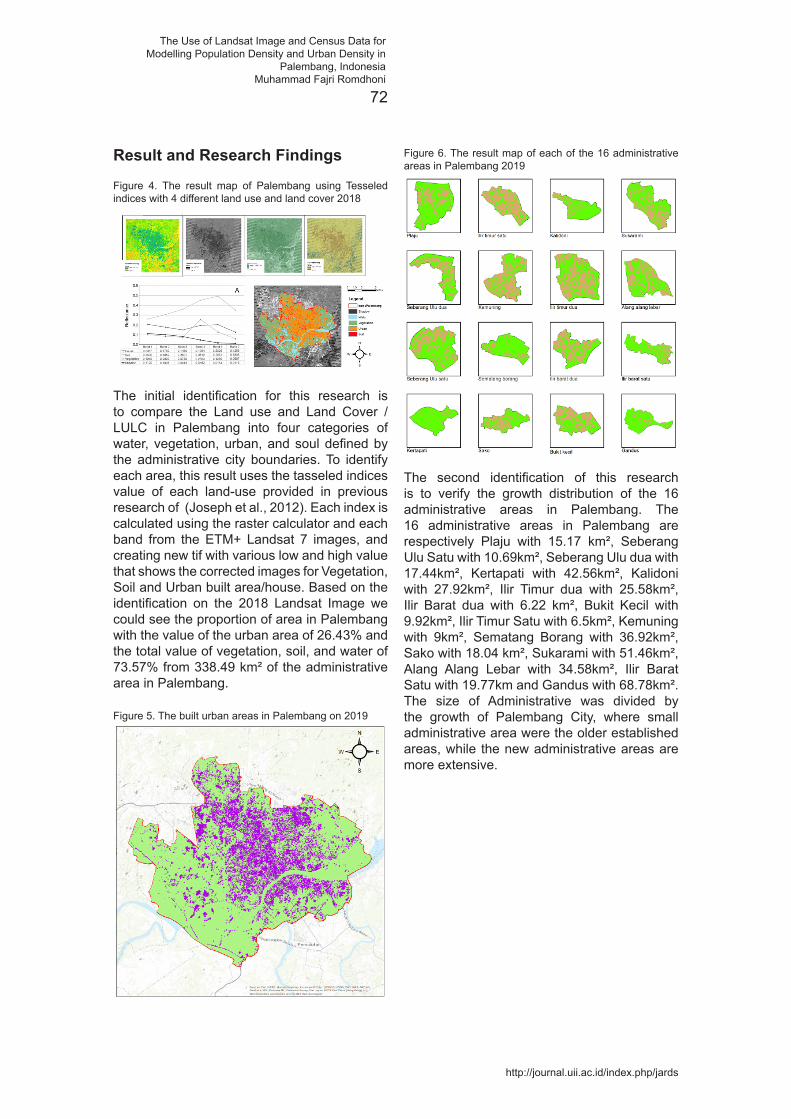
Figure 5. The built urban areas in Palembang on 2019
Figure 6. The result map of each of the 16 administrative areas in Palembang 2019
The second identification of this research is to verify the growth distribution of the 16 administrative areas in Palembang. The 16 administrative areas in Palembang are respectively Plaju with 15.17 km², Seberang Ulu Satu with 10.69km², Seberang Ulu dua with 17.44km², Kertapati with 42.56km², Kalidoni with 27.92km², Ilir Timur dua with 25.58km², Ilir Barat dua with 6.22 km², Bukit Kecil with 9.92km², Ilir Timur Satu with 6.5km², Kemuning with 9km², Sematang Borang with 36.92km², Sako with 18.04 km², Sukarami with 51.46km², Alang Alang Lebar with 34.58km², Ilir Barat Satu with 19.77km and Gandus with 68.78km². The size of Administrative was divided by the growth of Palembang City, where small administrative area were the older established areas, while the new administrative areas are more extensive.
The Use of Landsat Image and Census Data for Modelling Population Density and Urban Density in
Palembang, Indonesia Muhammad Fajri Romdhoni

Journal of Architectural Research and Design Studies Volume 4 Number 2 October 2020
73
Table 2 Land Use Land Cover Ratio and population density on 16 administrative area in Palembang
Figure 7. The population comparison between the 16 administrative areas population density vs urban built area density of Palembang
From the research output, we could see the use of every administrative area compared to the built and the unbuilt areas, and there is the administrative area that is densely built while there are others that show uneven growth by the comparison of built urban areas with the population census data. The most densely built administrative area is Ilir Barat Dua, with the contrast between population census and built urban area of 71,267 people with 1.49km2
showing the urban density of 47,673 people/km². The lowest density in the administrative area is Sukarami, with a population of 155,590 people with the built urban area of 15.48km² showing the urban density of 10,048 people/km2. This result is very different compared to the population density model provided by the census data by measuring the population with the administrative area. This method of comparing the census population with administrative data is only showing information of a general density but the flaw of this data that it does not show any information about the actual urban density of built urban areas.
Figure 8. comparison between population density and built area density in Palembang
Muhammad Fajri Romdhoni
Plaju
Sebe
ran
gulu
dua
Sebe
ran
gulu
satu
Kertap
ati
Kalid
oni
Ilir
timur
dua
Ilir
barat
Dua
Bukit
Kecil
Ilir
Timur
Satu
Kemun
ing
Semata
ng
Borang
Sako
Suka
rami
Alan
galan
gleba
r
Ilir
barat
satu
Gand
us
soilan
dve
getatio
n(km2)
11.47
5.34
10.76
40.46
22.74
7.15
1.63
1.42
1.54
3.38
11.93
10.37
27.43
13.19
43.81
36.44
urba
narea
(km2)
3.95
3.22
5.82
3.08
5.63
6.52
1.49
1.45
3.46
4.53
1.58
6.99
15.48
8.70
12.56
4.97
urba
npe
rcen
tage
25.61%
37.66%
35.11%
7.08%
19.85%
47.70%
47.81%
50.63%
69.22%
57.23%
11.72%
40.26%
36.08%
39.75%
22.28%
12.01%
administ
rativ
earea
(km2)
15.17
10.69
17.44
42.56
27.92
25.58
6.22
9.92
6.5
936.92
18.04
51.46
34.58
19.77
68.78
popu
latio
n88,265
104,209
91,619
89,597
111,030
93,352
71,267
48,874
77,102
91,419
35,821
91,753
155,590
96,886
137,863
64,020
popu
latin
den
sity(/km
2)5,818
9,748
5,253
2,105
3,977
3,649
11,458
4,927
11,862
10,158
970
5,086
3,024
2,802
6,973
931
builturban
den
sity(/km
2)builtarea
22,345
32,316
15,734
29,075
19,710
14,311
47,673
33,625
22,315
20,186
22,614
13,126
10,048
11,132
10,978
12,870
segm
entc
ount
1880
1506
3429
1579
4661
3157
748
910
2023
2719
1656
5857
10192
5227
6530
1644
mea
nstreetle
ngth(m
)85
7677
113
7073
7067
6265
7459
6568
75100
totalstree
tlen
gth(m
)159,306
114,920
263,664
178,074
328,465
230,965
52,093
60,730
125,116
177,658
122,030
348,467
660,639
356,954
492,986
163,796
streetline
arden
sityvsarearatio
10.50
10.75
15.12
4.18
11.76
9.03
8.38
6.12
19.25
19.74
3.31
19.32
12.84
10.32
24.94
2.38
Glob
alin
tegrationmea
n1.94
1.80
1.83
2.02
2.02
2.04
1.94
2.10
2.24
2.12
1.80
1.89
1.97
1.95
1.99
1.84
Glob
alin
tegrationmax
imum
3.04
3.05
3.05
3.65
3.53
3.53
3.28
3.64
3.68
3.68
2.80
3.36
3.68
3.65
3.65
3.65
Glob
alin
tegrationminim
um1.05
1.16
0.97
1.17
1.11
1.27
1.18
1.39
1.46
1.31
1.07
1.14
0.80
1.10
1.05
1.20

http://journal.uii.ac.id/index.php/jards
74
This table 2 is showing the value of population density from the census data by dividing the population value with the administrative area size, compared to the urban built density by dividing the population value with the built area size. The result shows that there is a difference in the actual density of each area
Figure 9 shows the three classifications of urban growth in Palembang of Land-use cover maps from 2001,2007 and 2016 and detected the difference in built or changes from the non-built area with the built area. In 2001, the Palembang urban built area had 66.75km2, which increased to 99.02km2 in 2007 and 116.25km2 in 2016. This shows that the Urban built area has an annual increased of growth of approximately 2.83% in the past 15 years (2001-2016), with the rate of 3.3km2 every year.
LUDI = 116.25 - 66.75 x 1/15 x 100% 116.25
= (49.5 / 116.25) x 1/15 x 100%= 0.425 / 15 x 100%= 2.83 %
Figure 9. Urban density map transformation in the city of Palembang from 2001 to 2016
Discussion
The limited data sources that provide detail built-area map in developing countries has been challenging. A straightforward and accessible dataset is needed to assess Palembang's Urban density while there is no robust enough data from the government that can be used as comparison data. The previous study has
shown that the accuracy level using Landsat urban mapping with the standard errors ranging from 7.7% to 15.9% depending on the quality of the Landsat images and the clear sky with 0% of cloud coverings would help reduce the error margins (Hu et al., 2016; Kaspersen et al., 2015). The research findings show that this research could be valuable for primary datasets in the urban designing process with limited urban and population density information.
Among other countries in South Asia that show a high urban growth are Sri Lanka (1.1%), Bangladesh (3.4%), Nepal (3.2%), Pakistan (3.3%), and India (2.4%) (Subasinghe et al., 2016). Palembang is also showing significant urban growth of 2.83% and can be considered as a rapidly growing metropolitan area. This annual growth is in-line with (United Nations, 2018) report that stated Palembang is one of the twelve fastest growing cities in Indonesia. The population growth and urban-built area have been driven by not only exponential birth but also urban migration to metropolitan areas, and it has been shown that the population growth in Palembang is significantly high.
Figure 10. intensity of ULC / Urban Land cover in Palembang
There have been visible changes in the Urban built area in Palembang, where the mixture of housing is more derived to the outer part of the city, while commercial functions stayed at the center. The result of Urban expansion and the government plan of creating a satellite city in Palembang of Jakabaring Sport City has impacted the city's shape. Urban growth and sprawl are moving simultaneously from the city's edge and becoming a dominant form (Glaeser & Kahn, 2004). The green area has decreased rapidly in the city center, and mass transport availability such as the LRT / Light Rapid Transit in Palembang has created
The Use of Landsat Image and Census Data for Modelling Population Density and Urban Density in
Palembang, Indonesia Muhammad Fajri Romdhoni
Journal of Architectural Research and Design Studies Volume 4 Number 2 October 2020
75
growth around the city centers. The city center's growth should be balanced with the announced program from the government to develop a healthy and balanced growth in other administrative areas in Palembang.
The urban density modeling output shows Palembang’s urban growth resembles ribbon development, which resulted from the existing dominance of the main road. Bhatta refers to Harvey about the concept of ribbon development as one of the major causes of urban sprawl (Bhatta, 2010). The ribbon development is the result of urban area fragmentation along the roads and the development of housing and commercial buildings and the main transportation plan that causes a direct effect on land-use planning, creating a significant urban sprawl. From this urban growth density map, we could argue that Palembang could result in a similar problem created by accessibility feature, a needed balanced growth would be the solution for the future of Palembang.
Conclusion
Remote Sensing is a powerful tool to analyze the urban changes phenomena by collecting the Landsat data. It is possible to see the various changes in Land-use and Land-cover variety and changes in a specific area. Satellite imagery has become a more consistent and reliable tool. With the growth of multiple techniques to verify the land cover, the method and tools will be more precise, given the comparative measurement for result accuracy.
Urban growth in Palembang has shown a high number of urban density areas from the year 2001-2016 and created the dispersion of urban patterns in the city. This urban growth has continued to evolve but creates a similar pattern attached to the center of the city. This growth of ribbon development is in a disruptive pattern with the addition of the mass transport development in Palembang that is connected to the city's main road. This disruptive patter will lead to the potential of urban sprawl and also environmental degradation in the future.
Acknowledgement
The author gratefully acknowledges Dr. Mahbub Rashid for the discussion on this research
by showing the choices in methods that are available for data analysis. The writer also acknowledges the Urban Growth and Sprawl group for the great insight and discussions.
References
Bagan, H., & Yamagata, Y. (2012). Landsat analysis of urban growth: How Tokyo became the world’s largest megacity during the last 40 years. Remote Sensing of Environment, 127, 210–222.
Bauer, M. E., Loffelholz, B. C., & Wilson, B. (2007). Estimating and mapping impervious surface area by regression analysis of Landsat imagery. In Remote sensing of impervious surfaces (pp. 31–48). CRC Press.
Bhatta, B. (2010). Analysis of urban growth and sprawl from remote sensing data. Springer Science & Business Media.
Bonafoni, S., & Keeratikasikorn, C. (2018). Land surface temperature and urban density: Multiyear modeling and relationship analysis using MODIS and Landsat data. Remote Sensing, 10(9), 1471.
Glaeser, E. L., & Kahn, M. E. (2004). Sprawl and urban growth. In Handbook of regional and urban economics (Vol. 4, pp. 2481–2527). Elsevier.
Guindon, B., Zhang, Y., & Dillabaugh, C. (2004). Landsat urban mapping based on a combined spectral–spatial methodology. Remote Sensing of Environment, 92(2), 218–232.
Hu, T., Yang, J., Li, X., & Gong, P. (2016). Mapping urban land use by using landsat images and open social data. Remote Sensing, 8(2), 151.
Joseph, M., Wang, L., & Wang, F. (2012). Using Landsat imagery and census data for urban population density modeling in Port-au-Prince, Haiti. GIScience & Remote Sensing, 49(2), 228–250.
Kaspersen, P., Fensholt, R., & Drews, M. (2015). Using Landsat vegetation indices to estimate impervious surface fractions for European cities. Remote Sensing, 7(6), 8224–8249.
Langford, M. (1991). The areal interpolation problem: Estimating population using remote sensing in a GIS framework. In Handling Geographical Information: Methodology and Potential Applications, 55–77.
Muhammad Fajri Romdhoni

http://journal.uii.ac.id/index.php/jards
76
Li, G., & Weng, Q. (2005). Using Landsat ETM+ imagery to measure population density in Indianapolis, Indiana, USA. Photogrammetric Engineering & Remote Sensing, 71(8), 947–958.
Lu, D., Weng, Q., & Li, G. (2006). Residential population estimation using a remote sensing derived impervious surface approach. International Journal of Remote Sensing, 27(16), 3553–3570.
Ridd, M. K. (1995). Exploring a VIS (vegetation-impervious surface-soil) model for urban ecosystem analysis through remote sensing: Comparative anatomy for cities. International Journal of Remote Sensing, 16(12), 2165–2185.
Subasinghe, S., Estoque, R., & Murayama, Y. (2016). Spatiotemporal analysis of urban growth using GIS and remote sensing: A case study of the Colombo metropolitan area, Sri Lanka. ISPRS International Journal of Geo-Information, 5(11), 197.
United Nations. (2018). The World’s Cities in 2018. Retrieved from https://www.un-ilibrary.org/content/publication/c93f4dc6-en
Wang, F. (2006). Quantitative methods and applications in GIS. CRC Press.
Wu, C., & Murray, A. T. (2003). Estimating impervious surface distribution by spectral mixture analysis. Remote Sensing of Environment, 84(4), 493–505.
Yang, X. (2006). Estimating landscape imperviousness index from satellite imagery. IEEE Geoscience and Remote Sensing Letters, 3(1), 6–9.
Yuan, Y., Smith, R. M., & Limp, W. F. (1997). Remodeling census population with spatial information from Landsat TM imagery. Computers, Environment and Urban Systems, 21(3–4), 245–258.
The Use of Landsat Image and Census Data for Modelling Population Density and Urban Density in
Palembang, Indonesia Muhammad Fajri Romdhoni