Embed Size (px)
Citation preview

THE USE OF INQUIRY-BASED INSTRUCTION TO INCREASE MOTIVATION
AND ACADEMIC SUCCESS IN A HIGH SCHOOL BIOLOGY CLASSROOM
by
Kathryn R. Madden
A professional paper submitted in partial fulfillment of the requirements for the degree
of
Master of Science
in
Science Education
MONTANA STATE UNIVERSITY Bozeman, Montana
July 2011

ii
STATEMENT OF PERMISSION TO USE
In presenting this professional paper in partial fulfillment of the requirements for
a master’s degree at Montana State University, I agree that the MSSE Program shall
make it available to borrowers under rules of the program.
Kathryn R. Madden
July 2011

iii
ACKNOWLEDGEMENTS
For Tony, who makes all things possible and encourages me each day to never stop exploring, learning, and loving our world.

iv
TABLE OF CONTENTS
INTRODUCTION AND BACKGROUND ........................................................................ 1 CONCEPTUAL FRAMEWORK ........................................................................................ 4 METHODOLOGY ..............................................................................................................8
DATA AND ANALYSIS ..................................................................................................14
INTERPRETATION AND CONCLUSION .....................................................................27
VALUE ..............................................................................................................................31
REFERENCES CITED ......................................................................................................34
APPENDICES ...................................................................................................................36
APPENDIX A: The Matrix for Assessing and Planning Scientific Inquiry .........37 APPENDIX B: The Student Science Survey……………………………… .......40 APPENDIX C: Student Science Inquiry Survey……………………………… .42
APPENDIX D: What Helped Me Learn Genetics……………………………… 45 APPENDIX E: Science Skills Assessment ..........................................................47 APPENDIX F: Exemption Form Regarding Consent .........................................49
v
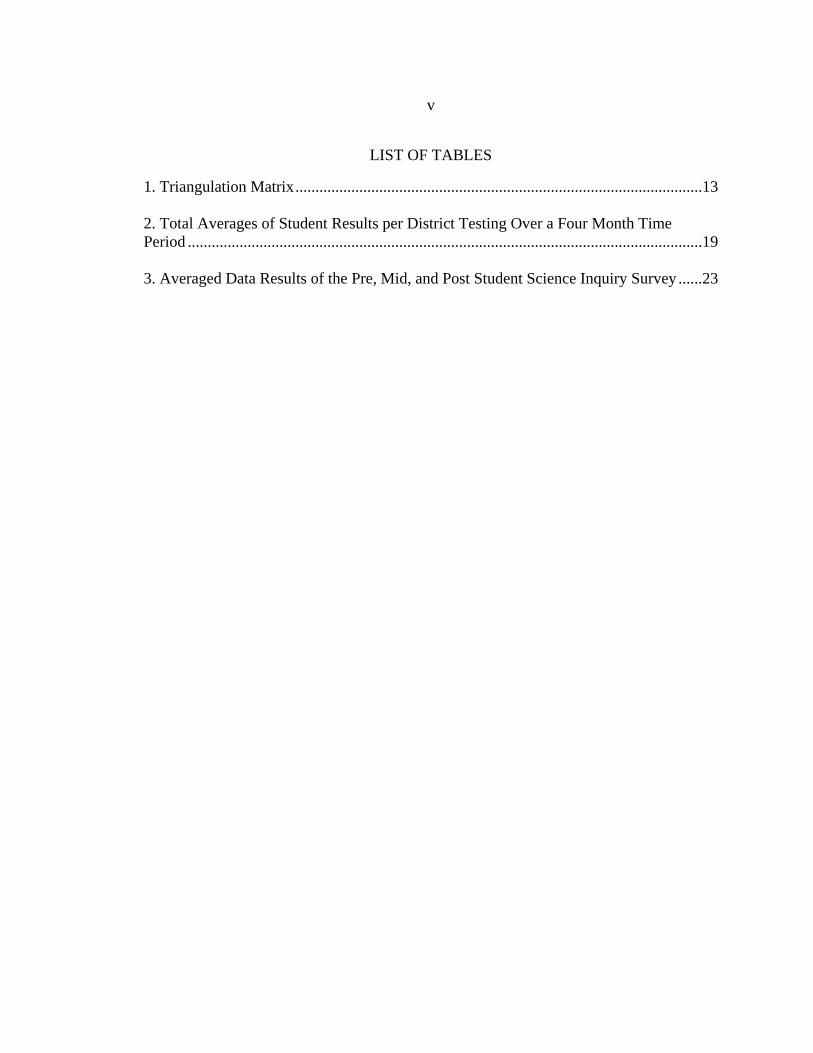
LIST OF TABLES
1. Triangulation Matrix ......................................................................................................13 2. Total Averages of Student Results per District Testing Over a Four Month Time Period .................................................................................................................................19 3. Averaged Data Results of the Pre, Mid, and Post Student Science Inquiry Survey ......23

vi
LIST OF FIGURES
1. Percentage of Student Response to the Question: Are you excited and motivated to come to science class ......................................................................................................... 14
2. Percentage of Student Response to the Question: How Do You Feel About Your Abilities to Do Science ....................................................................................................... 15
3. Percentage of Student Response to the Question: What Kinds of Activities Do You Enjoy in Science Class ....................................................................................................... 15 4. Percentage of Student Response to the Questions: Do You Feel You Have Enough Help in Science Class; Do You Receive Enough Feedback on Assignments, Projects, and Labs from the Adults in Your Life; Do You Feel You Should Be Rewarded with Things for Completing Science Work to the Best of Your Abilities ............................................. 16
5. Percentage of Student Ranking per Inquiry and Non Inquiry based Strategies: What Helped Me Learn Genetics ................................................................................................ 17 6. Percentage of Students were ranked high, average, low per scientific inquiry standard on MAP test ....................................................................................................................... 18
7. Percentages per letter grade for the End of Course for Biology Exam Scores .............. 20 8. Percentage of Students were ranked best, adequate, not met per category on the Student Skill Assessment for TD = teacher driven lab and SD = student driven lab investigation ....................................................................................................................... 21 9. Percentage of Student responses, highly confident, somewhat confident, and not confident, per science skill category for each pre, mid, and post student science self assessments ........................................................................................................................ 24 10. Percentage of Student responses, highly confident, somewhat confident, and not confident, per science skill category for each pre, mid, and post student science self assessments. ....................................................................................................................... 25
11. Percentage of Student responses, highly confident, somewhat confident, and not confident, per science skill category for each pre, mid, and post student science self assessments ........................................................................................................................ 26

vii
ABSTRACT
A variety of inquiry based lessons and non inquiry based lessons were used to motivate and increase academic success with a freshman biology honors students. Student self surveys, biology journals, and lab skills were indicators of motivation. Scores on standardized tests and other assessments were used to monitor students’ academic success. Trends indicated an increase in student motivation to do science while testing scores were varied.

1
INTRODUCTION AND BACKGROUND
Project Background
Teaching Experience and Classroom Environment
Five years ago, I switched career fields from a research coordinator with a
university ecology laboratory to a high school biology teacher. Initially, I was able to
work part-time with the lab while teaching full time. This opportunity allowed me the
unique ability to develop scientific inquiry with my students. We worked together on real
world environmental problems with many professional scientists in the community.
Throughout the school year, the students were excited and motivated in part due to the
many labs and activities related to their studies. They were able to experience “real”
applications of their efforts and the significance of scientific inquiry based skills. At the
end of the school year, reduced funding caused the near closure of the lab, and my part
time employment ended. I decided to move closer to my family and relocated to
Beaufort, South Carolina. I was hired at Beaufort High School and taught biology for two
years. Based on my first year of teaching, I wanted to apply scientific inquiry based
investigations with my new students. As I continued to teach with this method in mind, I
observed a slight increase in student achievement associated with scientific inquiry based
activities and labs conducted outdoors. During my second year at the high school, I was
contacted by the principal of Whale Branch Middle School and asked if I would consider
becoming part of their newly developed fifth grade STEM (science, technology,
engineering, and math) academy. I was excited to be part of new national pilot program
centered on science, so I took the appointment. While at Whale Branch Middle School, I

2
continued to develop a science curriculum centered in inquiry based learning. I expanded
the laboratory investigations to include as much environmental education as possible and
we worked to incorporate improving the natural landscape as much as possible. Over the
course of that school year, I observed an increase in student motivation and confidence
levels to “do” science – students were excited to come to school, check on classroom
projects, and go outside to apply science skills. The next school year I was assigned a
new school. H. E. McCracken School is located in the southeastern island/ marshlands of
Beaufort County, South Carolina. It is the last town before Hilton Head Island. During
the early turn of the century, this coastal area was booming with new development. This
once vast area of marshlands quickly became a popular tourist destination for outlet
shopping, dining, and golf. However, in recent years this coastal community has suffered
due to national economic hardships. Development suddenly ended, tourism dropped, and
people were left to seek other sources of income. There are large families in this area and
many had relocated due to the fast rising jobs and easier climate. Despite the economic
down-turn, many of these families have remained in the area. The small and few local
schools serve over 17, 500 people in this town (schooltree.org). The local high school
was overcrowded due to the prediction many people would leave the area for
employment. To address the overcrowding issued, a new middle school was built in the
summer of 2010. H. E. McCracken School was the former middle school but now serves
as a junior high school for 8th and 9th grade only for the community. The majority of the
school population is Caucasian and approximately 34% of the students receive free or
reduced lunch services (schooltree.org). I serve 82 students at the school and teach
Biology I, Honors to 9th graders.

3
Students need time and experience to develop the skills of learning how to
observe and monitor change. Students need to know how to interpret scientific data and
evaluate the meaning of the data. Students should have the abilities to communicate this
information in order to make the right choices. Since my goal was to determine if
scientific inquiry based labs increase student motivation and academic success, various
investigations and activities were implemented from January through April. Some
investigations were more inquiry based than others, but all had the goals of helping
student develop scientific skills and become more science literate. This research project
was centered on the development of a curriculum immersed in inquiry based activities
and laboratory investigations conducted in indoor and outdoor settings. Student
motivation, academic performance, and development of inquiry skills were monitored
and measured.
Focus Question
Underlying my primary focus question were some additional questions. What
were my students’ views of science, their abilities to do science, and how science literate
were they? I wanted to determine if an increase in the complexity of inquiry based
learning would benefit student academic success in the biology classroom. I researched
each of these to help support my project findings related to their existing thoughts,
beliefs, and feelings about science. I wanted to understand my ninth grade biology
students and their experiences with regards to science and determine potential growth in
science literacy and science skills during the course of the project. It was also important
to determine if confidence in their abilities to “do” science influenced their academic
success.

4
CONCEPTUAL FRAMEWORK
Scientific inquiry based learning is known by several different names: discovery
based learning, problem based learning, hands-on science, mind-on science, investigative
learning, real world problem solution, and experimental design process. Despite all the
names, there is little variation in the pedagogical implementations and theory among the
titles (Brooks & Brooks, 1993; Bruner, 1961; Dewey, 1910). Simply stated, an inquiry
based classroom is an environment in which students are actively engaged and
progressing towards becoming literate about what science is, what science looks like,
how to do science, and how to communicate science (NAP, 1996; AAAS, 1993). There is
significant purpose in inquiry based classroom and instruction. In an inquiry based
learning classroom, learners model scientists. All scientific pursuits are led by a question
or series of questions designated at determining the, whys or what ifs of a natural
phenomenon. In an inquiry based learning environment, it is obvious and evident the
teacher allows the students to ask questions and pursue investigations (Yager, 2009;
Llewwllyn, 2005). Students need to have the tools and ability to develop authentic
questions for inquiry purposes (Windschitl, 2001). Inquiry based classroom teachers
make all necessary tools and materials available and welcome students to explore their
own questions relevant to science and topics studied during our school year. In the
classroom, the teacher displays student extended investigations, various mapping
techniques of students’ conceptual understanding of science topics, and other forms of
student work are readily available; such as, notebooks, journals and portfolios. Those
student artifacts are evidence the learners and instructor are actively doing inquiry based
science. Teachers who encourage a holistic atmosphere and approach to inquire based
5
learning instruction, are led by the state and nation science standards and the 5-E
Learning Cycle: engage, explore, explain, extend, evaluate (Llewwllyn, 2005).
Preferable, students develop inquiry skills at a young age. These skills are enhanced in
the classroom throughout a student’s academic career (NAP, 1996; AAAS, 1993). The
earlier these skills are developed, the more analytical and aware a child becomes about
local and global issues.
Studies dismiss the role of unguided scientific inquiry in the science classroom as
a means to increase student academic success (Kirschner et al., 2000; Berkson,1993).
According to these studies, students need direct instruction from an educator in order to
best understand concepts and procedures. Researchers suggest that guided instruction
increases student cognitive abilities, and therefore information is retained in long term
memory (Kirschner et al., 2000). This is in some opposition to earlier theorists’ proposals
that students should be left to explore and construct information on their own with very
minimal assistance from an educator (Bruner, 1961; Dewey,1910). Current literature on
pedagogical implementation and design of scientific inquiry in the classroom suggest a
slightly different role for the educator than historically presented (Marx et al., 2004;
Crawford, 2000; Tam, 2000; Holbrook & Kolodner, 2000). In a scientific inquiry based
classroom environment, traditionally the role of the educator was to only facilitate,
leaving the students to actively explore and engage in scientific problem solving
activities. The facilitator role is still present, but educators must also academically
challenge students with new questions for exploration, allowing students to build or
scaffold higher level questioning in addition to exercising problem solving techniques.
When new information is manipulated in a guided manner by educator and student, it is

6
then contextually stored in long term memory (Kirshner et al., 2006; Pillay, 1994).
Educators in a modern scientific inquiry based classroom are, most importantly,
collaborators with students in doing, learning, and communicating science (Crawford,
2000; Tam, 2000, Krajcik et al., 1994; NAP, 1996).
Educators who collaborate with students in guided scientific inquiry based lessons
and activities increase student motivation (Crawford, 2000; MacIver et al., 2001; Marx et
al., 2004; Holbrook & Kolodner, 2000). The need for students to feel cared for and
invested in is highly important. A person willing to work with a student can reduce stress
induced from physical, social, and mental transitions (MacIver et al., 2001).
Opportunities for open collaboration and group work are also essential to students in the
inquiry based science classroom (Llewwllyn, 2005). Group work and group presentations
can help alleviate the side effects of peer pressures and motivate the otherwise introverted
student. Individual performance based tasks can often lead to embarrassment, fear, and
dread (MacIver et al., 2001) decreasing student motivation and success. It is up to the
educator to create an atmosphere in which students are comfortable and heard. Based on
research findings of middle school science classrooms, motivation is directly related to
the student awareness of his/her teacher’s best efforts and deep concern for students’
academic success (Wentzel, 1997; Wentzel, 1998).
Students are also academically motivated when they are collaborators with their
educators in real world based problem inquiry studies (Hubbard, 2003; Bouillion &
Gomez, 2001; Crawford, 2000; MacIver et al., 2001; Krajcik et al., 1994). Inquiry
projects based on real world problems increases student science literacy, knowledge and
abilities to confidently apply scientific methods (Krajcik et al., 1998). Instructional

7
practices in the science classroom should include students hypothesizing and
investigating real problems (MacIver et al., 2001). Students should be actively engaged in
reading scientific literature, referring to guides and texts, and writing about science as
they search for solutions to real world problems (Crawford, 2000; Krajcik et al., 1998;
MacIver et al., 2001). During real world inquiry based investigations, educators should
model scientists and guide students in accurate data collection (Crawford, 2000). Not
only are the educators collaborators with their students during inquiry investigations,
educators also collaborating with university professors, community partners, and other
students (Crawford, 2000; Tam, 2000, Krajcik et al., 1994; NAP, 1996). Collaboration
among researchers adds to the relevance of the investigations, thereby instilling
excitement in students as scientists. Collaboration among community partners, concerned
parents and citizens aides in bridging gaps between the community and the school.
Bridging the gap is an effective tool in increasing community involvement and helping
students feel connected to and an important part of their world (Bouillion & Gomez,
2001). If students feel more significant in the community with attention given on their
studies, academic success and motivation will increase at the school and in the science
classroom (Bouillion & Gomez, 2001; Crawford, 2000).
Nature or environmental inquiry projects aide in student awareness of community
and global issues. As students turn into voters, it is essential they understand the
democratic process and are scientifically literate. Students will vote on issues that will
impact local and global environments and economies (NAP, 1996). It is imperative that
science classrooms provide and foster the means for students to explore the natural world
in order to develop a strong sense of place in the world. Real problem based scientific

8
inquiry provides an opportunity for the educator and students to immerse themselves in a
collaborative investigation based in the environment (Windschilt, 2001; Crawford, 2000).
Environmental studies provide a robust method for student generated hypotheses and
investigations of authentic questions leading to authentic solutions. Students who
participate with guidance from an educator grow to understand the significance of their
education and relevance of their potential impact on the world (Krajcik et al., 1998; Marx
et al., 2004; Crawford, 2000). Students engaged in scientific inquiry based learning direct
their own development of scientific skills. Students who take ownership in their own
education will increase their drive to become more science literate and academically
successful. In order to reach these goals, it is important to find a way to engage students
whether it is the use of the natural landscape or any other exciting vehicle that helps
maintain their interests in the many fields of science.
METHODOLOGY
For each major unit of study, I designed and planned a curriculum based on my
expected outcomes regarding student understandings and skills by the end of each unit of
study. The final assessments along with laboratory experiences and activities were
determined prior to introduction of each unit of study to my biology students. A few
additional labs and activities were incorporated into the units as I discovered new ideas
that related to our topic of study. The units were separated into six categories, scientific
inquiry, energy, genetics, evolution, and ecology, based on South Carolina State Science
Standards. Scientific Inquiry was taught all year long while the other five units each
extended over a one to two month time period. This research extended over the genetics

9
unit of study. Mr. Shaw, school principal, signed my exemption for consent and approved
my research project.
Since the goal of this project was to determine if scientific inquiry based
instruction increased student motivation and academic success, I chose the Matrix for
Assessing and Planning Scientific Inquiry (MAPSI) to authenticate our investigations
(Appendix A). The MAPSI also provided me with a rank in the level of complexity of
the lab investigations and activities. Inquiry based lessons and activities were
implemented in all units of study. These included use of discrepant events, misconception
probes, and various laboratory investigations. My research time extended over three units
of study but I have selected one to present, genetics, because it is the most complete in
terms of data. For activities and laboratory activities used to enhance the genetics unit of
study and increase student science inquiry skills, the MAPSI chart was used to determine
if the investigations were more or less student driven, and also used as a means to
measure and validate the level of complexity of each of the investigations. I wanted to
monitor if implementation of inquiry based lessons would be more or less challenging for
students. If more challenging, this may result in a decrease of completion of student
work, in this case a written lab report.
The MAPSI rank allowed me to compare results with other data instruments to
observe any potential patterns. For each lab investigation and for a few activities I
planned for lessons to along with the units of study, the MAPSI was used (1) to
determine if the investigations were more or less student driven, and (2) as a means to
measure and validate the level of complexity of each of the investigations and activities.
Investigations were then categorized as either more student driven and inquiry based or

10
categorized as teacher driven not inquiry based instruction. The MAPSI was used, like a
rubric, to tally points for each step of the scientific method process. A rank of “1” was
given to any category that was mostly teacher driven, a rank of “2” for steps that were
moderately teacher driven, and a rank of “3” for steps that were student driven. Numbers
were tallied per step and indicated a total rank for the investigation.
Students’ prior science knowledge, feelings, beliefs, attitudes, academic success,
and science literacy were measured using the Student Science Survey (Appendix B). The
Student Science Survey asked students to rank their knowledge and feelings about
science. This survey was used to determine a range of student science literacy and
general interest in science. The survey also helped determine if inside, outside, or a
combination of both inside and outside science inquiry labs and studies proved most
favorable to students to help plan labs and activities. Students’ scores were compared
with other collected data for any potential pattern of students’ feelings about science and
confidence levels to do science.
To determine if student motivation increased due to the application of scientific
inquiry based investigations, students conducted several short term and extended biology
related investigations. The investigations were geared towards increasing student science
literacy skills. During this time, teacher observations of student performances were
recorded to monitor student progress with laboratory science skills. Each week, students
were requested to write a brief summary in their biology journal of the past week’s events
in biology class. Student Biology Journals were read and monitored over time. Other
student artifacts (class work, lab work, homework) were reviewed for completion and
effort. Students were requested to write a brief summary each week in their laboratory

11
journal All instruments were used as a measure of student academic progress and student
motivation. To determine an increase in students’ confidence in scientific inquiry over
time, the Student Science Inquiry Survey was given out three times (beginning, midterm,
and end) during the course of this research project. Students’ scores from each
administration were compared to determine any changes in response to the survey
questions. To initiate my research project and data collection, students were given the
Student Science Inquiry Survey (Appendix C). The survey consisted of 39 statements
which were separated into nine categories. The categories were identified as a specific
stage of the scientific inquiry process. Each student was asked to rate their own
confidence level (very confident, confident, not confident) per each statement based on
their current abilities to perform the specified task. The survey was given to all of my
biology honors students to determine how confident my students were at doing science.
The same survey was given two more times during the course of my research. The data
was analyzed to determine patterns in growth in confidence levels with performing
scientific inquiry. Student survey responses for each statement were converted by using a
Likert-scale: 1 = I am very confident on my abilities, 2 = I am somewhat confident in my
abilities and 3 = I am not confident in my abilities. The data were compiled into a
spreadsheet for analysis purposes. Once all the responses were entered into the
spreadsheet per student, the 39 statements were categorized into nine stages of inquiry.
These stages included, exploring, questioning, identifying a statement to test, designing a
procedure for an investigation, using the investigative plan, collecting data for evidence,
communicating results of an investigation, researching for scientific knowledge related to
investigation, and extending investigations.
12
Students were also asked to complete the What Helped Me Learn Genetics Survey
which asked students about their study habits and also likes and dislikes about biology
class (Appendix D). Students’ scores were used to determine if a relationship of
confidence in science inquiry skills related to how students felt about the materials
presented in biology classroom.
For comparison purposes with inquiry-based investigations, several traditional
laboratory investigations were conducted during each unit of study. Data from Teacher
Student Science Skills Assessments and other student artifacts such as Student Biology
Journals were used for comparison purposes (Appendix E). Two laboratory investigations
were chosen for comparisons, one student driven and the other teacher driven as ranked
by the MAPSI analysis.
Measure of Academic Progress (MAP) tests were given to students in the winter
of 2010 for biology. The questions are labeled according to the particular content or
science standard they represent. I selected questions related to scientific inquiry and used
scores to measure academic growth in this area. Students are ranked high, average, or low
per measured science standard based on percent of correct answers. For this research, two
standards were used, Hypothesis/Questions/Design and Design/Scientific Investigations.
Other measures of academic progress included, a common district-wide approved biology
mid-term test issued to students in January, another district-wide benchmark test given in
mid April of 2011, and the South Carolina End of Course Exam for Biology (EOC) given
the first week of June. Students were also assigned computer-based quizzes with a
random mixture of scientific inquiry and content study questions based on specific state
science standard indicators. The computer-based quizzes are issued though our district as

13
a tool used for helping students prepare for the end of year tests and finals. Scores from
the mid-term test, benchmark test, computer quizzes, along with all unit test scores were
used as measures of student academic progress. Scores were used to identify patterns of
growth and correlated with survey data and other collected data. The data sources
provided a triangulation matrix combined with my focus question and the other sub
questions regarding the use of scientific inquiry to increase student motivation and
academic success (Table 1).
Table 1 Data Triangulation Matrix Research Questions
Data Sources 1 Data Sources 2 Data Sources 3
1) What are my students’ existing knowledge of and feelings, beliefs, attitudes toward science and academic success?
Student Science Survey
Student Science Inquiry Survey
Teacher Observations Log
2) How scientifically literate are my students at any given point (can they “do science” that we learn in the classroom)?
Student Biology Journals
Comparisons of MAP Scientific Inquiry scores
Student Artifacts (completion of homework, classroom, effort in labs and activities)
3) Will the use and complexity of inquiry-based labs and activities increase student science skills and motivation?
Student Science Inquiry Survey
Student Biology Journals
Teacher Student Science Skills Assessments; MAPSI
4) Will increase motivation result in an increase in academic success?
Comparisons of MAP scores, Midterm, Benchmark, computer based tests
Comparisons of Units of Study assessment scores
Teacher Observation Log Student Biology Journal

14
DATA AND ANALYSIS
Measures of students’ motivation to come to science class were measured in late
fall of the school year with the Student Science Survey (Appendix B). Survey results
revealed about half of the students, 53%, were excited and motivated to come to a science
class (N=68). The other half of the students indicated they were split between maybe,
22%, and not, 25%, excited and motivated to come to class (Figure 1).
Figure 1. Percentage of Student Response to the Question: Are you excited and motivated to come to science class, (N=68).
Similar patterns are observed in student responses to their own abilities to do
science in the science classroom. The majority of students surveyed feel confident in their
abilities, 52%, (N=68). Other students indicated they were somewhat confident, 38%, or
not confident, 10%, in their abilities (Figure 2).

15
Figure 2. Percentage of Student Response to the Question: How Do You Feel About Your Abilities to Do Science, (N=68).
Student Science Survey results indicate the majority of students, 82%, enjoy
laboratory investigations in science class. Other activities were written on the survey,
such as creative assignments, 9%, any kind of group work, 4%, and even games and
worksheets, each 1%, while one student indicated nothing (Figure 3).
Figure 3. Percentage of Student Response to the Question: What Kinds of Activities Do You Enjoy in Science Class, (N=68).

16
Measurements of what motivates students to do science and complete science
indicate, most students feel they receive ample support with their science work, 84%, and
adult feedback, 85%. Student responses were almost equal towards feeling they should be
rewarded for completing science work, 44%, and not rewarded, 46%, for completion
purposes. While other had somewhat mixed feelings about a reward system, 10%,
(Figure 4).
Figure 4. Percentage of Student Response to the Questions: Do You Feel You Have Enough Help in Science Class; Do You Receive Enough Feedback on Assignments, Projects, and Labs from the Adults in Your Life; Do You Feel You Should Be Rewarded with Things for Completing Science Work to the Best of Your Abilities, (N=68).
Later in the school year, students were asked to write responses to two questions
regarding motivation and their studies in biology class. The first question was, thinking
about this past school year in biology class, please list anything that motivated you to
come to class or got you excited to learn about and do science. Students were also asked
to include items that were not motivators. The majority of student responses indicated
they were motivated by the variety of activities, labs, and a few specifically mentioned a
topic we studied. Many students indicated mini-lectures and note taking were least
17
motivating items but they learned a great deal. The second question students were asked
to respond to, what motivated you to do well in biology or try your hardest. The
overwhelming majority responded parents and the need to do well for college.
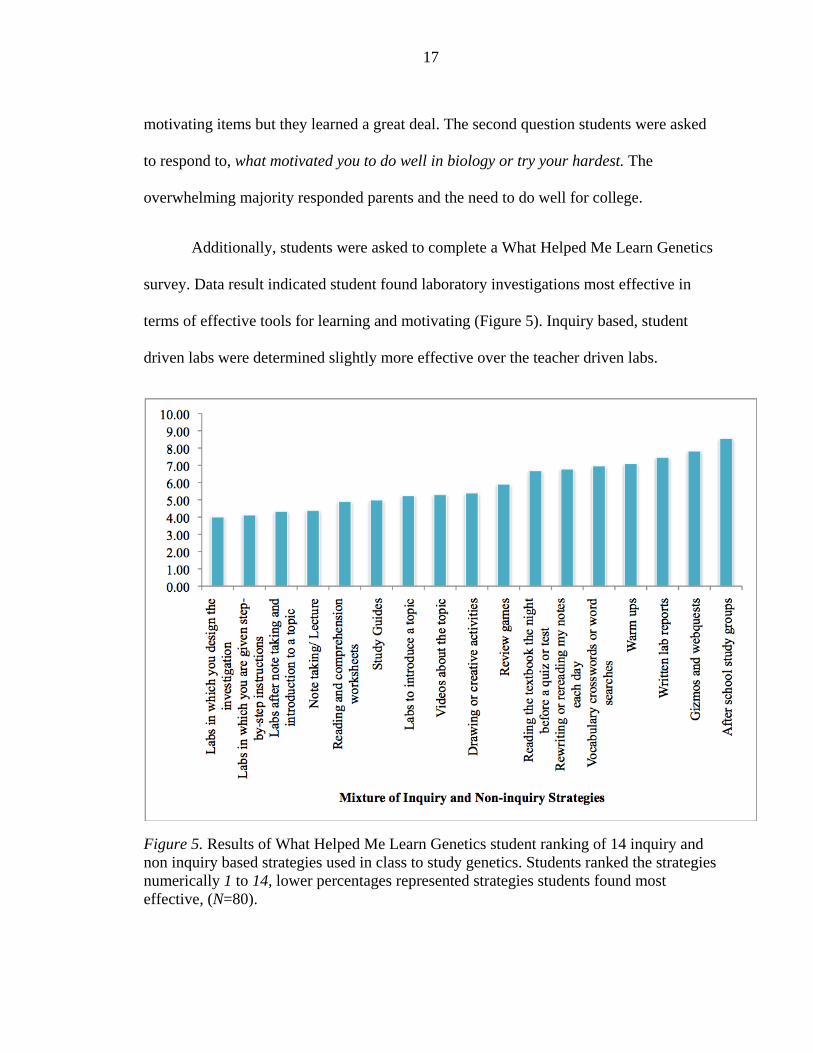
Additionally, students were asked to complete a What Helped Me Learn Genetics
survey. Data result indicated student found laboratory investigations most effective in
terms of effective tools for learning and motivating (Figure 5). Inquiry based, student
driven labs were determined slightly more effective over the teacher driven labs.
Figure 5. Results of What Helped Me Learn Genetics student ranking of 14 inquiry and non inquiry based strategies used in class to study genetics. Students ranked the strategies numerically 1 to 14, lower percentages represented strategies students found most effective, (N=80).

18
To determine if increased motivation resulted in increased academic success,
various assessment scores were used for comparison purposes. Biology MAP test results
indicated the majority of students, 83% and 80%, were ranked high in both scientific
inquiry standards (N=80). Few students were ranked average, 11% and 19%, per standard
and even less were ranked low, 6% and 1% (Figure 6).
Figure 6. Percentage of Students were ranked high, average, low per scientific inquiry standard on MAP test, (N=80).
The school district biology January midterm, combined computer based quizzes,
and biology April benchmark averaged results did not provide an obvious pattern of
student academic success over a four month time period (N=80). Questions per indicator
were randomized and not equally distributed over time (Table 2).

19
Table 2
Total percent averages of student results per district testing over a four month time period, (N=80).
Scientific Indicator (# of questions per indicator)
January Midterm (2)
Combined Computer-based
Quizzes (varied from 0 to 10)
April Benchmark (1)
Appropriate Lab Procedure 41% 75-89% 58%
Compare Investigation Technical Design 81% 90% 28%
Design Scientific Investigation 75% 66-79% 80% Evaluate Controlled Scientific Investigation 62% n/a 95%
Evaluate Technological Design Product 87% 32-57% 27%
Generate Evidence-based Hypothesis 97% 65-94% 95%
Organize and Interpret Data 68% 56-94% 74%
Use of Appropriate Safety Procedures 84% 99% 72%
Use of Scientific Instruments 61% 48-59% 83%
The South Carolina End of Course for Biology Exam (EOC) scores indicated
approximately 90% of my students scored an A or B letter grade. My students had the
highest overall EOC scores in comparison with the students at McCracken that I did not
teach and also with the rest of first year biology students in the entire district (Figure 7).

20
Figure 7. A comparison of Beaufort County biology students per high school percentages of students who scored an A, B, C, D, or F on the South Carolina End of Course for Biology Exam, (N=1459).
There were a total of 10 major activities and laboratory investigations. According
to the results of the MAPSI ranking, six of these ten investigations were more teacher
driven than student driven and thereby less complex. Four of the 10 were ranked more
student driven and thus more complex by MAPSI. The MAPSI data results helped
determine and categorize more inquiry based investigations from less inquiry based
investigations for student surveys. Student data results of the Science Skills Assessment
from two laboratory investigations, one ranked student driven and the other teacher
driven by MAPSI, reveal a general trend that most students ranked adequate for each
skill in both lab examples (N=71). However, comparisons of student results indicated
best and adequate totals in students’ abilities in generating questions, prediction, and
hypothesis were lower with the student driven lab (85%) than those of the teacher driven
lab (93%). The same was observed in the skill category, interpretation of data and
experiment. Data results show a lower percentage of students scored in the best and

21
adequate with student driven lab (65%) compared to teacher driven lab (89%) for the
skill category, interpretation of data and experiment (Figure 8).
Figure 8. Percentage of Students were ranked best, adequate, not met per category on the Student Skill Assessment for TD = teacher driven lab and SD = student driven lab investigation, (N=71).
Written laboratory report grades for the student driven and teacher driven
investigations were used as additional assessments of interpretation of data and
experiment skill category. The data averages indicated no notable differences in the
actual percentages, respectively. However, there was a notable difference in terms of
numbers of students motivated to complete the laboratory report assignment. The student
driven laboratory report average was 63.4% and this percent included eight zeros due to
incompleteness. The averaged grade was 65.3% for the teacher driven laboratory (N=81).

22
Although this percentage is slightly higher, 21 students did not complete the assignment
(N=81). Because students were not motivated to complete the assignment, there were
three times the number of zeros recorded in the grade book for that particular assessment.
The results of the weekly laboratory journal summaries indicate many students
were highly motivated to come to class and enjoyed the variety of work, activities, and
lab investigations. Many also indicated they were excited to see what would happen in
the week to come. They expressed an appreciation for the variety of inquiry based lessons
and include specific references to discrepant events, misconception probes, and inquiry
based lab investigations. Note taking and lecture were not favorable activities and
mentioned as such in student summaries.
Data sums of the Student Science Inquiry Survey were tabulated per category.
The sums were grouped into the nine stages of inquiry skills. Percentages per stage of
inquiry skill per pre, mid, and post were compared. Data was only used for students who
completed each of the three surveys (N=62). Comparisons of pre, mid, and post survey
data results indicated an increase in all skills over time ranging from 8.5 % to 22% in the
high confident category (Table 3).

23
Table 3 Averaged data results of the Pre, Mid, and Post Student Science Inquiry Survey. Students assessed their own abilities in each skill as HC = highly confident, SC= somewhat confident, or NC = not confident (N=62).
Pre Mid Post Exploring HC 46.4 56.5 62.5 SC 45.2 39.1 31.0 NC 8.5 4.4 6.5 Questioning HC 44.1 46.2 57.0 SC 44.6 44.6 36.0 NC 11.3 9.1 7.0 Identifying a Statement to Test HC 46.8 58.1 66.9 SC 46.0 37.9 31.5 NC 7.3 4.0 1.6 Designing a Procedure for an Investigation HC 51.8 57.8 60.4 SC 34.8 35.7 31.3 NC 13.4 6.5 8.3 Using the Investigation Plan HC 73.1 77.4 83.1 SC 24.7 19.9 13.7 NC 2.2 2.7 3.2 Collecting Data for Evidence HC 61.5 65.3 70.2 SC 32.7 31.7 28.0 NC 5.8 3.0 1.8 Communicating Results of an Investigation HC 45.2 47.3 62.0 SC 40.9 46.8 31.2 NC 14.0 5.9 7.0 Researching for Scientific Knowledge Related to an Investigation
HC 32.3 43.5 54.3 SC 58.1 45.2 35.5 NC 9.7 11.3 10.2

24
Extending Investigations HC 38.7 44.1 53.8 SC 48.9 44.1 37.6 NC 12.4 11.8 8.6
Of the nine stages measured, two stood out in pre and post data comparisons in
the highly confident student assessment category. Those stages included researching for
scientific knowledge related to an investigation (22% increased from pre to post survey)
and identifying statements to test (20.2 % increased from pre to post survey). A closer
look at these skills revealed an almost doubled increase from pre to post data
comparisons with, researching for scientific knowledge related to an investigation in
highly confident self rank (Figure 9).
Figure 9. Percentage of Student responses per science skill category for each pre, mid, and post student science self assessments. (N=62). Highly Confident (HC), Somewhat Confident (SC), and Not Confident (NC).

25
There was not as much of an increase with skills included in the identifying
statements to test data result comparison (Figure 10). The stage that received the least
amount of difference between pre and post data results included, designing a procedure
for an investigation (8% increased from pre to post survey). Students struggled with their
abilities to identify variables such as independent and dependent variables in an
experiment (Figure 11).
Figure 10. Percentage of Student responses per science skill category for each pre, mid, and post student science self assessments. (N=62). Highly Confident (HC), Somewhat Confident (SC), and Not Confident (NC).

26
Figure 11. Percentage of Student responses per science skill category for each pre, mid, and post student science self assessments. (N=62). Highly Confident (HC), Somewhat Confident (SC), and Not Confident (NC).
The mid survey resulted served to monitor students during the extent of the
research. The mid survey results were compared and used to chart possible progress or
areas of need with science skills. The mid survey results enhanced the trend in the
overall data set and illustrated students somewhat confident and not confident values

27
decreased as highly confident values increased across all skill levels over the course of
this research (Table 3).
INTERPRETATION AND CONCLUSION
Data results from the Student Science Survey revealed at the beginning of the
study that a slight majority of the students were excited to come to a new science class
while others indicated they had mixed feelings. Those student preexisting beliefs,
feelings, and attitudes towards science class were perhaps echoed in the results from the
first Student Science Inquiry Survey. The first inquiry survey data results revealed the
majority of the students at the beginning of the year were overall somewhat confident to
not confident in their abilities to do science. However, students indicated the activity
they enjoyed the most in previous science classes were laboratory investigations. This
was also reflected in data results of the first Student Science Inquiry Survey as the
majority was highly confident in only two categories and those were related to
performing lab experiments but they lacked the confidence in all other aspects of the
science skills measured. The combined data from the pre surveys suggested students
would benefit from inquiry based labs and lessons to increase their science skills and
thereby, increase their confidence in their abilities to do science. These data helped
formulate an inquiry based curriculum. Since one of the research questions was to
determine if more challenging inquiry based labs and lesson would increase student
motivation and academic performance, the MAPSI table was used for. The MAPSI
ranking provided an unbiased method to measure a variety of laboratory investigations,
activities, and lessons as more or less inquiry based for comparison purposes. The

28
MAPSI also provided a legitimate tool to determine and categorize the ten laboratory
investigations used during this research period as more or less challenging for students.
Although there was some concern student motivation would decrease with the more
challenging student driven inquiry lesson and labs, data results showed the opposite
occurred. More students failed to complete the less challenging teacher driven
assignments. Also, as the mid and post Student Science Inquiry Surveys data revealed,
student confidence levels increased across all science skills perhaps due to the student
driven work. These data support the argument students engaged in scientific inquiry
based learning do direct their own development of scientific skills (Krajcik et al., 1998).
This was supported in the What Helped Me Learn Genetics Survey as students ranked
inquiry based laboratory investigations as the most effective strategy used for learning
genetics content.
Survey data of what motivated students to do well in their academics indicated
adult feedback from parents, coaches, and teachers was important for the majority of
students over any other reward. Students also reported ample help with their science
work at home. Those data suggested relative quick teacher feedback and constant update
of online grade book was important in terms of motivating students to perform well
academically. The feedback and engagement from adults and the school community
suggested the students responded positively to the awareness people cared about their
individual academic success (Wentzel, 1997; Wentzel, 1998). Since students revealed
adequate help at school and at home with science work, the use of more challenging
student driven labs and lessons was suitable for these students. Students welcomed and
responded well to working with not only their teacher but also parents in a collaborated

29
manner in their studies (Bouillion & Gomez, 2001; Crawford, 2000). Data suggested
collaboration with adults may have been an important and effective element in student
motivation.
Another element that added to an increase in student motivation was the fact
many of our inquiry based lessons utilized plants and animals in investigations to explore
real world issues (Windschilt, 2001; Crawford, 2000). Students enjoyed the opportunity
to experience nature and their environment in the classroom and this kept them motivated
to come to class to observe any changes or do any tasks related to the studies. Students
grew plants and conducted scientific inquiry projects for several weeks. Students
investigated the use of biodegradable materials to clean up oil spills and clean water.
Many animals, such as legless lizards, were used for discrepant events and misconception
probes. A salt water tank and fresh water tank were kept in the classroom and stocked
with native animals. Those were just a few examples of how the use of the environment
motivated students and helped them take an ownership in the science classroom and
increased student motivation.
In terms of relating increased motivation with an increase in academic success,
most of the measurements used were perhaps not the most telling. The Biology MAP
scores were used as an initial measure of science literacy among the students. Those and
other successful measures of student literacy included the Student Biology Journals
maintained all year. The use of student biology journals allowed me to monitor student
understanding of various content materials. The materials included warm up questions
related to the previous day’s lessons, abilities to take and record observations, the variety
and level of questions they were instructed to write down during discrepant events, and

30
the use and proper context of biology content vocabulary. The weekly summary entries
in student notebooks allowed me to the opportunity to assess whether the activities and
laboratory investigations helped students make connections with the content. It seemed
and the data reflected students strove to become more literate and make deeper
connections with science concepts with the use inquiry based strategies (NAP, 1996;
AAAS, 1993). Although this process was very time consuming, it was a beneficial tool
for assessing student literacy in science and also motivation to work hard.
To determine if inquiry based activities increased academic success, a variety of
traditional assessments were utilized and compared. In the end, assessment scores proved
not to be the best measure of student academic success over time. Unit test grades proved
not to be a good measure either since most students maintained a consistent A to B
average with slight changes in grade averages throughout the course of this study.
However, the ability for the majority of students to maintain a high grade point average
indicated they were motivated to come to biology class and consistently work hard at
their studies. Student unit test grades also indicated the use of inquiry based strategies
may have helped students contextually retain information (Kirshner et al., 2006; Pillay,
1994). The variety of inquiry based strategies proved to be successful at increasing
student motivation and also successful at helping students consistently perform at a
higher level academically thought the course of this study. My students’ high EOC
scores indicated they had a lot of biology content in the long term memory and they had
to the ability to recall this information on a single end of the year assessment. I attribute
those successful scores to inquiry based learning. Because of inquiry based learning
techniques applied in the classroom, my students were given the opportunity to study the

31
same or similar material in several different ways. They were able to make deeper
connections which helped them academically.
VALUE
To enhance my data results, I would have liked to have surveyed biology honors
students that I did not teach this year. I was allowed by my principal and district to
deviate from the curriculum map for these research purposes but other teachers in the
district were strictly following the teacher planning instructional units for biology
(Appendix F). Although my students’ midterm, benchmark test, and weekly computer
based test averages were inconsistent, they were among the highest of our county’s
students who also took the very same assessments. My students scored the highest in the
county on their biology end of course exam as well (Phillip Shaw, personal
communication, June 6, 2011).
An unexpected benefit with the use of student journals included how students
used the summary entries. Many used them as a diary of what their week was like in
biology class. They indicated strong and weak points of lessons, asked questions, made
comments, indicated to me any struggles. Many of the comments were positive and
thoughtful. The use of the student journals allowed me to dialogue with my students on a
more personal level. I always commented back to them with positive, motivating notes
which they seemed to appreciate. Equally important to me, students made it clear which
teaching methods students liked or disliked. This helped me formulate inquiry based
lessons that motivated students. I think students appreciated and responded well to a
teacher who added a variety of inquiry based learning methods into the science

32
curriculum. The use of inquire based learning, discrepant events, misconception probes,
student driven laboratory investigations, enhanced the learning environment.
In conjunction with the surveys, students were able to access and monitor a
weekly updated online biology grade book. I feel these tools gave students the
opportunity to take ownership in their own educational experience. Over the course of the
school year and especially during the duration of this research, students were motivated
to strive for and maintain a high level of academic success in biology class.
I do feel the more student driven inquiry based laboratory investigations
challenged students more so than the teacher driven labs. The inquiry based labs
challenged students to come up with testable questions, design experiments, and present
their own data and findings. Although my students struggled and were more challenged
with inquiry based labs, they worked harder and did not give up as easily. We had
ongoing plant growth inquiry labs and I allowed students to work and keep science fair
projects in the classroom. This added a sense of ownership in the classroom and students
were excited to get to the classroom to observe and tend to projects. We would work on
these inquiry based labs on “Science Fridays.” This added a break in the weekly routine
in addition to hands-on lessons in which the students were the scientists.
Additionally, the more student driven inquiry based labs allowed me time to work
with students as a colleague instead of instructor. We worked on developing hypotheses,
making observations using scientific tools, looking for materials, and researching
together. Often, students came in during their lunch hour and we would work on data sets
together and look for patterns. My background as a research scientists served my students

33
as we worked side by side on various investigations. I was also able to put them in
contact with other scientists for collaboration purposes. This experience helped motivate
students and also helped students develop higher confidence levels in their abilities to so
science, as reflected in their self assessment surveys.
The use of inquiry based lessons in my biology classroom proved to be
successful. Students may not have academically improved but they did maintain a high
grade average during the course of this research and the school year. The best measure,
students felt they improved over time with the use of inquiry based lessons and
instruction. The variety of inquiry based instruction allowed me to be more creative and
thoughtful in my planning for biology lessons. Through action research, I developed good
repo ire with my students as we communicated often and worked together as
investigators. I cannot imagine teaching any other way or having a better educational
experience than I had this past school year due to this research. My data results indicated
to me, the methods and strategies I used in my classroom enhanced the learning
environment and motivated my students to consistently perform to the best of their
abilities. Through this action research, I learned it is important to create and to maintain
an educational environment in which curiosity and community are encouraged
throughout the learning experience. I also learned as an educator I could encourage fun,
excitement, and love of learning without sacrificing a vigorous biology curriculum.

34
REFERENCES CITED
American Association for the Advancement of Science. (1993). Benchmark for science literacy. Oxford: Oxford University Press.
National Academy Press. (1993). National education science standards. Washington, D.C.: National Academy Press.
Berkson, L. (1993). Problem-based learning: Have the expectations been met? Academic Medicine, 68, S79-S88.
Bouillion, L. M. & Gomez, L. M. (2001). Connecting schools and community with science learning: real world problems and school-community partnerships as contextual scaffolds. Journal of Research in Science Teaching. 38(8), 878-898.
Brooks, J. G. and Brooks, M. G. (1993). In search of understanding: the case for constructivist classrooms. Alexandria, VA: American Society for Curriculum Development.
Crawford, B. A. (2000). Embracing the essence of inquiry: new roles for science teachers. Journal of Research in Science Teaching, 37(9), 916-937.
Bruner, J.S. (1961). The Art of Discovery. Harvard Educational Review, 31, 21-32.
Dewey, J. (1910/1997). How we think. Mineola, New York: Dover Publications. Holbrook, J. & Kolodner, J. L. (2000). Scaffolding the development of an inquiry-based (science) classroom. Fourth International Conference of the Learning Sciences, 221-227. Hubbard, R. S., Power, B. M. (2003). The Art of Classroom Inquiry. Heinemann Publications, Poertsmouth, NH. Grady, Julie. (2010). The Inquiry Matrix. The Science Teacher, November, 32-37. Kirschner, P. A., Sweller, J. & Clark, R. E. (2006). Why minimal guidance during instruction does not work: an analysis of the failure of constructivist, discovery, problem-based, experimental, and inquiry-based teaching. Educational Psychologist, 41(7), 75-86. Krajcik, J. S, Blumenfeld, P. C., Marx W. M., & Soloway, E.(1994). A Collaborative Model for Helping Middle Grade Science Teachers Learn Project-Based Instruction. The Elementary School Journal, 94(5).
(Data Rretrieved 18 February 2010 http://www.jstor.org/stable/1001838 )

35
Krajcik, J., Blumenfeld, P. C., Marx, R. W., Bass, K. M., Fredricks, J, & Soloway, E. (1998). Inquiry in Project-Based Science Classrooms: Initial Attempts by Middle School Students. Journal of Learning Sciences, 7.
Llweellyn, Douglas. (2008). Teaching High School Science Through Inquiry. Corwin Press and NSTA press. Thousand Oaks, Ca and Arlington, Va.
MacIver, D. J., Young, E. M., & Washburn, B.(2001). Instructional practices and motivation during middle school (with special attention to science). Data Retrieved 18 February 2010 from http://eric.ed.gov/ERICDocs/data/ericdocs2sql/content_storage_01/0000019b/80/16/f7/19.pdf
Marx, R. W., Blumenfield, P. C., Krajcik, J. S., Fishman, B., Soloway, E., Geier, R. & Revital, T. T. (2004). Inquiry-based science in the middle grades: assessments of learning in urban systemic reform. Journal of Research in Science Teaching, 41(10), 1063-1080. Pillay, H. (1994). Cognitive load and mental rotation: Structuring orthographic projection for learning and problem solving. Instructional Science, 22, 91-113. Tam, Maureen. (2000). Constructivism, instructional design, and technology: implications for transforming distance learning. Educational Technology & Society, 3(2), 1-17. Wentzel, K. R. (1997). Student motivation in middle school: The role of perceived pedagogical caring. Journal of Educational Psychology, 89(3), 411-419. Wentzel, K. R. (1998). Social relationships and motivation in middle school: The role of parents, teachers, and peers. Journal of Educational Psychology. 90(2), 202-209. Windschitl, M. (2001). Inquiry Projects in Science Teacher Education: What Can
Investigative Experiences Reveal About Teacher Thinking and Eventual Classroom Practice? Curriculum & Instruction, University of Washington, Seattle.
Yager, Robert, Ed. (2009). Inquiry: The Key to Exemplary Science. NSTA Press:
Arlington, VA.

36
APPENDICES

37
APPENDIX A
THE MATRIX FOR ASSESSING AND PLANNING SCIENTIFIC INQUIRY

38
The Matrix for Assessing and Planning Scientific Inquiry*
Increasing in complexity
1. Generating scientifically oriented questions Students do not contribute to the investigation questions; teacher provides questions and/or other resource with questions.
Students make revisions to the questions provided by teacher or resources.
Students develop their own questions for investigation.
2. Making predictions or demonstrating the formulation of a hypothesis before investigation Students do not create predictions or hypothesis; teacher or resources provide these.
Students modify predictions or hypothesis given by the teacher or resources.
Students develop their own predictions and hypothesis for investigation.
3. Designing and conducting research study Subprocesses Designing investigation procedure
Students do not design; teacher or resources provide these.
Students make some contributions.
Students design most of the procedures with limited help from teacher.
Identify variables Students do not choose variables; teacher or resources provide these.
Students choose variable but have limited rationale for choices.
Students have thoughtful, scientific rationale for choices of variables.
Identifying experimental and control groups
Students do not choose experimental or control groups; teacher or resources provide these.
Students design some of the limits of the experiment.
Students give focused attention to the design of controls and conditions.
Data collection and organization of data
Students do not collect data; teacher or resources provide these.
Students collect data with some input and help from teacher or resources.
Student collect and organize data with very little help from teacher or resources.
4. Explaining results Subprocesses Use of simple summary statistics,
Students do not analyze data;
Students do some of the analyzes with
Students do the majority of

39
calculations, and graphing of data
teacher analyzes data.
teacher help. analyzes with limited teacher input.
Identifying evidence based on analyzed data
Students do not identify evidence from data; teacher identifies evidence.
Students identify some evidence from data; teacher identifies most of the evidence.
Students identify evidence from data with limited teacher input.
Checking findings for accuracy, addressing experimental errors
Students do not address accuracy or error analysis; teacher checks for accuracy or error analysis.
Students address some accuracy or error analysis; teacher checks for the majority accuracy or error analysis.
Students address accuracy or error analysis with limited teacher input.
Connecting evidence with scientific knowledge
Students do not strive to make connections with scientific knowledge; teacher or resources provide connections.
Students make some connections with scientific knowledge; teacher or resources provide majority of connections.
Students make connections with scientific knowledge with limited teacher input.
Communicating results (oral or written)
Students do not communicate results; teacher communicates findings to students.
Students communicate some results; teacher communicates the majority of findings to students.
Students communicate results with limited input from teacher.
Addressing additional experimental questions or real-world applications
Students do not address additional questions or application; teacher or resources address additional questions or applications.
Students address few additional questions or application; teacher or resources address most of the additional questions or applications.
Students address additional questions or application with limited input from teacher.
Based on Grady, 2010, pgs. 34-35

40
APPENDIX B
THE STUDENT SCIENCE SURVEY

41
The Student Science Survey
1. Are you excited and motivated to come to science class? Explain. 2. How do you feel about your abilities to “do science”? 3. What kind of activities do you enjoy in science class? 4. Are you motivated by outdoor science labs or indoor science labs? 5. How do you feel when you complete an assignment or project or lab? 6. Do you feel you have enough help in science class? 7. Do you feel your classmates help or hurt your science studies? Explain. 8. Do you receive enough feedback on assignments, projects and labs from adults in
your life (teachers, coaches, parents)? Explain. 9. Do you feel you should be rewarded with things (candy, toys, money) for
completing science work to the best of your abilities? 10. Is there anything else you need me to know?

42
APPENDIX C
STUDENT SCIENCE INQUIRY SURVEY*

43
Student Science Inquiry Survey
Stage of Inquiry I am very confident in my abilities
I am somewhat
confident in my abilities
I am not confident
in my abilities
Exploring Making observations Recording observations
Taking careful notes Drawing illustrations, labeling illustrations Questioning Making questions based on observations Creating scientific investigation type of questions Brainstorming “what if…” possibilities for experimenting Identifying a statement to test Making a statement to test or investigate Recording the statement to test or investigate Designing a procedure for an investigation Brainstorming what to do and steps to take Arranging steps in order Identifying independent variable Identifying dependent variable Identifying control group Identifying experimental group Determining all tools and materials needed Using the investigation plan Obtaining materials needed for investigation Following written procedures Following safety protocols Respectively communicating with others Assuming leadership role Making constructive contributions to the group Collecting Data for Evidence Gathering quantitative and qualitative data Making accurate measurements Organizing data into charts and graphs
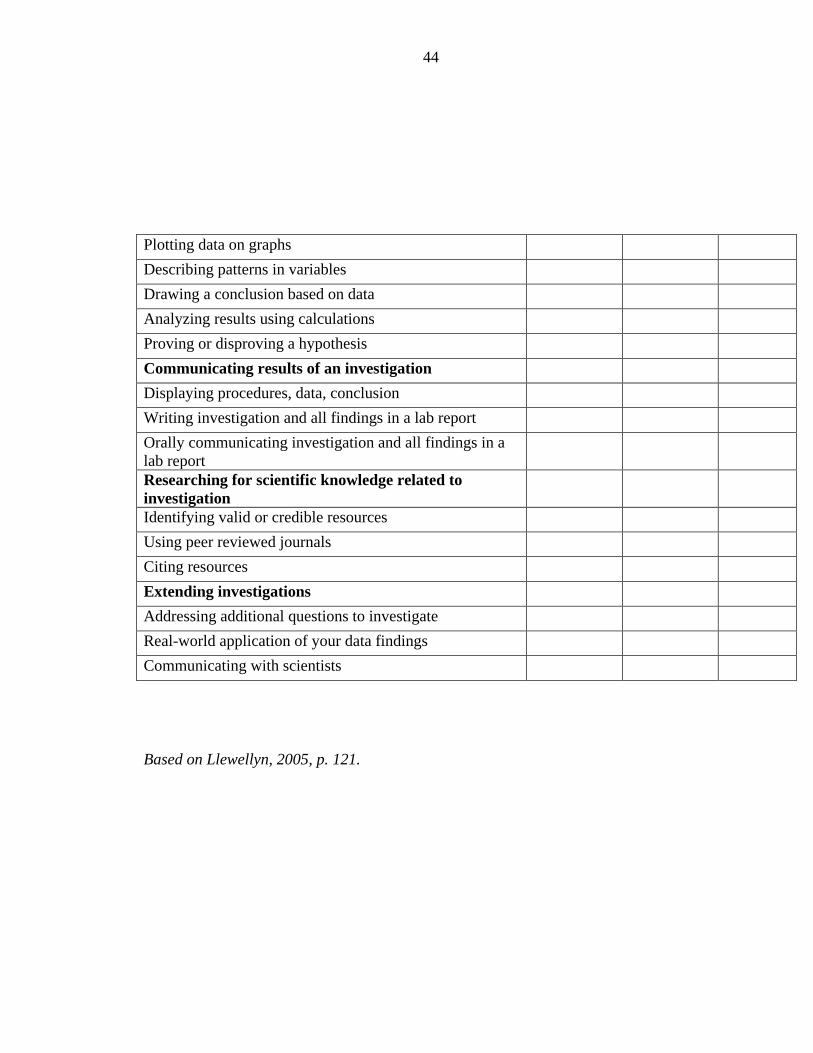
44
Plotting data on graphs Describing patterns in variables Drawing a conclusion based on data Analyzing results using calculations Proving or disproving a hypothesis Communicating results of an investigation Displaying procedures, data, conclusion Writing investigation and all findings in a lab report Orally communicating investigation and all findings in a lab report
Researching for scientific knowledge related to investigation
Identifying valid or credible resources Using peer reviewed journals Citing resources Extending investigations Addressing additional questions to investigate Real-world application of your data findings Communicating with scientists
Based on Llewellyn, 2005, p. 121.

45
APPENDIX D
WHAT HELPED ME LEARN GENETICS STUDENT SURVEY

46
What Helped Me Learn Genetics
Rank the below items in order of 1-17 based on how much the item helps you understand what we study in Biology class. Most helpful = 1 and least helpful= 17.
___ Reading and comprehension worksheets
___ Vocabulary crosswords or word searches
___ Note taking/ Lecture
___ Labs in which you design the investigation
___ Labs in which you are given step-by-step instructions
___ Labs to introduce a topic
___ Labs after note taking and introduction to a topic
___ Written lab reports
___ Drawing or creative activities
___ Videos about the topic
___ Review games
___ Gizmos and webquests
___ Reading the textbook the night before a quiz or test
___ Rewriting or rereading my notes each day
___ Study Guides
___ Warm ups
___ After school study groups

47
APPENDIX E
SCIENCE SKILLS ASSESSMENT*

48
Science Skills Assessment
Start Date _________ Student Name______________________________
Scale 1, 2, 3 (1 = best; 2 = adequate; 3 = not met)
Lab Activity
Date Completed
Questions, Predictions, Hypothesis
Lab Skills & Conduct
of Experiment
Observations & Data
Recording
Interpretation of Data &
Experiment
Responsibility, Initiative,
Work Habitats
Notes
*Based on Hofstein, Lunetta, and Gidding,s 1981.

49
APPENDIX F
EXEMPTION REGARDING INFORMED CONSENT

50