Embed Size (px)
Citation preview
A REVIEW OF INQUIRY BASED SCIENCE INSTRUCTION REFORM
Lorry A. Fitzpatrick
A Thesis Submitted to the University of North Carolina Wilmington in Partial Fulfillment
for the Requirements for the Degree of Master of Education
Department of Education Leadership
University of North Carolina Wilmington
2012
Approved by
Advisory Committee
Marsha Carr Martin Kozloff
Susan Catapano Chair
Accepted by
Dean, Graduate School
ii
TABLE OF CONTENTS ABSTRACT ................................................................................................................................... iii
ACKNOWLEDGEMENTS ........................................................................................................... iv
DEDICATION ................................................................................................................................ v
LIST OF TABLES ......................................................................................................................... vi
INTRODUCTION .......................................................................................................................... 1
Overview ...................................................................................................................................... 1
Relevant Literature ....................................................................................................................... 2
Problem Statement ..................................................................................................................... 13
METHODS ................................................................................................................................... 14
Research Design ......................................................................................................................... 14
Data Collection .......................................................................................................................... 14
Profile and Statistics of Respondents ......................................................................................... 15
Reliability and Validity of Survey Items ................................................................................... 15
Limitations of the Study ............................................................................................................. 17
Ethical Considerations ............................................................................................................... 17
RESULTS ..................................................................................................................................... 18
Survey Response Data ............................................................................................................... 20
Findings ...................................................................................................................................... 21
CONCLUSIONS ........................................................................................................................... 30
Implications ................................................................................................................................ 30
Recommendations ...................................................................................................................... 30
Summary .................................................................................................................................... 31
LITERATURE CITED ................................................................................................................. 32
APPENDIX ................................................................................................................................... 37
Appendix A. Survey Short Form ............................................................................................... 37
Appendix B. Survey Long Form ................................................................................................ 40
iii
ABSTRACT In the United States and specifically, North Carolina, there has been concern raised about
the achievement of students in science. This is especially and increasingly true as achievement
data has become readily available. This document reviews two aspects of this concern. The first
is a literature review of education reform both in general and secondary school science from an
historic and then an instructional perspective. The second is the analysis of electronic survey
data gathered from secondary science teachers in northeast North Carolina regarding classroom
instructional practice. Although serious reform efforts have been made since the early 1980’s,
there remains a gap between documented recommendations, governing body support and
classroom practice. In this time of teacher accountability, these contradictions in execution
toward educational objectives will continue to have far-reaching negative impact on students,
teachers and school districts.
iv
ACKNOWLEDGEMENTS
I would like to express my thanks to several people in the science education community.
First to Larry Dukerich of the American Modeling Teachers Association and Arizona State
University who first introduced me to the logic and strategies of what students of chemistry
should learn, why they should learn it, how it makes sense to teach it and the research that
supports teaching with modeling. Next to Scott Ragan from The Science House at North
Carolina State University in Raleigh, NC for encouraging and including me in many professional
development opportunities to enrich and enhance my teaching skills. Sincere appreciation goes
out to Rebecca Stanley, colleague, for her special brand of humor, camaraderie, sarcasm, support
and friendship.
Particular thanks go to my husband, Jim and my children, Jay, Colin and Tara. Their
patience, help and unwavering belief in me are invaluable. Additional thanks go to my parents
and sisters who have always helped me realize exactly who I was supposed to become. Also,
special thanks go to the Walker, Iacovone and Firetti families, for their friendship and
encouragement and to my former students for challenging me each and every day to be a better
teacher.
Finally, I would like to thank my committee for their guidance and assistance throughout
the thesis process.

v
DEDICATION This work is dedicated to Mr. Ralph Henry, retired teacher of physics at North Kingstown
Senior High School. Through his enthusiasm and skill Mr. Henry, has helped countless students
who were not necessarily interested in science, including me, discover their inner geek.
vi
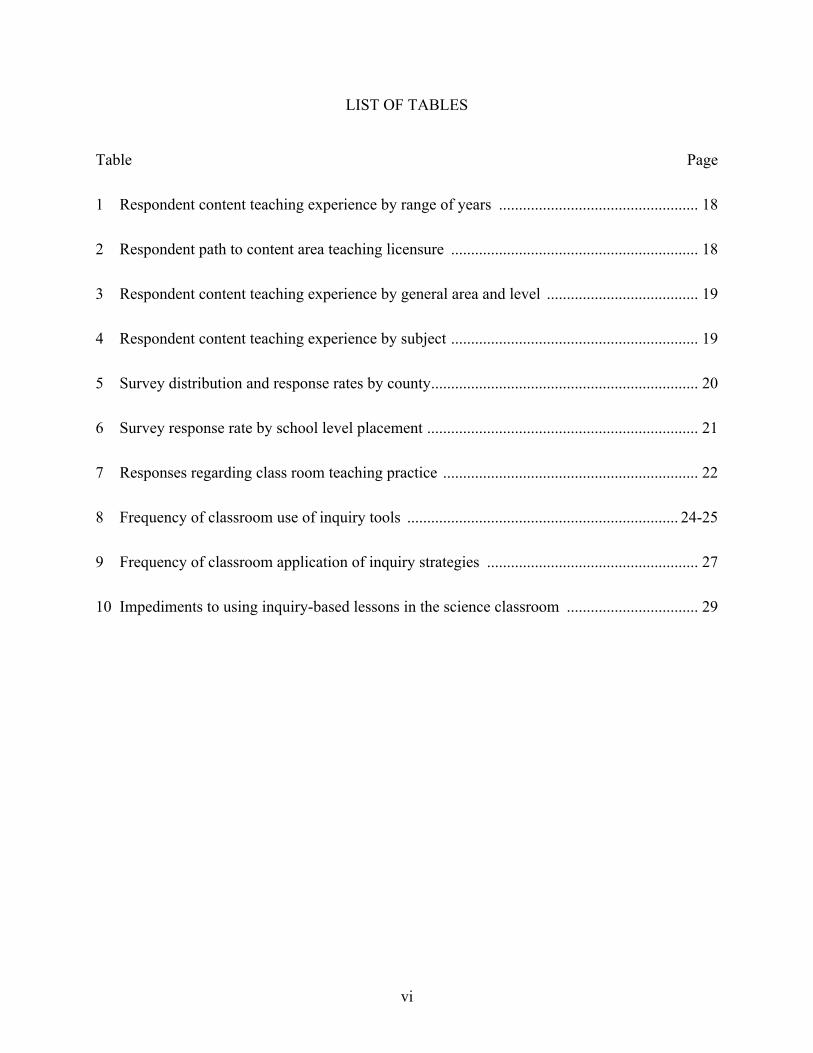
LIST OF TABLES Table Page
1 Respondent content teaching experience by range of years .................................................. 18
2 Respondent path to content area teaching licensure .............................................................. 18
3 Respondent content teaching experience by general area and level ...................................... 19
4 Respondent content teaching experience by subject .............................................................. 19
5 Survey distribution and response rates by county ................................................................... 20
6 Survey response rate by school level placement .................................................................... 21
7 Responses regarding class room teaching practice ................................................................ 22
8 Frequency of classroom use of inquiry tools .................................................................... 24-25
9 Frequency of classroom application of inquiry strategies ..................................................... 27
10 Impediments to using inquiry-based lessons in the science classroom ................................. 29
INTRODUCTION
Overview
Inquiry, according to Webster’s Dictionary is 1: examination into facts or principles:
research; 2: a request for information; 3: a systematic investigation often of a matter of public
interest. The North Carolina Department of Public Instruction (NCDPI) directs that “The goal of
the North Carolina Standard Course of Study (NCSOCS) for Science is to achieve scientific
literacy” (North Carolina Department of Public Instruction, 2007). Further, “The National
Science Education Standards define scientific literacy as "the knowledge and understanding of
scientific concepts and processes required for scientific decision making, participation in civic
and cultural affairs, and economic productivity". (National Research Council, 1996, p. 22)
Indeed, since the mid 1950’s a continuing concern has been the effect of quality science
education in public schools on the ability of Americans to make sound decisions regarding
national security, economic growth, and key political issues. In addition, apprehension has been
the ramification of declining science achievement on world leadership and American
employability (Hennessey, 2002; National Commission on Excellence in Education, 1983). It
has even been claimed that the “welfare of the nation and the individual will be improved when
all citizens have sufficient understanding of science to make soundly based personal, civic and
professional decisions” (American Association for the Advancement of Science, 1990, p. vii).
There are many sources of scholarly literature supporting the approach that active science
learning integrates the need for students to participate in the nature of science by recalling and
using accepted science knowledge, their past science learning and their reasoning strategies, as a
scaffold to build understanding. Recent research has identified several key strategies for
teaching nature of science, often reflecting general principles of effective learning. First, be
2
explicit. Second, guide student reflection. The third and last basic strategy for teaching science
is: use authentic examples. Namely, draw on real science (Allchin, 2011). Science teachers and
science education literature are full of ideas in the most appropriate or effective ways to teach
scientific facts, principles, and concepts but most commonly expressed is the idea that learning
science is a participatory endeavor. “In the National Science Education Standards, the term
“active process” implies physical and mental activity. Hands-on activities are not enough—
students also must have “minds-on” experiences” (National Research Council, 1996, p. 20).
This is (National Commission on Excellence in Education, 1983) the basis for use of the term
‘inquiry’ in regard to science education.
Relevant Literature
Historical Perspective. Since the 1930’s American schools have stumbled from crisis to
crisis and their internal confusion and aimlessness remains intact. Crises such as heated
pedagogical battles between progressive educators and traditionalists, critical shortages of
teachers and buildings, low teacher salaries and poorly qualified teachers (Ravitch, 1981).
Reforms truly began to gain momentum in the 1950’s. Nearly every document regarding the
motivation of reform of science instruction in the U.S. names the launch of the first Sputnik
orbiting artificial satellite on October 4, 1957 as the cornerstone event.
In the 1950’s, the US federal government established the National Science Foundation
(NSF). However its concentration was on science and engineering graduate level studies. After
the launch of Sputnik, NSF funding substantially increased resulting in a greater focus on
elementary and secondary education through curriculum development and teacher training.
Among the many objectives of Title III of the 1958 of the National Defense Education Act
(NDEA) was the modernization of public school laboratories and curriculum. Through the NSF
3
curriculum efforts in the 1950’s and 1960’s science education practices encouraged discovery
through experimentation rather than memorization of formulas and theorems, called conceptual
insight (Rosenblatt, 1982). Today, this might be called inquiry-based learning. However, the
federal support for the professional development motivated in the post-Sputnik era and mostly
funded by the NSF began its decline by 1968 and was nearly eliminated by 1975. Contributing to
the decline in science education quality in the late 1960’s and early 1970’s were the
overshadowing concerns regarding poverty, rights of minorities and the handicapped as well as
the war in Vietnam (Rosenblatt, 1982).
In the 1970’s with SAT scores continuing to drop concerns were rising due to seemingly
acceptable norms including high student absenteeism, minimal instructional time during the
school day, and little homework assigned. Curricula were watered down to accommodate
elective and life skill courses and low enrollment levels led to low high school graduation rates
(Ravitch, 1981). A back to basics attitude began to prevail emphasizing fundamentals and
traditional teaching methods but also leading to standardized minimal competency requirements
(Rosenblatt, 1982).
Well after the Sputnik inspired science education reforms of the 1960’s the 1983 A
Nation at Risk: The Imperative for Educational Reform was published by the United States
government and the results were not encouraging (Brady, 2008). During the 1980’s science
education reform again began its rise. Twenty-five years after the Soviet Union launched the first
Sputnik the adequacy of education in America continued to be growing concern of educators,
scientists, industry leaders and citizens. The inadequacies of the American educational system
were seen as a threat posed against the American way of life due to the overall decline of
scientific literacy of the general population. The shortfalls were mainly in math and science
4
education and were attributed to declining student competency, reduction of the minimum
requirements for high school graduation, the shortage of teachers qualified to instruct in these
areas and the poor quality and inadequate supplies of instructional materials, (Hennessey, 2002;
(Ravitch, 1981; Rosenblatt, 1982).
The shortage of qualified math and science teachers was blamed on teacher
disillusionment with teaching due to low pay, perceptions of their status as professionals and
general lack of student motivation, as well as industry luring them away from education with
higher salaries (Handelsman, et al., 2004; Price, 2008). Evidence of the math and science
education crisis came in the form of lower academic standards, and the social promotion of
students from one grade to another. In addition, 50% of high school graduates had never taken
physics or chemistry courses and some took no math courses at all. Adding to this was the
reduction in admission standards by many colleges and universities in order to maintain
enrollment numbers (American Educational Research Association, 2007; Hennessey, 2002).
In response, the Carnegie Foundation published A Nation Prepared: Teachers for the
21st Century in May 1986. This report of the Task Force on Teaching as a Profession cited the
need for all of America’s children to have access to the best possible education with a focus on
restructuring schools and redefining teaching as a career. Focus was on raising standards for
teacher preparation and performance and improving equitability in compensation, opportunity
and professionalism for teachers (Carnegie Forum on Education and the Economy, 1986). Also
published in 1986, Tomorrows Teachers: A Report of the Holmes Group. This study covered the
necessary reforms of teacher education and the teaching profession, namely teacher preparation,
on-going professional development, and standards for teacher assessment.
In 1989, The American Association for the Advancement of Science (AAAS) introduced
5
Project 2061 with a primary goal of promoting national scientific literacy. The AAAS published
a report called Science for All Americans: Education for a Changing Future stressing that
science education should be founded on scientific teaching and focus on habits of mind (Lee &
Paik, 2000). The report stressed that science education should “involve active learning strategies
to engage students in the process of science (should use) teaching methods that have been
systematically tested and shown to reach diverse students” (Handelsman, et al., 2004). At the
same time the Curriculum and Evaluation Standards for School Mathematics were published by
the National Council of Teachers of Mathematics (NCTM) as well as Everybody Counts by the
NRC in both of which mathematics educators and mathematicians were pioneers on the subject
of national standards (National Research Council, 1996). Thus began the renewed task for
scientists and science educators to define the outcomes for science education in the U.S.
In 1990 The Liberal Art of Science: Agenda for Action generated “recommendations of
goals for liberal education in the sciences as well as the multidisciplinary curriculum and
teaching strategies necessary to achieve them” (American Association for the Advancement of
Science, 1990, p. viii). During the 1990’s, several drafts of reform vehicles were introduced
including the NSTA’s first Scope & Sequence in 1992 and in 1993 the AAAS companion report
to Science for All Americans, Benchmark for Science Literacy: A Tool for Curriculum Reform.
The development of Benchmarks for Science Literacy, from AAAS and the National Science
Education Standards by the National Research Council (NRC) in 1996 were intended to guide
the reforms. “In the National Science Education Standards, the NRC spelled out what all students
should know and be able to do in science at grades K-4, 5-8, and 9-12. Its focus on inquiry-based
science, rather than memorization was somewhat controversial at the time, but it has been shown
to be more effective as a model for teaching science, if less amenable to multiple-choice tests”
6
(Brady, 2008). Contrary to AAAS’s Science for all Americans which emphasized the habits of
mind of scientists, the National Science Education Standards focused on the importance for
students to recognize, understand be able to accomplish and scientific inquiry (Lee & Paik,
2000).
In 1994, congress approved two pieces of legislation to raise the levels of student
achievement in America. One was Improving America’s School Act, the other, Goals 2000:
Educate America Act “To improve learning and teaching by providing a national framework for
education reform; to promote the research, consensus building, and systemic changes needed to
ensure equitable educational opportunities and high levels of educational achievement for all
students; to provide a framework for reauthorization of all federal education programs; to
promote the development and adoption of a voluntary national system of skill standards and
certifications; and for other purposes” (U.S. Department of Education, 1994). A study first
conducted in1995, verified the need for changes to how science was being taught. The Trends in
International Mathematics and Science Study (TIMMS), provided reliable and timely data on the
mathematics and science achievement of U.S. 4th and 8th grade students compared to that of
students in other countries (American Educational Research Association, 2007; Hennessey,
2002). This study has been repeated in 1999, 2003, and in 2007. These studies helped lead the
way to more legislation regarding educational reform. In 2001, the No Child Left Behind Act
(NCLB), produced sweeping reforms in teacher accountability and achievement for students and
in 2007 the America Creating Opportunities to Meaningfully Promote Excellence in Technology,
Education and Science Act (COMPETES) which increased federal support for math and science,
specifically funding subsidies for public STEM High Schools and for scholarships for potential
math and science teachers and for current math and science teachers to upgrade their skills
7
(Price, 2008).
In the new millennium there have been several protocols developed to support inquiry-
based learning, improving upon the 1990’s Problem Based Learning (PBL) curriculum. Among
them were the Science Writing Heuristic (SWH), Full Option Science System, Case study
Science, the Science-technology-environment-society (STES) interface, Science, Technology
and Environment in Modern Society (STEMS) now science, technology, engineering, and
mathematics (STEM). The SWH protocol for example is “structured so that students engage in
reasoning and transforming evidence into knowledge claims in parallel with scientists’ reasoning
and writing” (Akkus, Gunel, & Hand, 2007).
In 2006 the NRC’s How Children Learn Science publication outlined a clear model of
science instruction and explained and its research documented effectiveness. Even at the
university level changes have been made to science instruction. Many of these programs are
designed to both emulate the experience of scientists while artfully guiding students through
science content. Colleges around the country are encouraging the development of science
courses based upon inquiry. An example at the college level is an actual student research
expedition assigned by Frank Heppner at the University of Rhode Island. Some of the key
benefits are “valuable in terms of helping [students] discover why scientific research takes as
long as it does, and why being able to deal with bureaucracy, repeated frustration, and apparently
intractable obstacles are key skills for a professional scientist” and “the number of decisions that
would be required, and the necessity for developing a workable method for arriving at decisions
in a group, safety, logistics, transportation, data gathering, data reduction, etc. but the largest
unpleasant surprise came when [he] asked how they proposed to pay for this research. This
would be cooperative learning with a vengeance” (Heppner, 1996). There are other whole
8
course examples such as the Calculus based Physics without Lecture at Dickinson University;
SCALE-UP (physics) at N.C. State University; and Workshop Biology at the University of
Oregon (Handelsman, et al., 2004, p. 522). Universities and school districts are teaming up to
assist teachers in transitioning to teaching science using scientific thinking strategies. One of the
most promising of these is the Modeling Instruction in High School Science originating in 1994
at Arizona State University (Arizona State University, 2010).
Instructional Perspective. Science teachers in the United States today have more resources,
greater availability of scientific and educational research and more guidance from governing
authorities of end goals than ever in our history. Why, then, does there remain a gap in the
performance of American science students as compared to their contemporaries within the U.S.
and around the world and what must be done to close it (Metz, 2008)? The solution appears to
lie not in what we teach, but in how we teach it. For years science teachers have worked to
improve science education by teaching science through doing science. This is not a new concept.
As early as 1968, the well-known behaviorist, B.F. Skinner, wrote an article about this very
issue. “We cannot improve education to any great extent by finding more good teachers and
more good students. We need to find practices which permit all teachers to teach well and under
which all students learn as efficiently as their talents permit” (Skinner, 1968, p. 705). The tenets
of Free and Public Education and No Child Left Behind, which “emphasizes that reform of
teacher preparation is part of an urgent national commitment to bring high-quality teacher
candidates into the classroom” (Mangrubang, 2004, p. 292) are not new either.
Traditionally, “most introductory (science) courses rely on "transmission-of information"
lectures and "cookbook" laboratory exercises — techniques that are not highly effective in
fostering conceptual understanding or scientific reasoning. There is mounting evidence that
9
supplementing or replacing lectures with active learning strategies and engaging students in
discovery and scientific process improves learning and knowledge retention. (Handelsman, et al.,
2004, p. 522)
Many experienced science teachers are accustomed to being the giver of knowledge and the
students simply as recipients. This kind of thinking no longer assists students in our ever
changing, and technology dependent world. In addition to content standards, what students are
expected to know and be able to do, schools are responsible for promoting twenty-first century
skills. In the United States this means “schools must move beyond a focus on basic competency
in core subjects to promoting understanding of academic content at much higher levels by
weaving 21st century interdisciplinary themes into core subjects: Global Awareness, Financial,
Economic, Business and Entrepreneurial Literacy, Civic Literacy, Health Literacy” (Partnership
for 21st Century Skills, 2007). These skills include learning and innovation skills: creativity and
innovation, critical thinking and problem solving, communication and collaboration;
information, media and technology skills: information, communications and media literacy; life
and career skills: Flexibility, adaptability, initiative and self-direction, social and cross cultural
skills, accountability, productivity, leadership and responsibility (Partnership for 21st Century
Skills, 2007). Traditional teaching strategies will not promote these skills. Reform in science
education should be founded on "scientific teaching," in which teaching is approached with the
same rigor as science at its best.
Good science education involves active learning strategies to engage students in the
process of science and teaching methods that have been systematically tested and shown to reach
diverse students (American Association for the Advancement of Science, 1990). Through
guided inquiry, students develop or construct an understanding of a concept for themselves, with
10
the teacher facilitating the classroom activities and discussion (Uno, 1990). When science
teachers use strategies that require students to be both physically and mentally engaged, they
facilitate the active construction of meaning” (Clough & Clark, 1994).
A concern of science teachers as well as administrators, and legislators, is that teaching
science using inquiry strategies, as the primary method of instruction will reduce the amount of
content able to be covered. Over short periods of time, especially in the sciences, incredible
progress and discovery is made and documented. It is not realistic to expect that students learn
all traditional science content in addition to modern discoveries and technologies in the same,
and sometimes smaller, time frame that students followed twenty years ago. Interactive
approaches used during large lecture classes significantly enrich learning. This is worthwhile
even with the possible reduction in coverage of specific content due to the time necessary to
conduct inquiry-based activities. In addition, there is no loss in knowledge acquisition as
determined by standardized exams (Allred, Brewer, & Ebert-May, 1997).
Promoting the utilization of inquiry-based instruction in secondary science education is
not a recommendation to teach using this single instructional strategy to the exclusion of direct
instruction, or any other instructional strategy. This should not be a viewed as a continuation of
the conflict between advocating progressive versus traditional instructional methods. It is not a
suggestion that teachers utilize unguided instruction “based on the assumption of having learners
construct their own solutions” (Kirschner, Sweller, & and Clark, 2006). According to prominent
biochemist and former president of the National Academy of Science, Bruce Alberts, “teaching
science as inquiry is, at a minimum allowing students to conceptualize a problem that was solved
by a scientific discovery, and then forcing them to wrestle with possible answers to the problem
before they are told the answer” (Alberts, 2000, p. 4). Running parallel is the stance for the
11
exclusive use of explicit learning is the argument that mathematical processes should only be
taught by standard algorithm (Math Experts - Q&A, 2011). This idea marginally applies to the
secondary science classroom. It is only learning how to use and apply mathematical processes,
not learning the processes themselves, to help explain natural phenomena that should be of
concern in a secondary science classroom. Ideally, the sequencing of curriculum ensures that
middle and high school students acquire the necessary math skills prior to needing them in the
study of the sciences.
Various philosophies on teaching aspects of science by mirroring methods of scientists
have been often been lumped together as though identical in basis and implementation. There
have been several viewpoints in the evolution of including scientific methodology in the science
classroom. Labels such as discovery learning, problem-based learning, inquiry learning,
experiential learning theory and all often combined, simplified and often condemned as
constructivist learning theory. Using the term ‘unguided instruction’ in the science classroom
would imply that the teacher is not engaged in teaching and that would not only be unsafe, it
would be unprofessional and unethical. Using inquiry strategies, with intentional scaffolding,
careful crafting direction and assessment, mimics some of what scientists do in actuality. That is
not the same thing as “assum(ing) that knowledge can best be acquired through experience based
on the procedures of the discipline” (Kirschner, Sweller, & and Clark, 2006). As an example, to
teach a middle school child how to build a birdhouse would instruction begin by giving them a
tree, power saw and hydraulic nail gun and then tell them to have at it? A lesson might begin by
discussing what features a bird needs in a house, next having the child sketch what they think the
house should look like with its dimensions, making a list of the supplies needed, and perhaps
with a visit to the hardware store. It might reasonably be assumed that the child would know
12
what birds were, as well as what wood; nails; glue; sandpaper; etc. are. In addition, for a child’s
first effort, we would likely provide basic (and safe) tools rather than sophisticated equipment
Purposeful science instruction does not involve simply providing a worksheet with a list of
recipe-like steps. Nor does lecturing for ninety minutes, requiring students to take notes and then
build according to what they managed to record. However, chunking the tasks, supervising,
correcting and asking questions along the way would be. Through questioning and discussion at
the outset of the project, any existing knowledge gaps and misconceptions would be revealed so
that the child can be purposefully guided to reach the intended outcome.
This is how realistic inquiry instruction happens. It is not simply including hands on
activities or an alternative to lecture. It is also not exclusively focused on application as assumed
by Kirschner (Kirschner, Sweller, & and Clark, 2006). It involves thinking and speaking about
what is already known, questioning, observation, testing, reflective thought and dialogue. “What
students learn earlier is conspicuously integrated with what they learn today, which prepares
them for what they learn next” and “This order gives students’ participation a clear sense of
meaningfulness; their participation leads to mastery and application” (Kozloff, 2002, p. 14).
What happens in many current secondary science classrooms does not provide for correction of
misconceptions, making inferences to connect new ideas with prior knowledge, or for
generalizing classroom examples to a greater environment. It does not encourage students to
make critical observations or question why something is so, two processes inherent in scientific
study that fosters thinking skills that students need as they approach adulthood.
Through active participation in learning, students establish connections between current
understanding and application of new scientific concepts, ideas, and questions. Students engage
in observation, questioning, informed discussion, planning for problem solving and making
13
decisions based upon solid evidence. “Emphasizing active participation in science learning
means shifting emphasis away from teachers delivering information and merely covering science
topics. The perceived need to include all the topics, vocabulary, and information in textbooks is
in direct conflict with the central goal of having students learn scientific knowledge with
understanding” (National Research Council, 1996, pp. 20-21; Hennessey, 2002, p. 3). Ryder
discusses weaknesses in existing school science curricula. The “presentation of the concepts and
relationships of science (knowledge in science) without any reference to the ways in which these
ideas were developed (knowledge about science)” and that “knowledge about science cannot be
decontextualized; it is only meaningful when elaborated in specific science contexts” (Ryder,
2002, p. 639). This has been the foundation for science education reforms for the past fifty
years.
Many state and federal governments have mandated in such documents as the National
Science Education Standards that inquiry strategies should be the focus of the teaching of science
within school classrooms (National Research Council, 1996). The difficult part for success is
changing teacher practices from perceived traditional ways of teaching to more inquiry-based
approaches (Paik, Zhang, Lundeberg, Eberhardt, Shin, & Zhang, 2011). In their study, Akkus;
Gunel; and Hand (2007), state “the current emphasis for studies on professional development
programs have focused on teacher changes in beliefs and classroom practices” (p. 1746).
Problem Statement
Is secondary science education in the United States and primarily in North Carolina, has
implementation of effective science education reform to incorporate inquiry methods transpired
and if not, what are the primary impediments? This primarily concerns the elimination of
information delivery by lecture or demonstration methods, use of student lab activities that make

14
no connection to real life situations and shallow coverage of concepts with no practical exercise
in scientific problem solving methods.
METHODS
Research Design
This project utilized both quantitative and qualitative data collection tools. The
qualitative aspect required research to gather relevant information from scholarly articles,
journals, interview, and Internet resources regarding science education reform from a historical
perspective. This was followed by compilation of the information in order to analyze the
material and arrive at a more complete understanding, and historical reconstruction, of events
that occurred during the past fifty years in science education in the United States. Through
examination of literature from 1960 to present, the evolution of teaching reform in the sciences,
specifically the use of inquiry-based strategies is illustrated. Most especially examined were the
motivations behind education reforms in the sciences, the research and recommendations from
both government and scientific communities and the assessment of both short and long term
success in reaching established goals. Analysis of assembled information will primarily focus on
identifying common teaching practices, that existed during that time in history, views regarding
their worth, and the transformations of law, professionalism and attitudes devised to promote
student success in science education.
Data Collection
Information was collected from secondary science teachers in Southeastern North
Carolina using electronic survey methods. Two forms of survey containing thirteen questions
were designed using Microsoft Excel. One included features such as drop down menus and
check boxes for ease of use and efficiency of time spent by both the survey recipients and the
15
surveyor (Appendix A, Figures 1-3). The second was a slightly longer length, more manually
utilized form with identical questions and answer choices (Appendix A, Figure 4-7). Both
survey forms were sent to all recipients with the option to complete either one, according to
preference. The documents were sent via email to every middle and high school science teacher
in the counties of Brunswick, New Hanover, and Pender, North Carolina with two reminders
requesting completion each at a two-week interval. The survey gathered information regarding
teaching experience, current practices, knowledge and attitudes for teaching secondary science.
Data from survey respondents was quantified, analyzed and compared to past and current
education standards and expectations to determine the extent of reform application.
Profile and Statistics of Respondents
Three counties are located on the corner of the southeastern coast of North Carolina.
These are Brunswick, New Hanover and Pender Counties. These counties cover an approximate
area of 1,908 square miles of urban, suburban and rural area, with a combined population of
362,315 (U.S. Census Bureau, 2011). In Brunswick County there are four public high schools,
including an Early College high school and a transitional middle / high school and five public
middle schools including one K-8 school. New Hanover County secondary schools comprise six
high schools, including two Early College high schools and eight middle schools. There are four
high schools in Pender County including one Early College high school, as well as four middle
schools.
Reliability and Validity of Survey Items
In assessing the reliability of the research protocol several aspects were considered. One
is equivalence, which “refers to the amount of agreement between two or more instruments that
are administered at nearly the same point in time. Equivalence is measured through a parallel
16
forms procedure in which one administers alternative forms of the same measure to either the
same group or different group of respondents” (Miller, 2011, p. 1). This research protocol
utilized two forms of the survey instrument selected entirely by respondent preference. Either
version of the survey provides identical response options. Since there is a high degree of
correlation between the two forms, there is a resulting high degree of equivalence. Another
aspect is stability. The stability of this trial of research cannot be determined as there has not
been a repeat of the survey with which to compare. A third aspect is internal consistency. In
regard to internal consistency, the extent to which items on the test or instrument are measuring
the same thing, each of the survey items exclusive of respondent profile information (items 5-13)
addresses one aspect of teaching practice that might be applied in the use of inquiry to teach
secondary science. Reliability measures of the survey could have been improved by increasing
the number of items providing overlapping data. However, increasing the size of the survey may
also increase the risk of an even lower response rate.
Validity by definition “is the degree to which an instrument actually measures the
concept or construct it is supposed to measure” (Slavin, 2007, p. 178). There exists some
conflict of response between questions 5 and 6, the first two in the survey that address actual
classroom teaching strategies. Although 4.5% of respondents claim not to use inquiry-based
lessons in response to question #5, 0% responded to the next question that they indeed, don’t
teach inquiry-based lessons. From a teacher with 4-6 years experience in science: “I did similar
research when getting my master's. I found very little evidence that inquiry-based lessons
actually improve student learning. Many of the papers that spoke to inquiry-based learning
actually had very little true science to back up their claims. One study showed there was a slight
improvement in learning for middle-school students. One study showed that frustration felt by
17
less successful students actually caused harm. Therefore, I only use true inquiry-based activities
with students that I believe will benefit and I do so sparingly. Not all labs in science courses are
inquiry based” (Teacher N. H., 2012). These conflicting results alone bring into question whether
the research participants consider the term ‘use inquiry-based lessons in the science classroom’
in the same way.
Limitations of the Study
The concentration of science teachers in one small area of North Carolina does entail
some limitations. Primarily that results may not apply to schools in other areas of the state, or in
other areas of the country, any of which may have different contexts under which they operate.
Secondly, the narrow range of the study does not necessarily afford generalization. Since the
core intent of this study was to provide data intended to gather information regarding application
of curriculum in North Carolina secondary schools, further data should be collected from
representative North Carolina districts based on geographic distribution.
Ethical Considerations
In an effort to protect the privacy and security of the participants in this study, surveys
were anonymous and participation was voluntary. All surveys for this study were sent
electronically only to district e-mail addresses. Access to the data was restricted to the researcher
and the readers of this document. All data was securely stored at all times. In all data reporting
participant names were eliminated and results were written in such way that identity of study
participants would not be revealed. The study was also approved by the author’s advisory
committee chair at the University of North Carolina at Wilmington’s Watson School of
Education.
18
RESULTS
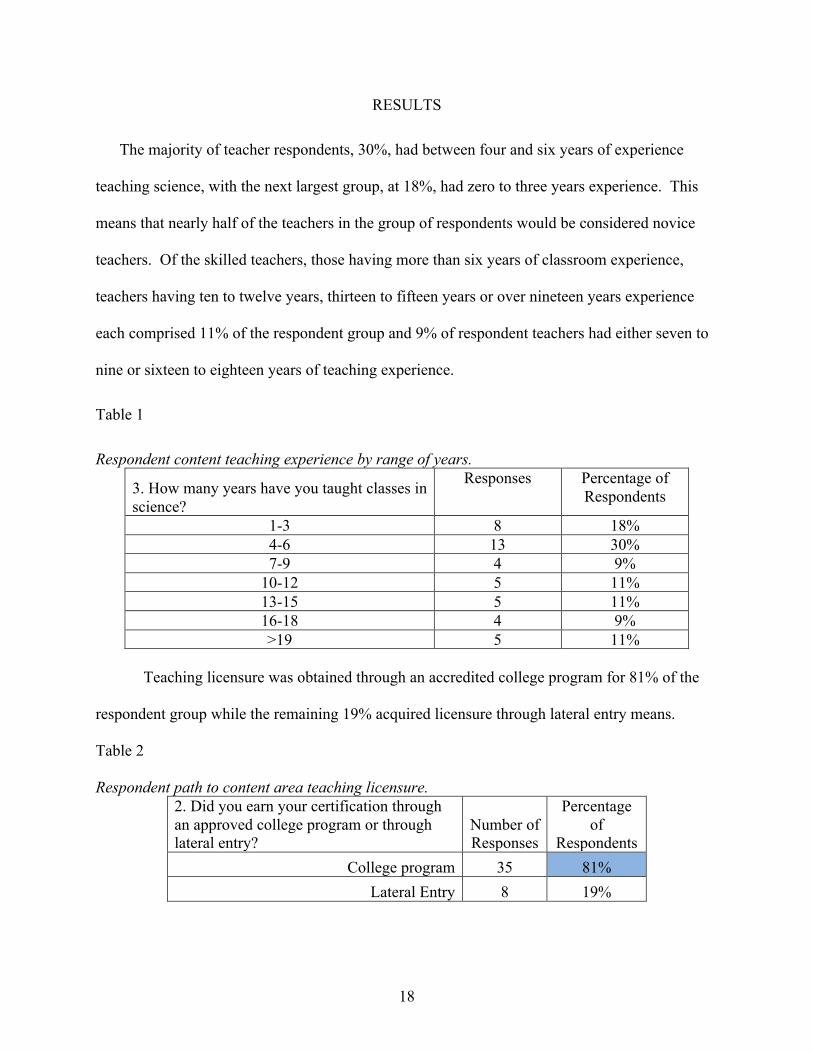
The majority of teacher respondents, 30%, had between four and six years of experience
teaching science, with the next largest group, at 18%, had zero to three years experience. This
means that nearly half of the teachers in the group of respondents would be considered novice
teachers. Of the skilled teachers, those having more than six years of classroom experience,
teachers having ten to twelve years, thirteen to fifteen years or over nineteen years experience
each comprised 11% of the respondent group and 9% of respondent teachers had either seven to
nine or sixteen to eighteen years of teaching experience.
Table 1
Respondent content teaching experience by range of years.
3. How many years have you taught classes in science?
Responses Percentage of Respondents
1-3 8 18% 4-6 13 30% 7-9 4 9%
10-12 5 11% 13-15 5 11% 16-18 4 9% >19 5 11%
Teaching licensure was obtained through an accredited college program for 81% of the
respondent group while the remaining 19% acquired licensure through lateral entry means.
Table 2
Respondent path to content area teaching licensure. 2. Did you earn your certification through an approved college program or through lateral entry?
Number of Responses
Percentage of
Respondents College program 35 81%
Lateral Entry 8 19%
19
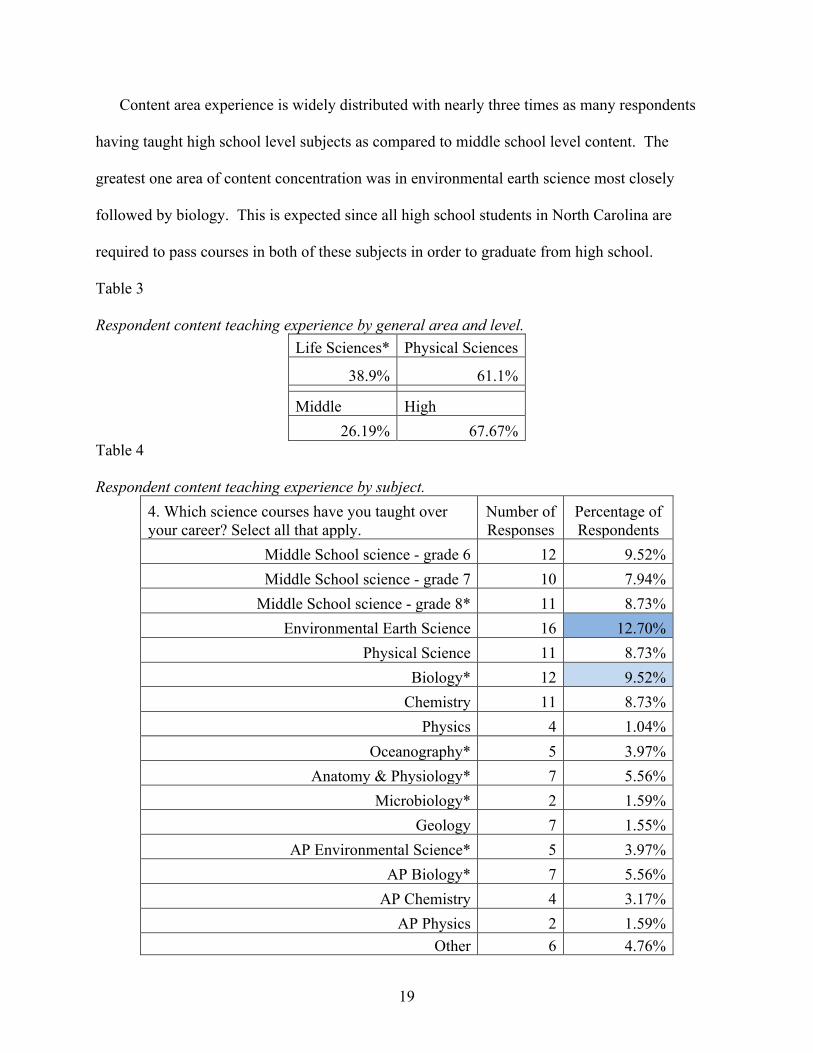
Content area experience is widely distributed with nearly three times as many respondents
having taught high school level subjects as compared to middle school level content. The
greatest one area of content concentration was in environmental earth science most closely
followed by biology. This is expected since all high school students in North Carolina are
required to pass courses in both of these subjects in order to graduate from high school.
Table 3
Respondent content teaching experience by general area and level. Life Sciences* Physical Sciences
38.9% 61.1% Middle High
26.19% 67.67% Table 4
Respondent content teaching experience by subject. 4. Which science courses have you taught over your career? Select all that apply.
Number of Responses
Percentage of Respondents
Middle School science - grade 6 12 9.52% Middle School science - grade 7 10 7.94%
Middle School science - grade 8* 11 8.73% Environmental Earth Science 16 12.70%
Physical Science 11 8.73% Biology* 12 9.52%
Chemistry 11 8.73% Physics 4 1.04%
Oceanography* 5 3.97% Anatomy & Physiology* 7 5.56%
Microbiology* 2 1.59% Geology 7 1.55%
AP Environmental Science* 5 3.97% AP Biology* 7 5.56%
AP Chemistry 4 3.17% AP Physics 2 1.59%
Other 6 4.76%

20
Survey Response Data
Closed form surveys with optional open form input areas were sent via electronic mail to
218 secondary science teachers in these three North Carolina counties with equal numbers
representing high school and middle school science teachers. Response rates did not
significantly differ between high school teachers and middle school teachers, with the response
from high school teachers being only slightly higher. Second and third requests for response
were sent via electronic mail two weeks and four weeks after the initial request. Forty-four
teachers returned completed surveys resulting in an overall return rate of 20.18%. Because the
response rate after two weeks was only 6%, an additional request was sent to all non-responders.
At four weeks from the initial survey distribution the response rate remained low, at 12%. A
final request, with an incentive offered for a chance to win a prize drawing from among the pool
of respondents, resulted in the final response rate of just over 20%. Such limited response rates
might be improved in future trials by offering incentives from the outset, distribution to a larger
pool of recipients, or through the use of non-electronic formats.
Table 5
Survey distribution and response rates by county.
County Sent Response Percent
Responses from:
Brunswick 61 12 19.7% New Hanover 124 26 21.0% Pender 33 6 18.2%
Total: 218 44 20.18%
21
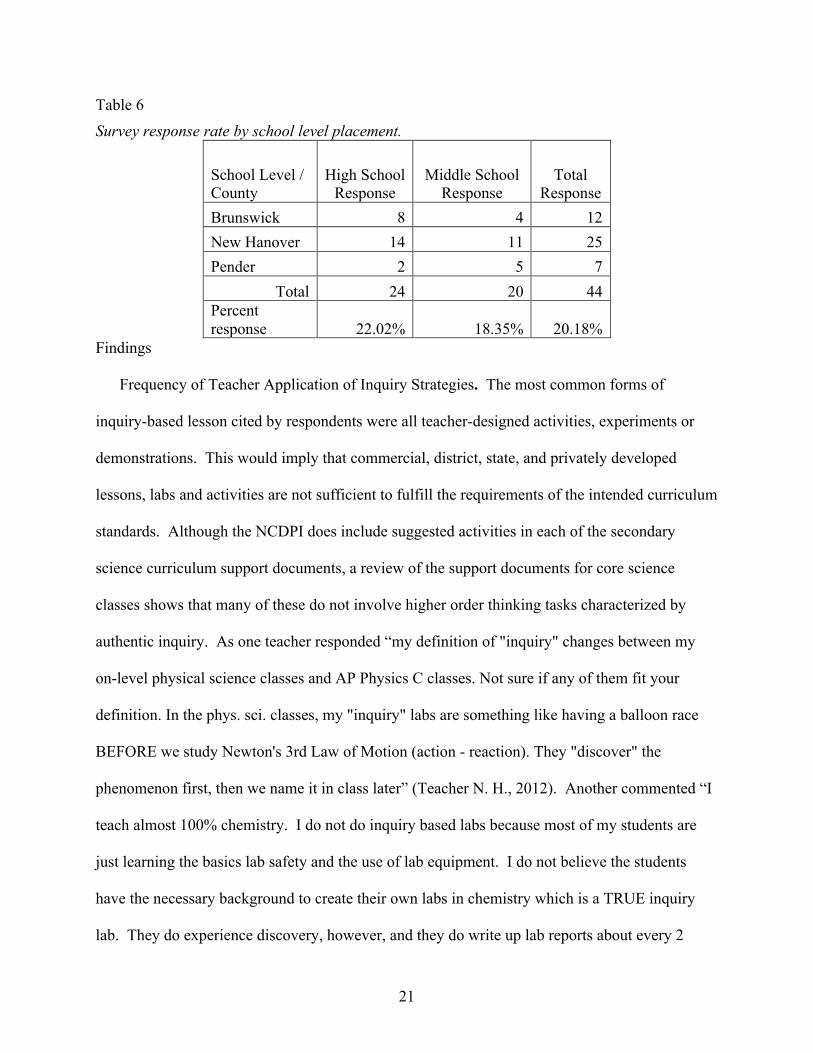
Table 6 Survey response rate by school level placement.
School Level / County
High School Response
Middle School Response
Total Response
Brunswick 8 4 12 New Hanover 14 11 25 Pender 2 5 7
Total 24 20 44 Percent response 22.02% 18.35% 20.18%
Findings
Frequency of Teacher Application of Inquiry Strategies. The most common forms of
inquiry-based lesson cited by respondents were all teacher-designed activities, experiments or
demonstrations. This would imply that commercial, district, state, and privately developed
lessons, labs and activities are not sufficient to fulfill the requirements of the intended curriculum
standards. Although the NCDPI does include suggested activities in each of the secondary
science curriculum support documents, a review of the support documents for core science
classes shows that many of these do not involve higher order thinking tasks characterized by
authentic inquiry. As one teacher responded “my definition of "inquiry" changes between my
on-level physical science classes and AP Physics C classes. Not sure if any of them fit your
definition. In the phys. sci. classes, my "inquiry" labs are something like having a balloon race
BEFORE we study Newton's 3rd Law of Motion (action - reaction). They "discover" the
phenomenon first, then we name it in class later” (Teacher N. H., 2012). Another commented “I
teach almost 100% chemistry. I do not do inquiry based labs because most of my students are
just learning the basics lab safety and the use of lab equipment. I do not believe the students
have the necessary background to create their own labs in chemistry which is a TRUE inquiry
lab. They do experience discovery, however, and they do write up lab reports about every 2
22
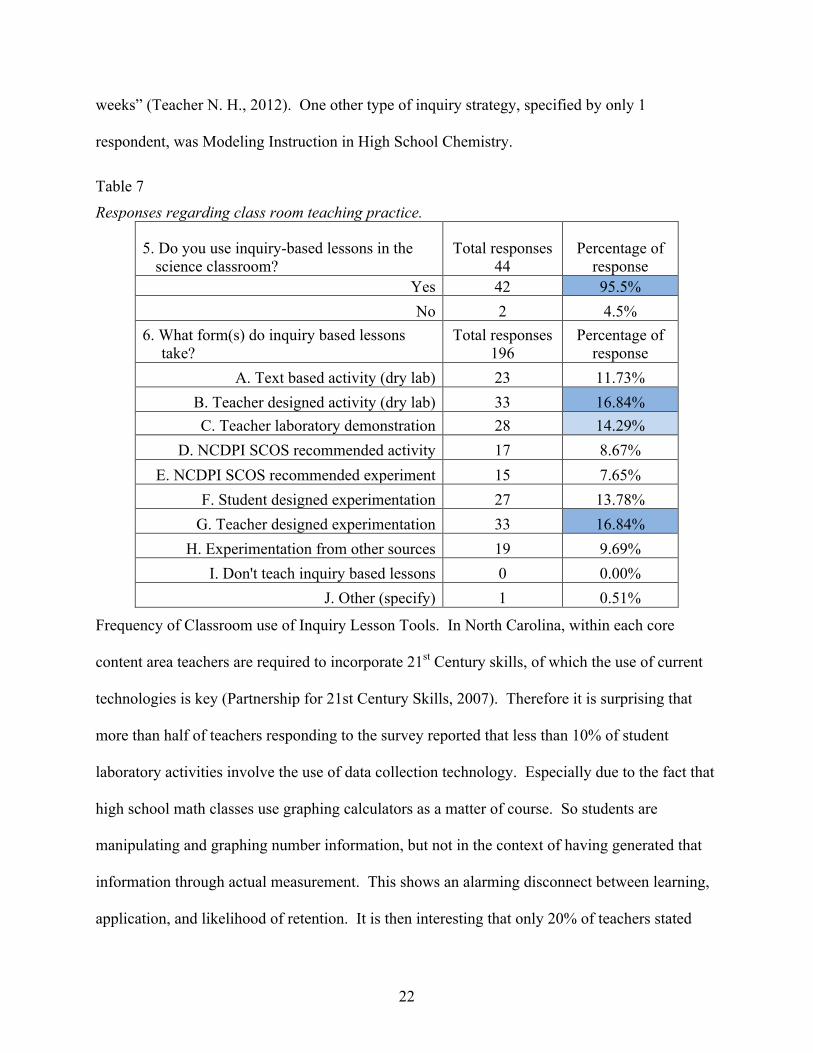
weeks” (Teacher N. H., 2012). One other type of inquiry strategy, specified by only 1
respondent, was Modeling Instruction in High School Chemistry.
Table 7 Responses regarding class room teaching practice.
5. Do you use inquiry-based lessons in the science classroom?
Total responses 44
Percentage of response
Yes 42 95.5% No 2 4.5%
6. What form(s) do inquiry based lessons take?
Total responses 196
Percentage of response
A. Text based activity (dry lab) 23 11.73% B. Teacher designed activity (dry lab) 33 16.84% C. Teacher laboratory demonstration 28 14.29%
D. NCDPI SCOS recommended activity 17 8.67% E. NCDPI SCOS recommended experiment 15 7.65%
F. Student designed experimentation 27 13.78% G. Teacher designed experimentation 33 16.84%
H. Experimentation from other sources 19 9.69% I. Don't teach inquiry based lessons 0 0.00%
J. Other (specify) 1 0.51%
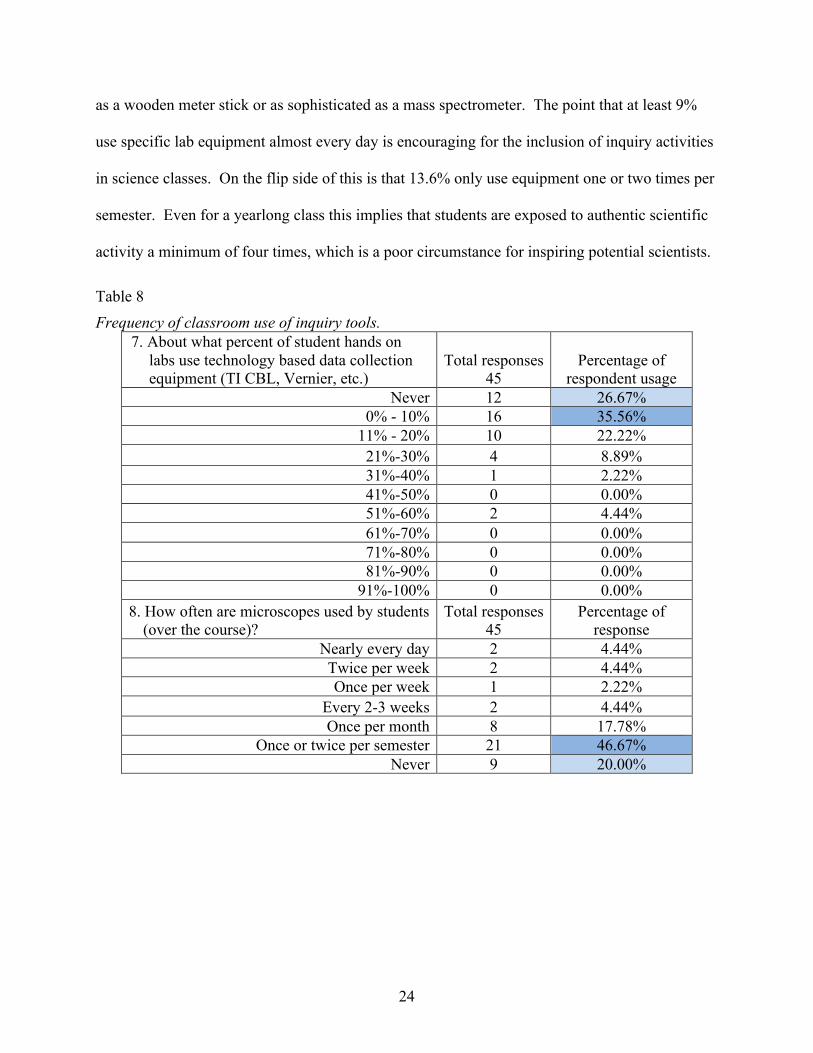
Frequency of Classroom use of Inquiry Lesson Tools. In North Carolina, within each core
content area teachers are required to incorporate 21st Century skills, of which the use of current
technologies is key (Partnership for 21st Century Skills, 2007). Therefore it is surprising that
more than half of teachers responding to the survey reported that less than 10% of student
laboratory activities involve the use of data collection technology. Especially due to the fact that
high school math classes use graphing calculators as a matter of course. So students are
manipulating and graphing number information, but not in the context of having generated that
information through actual measurement. This shows an alarming disconnect between learning,
application, and likelihood of retention. It is then interesting that only 20% of teachers stated
23
that their students never use microscopes, especially since over 60% of respondents teach
physical science, which does not generally use microscopes, rather than life science which does.
Microscopes, of the type available to schools, are a modern technology. While not considered a
data collection tool in the way that a pH meter, electronic balance or motion sensor might be,
they remain a tool of observation and therefore are used to collect data.
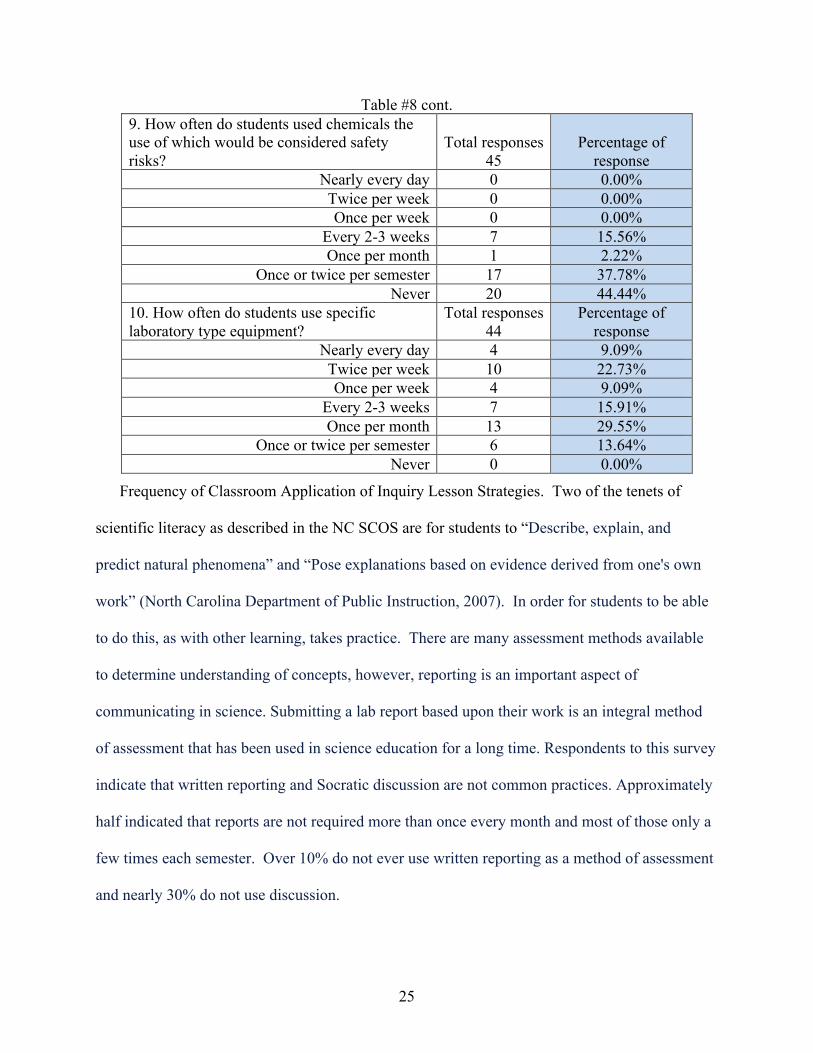
In regard to the use of substance that are considered a chemical safety risk 44%, nearly
half, of all respondents state that they never use them with students. The support documents for
every secondary science course from NCDPI includes safety guidelines and resources, making
the issue of being too unsafe moot. Consider that the only course that might never use chemicals
of any sort is physics and those courses make up less than 3% of respondent classes. Also
consider that the curriculum unit documents provided by NCDPI contain at least one activity or
lab that requires the use of a substance that requires precautions in the remaining courses. This
demonstrates that many science teachers have misconceptions as to what and how to incorporate
aspects of inquiry into their lessons. Not simply because they don’t use chemicals but that there
appears to be misunderstanding of what substances would be considered safety risks. For
example, hot water and lemon juice are substances whose use requires (by law) that students
wear safety glasses. One respondent even commented that it “depends on who is defining safety
risk” (Teacher N. H., 2012). Whether teachers are unaware of safety guidelines, unable or
unwilling to enforce safety rules or unwilling to bother with activities that may require more
vigilance remains an issue served by supervision and professional development.
A bit more than half of the respondents claim student use of use specific laboratory
equipment between twice each week and once per month, but none claimed that they never did.
This might be interpreted several ways. Description of specific lab equipment could be as basic
24
as a wooden meter stick or as sophisticated as a mass spectrometer. The point that at least 9%
use specific lab equipment almost every day is encouraging for the inclusion of inquiry activities
in science classes. On the flip side of this is that 13.6% only use equipment one or two times per
semester. Even for a yearlong class this implies that students are exposed to authentic scientific
activity a minimum of four times, which is a poor circumstance for inspiring potential scientists.
Table 8 Frequency of classroom use of inquiry tools.
7. About what percent of student hands on labs use technology based data collection equipment (TI CBL, Vernier, etc.)
Total responses 45
Percentage of respondent usage
Never 12 26.67% 0% - 10% 16 35.56%
11% - 20% 10 22.22% 21%-30% 4 8.89% 31%-40% 1 2.22% 41%-50% 0 0.00% 51%-60% 2 4.44% 61%-70% 0 0.00% 71%-80% 0 0.00% 81%-90% 0 0.00%
91%-100% 0 0.00% 8. How often are microscopes used by students
(over the course)? Total responses
45 Percentage of
response Nearly every day 2 4.44% Twice per week 2 4.44% Once per week 1 2.22%
Every 2-3 weeks 2 4.44% Once per month 8 17.78%
Once or twice per semester 21 46.67% Never 9 20.00%
25
Table #8 cont. 9. How often do students used chemicals the use of which would be considered safety risks?
Total responses 45
Percentage of response
Nearly every day 0 0.00% Twice per week 0 0.00% Once per week 0 0.00%
Every 2-3 weeks 7 15.56% Once per month 1 2.22%
Once or twice per semester 17 37.78% Never 20 44.44%
10. How often do students use specific laboratory type equipment?
Total responses 44
Percentage of response
Nearly every day 4 9.09% Twice per week 10 22.73% Once per week 4 9.09%
Every 2-3 weeks 7 15.91% Once per month 13 29.55%
Once or twice per semester 6 13.64% Never 0 0.00%
Frequency of Classroom Application of Inquiry Lesson Strategies. Two of the tenets of
scientific literacy as described in the NC SCOS are for students to “Describe, explain, and
predict natural phenomena” and “Pose explanations based on evidence derived from one's own
work” (North Carolina Department of Public Instruction, 2007). In order for students to be able
to do this, as with other learning, takes practice. There are many assessment methods available
to determine understanding of concepts, however, reporting is an important aspect of
communicating in science. Submitting a lab report based upon their work is an integral method
of assessment that has been used in science education for a long time. Respondents to this survey
indicate that written reporting and Socratic discussion are not common practices. Approximately
half indicated that reports are not required more than once every month and most of those only a
few times each semester. Over 10% do not ever use written reporting as a method of assessment
and nearly 30% do not use discussion.
26
With students assessed on writing across the state of NC in grades four, seven and ten,
writing practice in many forms is critical. It is possible that teachers do not know what is
required in a lab report or how to effectively assess a lab report. This may be due, in part to the
continued shortage of qualified science teacher in our state both by non-certified teachers in
science classrooms and by certified science teachers who lack sufficient science education. It
may also be a result of a deficit in student preparation for science writing in the secondary
grades. One high school teacher in Brunswick County commented that “They (the students) don't
know how to write a formal lab report and there's not enough time to teach them how to do so”
(Teacher B. C., 2011). Writing well, in any format, requires instruction and practice from an
early point in a student’s education. This view is not unexpected, as the amount of scientific
information to be learned constantly increases and the amount of time in which to learn it does
not and in some areas has decreased (American Association for the Advancement of Science,
1990), (Hennessey, 2002) and (National Commission on Excellence in Education, 1983). Written
communication of learning as a summative assessment is time consuming and subjective. As the
demand on teacher time increases with the increase of non-instructional obligations, so does the
increased use of objective and quickly accomplished student assessment methods.
Through discourse of concepts, observations and interpretations in a safe and structured
format such as Socratic discussion, students can explore ideas, correct misconceptions and
develop important verbal and social skills. Science education naturally lends itself to this
endeavor as scientists have been presenting, discussing, and disputing the evidence and
interpretation of observations and ideas for centuries. As a formative assessment tool discussion
is a fast and easy way for teachers to gauge understanding. With effective questioning strategies
a teacher can guide a discussion to reveal understanding and stimulate student enthusiasm and
27
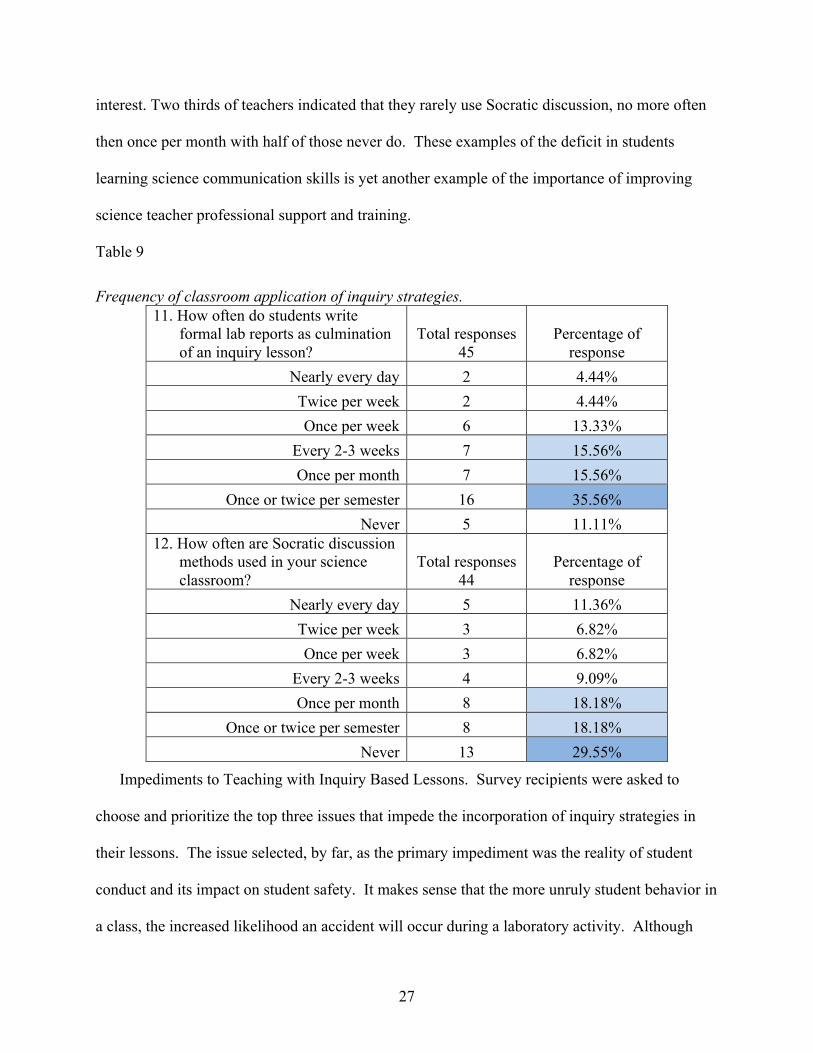
interest. Two thirds of teachers indicated that they rarely use Socratic discussion, no more often
then once per month with half of those never do. These examples of the deficit in students
learning science communication skills is yet another example of the importance of improving
science teacher professional support and training.
Table 9
Frequency of classroom application of inquiry strategies. 11. How often do students write
formal lab reports as culmination of an inquiry lesson?
Total responses 45
Percentage of response
Nearly every day 2 4.44% Twice per week 2 4.44% Once per week 6 13.33%
Every 2-3 weeks 7 15.56% Once per month 7 15.56%
Once or twice per semester 16 35.56% Never 5 11.11%
12. How often are Socratic discussion methods used in your science classroom?
Total responses 44
Percentage of response
Nearly every day 5 11.36% Twice per week 3 6.82% Once per week 3 6.82%
Every 2-3 weeks 4 9.09% Once per month 8 18.18%
Once or twice per semester 8 18.18% Never 13 29.55%
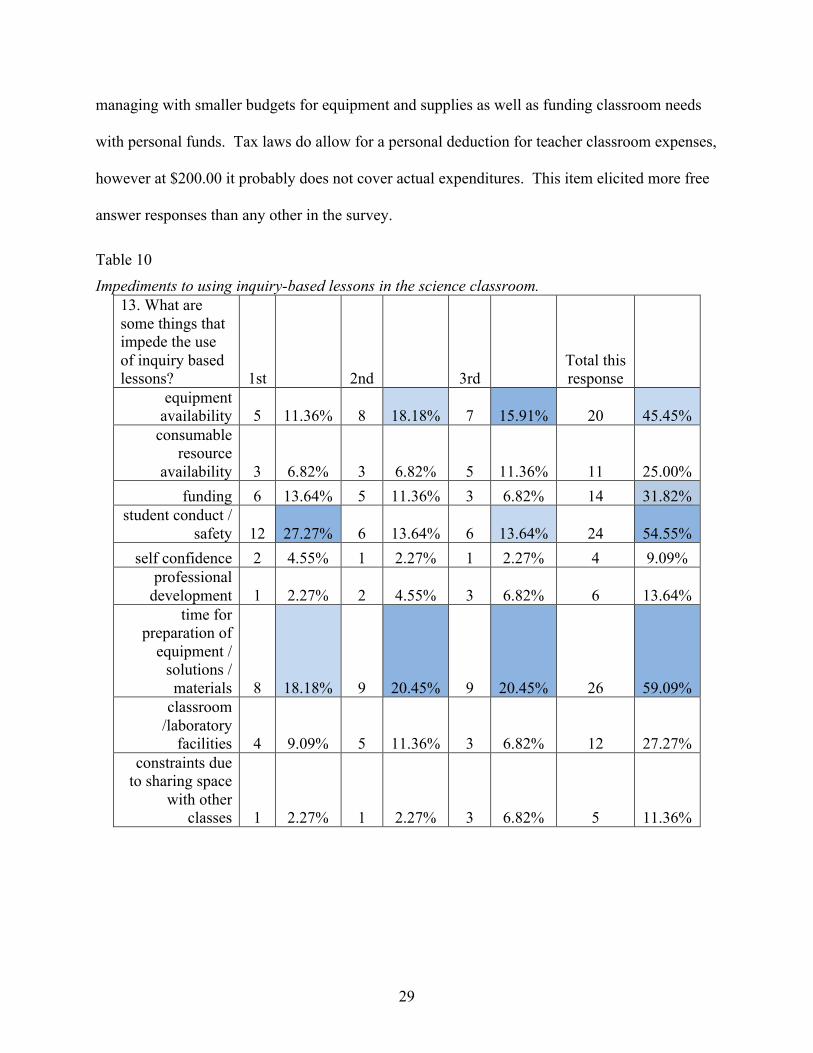
Impediments to Teaching with Inquiry Based Lessons. Survey recipients were asked to
choose and prioritize the top three issues that impede the incorporation of inquiry strategies in
their lessons. The issue selected, by far, as the primary impediment was the reality of student
conduct and its impact on student safety. It makes sense that the more unruly student behavior in
a class, the increased likelihood an accident will occur during a laboratory activity. Although
28
class size was not addressed in this survey, it remains to be a concern at all school levels for
many school districts in the U.S.
Second to safety, time for preparation of equipment, solutions, and materials was the
most often selected obstacle. As stated above, the rate of scientific discovery continues to
increase with technological development without an increase in available instructional time.
Time constraint was most commonly chosen as the number two and three reasons for not
integrating inquiry into science instruction, and being the overall most common impediment.
Another time issue was provided as an additional comment “The second biggest challenge is the
amount of time for class. My classes are 40 minutes - occasionally I keep them for 80 minutes
(on an A-day B-day type schedule) to do inquiry based lessons” (Teacher P. C., 2011).
The third most commonly designated barrier was the availability of equipment.
Predictably, also high on the list of issues are classroom/laboratory facilities as the availability of
equipment is a part of school science facilities. Among teacher comments were “My main issue
is class size vs. facilities. I teach in a trailer with classes of 22-27 (9th grade) students. There are
no lab benches, sinks, or areas to conduct labs other than in the classroom seating. I do continue
to do labs about once a week, some more inquiry-based and lasting for several days (ex: soil
quality testing next week). It is often not a pleasant experience for me, though, with that class
size in these facilities. However, the students do love them and learn much more” and “In regard
to classroom/laboratory facilities: Difficult to conduct regular lab opportunities in my current
setup” (Teacher P. C., 2011).
The third most commonly selected hindrance was funding. Recently, public schools have
been required to stretch resources further each year while simultaneously mandated with
improving student achievement and ensuring increased teacher accountability. Teachers are
29
managing with smaller budgets for equipment and supplies as well as funding classroom needs
with personal funds. Tax laws do allow for a personal deduction for teacher classroom expenses,
however at $200.00 it probably does not cover actual expenditures. This item elicited more free
answer responses than any other in the survey.
Table 10 Impediments to using inquiry-based lessons in the science classroom.
13. What are some things that impede the use of inquiry based lessons? 1st
2nd
3rd
Total this response
equipment availability 5 11.36% 8 18.18% 7 15.91% 20 45.45%
consumable resource
availability 3 6.82% 3 6.82% 5 11.36% 11 25.00% funding 6 13.64% 5 11.36% 3 6.82% 14 31.82%
student conduct / safety 12 27.27% 6 13.64% 6 13.64% 24 54.55%
self confidence 2 4.55% 1 2.27% 1 2.27% 4 9.09% professional
development 1 2.27% 2 4.55% 3 6.82% 6 13.64% time for
preparation of equipment /
solutions / materials 8 18.18% 9 20.45% 9 20.45% 26 59.09%
classroom /laboratory
facilities 4 9.09% 5 11.36% 3 6.82% 12 27.27% constraints due
to sharing space with other
classes 1 2.27% 1 2.27% 3 6.82% 5 11.36%
30
CONCLUSIONS
Implications
Since one objective of this study was to determine if secondary science educators in one
part of North Carolina have implemented effective science education reforms to incorporate
inquiry methods of instruction, perhaps, as the literature suggests, the reforms themselves that
have been introduced do not adequately address or define the concept of inquiry and
participation in the acquisition of scientific knowledge and thinking. With improvement of
science teachers’ own metacognition regarding their craft through professional development and
undergraduate preparation, attainment levels of student science knowledge must increase. One
comment in particular, illustrates the need for teacher enlightenment “I find that the students in
grade 7 lack prior science experience and knowledge as well as critical thinking and problem
solving skills to engage meaningfully in inquiry based lessons. In general, they are not
motivated to think through a problem/situation when they can be readily given the answer”
(Teacher N. H., 2012). Science class is precisely the place for students learn and improve critical
thinking and problem solving skills by using the processes of science not so that they can use
them.
Recommendations
As seen in the literature, professional development for existing teachers and better
education for prospective teachers regarding instruction incorporating scientific methods should
be a priority if student science achievement is to improve. This is demonstrated by the almost
non-use of available technology, safety awareness, the frequency that students use scientific tools
and the in teaching scientific communication. In addition the time required for science teachers
to prepare effective class activities is far greater in the sciences than any other academic
31
discipline. School districts are obligated to improve and adhere to policy regarding this aspect of
working conditions for science educators if the expectation is improved science achievement.
Summary
The focus on improving science education seems to rest solely on inquiry-based teaching
strategies. The reform questions that have arisen and that still linger are: which strategies
incorporate inquiry; how they are defined; which are most effective; how will teachers learn to
use them; and what resources are required? To bring about real changes in science teaching
methods there must be more than published reports, recommendations and mandates. Change
and the support for that change must come from the top down. Faculty and administrators
should collaborate in their work to overcome the barriers and to create an educational that
enables change. “The reward system must be aligned with the need for reform. Tenure,
sabbaticals, awards, teaching responsibilities, and administrative support should be used to
reinforce those who are teaching with tested and successful methods, learning new methods, or
introducing and analyzing new assessment tools” (Handelsman, et al., 2004).
LITERATURE CITED
Akkus, R., Gunel, M., & Hand, B. (2007). Comparing an inquiry-based approach known as the
science writing heuristic to traditional tcience teaching practices: Are there differences?
International Journal of Science Education , 29 (14), 1745-1765.
Alberts, B. (2000). Some Thoughts of a Scientist on Inquiry? In A. A. Science, Inquiring into
Inquiry Learning and Teaching in Science (pp. 3-13). Washington, DC: American
Association for the Advancement of Science.
Allchin, D. (2011). Teaching Whole Science. The American Biology Teacher , 73 (1), 53-55.
Allred, S., Brewer, C., & Ebert-May, D. (1997). Innovation in large lectures - Teaching for
active learning. Bioscience , 47 (9), 601-607.
American Association for the Advancement of Science. (1990). The liberal art of science:
Agenda for action. Retrieved 12 1, 2011, from AAAS Programs, Education, Publications:
http://www.aaas.org/programs/education/about_ehr/pubs/the_liberal_art_of_science.pdf
American Educational Research Association. (2007). Science education that makes sense.
Research Points , 5 (1), 2-3.
Anderson, R., & Mitchner, C. (1994). Handbook of esearch on science teacher education. New
York: Macmillan.
Arizona State University. (2010, October 3). Modeling instruction in high school
physics,chemistry, physical science, and biology. Retrieved November 12, 2010, from
http://modeling.asu.edu/modeling-HS.html
Arrendondo, D., & Rucinski, T. (1997). Using structured interactions in conferences and journals
to promote cogniitive development amongmentors and mentees. Annual Meeting of the
33
American Educational Research Association (p. 39). Chicago, IL: American Educational
Research Association.
Brady, T. (2008, April). Science education: Cassandra's prophecy. Phi Delta Kappan , 605-607.
Carnegie Forum on Education and the Economy. (1986). A nation prepared:Teachers for the
21st century. The Carnegie Foundation, Task Force on Teaching as a Profession.
Washington, DC: The Carnegie Foundation.
Clough, M., & Clark, R. (1994). Creative Constructivism. Science Teacher , 61 (7), 46-49.
Handelsman, J., Ebert-May, D., Beichner, R., Bruns, P., Chang, A., DeHaan, R., et al. (2004).
Scientific Teaching. Science , 304 (5670), 521-522.
Hennessey, J. (2002). Teaching Math and Science. CQ Researcher , 12 (30), 697-720.
Heppner, F. (1996). Learning science by doing science. The American Biology Teacher , 58 (6),
372-374.
Kirschner, P. (1992). Epistemology, practical work and academic skills in science education.
Science and Education (1), 273-299.
Kirschner, P., Sweller, J., & and Clark, R. (2006). Why Minimal Guidance During Instruction
Does Not Work: An Analysis of the Failure of Constructivist, Discovery, Problem-Based,
Experiential, and Inquiry-Based Teaching. Educational Psychologist , 41 (2), 75-86.
Kozloff, M. (2002, 02). Three Requirements of Effective Instruction: Providing Sufficient
Scaffolding, Helping Students Organize and Activate Knowledge, and Sustaining High
Engaged Time. 90. Wilmington, NC.
Lee, O., & Paik, S. (2000). Conceptions of Science Achievement in Major Reform Documents.
School Science and Mathematics , 100 (1), 16-26.
34
Mangrubang, F. (2004). Preparing elementary education majors to teach science using an inquiry
based approach: The full option science system. American Annals of the Deaf , 149 (3),
290-303.
Math Experts - Q&A. (2011, 05 16). The case for standard algorithms. Retrieved 03 31, 2012,
from blogger.com: http://mathexperts-qa.blogspot.com/
Metz, S. (2008, March). Science for all. The Science teacher , 8.
Miller, M. J. (2011). RES 600: Graduate Research Methods. Retrieved march 2012, from
Western International University:
http://michaeljmillerphd.com/res500_lecturenotes/reliability_and_validity.pdf
National Center for Educational Achievement. (2009, March 20). The NCEA Core Practice
Framework: An Organizing Guide to Sustained School Improvement. Retrieved 02 10,
2011, from NCAE Library:
http://www.nc4ea.org/files/organizing_guide_to_sustained_school_improvement-03-20-
09.pdf
National Commission on Excellence in Education. (1983). A Nation at Risk. (P. J. Denning, Ed.)
Communications of the ACM , 26 (7), 467-478.
National Research Council. (1996). National Science Education Standards. Washington, DC:
National Academies Press.
North Carolina Department of Public Instruction. (2007). Science. Retrieved 01 26, 2012, from
NC Standard Course of Study: http://www.dpi.state.nc.us/curriculum/science/
Paik, S., Zhang, M., Lundeberg, M., Eberhardt, J., Shin, T., & Zhang, T. (2011). Supporting
Science Teachers in Alignment with State Curriculum Standards. Journal of Science
Education Technology , 20, 422-434.
35
Partnership for 21st Century Skills. (2007, 07 23). 21st Century Learning Environments.
Retrieved 02 03, 2012, from 21st Century Skills: www.21stcenturyskills.org
Partnership for 21st Century Skills. (2007, 07 23). Framework for 21st Century Learning.
Retrieved 12 1, 2011, from 21st Centry Skills:
http://www.dpi.state.nc.us/docs/profdev/resources/skills/framework.pdf
Price, T. (2008, 1 11). Science in America. Retrieved 03 02, 2011, from CQ Researcher:
www.cqresearcher.com
Ravitch, D. (1981, 04 18). The Schools We Deserve. The New Republic , 23-27.
Robers, S., Zhang, J., Truman, J., & Snyder, T. (2010). Indicators of School Crime and Safety:
2010 (NCES 2011-002/ NCJ 230812) . National Center for Education Statistics, U.S.
Department of Education, and Bureau of Justice Statistics, Office of Justice Programs,
U.S. Department of Justice. , Washington, DC.
Rosenblatt, J. (1982, 09 03). Post-Sputnik Education. Retrieved 03 04, 2012, from Editorial
Research Reports: http://library.cqpress.com/cqresearcher/cqresrre1982090300
Ryder, J. (2002). School science education for citizenship: strategies for teaching about the
epistemology of science . Journal of Curriculum Studies , 34 (6), 637-658.
Skinner, B. (1968). Teaching science in hgh school - What is wrong? Science , 159 (3816), 704-
710.
Slavin, R. E. (2007). Educational Research in an Age of Accountability. Boston, MA, USA:
Allyn and Bacon.
Teacher, B. C. (2011, 02). Science Teacher. (L. Fitzpatrick, Interviewer)
Teacher, N. H. (2012, 02). Science Teacher. (L. Fitzpatrick, Interviewer)
Teacher, P. C. (2011, 02). Science Teacher. (L. Fitzpatrick, Interviewer)
36
U.S. Census Bureau. (2011). Statae & County Quick Facts. Retrieved 03 14, 2012, from North
Carolina County Selection Map:
http://quickfacts.census.gov/qfd/maps/north_carolina_map.html
U.S. Department of Education. (1994, 01 25). Retrieved 03 25, 2011, from Ed.gov:
http://www2.ed.gov/legislation/GOALS2000/TheAct/index.html
Uno, G. E. (1990). Inquiry in the classroom. Bioscience , 40 (11), 841-843.
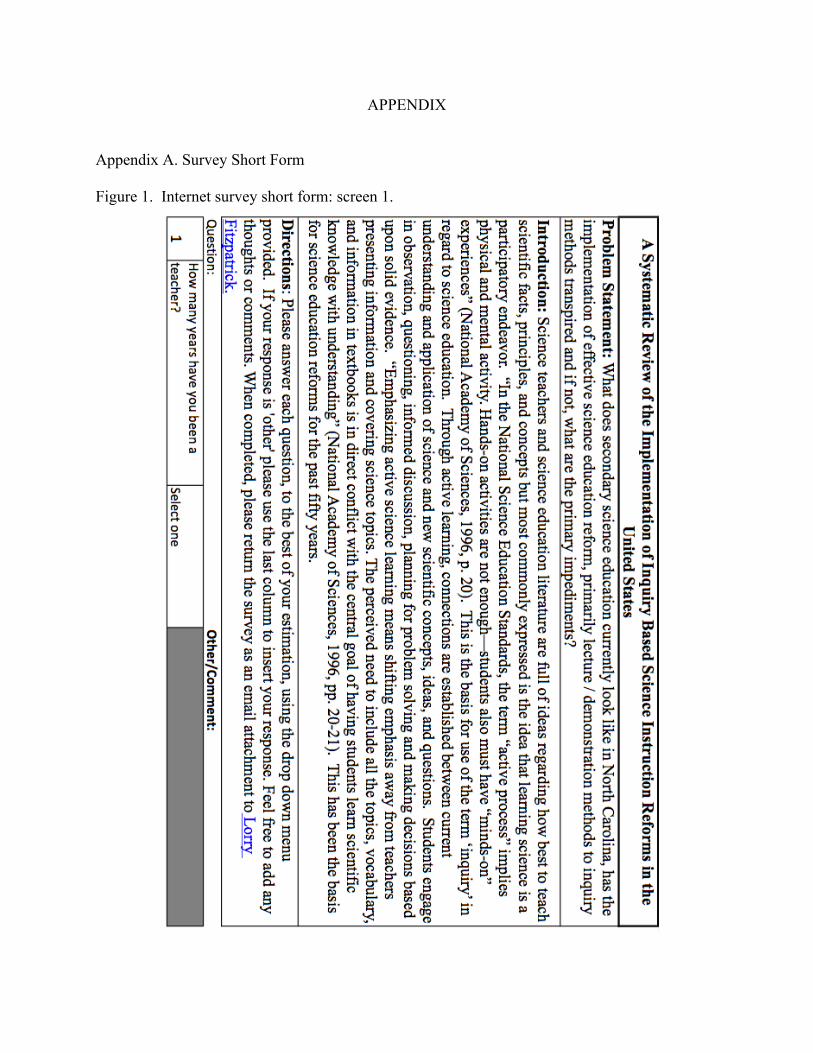
APPENDIX
Appendix A. Survey Short Form
Figure 1. Internet survey short form: screen 1.
38
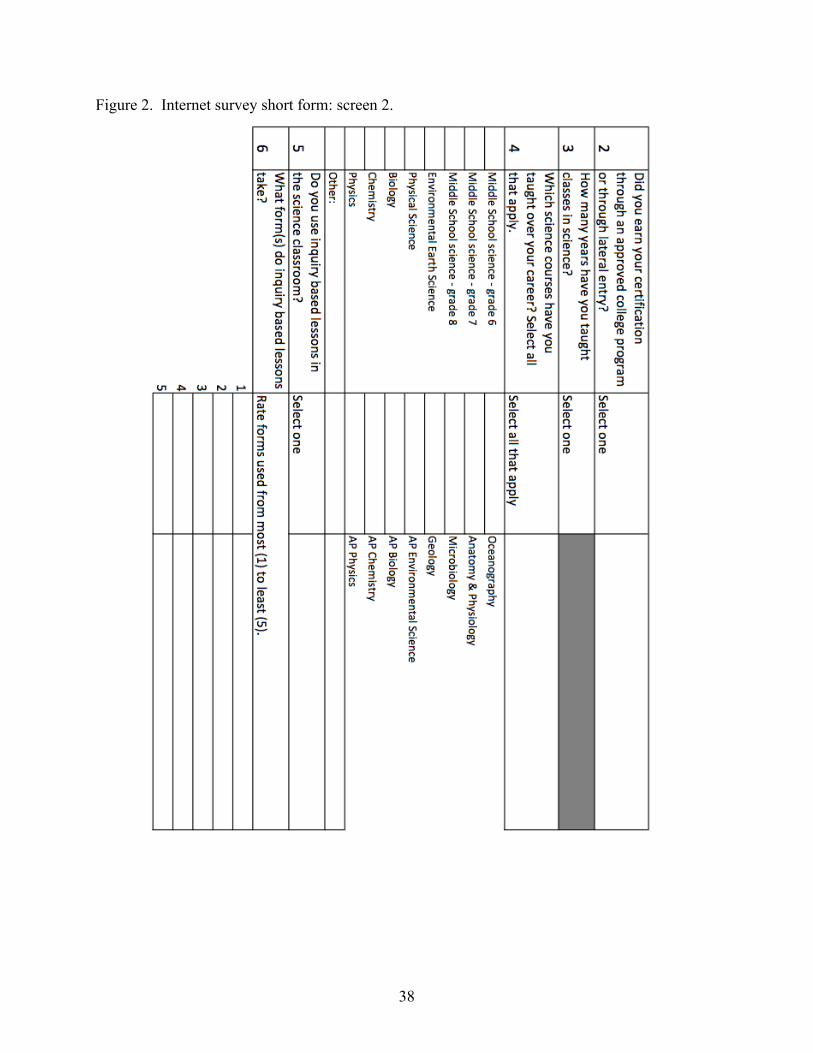
Figure 2. Internet survey short form: screen 2.
39
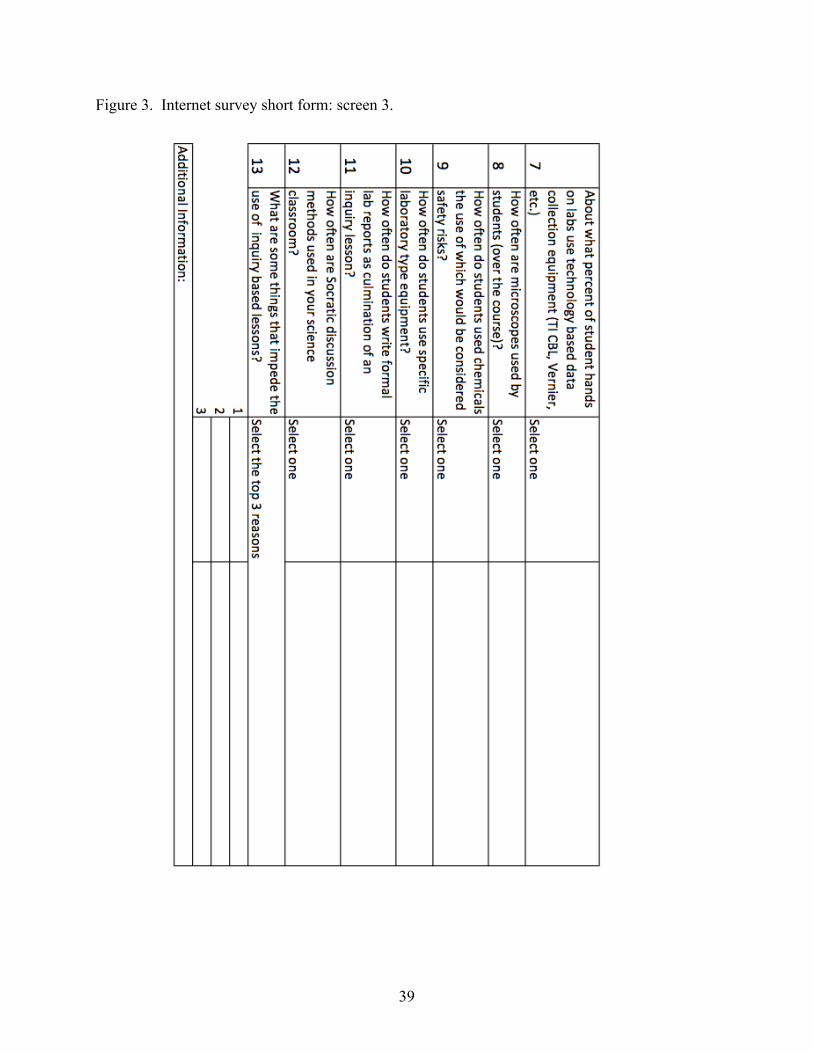
Figure 3. Internet survey short form: screen 3.
40
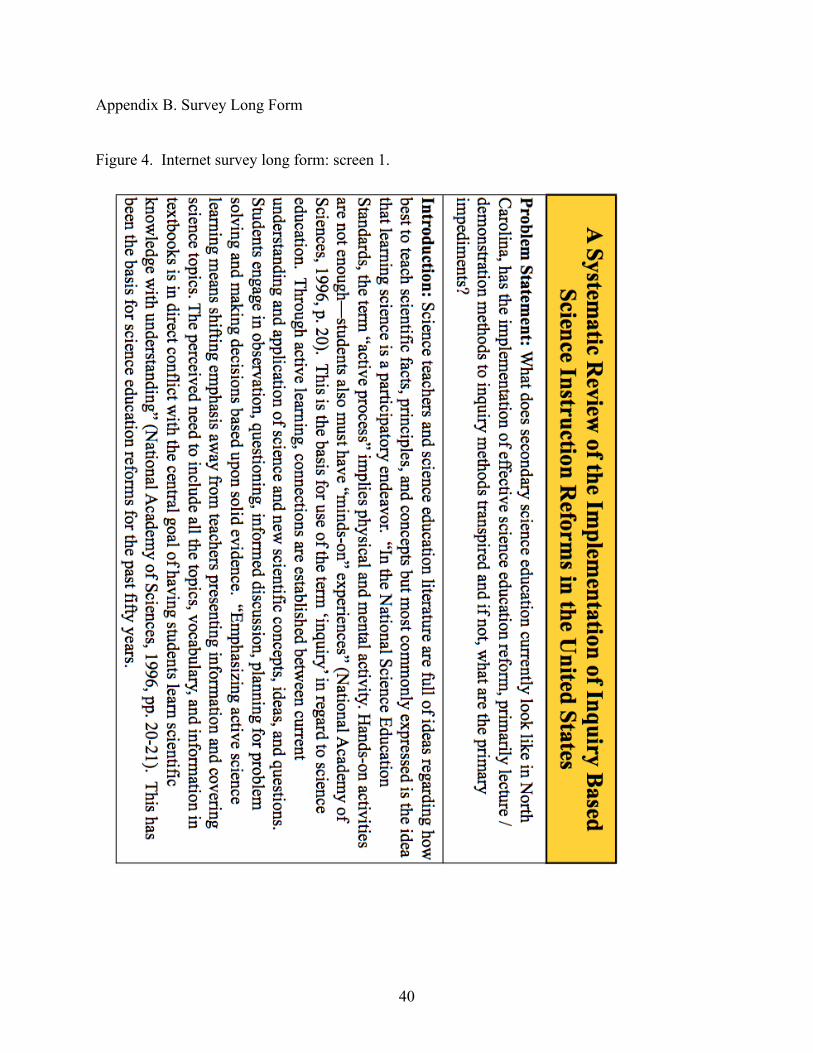
Appendix B. Survey Long Form
Figure 4. Internet survey long form: screen 1.
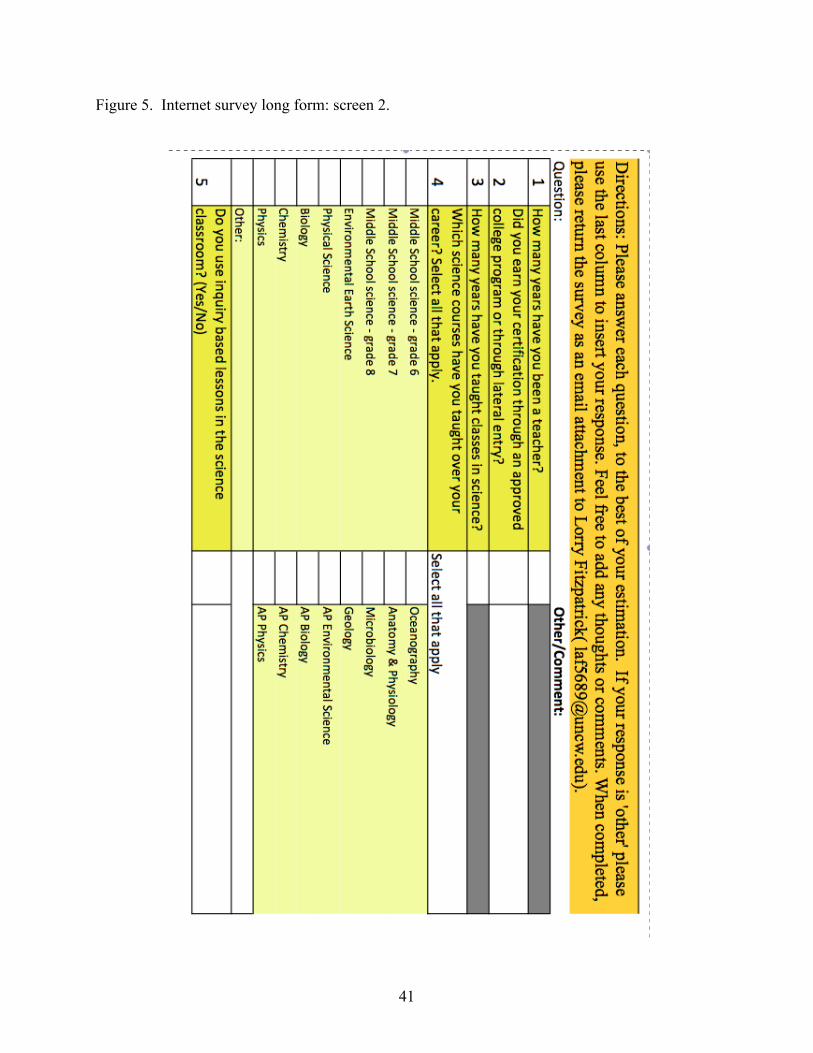
41
Figure 5. Internet survey long form: screen 2.
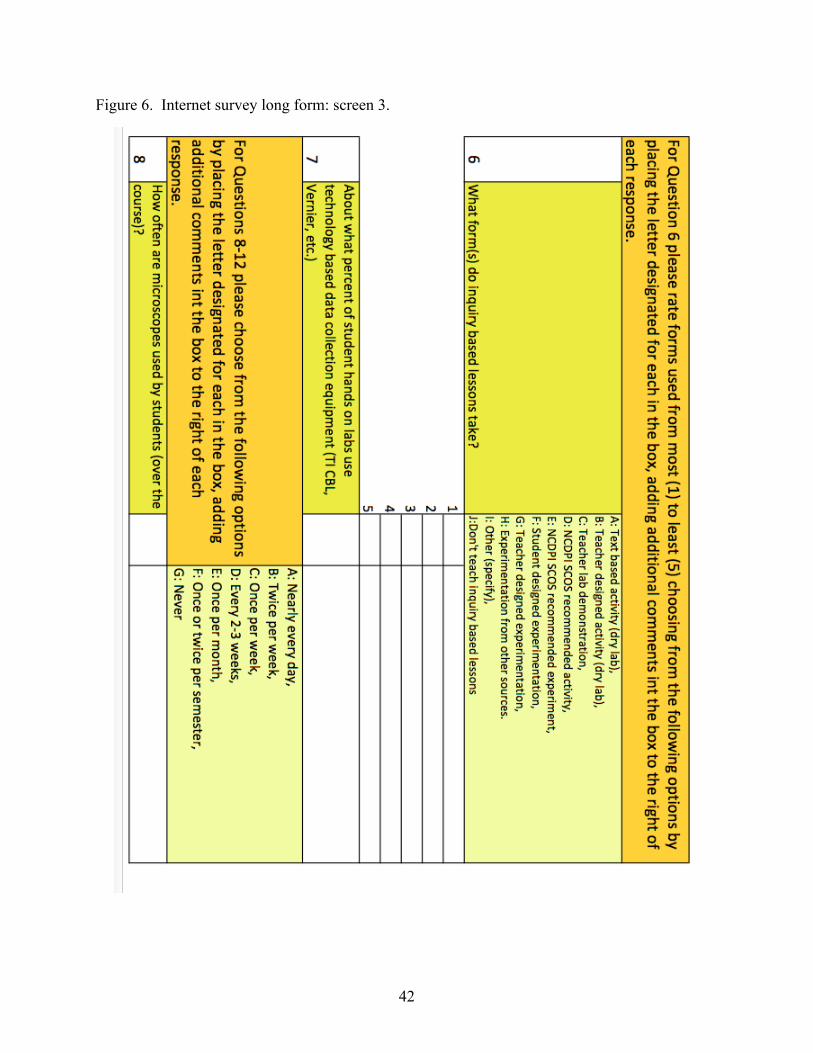
42
Figure 6. Internet survey long form: screen 3.
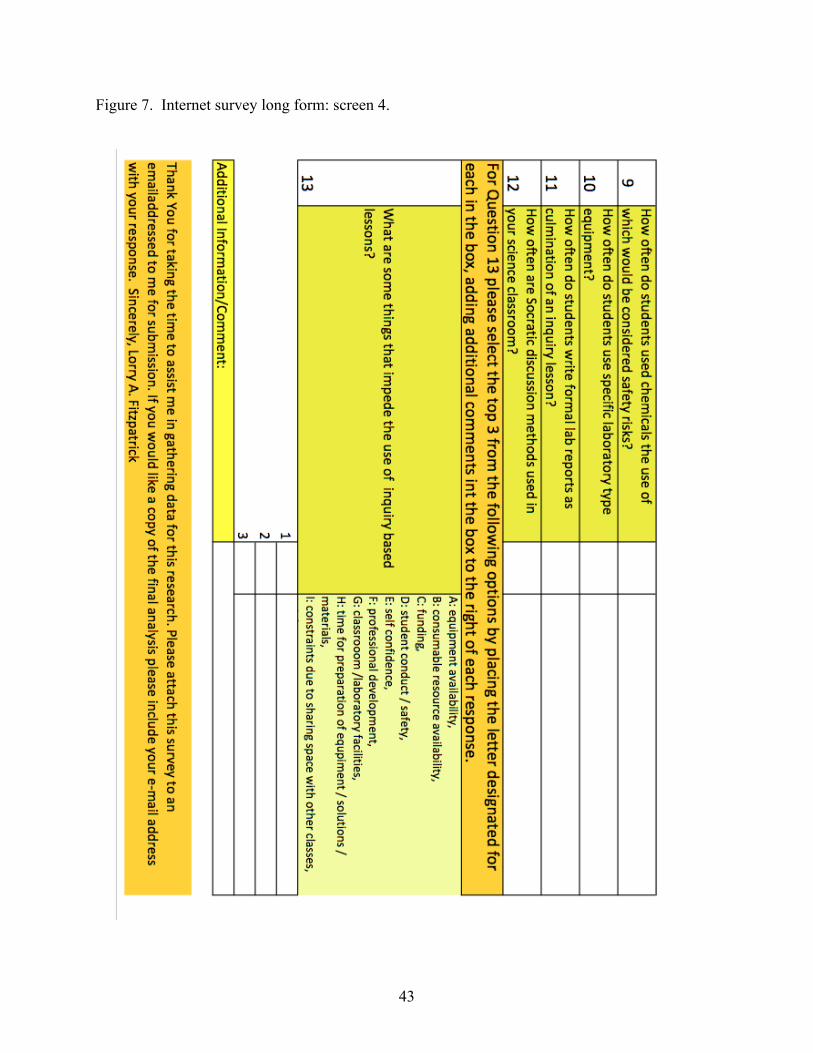
43
Figure 7. Internet survey long form: screen 4.