Embed Size (px)
Citation preview
Policy and Planning Administration Presents
THE UNINSURED IN MICHIGAN‐ A PROFILE
Released December 2013
MDCH is an Equal Opportunity Employer, Services and Programs Provider 0 printed at 0 cents each with a total cost of $0

TABLE OF CONTENTS
INTRODUCTION ......................................................................................................................................................... 1
EXECUTIVE SUMMARY ............................................................................................................................................... 2
NATIONAL COMPARISONS ........................................................................................................................................ 4
SOURCES OF HEALTH INSURANCE COVERAGE .......................................................................................................... 6
THE UNINSURED – TRENDS IN MICHIGAN, (2001‐2011) ........................................................................................... 9
DEMOGRAPHIC SNAPSHOT OF UNINSURED IN MICHIGAN ..................................................................................... 11
HOW DOES MICHIGAN COMPARE WITH THE UNITED STATES ............................................................................... 16
Appendix A: Access Profile Summary 2012 ........................................................................................................... A‐1
Appendix B: Technical Notes on the Current Population Survey (CPS) .................................................................. B‐1
Appendix C: Current Population Survey Demographic Definitions ........................................................................ C‐1

1 The Uninsured in Michigan: A Profile
INTRODUCTION
The Michigan Department of Community Health is pleased to release the 2013 edition of The Uninsured in Michigan: A Profile. This report describes the demographic characteristics of the uninsured, as well as those who have employer‐based, public, and individually purchased health insurance coverage in Michigan. The information contained in these charts and tables would provide a baseline scenario to make comparisons and measure changes in the status of the uninsured population after the implementation of Health Care Affordability law. The Affordable Care Act would substantially increase and improve health insurance for Americans across income and age groups. The data contained in this report would allow us to measure changes in status of uninsured population after the implementation of the act.
This report focuses primarily on Michigan’s nonelderly residents since persons aged 65 and older are by and large insured, often with coverage options such as Medicare, which are not uniformly available to the rest of the population. Three‐year averages are used for most comparisons to eliminate year‐to‐year fluctuations and improve reliability. The data presented in this report comes primarily from the CPS, which is only one of four major government surveys that include information on the uninsured. Please note that in the preceding reports the CPS data was provided by the Employee Benefit Research Institute (EBRI). This report uses SHADAC estimates of data from the Current Population Survey (2011). The University of Minnesota's State Health Access Data Assistance Center (SHADAC) is funded by The Robert Wood Johnson Foundation to help states monitor rates of health insurance coverage and to understand the various factors associated with access to health care.

2 The Uninsured in Michigan: A Profile
EXECUTIVE SUMMARY
Health insurance coverage is an important element in keeping people healthy. Studies have shown that lack of health insurance negatively affects both access to health care and health status. Without health insurance, people may forego preventive services and delay seeking care until health problems are more advanced and harder to treat. Uninsured children and adults who do not receive the care they need , suffer from poorer health and development outcomes and are more likely to die early than those with coverage. Even one uninsured person in a family can put the financial stability and health of the whole family at risk (Institute of Medicine, 2004. Those people who lack in health insurance represent a diverse group. )1. It is important to understand the uninsured population for policy makers in order to design effective solution to their problem. This report describes the demographic characteristics of the uninsured, as well as those who have employer based, public, and individually purchased health insurance coverage in Michigan. According to the Current Population Survey (CPS), 16 percent of the people (all ages) living in the U.S. did not have health insurance in 2009‐2011. In Michigan, the percentage of uninsured residents (all ages) increased to 12.8 percent in 2009‐2011 as compared to 11.7 percent in 2007‐2009. However, the percentage of nonelderly population without health insurance has been 14.6 in 2009‐2011. Lack of health insurance disproportionately affects some population groups. Nineteen point nine percent (19.9 percent) of the total Hispanic population in Michigan has been uninsured in 2009‐2011. Being uninsured is largely a problem of the young; 26.7 percent of the total population in the 26‐34 year age group has been uninsured. In contrast, 5.3 percent of the children (0‐17years) were uninsured in Michigan as compared to 9.6 percent in the United States.
Key points Michigan has a lower percentage of uninsured residents than the majority of other states in the United
States. Michigan is ranked 16th among states in having a low percentage of uninsured residents (non‐elderly) at 14.6 percent.
Michigan adults are much more likely to be uninsured than children. In 2009‐2011, 18.4 percent of adults (19‐64) are uninsured, while only 5.5 percent of children (0‐18 years) are uninsured.
In Michigan, Black and Hispanic residents are more likely than White residents to be uninsured. Seventeen point two percent (17.2 percent) of Black residents and 19.9 percent of Hispanic residents have been uninsured, while 13.7 percent of White residents were uninsured in 2009‐2011.
Rates of uninsured decrease as the education level of the family increases. In Michigan, the percentage of uninsured individuals is higher in the families without a high school diploma (28.9 percent) as compared to those who have family members with a college degree or higher level of education (7.0 percent).
1 Institute of Medicine. 2004. Insuring America’s Health. Principles and Recommendations. Executive Summary: Institute of Medicine of the National Academies. Washington, DC

3 The Uninsured in Michigan: A Profile
Individuals from families with children are more likely to be insured than those without children. Married couples with children under 18 years have the lower uninsured rate of 7.9 percent while not married, without children under 18, have an uninsured rate of 28.5 percent in Michigan.
This report presents an overview of the uninsured population in Michigan. While the uninsured are concentrated disproportionately in certain subgroups, the uninsured are clearly a diverse population comprised of people from all income levels, racial groups and employment types.

4 The Uninsured in Michigan: A Profile
NATIONAL COMPARISONS
(I) Percentage of the Nonelderly Uninsured, 2009‐2011‐ by State
In 2009‐2011, the proportion of nonelderly residents without health insurance ranged from a low of 5.0 percent in Massachusetts to a high of 27 percent in Texas, with Michigan ranked 16th lowest among the states with a non‐elderly uninsured rate of 14.6 percent.
(II) Employer‐based Coverage by State, 2009‐2011
Percentage of Employer‐Based coverage by State , 2009‐2011
United States 58.8 Idaho 56.5 Missouri 60.8 Pennsylvania 66
Alabama 59.5 Illinois 60.5 Montana 51.7 Rhode Island 63.3
Alaska 58.5 Indiana 63.1 Nebraska 64.4 South Carolina 55.6
Arizona 53.2 Iowa 66.4 Nevada 58.5 South Dakota 60.4
Arkansas 52.5 Kansas 62.4 New Hampshire 72.2 Tennessee 56.7
California 52.5 Kentucky 58.6 New Jersey 66.6 Texas 51.6
Colorado 61.4 Louisiana 52.8 New Mexico 48 Utah 68.8
Connecticut 70.5 Maine 60.9 New York 58.6 Vermont 62.4
Delaware 65.5 Maryland 68.2 North Carolina 56.3 Virginia 64.5
District of Columbia 56.9 Massachusetts 70.8 North Dakota 65.4 Washington 59.7
Florida 52.9 Michigan 62.8 Ohio 62.3 West Virginia 60.2
Georgia 55.4 Minnesota 68.6 Oklahoma 56.8 Wisconsin 67
Hawaii 67.8 Mississippi 50.7 Oregon 59.7 Wyoming 61.1
Non‐elderly Uninsured by State, 2009‐2011
United States 18.2 Idaho 19.4 Missouri 16.7 Pennsylvania 12.8
Alabama 17.2 Illinois 16.4 Montana 20.4 Rhode Island 13.6
Alaska 19.2 Indiana 15 Nebraska 13.9 South Carolina 21.8
Arizona 20.5 Iowa 12.5 Nevada 24.3 South Dakota 15.1
Arkansas 21 Kansas 15 New Hampshire 12.5 Tennessee 16.3
California 21.6 Kentucky 17.1 New Jersey 17.1 Texas 27
Colorado 16.1 Louisiana 20.9 New Mexico 23.7 Utah 15.6
Connecticut 11.7 Maine 11.6 New York 15.5 Vermont 10.4
Delaware 13.2 Maryland 14.9 North Carolina 19.5 Virginia 15.1
District of Columbia 12.4 Massachusetts 5 North Dakota 12.6 Washington 15.4
Florida 24.7 Michigan 14.6 Ohio 15.7 West Virginia 16.2
Georgia 21.6 Minnesota 10.3 Oklahoma 20.1 Wisconsin 11.1
Hawaii 8.7 Mississippi 20.7 Oregon 18.2 Wyoming 19

5 The Uninsured in Michigan: A Profile
The proportion of U.S. residents with employer‐based health insurance coverage ranged from a low of 48 percent in New Mexico to a high of 72.2 percent in New Hampshire, with Michigan ranked 18th highest in employer‐based coverage in the nation. This high rate of employer‐based coverage at 62.8 percent is one of the primary reasons for Michigan’s lower uninsured rate. Nationally, the percentage of residents covered by employer‐based health insurance declined between 2007‐2009 and 2009‐2011 from 61.7 percent to 58.8 percent. It also declined in Michigan from 67.4 percent to 62.8 percent during this same time period while still remaining above the national average.
(III) Individual Purchased Health Insurance by State
Percentage of Individually Purchased Coverage by State, 2009‐2011
United States 7 Idaho 12.1 Missouri 9.1 Pennsylvania 8.9
Alabama 6.9 Illinois 6.6 Montana 11.3 Rhode Island 6
Alaska 4.4 Indiana 6.2 Nebraska 11.8 South Carolina 6.4
Arizona 7.3 Iowa 9 Nevada 6.3 South Dakota 11.2
Arkansas 6.1 Kansas 7.3 New Hampshire 7.4 Tennessee 7.1
California 7.7 Kentucky 4.8 New Jersey 5.8 Texas 5.3
Colorado 10.2 Louisiana 6.6 New Mexico 5.4 Utah 7.9
Connecticut 8.8 Maine 6.2 New York 6.4 Vermont 6.9
Delaware 5.8 Maryland 7.3 North Carolina 6.4 Virginia 7.3
District of Columbia 8.6 Massachusetts 6 North Dakota 14.1 Washington 8.2
Florida 7.6 Michigan 6.7 Ohio 6.4 West Virginia 2.9
Georgia 6.1 Minnesota 9.3 Oklahoma 5.4 Wisconsin 6.3
Hawaii 6.6 Mississippi 6.5 Oregon 8.9 Wyoming 7.6
The proportion of residents with individually purchased insurance ranged from a low of 2.9 percent in West Virginia to a high of 14.1 percent in North Dakota. The proportion of Michigan residents who purchased individual policies has increased from 5.3 percent in 2007‐2009 to 6.7 percent in 2009‐2011.

6 The Uninsured in Michigan: A Profile
SOURCES OF HEALTH INSURANCE COVERAGE
OF THE NONELDERLY POPULATION
This report focuses primarily on Michigan’s non‐elderly residents since persons aged 65 and older are by and large insured under coverage options such as Medicare, which are not uniformly available to the rest of the population.
Sources of Health Insurance for Non –Elderly Population, 2009‐2011
14.60%
62.80%
6.70%
21.60%
Sources of Health Insurance for Non elderly population in MI, 2009‐2011
Uninsured
Employer Coverage
Individual
Public Coverage
Data Source: Current Population Survey Annual Social and Economic Supplement (CPS. Those who report multiple types of insurance coverage ( i.e private, public or millitary) are included in each category. Therefore the total adds up more than 100 percent.
In 2009‐2011, 12.8 percent of Michigan’s total population was uninsured, while 14.6 percent of Michigan’s non‐elderly population (0‐64 years) was uninsured. Employer‐based health insurance is the cornerstone of the healthcare system in the U.S. It still remains a dominant source of coverage, while its share has been declining each year. Employer‐based coverage decreased in Michigan from 67.4 percent in 2007‐2009 to 62.8 percent in 2009‐2011. Public health insurance options increased over the same time period and the uninsured rate has not increased at an equal rate. This means that the loss of employer‐based coverage has been partially offset by an increase in public coverage. For calendar years 2009‐2011, 62.8 percent of the population had employer coverage and 21.6 percent had public coverage in Michigan.

7 The Uninsured in Michigan: A Profile
EMPLOYER BASED COVERAGE IN MICHIGAN, 2001‐2011
Employer based coverage in Michigan, non‐elderly, 2001‐2011
76.4 73.7 73.8 71.7 71.3 70.5 69.8 67 65.5 62.1 60.8
0
20
40
60
80
100
2001 2002 2003 2004 2005 2006 2007 2008 2009 2010 2011
Percentage
Trends in MI ‐ Employer based coverage, 2001‐2011
Employer based coverage
The availability of the employer‐ based coverage has been declining over the years. It peaked in 2001 by providing coverage to 76.4 percent of the population. In 2011, 60.8 percent of the people had employer‐ based coverage in Michigan, which is 15.6 percent lower than the percentage in 2001.
Health Insurance Coverage, Non‐elderly Population, (2009‐2011)
The incidence of employer‐based health insurance in Michigan (62.8 percent) is above the national average (58.8 percent). Private coverage has always accounted for the majority of health insurance coverage, both in Michigan and throughout the United States, with Michigan consistently having rates above the national average. This contributes to Michigan having a lower uninsured rate than the national average.
Uninsured Insured Employer Coverage Individual Coverage Public CoverageUnited States 18.20% 81.80% 58.80% 7.00% 22.00%
Michigan 14.60% 85.40% 62.80% 6.70% 21.60%

8 The Uninsured in Michigan: A Profile
PUBLIC COVERAGE IN MICHIGAN (2009‐2011)
Public coverage in Michigan, non‐elderly (2009‐2011)
13.415 15.5
16.8 17.4 18 18.119.3 19.4
22.8 22.6
0
5
10
15
20
25
2001 2002 2003 2004 2005 2006 2007 2008 2009 2010 2011
Trends in MI‐ Public Coverage, 2001‐2011
Public Coverage
Public Coverage has historically made up a smaller percentage as compared to private coverage throughout the nation and in Michigan. In 2001, 13.4 percent of the nonelderly population had public coverage in Michigan. It has been increasing steadily and, in 2011, 22.6 percent of the population had health insurance from this source. The expansion of public program coverage has been helpful to some of the people who did not have access to the private coverage.

9 The Uninsured in Michigan: A Profile
THE UNINSURED – TRENDS IN MICHIGAN, (2001‐2011)
In order to show the trend over time, this section uses annual data from 2001‐2011 to depict changes in percentage of uninsured population over the years. The proportion of residents without health insurance coverage in Michigan has been consistently lower than the national average since 1987; the first year when comparable data were made available.
(I) Trends ‐ Nonelderly Uninsured (0‐64years), 2001‐2011
15.2 15.7 16.4 16.1 16.5 17.1 16.6 16.718.2 18.4 17.9
10.1 10.9 10.411.5 10.7 11.5 12.1 13
14.7 14.9 14.1
0
5
10
15
20
2001 2002 2003 2004 2005 2006 2007 2008 2009 2010 2011
Percentage
Nonelderly (0‐64 yrs)uninsured
US MI
In 2001, 10.1 percent of Michigan’s nonelderly population was without health insurance. The percentage was highest in 2010 (14.9 percent) and came down to 14.1 percent in 2011. The national trends are similar to those observed in Michigan. The percentage of uninsured has been increasing slowly overtime in the U.S., and it came down to 17.9 percent in 2011 from 18.4 percent in 2010.
(II) Trends ‐ Uninsured Children (0‐17years), 2001‐2011

10 The Uninsured in Michigan: A Profile
Children’s health coverage is extremely important in access to health care. Despite the predominant role of health insurance in access to health care, there are a significant number of uninsured children in the U.S. Children living in poverty, working families, or low income households are more likely to be uninsured. Michigan continues to experience a considerably lower rate of uninsured children than the United States. In Michigan, the percentage of uninsured children has been lowest at 4.4 percent in 2005. For 2011, Michigan had an uninsured rate of 5.4 percent for children, compared with the United States rate of 9.4 percent.
(III) Trends – Uninsured adults (18‐64 years), 2001‐2011
Age factor plays an important role in access to health insurance. Young adults are the age group least likely to have health insurance. Majorities of the people between 18‐64 years of age receive insurance as a job benefit; however, not everyone has access to that type of coverage. Due to the gaps in public and private coverage, 21.2 percent of the people in this age group in the United States. were uninsured in 2011. Among the adults aged 18‐64, rates of uninsurance have been increasing over the years. In 2010, 21.8 percent of the U.S. population, ages 18‐64 years was without health insurance. Michigan also reached its highest point (18.6 percent) of uninsured between 18‐64 year age group in the same year; however, it came down to 17.5 percent in 2011.
11 The Uninsured in Michigan: A Profile
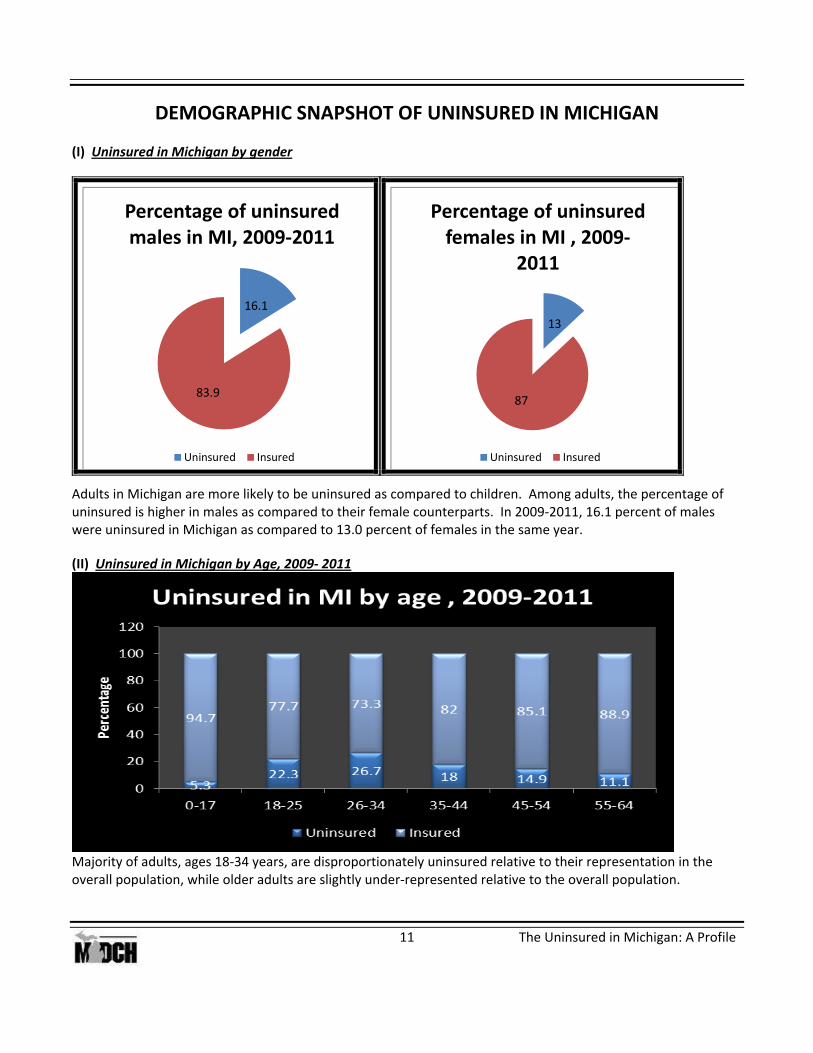
DEMOGRAPHIC SNAPSHOT OF UNINSURED IN MICHIGAN
(I) Uninsured in Michigan by gender
16.1
83.9
Percentage of uninsured males in MI, 2009‐2011
Uninsured Insured
13
87
Percentage of uninsured females in MI , 2009‐
2011
Uninsured Insured
Adults in Michigan are more likely to be uninsured as compared to children. Among adults, the percentage of uninsured is higher in males as compared to their female counterparts. In 2009‐2011, 16.1 percent of males were uninsured in Michigan as compared to 13.0 percent of females in the same year.
(II) Uninsured in Michigan by Age, 2009‐ 2011
Majority of adults, ages 18‐34 years, are disproportionately uninsured relative to their representation in the overall population, while older adults are slightly under‐represented relative to the overall population.
12 The Uninsured in Michigan: A Profile
The risk of being uninsured is greatest for adults aged 18‐34. This means there are more uninsured individuals in these age groups than their percent of overall population. In Michigan, 94.7 percent of the non‐elderly uninsured are adults, while only 5.3 percent are children. Among adults ages 25 years and older, the rate of uninsured in each age group decreases as age increases. This result is also likely due to the correlation between age and income, as younger adults are more likely to have lower incomes than older adults.
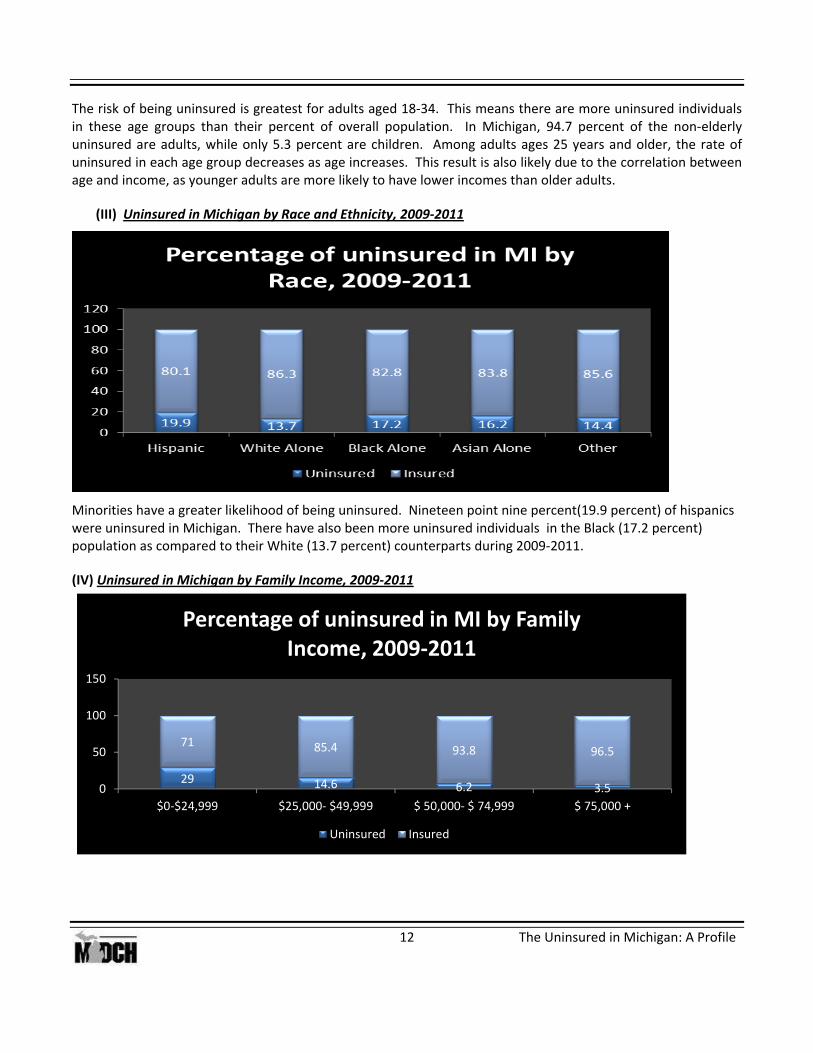
(III) Uninsured in Michigan by Race and Ethnicity, 2009‐2011
Minorities have a greater likelihood of being uninsured. Nineteen point nine percent(19.9 percent) of hispanics were uninsured in Michigan. There have also been more uninsured individuals in the Black (17.2 percent) population as compared to their White (13.7 percent) counterparts during 2009‐2011.
(IV) Uninsured in Michigan by Family Income, 2009‐2011
29 14.6 6.2 3.5
71 85.4 93.8 96.5
0
50
100
150
$0‐$24,999 $25,000‐ $49,999 $ 50,000‐ $ 74,999 $ 75,000 +
Percentage of uninsured in MI by Family Income, 2009‐2011
Uninsured Insured

13 The Uninsured in Michigan: A Profile
Individuals below poverty line and with low family income are at the highest risk of being uninsured. A high family income does not guarantee health insurance. The gaps in the health insurance system affect people of all ages, races, ethnicities, and income levels; however, those with the lowest income face the greatest risk of being uninsured. Twenty‐nine percent (29 percent) of the people with family earning less than $25,000 have been uninsured in Michigan in 2009‐2011. Three point five percent (3.5 percent) of the population in Michigan having a family income of $75,000 or greater have been uninsured in Michigan during the same period of time.
(V) Uninsured in Michigan by Family type, non‐ elderly, (2009‐2011)
7.9 10.4 12.828.5
92.1 89.6 87.271.5
0
20
40
60
80
100
120
Married, with childrenunder 18
Married , withoutchildren under 18
Not married, withchildren under 18
Not married, withoutchildren under 18
Percentage
Uninsured in MI by Family Type, 2009‐2011
Uninsured Insured
Single individuals without children are at the highest risk for being uninsured. There are more uninsured individuals in this group than the percent of uninsured in overall population. In 2009‐2011, 28.5 percent of the unmarried individuals without children less than 18 years of age have been uninsured. The percentage of married people with children less than 18 years of age had the lowest uninsured rate at 7.9 percent.
(VI) Uninsured in Michigan by Education Level, non‐elderly, 2009‐2011

14 The Uninsured in Michigan: A Profile
Individuals having less than a high school education have the greatest risk of being uninsured. The uninsured rate drops with the completion of a college degree. It has been observed that as the education level increases, the number of uninsured people decreases. A majority of the people (28.4 percent) with an education level less than high school have been uninsured in Michigan during 2009‐2011. Twenty‐three point eight percent (23.8 percent) of the people with a high school degree have been uninsured in Michigan and 8.9 percent of the people with a college degree and higher have been uninsured in 2009‐2011.
(VII) Uninsured in Michigan by Health Status, non‐ elderly, 2009‐2011
14.2 18.1
85.8 81.9
0
20
40
60
80
100
120
Good/Very Good Fair/poor
Percentage
Uninsured in MI, by Health Status, 2009‐2011
Insured
Uninsured
The data suggests that 14.2 percent of people with good/very good health have been uninsured in Michigan and 18.1 percent of the people who have a fair/poor health status were also uninsured during 2009‐2011.
(VIII) Employment Characteristics of the uninsured in Michigan, non‐ elderly, 2009‐2011

15 The Uninsured in Michigan: A Profile
Part‐time workers comprise a disproportionately large percentage of the uninsured, because sometimes employers often do not offer coverage to part‐time workers or they don’t offer affordable plans. Many of the uninsured work for firms that do not offer coverage or, if their employers offered coverage, they either were not eligible or did not accept the offer. Individuals who are not working or experiencing some unemployment are more likely to be uninsured. Those who are working full time/full year are more likely to be insured than the part‐time workers. Twenty‐five point three percent (25.3 percent) of people working part time in Michigan have been uninsured in 2009‐2011. The percentage of uninsured people working full time has been fourteen (14 percent) during the same years.
(IX) Income Distribution of the Uninsured Population in Michigan, 18‐64 years, 2009‐2011
3527.2
13 5.2
40.1 34.2
18 5.90
10
20
30
40
50
0‐138%FPG 139‐200% FPG 201‐400% FPG 401 + FPG
Percentage
Uninsured, 18‐64 age at different poverty levels
MI US
There is a higher percentage (35 percent) of uninsured population at the 0‐138 percent FPG level as compared to the percentage (5.2 percent) of uninsured at 401 percentage plus FPG in Michigan. There are more uninsured people at the 0‐138 percent FPG level as compared to the uninsured rate at 401+FPG level in Michigan and the United States.

16 The Uninsured in Michigan: A Profile
HOW DOES MICHIGAN COMPARE WITH THE UNITED STATES
(I) Source of coverage, non‐ elderly, (2009‐2011)
Employer‐based and individually purchased coverage both decreased in Michigan and the U.S. since 2001. The percentage of people covered in Michigan by employer‐based programs (62.8 percent) has been higher than the US (58.8 percent) in 2009‐2011. Employer‐sponsored insurance still continues to be the largest source of health insurance coverage. Public health insurance options, which include Medicaid, Medicare, and Military/Veteran Affairs, have increased in the same period of time.
(II) Health Insurance Coverage, Age (0‐17years)
5.3
94.7
9.6
90.4
0
20
40
60
80
100
Uninsured Children Insured Children
Health Insurance Coverage , 0‐17 years, 2009‐2011
Michigan US
In Michigan, 94.7 percent of the children were insured, while only 5.3 percent of the children were uninsured in 2009‐2011. The percentage of children making up the uninsured has dropped over time. Michigan children are almost half likely to be uninsured (5.3 percent) as children nationally (9.6 percent).
17 The Uninsured in Michigan: A Profile
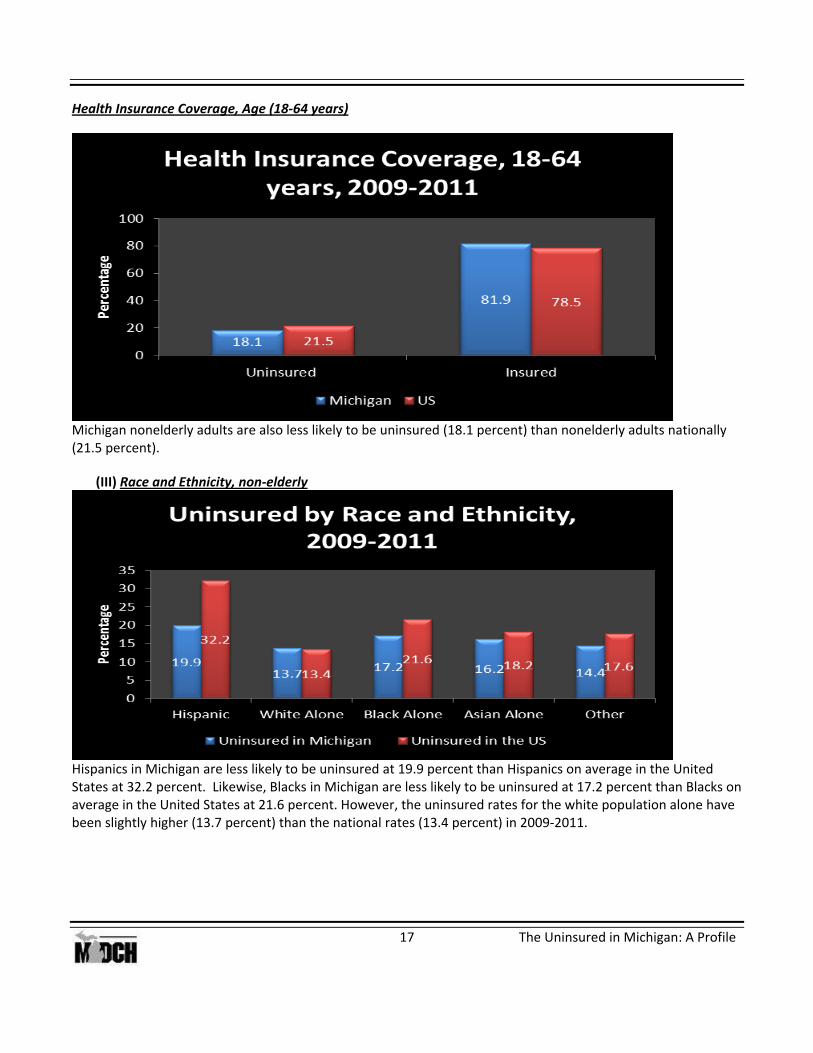
Health Insurance Coverage, Age (18‐64 years)
Michigan nonelderly adults are also less likely to be uninsured (18.1 percent) than nonelderly adults nationally (21.5 percent).
(III) Race and Ethnicity, non‐elderly
Hispanics in Michigan are less likely to be uninsured at 19.9 percent than Hispanics on average in the United States at 32.2 percent. Likewise, Blacks in Michigan are less likely to be uninsured at 17.2 percent than Blacks on average in the United States at 21.6 percent. However, the uninsured rates for the white population alone have been slightly higher (13.7 percent) than the national rates (13.4 percent) in 2009‐2011.

18 The Uninsured in Michigan: A Profile
(IV) Income to Poverty Ratio, 18‐64 yrs
3527.2
135.2
40.134.2
18
5.90
5
10
15
20
25
30
35
40
45
0‐138%FPG 139‐200% FPG 201‐400% FPG 401 + FPG
Percentage
Uninsured, 18‐64 age at different poverty levels
MI US
Michigan has a lower percentage of uninsured than the United States in all income brackets and at different poverty levels. There is a higher percentage of uninsured population at the 0‐138 percent FPG level as compared to the percentage of uninsured at 401 percent plus FPG. In the Michigan, there have been 35 percent uninsured people at the 0‐138 percent FPG level and 5.2 percent of uninsured at 401 percent plus FPG. (V)Uninsured by Education Level, non‐elderly
Both nationally and in Michigan, the most likely to be uninsured are individuals with an education level less than high school. Twenty‐eight point four percent (28.4 percent) of the Michigan residents within this category and 40.6 percent nationally are uninsured. Michigan’s uninsured rates are lower for all education categories than the United States.

19 The Uninsured in Michigan: A Profile
(VI) Family Type
Both nationally and in Michigan, the most likely to be uninsured are single individuals who are not married and without children under 18 years of age (28.5 percent in Michigan, 29.6 percent nationally). The least likely to be uninsured are married couples with children under 18, both in the Michigan and United States.
A‐1 The Uninsured in Michigan: A Profile
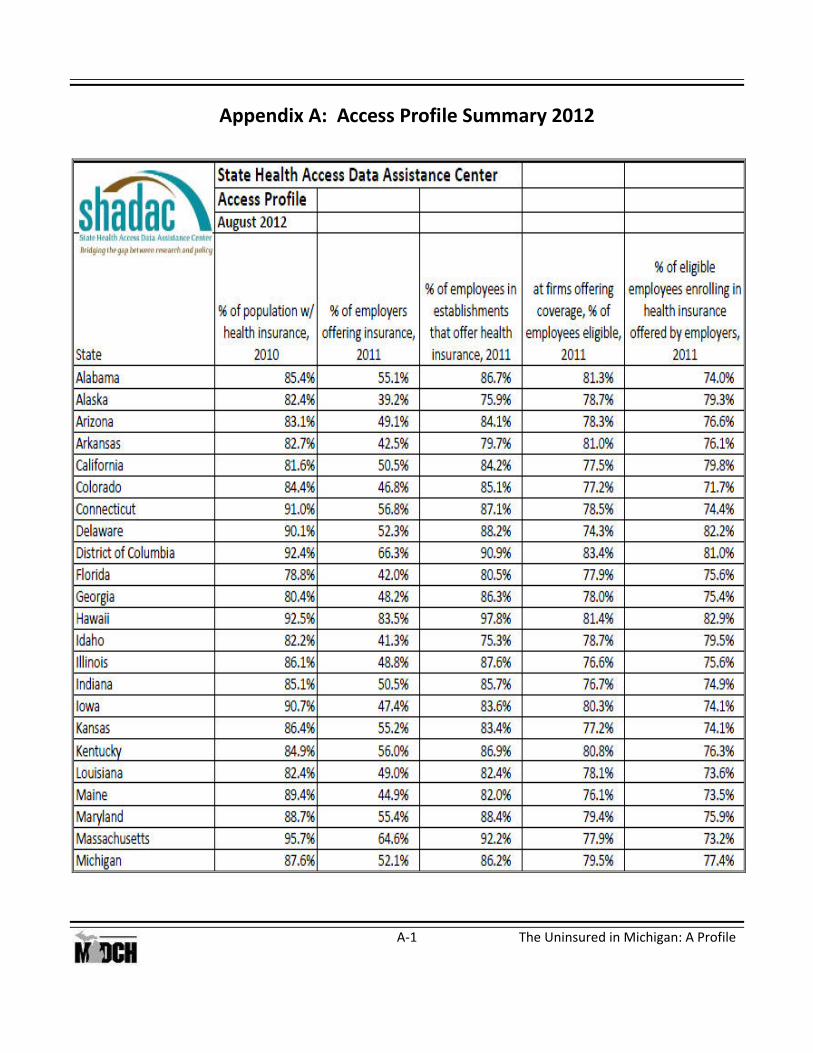
Appendix A: Access Profile Summary 2012

A‐2 The Uninsured in Michigan: A Profile

B‐1 The Uninsured in Michigan: A Profile
Appendix B: Technical Notes on the Current Population Survey (CPS)
Information for these notes was provided by the Census Bureau at websites listed below. Additional information on the CPS can be found at: http://www.census.gov/. Any additional information about the limitations of the CPS and other methodology concerns can be found in Technical Paper 63RV, The Current Population Survey: Design and Methodology, at http://www.census.gov/prod/2002pubs/tp63rv.pdf. CPS information specific to health care is available at: http://www.census.gov/hhes/www/hlthins/hlthins.html. Please note that there is a technical error in the CPS classification of insurance coverage status for some population groups (the population age 18‐24 in particular) that has led to a corresponding loss of data for those population groups. The Current Population Survey (CPS) is the source of the official government statistics on employment and unemployment. The CPS has been conducted monthly for over 50 years. Currently, it interviews about 57,000 households monthly (about 112,000 individuals), scientifically selected based on area of residence to represent the nation as a whole, individual states, and other specified areas. Each household is interviewed once a month for four consecutive months one year, and again for the corresponding time period a year later. This technique enables the CPS to obtain month‐to‐month and year‐to‐year comparisons at a reasonable cost while minimizing the inconvenience to any one household. Although the main purpose of the survey is to collect information on the employment situation, a very important secondary purpose is to collect information on the demographic status of the population, information such as age, sex, race, marital status, educational attainment, and family structure. From time to time, additional questions are included on such important subjects as health, education, income, and previous work experience. The statistics resulting from these questions serve to update similar information collected once every ten years through the decennial census, and are used by government policymakers and legislators as important indicators of our nation's economic situation and for planning and evaluating many government programs. The CPS provides current estimates of the economic status and activities of the population of the United States. Because it is not possible to develop one or two overall figures (such as the number of unemployed) that would adequately describe the labor market, the CPS is designed to provide a large amount of detailed and supplementary data. Such data are made available to meet a wide variety of needs on the part of users of labor market information. In 2002, the Annual Social and Economic Supplement (ASEC) incorporated a significant sample expansion. The sample was expanded primarily to improve state estimates of children’s health insurance coverage. This sample expansion, known as the CHIP sample, has three components: 1) Asking the ASEC Supplement questions of one‐quarter of the February and April CPS samples ‐ that is, of the households not also included in the March sample; 2) Interviewing selected sample households from the preceding November CPS sample during the February‐ April period using the ASEC Supplement; and 3) Increasing the monthly CPS sample in states with high sampling errors for uninsured children. This sample increased results in the addition of about 34,500 households to the ASEC. Adding together the regular sample (60,000), plus the Hispanic sample (4,500), plus the CHIP sample

B‐2 The Uninsured in Michigan: A Profile
(34,500), we arrive at the total sample size for the ASEC of about 99,000 households. Michigan did not have an increase in sample size due to this change. Sample The CPS sample is based on the civilian non‐institutional population of the United States. The sample is located in 792 sample areas comprising 2,007 counties and independent cities with coverage in every state and in the District of Columbia. In all, some 72,000 housing units or other living quarters are assigned for interviews each month; about 57,000 of them, containing approximately 112,000 persons 15 years old and over, are interviewed. Also included are demographic data for approximately 31,000 children 0‐14 years old and 450 armed forces members living with civilians either on or off base within these households. The remainder of the assigned housing units is found to be vacant, converted to nonresidential use, contain persons with residence elsewhere, or are not interviewed because the residents are not found at home after repeated calls, are temporarily absent, or are unavailable for other reasons. Approximately 16,000 non‐interview households are present each month. The resulting file size is approximately 160,000 records. Each year in the ASEC supplement, data are collected for Armed Forces members residing with their families in civilian housing units or on a military base. The Armed Forces members, however, are not asked the monthly labor force questions. In addition, the ASEC is supplemented with a sample of Hispanic households identified the previous November. This results in the addition of about 4,500 households (4,000 interviewed). Sampling The following list briefly describes the major characteristics of the CPS sample as of July 1995:
1. The CPS sample is a probability sample. 2. The sample is designed primarily to produce national and state estimates of labor force characteristics
of the civilian non‐institutional population 16 years of age and older (CNP16+). 3. The CPS sample consists of independent samples in each state and the District of Columbia. In other
words, each state’s sample is specifically tailored to the demographic and labor market conditions that prevail in that particular state.
Weighting For all CPS data files, a single weight is prepared and used to compute the monthly labor force status estimates. The final weight, which is the product of several adjustments, is used to produce population estimates for the various items covered in the regular monthly CPS. This weight is constructed from the basic weight for each person, which represents the probability of selection for the survey. The basic weight is adjusted for special sampling situations and failure to obtain interviews from eligible households (non‐interview adjustment). Limitations CPS is a sample of data that produces estimates nationally and by state. The quality of any estimate based on sample survey data can and should be examined from two perspectives. The first is based on the mathematics of statistical science, and the second stems from the fact that survey measurement is a production process conducted by human beings. From both perspectives, survey estimates are subject to error and, to avoid misusing or reading too much into the data, we should use them only after their potential error of both sorts has been examined relative to the particular use at hand.

B‐3 The Uninsured in Michigan: A Profile
The quality of estimates made from any survey, including CPS, is a function of innumerable decisions made by designers and implementers. As a general rule of thumb, designers make decisions aimed at minimizing mean squared error within given cost constraints. Practically speaking, statisticians are often compelled to make decisions on sample designs and estimators based on variance alone; however, in the case of CPS, the availability of external population estimates and data on rotation group bias makes it possible to do more than that. Designers of questions and data collection procedures tend to focus on limiting bias and assume the specification of exact question wording and ordering will naturally limit the introduction of variance. Whatever the theoretical focus of the designers, the accomplishment of the goal is heavily dependent upon those responsible for implementing the design. Implementers of specified survey procedures, like interviewers and respondents, are presumably concentrating on doing the best job they know how to do given time and knowledge constraints. Consequently, process monitoring through quality indicators, such as coverage and response rates, is necessary to determine when additional training or revisions in process specification are needed. Continuing process improvement must be a vital component of survey management if the quality goals set by designers are to be achieved. Nevertheless, it is clear that there are two main types of non‐sampling error in the CPS. The first is error imported from other frames or sources of information, such as Decennial Census omissions. The second type is considered preventable, such as when the sample is not completely representative of the intended population, within household omissions, respondents not providing true answers to a questionnaire item, or errors produced during the processing of the survey data. Small samples in each state and the District of Columbia result in unacceptably high variations in the monthly CPS composite estimates of state employment and unemployment. In an effort to produce less variable labor force estimates, models are used to assume and predict certain factors. As for the state estimates, data is also reported in three year averages to help boost the sample sizes used. Health Insurance Questions Until recently, a question specifically about being uninsured was never asked. Estimates of the uninsured were calculated as a residual; that is, persons were counted as being uninsured if they did not report having any type of health insurance coverage. When the CPS began including questions about health insurance, they always asked about coverage during the previous calendar year. For example, in March 2005, interviewers asked about health insurance coverage during 2004, so the uninsured estimate represents the number of residents who were uninsured for the entire previous calendar year. One measurement issue that arises in this structure is that individuals potentially are asked to recall the type of health insurance they had 14 months prior to being interviewed. A second issue is that some individuals do not understand the question and report the type of health insurance they have as of the interview date. Third, the CPS may not be picking up all Medicaid recipients because some states do not refer to their public program as “Medicaid”. In fact, there is strong evidence that the CPS under‐reports Medicaid coverage based on comparisons of CPS data with enrollment data provided by the Centers for Medicare & Medicaid Services (CMS) which is the federal agency primarily responsible for administering Medicaid. Last, because

B‐4 The Uninsured in Michigan: A Profile
respondents are asked to provide information about all sources of health insurance coverage during the previous calendar year, some individuals reported having health insurance coverage from more than one source, all of which were coded. CPS Changes in the Past Decade The CPS has undergone a number of changes over the years that affect the comparability of data over time. All of these changes have been made to the data shown in this report. The remainder of this section discusses those changes. March 1998 ‐ The Census Bureau modified its definition of Medicaid coverage. Previously, an individual covered only by the Indian Health Service (IHS) was counted as part of the Medicaid population. Beginning with the March 1998 CPS, individuals covered solely by IHS were counted as uninsured. This methodological change affected roughly 300,000 individuals. If this change had not taken place, the Medicaid population would have fallen by 0.9 percentage points between 1996 and 1997, instead of by 1.1 percentage points, and the uninsured would have increased to only 18.1 percent instead of 18.3 percent. However, overall, this was a minor change to the uninsured estimates in the CPS. March 2000 ‐ The Census Bureau added a question to the CPS to verify whether a person was actually uninsured. In essence, anyone who did not report any health insurance coverage during 2000 was asked an additional question about whether they were uninsured. Those who reported that they had coverage were then asked about the type of coverage. The verification questions resulted in the Census Bureau providing a “corrected” estimate for the uninsured in 1999. Prior to the correction, 17.5 percent of the nonelderly, representing 42.1 million individuals, were estimated to be uninsured in 1999. The verification questions resulted in a decline in the number and percentage of nonelderly individuals without health insurance coverage in 1999. Some of the persons who would have been counted as uninsured under the old methodology were now counted as having either employment‐based health insurance or purchased health insurance directly from an insurer. Hence, the corrected estimate for the uninsured in 1999 is 16.2 percent, or 39 million; a reduction from the previous estimate of 17.5 percent, or 42.1 million. Since the verification questions were not asked prior to the March 2000 CPS, data prior to that date are not directly comparable with data collected after that time period. 2001 ‐ Two changes were made to the CPS in 2001. First, the sample was expanded to improve state estimates of SCHIP (State Children’s Health Insurance Program) enrollees. Overall, this expanded sample increased the uninsured estimate from 14 percent of the population to 14.1 percent, which accounted for an increase of nearly 200,000 uninsured individuals (Mills, 2002). The Census Bureau also introduced Census 2000‐based weights to begin with the March 2002 CPS and provided new estimates for the March 2000 and March 2001 CPS that were based on the new weights. When using the Census 1990‐based weights for the March 2001 CPS, 15.8 percent of the nonelderly population, or 38.4 million residents, were uninsured. However, when using the Census 2000‐based weights, 16.1 percent of the nonelderly population was estimated to be uninsured, representing 39.4 million residents. The SCHIP sample expansion combined with an expansion in the number of Hispanic households interviewed each March results in 99,000 households being interviewed for the survey, representing 211,000 individuals.

B‐5 The Uninsured in Michigan: A Profile
August 2006 ‐ The Census Bureau released a revised March 2005 CPS dataset. The 2005 data were revised to reflect a correction to the weights, and the estimates were revised based on improvements to the methodology that assigns health insurance coverage to dependents. March 2007 ‐ The Census Bureau announced that it was revising the March 2005 and March 2006 datasets after discovering a coding error that affected a small number of individuals who were coded as not having health insurance coverage when, in fact, they did have coverage. Based on the new census data, the number of individuals under age 65 with health insurance increased by 1.8 million in both 2005 and 2006. The increase in coverage was mainly due to an increase in the number of dependents with employment‐based health benefits. The 1.8 million additional residents with health insurance coverage represents 0.7 percent additional individuals with coverage and 0.7 percent fewer uninsured individuals.
C‐1 The Uninsured in Michigan: A Profile
Appendix C: Current Population Survey Demographic Definitions
Health Insurance Coverage ‐ A person was considered covered by health insurance at some time during the year if he or she was covered by at least one of the following types of coverage:
1. Employer/union 2. Privately purchased (not related to employment) 3. Medicare 4. Medicaid 5. Military Health Care (Military, CHAMPUS, CHAMPVA, VA, Indian Health Services) 6. Someone Outside the Household 7. Other
An individual can have more than one type of coverage during the year. Medicaid ‐ The Medicaid Program is designed to provide medical assistance to needy families with dependent children, and to aged, blind, or permanently and totally disabled individuals whose incomes and resources are insufficient to meet the costs of necessary medical services. The program is administered by state agencies through grants from the Health Care Financing Administration of the Department of Health and Human Services. Funding for medical assistance payments consists of a combination of federal, state and, in some cases, local funds. Medicaid is a categorical program with complex eligibility rules which vary from state to state. There are two basic groups of eligible individuals: the categorically eligible and the medically needy. The major categorically eligible groups are all Aid to Families with Dependent Children (AFDC) recipients and most Supplemental Security Income (SSI) recipients. Other categorically eligible groups are 1) those who meet basic state cash assistance eligibility rules; aged, blind, disabled, needy single parents with children and, in some states, needy unemployed parents with children, but who are not currently receiving money payments; and 2) needy persons who meet categorical eligibility standards but are institutionalized for medical reasons (e.g., low‐income elderly persons in nursing homes). However, such institutionalized persons are not included in the CPS universe and, therefore, are not reflected in these statistics. Age ‐ Age classification is based on the age of the person at his/her last birthday. The adult universe (i.e., population of marriageable age) is comprised of persons 15 years old and over for the Annual Social and Economic (ASEC) Supplement data and for CPS labor force data. Child ‐ A child is a son or daughter by birth, a stepchild, or an adopted child of the householder, regardless of the child’s age or marital status. The category excludes son‐in‐laws, daughter‐in‐laws, and foster children. Children in this report refer to persons less than 18 years of age. Nonelderly Adult ‐ A person who is between 18‐64 years of age.

C‐2 The Uninsured in Michigan: A Profile
Race ‐ The race of individuals was identified by a question that asked for self‐identification of the person’s race. Respondents were asked to select their race from a "flashcard" listing racial groups and allowed to report more than one race. The population is divided into five groups on the basis of race: White; Black; American Indian, Eskimo or Aleut; Asian or Pacific Islander; and Other races. The last category includes any other race except White and Black in Michigan. Hispanic Origin ‐ Hispanic is an ethnicity, not a race. Persons of Hispanic origin in this file are determined on the basis of a question that asked for self‐identification of the person's origin or descent. Persons of Hispanic origin, in particular, are those who indicated that their origin was Mexican‐American, Chicano, Mexican, Mexicano, Puerto Rican, Cuban, Central or South American, or other Hispanic. Gender ‐ Individuals were asked to mark either ‘‘male’’ or ‘‘female’’ to indicate their sex. For most cases in which sex was not reported, it was determined from the person’s given (i.e., first) name and household relationship. Otherwise, sex was imputed according to the relationship to the householder and the age of the person. Family ‐ A family is a group of two persons or more (one of whom is the householder) residing together and related by birth, marriage, or adoption. All such persons (including related subfamily members) are considered as members of one family. Family Income ‐ In compiling statistics on family income, the incomes of all members 15 years old and over related to the householder are summed and treated as a single amount. Wages and Salary ‐ Money wages or salary is defined as total money earnings received for work performed as an employee during the income year. It includes wages, salary, Armed Forces pay, commissions, tips, piece‐rate payments, and cash bonuses earned, before deductions are made for taxes, bonds, pensions, union dues, etc. Earnings for self‐employed incorporated businesses are considered wage and salary. Education ‐ The order in which degrees were listed on the questionnaire suggested that doctorate degrees were ‘‘higher’’ than professional school degrees, which were ‘‘higher’’ than master’s degrees. The question included instructions for residents currently enrolled in school to report the level of the previous grade attended or the highest degree received. Respondents who did not report educational attainment or enrollment level were assigned the attainment of a person of the same age, race, Hispanic or Latino origin, occupation and sex, where possible, who resided in the same or a nearby area. Respondents who filled more than one box were edited to the highest level or degree reported. Family Household ‐ A family household is a household maintained by a family and may include among the household members any unrelated persons (unrelated subfamily members and/or unrelated individuals) who may be residing there. The number of family households is equal to the number of families. Poverty ‐ In this file, families and unrelated individuals are classified as being above or below the poverty level using a poverty index adopted by a Federal Interagency Committee in 1969 and slightly modified in 1981. The modified index provides a range of income cutoffs or "poverty thresholds" adjusted to take into account family
C‐3 The Uninsured in Michigan: A Profile
size, number of children, and age of the family householder or unrelated individual. The impact of these revisions on the poverty estimates is minimal at the national level. The poverty thresholds do not vary geographically, but they are updated annually for inflation using the Consumer Price Index. The official poverty definition counts money income before taxes and does not include capital gains and noncash benefits (such as public housing, Medicaid, and food stamps). Poverty is not defined for residents in military barracks, institutional group quarters, or for unrelated individuals under age 15 (such as foster children). These individuals are excluded from the poverty universe – that is, they are considered neither as "poor" nor as "non‐poor." Additional information on FPL can be found at: www.census.gov/hhes/www/poverty.html. Married Couple ‐ A married couple, as defined for census purposes, is a husband and wife enumerated as members of the same household. The married couple may or may not have children living with them. Single ‐ when used as a marital status category, is the sum of never‐married, widowed, and divorced residents. "Single," when used in the context of "single‐parent family/household," means only one parent is present in the home. The parent may be never‐married, widowed, divorced, or married, spouse absent. Employed ‐ Employed persons comprise 1) all civilians who, during the survey week did any work at all as paid employees or in their own business or profession, or on their own farm, or who work 15 hours or more as unpaid workers on a farm or a business operated by a member of the family; and 2) all those who have jobs but who are not working because of illness, bad weather, vacation, or labor management dispute, or because they are taking time off for personal reasons, whether or not they are seeking other jobs. These persons would have a Labor Force Status Recode (LFSR) of 1 or 2 respectively in character 145 of the person record which designates "at work" and "with a job, but not at work." Each employed person is counted only once. Unemployed ‐ Unemployed persons are those civilians who, during the survey week, have no employment but are available for work, and 1) have engaged in any specific job seeking activity within the past four weeks such as registering at a public or private employment office, meeting with prospective employers, checking with friends or relatives, placing or answering advertisements, writing letters of application, or being on a union or professional register; 2) are waiting to be called back to a job from which they had been laid off; or 3) are waiting to report to a new wage or salary job within 30 days. These persons would have an LFSR code of 3 or 4 in character 145 of the person record. The unemployed includes job leavers, job losers, new job entrants, and job re‐entrants. Work Experience ‐ A person with work experience is one who, during the preceding calendar year, did any work for pay or profit or worked without pay on a family‐operated farm or business at any time during the year, on a part‐time or full‐time basis. Full‐Time Worker ‐ A full‐time worker is one who worked 35 hours or more per week during a majority of the weeks worked during the preceding calendar year. Full‐Year Worker ‐ A full‐year worker is one who worked for 50 weeks or more during the preceding calendar year. Part‐Year Work ‐ Part‐year work is classified as less than 50 work weeks.

C‐4 The Uninsured in Michigan: A Profile
Full‐Time/Full‐Year Worker ‐ A full‐time, full‐year worker is a person who worked full time (35 or more hours per week) and 50 or more weeks during the previous calendar year. Full‐year/Some Unemployment ‐ A worker who normally works the entire year, either full‐time or part‐time, but experienced a period of unemployment during the year. Part‐time Worker ‐ Persons who work between one and 34 hours are designated as working "part‐time" in the current job held during the reference week. For the March supplement, a person is classified as having worked part‐time during the preceding calendar year if he worked less than 35 hours per week in a majority of the weeks in which he worked during the year. Conversely, he is classified as having worked full‐time if he worked 35 hours or more per week during a majority of the weeks in which he worked. Non‐worker ‐ A person who did not do any work in the calendar year preceding the survey. Self‐Employed ‐ Self‐employed persons are those who work for profit or fees in their own business, profession or trade, or operate a farm. Private Wage and Salary Workers ‐ Private wage and salary workers include residents who worked for wages, salary, commission, tips, pay‐in‐kind, or piece rates for a private for‐profit employer or a private not‐for‐profit, tax‐exempt, or charitable organization. Self‐employed residents whose business was incorporated are included with private wage and salary workers because they are paid employees of their own companies. Some tabulations present data separately for these subcategories: ‘‘for‐profit,’’ ‘‘not‐for‐profit,’’ and ‘‘own business incorporated.’’ Government Workers ‐ Government workers include residents who were employees of any federal, tribal, state, or local governmental unit, regardless of the activity of the particular agency. For some tabulations, the data were presented separately for federal (includes tribal), state, and local governments. Employees of foreign governments, the United Nations, or other formal international organizations were classified as ‘‘federal government.’’ Industry ‐ Some occupation groups are related closely to certain industries. Operators of transportation equipment, farm operators and workers, and healthcare providers account for major portions of their respective industries of transportation, agriculture, and healthcare. However, the industry categories include residents in other occupations. For example, residents employed in agriculture include truck drivers and bookkeepers; residents employed in the transportation industry include mechanics, freight handlers, and payroll clerks; and residents employed in the health care industry include occupations such as security guard and secretary.
C‐5 The Uninsured in Michigan: A
Profile
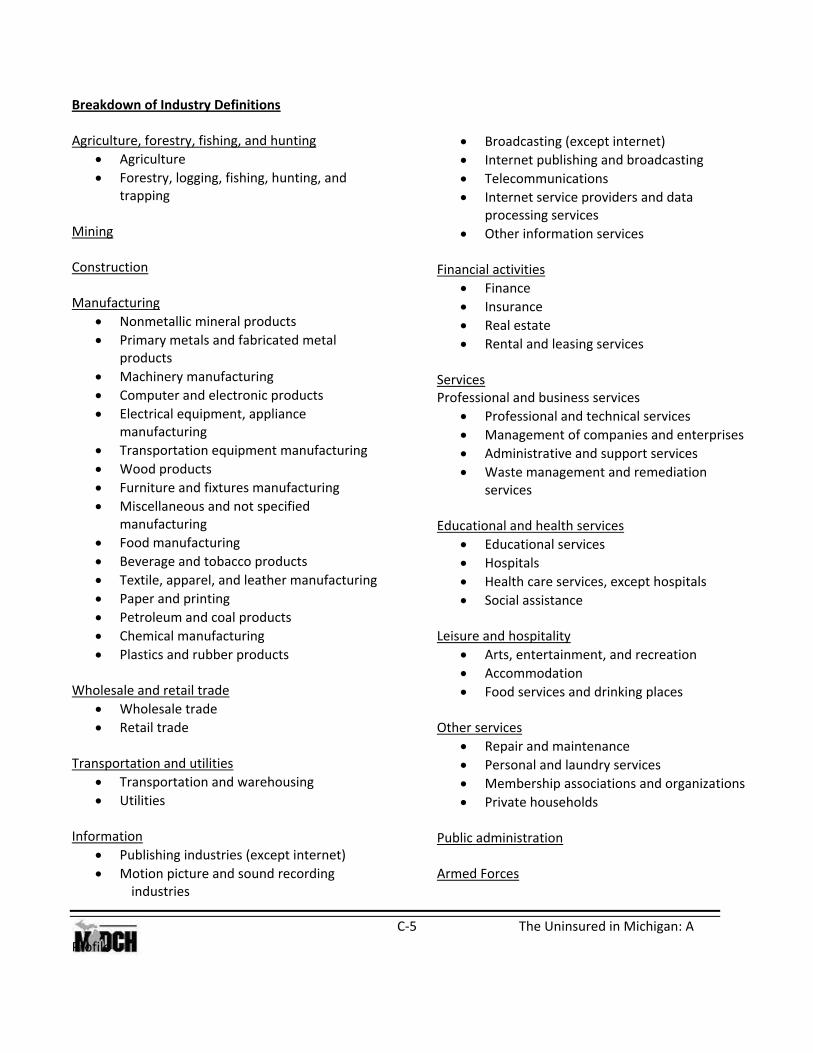
Breakdown of Industry Definitions Agriculture, forestry, fishing, and hunting
Agriculture
Forestry, logging, fishing, hunting, and trapping
Mining Construction Manufacturing
Nonmetallic mineral products
Primary metals and fabricated metal products
Machinery manufacturing
Computer and electronic products
Electrical equipment, appliance manufacturing
Transportation equipment manufacturing
Wood products
Furniture and fixtures manufacturing
Miscellaneous and not specified manufacturing
Food manufacturing
Beverage and tobacco products
Textile, apparel, and leather manufacturing
Paper and printing
Petroleum and coal products
Chemical manufacturing
Plastics and rubber products Wholesale and retail trade
Wholesale trade
Retail trade Transportation and utilities
Transportation and warehousing
Utilities Information
Publishing industries (except internet)
Motion picture and sound recording industries
Broadcasting (except internet)
Internet publishing and broadcasting
Telecommunications
Internet service providers and data processing services
Other information services Financial activities
Finance
Insurance
Real estate
Rental and leasing services Services Professional and business services
Professional and technical services
Management of companies and enterprises
Administrative and support services
Waste management and remediation services
Educational and health services
Educational services
Hospitals
Health care services, except hospitals
Social assistance Leisure and hospitality
Arts, entertainment, and recreation
Accommodation
Food services and drinking places Other services
Repair and maintenance
Personal and laundry services
Membership associations and organizations
Private households Public administration Armed Forces

The Uninsured in Michigan: A
Profile
More Information
Additional data resources on health insurance coverage in Michigan can be found at www.michigan.gov/spg.
For more information regarding this report, please contact:
Policy and Planning Administration Michigan Department of Community Health
Capitol View Building – 7th Floor Lansing, Michigan 48913
Email: [email protected] Phone: (517) 373‐2559
Michigan is an Equal Opportunity Employer, Services and Program Provider