Embed Size (px)
Citation preview
Michigan State Energy Profile
Michigan Quick Facts• In 2012, Michigan had more underground natural gas storage capacity – 1.1 trillion cubic feet – than any other
state in the nation.
• The Antrim Gas Field, located in Michigan's Lower Peninsula, was ranked 15th in the nation in estimated proved
wet natural gas reserves as of 2009 and produced an estimated 126 billion cubic feet of gas that year.
• In 2013, Michigan’s three nuclear power plants, with four reactor units, provided 28% of the state's net electricity
generation.
• Michigan used coal for 54% of its net electricity generation in 2013; much of its coal is brought by rail from
Wyoming and Montana.
• Biomass, much of it from Michigan’s almost 19 million acres of forest land, provided fuel for 42% of Michigan's
renewable net electricity generation in 2013.
• Because the weather in Michigan is cooler than in other areas of the United States, space heating makes up a
greater portion of energy use in homes (55 percent) compared to the U.S. average (41 percent), while air
conditioning makes up only 1 percent of energy use, according to EIA's Residential Energy Consumption Survey.
Last Updated: March 27, 2014
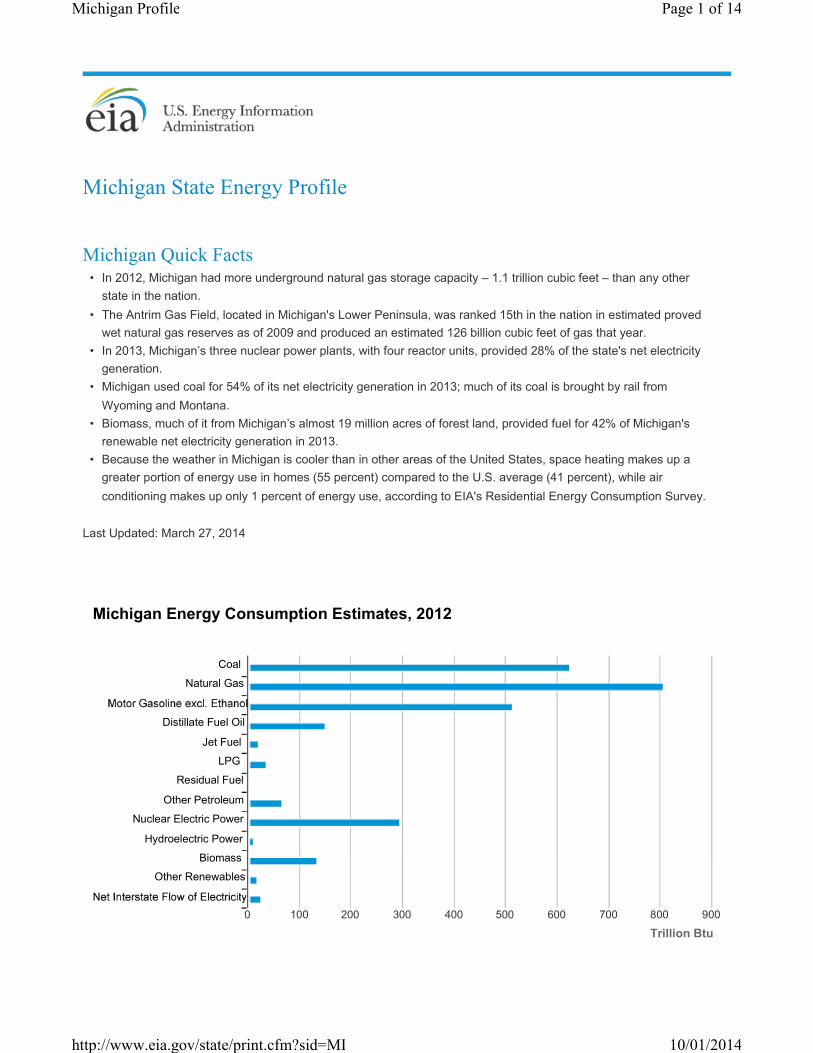
Michigan Energy Consumption Estimates, 2012
Coal
Natural Gas
Distillate Fuel Oil
Jet Fuel
LPG
Residual Fuel
Other Petroleum
Nuclear Electric Power
Hydroelectric Power
Biomass
Other Renewables
0 100 200 300 400 500 600 700 800 900
Trillion Btu
Page 1 of 14Michigan Profile
10/01/2014http://www.eia.gov/state/print.cfm?sid=MI

Source: Energy Information Administration, State Energy Data System
Page 2 of 14Michigan Profile
10/01/2014http://www.eia.gov/state/print.cfm?sid=MI

Michigan Energy Consumption by End-Use Sector, 2012
Michigan Energy Production Estimates, 2012
26.0 %
21.5 %
26.1 %
26.5 %
Residential
Commercial
Industrial
Transportation
Coal
Natural Gas - Marketed
Crude Oil
Nuclear Electric Power
Biofuels
Other Renewable Energy
0 50 100 150 200 250 300 350
Trillion Btu
Source: Energy Information Administration, State Energy Data System
Source: Energy Information Administration, State Energy Data System
Page 3 of 14Michigan Profile
10/01/2014http://www.eia.gov/state/print.cfm?sid=MI

DataLast Update: September 18, 2014 | Next Update: October 16, 2014
Energy Indicators
Michigan Net Electricity Generation by Source, Jun. 2014
Michigan Price Differences from U.S. Average, Most Recent Monthly
Petroleum-Fired
Natural Gas-Fired
Coal-Fired
Nuclear
Hydroelectric
Other Renewables
0 500 1,000 1,500 2,000 2,500 3,000 3,500 4,000 4,500 5,000
GWh
Natural Gas - Citygate
Electricity - Residential
Electricity - Commercial
Electricity - Industrial
-30 -25 -20 -15 -10 -5 0 5 10 15 20
Percent
Source: Energy Information Administration, Electric Power Monthly
Source: Energy Information Administration, Petroleum Marketing Monthly; Natural Gas Monthly;
Electric Power Monthly
Page 4 of 14Michigan Profile
10/01/2014http://www.eia.gov/state/print.cfm?sid=MI
Energy Indicators
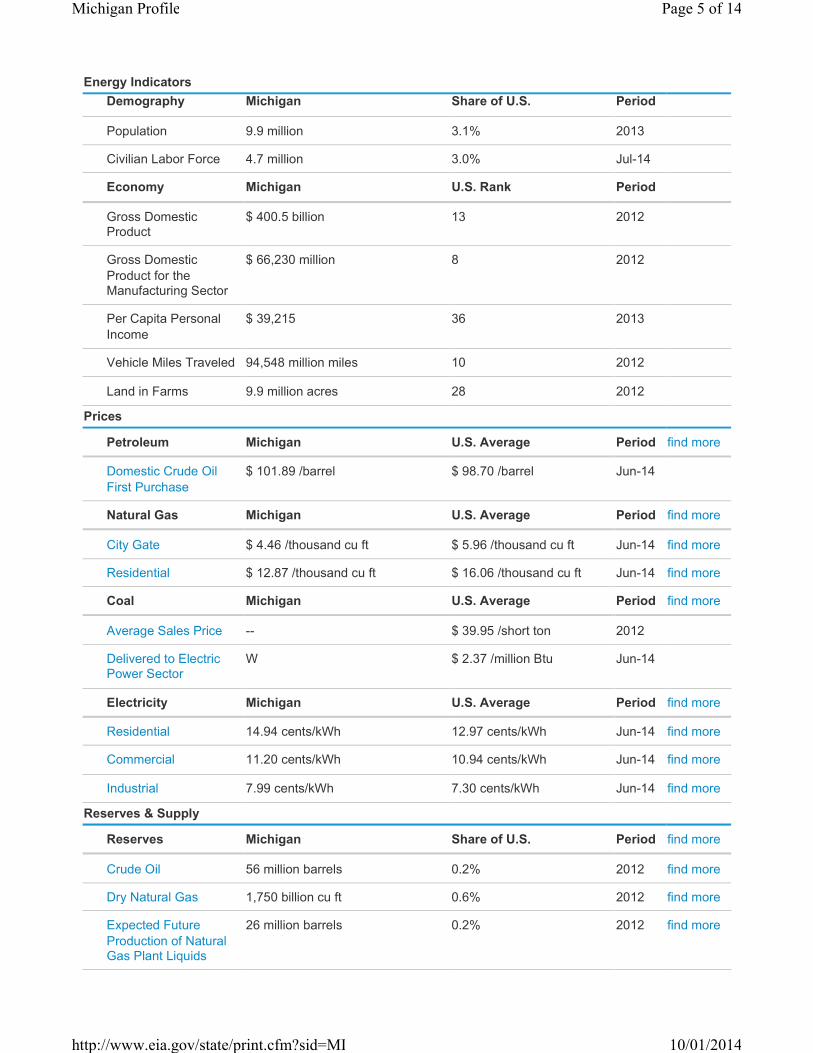
Demography Michigan Share of U.S. Period
Population 9.9 million 3.1% 2013
Civilian Labor Force 4.7 million 3.0% Jul-14
Economy Michigan U.S. Rank Period
Gross Domestic Product
$ 400.5 billion 13 2012
Gross Domestic
Product for the Manufacturing Sector
$ 66,230 million 8 2012
Per Capita Personal
Income
$ 39,215 36 2013
Vehicle Miles Traveled 94,548 million miles 10 2012
Land in Farms 9.9 million acres 28 2012
Prices
Petroleum Michigan U.S. Average Period find more
Domestic Crude Oil
First Purchase
$ 101.89 /barrel $ 98.70 /barrel Jun-14
Natural Gas Michigan U.S. Average Period find more
City Gate $ 4.46 /thousand cu ft $ 5.96 /thousand cu ft Jun-14 find more
Residential $ 12.87 /thousand cu ft $ 16.06 /thousand cu ft Jun-14 find more
Coal Michigan U.S. Average Period find more
Average Sales Price -- $ 39.95 /short ton 2012
Delivered to Electric Power Sector
W $ 2.37 /million Btu Jun-14
Electricity Michigan U.S. Average Period find more
Residential 14.94 cents/kWh 12.97 cents/kWh Jun-14 find more
Commercial 11.20 cents/kWh 10.94 cents/kWh Jun-14 find more
Industrial 7.99 cents/kWh 7.30 cents/kWh Jun-14 find more
Reserves & Supply
Reserves Michigan Share of U.S. Period find more
Crude Oil 56 million barrels 0.2% 2012 find more
Dry Natural Gas 1,750 billion cu ft 0.6% 2012 find more
Expected Future
Production of Natural Gas Plant Liquids
26 million barrels 0.2% 2012 find more
Page 5 of 14Michigan Profile
10/01/2014http://www.eia.gov/state/print.cfm?sid=MI

Energy Indicators
Recoverable Coal at
Producing Mines
-- -- 2012 find more
Rotary Rigs & Wells Michigan Share of U.S. Period find more
Rotary Rigs in
Operation
0 rigs 0.0% 2013
Natural Gas Producing
Wells
10,900 wells 2.3% 2012 find more
Production Michigan Share of U.S. Period find more
Total Energy 618 trillion Btu 0.8% 2012 find more
Crude Oil 606 thousand barrels 0.2% Jun-14 find more
Natural Gas - Marketed 129,333 million cu ft 0.5% 2012 find more
Coal -- -- 2012 find more
Capacity Michigan Share of U.S. Period
Crude Oil Refinery
Capacity (as of Jan. 1)
120,000 barrels/calendar day 0.7% 2013
Electric Power Industry
Net Summer Capacity
30,730 MW 2.9% Jun-14
Net Electricity
Generation
Michigan Share of U.S. Period find more
Total Net Electricity
Generation
9,108 thousand MWh 2.5% Jun-14
Net Electricity
Generation (share of
total)
Michigan U.S. Average Period
Petroleum-Fired 0.1 % 0.3 % Jun-14 find more
Natural Gas-Fired 10.8 % 27.3 % Jun-14 find more
Coal-Fired 50.8 % 38.7 % Jun-14 find more
Nuclear 30.6 % 19.1 % Jun-14 find more
Hydroelectric 1.3 % 7.2 % Jun-14 find more
Other Renewables 5.1 % 6.8 % Jun-14
Stocks Michigan Share of U.S. Period find more
Motor Gasoline
(Excludes Pipelines)
317 thousand barrels 1.5% Jun-14
Distillate Fuel Oil
(Excludes Pipelines)
1,098 thousand barrels 1.2% Jun-14 find more
Natural Gas in
Underground Storage
671,495 million cu ft 10.6% Jun-14 find more
Page 6 of 14Michigan Profile
10/01/2014http://www.eia.gov/state/print.cfm?sid=MI
Energy Indicators
Petroleum Stocks at
Electric Power
Producers
413 thousand barrels 1.4% Jun-14 find more
Coal Stocks at Electric
Power Producers
4,380 thousand tons 3.3% Jun-14 find more
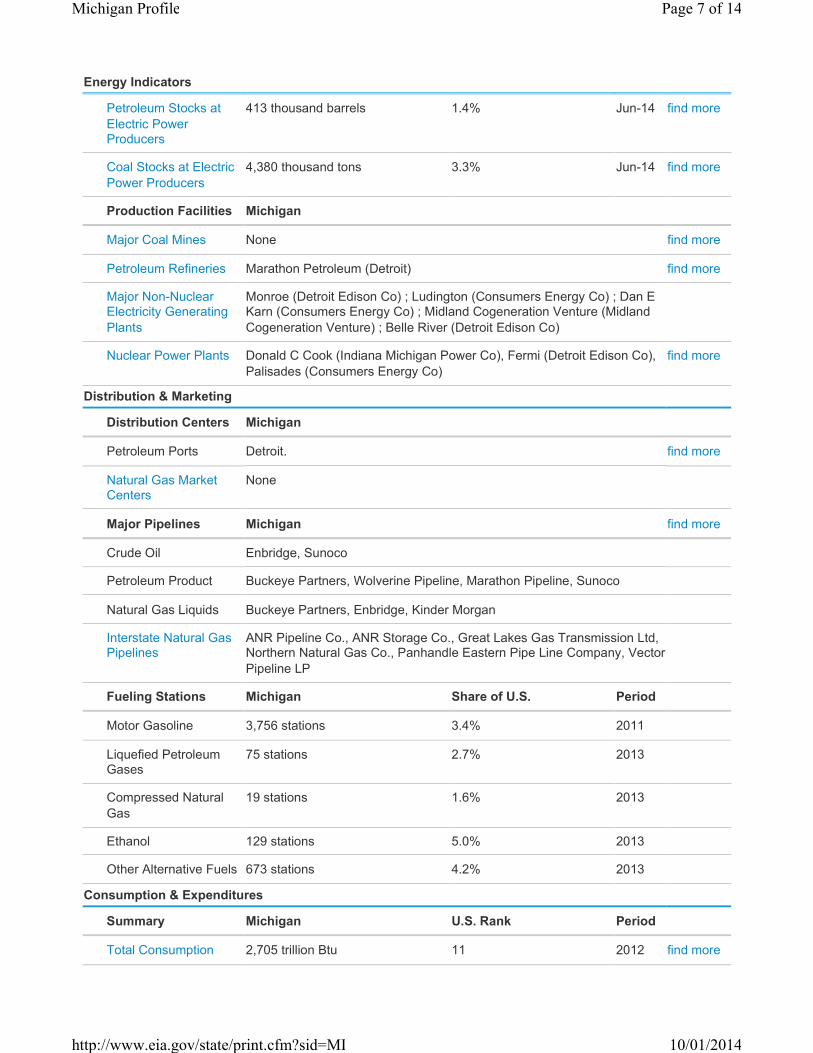
Production Facilities Michigan
Major Coal Mines None find more
Petroleum Refineries Marathon Petroleum (Detroit) find more
Major Non-Nuclear
Electricity Generating
Plants
Monroe (Detroit Edison Co) ; Ludington (Consumers Energy Co) ; Dan E
Karn (Consumers Energy Co) ; Midland Cogeneration Venture (Midland
Cogeneration Venture) ; Belle River (Detroit Edison Co)
Nuclear Power Plants Donald C Cook (Indiana Michigan Power Co), Fermi (Detroit Edison Co),
Palisades (Consumers Energy Co)
find more
Distribution & Marketing
Distribution Centers Michigan
Petroleum Ports Detroit. find more
Natural Gas Market
Centers
None
Major Pipelines Michigan find more
Crude Oil Enbridge, Sunoco
Petroleum Product Buckeye Partners, Wolverine Pipeline, Marathon Pipeline, Sunoco
Natural Gas Liquids Buckeye Partners, Enbridge, Kinder Morgan
Interstate Natural Gas Pipelines
ANR Pipeline Co., ANR Storage Co., Great Lakes Gas Transmission Ltd, Northern Natural Gas Co., Panhandle Eastern Pipe Line Company, Vector
Pipeline LP
Fueling Stations Michigan Share of U.S. Period
Motor Gasoline 3,756 stations 3.4% 2011
Liquefied Petroleum
Gases
75 stations 2.7% 2013
Compressed Natural
Gas
19 stations 1.6% 2013
Ethanol 129 stations 5.0% 2013
Other Alternative Fuels 673 stations 4.2% 2013
Consumption & Expenditures
Summary Michigan U.S. Rank Period
Total Consumption 2,705 trillion Btu 11 2012 find more
Page 7 of 14Michigan Profile
10/01/2014http://www.eia.gov/state/print.cfm?sid=MI
Energy Indicators
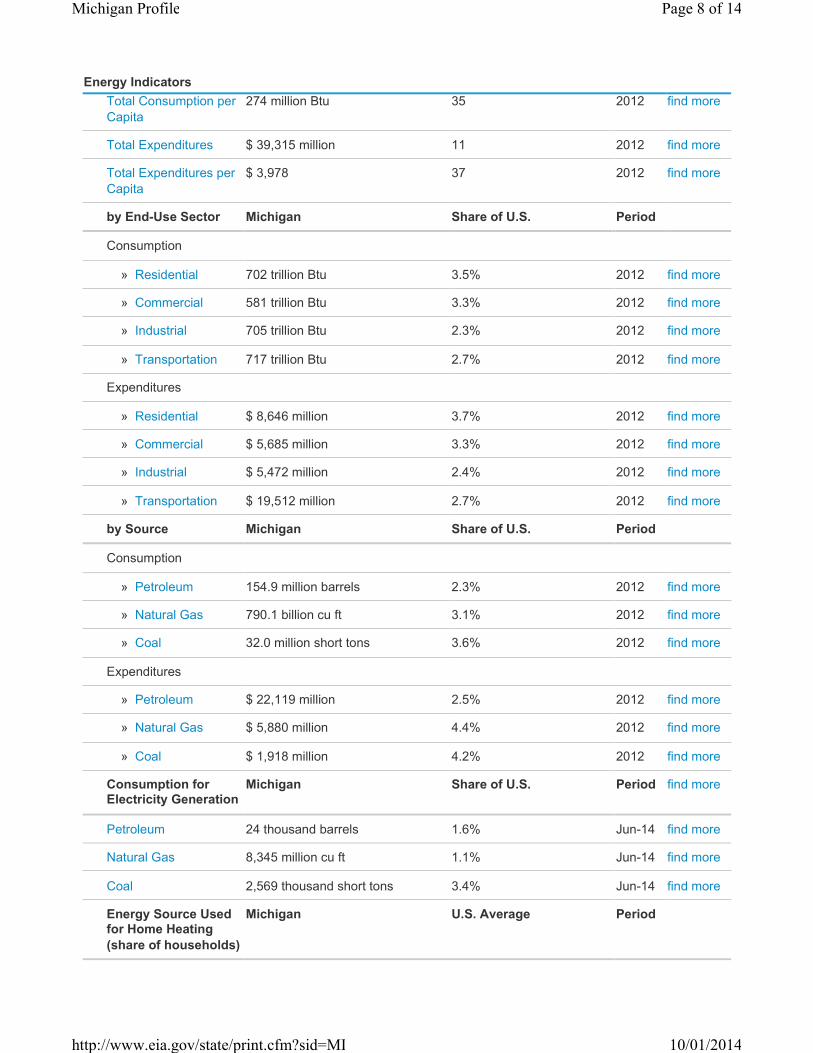
Total Consumption per
Capita
274 million Btu 35 2012 find more
Total Expenditures $ 39,315 million 11 2012 find more
Total Expenditures per
Capita
$ 3,978 37 2012 find more
by End-Use Sector Michigan Share of U.S. Period
Consumption
» Residential 702 trillion Btu 3.5% 2012 find more
» Commercial 581 trillion Btu 3.3% 2012 find more
» Industrial 705 trillion Btu 2.3% 2012 find more
» Transportation 717 trillion Btu 2.7% 2012 find more
Expenditures
» Residential $ 8,646 million 3.7% 2012 find more
» Commercial $ 5,685 million 3.3% 2012 find more
» Industrial $ 5,472 million 2.4% 2012 find more
» Transportation $ 19,512 million 2.7% 2012 find more
by Source Michigan Share of U.S. Period
Consumption
» Petroleum 154.9 million barrels 2.3% 2012 find more
» Natural Gas 790.1 billion cu ft 3.1% 2012 find more
» Coal 32.0 million short tons 3.6% 2012 find more
Expenditures
» Petroleum $ 22,119 million 2.5% 2012 find more
» Natural Gas $ 5,880 million 4.4% 2012 find more
» Coal $ 1,918 million 4.2% 2012 find more
Consumption for
Electricity Generation
Michigan Share of U.S. Period find more
Petroleum 24 thousand barrels 1.6% Jun-14 find more
Natural Gas 8,345 million cu ft 1.1% Jun-14 find more
Coal 2,569 thousand short tons 3.4% Jun-14 find more
Energy Source Used
for Home Heating
(share of households)
Michigan U.S. Average Period
Page 8 of 14Michigan Profile
10/01/2014http://www.eia.gov/state/print.cfm?sid=MI

Energy Indicators
Natural Gas 77.6 % 49.4 % 2012
Fuel Oil 1.7 % 6.5 % 2012
Electricity 7.6 % 35.5 % 2012
Liquefied Petroleum
Gases
8.8 % 5.0 % 2012
Other/None 4.3 % 3.6 % 2012
Environment
Special Programs Michigan find more
Clean Cities Coalitions Ann Arbor, Detroit, Greater Lansing
Alternative Fuels Michigan Share of U.S. Period find more
Alternative Fueled
Vehicles in Use
31,548 vehicles 2.7% 2011 find more
Ethanol Plant Operating
Capacity
268 million gal/year 1.9% 2014 find more
Ethanol Consumption 10,771 thousand barrels 3.5% 2012 find more
Total Emissions Michigan Share of U.S. Period find more
Carbon Dioxide 157.0 million metric tons 2.9% 2011
Electric Power
Industry Emissions
Michigan Share of U.S. Period find more
Carbon Dioxide 67,876,595 metric tons 3.1% 2012
Sulfur Dioxide 214,979 metric tons 5.8% 2012
Nitrogen Oxide 80,818 metric tons 3.8% 2012
AnalysisLast Updated: December 18, 2013
Overview
Michigan, known as the Great Lakes State, has within its boundaries portions of
four of the five Great Lakes. The state has more shoreline than any other state
except Alaska, and vessels that transit the Great Lakes–Saint Lawrence Seaway
arrive and depart from its many ports. The northern ends of Lake Michigan and
Lake Huron divide Michigan into two distinct sections, the Upper Peninsula, which
is lightly populated and heavily forested, and the Lower Peninsula, where most of
the state's population lives and all of the major cities, manufacturing industries,
and commercial agriculture are located. Michigan's largest and longest rivers are
in the Lower Peninsula, but of the state's more than 150 waterfalls, all but one are
located in the Upper Peninsula. With almost 40,000 square miles of the Great
With over one-
half of the state
forested,
Michigan has
abundant
woody biomass.
Page 9 of 14Michigan Profile
10/01/2014http://www.eia.gov/state/print.cfm?sid=MI

Lakes within its borders and thousands of smaller inland lakes, almost one-half of Michigan is water.
Michigan's energy resources include natural gas and crude oil, as well as renewable resources in the form of biomass,
hydroelectric power, and wind. With over one-half of the state's land area forested, Michigan has abundant woody
biomass. The state has many rivers, but hydroelectric power generation is limited by the generally level terrain and
relatively small size of many of the rivers. Winds, occasionally of gale force, sweep in across the lakes and provide the
state with another potential resource.
Michigan has a temperate climate with four seasons. Generally, the Great Lakes moderate temperatures with the most
extreme temperature highs and lows occurring in the interior of the Lower Peninsula, away from the lakes. Snowfall, on
the other hand, is highest along the lakes because of the lake-effect snows created by cold air blowing over the warmer
lake waters. The lakes also cause Michigan to have more cloudy days than most states. Despite its cold winters and its
high total energy consumption, Michigan's large population places it in the bottom one-third of all states in energy use per
capita. The residential sector is the leading energy consumer, followed closely by transportation, and then the industrial
sector. The state's most valuable manufactured products are transportation equipment, including automobiles, trucks,
buses, airplanes, and boats. Energy-intensive industrial activities in the state include not only automotive manufacturing,
but also the forest products, machinery manufacturing, fabricated metal products, and petroleum refining industries.
Petroleum
Although Michigan has one oil field that has produced more than 100 million barrels of oil since its discovery in 1957,
current crude oil production and reserves in Michigan are modest and account for far less than 1% of both the nation's
total production and reserves. The state's one refinery, located in Detroit, was recently upgraded to allow the processing
of heavy Canadian crude oils and to increase refinery capacity to 120,000 barrels per calendar day.
Several petroleum pipelines service the state. Two major crude oil pipelines from western Canada, both part of the
Lakehead Pipeline System, enter Michigan from the northwest and southwest, supplying both Michigan and eastern
Canada. Other pipelines come up from the Gulf South. Petroleum product pipeline systems that supply Michigan markets
enter the Lower Peninsula from the Chicago area to the southwest and also from the southeast. There are no petroleum
product pipelines in the Upper Peninsula. Domestic petroleum products enter the Upper Peninsula at the port of
Escanaba. The Lower Peninsula port cities of Detroit and Port Huron receive petroleum products from Canada. Port
Huron also receives crude oil imports from Canada.
Petroleum is consumed in the state primarily as motor gasoline. Although most of the state can sell conventional motor
gasoline year-round, the vapor pressure of motor gasoline sold in all eight Detroit area counties during the summer
ozone season is regulated to reduce emissions that contribute to ground-level ozone. Consumption of liquefied
petroleum gas (LPG) is high in Michigan. The state has the largest residential LPG consumption in the nation and ranks
among the top 10 states in the use of LPG overall.
Natural gasMichigan has significant natural gas reserves. The Antrim Field in the northern portion of the Lower Peninsula is one of
the top 100 natural gas fields in the nation as ranked by proved reserves. However, natural gas production in Michigan
peaked in the late 1990s and is declining. Current natural gas exploration is focusing on the Collingwood Shale, which
underlies the Utica Shale in northern Michigan. The state's natural gas marketed production meets less than one-fifth of
the state's needs. Several pipelines cross Michigan on the way to markets in the northeastern United States and eastern
Canada and satisfy the remainder of the state's natural gas demand. Natural gas enters the state from Indiana, Ohio,
and Wisconsin. Michigan also receives natural gas imports from Canada at Marysville, St. Clair, and Detroit. The bulk of
the natural gas flowing out of Michigan flows into Canada at St. Clair, Detroit, Marysville, and Sault Ste. Marie.
Driven largely by the residential sector, Michigan's natural gas consumption is
high. The state routinely ranks among the top 5 in residential use of natural gas,
Page 10 of 14Michigan Profile
10/01/2014http://www.eia.gov/state/print.cfm?sid=MI
and in the top 10 in total consumption. Nearly four-fifths of Michigan households
use natural gas as their primary source for home heating. With more than one-
tenth of U.S. capacity, Michigan has the most underground natural gas storage
capacity in the nation, and, after Pennsylvania, the second largest number of
natural gas storage fields. During the high-demand winter months natural gas is
withdrawn from storage and supplied within Michigan and to neighboring states.
CoalAlthough Michigan produced substantial amounts of coal between 1860 and 1949,
there are not currently any active coal mines within the state. However, Michigan's
ports handle almost one-third of all Great Lakes coal shipments. The state relies
heavily on coal for electricity generation, and some coal is used by coke plants, the industrial sector, and others. The
majority of the coal consumed in Michigan comes by rail from the west, primarily from Wyoming and, to a much lesser
extent, from Montana and Colorado. A significant amount also comes from nearby states, including some from the
Appalachian coal fields of West Virginia and Kentucky.
ElectricityBecause of Michigan's unique geography, the state is serviced by two major
interstate electricity grids. One covers the Lower Peninsula and a small portion of
the Upper Peninsula, and the other covers much of the Upper Peninsula. About
one-half of the electricity generated in Michigan is produced by coal-fired power
plants, the majority of which are in the southern half of the Lower Peninsula.
Michigan's three nuclear power plants, with a total of four reactors, are in the
extreme southern portion of the state and typically supply more than one-fourth of
the state's generation. Natural gas fuels much of the remainder, with renewables,
including hydroelectric power, routinely contributing less than 5% of the electricity
generation delivered to the grid.
Although the amount of net electricity generation in Michigan is in the top one-third of states, residential electricity sales
per person in Michigan are below the national average, in part because of low demand for air conditioning during the mild
summers and a reliance on natural gas for home heating. Less than one-tenth of Michigan households rely on electricity
as their primary source of energy for home heating.
Renewable energyMichigan's renewable electricity generation comes predominantly from biomass,
with a lesser amount from hydroelectric power and a small but rapidly growing
contribution from wind energy. Substantial renewable electricity generation comes
from wood and wood waste. Other sources include more than 100 hydroelectric
power plants and several facilities that generate electricity using methane
recovered from landfills and anaerobic digesters on some of Michigan's many
dairy farms. Although the state's wind resource is ranked as only 18th in the
nation, in recent years, Michigan has been among the top states in percentage
increase in wind capacity. More than 600 megawatts of additional wind generation
capacity was installed in 2012 helping the state's net generation from wind more
than double. Michigan has about 20 electric utility-scale wind farms. Overall, however, renewable power generation
contributes only minimally to the state's electricity grid.
Michigan has
the most
underground
natural gas
storage capacity
in the nation.
About one-half
of the electricity
generated in
Michigan is
produced from
coal.
Michigan's wind
capacity is
among the
fastest growing
in the nation.
Page 11 of 14Michigan Profile
10/01/2014http://www.eia.gov/state/print.cfm?sid=MI
Michigan has several ethanol and biodiesel production plants in operation. A major corn producer, Michigan uses corn as
a feedstock for its ethanol plants. Those plants have the ability to produce more than 260 million gallons of ethanol each
year from that feedstock. Michigan also has a small cellulosic ethanol plant that uses wood sugars as a feedstock.
Michigan's Clean, Renewable, and Efficient Energy Act, enacted in 2008, requires that all electricity providers obtain at
least 10% of their electricity supply from renewable energy resources by 2015. The act defines renewable energy
resources as biomass; solar and solar thermal energy; wind energy; kinetic energy of moving water; geothermal energy;
municipal solid waste; and landfill gas produced by municipal solid waste. Electricity generation from hydroelectric
facilities at newly constructed dams does not count toward the 10% requirement, but generation from modified facilities at
existing dams does. The standard also allows electric utilities to use energy efficiency and advanced cleaner energy
technologies to fulfill part of the requirement. The state's two largest investor-owned electric utilities have additional
requirements called renewable energy capacity standards. Those capacity standards are based on the number of
customers each of the two utilities served at the beginning of 2008. The energy produced from new facilities that meet
the capacity standards may be counted towards the 10% required from renewable energy resources for each of those
electric utilities.
Michigan offers tax incentives in Renewable Energy Renaissance Zones. Those zones were created to promote the
development of a renewable energy manufacturing industry in the state.
Other Resources
Energy-Related Regions and Organizations
• Regional Transmission Organization (RTO): Midwest Independent Transmission System Operator (MISO), PJM
Interconnection (PJM)
• Petroleum Administration for Defense District (PADD): 2
• North American Electric Reliability Corporation (NERC) Region: Midwest Reliability Organization (MRO, Reliability
First Corporation (RFC)
Other Websites
• Michigan Energy Office
• Michigan Public Service Commission
• Michigan Department of Human Services, Energy and Weatherization
• Michigan Public Service Commission, Renewable Energy
• Alternative Fuels and Advanced Vehicle Data Center - Federal and State Incentives and Laws
• Michigan Department of Environmental Quality, Office of Oil, Gas, and Minerals
• Benefits.Gov Energy Assistance (105)
• DSIRE - Database of State Incentives for Renewables and Efficiency
• National Association of Regulatory Utility Commissioners (NARUC)
• National Association of State Energy Officials (NASEO)
• National Conference of State Legislatures (NCSL)-Issues and Research - News Highlights: Issues and Research
- Energy
• National Renewable Energy Laboratory (NREL)-Dynamic Maps, Geographic Information System (GIS) Data and
Analysis Tools - Maps
• U.S. Geological Survey (USGS) Maps, Imagery, and Publications - Maps
• Interstate Oil and Gas Compact Commission
• United States Department of Health and Human Services - Administration for Children and Families - Low Income
Home Energy Assistance Program
Page 12 of 14Michigan Profile
10/01/2014http://www.eia.gov/state/print.cfm?sid=MI

Email suggestions for additional Michigan website resources to: [email protected].
Page 13 of 14Michigan Profile
10/01/2014http://www.eia.gov/state/print.cfm?sid=MI

Page 14 of 14Michigan Profile
10/01/2014http://www.eia.gov/state/print.cfm?sid=MI