Embed Size (px)
Citation preview
U.S. Department of Commerce Economics and Statistics Administration U.S. CENSUS BUREAU
The Two or More Races Population: 20102010 Census Briefs
By Nicholas A. Jones and Jungmiwha Bullock
C2010BR-13
Issued September 2012
INTRODUCTION
Data from the 2010 Census and Census 2000 present information on the popu-lation reporting more than one race and enable comparisons of this population from two major data points for the first time in U.S. decennial census history.1 Overall, the population reporting more than one race grew from about 6.8 mil-lion people to 9.0 million people. One of the most effective ways to compare the 2000 and 2010 data is to examine changes in specific race combination groups, such as people who reported White as well as Black or African American—a population that grew by over one million people, increasing by 134 percent—and people who reported White as well as Asian—a population that grew by about three-quarters of a million people, increasing by 87 percent. These two groups exhibited significant growth in size and proportion since 2000, and they exemplify the impor-tant changes that have occurred among people who reported more than one race over the last decade.
This report looks at our nation’s chang-ing racial and ethnic diversity. It is part of a series that analyzes population and housing data collected from the 2010 Census and provides a snap shot of the population reporting multiple races in the United States.2 Racial and ethnic popula-tion group distributions and growth at the national level and at lower levels of geography are presented.
1 Census 2000 was the first decennial census to provide an option that allowed individuals to self-identify with more than one race.
2 This report discusses data for the 50 states and the District of Columbia, but not Puerto Rico.
This report also provides an overview of race and ethnicity concepts and defi nitions used in the 2010 Census. The data for this report are based on the 2010 Census Redistricting Data (Public Law 94-171) Summary File, which was the first 2010 Census data product released with data on race and Hispanic origin and was pro vided to each state for use in drawing boundaries for legislative districts.3
UNDERSTANDING RACE DATA FROM THE 2010 CENSUS
The 2010 Census used federal standards to collect and present data on race.
For the 2010 Census, the question on race was asked of individuals living in the United States (see Figure 1). An individ ual’s response
3 The 2010 Census Redistricting Data (Public Law 94-171) Summary File provides data on Hispanic origin and race, including information on the popula tion reporting more than one race as well as detailed race combinations.
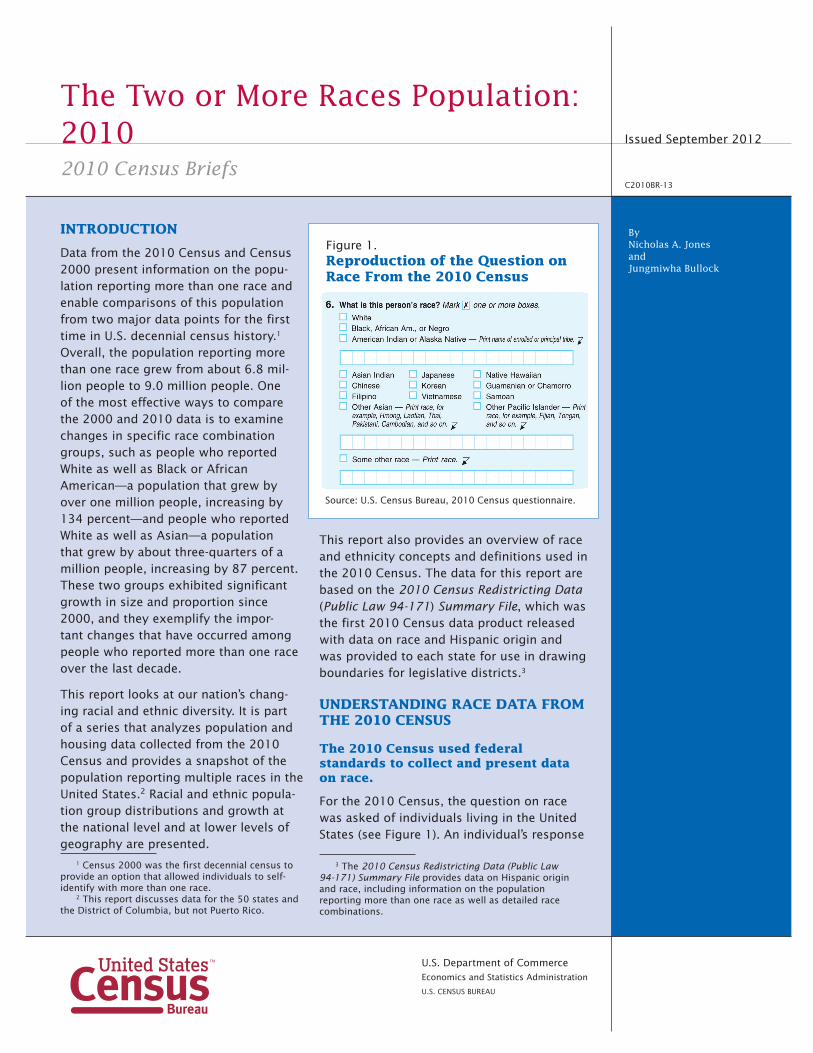
Figure 1.Reproduction of the Question on Race From the 2010 Census
Source: U.S. Census Bureau, 2010 Census questionnaire.
2 U.S. Census Bureau
to the race question was based upon self-identification. The U.S. Census Bureau collects information on race following the guidance of the U.S. Office of Management and Budget’s (OMB) 1997 Revisions to the Standards for the Classification of Federal Data on Race and Ethnicity.4 These federal stan dards mandate that race and Hispanic origin (ethnicity) are separate and distinct concepts and that, when collecting these data via self- identification, two different questions must be used.5
The OMB definitions of the race cat-egories used in the 2010 Census, plus the Census Bureau’s definition of Some Other Race, are presented in the text box “Definition of Race Categories Used in the 2010 Census.” Starting in 1997, OMB required federal agencies to use a minimum of five race categories: White, Black or African American, American Indian or Alaska Native, Asian, and Native Hawaiian or Other Pacific Islander. For respon-dents unable to identify with any of these five race categories, OMB approved the Census Bureau’s inclusion of a sixth category—Some Other Race—on the Census 2000 and 2010 Census questionnaires. The 1997 OMB standards also allowed respon dents to identify with more than one race.
4 The 1997 Revisions to the Standards for the Classification of Federal Data on Race and Ethnicity, issued by OMB, is available at <www.whitehouse.gov/omb /fedreg/1997standards.html>.
5 The OMB requires federal agencies to use a minimum of two ethnicities: Hispanic or Latino and Not Hispanic or Latino. Hispanic origin can be viewed as the heritage, nationality group, lineage, or country of birth of the person or the person’s parents or ancestors before their arrival in the United States. People who identify their origin as Hispanic, Latino, or Spanish may be of any race. “Hispanic or Latino” refers to a person of Cuban, Mexican, Puerto Rican, South or Central American, or other Spanish culture or origin regardless of race.
In Census 2000, for the first time, individuals were presented with the option to self-identify with more than one race, and this continued with the 2010 Census.
Data on race have been collected since the first U.S. decennial census in 1790. An individual’s response to the race question is based upon
self-identification; the Census Bureau does not tell individuals which boxes to mark or what heritage to write in. Beginning with Census 2000, individuals were presented with the option to self-identify with more than one race. People who identify with more than one race may choose to provide multiple races in response
Definition of Race Categories Used in the 2010 Census
“White” refers to a person having origins in any of the original peo-ples of Europe, the Middle East, or North Africa. It includes people who indi cated their race(s) as “White” or reported entries such as Irish, German, Italian, Lebanese, Arab, Moroccan, or Caucasian.
“Black or African American” refers to a person having origins in any of the Black racial groups of Africa. It includes people who indicated their race(s) as “Black, African Am., or Negro” or reported entries such as African American, Kenyan, Nigerian, or Haitian.
“American Indian or Alaska Native” refers to a person having origins in any of the original peoples of North and South America (includ-ing Central America) and who maintains tribal affiliation or com-munity attachment. This category includes people who indicated their race(s) as “American Indian or Alaska Native” or reported their enrolled or prin cipal tribe, such as Navajo, Blackfeet, Inupiat, Yup’ik, or Central American Indian groups or South American Indian groups.
“Asian” refers to a person having origins in any of the original peoples of the Far East, Southeast Asia, or the Indian subconti-nent, including, for example, Cambodia, China, India, Japan, Korea, Malaysia, Pakistan, the Philippine Islands, Thailand, and Vietnam. It includes people who indicated their race(s) as “Asian” or reported entries such as “Asian Indian,” “Chinese,” “Filipino,” “Korean,” “Japanese,” “Vietnamese,” and “Other Asian” or provided other detailed Asian responses.
“Native Hawaiian or Other Pacific Islander” refers to a person having origins in any of the original peoples of Hawaii, Guam, Samoa, or other Pacific Islands. It includes people who indicated their race(s) as “Pacific Islander” or reported entries such as “Native Hawaiian,” “Guamanian or Chamorro,” “Samoan,” and “Other Pacific Islander” or provided other detailed Pacific Islander responses.
“Some Other Race” includes all other responses not included in the White, Black or African American, American Indian or Alaska Native, Asian, and Native Hawaiian or Other Pacific Islander race categories described above. Respondents reporting entries such as multi-racial, mixed, interracial, or a Hispanic or Latino group (for example, Mexican, Puerto Rican, Cuban, or Spanish) in response to the race question are included in this category.
U.S. Census Bureau 3
to the race question. For example, a respondent who identifies as both Asian and White may respond to the question on race by checking the appropriate boxes that describe his or her racial identities and/or writing in these identities on the spaces provided.6
The 2010 Census question on race included 15 separate response categories and three areas where respondents could write in detailed information about their race (see Figure 1).7
The response catego ries and write-in answers can be com-bined to create the five mini mum OMB race categories plus Some Other Race. In addition to White, Black, American Indian and Alaska Native, and Some Other Race, 7 of the 15 response categories are Asian groups, and 4 are Native Hawaiian and Other Pacific Islander groups.8, 9
6 For information about comparability of 2010 Census data on race and Hispanic origin to data collected in previous censuses, see the 2010 Census Redistricting Data (Public Law 94-171) Summary File—Technical Documentation at <www.census.gov/prod /cen2010/doc/pl94-171.pdf>. Additional reports on selected race popula tion groups and the Hispanic population are part of the 2010 Census Briefs series. For a detailed list-ing of 2010 Census Briefs and other products, visit <http://2010.census.gov/2010census /data>.
7 There were two changes to the question on race for the 2010 Census. First, the word-ing of the race question was changed from “What is this person’s race? Mark one or more races to indicate what this person con-siders himself/herself to be” in 2000 to “What is this person’s race? Mark one or more boxes” for 2010. Second, in 2010, examples were added to the “Other Asian” response category (Hmong, Laotian, Thai, Pakistani, Cambodian, and so on) and the “Other Pacific Islander” response category (Fijian, Tongan, and so on). In 2000, no examples were given in the race question.
8 The terms “Black or African American” and “Black” are used interchangeably in this report.
9 The race categories included in the census questionnaire generally reflect a social definition of race recognized in this country and are not an attempt to define race biologi-cally, anthropologically, or genetically. In addi tion, it is recognized that the categories of the race question include race and national origin or sociocultural groups.
RACE CONCEPTS
The data on race collected in the 2010 Census can be divided into two broad categories: the race alone population and the Two or More Races population.
People who responded to the ques-tion on race by indicating only one race are referred to as the race alone population, or the group who reported only one race. For exam-ple, people who marked only the “White” cat egory on the census questionnaire constitute the White alone population. This population can be viewed as the minimum number of people reporting White.
The Two or More Races population refers to people who reported more than one of the six race categories, and this term is used in census statistics as well as the tables and figures in this report. The text of this report also refers to the Two or More Races population as the group who reported more than one race, or the multiple-race population. For example, people who reported they were both White and Black or reported they were both Black and Asian would be included in the multiple-race population. There are 57 possible mul tiple race combina-tions involving the five OMB race categories and the category Some Other Race.10 This report presents data for each of the 57 race com-binations. The analysis focuses on the four largest race combinations that had over one million in popu-lation size, nine race combination groups with over 100,000 in popu-lation size, as well as smaller race
10 The 2010 Census provides information on the population reporting more than one race, as well as detailed race combinations (e.g., White and Black; Black and Asian). In the text of this report, the multiple-race groups are denoted with the conjunction and in bold and italicized print to indicate the separate race groups that represent the particular combination.
combination groups within the Two or More Races population.11
ANALYZING DATA FOR THE MULTIPLE-RACE POPULATION
Data from the 2010 Census and Census 2000 provide information on the population reporting more than one race. The most effective way to compare the multiple-race data between the two censuses is to examine changes in specific OMB race combinations, such as the White and Black population or the Black and Asian population. These comparisons provide detailed insights to the changes in different race combination groups from 2000 to 2010, and they yield a clearer understanding of the changes that have occurred in the Two or More Races population since 2000.
The observed changes in race data between Census 2000 and the 2010 Census could be attributed to a number of factors. Demographic change since 2000, which includes births and deaths in a geographic area and migration in and out of a geographic area, will have an impact on the resulting 2010 Census counts. Additionally, some changes in the wording and format of the questions on Hispanic origin
11 The maximum number of people reporting a particular race is reflected in the race-alone-or-in-combination concept. This represents the number of times responses were part of one of the six major race categories, either alone or in combination with the other five race categories. There are six race-alone-or-in-combination categories, which are not mutually exclusive: White alone or in combination, Black alone or in combination, American Indian and Alaska Native alone or in combination, Asian alone or in combination, Native Hawaiian and Other Pacific Islander alone or in combination, and Some Other Race alone or in combination. For example, a respondent who indicated Asian and White was counted in the Asian alone-or-in- combination category as well as in the White alone-or-in-combination category. Therefore, the sum of all race-alone-or-in-combination categories equals the number of races reported, which exceeds the total population.
4 U.S. Census Bureau
and race since Census 2000 may have influenced reporting patterns in the 2010 Census.
Also, in Census 2000 an error in data processing resulted in an overstatement of the Two or More Races population by about 1 mil-lion people nationally (about 15 percent), which almost entirely affected race combinations involv-ing Some Other Race. The Census Bureau issued a Data Note to advise data users about this process-ing error.12 Therefore, data users should assess observed changes in the total Two or More Races popu-lation between Census 2000 and
12 The Data Note is available online in Chapter 9, “User Updates” (page 467) of the Census 2000 Summary File 1—Technical Documentation <www.census.gov/prod /cen2000/doc/sf1.pdf>. The note states: “In Census 2000, during the conversion process of making the race write-in entries on the enumerator-filled questionnaire consistent with those in the mailout/mailback ques-tionnaire, a step was inadvertently omitted. This resulted in an overstatement by about 1 million people reporting more than one race (or about 15 percent of the Two or More Races population). This overstatement almost entirely affects race combinations involving Some Other Race with the five race groups identified by the OMB (White, Black or African American, American Indian or Alaska Native, Asian, and Native Hawaiian or Other Pacific Islander). The overstatement does not significantly affect the totals for the OMB race groups reporting a single race (“race alone”) or the reporting of the single race and at least one other race (“race alone or in combination”).”
the 2010 Census with caution and should instead examine changes in specific race combinations involv-ing OMB race groups, such as White and Black, White and Asian, Black and Asian, etc., to gain detailed insights into the Two or More Races population.13
THE TWO OR MORE RACES POPULATION: A SNAPSHOT
Over the last 10 years, consider-able research has been conducted on the population reporting mul-tiple races, and the fact that people may identify themselves as being of more than one race has become a more common part of discus sions and understanding of race and ethnicity. Results from the 2010 Census provide new informa tion on the diversity and changes in the Two or More Races population in the United States and enable comparisons of this population from two major decennial data points. The analysis in this report focuses on specific multiple-race
13 The Census Bureau did not go back to reprocess the figures after Census 2000, thus there is not a definitive assessment on impact. However, since the Census 2000 base was overestimated by about 15 percent, the observed percent change from 2000 to 2010 for people reporting more than one race could actually be higher.
combination groups, such as the White and Black population and the Black and Asian population, which exemplify some of the important changes that have occurred among people who reported more than one race over the last decade.
About 92 percent of people who reported multiple races reported exactly two races.
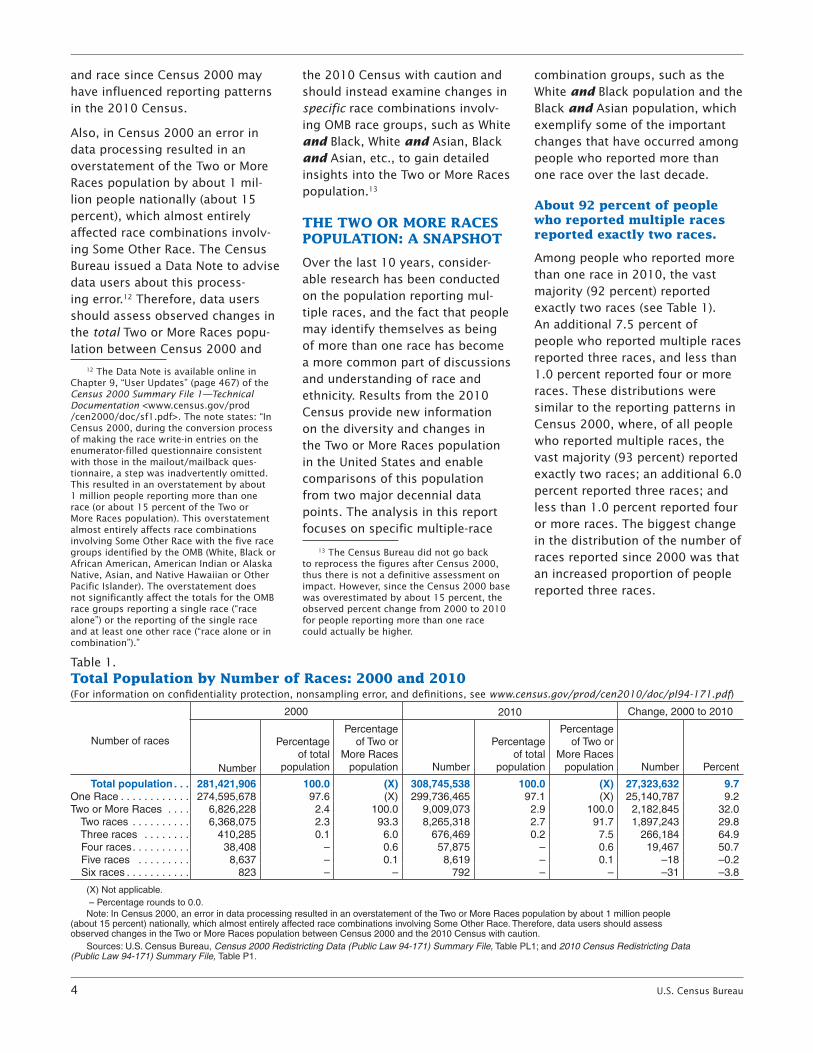
Among people who reported more than one race in 2010, the vast majority (92 percent) reported exactly two races (see Table 1). An additional 7.5 percent of people who reported multiple races reported three races, and less than 1.0 percent reported four or more races. These distributions were similar to the reporting patterns in Census 2000, where, of all people who reported multiple races, the vast majority (93 percent) reported exactly two races; an additional 6.0 percent reported three races; and less than 1.0 percent reported four or more races. The biggest change in the distribution of the number of races reported since 2000 was that an increased proportion of people reported three races.
Table 1.Total Population by Number of Races: 2000 and 2010(For information on confidentiality protection, nonsampling error, and definitions, see www.census.gov/prod/cen2010/doc/pl94-171.pdf)
Number of races
2000 2010 Change, 2000 to 2010
Number
Percentage of total
population
Percentageof Two or
More Races population Number
Percentage of total
population
Percentage of Two or
More Races population Number Percent
Total population . . . 281,421,906 100 .0 (X) 308,745,538 100 .0 (X) 27,323,632 9 .7One Race . . . . . . . . . . . . 274,595,678 97 .6 (X) 299,736,465 97 .1 (X) 25,140,787 9 .2Two or More Races . . . . 6,826,228 2 .4 100 .0 9,009,073 2 .9 100 .0 2,182,845 32 .0 Two races . . . . . . . . . . 6,368,075 2 .3 93 .3 8,265,318 2 .7 91 .7 1,897,243 29 .8 Three races . . . . . . . . 410,285 0 .1 6 .0 676,469 0 .2 7 .5 266,184 64 .9 Four races . . . . . . . . . . 38,408 – 0 .6 57,875 – 0 .6 19,467 50 .7 Five races . . . . . . . . . 8,637 – 0 .1 8,619 – 0 .1 –18 –0 .2 Six races . . . . . . . . . . . 823 – – 792 – – –31 –3 .8
(X) Not applicable . – Percentage rounds to 0 .0 .Note: In Census 2000, an error in data processing resulted in an overstatement of the Two or More Races population by about 1 million people
(about 15 percent) nationally, which almost entirely affected race combinations involving Some Other Race . Therefore, data users should assess observed changes in the Two or More Races population between Census 2000 and the 2010 Census with caution .
Sources: U .S . Census Bureau, Census 2000 Redistricting Data (Public Law 94-171) Summary File, Table PL1; and 2010 Census Redistricting Data (Public Law 94-171) Summary File, Table P1 .
U.S. Census Bureau 5
The Two or More Races population increased by about one-third in size since 2000.
Table 1 shows the number and percentage of respondents to Census 2000 and the 2010 Census who reported one or more races. In 2010, 9.0 million people, or 2.9 percent of the total population, reported multiple races. This was up from 6.8 million people, or 2.4 percent, who reported multiple races in 2000. Overall, the multiple-race population grew by about one-third in size over 10 years. However, these com-parisons of the total Two or More Races population should be made with caution, considering that the 2000 base was overstated by about 15 percent nationally, and thus the percentage change for people reporting more than one race could actually be higher.
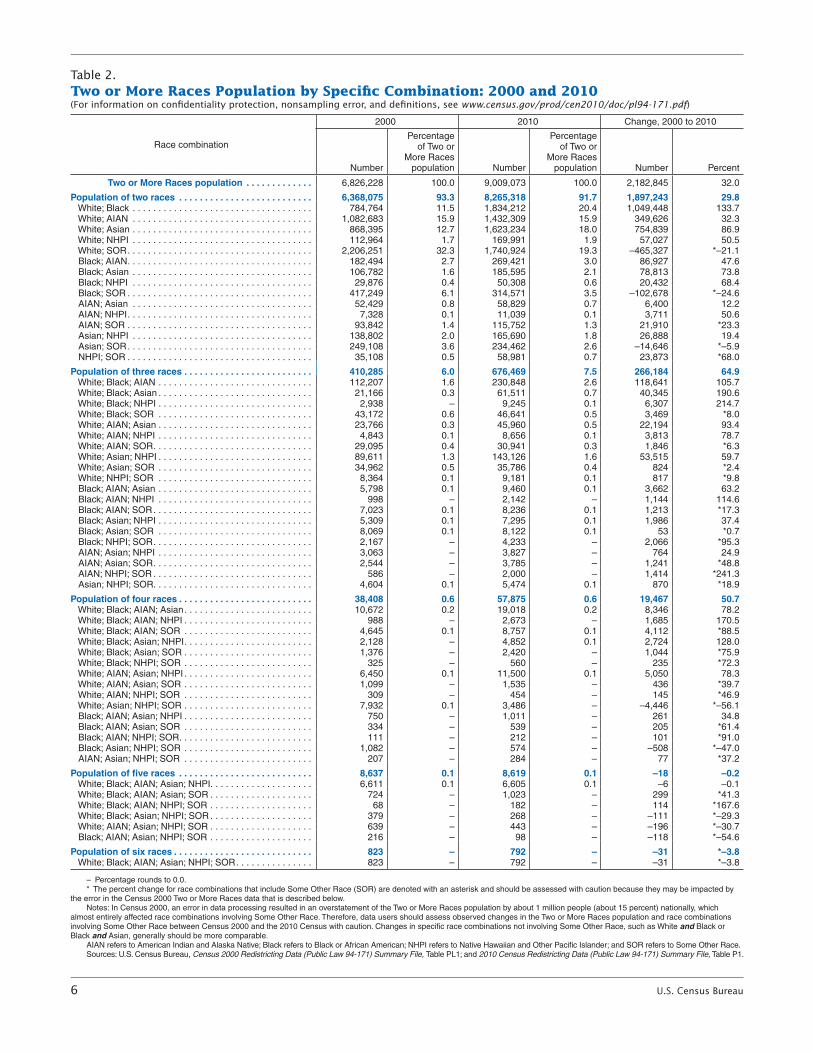
Four multiple-race groups were, by far, the largest race combinations in 2010.
In 2010, four groups were the largest multiple-race combina-tions in the United States, each exceeding 1 million people in size (see Table 2). People who reported both White and Black numbered 1.8 million. People who reported both White and Some Other Race numbered 1.7 million. People who reported both White and Asian numbered 1.6 million. In addition, people who reported both White and American Indian and Alaska Native numbered 1.4 million.
Thirteen multiple-race groups had at least 100,000 people in 2010.
In addition to the four multiple-race groups with more than 1 million people, nine additional multiple-race combination groups exceeded 100,000 people in 2010. The larg-est of these was Black and Some Other Race (315,000). Three other
groups exceeded 200,000—Black and American Indian and Alaska Native, Asian and Some Other Race, as well as White and Black and American Indian and Alaska Native. The remaining groups were all over 100,000—Black and Asian, White and Native Hawaiian and Other Pacific Islander, Asian and Native Hawaiian and Other Pacific Islander, White and Asian and Native Hawaiian and Other Pacific Islander, and American Indian and Alaska Native and Some Other Race.
The four largest multiple-race groups accounted for nearly three-fourths of the Two or More Races population…
The four largest multiple-race com-bination groups each accounted for more than 15 percent of the Two or More Races population in 2010. People who reported both White and Black accounted for 20 percent of the multiple-race population. White and Some Other Race repre-sented another 19 percent, while White and Asian made up 18 per-cent. People who reported both White and American Indian and Alaska Native constituted another 16 percent of the Two or More Races population (see Figure 2). Together, these four combination groups represented nearly three-fourths of the Two or More Races population in the 2010 Census.
… and nine additional multiple-race groups each represented about 1 percent to 4 percent of the population reporting more than one race.
After the four largest multiple-race combinations, an additional nine combinations represented at least 1.0 percent of the Two or More Races population (see Figure 2). The largest of these combinations represented about 3 to 4 percent each (the Black and Some Other Race population and the Black and American Indian and Alaska Native
population). The Asian and Some Other Race population, the White and Black and American Indian and Alaska Native population, and the Black and Asian population rep-resented about 2 to 3 percent each. Additionally, the White and Native Hawaiian and Other Pacific Islander population, the Asian and Native Hawaiian and Other Pacific Islander population, the White and Asian and Native Hawaiian and Other Pacific Islander population, and the American Indian and Alaska Native and Some Other Race population each accounted for about 1 to 2 percent of the total Two or More Races population.
There were considerable increases in the size of a number of multiple-race groups.
Between 2000 and 2010, the White and Black population increased the most in size, growing by over 1 million people, with a substantial 134 percent change (see Table 2). The White and Asian population also increased significantly, grow-ing by about three-quarters of a million people, with an 87 percent change in its size. The White and American Indian and Alaska Native population increased by about 350,000 people, with a 32 percent change in size. On the other hand, the White and Some Other Race population decreased by about half a million people and declined 21 percent in size. Again, as dis-cussed earlier, this decrease was likely due to the Census 2000 error in data processing that resulted in an overstatement of the race combinations involving Some Other Race, of which White and Some Other Race was the largest group in 2000.
6 U.S. Census Bureau
Table 2.Two or More Races Population by Specific Combination: 2000 and 2010(For information on confidentiality protection, nonsampling error, and definitions, see www.census.gov/prod/cen2010/doc/pl94-171.pdf)
Race combination
2000 2010 Change, 2000 to 2010
Number
Percentage of Two or
More Races population Number
Percentage of Two or
More Races population Number Percent
Two or More Races population . . . . . . . . . . . . . 6,826,228 100 .0 9,009,073 100 .0 2,182,845 32 .0
Population of two races . . . . . . . . . . . . . . . . . . . . . . . . . . 6,368,075 93 .3 8,265,318 91 .7 1,897,243 29 .8 White; Black . . . . . . . . . . . . . . . . . . . . . . . . . . . . . . . . . . . 784,764 11 .5 1,834,212 20 .4 1,049,448 133 .7 White; AIAN . . . . . . . . . . . . . . . . . . . . . . . . . . . . . . . . . . . 1,082,683 15 .9 1,432,309 15 .9 349,626 32 .3 White; Asian . . . . . . . . . . . . . . . . . . . . . . . . . . . . . . . . . . . 868,395 12 .7 1,623,234 18 .0 754,839 86 .9 White; NHPI . . . . . . . . . . . . . . . . . . . . . . . . . . . . . . . . . . . 112,964 1 .7 169,991 1 .9 57,027 50 .5 White; SOR . . . . . . . . . . . . . . . . . . . . . . . . . . . . . . . . . . . . 2,206,251 32 .3 1,740,924 19 .3 –465,327 *–21 .1 Black; AIAN . . . . . . . . . . . . . . . . . . . . . . . . . . . . . . . . . . . . 182,494 2 .7 269,421 3 .0 86,927 47 .6 Black; Asian . . . . . . . . . . . . . . . . . . . . . . . . . . . . . . . . . . . 106,782 1 .6 185,595 2 .1 78,813 73 .8 Black; NHPI . . . . . . . . . . . . . . . . . . . . . . . . . . . . . . . . . . . 29,876 0 .4 50,308 0 .6 20,432 68 .4 Black; SOR . . . . . . . . . . . . . . . . . . . . . . . . . . . . . . . . . . . . 417,249 6 .1 314,571 3 .5 –102,678 *–24 .6 AIAN; Asian . . . . . . . . . . . . . . . . . . . . . . . . . . . . . . . . . . . 52,429 0 .8 58,829 0 .7 6,400 12 .2 AIAN; NHPI . . . . . . . . . . . . . . . . . . . . . . . . . . . . . . . . . . . . 7,328 0 .1 11,039 0 .1 3,711 50 .6 AIAN; SOR . . . . . . . . . . . . . . . . . . . . . . . . . . . . . . . . . . . . 93,842 1 .4 115,752 1 .3 21,910 *23 .3 Asian; NHPI . . . . . . . . . . . . . . . . . . . . . . . . . . . . . . . . . . . 138,802 2 .0 165,690 1 .8 26,888 19 .4 Asian; SOR . . . . . . . . . . . . . . . . . . . . . . . . . . . . . . . . . . . . 249,108 3 .6 234,462 2 .6 –14,646 *–5 .9 NHPI; SOR . . . . . . . . . . . . . . . . . . . . . . . . . . . . . . . . . . . . 35,108 0 .5 58,981 0 .7 23,873 *68 .0
Population of three races . . . . . . . . . . . . . . . . . . . . . . . . . 410,285 6 .0 676,469 7 .5 266,184 64 .9 White; Black; AIAN . . . . . . . . . . . . . . . . . . . . . . . . . . . . . . 112,207 1 .6 230,848 2 .6 118,641 105 .7 White; Black; Asian . . . . . . . . . . . . . . . . . . . . . . . . . . . . . . 21,166 0 .3 61,511 0 .7 40,345 190 .6 White; Black; NHPI . . . . . . . . . . . . . . . . . . . . . . . . . . . . . . 2,938 – 9,245 0 .1 6,307 214 .7 White; Black; SOR . . . . . . . . . . . . . . . . . . . . . . . . . . . . . . 43,172 0 .6 46,641 0 .5 3,469 *8 .0 White; AIAN; Asian . . . . . . . . . . . . . . . . . . . . . . . . . . . . . . 23,766 0 .3 45,960 0 .5 22,194 93 .4 White; AIAN; NHPI . . . . . . . . . . . . . . . . . . . . . . . . . . . . . . 4,843 0 .1 8,656 0 .1 3,813 78 .7 White; AIAN; SOR . . . . . . . . . . . . . . . . . . . . . . . . . . . . . . . 29,095 0 .4 30,941 0 .3 1,846 *6 .3 White; Asian; NHPI . . . . . . . . . . . . . . . . . . . . . . . . . . . . . . 89,611 1 .3 143,126 1 .6 53,515 59 .7 White; Asian; SOR . . . . . . . . . . . . . . . . . . . . . . . . . . . . . . 34,962 0 .5 35,786 0 .4 824 *2 .4 White; NHPI; SOR . . . . . . . . . . . . . . . . . . . . . . . . . . . . . . 8,364 0 .1 9,181 0 .1 817 *9 .8 Black; AIAN; Asian . . . . . . . . . . . . . . . . . . . . . . . . . . . . . . 5,798 0 .1 9,460 0 .1 3,662 63 .2 Black; AIAN; NHPI . . . . . . . . . . . . . . . . . . . . . . . . . . . . . . 998 – 2,142 – 1,144 114 .6 Black; AIAN; SOR . . . . . . . . . . . . . . . . . . . . . . . . . . . . . . . 7,023 0 .1 8,236 0 .1 1,213 *17 .3 Black; Asian; NHPI . . . . . . . . . . . . . . . . . . . . . . . . . . . . . . 5,309 0 .1 7,295 0 .1 1,986 37 .4 Black; Asian; SOR . . . . . . . . . . . . . . . . . . . . . . . . . . . . . . 8,069 0 .1 8,122 0 .1 53 *0 .7 Black; NHPI; SOR . . . . . . . . . . . . . . . . . . . . . . . . . . . . . . . 2,167 – 4,233 – 2,066 *95 .3 AIAN; Asian; NHPI . . . . . . . . . . . . . . . . . . . . . . . . . . . . . . 3,063 – 3,827 – 764 24 .9 AIAN; Asian; SOR . . . . . . . . . . . . . . . . . . . . . . . . . . . . . . . 2,544 – 3,785 – 1,241 *48 .8 AIAN; NHPI; SOR . . . . . . . . . . . . . . . . . . . . . . . . . . . . . . . 586 – 2,000 – 1,414 *241 .3 Asian; NHPI; SOR . . . . . . . . . . . . . . . . . . . . . . . . . . . . . . . 4,604 0 .1 5,474 0 .1 870 *18 .9
Population of four races . . . . . . . . . . . . . . . . . . . . . . . . . . 38,408 0 .6 57,875 0 .6 19,467 50 .7 White; Black; AIAN; Asian . . . . . . . . . . . . . . . . . . . . . . . . . 10,672 0 .2 19,018 0 .2 8,346 78 .2 White; Black; AIAN; NHPI . . . . . . . . . . . . . . . . . . . . . . . . . 988 – 2,673 – 1,685 170 .5 White; Black; AIAN; SOR . . . . . . . . . . . . . . . . . . . . . . . . . 4,645 0 .1 8,757 0 .1 4,112 *88 .5 White; Black; Asian; NHPI . . . . . . . . . . . . . . . . . . . . . . . . . 2,128 – 4,852 0 .1 2,724 128 .0 White; Black; Asian; SOR . . . . . . . . . . . . . . . . . . . . . . . . . 1,376 – 2,420 – 1,044 *75 .9 White; Black; NHPI; SOR . . . . . . . . . . . . . . . . . . . . . . . . . 325 – 560 – 235 *72 .3 White; AIAN; Asian; NHPI . . . . . . . . . . . . . . . . . . . . . . . . . 6,450 0 .1 11,500 0 .1 5,050 78 .3 White; AIAN; Asian; SOR . . . . . . . . . . . . . . . . . . . . . . . . . 1,099 – 1,535 – 436 *39 .7 White; AIAN; NHPI; SOR . . . . . . . . . . . . . . . . . . . . . . . . . 309 – 454 – 145 *46 .9 White; Asian; NHPI; SOR . . . . . . . . . . . . . . . . . . . . . . . . . 7,932 0 .1 3,486 – –4,446 *–56 .1 Black; AIAN; Asian; NHPI . . . . . . . . . . . . . . . . . . . . . . . . . 750 – 1,011 – 261 34 .8 Black; AIAN; Asian; SOR . . . . . . . . . . . . . . . . . . . . . . . . . 334 – 539 – 205 *61 .4 Black; AIAN; NHPI; SOR . . . . . . . . . . . . . . . . . . . . . . . . . . 111 – 212 – 101 *91 .0 Black; Asian; NHPI; SOR . . . . . . . . . . . . . . . . . . . . . . . . . 1,082 – 574 – –508 *–47 .0 AIAN; Asian; NHPI; SOR . . . . . . . . . . . . . . . . . . . . . . . . . 207 – 284 – 77 *37 .2
Population of five races . . . . . . . . . . . . . . . . . . . . . . . . . . 8,637 0 .1 8,619 0 .1 –18 –0 .2 White; Black; AIAN; Asian; NHPI . . . . . . . . . . . . . . . . . . . . 6,611 0 .1 6,605 0 .1 –6 –0 .1 White; Black; AIAN; Asian; SOR . . . . . . . . . . . . . . . . . . . . 724 – 1,023 – 299 *41 .3 White; Black; AIAN; NHPI; SOR . . . . . . . . . . . . . . . . . . . . 68 – 182 – 114 *167 .6 White; Black; Asian; NHPI; SOR . . . . . . . . . . . . . . . . . . . . 379 – 268 – –111 *–29 .3 White; AIAN; Asian; NHPI; SOR . . . . . . . . . . . . . . . . . . . . 639 – 443 – –196 *–30 .7 Black; AIAN; Asian; NHPI; SOR . . . . . . . . . . . . . . . . . . . . 216 – 98 – –118 *–54 .6
Population of six races . . . . . . . . . . . . . . . . . . . . . . . . . . . 823 – 792 – –31 *–3 .8 White; Black; AIAN; Asian; NHPI; SOR . . . . . . . . . . . . . . . 823 – 792 – –31 *–3 .8
– Percentage rounds to 0 .0 .* The percent change for race combinations that include Some Other Race (SOR) are denoted with an asterisk and should be assessed with caution because they may be impacted by
the error in the Census 2000 Two or More Races data that is described below .Notes: In Census 2000, an error in data processing resulted in an overstatement of the Two or More Races population by about 1 million people (about 15 percent) nationally, which
almost entirely affected race combinations involving Some Other Race . Therefore, data users should assess observed changes in the Two or More Races population and race combinations involving Some Other Race between Census 2000 and the 2010 Census with caution . Changes in specific race combinations not involving Some Other Race, such as White and Black or Black and Asian, generally should be more comparable .
AIAN refers to American Indian and Alaska Native; Black refers to Black or African American; NHPI refers to Native Hawaiian and Other Pacific Islander; and SOR refers to Some Other Race .Sources: U .S . Census Bureau, Census 2000 Redistricting Data (Public Law 94-171) Summary File, Table PL1; and 2010 Census Redistricting Data (Public Law 94-171) Summary File, Table P1 .

U.S. Census Bureau 7
Several race combinations changed significantly in both size and growth.
Five other multiple-race combina-tion groups increased by more than 50,000 people since 2000 and exhibited significant percentage changes in their size as well (see Table 2). For example, the White and Black and American Indian and Alaska Native population grew by nearly 120,000 people, doubling in size with a 106 percent change over 10 years. The Black and American Indian and Alaska Native population grew by over 85,000 people, with a 48 percent change.
The Black and Asian population also increased significantly, grow-ing by about 80,000 people, with a 74 percent change in size. The White and Native Hawaiian and Other Pacific Islander population increased by nearly 60,000 people, with about a 50 percent change. In addition, the White and Asian and Native Hawaiian and Other Pacific Islander population increased by over 50,000 people, with a 60 per-cent change in size since 2000.
Examining the changes in the specific race combination groups shows that many multiple-race combinations increased over
the past decade. While the total U.S. population increased by 9.7 percent since 2000, many multiple-race groups increased by 50 percent or more, and several more than doubled in size over 10 years. In fact, since 2000, as individuals had the opportunity to identify with more than one race group in their census response, the multiple-race populations within each race group grew much faster than their corresponding single-race populations, and thereby may have impacted each of the single-race groups’ total popu-lation growth.
Figure 2.Percentage Distribution of the Two or More Races Population by Largest Combinations: 2010
Note: Percentages do not add to 100.0 due to rounding. AIAN refers to American Indian and Alaska Native; Black refers to Black or African American; NHPI refers to Native Hawaiian and Other Pacific Islander; and SOR refers to Some Other Race.
Source: U.S. Census Bureau, 2010 Census Redistricting Data (Public Law 94-171) Summary File, Table P1.
20.4
19.3
18.0
15.9
3.5
3.0
2.6
2.6
2.1
1.9
1.8
1.6
1.3
6.1All other combinations of two or more races
AIAN; SOR
White; Asian; NHPI
Asian; NHPI
White; NHPI
Black; Asian
White; Black; AIAN
Asian; SOR
Black; AIAN
Black; SOR
White; AIAN
White; Asian
White; SOR
White; Black
(For more information on confidentiality protection, nonsampling error, and definitions, see www.census.gov/prod/cen2010/doc/pl94-171.pdf)
24.0
25.7
34.3
35.9
8 U.S. Census Bureau
PATTERNS AMONG MULTIPLE-MINORITY RACE COMBINATION GROUPS WITHIN THE TWO OR MORE RACES POPULATION
For the purposes of this report, the term “multiple-minority race” refers to race combinations among people who identified only with a combination of races that did not include White, regardless of Hispanic origin.
Important patterns existed for multiple-race groups that did not include White as part of their self-identification.
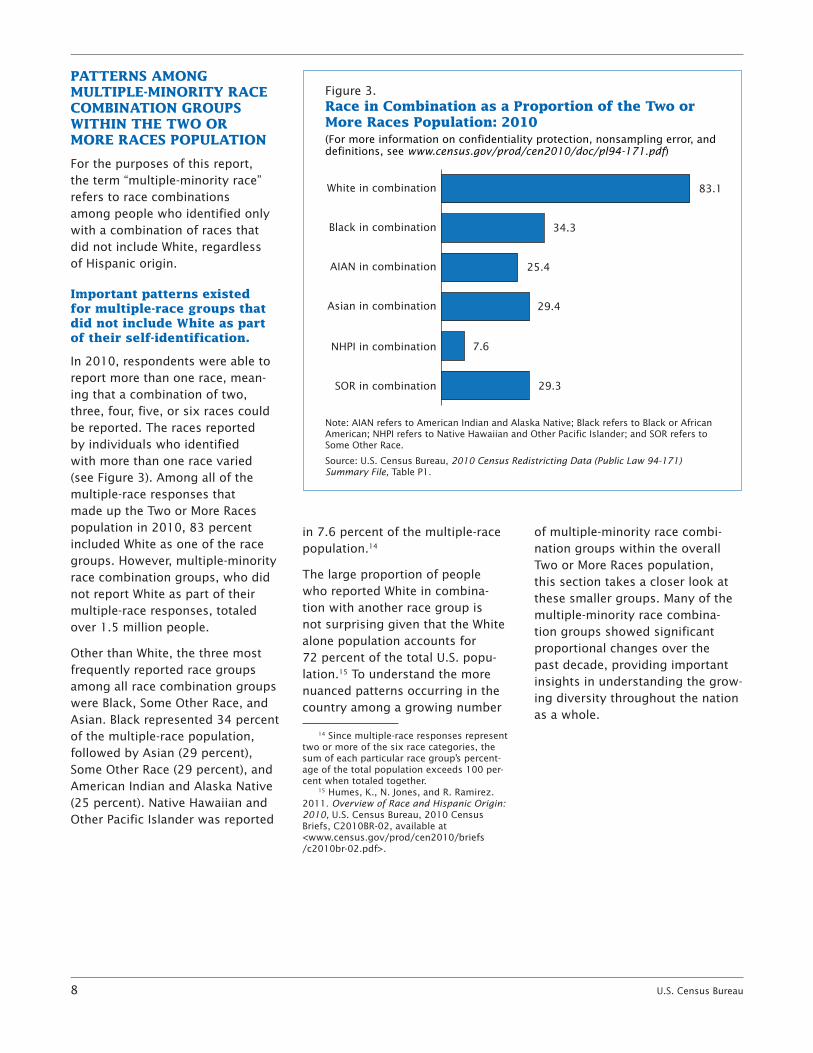
In 2010, respondents were able to report more than one race, mean-ing that a combination of two, three, four, five, or six races could be reported. The races reported by individuals who identified with more than one race varied (see Figure 3). Among all of the multiple-race responses that made up the Two or More Races population in 2010, 83 percent included White as one of the race groups. However, multiple-minority race combination groups, who did not report White as part of their multiple-race responses, totaled over 1.5 million people.
Other than White, the three most frequently reported race groups among all race combination groups were Black, Some Other Race, and Asian. Black represented 34 percent of the multiple-race population, followed by Asian (29 percent), Some Other Race (29 percent), and American Indian and Alaska Native (25 percent). Native Hawaiian and Other Pacific Islander was reported
in 7.6 percent of the multiple-race population.14
The large proportion of people who reported White in combina-tion with another race group is not surprising given that the White alone population accounts for 72 percent of the total U.S. popu-lation.15 To understand the more nuanced patterns occurring in the country among a growing number
14 Since multiple-race responses represent two or more of the six race categories, the sum of each particular race group’s percent-age of the total population exceeds 100 per-cent when totaled together.
15 Humes, K., N. Jones, and R. Ramirez. 2011. Overview of Race and Hispanic Origin: 2010, U.S. Census Bureau, 2010 Census Briefs, C2010BR-02, available at <www.census.gov/prod/cen2010/briefs /c2010br-02.pdf>.
of multiple-minority race combi-nation groups within the overall Two or More Races population, this section takes a closer look at these smaller groups. Many of the multiple-minority race combina-tion groups showed significant proportional changes over the past decade, providing important insights in understanding the grow-ing diversity throughout the nation as a whole.
Figure 3.Race in Combination as a Proportion of the Two or More Races Population: 2010
Note: AIAN refers to American Indian and Alaska Native; Black refers to Black or African American; NHPI refers to Native Hawaiian and Other Pacific Islander; and SOR refers to Some Other Race.
Source: U.S. Census Bureau, 2010 Census Redistricting Data (Public Law 94-171) Summary File, Table P1.
83.1
34.3
25.4
29.4
7.6
29.3SOR in combination
NHPI in combination
Asian in combination
AIAN in combination
Black in combination
White in combination
(For more information on confidentiality protection, nonsampling error, and definitions, see www.census.gov/prod/cen2010/doc/pl94-171.pdf)
35.9
U.S. Census Bureau 9
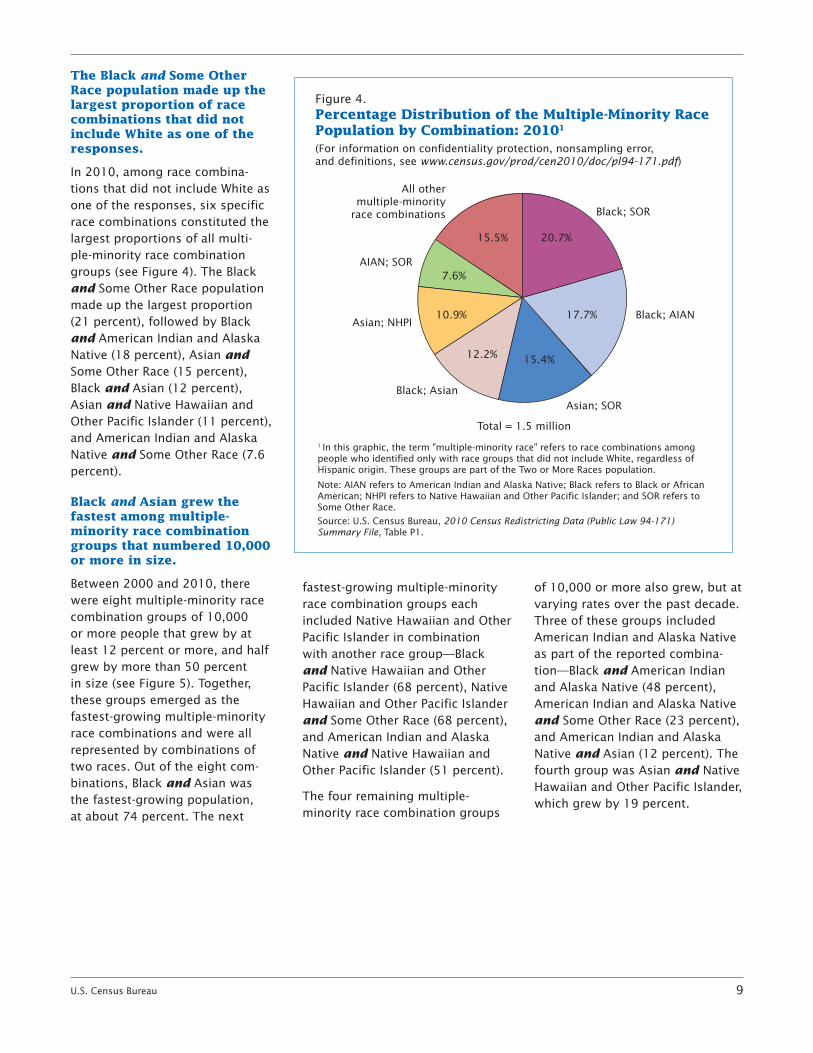
The Black and Some Other Race population made up the largest proportion of race combinations that did not include White as one of the responses.
In 2010, among race combina-tions that did not include White as one of the responses, six specific race combinations constituted the largest proportions of all multi-ple-minority race combination groups (see Figure 4). The Black and Some Other Race population made up the largest proportion (21 percent), followed by Black and American Indian and Alaska Native (18 percent), Asian and Some Other Race (15 percent), Black and Asian (12 percent), Asian and Native Hawaiian and Other Pacific Islander (11 percent), and American Indian and Alaska Native and Some Other Race (7.6 percent).
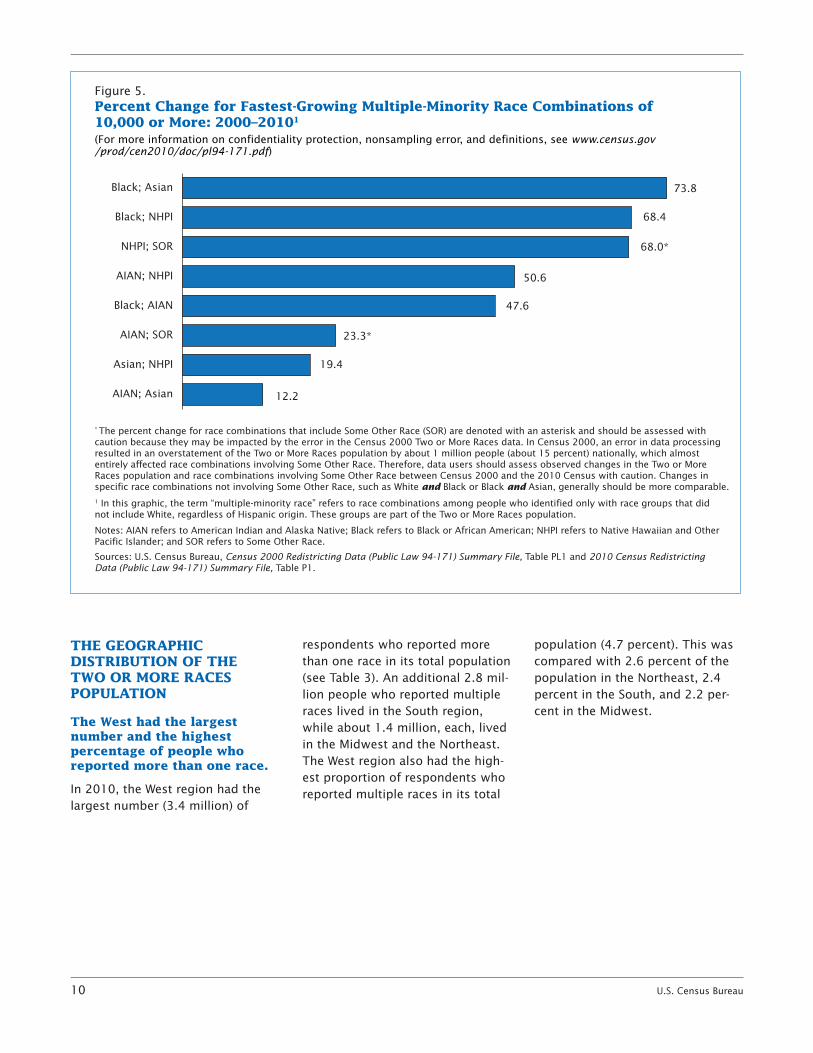
Black and Asian grew the fastest among multiple-minority race combination groups that numbered 10,000 or more in size.
Between 2000 and 2010, there were eight multiple-minority race combination groups of 10,000 or more people that grew by at least 12 percent or more, and half grew by more than 50 percent in size (see Figure 5). Together, these groups emerged as the fastest-growing multiple-minority race combinations and were all represented by combinations of two races. Out of the eight com-binations, Black and Asian was the fastest-growing population, at about 74 percent. The next
fastest-growing multiple-minority race combination groups each included Native Hawaiian and Other Pacific Islander in combination with another race group—Black and Native Hawaiian and Other Pacific Islander (68 percent), Native Hawaiian and Other Pacific Islander and Some Other Race (68 percent), and American Indian and Alaska Native and Native Hawaiian and Other Pacific Islander (51 percent).
The four remaining multiple-minority race combination groups
of 10,000 or more also grew, but at varying rates over the past decade. Three of these groups included American Indian and Alaska Native as part of the reported combina-tion—Black and American Indian and Alaska Native (48 percent), American Indian and Alaska Native and Some Other Race (23 percent), and American Indian and Alaska Native and Asian (12 percent). The fourth group was Asian and Native Hawaiian and Other Pacific Islander, which grew by 19 percent.
Figure 4.Percentage Distribution of the Multiple-Minority Race Population by Combination: 20101
1 In this graphic, the term "multiple-minority race" refers to race combinations among people who identified only with race groups that did not include White, regardless of Hispanic origin. These groups are part of the Two or More Races population.
Note: AIAN refers to American Indian and Alaska Native; Black refers to Black or African American; NHPI refers to Native Hawaiian and Other Pacific Islander; and SOR refers to Some Other Race.
Source: U.S. Census Bureau, 2010 Census Redistricting Data (Public Law 94-171) Summary File, Table P1.
(For information on confidentiality protection, nonsampling error, and definitions, see www.census.gov/prod/cen2010/doc/pl94-171.pdf)
Black; SOR
Black; AIAN
Black; Asian
Asian; NHPI
AIAN; SOR
Asian; SOR
Total = 1.5 million
All other multiple-minority
race combinations
20.7%15.5%
7.6%
15.4%12.2%
10.9% 17.7%
10 U.S. Census Bureau
THE GEOGRAPHIC DISTRIBUTION OF THE TWO OR MORE RACES POPULATION
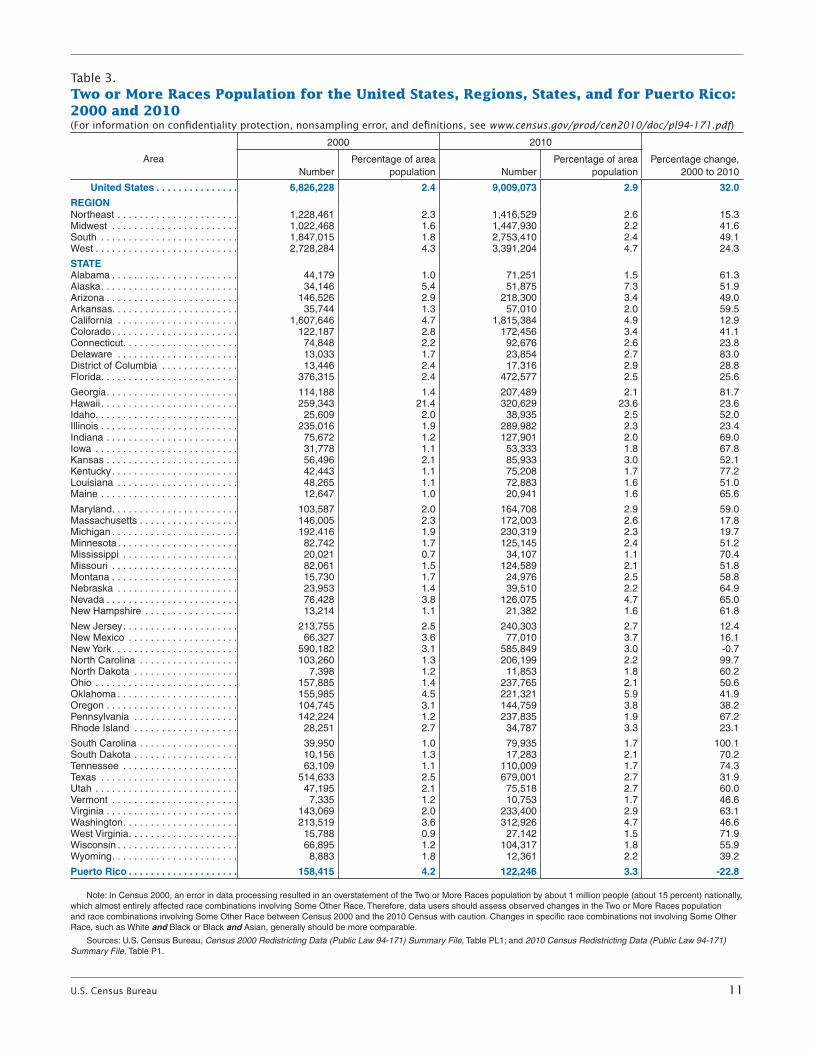
The West had the largest number and the highest percentage of people who reported more than one race.
In 2010, the West region had the largest number (3.4 million) of
respondents who reported more than one race in its total population (see Table 3). An additional 2.8 mil-lion people who reported multiple races lived in the South region, while about 1.4 million, each, lived in the Midwest and the Northeast. The West region also had the high-est proportion of respondents who reported multiple races in its total
population (4.7 percent). This was compared with 2.6 percent of the population in the Northeast, 2.4 percent in the South, and 2.2 per-cent in the Midwest.
Figure 5.Percent Change for Fastest-Growing Multiple-Minority Race Combinations of 10,000 or More: 2000–20101
* The percent change for race combinations that include Some Other Race (SOR) are denoted with an asterisk and should be assessed with caution because they may be impacted by the error in the Census 2000 Two or More Races data. In Census 2000, an error in data processing resulted in an overstatement of the Two or More Races population by about 1 million people (about 15 percent) nationally, which almost entirely affected race combinations involving Some Other Race. Therefore, data users should assess observed changes in the Two or More Races population and race combinations involving Some Other Race between Census 2000 and the 2010 Census with caution. Changes in specific race combinations not involving Some Other Race, such as White and Black or Black and Asian, generally should be more comparable.1 In this graphic, the term “multiple-minority race” refers to race combinations among people who identified only with race groups that did not include White, regardless of Hispanic origin. These groups are part of the Two or More Races population.
Notes: AIAN refers to American Indian and Alaska Native; Black refers to Black or African American; NHPI refers to Native Hawaiian and Other Pacific Islander; and SOR refers to Some Other Race.
Sources: U.S. Census Bureau, Census 2000 Redistricting Data (Public Law 94-171) Summary File, Table PL1 and 2010 Census Redistricting Data (Public Law 94-171) Summary File, Table P1.
73.8
68.4
68.0*
50.6
47.6
23.3*
19.4
12.2AIAN; Asian
Asian; NHPI
AIAN; SOR
Black; AIAN
AIAN; NHPI
NHPI; SOR
Black; NHPI
Black; Asian
(For more information on confidentiality protection, nonsampling error, and definitions, see www.census.gov/prod/cen2010/doc/pl94-171.pdf)
35.9
U.S. Census Bureau 11
Table 3.Two or More Races Population for the United States, Regions, States, and for Puerto Rico: 2000 and 2010(For information on confidentiality protection, nonsampling error, and definitions, see www.census.gov/prod/cen2010/doc/pl94-171.pdf)
Area
2000 2010
Percentage change, 2000 to 2010Number
Percentage of area population Number
Percentage of area population
United States . . . . . . . . . . . . . . . 6,826,228 2 .4 9,009,073 2 .9 32 .0
REGIONNortheast . . . . . . . . . . . . . . . . . . . . . . 1,228,461 2 .3 1,416,529 2 .6 15 .3Midwest . . . . . . . . . . . . . . . . . . . . . . . 1,022,468 1 .6 1,447,930 2 .2 41 .6South . . . . . . . . . . . . . . . . . . . . . . . . . 1,847,015 1 .8 2,753,410 2 .4 49 .1West . . . . . . . . . . . . . . . . . . . . . . . . . . 2,728,284 4 .3 3,391,204 4 .7 24 .3
STATEAlabama . . . . . . . . . . . . . . . . . . . . . . . 44,179 1 .0 71,251 1 .5 61 .3Alaska . . . . . . . . . . . . . . . . . . . . . . . . . 34,146 5 .4 51,875 7 .3 51 .9Arizona . . . . . . . . . . . . . . . . . . . . . . . . 146,526 2 .9 218,300 3 .4 49 .0Arkansas . . . . . . . . . . . . . . . . . . . . . . . 35,744 1 .3 57,010 2 .0 59 .5California . . . . . . . . . . . . . . . . . . . . . . 1,607,646 4 .7 1,815,384 4 .9 12 .9Colorado . . . . . . . . . . . . . . . . . . . . . . . 122,187 2 .8 172,456 3 .4 41 .1Connecticut . . . . . . . . . . . . . . . . . . . . . 74,848 2 .2 92,676 2 .6 23 .8Delaware . . . . . . . . . . . . . . . . . . . . . . 13,033 1 .7 23,854 2 .7 83 .0District of Columbia . . . . . . . . . . . . . . 13,446 2 .4 17,316 2 .9 28 .8Florida . . . . . . . . . . . . . . . . . . . . . . . . . 376,315 2 .4 472,577 2 .5 25 .6
Georgia . . . . . . . . . . . . . . . . . . . . . . . . 114,188 1 .4 207,489 2 .1 81 .7Hawaii . . . . . . . . . . . . . . . . . . . . . . . . . 259,343 21 .4 320,629 23 .6 23 .6Idaho . . . . . . . . . . . . . . . . . . . . . . . . . . 25,609 2 .0 38,935 2 .5 52 .0Illinois . . . . . . . . . . . . . . . . . . . . . . . . . 235,016 1 .9 289,982 2 .3 23 .4Indiana . . . . . . . . . . . . . . . . . . . . . . . . 75,672 1 .2 127,901 2 .0 69 .0Iowa . . . . . . . . . . . . . . . . . . . . . . . . . . 31,778 1 .1 53,333 1 .8 67 .8Kansas . . . . . . . . . . . . . . . . . . . . . . . . 56,496 2 .1 85,933 3 .0 52 .1Kentucky . . . . . . . . . . . . . . . . . . . . . . . 42,443 1 .1 75,208 1 .7 77 .2Louisiana . . . . . . . . . . . . . . . . . . . . . . 48,265 1 .1 72,883 1 .6 51 .0Maine . . . . . . . . . . . . . . . . . . . . . . . . . 12,647 1 .0 20,941 1 .6 65 .6
Maryland . . . . . . . . . . . . . . . . . . . . . . . 103,587 2 .0 164,708 2 .9 59 .0Massachusetts . . . . . . . . . . . . . . . . . . 146,005 2 .3 172,003 2 .6 17 .8Michigan . . . . . . . . . . . . . . . . . . . . . . . 192,416 1 .9 230,319 2 .3 19 .7Minnesota . . . . . . . . . . . . . . . . . . . . . . 82,742 1 .7 125,145 2 .4 51 .2Mississippi . . . . . . . . . . . . . . . . . . . . . 20,021 0 .7 34,107 1 .1 70 .4Missouri . . . . . . . . . . . . . . . . . . . . . . . 82,061 1 .5 124,589 2 .1 51 .8Montana . . . . . . . . . . . . . . . . . . . . . . . 15,730 1 .7 24,976 2 .5 58 .8Nebraska . . . . . . . . . . . . . . . . . . . . . . 23,953 1 .4 39,510 2 .2 64 .9Nevada . . . . . . . . . . . . . . . . . . . . . . . . 76,428 3 .8 126,075 4 .7 65 .0New Hampshire . . . . . . . . . . . . . . . . . 13,214 1 .1 21,382 1 .6 61 .8
New Jersey . . . . . . . . . . . . . . . . . . . . . 213,755 2 .5 240,303 2 .7 12 .4New Mexico . . . . . . . . . . . . . . . . . . . . 66,327 3 .6 77,010 3 .7 16 .1New York . . . . . . . . . . . . . . . . . . . . . . . 590,182 3 .1 585,849 3 .0 -0 .7North Carolina . . . . . . . . . . . . . . . . . . 103,260 1 .3 206,199 2 .2 99 .7North Dakota . . . . . . . . . . . . . . . . . . . 7,398 1 .2 11,853 1 .8 60 .2Ohio . . . . . . . . . . . . . . . . . . . . . . . . . . 157,885 1 .4 237,765 2 .1 50 .6Oklahoma . . . . . . . . . . . . . . . . . . . . . . 155,985 4 .5 221,321 5 .9 41 .9Oregon . . . . . . . . . . . . . . . . . . . . . . . . 104,745 3 .1 144,759 3 .8 38 .2Pennsylvania . . . . . . . . . . . . . . . . . . . 142,224 1 .2 237,835 1 .9 67 .2Rhode Island . . . . . . . . . . . . . . . . . . . 28,251 2 .7 34,787 3 .3 23 .1
South Carolina . . . . . . . . . . . . . . . . . . 39,950 1 .0 79,935 1 .7 100 .1South Dakota . . . . . . . . . . . . . . . . . . . 10,156 1 .3 17,283 2 .1 70 .2Tennessee . . . . . . . . . . . . . . . . . . . . . 63,109 1 .1 110,009 1 .7 74 .3Texas . . . . . . . . . . . . . . . . . . . . . . . . . 514,633 2 .5 679,001 2 .7 31 .9Utah . . . . . . . . . . . . . . . . . . . . . . . . . . 47,195 2 .1 75,518 2 .7 60 .0Vermont . . . . . . . . . . . . . . . . . . . . . . . 7,335 1 .2 10,753 1 .7 46 .6Virginia . . . . . . . . . . . . . . . . . . . . . . . . 143,069 2 .0 233,400 2 .9 63 .1Washington . . . . . . . . . . . . . . . . . . . . . 213,519 3 .6 312,926 4 .7 46 .6West Virginia . . . . . . . . . . . . . . . . . . . . 15,788 0 .9 27,142 1 .5 71 .9Wisconsin . . . . . . . . . . . . . . . . . . . . . . 66,895 1 .2 104,317 1 .8 55 .9Wyoming . . . . . . . . . . . . . . . . . . . . . . . 8,883 1 .8 12,361 2 .2 39 .2
Puerto Rico . . . . . . . . . . . . . . . . . . . . 158,415 4 .2 122,246 3 .3 -22 .8
Note: In Census 2000, an error in data processing resulted in an overstatement of the Two or More Races population by about 1 million people (about 15 percent) nationally, which almost entirely affected race combinations involving Some Other Race . Therefore, data users should assess observed changes in the Two or More Races population and race combinations involving Some Other Race between Census 2000 and the 2010 Census with caution . Changes in specific race combinations not involving Some Other Race, such as White and Black or Black and Asian, generally should be more comparable .
Sources: U .S . Census Bureau, Census 2000 Redistricting Data (Public Law 94-171) Summary File, Table PL1; and 2010 Census Redistricting Data (Public Law 94-171) Summary File, Table P1 .
12 U.S. Census Bureau
The greatest proportions of the Two or More Races population lived in the West and the South.
According to the 2010 Census, 38 percent of people who reported multiple races lived in the West region, and an additional 31 per-cent lived in the South. Another 16 percent lived in the Midwest, as well as 16 percent in the Northeast (see Figure 6).16 These distribu-tions were somewhat different from Census 2000, when 40 percent of all respondents who reported multiple races lived in the West, 27 percent in the South, 18 percent in the Northeast, and 15 percent
16 The Northeast census region includes Connecticut, Maine, Massachusetts, New Hampshire, New Jersey, New York, Pennsylvania, Rhode Island, and Vermont. The Midwest census region includes Illinois, Indiana, Iowa, Kansas, Michigan, Minnesota, Missouri, Nebraska, North Dakota, Ohio, South Dakota, and Wisconsin. The South census region includes Alabama, Arkansas, Delaware, the District of Columbia, Florida, Georgia, Kentucky, Louisiana, Maryland, Mississippi, North Carolina, Oklahoma, South Carolina, Tennessee, Texas, Virginia, and West Virginia. The West census region includes Alaska, Arizona, California, Colorado, Hawaii, Idaho, Montana, Nevada, New Mexico, Oregon, Utah, Washington, and Wyoming.
in the Midwest.17 These changes in the regional distributions between 2000 and 2010 are likely influ-enced by the data error for combi-nations involving Some Other Race, as a large proportion of the Some Other Race combinations in 2000 were in the West region.
The number and proportion of people who reported more than one race increased in all four regions.
The greatest changes in the Two or More Races population by region were seen in the South and the Midwest. In the South region, the population reporting more than one race increased by nearly half its size since 2000 (increasing by 49 percent) and grew from 1.8 million to 2.8 million. In the Midwest, the multiple-race population grew from 1.0 million to 1.4 million, increas-ing by 42 percent. The population
17 For more information on the analysis of the Two or More Races population in Census 2000, see Jones, N. and A. Symens Smith. 2001. The Two or More Races Population: 2000, U.S. Census Bureau, Census 2000 Briefs, C2KBR/01-6, available at <www.census.gov/prod/2001pubs /c2kbr01-6.pdf>.
reporting more than one race in the West and the Northeast grew at slower rates, increasing by 24 per-cent and 15 percent, respectively (see Table 3).
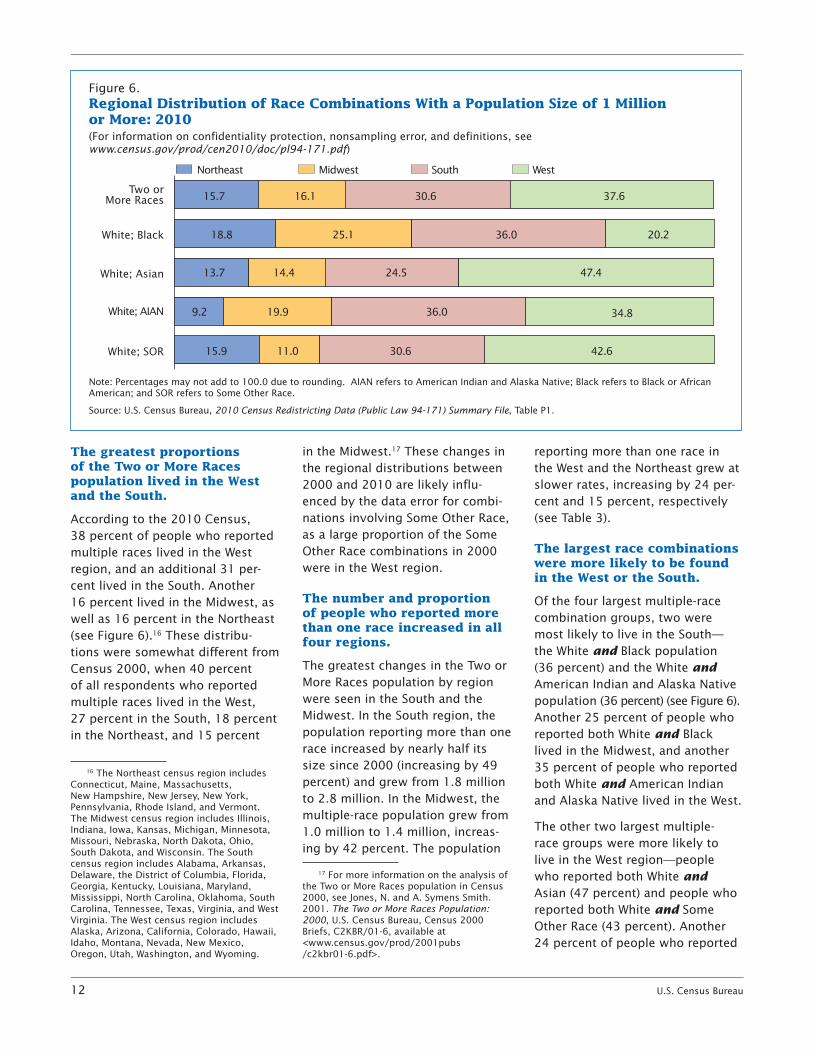
The largest race combinations were more likely to be found in the West or the South.
Of the four largest multiple-race combination groups, two were most likely to live in the South—the White and Black population (36 percent) and the White and American Indian and Alaska Native population (36 percent) (see Figure 6). Another 25 percent of people who reported both White and Black lived in the Midwest, and another 35 percent of people who reported both White and American Indian and Alaska Native lived in the West.
The other two largest multiple-race groups were more likely to live in the West region—people who reported both White and Asian (47 percent) and people who reported both White and Some Other Race (43 percent). Another 24 percent of people who reported
Figure 6.Regional Distribution of Race Combinations With a Population Size of 1 Million or More: 2010
Note: Percentages may not add to 100.0 due to rounding. AIAN refers to American Indian and Alaska Native; Black refers to Black or African American; and SOR refers to Some Other Race.
Source: U.S. Census Bureau, 2010 Census Redistricting Data (Public Law 94-171) Summary File, Table P1.
(For information on confidentiality protection, nonsampling error, and definitions, see www.census.gov/prod/cen2010/doc/pl94-171.pdf)
White; SOR
White; AIAN
White; Asian
White; Black
Two orMore Races 15.7
18.8
13.7
9.2
15.9 11.0 30.6 42.6
19.9 36.0 34.8
14.4
Northeast Midwest South West
24.5 47.4
25.1 36.0 20.2
16.1 30.6 37.6
U.S. Census Bureau 13
both White and Asian lived in the South, as well as another 31 per-cent of people who reported both White and Some Other Race.
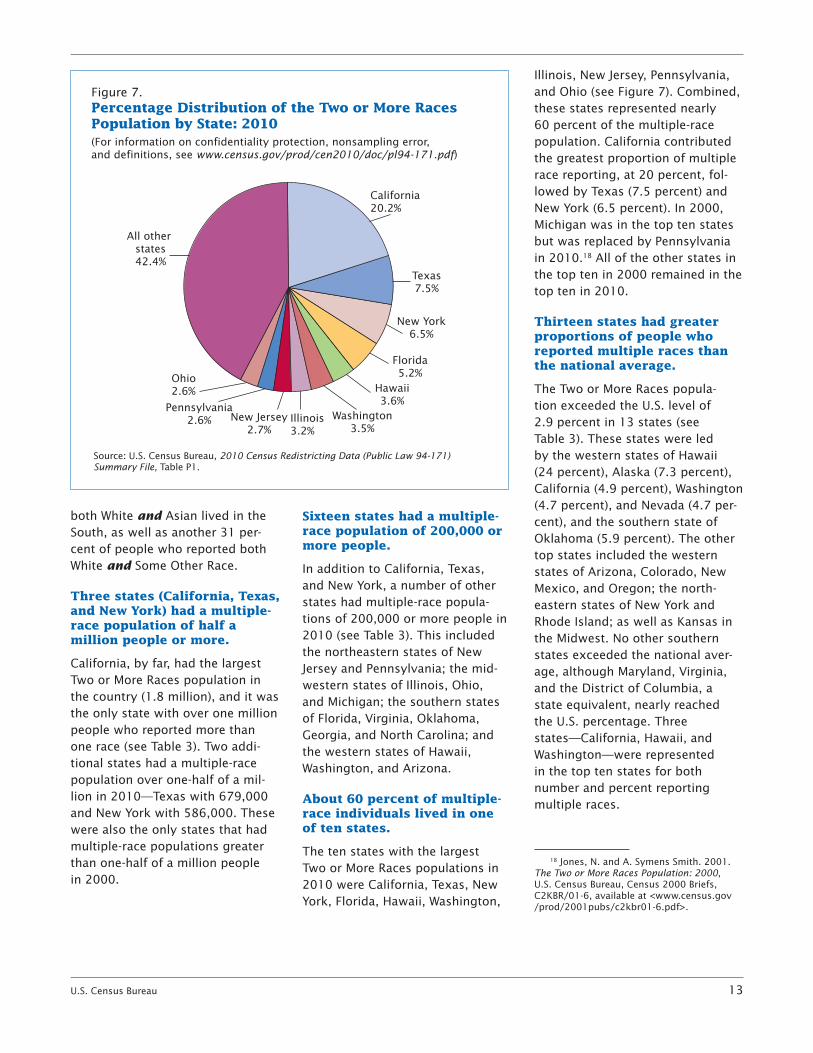
Three states (California, Texas, and New York) had a multiple-race population of half a million people or more.
California, by far, had the largest Two or More Races population in the country (1.8 million), and it was the only state with over one million people who reported more than one race (see Table 3). Two addi-tional states had a multiple-race population over one-half of a mil-lion in 2010—Texas with 679,000 and New York with 586,000. These were also the only states that had multiple-race populations greater than one-half of a million people in 2000.
Sixteen states had a multiple-race population of 200,000 or more people.
In addition to California, Texas, and New York, a number of other states had multiple-race popula-tions of 200,000 or more people in 2010 (see Table 3). This included the northeastern states of New Jersey and Pennsylvania; the mid-western states of Illinois, Ohio, and Michigan; the southern states of Florida, Virginia, Oklahoma, Georgia, and North Carolina; and the western states of Hawaii, Washington, and Arizona.
About 60 percent of multiple-race individuals lived in one of ten states.
The ten states with the largest Two or More Races populations in 2010 were California, Texas, New York, Florida, Hawaii, Washington,
Illinois, New Jersey, Pennsylvania, and Ohio (see Figure 7). Combined, these states represented nearly 60 percent of the multiple-race population. California contributed the greatest proportion of multiple race reporting, at 20 percent, fol-lowed by Texas (7.5 percent) and New York (6.5 percent). In 2000, Michigan was in the top ten states but was replaced by Pennsylvania in 2010.18 All of the other states in the top ten in 2000 remained in the top ten in 2010.
Thirteen states had greater proportions of people who reported multiple races than the national average.
The Two or More Races popula-tion exceeded the U.S. level of 2.9 percent in 13 states (see Table 3). These states were led by the western states of Hawaii (24 percent), Alaska (7.3 percent), California (4.9 percent), Washington (4.7 percent), and Nevada (4.7 per-cent), and the southern state of Oklahoma (5.9 percent). The other top states included the western states of Arizona, Colorado, New Mexico, and Oregon; the north-eastern states of New York and Rhode Island; as well as Kansas in the Midwest. No other southern states exceeded the national aver-age, although Maryland, Virginia, and the District of Columbia, a state equivalent, nearly reached the U.S. percentage. Three states—California, Hawaii, and Washington—were represented in the top ten states for both number and percent reporting multiple races.
18 Jones, N. and A. Symens Smith. 2001. The Two or More Races Population: 2000, U.S. Census Bureau, Census 2000 Briefs, C2KBR/01-6, available at <www.census.gov /prod/2001pubs/c2kbr01-6.pdf>.
Figure 7.Percentage Distribution of the Two or More Races Population by State: 2010
Source: U.S. Census Bureau, 2010 Census Redistricting Data (Public Law 94-171) Summary File, Table P1.
(For information on confidentiality protection, nonsampling error, and definitions, see www.census.gov/prod/cen2010/doc/pl94-171.pdf)
California20.2%
New York6.5%
Florida5.2%Ohio
2.6%
Illinois3.2%
All other states42.4%
Washington3.5%
Hawaii3.6%
Pennsylvania2.6% New Jersey
2.7%
Texas7.5%
14 U.S. Census Bureau
No state had less than 1.0 percent multiple-race reporting in 2010.
In 2000, there were five states where the Two or More Races population represented 1.0 per-cent or less of the total popula-tion (Alabama, Maine, Mississippi, South Carolina, and West Virginia). However, in 2010, there were no states where less than 1.0 percent of the population reported multiple races. In fact, by 2010, nearly every state in the country (with only Mississippi at 1.1 percent) had a multiple-race population of 1.5 per-cent or more.
Nine states had a 70 percent or greater increase in their multiple-race populations since 2000.
The percentage change in the Two or More Races population was 70 percent or greater in nine states—South Carolina, North Carolina, Delaware, Georgia, Kentucky, Tennessee, West Virginia, Mississippi, and South Dakota (see Table 3). Each state—with the exception of South Dakota—was a southern state. Many other states also saw large percentage changes in their multiple-race populations. In fact, the multiple-race population grew by 50 percent or more in 22 additional states.
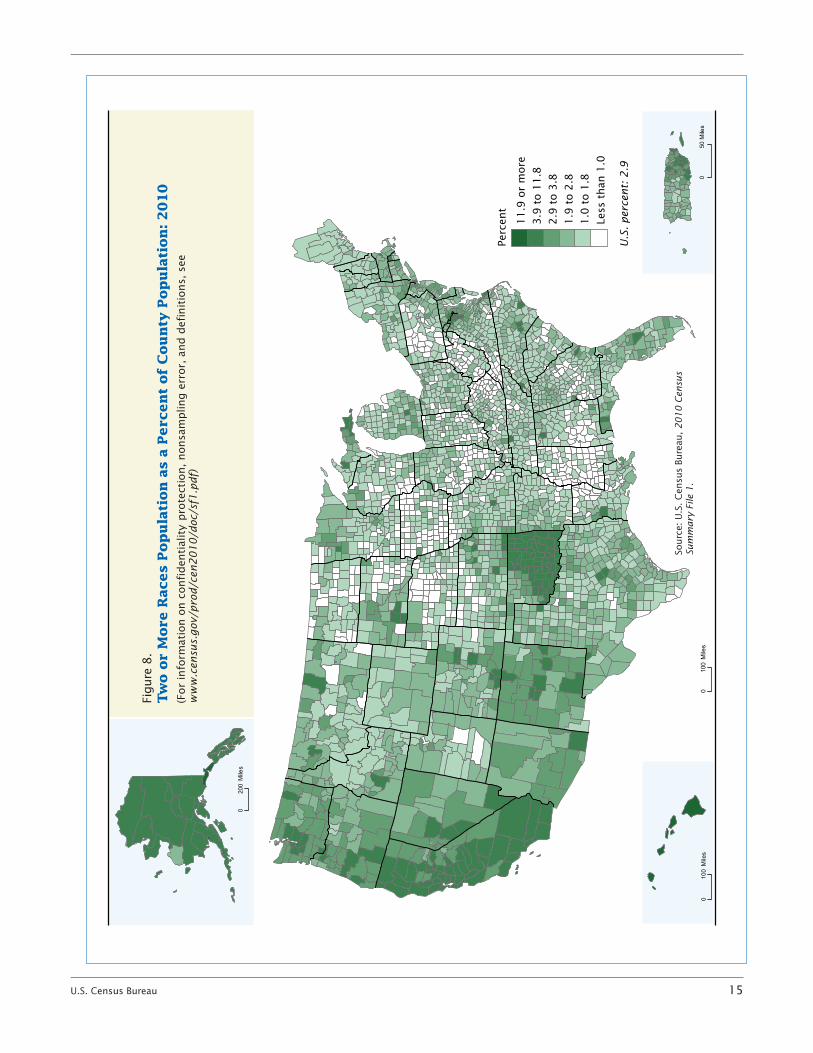
In 2010, every county in the United States had respondents who reported multiple races.
Multiple-race respondents were counted in every county through-out the country in 2010. In fact, about one-third of all counties in the United States had 1,000 or more respondents reporting more than one race. In addition, in about one of every six counties, the Two or More Races population’s
proportion was higher than the U.S. level of 2.9 percent. Figure 8 shows the proportion of each county’s total population that reported mul-tiple races in 2010.
The Two or More Races population was concentrated in counties throughout the West.
The highest concentrations of multiple-race reporting were notice-able in counties in the western part of the country. Similar to patterns observed in 2000, the West con-tained four counties (all in Hawaii) with between 22 percent and 29 percent reporting more than one race. Other counties with promi-nent Two or More Races propor-tions were located in parts of the South and the Northeast regions.
The majority of counties in Hawaii, Alaska, California, and Oklahoma had higher levels of multiple-race reporting, and many had more than double or triple the 2.9 percent U.S. level, as shown in Figure 8. Counties along the Pacific coast in Washington and Oregon, as well as counties in Nevada and south-ern and central Colorado, had higher percentages of multiple-race reporting.
Moderately high concentrations of the Two or More Races population were in metropolitan counties along the New England and Middle-Atlantic coasts.
The Two or More Races population was also concentrated in metropoli-tan counties along the New England and Middle-Atlantic coasts. The counties forming the metropolitan corridor from Washington, DC, to Boston, MA, had noticeably higher percentages of people reporting multiple races, in comparison to counties located mostly outside the metropolitan areas of these
states. Similarly, some clusters of metropolitan counties across the Upper Midwest, around Chicago, IL, Detroit, MI, and Minneapolis, MN, as well as outside of metropoli-tan counties in Michigan’s Upper Peninsula, had moderately high percentages (between 2.9 percent to 11.8 percent) of multiple-race reporting. Some southern and mid-western counties also had moder-ately high proportions reporting multiple races in 2010, especially in and around metropolitan area clus-ters in parts of Alabama, Georgia, North Carolina, and Tennessee and the metropolitan Gulf Coast of Louisiana, Mississippi, and Florida.
The Two or More Races population was least concentrated outside of metropolitan counties in the Midwest and the South.
Counties with percentages of multiple race reporting lower than the percentage for the nation were likely to be outside of metropolitan counties in the Midwest and the South. This was especially true in the lowland South counties extend-ing from Mississippi, Alabama, and Georgia, through some portions of South Carolina, and into north-central Tennessee, central-eastern Kentucky, and West Virginia. Pennsylvania, in the Northeast, also had relatively lower levels of multiple-race reporting than the national average in the central por-tions of the state. Additional con-centrations of counties with lower percentages of multiple races were in midwestern counties throughout Iowa, Wisconsin, Nebraska, North Dakota, and the eastern half of South Dakota.
U.S. Census Bureau 15
010
0M
iles
010
0M
iles
Perc
ent
11
.9 o
r m
ore
3.9
to 1
1.8
2.9
to 3
.8
1.9
to 2
.8
1.0
to 1
.8
Less
than
1.0
020
0M
iles
050
Mile
s
U.S
. per
cent:
2.9
Figure
8.
Tw
o o
r M
ore
Races
Pop
ula
tion
as
a P
erc
en
t of
Cou
nty
Pop
ula
tion
: 2010
(For
info
rmat
ion o
n c
onfi
den
tial
ity p
rote
ctio
n,
non
sam
plin
g e
rror,
and d
efin
itio
ns,
see
w
ww
.cen
sus.
gov
/pro
d/c
en2
01
0/d
oc/s
f1.p
df)
Sourc
e: U
.S. C
ensu
s Bu
reau
, 2010 C
ensu
s Su
mm
ary
File
1.
16 U.S. Census Bureau
Table 4.Ten Places With the Largest Two or More Races Population: 2010(For information on confidentiality protection, nonsampling error, and definitions, see www.census.gov/prod/cen2010/doc/sf1.pdf)
PlaceTotal
population
Two or More Races
Rank Number
New York, NY . . . . . . . . . . . . . . . . . . . . . . . . . . . 8,175,133 1 325,901 Los Angeles, CA . . . . . . . . . . . . . . . . . . . . . . . . 3,792,621 2 175,635 Chicago, IL . . . . . . . . . . . . . . . . . . . . . . . . . . . . 2,695,598 3 73,148 Houston, TX . . . . . . . . . . . . . . . . . . . . . . . . . . . . 2,099,451 4 68,530 San Diego, CA . . . . . . . . . . . . . . . . . . . . . . . . . . 1,307,402 5 66,688 Urban Honolulu CDP, HI1 . . . . . . . . . . . . . . . . . . 337,256 6 55,080 Phoenix, AZ . . . . . . . . . . . . . . . . . . . . . . . . . . . . 1,445,632 7 52,334 San Jose, CA . . . . . . . . . . . . . . . . . . . . . . . . . . . 945,942 8 47,062 San Antonio, TX . . . . . . . . . . . . . . . . . . . . . . . . . 1,327,407 9 45,531 Philadelphia, PA . . . . . . . . . . . . . . . . . . . . . . . . . 1,526,006 10 43,070
1 Urban Honolulu CDP, HI, is a census designated place (CDP) . CDPs are the statistical counterparts of incorporated places and are delineated to provide data for settled concentrations of population that are identifiable by name but are not legally incorporated under the laws of the state in which they are located .
Source: U .S . Census Bureau, 2010 Census Redistricting Data (Public Law 94-171) Summary File, Table P1 .
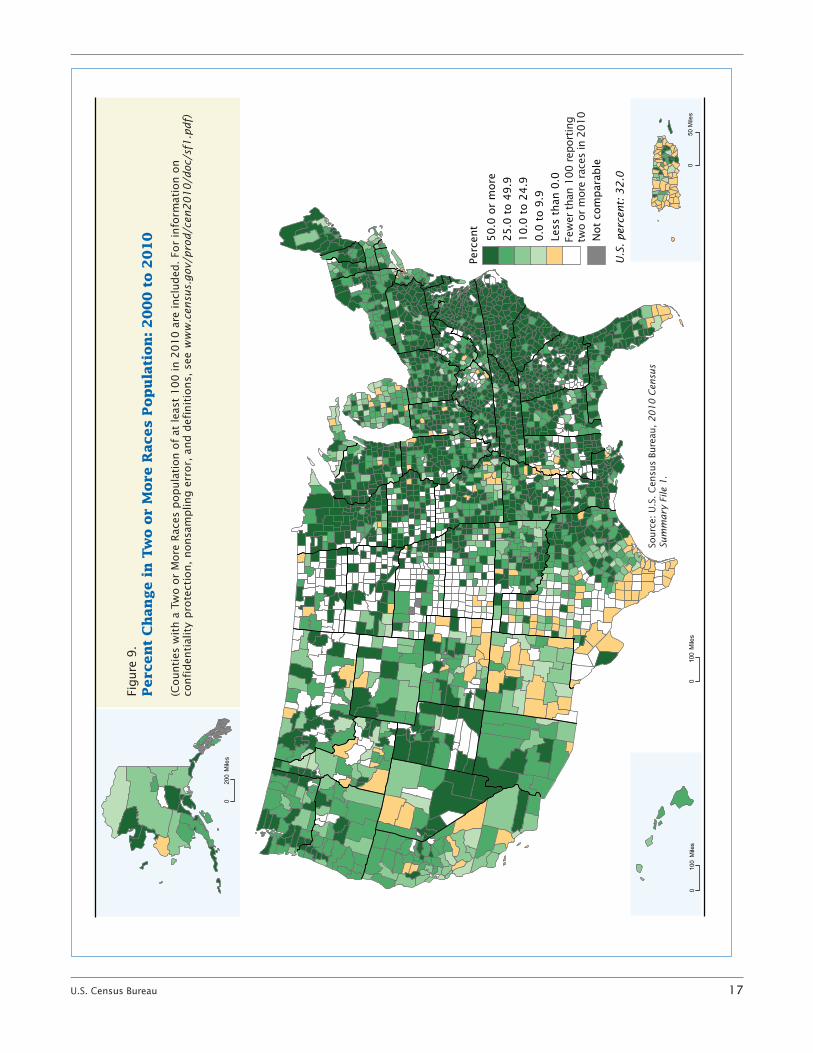
More than half of counties across the country experienced a 50 percent increase or more in their multiple-race populations between 2000 and 2010.
The map in Figure 9 illustrates the percentage change in the Two or More Races population between 2000 and 2010 for counties with a Two or More Races population of at least 100 in 2010. Among these counties, over half exhibited growth of 50 percent or more from 2000 to 2010, as shown in dark green on the map.
The multiple-race population grew by more than 50 percent in most counties in the eastern half of the country. Other counties with more than 50 percent growth in the Two or More Races population can be seen throughout the central part of the country from Minnesota and Wisconsin down through eastern Texas and the Gulf Coast states. Additionally, multiple groupings of counties in southern Nevada, parts of Arizona, Utah, and Colorado, as well as clusters of counties in the Pacific Northwest, experienced substantial growth in their Two or More Races population between 2000 and 2010.
A number of counties in California, Colorado, New Mexico, Texas, and other parts of the country showed decreases in their multiple-race population since 2000. These decreases are likely a result of the Census 2000 processing error that overstated combinations including Some Other Race in 2000.19
It is important to note that other counties with more moderate growth, especially in the Western half of the country, already showed high levels of multiple-race
19 There were 286 counties that showed a decrease in their Two or More Races popula-tion, which was likely a result of the Census 2000 processing error that overstated combi-nations including Some Other Race.
reporting in 2000 and, therefore, are maintaining similar proportions a decade later to show little to moderate change.
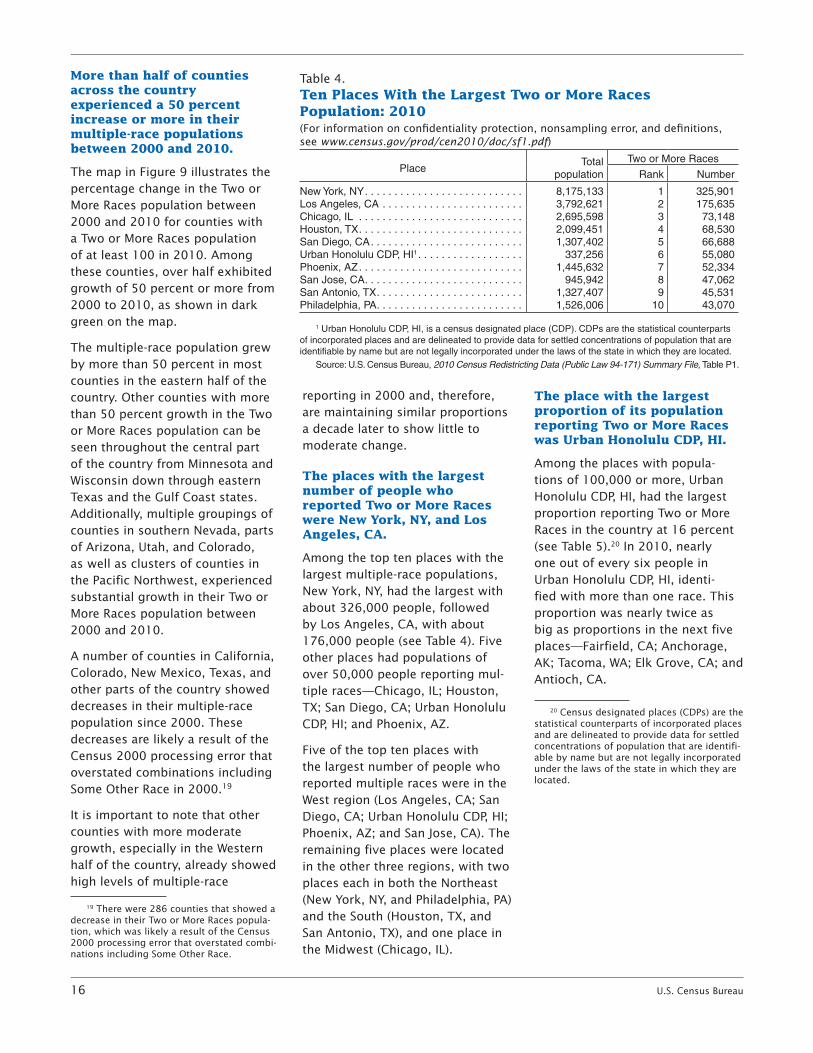
The places with the largest number of people who reported Two or More Races were New York, NY, and Los Angeles, CA.
Among the top ten places with the largest multiple-race populations, New York, NY, had the largest with about 326,000 people, followed by Los Angeles, CA, with about 176,000 people (see Table 4). Five other places had populations of over 50,000 people reporting mul-tiple races—Chicago, IL; Houston, TX; San Diego, CA; Urban Honolulu CDP, HI; and Phoenix, AZ.
Five of the top ten places with the largest number of people who reported multiple races were in the West region (Los Angeles, CA; San Diego, CA; Urban Honolulu CDP, HI; Phoenix, AZ; and San Jose, CA). The remaining five places were located in the other three regions, with two places each in both the Northeast (New York, NY, and Philadelphia, PA) and the South (Houston, TX, and San Antonio, TX), and one place in the Midwest (Chicago, IL).
The place with the largest proportion of its population reporting Two or More Races was Urban Honolulu CDP, HI.
Among the places with popula-tions of 100,000 or more, Urban Honolulu CDP, HI, had the largest proportion reporting Two or More Races in the country at 16 percent (see Table 5).20 In 2010, nearly one out of every six people in Urban Honolulu CDP, HI, identi-fied with more than one race. This proportion was nearly twice as big as proportions in the next five places—Fairfield, CA; Anchorage, AK; Tacoma, WA; Elk Grove, CA; and Antioch, CA.
20 Census designated places (CDPs) are the statistical counterparts of incorporated places and are delineated to provide data for settled concentrations of population that are identifi-able by name but are not legally incorporated under the laws of the state in which they are located.
U.S. Census Bureau 17
010
0M
iles
0
100
Mile
s
Perc
ent
50
.0 o
r m
ore
25
.0 t
o 4
9.9
10
.0 t
o 2
4.9
0.0
to 9
.9
Less
than
0.0
.
.
Not
com
par
able
020
0M
iles
050
Mile
s
U.S
. per
cent:
32
.0
Figure
9.
Perc
en
t C
han
ge i
n T
wo o
r M
ore
Races
Pop
ula
tion
: 2000 t
o 2
010
(Counti
es w
ith a
Tw
o o
r M
ore
Rac
es p
opula
tion o
f at
lea
st 1
00
in 2
01
0 a
re incl
uded
. Fo
r in
form
atio
n o
n
confi
den
tial
ity p
rote
ctio
n,
non
sam
plin
g e
rror,
and d
efin
itio
ns,
see
ww
w.c
ensu
s.gov
/pro
d/c
en2
01
0/d
oc/s
f1.p
df)
Sourc
e: U
.S. C
ensu
s Bu
reau
, 2010 C
ensu
s Su
mm
ary
File
1.
Few
er t
han
100 r
epor
ting
two
or m
ore
race
s in
2010
18 U.S. Census Bureau
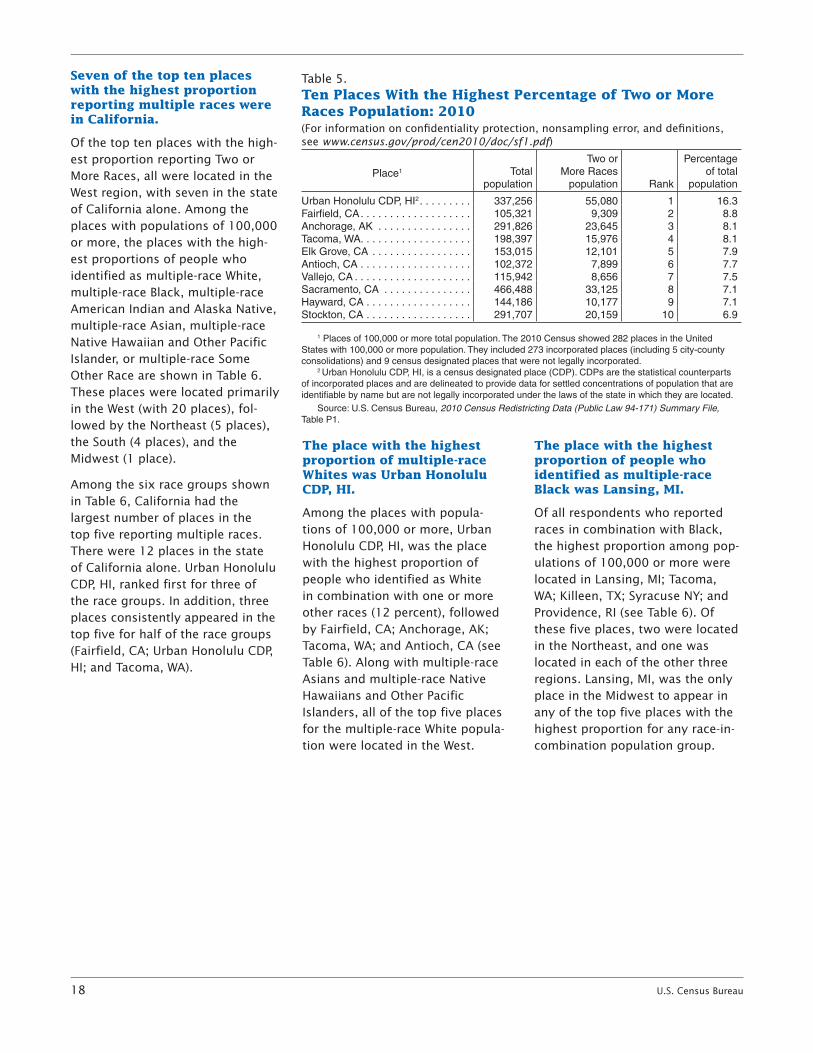
Seven of the top ten places with the highest proportion reporting multiple races were in California.
Of the top ten places with the high-est proportion reporting Two or More Races, all were located in the West region, with seven in the state of California alone. Among the places with populations of 100,000 or more, the places with the high-est proportions of people who identified as multiple-race White, multiple-race Black, multiple-race American Indian and Alaska Native, multiple-race Asian, multiple-race Native Hawaiian and Other Pacific Islander, or multiple-race Some Other Race are shown in Table 6. These places were located primarily in the West (with 20 places), fol-lowed by the Northeast (5 places), the South (4 places), and the Midwest (1 place).
Among the six race groups shown in Table 6, California had the largest number of places in the top five reporting multiple races. There were 12 places in the state of California alone. Urban Honolulu CDP, HI, ranked first for three of the race groups. In addition, three places consistently appeared in the top five for half of the race groups (Fairfield, CA; Urban Honolulu CDP, HI; and Tacoma, WA).
The place with the highest proportion of multiple-race Whites was Urban Honolulu CDP, HI.
Among the places with popula-tions of 100,000 or more, Urban Honolulu CDP, HI, was the place with the highest proportion of people who identified as White in combination with one or more other races (12 percent), followed by Fairfield, CA; Anchorage, AK; Tacoma, WA; and Antioch, CA (see Table 6). Along with multiple-race Asians and multiple-race Native Hawaiians and Other Pacific Islanders, all of the top five places for the multiple-race White popula-tion were located in the West.
The place with the highest proportion of people who identified as multiple-race Black was Lansing, MI.
Of all respondents who reported races in combination with Black, the highest proportion among pop-ulations of 100,000 or more were located in Lansing, MI; Tacoma, WA; Killeen, TX; Syracuse NY; and Providence, RI (see Table 6). Of these five places, two were located in the Northeast, and one was located in each of the other three regions. Lansing, MI, was the only place in the Midwest to appear in any of the top five places with the highest proportion for any race-in-combination population group.
Table 5.Ten Places With the Highest Percentage of Two or More Races Population: 2010(For information on confidentiality protection, nonsampling error, and definitions, see www.census.gov/prod/cen2010/doc/sf1.pdf)
Place1 Total population
Two or More Races
population Rank
Percentage of total
population
Urban Honolulu CDP, HI2 . . . . . . . . . 337,256 55,080 1 16 .3Fairfield, CA . . . . . . . . . . . . . . . . . . . 105,321 9,309 2 8 .8Anchorage, AK . . . . . . . . . . . . . . . . 291,826 23,645 3 8 .1Tacoma, WA . . . . . . . . . . . . . . . . . . . 198,397 15,976 4 8 .1Elk Grove, CA . . . . . . . . . . . . . . . . . 153,015 12,101 5 7 .9Antioch, CA . . . . . . . . . . . . . . . . . . . 102,372 7,899 6 7 .7Vallejo, CA . . . . . . . . . . . . . . . . . . . . 115,942 8,656 7 7 .5Sacramento, CA . . . . . . . . . . . . . . . 466,488 33,125 8 7 .1Hayward, CA . . . . . . . . . . . . . . . . . . 144,186 10,177 9 7 .1Stockton, CA . . . . . . . . . . . . . . . . . . 291,707 20,159 10 6 .9
1 Places of 100,000 or more total population . The 2010 Census showed 282 places in the United States with 100,000 or more population . They included 273 incorporated places (including 5 city-county consolidations) and 9 census designated places that were not legally incorporated .
2 Urban Honolulu CDP, HI, is a census designated place (CDP) . CDPs are the statistical counterparts of incorporated places and are delineated to provide data for settled concentrations of population that are identifiable by name but are not legally incorporated under the laws of the state in which they are located .
Source: U .S . Census Bureau, 2010 Census Redistricting Data (Public Law 94-171) Summary File, Table P1 .
U.S. Census Bureau 19
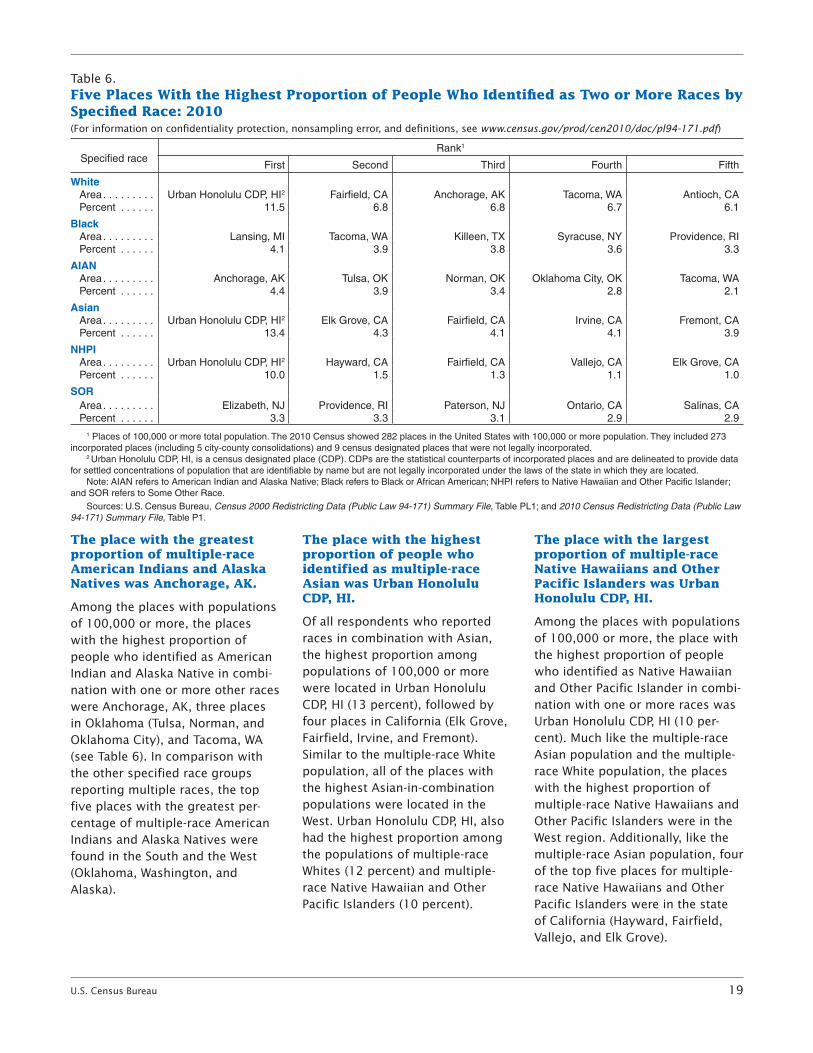
The place with the greatest proportion of multiple-race American Indians and Alaska Natives was Anchorage, AK.
Among the places with populations of 100,000 or more, the places with the highest proportion of people who identified as American Indian and Alaska Native in combi-nation with one or more other races were Anchorage, AK, three places in Oklahoma (Tulsa, Norman, and Oklahoma City), and Tacoma, WA (see Table 6). In comparison with the other specified race groups reporting multiple races, the top five places with the greatest per-centage of multiple-race American Indians and Alaska Natives were found in the South and the West (Oklahoma, Washington, and Alaska).
The place with the highest proportion of people who identified as multiple-race Asian was Urban Honolulu CDP, HI.
Of all respondents who reported races in combination with Asian, the highest proportion among populations of 100,000 or more were located in Urban Honolulu CDP, HI (13 percent), followed by four places in California (Elk Grove, Fairfield, Irvine, and Fremont). Similar to the multiple-race White population, all of the places with the highest Asian-in-combination populations were located in the West. Urban Honolulu CDP, HI, also had the highest proportion among the populations of multiple-race Whites (12 percent) and multiple-race Native Hawaiian and Other Pacific Islanders (10 percent).
The place with the largest proportion of multiple-race Native Hawaiians and Other Pacific Islanders was Urban Honolulu CDP, HI.
Among the places with populations of 100,000 or more, the place with the highest proportion of people who identified as Native Hawaiian and Other Pacific Islander in combi-nation with one or more races was Urban Honolulu CDP, HI (10 per-cent). Much like the multiple-race Asian population and the multiple-race White population, the places with the highest proportion of multiple-race Native Hawaiians and Other Pacific Islanders were in the West region. Additionally, like the multiple-race Asian population, four of the top five places for multiple-race Native Hawaiians and Other Pacific Islanders were in the state of California (Hayward, Fairfield, Vallejo, and Elk Grove).
Table 6.Five Places With the Highest Proportion of People Who Identified as Two or More Races by Specified Race: 2010(For information on confidentiality protection, nonsampling error, and definitions, see www.census.gov/prod/cen2010/doc/pl94-171.pdf)
Specified raceRank1
First Second Third Fourth Fifth
White Area . . . . . . . . . Urban Honolulu CDP, HI2 Fairfield, CA Anchorage, AK Tacoma, WA Antioch, CA Percent . . . . . . 11 .5 6 .8 6 .8 6 .7 6 .1
Black Area . . . . . . . . . Lansing, MI Tacoma, WA Killeen, TX Syracuse, NY Providence, RI Percent . . . . . . 4 .1 3 .9 3 .8 3 .6 3 .3
AIAN Area . . . . . . . . . Anchorage, AK Tulsa, OK Norman, OK Oklahoma City, OK Tacoma, WA Percent . . . . . . 4 .4 3 .9 3 .4 2 .8 2 .1
Asian Area . . . . . . . . . Urban Honolulu CDP, HI2 Elk Grove, CA Fairfield, CA Irvine, CA Fremont, CA Percent . . . . . . 13 .4 4 .3 4 .1 4 .1 3 .9
NHPI Area . . . . . . . . . Urban Honolulu CDP, HI2 Hayward, CA Fairfield, CA Vallejo, CA Elk Grove, CA Percent . . . . . . 10 .0 1 .5 1 .3 1 .1 1 .0
SOR Area . . . . . . . . . Elizabeth, NJ Providence, RI Paterson, NJ Ontario, CA Salinas, CA Percent . . . . . . 3 .3 3 .3 3 .1 2 .9 2 .9
1 Places of 100,000 or more total population . The 2010 Census showed 282 places in the United States with 100,000 or more population . They included 273 incorporated places (including 5 city-county consolidations) and 9 census designated places that were not legally incorporated .
2 Urban Honolulu CDP, HI, is a census designated place (CDP) . CDPs are the statistical counterparts of incorporated places and are delineated to provide data for settled concentrations of population that are identifiable by name but are not legally incorporated under the laws of the state in which they are located .
Note: AIAN refers to American Indian and Alaska Native; Black refers to Black or African American; NHPI refers to Native Hawaiian and Other Pacific Islander; and SOR refers to Some Other Race .
Sources: U .S . Census Bureau, Census 2000 Redistricting Data (Public Law 94-171) Summary File, Table PL1; and 2010 Census Redistricting Data (Public Law 94-171) Summary File, Table P1 .
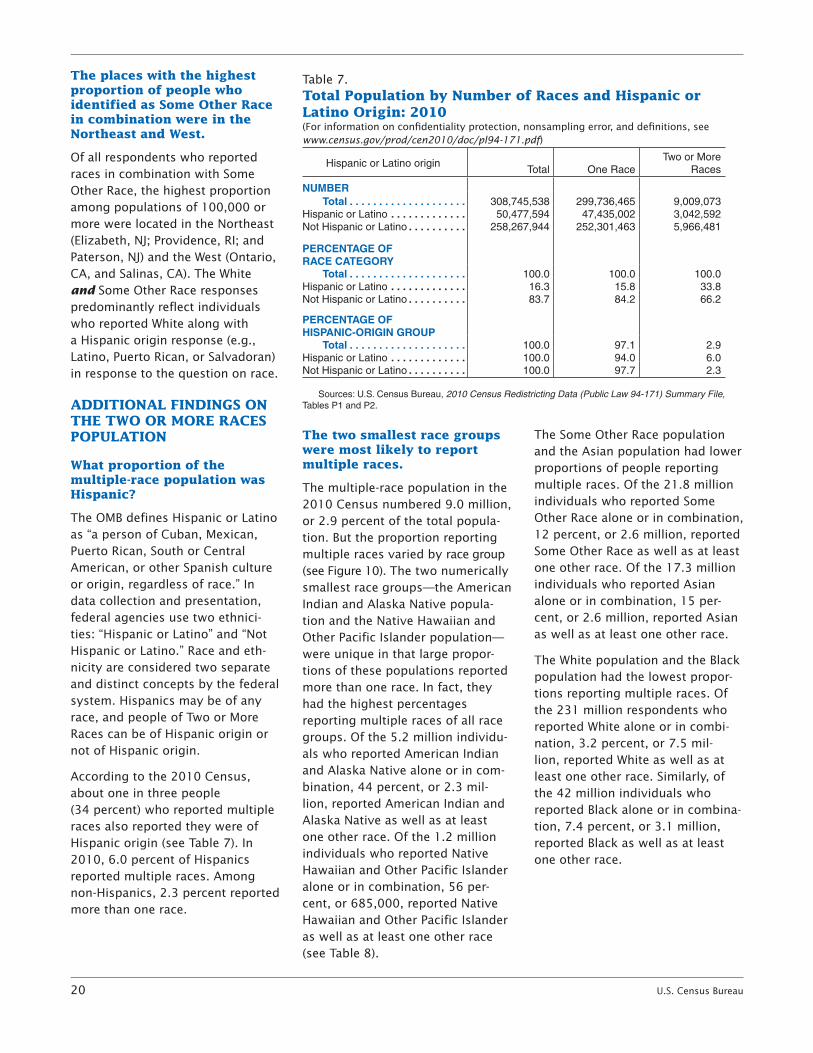
20 U.S. Census Bureau
The places with the highest proportion of people who identified as Some Other Race in combination were in the Northeast and West.
Of all respondents who reported races in combination with Some Other Race, the highest proportion among populations of 100,000 or more were located in the Northeast (Elizabeth, NJ; Providence, RI; and Paterson, NJ) and the West (Ontario, CA, and Salinas, CA). The White and Some Other Race responses predominantly reflect individuals who reported White along with a Hispanic origin response (e.g., Latino, Puerto Rican, or Salvadoran) in response to the question on race.
ADDITIONAL FINDINGS ON THE TWO OR MORE RACES POPULATION
What proportion of the multiple-race population was Hispanic?
The OMB defines Hispanic or Latino as “a person of Cuban, Mexican, Puerto Rican, South or Central American, or other Spanish culture or origin, regardless of race.” In data collection and presentation, federal agencies use two ethnici-ties: “Hispanic or Latino” and “Not Hispanic or Latino.” Race and eth-nicity are considered two separate and distinct concepts by the federal system. Hispanics may be of any race, and people of Two or More Races can be of Hispanic origin or not of Hispanic origin.
According to the 2010 Census, about one in three people (34 percent) who reported multiple races also reported they were of Hispanic origin (see Table 7). In 2010, 6.0 percent of Hispanics reported multiple races. Among non- Hispanics, 2.3 percent reported more than one race.
The two smallest race groups were most likely to report multiple races.
The multiple-race population in the 2010 Census numbered 9.0 million, or 2.9 percent of the total popula-tion. But the proportion reporting multiple races varied by race group (see Figure 10). The two numerically smallest race groups—the American Indian and Alaska Native popula-tion and the Native Hawaiian and Other Pacific Islander population—were unique in that large propor-tions of these populations reported more than one race. In fact, they had the highest percentages reporting multiple races of all race groups. Of the 5.2 million individu-als who reported American Indian and Alaska Native alone or in com-bination, 44 percent, or 2.3 mil-lion, reported American Indian and Alaska Native as well as at least one other race. Of the 1.2 million individuals who reported Native Hawaiian and Other Pacific Islander alone or in combination, 56 per-cent, or 685,000, reported Native Hawaiian and Other Pacific Islander as well as at least one other race (see Table 8).
The Some Other Race population and the Asian population had lower proportions of people reporting multiple races. Of the 21.8 million individuals who reported Some Other Race alone or in combination, 12 percent, or 2.6 million, reported Some Other Race as well as at least one other race. Of the 17.3 million individuals who reported Asian alone or in combination, 15 per-cent, or 2.6 million, reported Asian as well as at least one other race.
The White population and the Black population had the lowest propor-tions reporting multiple races. Of the 231 million respondents who reported White alone or in combi-nation, 3.2 percent, or 7.5 mil-lion, reported White as well as at least one other race. Similarly, of the 42 million individuals who reported Black alone or in combina-tion, 7.4 percent, or 3.1 million, reported Black as well as at least one other race.
Table 7.Total Population by Number of Races and Hispanic or Latino Origin: 2010 (For information on confidentiality protection, nonsampling error, and definitions, see www.census.gov/prod/cen2010/doc/pl94-171.pdf)
Hispanic or Latino originTotal One Race
Two or More Races
NUMBER Total . . . . . . . . . . . . . . . . . . . . 308,745,538 299,736,465 9,009,073Hispanic or Latino . . . . . . . . . . . . . 50,477,594 47,435,002 3,042,592Not Hispanic or Latino . . . . . . . . . . 258,267,944 252,301,463 5,966,481
PERCENTAGE OF RACE CATEGORY Total . . . . . . . . . . . . . . . . . . . . 100 .0 100 .0 100 .0Hispanic or Latino . . . . . . . . . . . . . 16 .3 15 .8 33 .8Not Hispanic or Latino . . . . . . . . . . 83 .7 84 .2 66 .2
PERCENTAGE OF HISPANIC-ORIGIN GROUP Total . . . . . . . . . . . . . . . . . . . . 100 .0 97 .1 2 .9Hispanic or Latino . . . . . . . . . . . . . 100 .0 94 .0 6 .0Not Hispanic or Latino . . . . . . . . . . 100 .0 97 .7 2 .3
Sources: U .S . Census Bureau, 2010 Census Redistricting Data (Public Law 94-171) Summary File, Tables P1 and P2 .
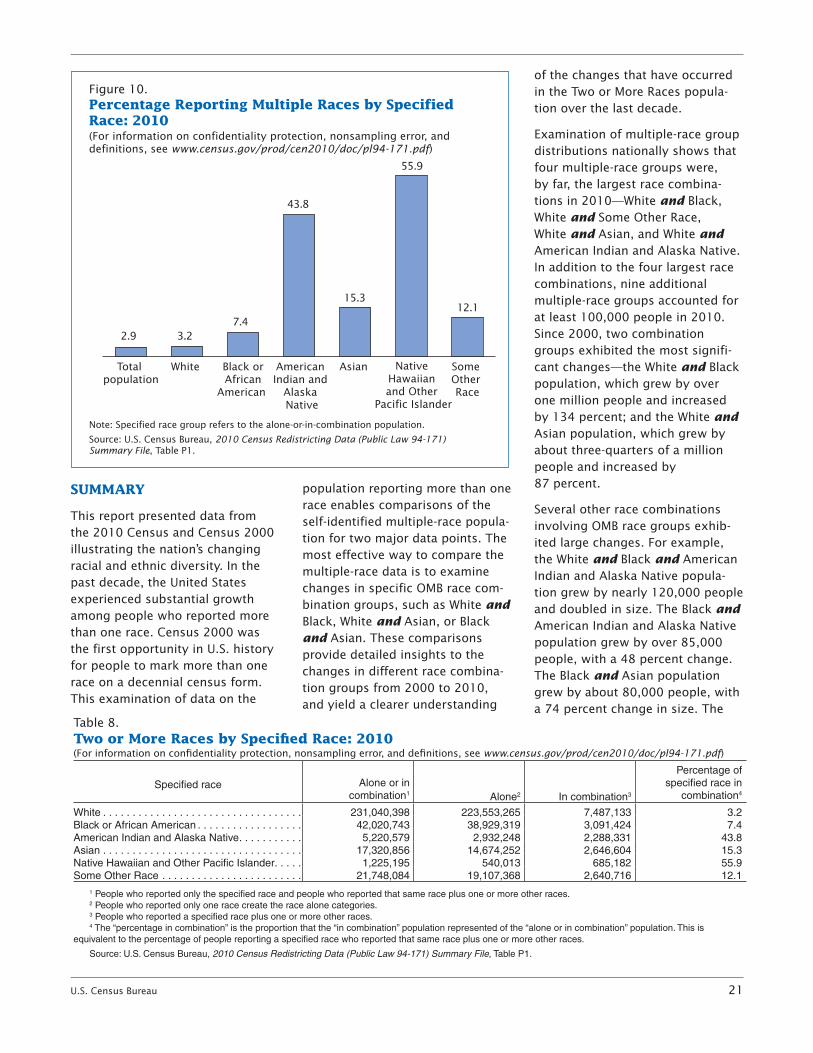
U.S. Census Bureau 21
SUMMARY
This report presented data from the 2010 Census and Census 2000 illustrating the nation’s changing racial and ethnic diversity. In the past decade, the United States experienced substantial growth among people who reported more than one race. Census 2000 was the first opportunity in U.S. history for people to mark more than one race on a decennial census form. This examination of data on the
population reporting more than one race enables comparisons of the self-identified multiple-race popula-tion for two major data points. The most effective way to compare the multiple-race data is to examine changes in specific OMB race com-bination groups, such as White and Black, White and Asian, or Black and Asian. These comparisons provide detailed insights to the changes in different race combina-tion groups from 2000 to 2010, and yield a clearer understanding
of the changes that have occurred in the Two or More Races popula-tion over the last decade.
Examination of multiple-race group distributions nationally shows that four multiple-race groups were, by far, the largest race combina-tions in 2010—White and Black, White and Some Other Race, White and Asian, and White and American Indian and Alaska Native. In addition to the four largest race combinations, nine additional multiple-race groups accounted for at least 100,000 people in 2010. Since 2000, two combination groups exhibited the most signifi-cant changes—the White and Black population, which grew by over one million people and increased by 134 percent; and the White and Asian population, which grew by about three-quarters of a million people and increased by 87 percent.
Several other race combinations involving OMB race groups exhib-ited large changes. For example, the White and Black and American Indian and Alaska Native popula-tion grew by nearly 120,000 people and doubled in size. The Black and American Indian and Alaska Native population grew by over 85,000 people, with a 48 percent change. The Black and Asian population grew by about 80,000 people, with a 74 percent change in size. The
Figure 10.Percentage Reporting Multiple Races by Specified Race: 2010
Note: Specified race group refers to the alone-or-in-combination population.
Source: U.S. Census Bureau, 2010 Census Redistricting Data (Public Law 94-171) Summary File, Table P1.
(For information on confidentiality protection, nonsampling error, and definitions, see www.census.gov/prod/cen2010/doc/pl94-171.pdf)
Some Other Race
Native Hawaiian and Other
Pacific Islander
Asian American Indian and
Alaska Native
Black or African
American
White Total population
2.9 3.27.4
43.8
15.312.1
55.9
Table 8.Two or More Races by Specified Race: 2010 (For information on confidentiality protection, nonsampling error, and definitions, see www.census.gov/prod/cen2010/doc/pl94-171.pdf)
Specified race Alone or in combination1 Alone2 In combination3
Percentage of specified race in
combination4
White . . . . . . . . . . . . . . . . . . . . . . . . . . . . . . . . . . 231,040,398 223,553,265 7,487,133 3 .2Black or African American . . . . . . . . . . . . . . . . . . 42,020,743 38,929,319 3,091,424 7 .4American Indian and Alaska Native . . . . . . . . . . . 5,220,579 2,932,248 2,288,331 43 .8Asian . . . . . . . . . . . . . . . . . . . . . . . . . . . . . . . . . . 17,320,856 14,674,252 2,646,604 15 .3Native Hawaiian and Other Pacific Islander . . . . . 1,225,195 540,013 685,182 55 .9Some Other Race . . . . . . . . . . . . . . . . . . . . . . . . 21,748,084 19,107,368 2,640,716 12 .1
1 People who reported only the specified race and people who reported that same race plus one or more other races .2 People who reported only one race create the race alone categories .3 People who reported a specified race plus one or more other races .4 The “percentage in combination” is the proportion that the “in combination” population represented of the “alone or in combination” population . This is
equivalent to the percentage of people reporting a specified race who reported that same race plus one or more other races .
Source: U .S . Census Bureau, 2010 Census Redistricting Data (Public Law 94-171) Summary File, Table P1 .
22 U.S. Census Bureau
White and Native Hawaiian and Other Pacific Islander population increased by nearly 60,000 people, with a 50 percent change. In addi-tion, the White and Asian and Native Hawaiian and Other Pacific Islander population increased by over 50,000 people, with a 60 percent change in size since 2000. By examining the changes in the specific race combination groups, we see that many multiple-race combinations increased in both number and proportion over the past decade.
Additional notable trends were presented in this report. Overall, people who reported more than one race were most likely to live in the West (38 percent) and the South (31 percent). Sixteen states had a multiple-race population of 200,000 or more people. Among
all states, nine had a 70 percent or greater increase in their multiple-race population since 2000, and the multiple-race population grew by 50 percent or more in twenty-two additional states. Thirteen states had larger proportions of people who reported multiple races than the national average of 2.9 percent, and unlike 2000, no states had less than 1.0 percent multiple-race reporting in 2010. More than half of counties across the country experienced a 50 percent increase or more among multiple-race respondents between 2000 and 2010.
Among the places with populations of 100,000 or more, the top five places in proportion of people who identified as multiple-race White, Black, American Indian and Alaska Native, Asian, or Native Hawaiian
and Other Pacific Islander were primarily in the West (20 places), followed by the Northeast (5 places), the South (4 places), and the Midwest (1 place).
Data from the 2010 Census and Census 2000 present information that enables the first comparisons on multiple-race combinations in the United States, yielding insights into how this population has grown and diversified over the past decade. Throughout the decade, the Census Bureau will release additional information on the Two or More Races population and its diverse multiple-race combination groups, which will provide more insights to the nation’s racial and ethnic diversity.
U.S. Census Bureau 23
ABOUT THE 2010 CENSUS
Why was the 2010 Census conducted?
The U.S. Constitution mandates that a census be taken in the United States every 10 years. This is required in order to determine the number of seats each state is to receive in the U.S. House of Representatives.
Why did the 2010 Census ask the question on race?
The Census Bureau collects data on race to fulfill a variety of legislative and program requirements. Data on race are used in the legislative redistricting process carried out by the states and in monitoring local jurisdictions’ compliance with the Voting Rights Act. More broadly, data on race are critical for research that underlies many policy deci-sions at all levels of government.
How do data from the question on race benefit me, my family, and my community?
All levels of government need infor-mation on race to implement and evaluate programs, or enforce laws, such as the Civil Rights Act, Voting Rights Act, Fair Housing Act, Equal Employment Opportunity Act, and the 2010 Census Redistricting Data Program.
Both public and private organiza-tions use race information to find areas where groups may need spe cial services and to plan and imple ment education, housing, health, and other programs that address these needs. For example, a school system might use this information to design cultural activities that reflect the diversity in their com munity, or a business could use it to select the mix of merchandise it will sell in a new store. Census information also helps identify areas where resi-dents might need services of par-ticular importance to certain racial or ethnic groups, such as screening for hypertension or diabetes.
FOR MORE INFORMATION
For more information on race in the United States, visit the Census Bureau’s Internet site at <www.census.gov/population /race>. Information on confiden-tiality protection, nonsampling error, and definitions is available at <www.census.gov/prod/cen2010 /doc/pl94-171.pdf>.
Data on race from the 2010 Census Redistricting Data (Public Law 94-171) Summary File were released on a state-by-state basis. The 2010 Census redistricting data are available on the Internet at <http://factfinder2.census.gov>.
For more information on specific race groups in the United States, go to <www.census.gov> and search for “Minority Links.” This Web page includes information about the 2010 Census and provides links to reports based on past censuses and surveys focusing on the social and economic characteristics of the Black or African American, American Indian and Alaska Native, Asian, and Native Hawaiian and Other Pacific Islander populations.
Information on other population and housing topics is presented in the 2010 Census Briefs series, located on the Census Bureau’s Web site at <www.census.gov/prod /cen2010>. This series presents information about race, Hispanic origin, age, sex, household type, and housing tenure.
For more information about the 2010 Census, including data prod-ucts, call the Customer Services Center at 1-800-923-8282. You can also visit the Census Bureau’s Question and Answer Center at <ask.census.gov> to submit your questions online.