Embed Size (px)
Citation preview
1
“The Transformation of Consumer buying habits in Suburban Area
in Western India”
A Research Paper submitted to the
The 10th International Marketing Trends Conference includes the Research Marketing Trends Congress Sessions and the Consumer Behavior Forum Sessions.
Krishna Mohan Sharma
Asst Professor,
Sinhgad Management School
Kondapuri, Pune -412101
Maharashtra, India
Mobile No: +91.9970923781
e-mail: [email protected]
Co-Author 1:-
Dr. Kunal Bhattacharya
Professor
Sinhgad Institute of Business Administration and Research (SIBAR)
40/4A Saswad Road, Kondhwa, Pune 411048
Maharashtra, India
Phone: +91.9922229600
e-mail: [email protected]
Co-Author 2:-
Dr. Virbhadra Mangnale
Director
SIBM, Kamlapur, Solapur University
Maharashtra, India
Phone: +91. 9881476717
e-mail: [email protected]
2
INDEX
SERIAL NUMBER PARTICULARS PAGE NO
1. Abstract 3
2. Key Words 3
3. Introduction 4
4. Objectives 6
5. Conceptual Framework 6
6. Literature Review 8
7. Research Model 10
8. Research Methodology 10
9. Findings 15
10. Discussion 17
11. Limitation of the Study 17
12. Conclusion 17
13. Further Research 18
14. Managerial Implications 18
15. Bibliography 18
16. Appendices 21
3
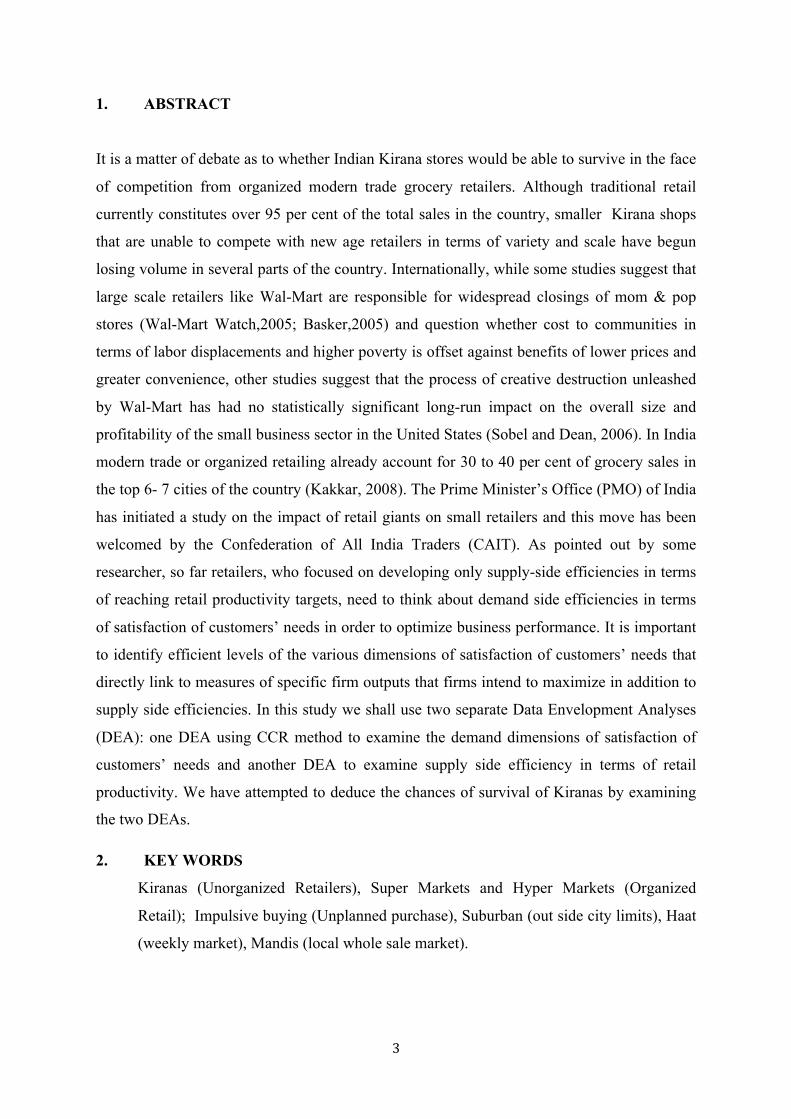
1. ABSTRACT
It is a matter of debate as to whether Indian Kirana stores would be able to survive in the face
of competition from organized modern trade grocery retailers. Although traditional retail
currently constitutes over 95 per cent of the total sales in the country, smaller Kirana shops
that are unable to compete with new age retailers in terms of variety and scale have begun
losing volume in several parts of the country. Internationally, while some studies suggest that
large scale retailers like Wal-Mart are responsible for widespread closings of mom & pop
stores (Wal-Mart Watch,2005; Basker,2005) and question whether cost to communities in
terms of labor displacements and higher poverty is offset against benefits of lower prices and
greater convenience, other studies suggest that the process of creative destruction unleashed
by Wal-Mart has had no statistically significant long-run impact on the overall size and
profitability of the small business sector in the United States (Sobel and Dean, 2006). In India
modern trade or organized retailing already account for 30 to 40 per cent of grocery sales in
the top 6- 7 cities of the country (Kakkar, 2008). The Prime Minister’s Office (PMO) of India
has initiated a study on the impact of retail giants on small retailers and this move has been
welcomed by the Confederation of All India Traders (CAIT). As pointed out by some
researcher, so far retailers, who focused on developing only supply-side efficiencies in terms
of reaching retail productivity targets, need to think about demand side efficiencies in terms
of satisfaction of customers’ needs in order to optimize business performance. It is important
to identify efficient levels of the various dimensions of satisfaction of customers’ needs that
directly link to measures of specific firm outputs that firms intend to maximize in addition to
supply side efficiencies. In this study we shall use two separate Data Envelopment Analyses
(DEA): one DEA using CCR method to examine the demand dimensions of satisfaction of
customers’ needs and another DEA to examine supply side efficiency in terms of retail
productivity. We have attempted to deduce the chances of survival of Kiranas by examining
the two DEAs.
2. KEY WORDS
Kiranas (Unorganized Retailers), Super Markets and Hyper Markets (Organized
Retail); Impulsive buying (Unplanned purchase), Suburban (out side city limits), Haat
(weekly market), Mandis (local whole sale market).
4
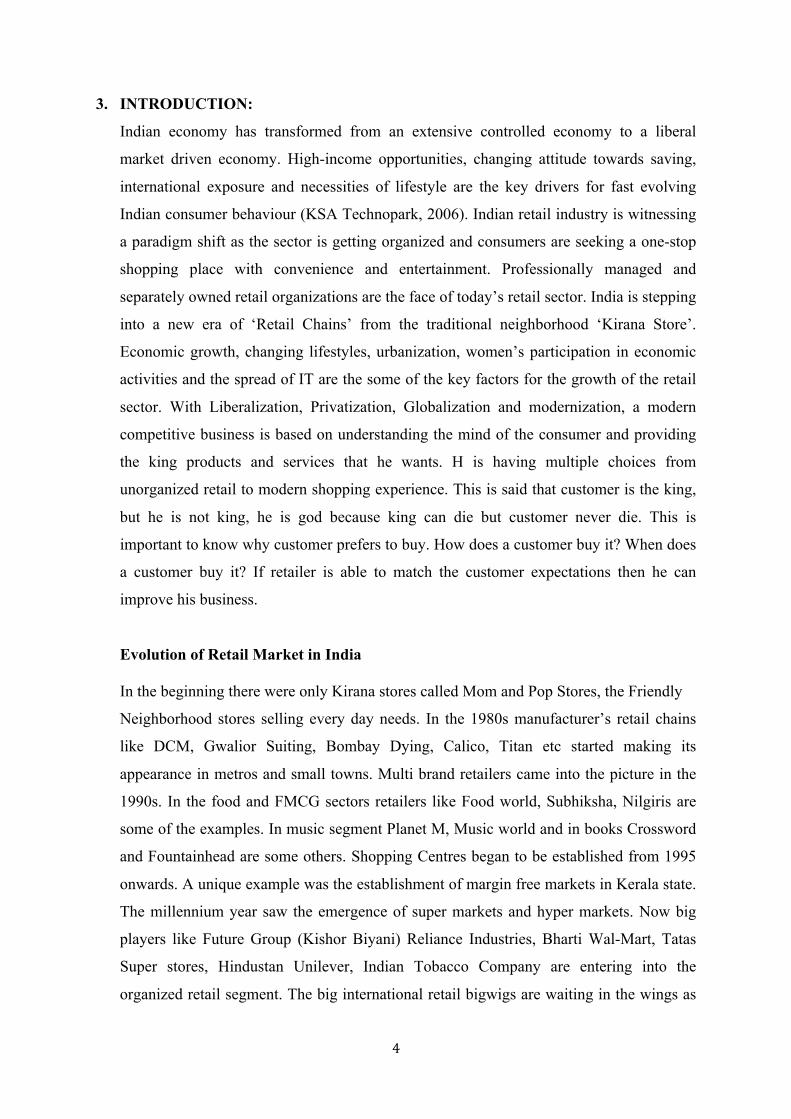
3. INTRODUCTION:
Indian economy has transformed from an extensive controlled economy to a liberal
market driven economy. High-income opportunities, changing attitude towards saving,
international exposure and necessities of lifestyle are the key drivers for fast evolving
Indian consumer behaviour (KSA Technopark, 2006). Indian retail industry is witnessing
a paradigm shift as the sector is getting organized and consumers are seeking a one-stop
shopping place with convenience and entertainment. Professionally managed and
separately owned retail organizations are the face of today’s retail sector. India is stepping
into a new era of ‘Retail Chains’ from the traditional neighborhood ‘Kirana Store’.
Economic growth, changing lifestyles, urbanization, women’s participation in economic
activities and the spread of IT are the some of the key factors for the growth of the retail
sector. With Liberalization, Privatization, Globalization and modernization, a modern
competitive business is based on understanding the mind of the consumer and providing
the king products and services that he wants. H is having multiple choices from
unorganized retail to modern shopping experience. This is said that customer is the king,
but he is not king, he is god because king can die but customer never die. This is
important to know why customer prefers to buy. How does a customer buy it? When does
a customer buy it? If retailer is able to match the customer expectations then he can
improve his business.
Evolution of Retail Market in India
In the beginning there were only Kirana stores called Mom and Pop Stores, the Friendly
Neighborhood stores selling every day needs. In the 1980s manufacturer’s retail chains
like DCM, Gwalior Suiting, Bombay Dying, Calico, Titan etc started making its
appearance in metros and small towns. Multi brand retailers came into the picture in the
1990s. In the food and FMCG sectors retailers like Food world, Subhiksha, Nilgiris are
some of the examples. In music segment Planet M, Music world and in books Crossword
and Fountainhead are some others. Shopping Centres began to be established from 1995
onwards. A unique example was the establishment of margin free markets in Kerala state.
The millennium year saw the emergence of super markets and hyper markets. Now big
players like Future Group (Kishor Biyani) Reliance Industries, Bharti Wal-Mart, Tatas
Super stores, Hindustan Unilever, Indian Tobacco Company are entering into the
organized retail segment. The big international retail bigwigs are waiting in the wings as
5
the present FDI guidelines do not allow them to own retail outlets in the country. Walmart
is testing the waters by agreeing to provide back end and logistic support to Bharti for
establishment of retail chains with a view to study the market for future entry when the
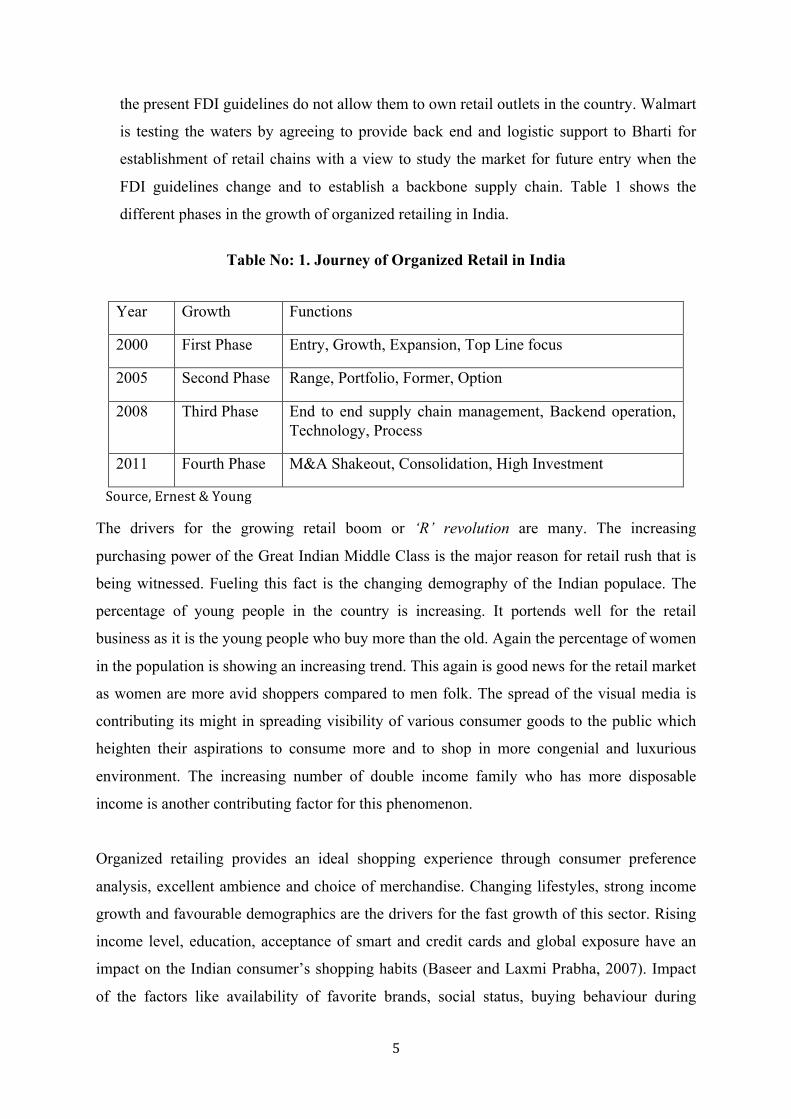
FDI guidelines change and to establish a backbone supply chain. Table 1 shows the
different phases in the growth of organized retailing in India.
Table No: 1. Journey of Organized Retail in India
Year Growth Functions
2000 First Phase Entry, Growth, Expansion, Top Line focus
2005 Second Phase Range, Portfolio, Former, Option
2008 Third Phase End to end supply chain management, Backend operation, Technology, Process
2011 Fourth Phase M&A Shakeout, Consolidation, High Investment
Source, Ernest & Young
The drivers for the growing retail boom or ‘R’ revolution are many. The increasing
purchasing power of the Great Indian Middle Class is the major reason for retail rush that is
being witnessed. Fueling this fact is the changing demography of the Indian populace. The
percentage of young people in the country is increasing. It portends well for the retail
business as it is the young people who buy more than the old. Again the percentage of women
in the population is showing an increasing trend. This again is good news for the retail market
as women are more avid shoppers compared to men folk. The spread of the visual media is
contributing its might in spreading visibility of various consumer goods to the public which
heighten their aspirations to consume more and to shop in more congenial and luxurious
environment. The increasing number of double income family who has more disposable
income is another contributing factor for this phenomenon.
Organized retailing provides an ideal shopping experience through consumer preference
analysis, excellent ambience and choice of merchandise. Changing lifestyles, strong income
growth and favourable demographics are the drivers for the fast growth of this sector. Rising
income level, education, acceptance of smart and credit cards and global exposure have an
impact on the Indian consumer’s shopping habits (Baseer and Laxmi Prabha, 2007). Impact
of the factors like availability of favorite brands, social status, buying behaviour during
6
discounts, influence of family and friends over the organized retail and unorganized retail..
The main objective of this research is to know the consumer perception towards organized
retail and unorganized retail while shopping.
This paper is an attempt to understand the changing consumer shopping behaviour from
unorganized retail to organized retail.
4. OBJECTIVES OF THE STUDY. Review of literature leads to the objectives of the
study and statement of problem to the Formulation of the hypothesis
a. To understand the consumer shopping behaviour dimensions.
b. To measure the significance of demographic variables on shopping behaviour.
c. To analyze the change in shopping pattern in semin urban population of Western
India.
d. To know the preferred shopping point.
e. To know the impact of organized retail on their wallet.
5. CONCEPTUAL FRAMEWORK OF THE TOPIC
Due to the growth of middle class and upper middle class segment in Indian economy
retail market is booming. Middle class ownership patterns and increasing disposable and
dual family income is the main cause for the growth of retail industry in Indian market.
Earlier in India traditional kirana shops were the main choice of buyers. Now due to socio
economical changes this study is an attempt to understand the changing consumer buying
behavior. The Indian market is currently witnessing a retail boom with organized retailers
offering a whole assortment of goods and services to consumers under one roof with
congenital shopping ambience. Retail business is the largest private industry, ahead even
of finance and engineering and contribute more than 10% to Indian GDP( Marketing
White Book, 2009-2010). India is having more than 12 million retail outlet and known as
country of shopkeepers. But as for as for as growth of organized retail is concerned, this
is comparatively very low in comparison to other country. For instance in US share of
organized retail is 85%, Taiwan 81%, Malaysia 55%, Thailand 40%, Indonesia 30%,
China 20% while in India this is just 5% ( Marketing White Book,2009-2010).
Actually, from the 1950s to 1980 Indian shoppers were used to shop at Haat, Mandis,
Melas and at small family run stores kirana shops. After liberalization, privatization and
7
globalization Indian government lifted the restrictions from private companies and Indian
economy slowly progressed from being state-led to market friendly. This was the
beginning of modern India. The growth of middle and higher middle class, growing trend
of call centers and BPO, increasing number o dual income nuclear families, convenience
of shopping from one place to another, reasonable pricing and a good place to pass the
time fuelled the growth of supermarket, hypermarkets and concepts of organized retailing
in India.
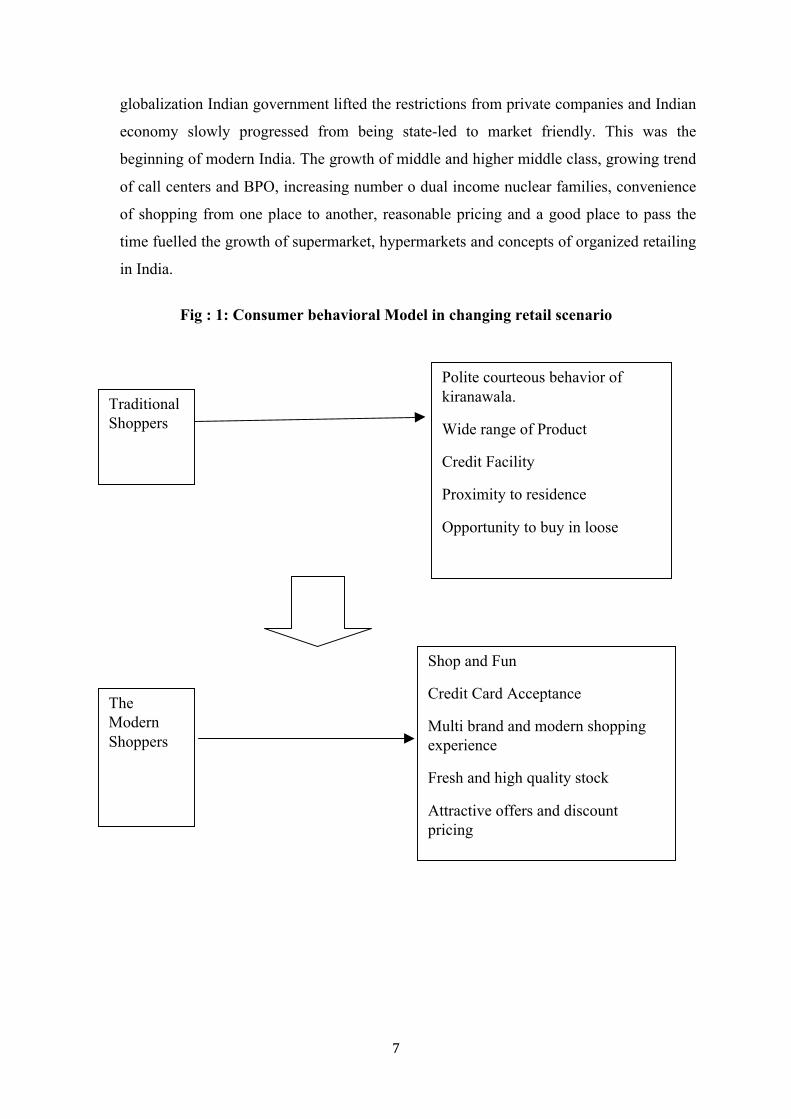
Fig : 1: Consumer behavioral Model in changing retail scenario
Traditional Shoppers
The Modern Shoppers
Polite courteous behavior of kiranawala.
Wide range of Product
Credit Facility
Proximity to residence
Opportunity to buy in loose
Shop and Fun
Credit Card Acceptance
Multi brand and modern shopping experience
Fresh and high quality stock
Attractive offers and discount pricing
8
6. LITERATURE REVIEW
As far as grocery store patronage is concerned, though early studies (Enis and Paul,
1970; Dunn and Wrigley, 1984) found loyalty to be a characteristic of poorer shoppers,
a recent study indicates significantly higher incomes and weekly expenditures of the
loyal Indian consumer’s shoppers (McGoldrick and Andre, 1997). Knox and Walker
(2003) confirmed the existence of a weak but significant relationship between
involvement and brand loyalty in grocery markets. Overall satisfaction with a store
does not significantly influence customers’ loyalty to that store and shoppers’ intention
to remain loyal to their ‘‘primary store’’ is influenced by factors like frequent-buyer
reward schemes, travel distance, preference for an in-store delicatessen, size of the
average grocery bill, store signage and the level of sale assistance (Miranda et al.,
2005). However, given that grocery shopping patterns vary with culture, Indian
grocery shoppers are required to be investigated separately to determine, which
grocery store attributes contribute to store patronage (Shanon and Mandhachitara,
2005). The store dimensions which are relevant for grocery store choice of customers
may now be investigated. Grocery industry is strongly driven by price competitiveness
(Taylor, 2003). ‘‘Credit’’ is a predictor of grocery shopping expenditures spent out of
the community and consumers spending a medium proportion of their grocery
expenditures out of a locality had the highest overall shopping expenditures in all
categories (Sullivanand Savitt, 1997). Product selection, assortment and courtesy of
personnel are also very important in determining format choice and cleanliness is the
most important attribute regardless of the format of grocery store (Carpenter and
Moore, 2006; Teller et al., 2006).In an earlier study by Solgaard and Hansen (2003),
assortment was found to be the single most important driver for the choice between
store formats; price level and distance also being important drivers for consumers’
choice between store formats; although quality and service were not found to be
differentiator between formats. Again, Singh and Powell (2002) found that grocery
shoppers consider quality to be most important, followed by price, locality, range of
products and parking. Fox et al. (2004) found that shopping and spending vary much
more across than within formats, and expenditures respond more to varying levels of
assortment and promotion than price, although price sensitivity was most evident at
grocers. While super center primary shoppers of food identified low price and
assortment more often as the reason for store choice, traditional supermarket primary
shoppers were less willing to trade off location convenience or, in some cases, quality
9
and assortment (Seiders et al., 2000). Chinese supermarket shoppers found store
location, price and product variety as the most important store attributes influencing
satisfaction (McDonald, 1991). In an investigation of consumer shopping destination
choice behavior for convenience goods shopping trips in Taiwan, spatial separation
distance best explained respondents’ shopping destination choice behavior, followed
by store selection criteria (Yang, 2006). A study in Vietnam on the factors which
influence decision-making by consumers when selecting traditional bazaars vs
supermarkets revealed that freshness, price and convenience are important in shaping
the choice by consumers for traditional outlets for fresh food, while price played a key
role in selecting shopping outlets for processed food and drinks and non-food
products(Maruyama and Trung, 2007). Hence, there is difference in the result of the
studies of different authors as far as relative importance of attributes are concerned,
which might be attributed to either changes in consumers over a period of time or to
the place of study as grocery shopping patterns vary with culture (Shanon and
Mandhachitara, 2005).Customers attach considerable importance to store location and
private labeling is found to be a store selection criterion of low importance for grocery
shoppers (Baltas and Papastathopoulou, 2003). Generally, national food brands were
perceived as superior to own labels in terms of quality, packaging, consistency and
good image (Omar, 1996).Customers can distinguish high-quality stores from low-
quality stores, large stores(associated with the great amounts of goods, special offers
and a lot of walking and searching) from small stores (associated with personal
attention, accessibility, nearness, high prices), hypermarkets from other retail formats,
stores where weekend purchases are made vs stores where only specific item/items are
bought (Uusitalo,2001). Consumers are not able to perceive an important difference
between home delivery and traditional grocery shopping (Teller et al., 2006). Older
consumers are very price-conscious, have different needs compared to younger grocery
shoppers, enjoy interactions more than younger consumers and prefer to shop in a store
where they can receive special-assistance services (Moschis et al., 2004). Most people
exhibit certain habits when they do their main trip to the supermarket and have a usual
day and a usual time of day to shop (East et al., 1994; Singh and Powell, 2002).
Seventy percent of shoppers visit grocery stores with random intervals and 30 per cent
with relatively fixed intervals and ‘‘routine’’ shoppers spend more dollars for a given
shopping trip but have difficulty in visiting grocery stores more often and in switching
stores (Kim and Park, 1997).
10
7. RESEARCH MODEL
The present study is focused on the shopping behaviour dimensions of consumers who visit
organized stores for food and grocery items. A convenient sampling method was used to
obtain the data from the three areas of Pimpri, Dehu Road and Thane A total of 600
questionnaires were distributed; out of which 500 filled questionnaire were received. While
conducting the survey due care was taken to include respondents from different walks of life,
i.e., gender, educational background, occupation, age group, income level, etc.
Hypothesis:
H1: There significant relationship in consumer buying behaviour and attractive offers of
organized retail.
H2: There is significant relationship between age and no of visit to organized retail.
H3: There is significant relationship between visit and income pattern at organized retail.
8. RESEARCH METHODOLOGY. The methodology which is used for carrying out
the research is as follows:
Research Design: The study is related to changing buying behaviour of consumers in
organized retail as well as in un-organised retail in select area of suburb of western India. The
studies made to know the changing buying behaviour of consumers. The data related to study
is collected through structured questionnaires from customers who were visiting organized
retail as well as unorganized retail (Mom and Pop stores). The study includes 3 months
period from February 2010 to April 2010. The data is collected from approx 500 respondents
and for analyzing the data percentage methods, chi square tests and other statistical tools
related to data are used.
Data Collection Method: The data is collected through structured questionnaires from
customers who are visiting organized retail as well as unorganized retail by using multistage-
convenience method. This is like cluster sampling, but with several stages of sampling and
sub-sampling. This method is usually used in large-scale population surveys. For research
work primary as well as secondary data were used for collection of information. Research
was broadly classified into two sections. First part was detailed study of various HR policy
formulation & its implications and Second part were how these strategy have affected
employees of various categories of IT industry i.e. employees, management and society.
11
Primary data:-
The primary data were collected by direct interaction with individuals on a one to one basis.
The benefits of these approaches include richness of data and deeper insight into the
phenomena under study. Primary data collection has been through interviewing and
questionnaires to all types of target samples (urban and rural,) also on the basis of
questionnaire and observing the socio-economic, living and working aspects of the sample in
their behavioral pattern. The data were also collected through discussion with samples and
experts from this field. The main methods of collecting data thus are a combination of
questionnaire and interview.
Secondary data:-
Secondary data has been collected through a wide range of written materials. e.g. to
understand the philosophy of consumer behaviour. These include research papers, articles in
various magazines and journals, annual reports of the Govt of India, etc. Other sources used
for collecting data are downloads from companies’ websites, newspaper reports, technical
and trade journal, books, magazines. The remaining statistical part of this study is derived
from secondary sources like the publications of the Registrar, Census of India, Government
of India, New Delhi; Commerce Ministry, Government of India, Indian Council for
Research on International Economic Relations (ICRIER), retail report 2008, Government
of India, Marketing white Book 2009-2010, National Sampling survey and Internet etc.
RESEARCH INSTRUMENTS
Questionnaire:-
In order to collect primary data to structured, exhaustive and descriptive (free end)
questionnaires were designed. The same questions were asked to all Type of subjects which
cover all areas of consumer buying behaviour and motives.
Specific information and open ended questions for general information is used. Proper care is
taken for sequencing the questions and ambiguous questions are avoided after pilot survey.
Individual interviews:-
Semi structured and unstructured interview method has been used. Semi structured
(sometimes referred to as focused interviews) involve a series of open ended questions based
on the topic area sent in advance which the researches wants to cover.
Unstructured Interviews are a method of interviews where questions can be changed or
adapted to meet the respondent's intelligence, understanding or belief. Unlike a structured
12
interview they do not offer a limited, pre-set range of answers for a respondent to choose, but
instead advocate listening to how each individual person responds to the question.
Observation and Discussion methods:
Observation as a technique has been used to validate data provided in face to face encounters.
Out of various techniques of Data collection available through observation written
description has been adopted by making notes of what has been observed.
Data Analysis:
The study was carried out basically in three suburban areas of western India. The research
field work was carried out considering Thane near Mumbai (92 persons) and Dehu Road,
(122 respondents) and Pimpri (respondent 286) near Pune.
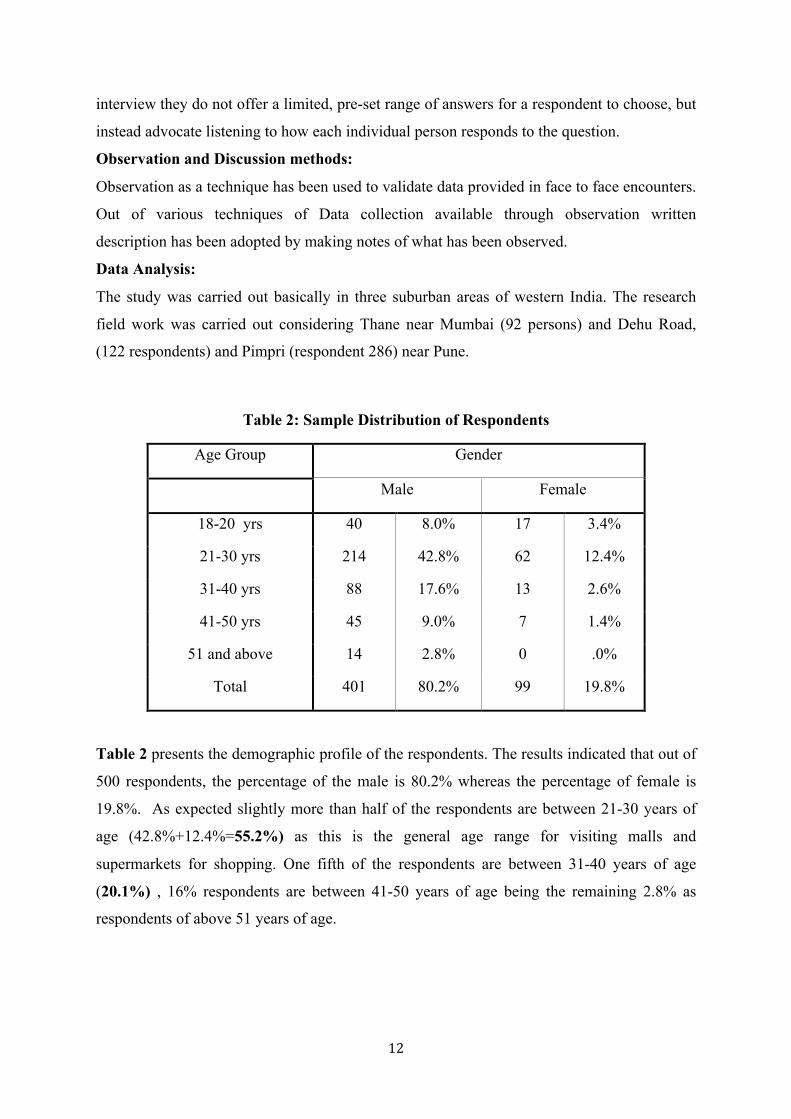
Table 2: Sample Distribution of Respondents
Age Group Gender
Male Female
18-20 yrs 40 8.0% 17 3.4%
21-30 yrs 214 42.8% 62 12.4%
31-40 yrs 88 17.6% 13 2.6%
41-50 yrs 45 9.0% 7 1.4%
51 and above 14 2.8% 0 .0%
Total 401 80.2% 99 19.8%
Table 2 presents the demographic profile of the respondents. The results indicated that out of
500 respondents, the percentage of the male is 80.2% whereas the percentage of female is
19.8%. As expected slightly more than half of the respondents are between 21-30 years of
age (42.8%+12.4%=55.2%) as this is the general age range for visiting malls and
supermarkets for shopping. One fifth of the respondents are between 31-40 years of age
(20.1%) , 16% respondents are between 41-50 years of age being the remaining 2.8% as
respondents of above 51 years of age.
13
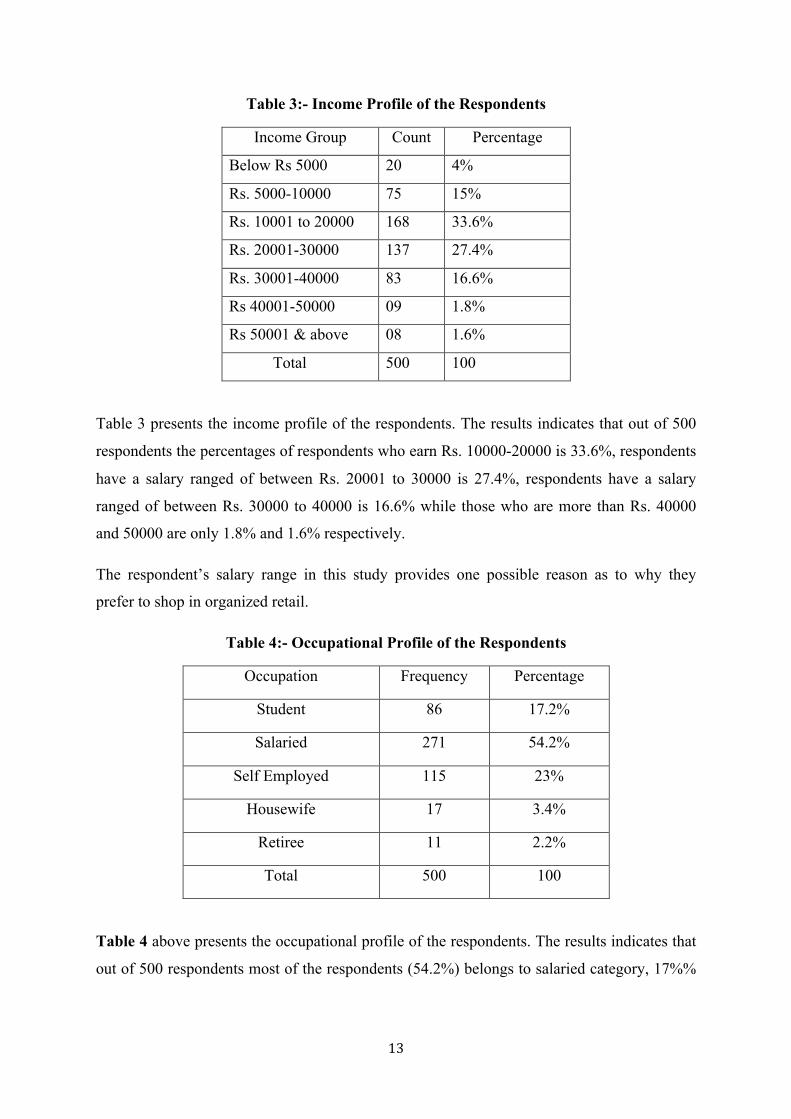
Table 3:- Income Profile of the Respondents
Income Group Count Percentage
Below Rs 5000 20 4%
Rs. 5000-10000 75 15%
Rs. 10001 to 20000 168 33.6%
Rs. 20001-30000 137 27.4%
Rs. 30001-40000 83 16.6%
Rs 40001-50000 09 1.8%
Rs 50001 & above 08 1.6%
Total 500 100
Table 3 presents the income profile of the respondents. The results indicates that out of 500
respondents the percentages of respondents who earn Rs. 10000-20000 is 33.6%, respondents
have a salary ranged of between Rs. 20001 to 30000 is 27.4%, respondents have a salary
ranged of between Rs. 30000 to 40000 is 16.6% while those who are more than Rs. 40000
and 50000 are only 1.8% and 1.6% respectively.
The respondent’s salary range in this study provides one possible reason as to why they
prefer to shop in organized retail.
Table 4:- Occupational Profile of the Respondents
Occupation Frequency Percentage
Student 86 17.2%
Salaried 271 54.2%
Self Employed 115 23%
Housewife 17 3.4%
Retiree 11 2.2%
Total 500 100
Table 4 above presents the occupational profile of the respondents. The results indicates that
out of 500 respondents most of the respondents (54.2%) belongs to salaried category, 17%%
14
were student, 23% were self employed while 3.4% and 2.2% were housewife and retiree
respectively.
Sampling Design: In this study multistage- convenience sampling method is used. This is
like cluster sampling, but with several stages of sampling and sub-sampling. This method is
usually used in large-scale population surveys.
a. The process of selection is based on chance as the consumers coming out of the Mall/
Super Store.
b. The study is of exploratory nature - it aims at having a feel of the issue or problems under
study. There are many inputs from the samples which were not included in the questionnaires
prepared for the research.
c. There are pressing time constraints that prohibit adopting other sampling technique.
d. The merits are - simplicity, convenience, low cost.
The Sampling Technique:
Multi Stage Convenient Sampling Technique: - Convenience sampling means a sample is
drawn on the basis of opportunity. For example, the sample includes customers attending an
organized retail.
Reasons for considering Multi stage Convenient Sampling:
a. This sampling scheme is very easy and convenient to operate.
b. Low cost of selection and low cost of fieldwork.
c. This method overcomes the chief hurdle of random sampling viz, giving unequal
representation. Here unequal representation implies that certain parts of the
populations may be better represented than others in the sample.
d. When the sample size is too large, it is always better to select a convenient
sampling and select few people from whole. The method is useful in gaining an
initial insight into the nature of the problem or for hypothesis formulation. The
chief merit of this method is that the manner of picking up items from whole
stratum is purely according to random sampling principles.
Data Analysis Procedure used: The data collected through structured questionnaires and
filtered in required manners tabulated and while anlysing the data proper coding de-coding as
per requirement of data were used. Statistical software SPSS, ver-16 is used and percentage
method, pie chart, chi square test are used for hypothesis testing.
15
Contact method.
All sample units were personally contacted & interview technique was used for collection of
information.
Reference Period:
The survey of sample design population was under taken during the period from Feb -2010 to
Apr 2010.
9. FINDINGS
a. As expected slightly more than half of the respondents are between 21-30 years of age
(55.2%) as this is the general age range for visiting malls and supermarkets for
shopping. Market is dominated by young population.
b. Regarding the personal profile of consumers, 80.2% are male shoppers and 19.2% are
female shoppers.The results indicates that out of 500 respondents the percentages of
respondents who earn `. 10,000-20,000 is 33.6%, respondents have a salary ranged of
between `. 20001 to 30000 is 27.4%, respondents have a salary ranged of between `..
30000 to 40000 is 16.6% while those who are more than `.. 40000 and 50000 are only
1.8% and 1.6% respectively. This is observed that majority of shoppers are from Rs.
10000 to 30000 household income profile.
c. There is a major change in the shopping frequency of salaried customers, salaried
categories have been changed (13.4%) their shopping pattern and prefer to shop
weekly (22.4%) and fortnightly basis (15%). No major changes have been reported
from retiree and housewife category.
d. There is a drastic change in the daily shopping pattern of Pimpri area consumers.
Earlier 32.16% % consumers were visiting unorganized retail often more than once a
day but after opening of supermarkets in the locality, now only 8.74% consumer
follow this trend. Similarly 37.06%% consumers were visiting at least once a day
(earlier) and now only 15.73% follow this pattern.
e. As for as daily visit is concerned consumers prefer to visit daily to buy perishable
(FMCG) product (Milk/biscuits/butter) and any reduction in shopping pattern may
affect sales of perishable nature product( FMCG) of unorganized retailers.
f. There is a negligible rise of such customers (1.74%) who have been stopped buying
from unorganized retail outlets after opening of super market and malls in the locality.
16
g. Dehu Road market is suburb of Pune and 4 K.M away from the area where organized
retail are in operation. Now in comparison to earlier frequency (32.78%), only 8.19%
customers visit to retailers often more than once a day, 19.67% at least one a day.
Thus, there is decline in the daily visit pattern of shoppers at unorganized retail
outlets.
h. Now, there is a almost 50% rise in such category of customers who were not visiting
unorganized retail weekly basis and 17% rise on monthly buyers .
i. There is almost negligible rise (1.60%) of such customers who have stopped buying
from unorganized retail outlets in Dehu Market.
j. There is 13.04% decline Pune city shoppers who were visiting unorganized retail
outlet often more than once a day, 14.14% decline in daily shopper’s category.
k. There is a major change (14.13%) in fortnightly shopping behavior while there is an
only 5.43% rise in monthly shopper’s category after opening of super markets and
malls in their locality.
l. There is an 8% and respectively 5% decline in daily visit frequency of Middle
Income Group (Rs.10000-20000) and Higher Middle Income Group (Rs.20001-
30000).
m. No major changes have been reported by higher income group customers from the
bracket of Rs.30000-50000 and above income group.
n. Table No.10 (Appendix) indicates that 76.92% consumers from Pimpri area, 94.26%
from Dehu Road while 59.7% from Thane prefer to shop unorganized retail for their
day to day needs.
p. Fig. No. 6 (Appendix) indicates that majority of customers reported that shopping in
organized retail (supermarket/malls/Department Stores) increases the average
expenditure pattern on their wallet
Findings from Hypothesis:
Hypothesis 1: The null hypothesis is rejected. There is significant relationship exists
between attractive offers of organized retail and consumer buying behaviour.
Hypothesis 2: The null rejected. There is a significant relationship between age group and
visit pattern.
Hypothesis 3: The null hypothesis is accepted. There is a significant relationship between
income group and visit pattern at organized retail.
17
10. DISCUSSION
a. There are many players in the retail market-with different promotional schemes and
facilities. In the face of so many options, the choice of appropriate retail stores
becomes an important topic for the customers.
b. With the buying of a product, the customers also want to satisfy their unstated needs.
Once the customers are satisfied with the unstated needs in the retail malls, then there
is the possibility of revisit.
c. Prior to opening of organized retail in the vicinity of unorganized retailers customers
were used to buy their stuff from kirana only but due to liberalization, privatization
and globalization there are multiple options in the hand of customers to satisfy their
wants and needs.
d. Customers are shifting their shopping pattern from unorganized retail to organized
retail due to various factors such as due to economical improvement and increased
disposable income, payment option (Credit Card), cleanliness, variety and fun during
shopping at organized retail.
11. SCOPE AND LIMITATIONS OF THE STUDY
a. The study is limited to suburban area of two metropolitan cities in Western
India namely Mumbai and Pune.
b. Due to the Time constraint of the research team the sample size was limited to
500 only. A larger sample size would give more accurate result.
c. The sample mostly carried out was in the evening time when the maximum
people were coming. If we could collect data during other time the findings
might be different.
d. There were only 8 people in the research team. A larger team would have
brought better data.
12. CONCLUSION: This is observed there is tremendous changes in consumer buying
behaviour after arrival of organize retail in their vicinity. Attractive offers of the
organized retail and availability of multiproduct under one roof at attractive price always
instigate and motivate to buy from organized retail. Majority of customers have shifted
their partly purchase from un-organized retail (Mom and Pop) to organized retail. But as
18
far as day to day purchase is concern Indian consumers still prefer to buy from
Traditional retail outlet in their locality.
Gen Y (age group of 21 to 30) and Gen X (age group 31-40) are the major consumer size
prefers to visit organized retail. It has also been seen the big spenders in organized retail
are the huge Indian middle class, which is more than many western countries total
population.
13. FURTHER SCOPE OF RESEARCH
a. A similar research can be carried out in other parts of the region as well as other
parts of the country.
b. This research is specially concern especially in the food an grocery segment of the
retailing. There are enough scope in other segments like apparels, electronics,
jewellery, consumer durables etc.
c. This study can be carried out in the rural segments as well.
14. MANGERIAL IMPLICATIONS
The findings of research are helpful for all practicing Managers and all those who are
in research for understanding the changing buying behavior of consumers. To
understand the consumer buying behavior is very important for formation of any kind
of marketing strategy and implementation of sales promotion schemes for enhancing
the overall sales volume of the company.
Bibliography
1. Baseer, A. and Laxmi Prabha, G. (2007). “Prospects and Problems of Indian
Retailing,” IndianJournal of Marketing, 37(10), 26–8.
2. Baltas, G. and Papastathopoulou, P. (2003), ‘‘Shopper characteristics, product and
store choice criteria: a survey in the Greek grocery sector’’, International Journal of
Retail and Distribution Management, Vol. 31 No. 10, pp. 498-507.
3. Bureau (2007a), ‘‘Wal-Mart may ink MoU with Bharti during CEO’s visit’’, The
Economic Times, Kolkata edition, 14 February, p. 15.
4. Carpenter, J.M. and Moore, M. (2006), ‘‘Consumer demographics, store attributes,
and retailformat choice in the US grocery market’’, International Journal of Retail and
Distribution Management, Vol. 34 No. 6, pp. 434-52.
19
5. Dunn, R. and Wrigley, N. (1984), ‘‘Store loyalty for grocery products: an empirical
study’’, Area,Vol. 16 No. 4, pp. 307-14.
6. East, R., Lomax, W., Willson, G. and Harris, P. (1994), ‘‘Decision-making and habit
in shopping times’’, European Journal of Marketing, Vol. 28 No. 4, pp. 56-71.
7. Enis B.M. and Paul, G.W. (1970), ‘‘Store loyalty’ as a basis for market
segmentation’’, Journal of Retailing, Vol. 46 No. 3, pp. 42-56.
8. Ghosal, R. (2008), ‘‘Kiranas at the crossroads’’, Images Retail, Vol. 7 No. 4, April,
pp. 68-80.
9. Goswami P., Mishra M.S. (2009) (to be published), ‘Would Indian Consumers move
from Kirana Stores to Organized Retailers when Shopping for Groceries?’, Asia-
Pacific Journal of Marketing and Logistics,2008
10. Gulati, A. and Reardon, T. (2007), ‘‘For a less painful path towards retail
revolution’’, The Economic Times, 22 June 2007,
11. Iyer, Easwar S. (2009), “Unplanned Purchasing: Knowledge of Shopping
Environment and Time Pressure,” Journal of Retailing, 65 (1), Spring, 40-57.
12. Kakkar, S. (2008), ‘‘The future of kirana stores and implications for national brands’’,
9thMarketing and Retail Conclave, Organized by Technopak, 19-21 February, The
Taj Palace, New Delhi.
13. Knox, S. and Walker, D. (2003), ‘‘Empirical developments in the measurement of
involvement, brand loyalty and their relationship in grocery markets’’, Journal of
Strategic Marketing, Vol. 11, pp. 271-86.
14. Kim, B. and Park, K. (1997), ‘‘Studying patterns of consumer’s grocery shopping
trip’, Journal of Retailing, Vol. 73 No. 4, pp. 501-17.
15. McGoldrick, P.J. and Andre, E. (1997), ‘‘Consumer misbehavior: promiscuity or
loyalty in grocery shopping’’, Journal of Retailing and Consumer Services, Vol. 4,
No. 2, pp. 73-81.
16. Maruyama, M. and Trung, L.V. (2007), ‘‘Traditional bazaar or supermarkets: a profit
analysis of affluent consumer perceptions in Hanoi’’, The International Review of
Retail, Distribution and Consumer Research, Vol. 17 No. 3, July, pp. 233-52.
20
17. McDonald, G.M. (1991); ‘‘The influence of supermarket attributes on perceived
customer satisfaction: an East Asian study’’, The International Review of Retail,
Distribution and Consumer Research, Vol. 1 No. 3, April, pp. 315-27.
18. Miranda, M.J., Ko´nya, L. and Havrila, I. (2005), ‘‘Shoppers’ satisfaction levels are
not the only key to store loyalty’’, Marketing Intelligence and Planning, Vol. 23 No.
2, pp. 220-32.
19. Shanon, R. and Mandhachitara, R. (2005), ‘‘Private-label grocery shopping attitudes
and behavior: a cross-cultural study’’, Brand Management, Vol. 12 No. 6, August, pp.
461-74.
20. Singh, S. and Powell, J. (2002), ‘‘Shopping from dusk ‘til dawn’’’, Marketing Week,
9 May.
21. Sullivan, P. and Savitt, R. (1997), ‘‘Store patronage and lifestyle factors: implications
for rural grocery retailers’’, International Journal of Retail and Distribution
Management, Vol. 25No. 11, pp. 351-64.
22. Tarun, K.S. and Chopra, S.L. (2007), ‘‘Beyond the retail hype’’, Indian Management,
Vol. 46 No.1, January, pp. 12-27.Taylor, R. (2003), ‘‘Top of mind: saving America’s
grocers’’, Brandweek, Vol. 44 No.18, pp. 22-3.
23. Teller, C., Kotzab, H. and Grant, D.B. (2006), ‘‘The consumer direct services
revolution in grocery retailing: an exploratory investigation’’, Managing Service
Quality, Vol. 16 No. 1, pp. 78-96.
24. Uusitalo, O. (2001), ‘‘Consumer perceptions of grocery retail formats and brands’’,
International Journal of Retail and Distribution Management, Vol. 29 No. 5, pp. 214-
25.
25. Yang, H.W. (2006), ‘‘An exploratory study of consumers’ convenience goods
shopping behavior – a case of Tainan Urban Area, Taiwan’’, Asia Pacific
Management Conference XII,
Theses and dissertations
1. Alawi, H. (1986), ‘‘Saudi Arabia: making sense of self-service’’, International Marketing
Review,Vol. 3 No. 1, Spring, pp. 21-38.
2. Sue Eccles, Women and Addictive Consumption in the UK, PhD thesis, Marketing, 2000,
Lancaster University:
21
3. Stefanos Mouzas, Development of Manufacturer-Retailer Networks, Lancaster
University Management Dept, 1999
4. Helen Woodruff-Burton, "Retail Therapy": An Investigation of Compensatory
Consumption and Shopping Behaviour, Lancaster University, UK, 2001.
Appendix
Consumer Survey Result
The purpose of the research is to understand the behavior of consumers and benefits to
consumers in shopping at organized vs. unorganized retail outlets. The consumers, who shop
in general stores, departmental stores, shopping malls, small retail outlets etc, in the area of
PCMC, Dehu Road and Thane suburban town near Mumbai, were taken as the population for
this study.
A convenient sample of 500 consumers was pooled up for the current study in which
respondents were requested to complete the questionnaire on voluntary basis. The customers
who were coming out after shopping from Malls (Exit customers) were interviewed through
structured questionnaire. Study covers 286 respondents from Pimpri area, 122 from Dehu
Road and 92 respondents from Thane city where organized and unorganized retails are in
operation.
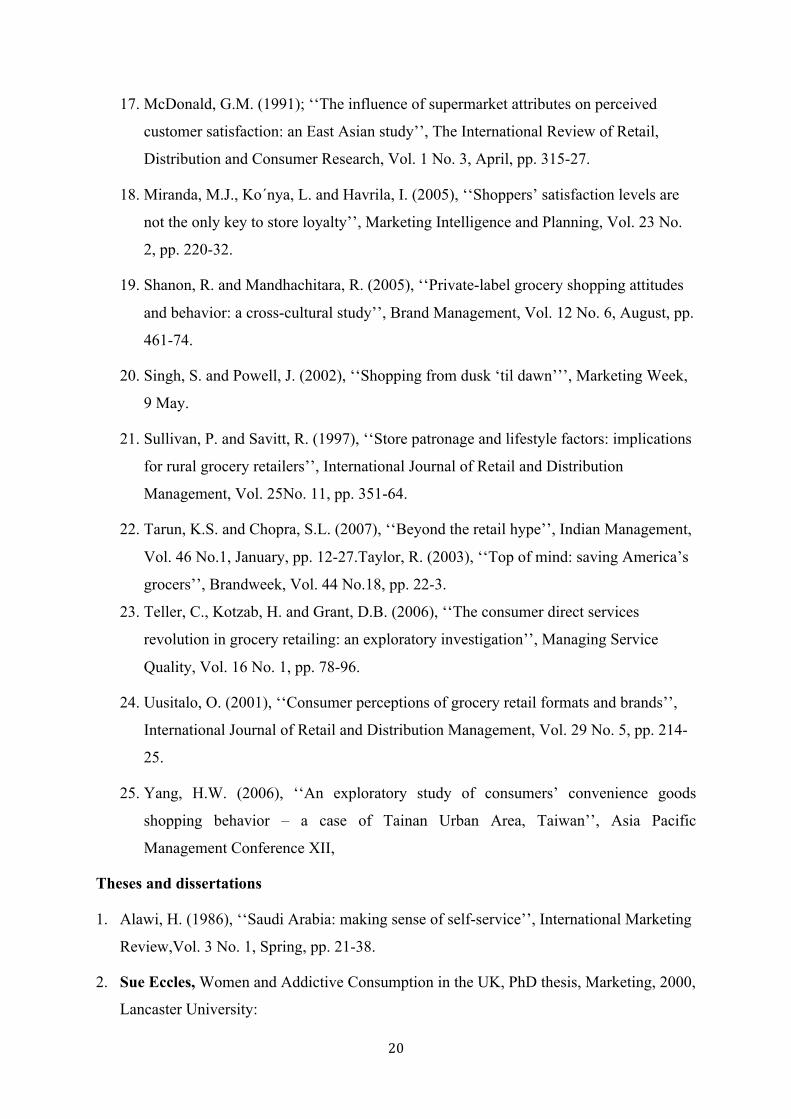
Table 5:- Analysis of change in shopping pattern on the basis of Occupation
Visit habits Student Salaried Self Employed Housewife Retiree Earlier Now Earlier Now Earlier Now Earlier Now Earlier Now Often more than once a day 5.4 2.2% 17.4 4% 6.6% 2% 1% 0.4% 0.2% 0.2% At least once a day 7.2% 3.4% 15.8% 7.6% 8.6% 3.4% 1.4% 0.6% 1.4% 1.0% Once or twice a week 2.4% 4.4% 14.8% 22.4% 5.6% 8.6% 0.6% 0.8% 0.4% 0.4% Once a fortnight 1.4 6.2% 4% 15% 1.0% 6.2% 0.4% 1% 0.2% 0.4% Once in a month 0.8% 0.8% 2% 3.6% 1.2% 2.4% 0.0% 0.6% 0.0% 0.2% Not at all - 0.2% - 1.6% - 0.4%
22
Table 5 shows relationship between occupation and visit pattern of respondents. Respondents
who were shopping often more than once a day and belongs from salaried categories have
been changed (13.4%) been changed their shopping pattern and prefer to shop weekly
(22.4%) and fortnightly basis (15%).
Respondents who were self employed and were visiting often more than once a day also
registered a change (4.6%) in their visit pattern and shifted their shopping pattern towards
weekly and fortnightly basis.
As far as housewife and retiree are concerned they did not registered any major changes in
their visit pattern. Any change in daily shopping pattern of shoppers definitely affects to daily
turnover of retailers and create financial crisis for him.
Table-6:- Analysis of Income and Age Group
Age Group 18-20 yrs 21-30 31-40 41-50 yrs 51 and above
Monthly Household Income (Rs.) Count
Table N % Count
Table N % Count
Table N % Count
Table N % Count
Table N %
Below Rs. 5000
6 1.2% 8 1.6% 3 0.6% 0 0.0% 1 0.2%
Rs 5000-10000
15 3.0% 41 8.2% 11 2.2% 6 1.2% 2 0.4%
Rs, 10001 to 20000
21 4.2% 102 20.4% 27 5.4% 13 2.6% 5 1.0%
Rs. 20001 -30000
10 2.0% 74 14.8% 34 6.8% 19 3.8% 0 0.0%
Rs. 30001-40000
2 0.4% 39 7.8% 24 4.8% 13 2.6% 5 1.0%
Rs 40001-50000
1 0.2% 6 1.2% 0 0.0% 1 0.2% 1 0.2%
Rs. 50001 & above
1 0.2% 4 0.8% 2 0.4% 0 0.0% 0 0.0%
Total 57 11.4% 275 55.1% 101 20.2% 52 10.4% 14 2.8%
23
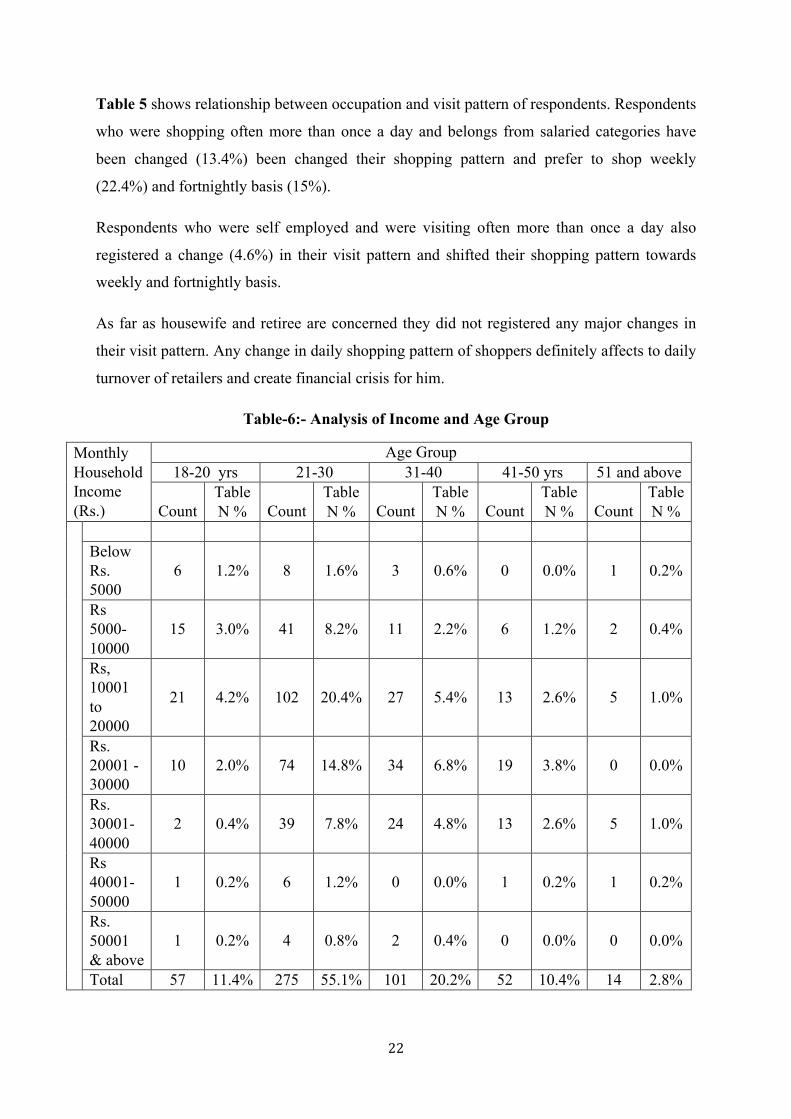
Table 6 shows the relationship between age group and income of the respondents. As data
indicates that there is major contribution of respondents from the age group of 21-30 that is
55.1%. Respondents who are in the age group of 31-40 and active earning members
contribute 20.2%. Respondents from 18-20 are 11.4%. Contribution from higher age group
from 41-50 is 10.4% and 51 & above is only 2.8%..
The growth of the earning middle and higher middle class, which demands value for money,
has led to a lot of changes on the retail front. The increase in household’s income also led to a
change in the spending patterns across retailing. The discretionary spending power in the
hands of this group makes a very big impact on the ability to spend. Their level of aspirations
is also higher from the older generations due to higher income in comparison to older
generation.
Table 7: Location wise Analysis of consumers
Location Respondents Percentage
Pimpri 286 57.2%
Dehu Road 122 24.4%
Thane 92 18.4%
Total 500 100
Source: Primary Data
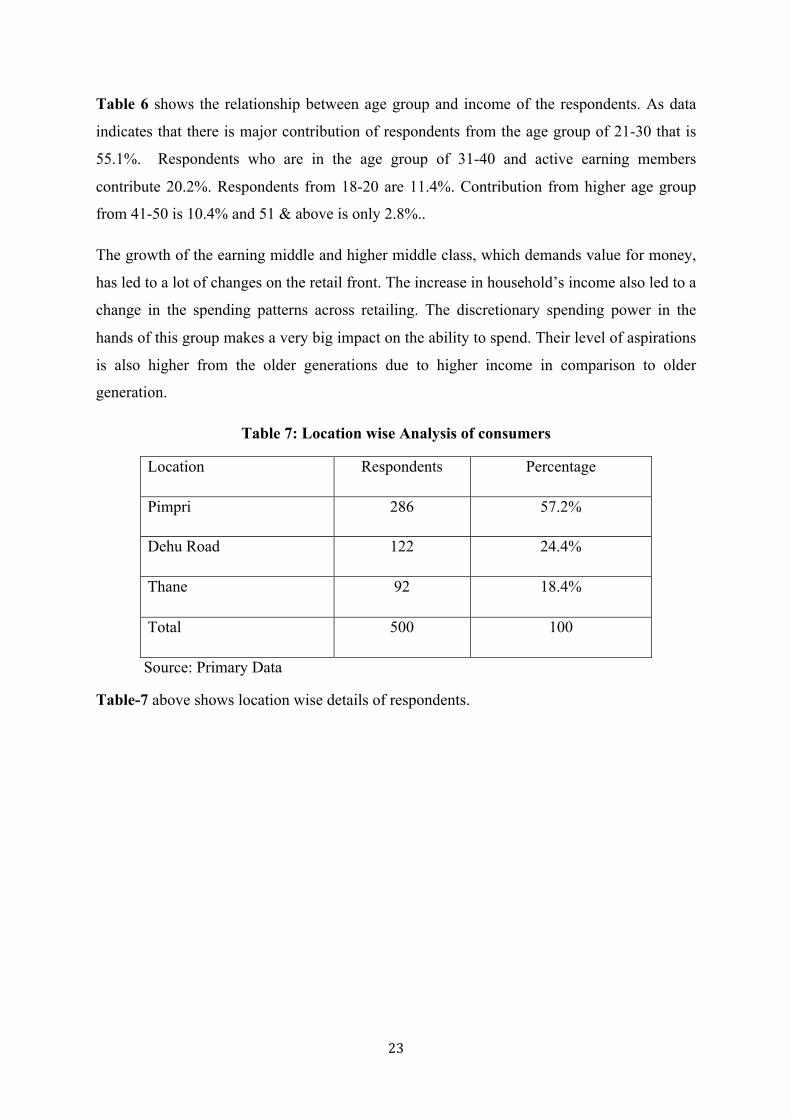
Table-7 above shows location wise details of respondents.
24
Figure No.2: Comparative Visit Frequency Analysis (Earlier and Now),
Pimpri Area Sample Size= 286
Source: Primary Data
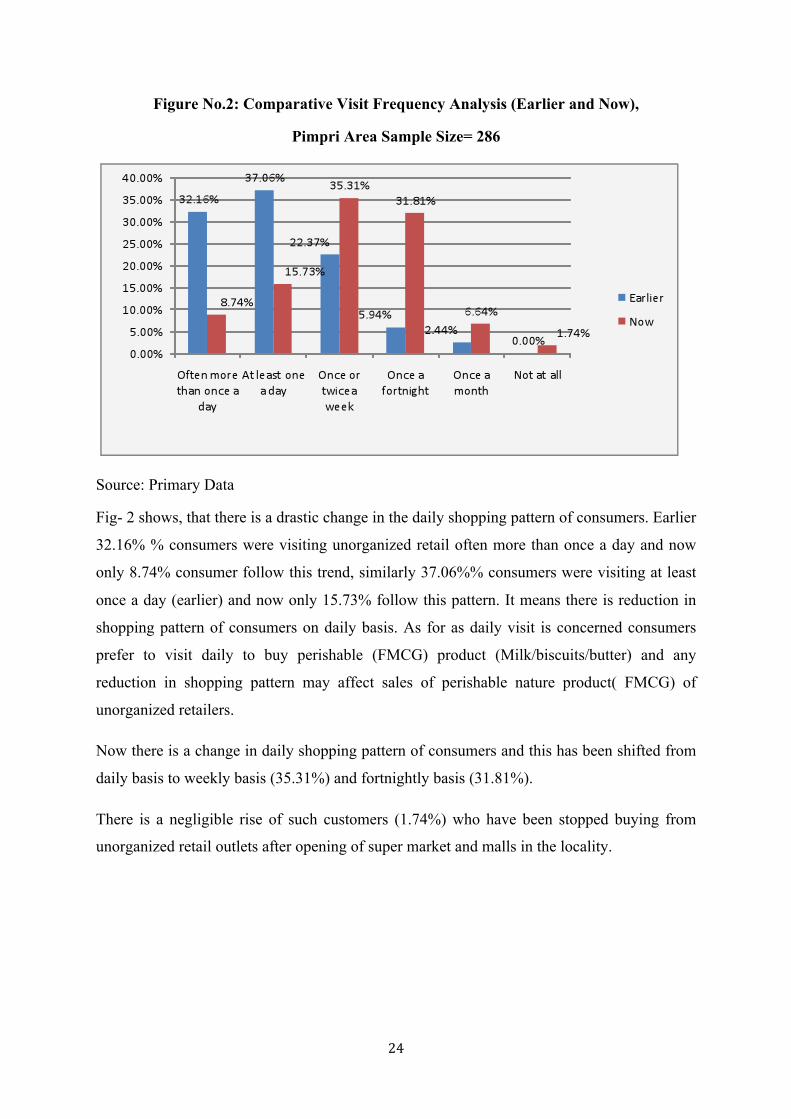
Fig- 2 shows, that there is a drastic change in the daily shopping pattern of consumers. Earlier
32.16% % consumers were visiting unorganized retail often more than once a day and now
only 8.74% consumer follow this trend, similarly 37.06%% consumers were visiting at least
once a day (earlier) and now only 15.73% follow this pattern. It means there is reduction in
shopping pattern of consumers on daily basis. As for as daily visit is concerned consumers
prefer to visit daily to buy perishable (FMCG) product (Milk/biscuits/butter) and any
reduction in shopping pattern may affect sales of perishable nature product( FMCG) of
unorganized retailers.
Now there is a change in daily shopping pattern of consumers and this has been shifted from
daily basis to weekly basis (35.31%) and fortnightly basis (31.81%).
There is a negligible rise of such customers (1.74%) who have been stopped buying from
unorganized retail outlets after opening of super market and malls in the locality.
25
Figure No.3 :- Comparative Visit Frequency Analysis (Earlier and Now),
DEHU ROAD , Sample Size= 122
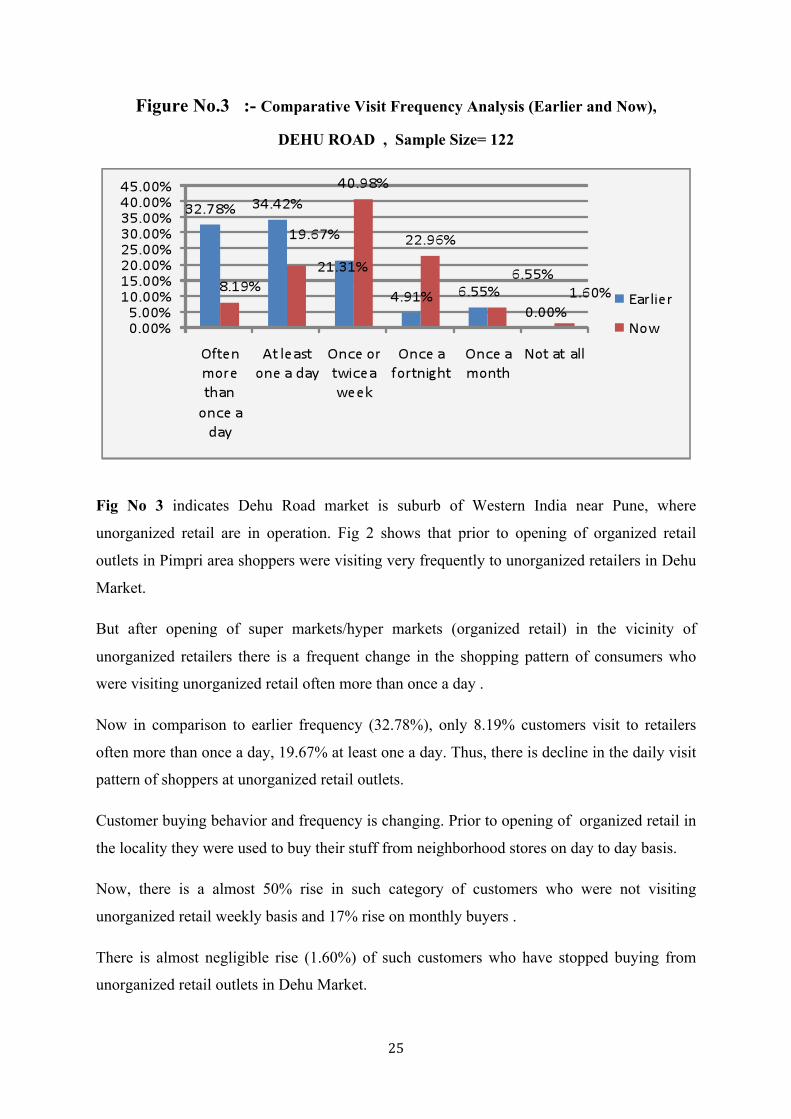
Fig No 3 indicates Dehu Road market is suburb of Western India near Pune, where
unorganized retail are in operation. Fig 2 shows that prior to opening of organized retail
outlets in Pimpri area shoppers were visiting very frequently to unorganized retailers in Dehu
Market.
But after opening of super markets/hyper markets (organized retail) in the vicinity of
unorganized retailers there is a frequent change in the shopping pattern of consumers who
were visiting unorganized retail often more than once a day .
Now in comparison to earlier frequency (32.78%), only 8.19% customers visit to retailers
often more than once a day, 19.67% at least one a day. Thus, there is decline in the daily visit
pattern of shoppers at unorganized retail outlets.
Customer buying behavior and frequency is changing. Prior to opening of organized retail in
the locality they were used to buy their stuff from neighborhood stores on day to day basis.
Now, there is a almost 50% rise in such category of customers who were not visiting
unorganized retail weekly basis and 17% rise on monthly buyers .
There is almost negligible rise (1.60%) of such customers who have stopped buying from
unorganized retail outlets in Dehu Market.
26
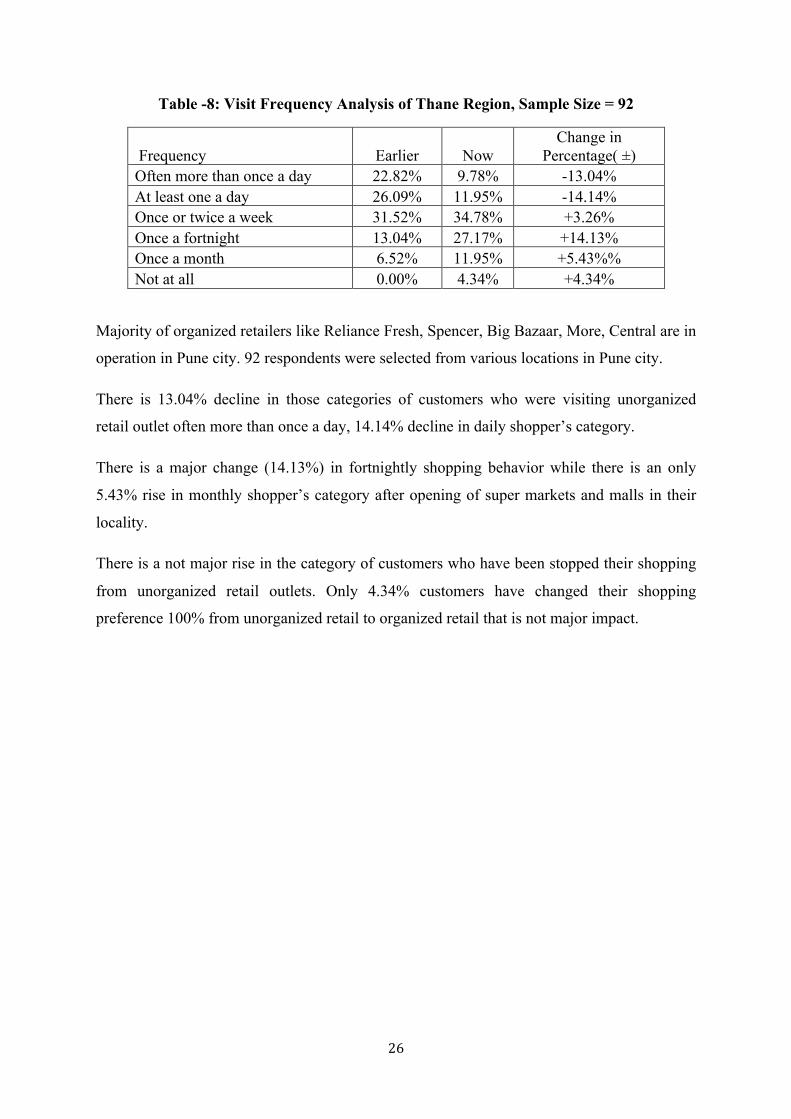
Table -8: Visit Frequency Analysis of Thane Region, Sample Size = 92
Frequency Earlier Now Change in
Percentage( ±) Often more than once a day 22.82% 9.78% -13.04% At least one a day 26.09% 11.95% -14.14% Once or twice a week 31.52% 34.78% +3.26% Once a fortnight 13.04% 27.17% +14.13% Once a month 6.52% 11.95% +5.43%% Not at all 0.00% 4.34% +4.34%
Majority of organized retailers like Reliance Fresh, Spencer, Big Bazaar, More, Central are in
operation in Pune city. 92 respondents were selected from various locations in Pune city.
There is 13.04% decline in those categories of customers who were visiting unorganized
retail outlet often more than once a day, 14.14% decline in daily shopper’s category.
There is a major change (14.13%) in fortnightly shopping behavior while there is an only
5.43% rise in monthly shopper’s category after opening of super markets and malls in their
locality.
There is a not major rise in the category of customers who have been stopped their shopping
from unorganized retail outlets. Only 4.34% customers have changed their shopping
preference 100% from unorganized retail to organized retail that is not major impact.
27
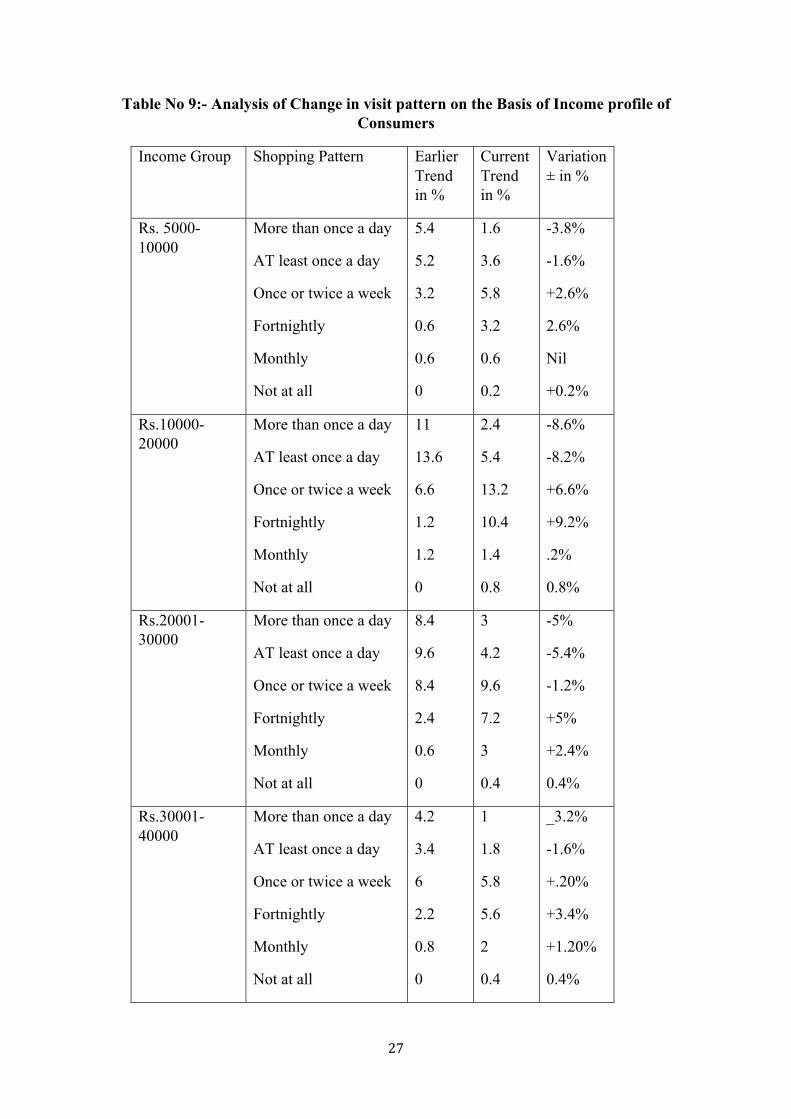
Table No 9:- Analysis of Change in visit pattern on the Basis of Income profile of Consumers
Income Group Shopping Pattern Earlier Trend in %
Current Trend in %
Variation ± in %
Rs. 5000-10000
More than once a day
AT least once a day
Once or twice a week
Fortnightly
Monthly
Not at all
5.4
5.2
3.2
0.6
0.6
0
1.6
3.6
5.8
3.2
0.6
0.2
-3.8%
-1.6%
+2.6%
2.6%
Nil
+0.2%
Rs.10000-20000
More than once a day
AT least once a day
Once or twice a week
Fortnightly
Monthly
Not at all
11
13.6
6.6
1.2
1.2
0
2.4
5.4
13.2
10.4
1.4
0.8
-8.6%
-8.2%
+6.6%
+9.2%
.2%
0.8%
Rs.20001-30000
More than once a day
AT least once a day
Once or twice a week
Fortnightly
Monthly
Not at all
8.4
9.6
8.4
2.4
0.6
0
3
4.2
9.6
7.2
3
0.4
-5%
-5.4%
-1.2%
+5%
+2.4%
0.4%
Rs.30001-40000
More than once a day
AT least once a day
Once or twice a week
Fortnightly
Monthly
Not at all
4.2
3.4
6
2.2
0.8
0
1
1.8
5.8
5.6
2
0.4
_3.2%
-1.6%
+.20%
+3.4%
+1.20%
0.4%
28
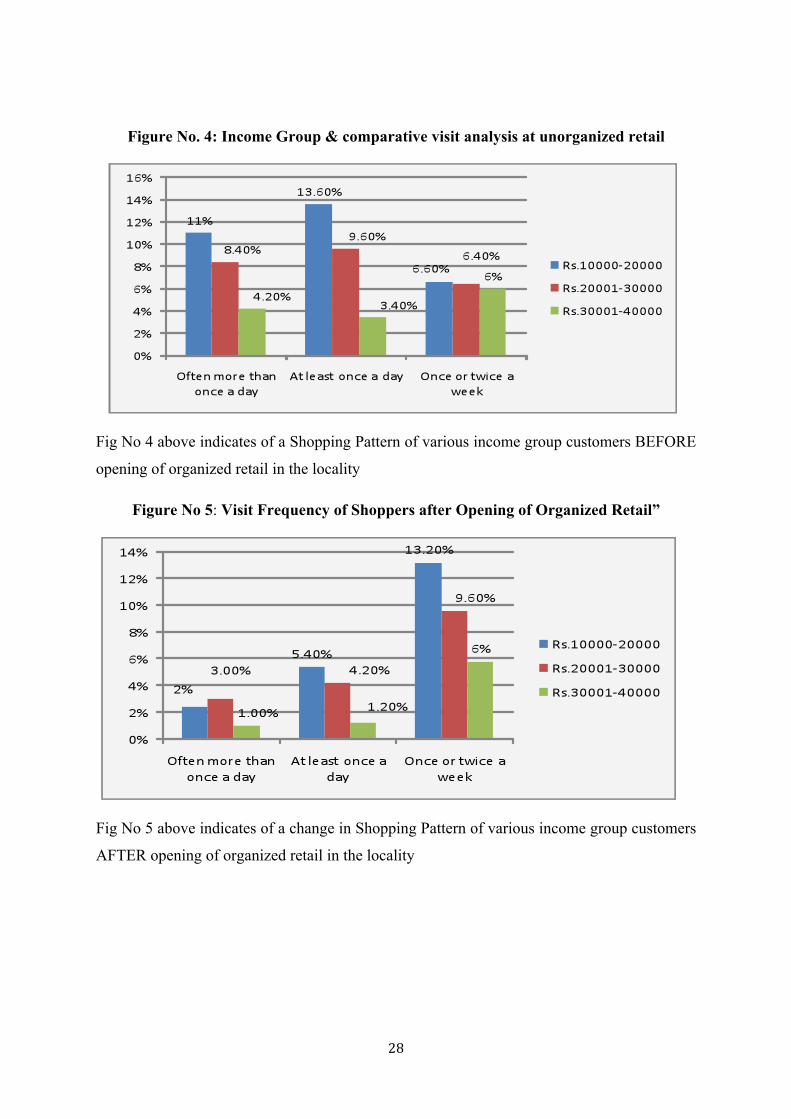
Figure No. 4: Income Group & comparative visit analysis at unorganized retail
Fig No 4 above indicates of a Shopping Pattern of various income group customers BEFORE
opening of organized retail in the locality
Figure No 5: Visit Frequency of Shoppers after Opening of Organized Retail”
Fig No 5 above indicates of a change in Shopping Pattern of various income group customers
AFTER opening of organized retail in the locality
29
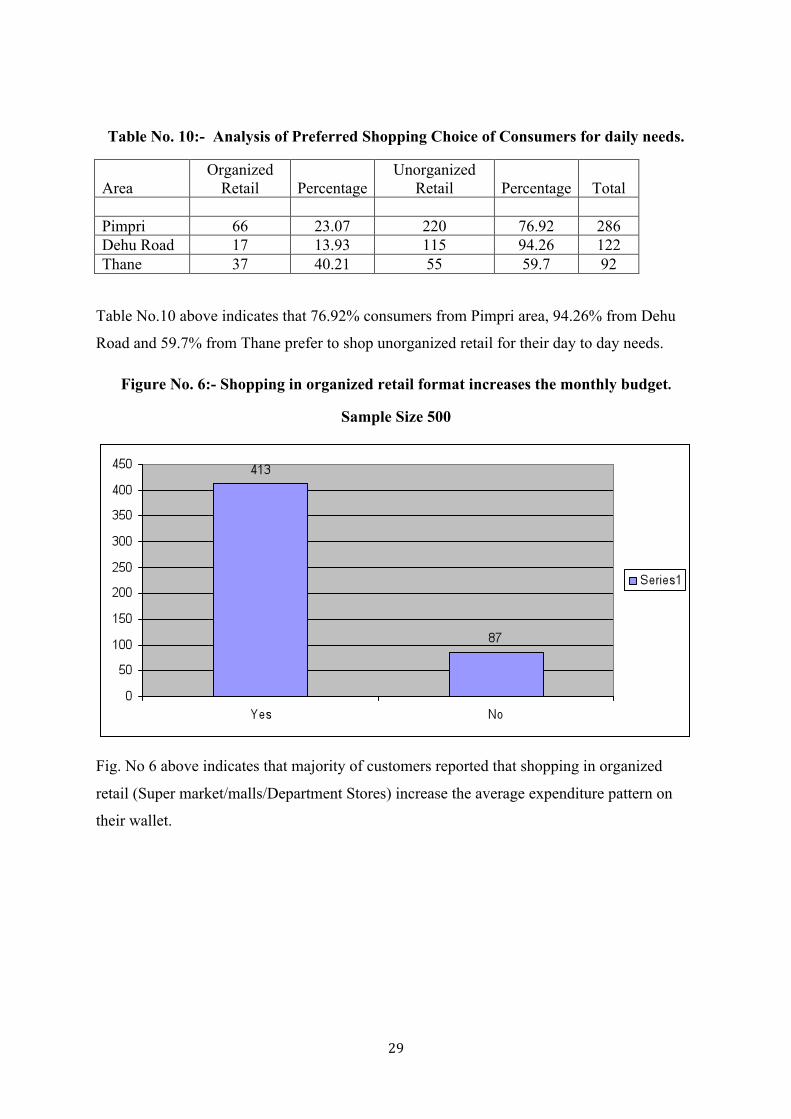
Table No. 10:- Analysis of Preferred Shopping Choice of Consumers for daily needs.
Area Organized
Retail Percentage Unorganized
Retail Percentage Total Pimpri 66 23.07 220 76.92 286 Dehu Road 17 13.93 115 94.26 122 Thane 37 40.21 55 59.7 92
Table No.10 above indicates that 76.92% consumers from Pimpri area, 94.26% from Dehu
Road and 59.7% from Thane prefer to shop unorganized retail for their day to day needs.
Figure No. 6:- Shopping in organized retail format increases the monthly budget.
Sample Size 500
Fig. No 6 above indicates that majority of customers reported that shopping in organized
retail (Super market/malls/Department Stores) increase the average expenditure pattern on
their wallet.