Embed Size (px)
Citation preview
1
2 -------------------------------------------
3 AMERICAN PHYSICAL SOCIETY
4 CLIMATE CHANGE STATEMENT REVIEW WORKSHOP
5
6
7 NEW YORK UNIVERSITY
8 CENTER FOR URBAN SCIENCE AND PROGRESS
9 One MetroTech Center
10 19th Floor
11 Brooklyn, New York 11201
12 January 8, 2014
13 8:20 A.M.
14 -------------------------------------------
15
16
17
18 TRANSCRIPT OF PROCEEDINGS
19
20
21
22
23
24
25
1
1
2 IN ATTENDANCE:
3 AMERICAN PHYSICAL SOCIETY STAFF:
4 DR. FRANCIS SLAKEY, Associate Director of
5 Public Affairs JEANETTE RUSSO, Office Manager and POPA
6 Studies Administration Specialist
7 APS CLIMATE CHANGE STATEMENT STEERING
8 COMMITTEE:
9 DR. ROBERT JAFFE, Chair DR. MALCOLM BEASLEY, APS President
10 DR. KATE KIRBY, Executive Officer
11 APS CLIMATE CHANGE STATEMENT REVIEW
12 SUBCOMMITTEE:
13 DR. STEVEN KOONIN, Chair MR. PHILIP COYLE
14 DR. R. SCOTT KEMP DR. ROBERT ROSNER
15 DR. SUSAN SEESTROM
16 NYU-CUSP STAFF:
17 DR. MICHAEL HOLLAND, Chief of Staff
18 DR. ARI PATRINOS, Deputy Director for Research
19
20 EXPERTS:
21 DR. JOHN CHRISTY DR. WILLIAM COLLINS
22 DR. JUDITH CURRY DR. ISAAC HELD
23 DR. RICHARD LINDZEN DR. BENJAMIN SANTER
24
25 Transcribed by JOSHUA B. EDWARDS, RPR, CRR
2
1
2 INDEX
3
4 OPENING REMARKS BY PAGE
5 DR. KOONIN 4
6
7 PRESENTATION BY
8 DR. COLLINS 17
9 DR. CURRY 96
10 DR. SANTER 173
11 DR. LINDZEN 275
12 DR. CHRISTY 330
13 DR. HELD 408
14
15
16 PANEL DISCUSSION 467
17
18
19
20
21
22
23
24
25
3
1 APS CLIMATE CHANGE STATEMENT REVIEW WORKSHOP
2 DR. KOONIN: Welcome to
3 Brooklyn, everybody, and to this
4 space, which is part of NYU’s Center for
5 Urban Science and Progress. It's an
6 organization that I have been
7 building for the last two years. And
8 during the break, I am happy to tell
9 you more about it.
10 Thanks, of course, for taking
11 the time to help out the American
12 Physical Society, which is convening
13 this meeting in thinking through its
14 statement on climate change.
15 The history and context of what
16 we would like to accomplish today
17 were covered in the pre-read material
18 that we sent around, and so I am not
19 going to take time to go through much
20 of that.
21 But let me just note that this
22 meeting is one intermediate step in
23 an orderly, open, and substantive
24 process to create an APS stance on
25 climate change.
4
1 APS CLIMATE CHANGE STATEMENT REVIEW WORKSHOP
2 The meeting is convened by the
3 APS subcommittee that is charged with
4 reviewing the statement.
5 And the meeting's purpose is to
6 explore through expert presentations
7 and discussion the state of climate
8 science, both the consensus view as
9 expressed by several thousand pages
10 of the IPCC AR5 Working Group 1
11 report that came out three months
12 ago, but also the views of experts
13 who credibly take significant issue
14 with several aspects of the consensus
15 picture.
16 In doing this, the subcommittee
17 hopes to illuminate the certainties
18 and the gaps in our understanding of
19 the physical basis of climate change
20 for the subcommittee itself, for the
21 APS leadership who are present here
22 as observers, and, through a transcript,
23 for the APS membership and the
24 broader public.
25 Let me start with introductions
5
1 APS CLIMATE CHANGE STATEMENT REVIEW WORKSHOP
2 around the room. I would ask each of
3 you to just state your name and the
4 institution and the capacity in which
5 you are here today.
6 And as you introduce
7 yourselves, you have the option of
8 using your quota of one
9 weather-related remark, after which
10 we will ban all further discussions
11 of weather!
12 So, I am Steve Koonin and I am
13 Chair of the subcommittee that is
14 responsible for reviewing the
15 statement and making recommendations
16 up the chain.
17 And I am a professor,
18 of civil and urban engineering in the
19 engineering school here at NYU and a
20 professor of information, operations
21 and management in the NYU business
22 school. And I have never taken a
23 course in either of those subjects!
24 DR. KEMP: I am Scott Kemp. I
25 am assistant professor of nuclear
6
1 APS CLIMATE CHANGE STATEMENT REVIEW WORKSHOP
2 science and engineering at MIT, where I
3 direct a Lab for Nuclear Security and
4 Policy. I also have a position in
5 the policy schools at Princeton and
6 Harvard. And I am here as a member
7 of the subcommittee.
8 DR. LINDZEN: I am Dick
9 Lindzen, emeritus professor at MIT in
10 atmospheric sciences.
11 DR. CHRISTY: John Christy,
12 professor of atmospheric science at
13 the University of Alabama in
14 Huntsville. My one weather comment
15 was made 25 years ago on the Weather
16 Channel when I said, "If it happened
17 before, it will happen again, but
18 probably worse."
19 DR. CURRY: I am Judy Curry
20 from Georgia Tech, earth and
21 atmospheric sciences.
22 DR. COLLINS: I am Bill
23 Collins. I head the weather science
24 department at Berkeley. I also teach
25 earth and air science at Berkeley.
7
1 APS CLIMATE CHANGE STATEMENT REVIEW WORKSHOP
2 And I guess my role here today is as
3 one of the lead authors of chapter 9
4 in the fifth IPCC report.
5 DR. SANTER: I am Ben Santer.
6 I am from Lawrence Livermore National
7 Laboratory. And I will be talking
8 today about detection and attribution
9 work and the stasis.
10 DR. HELD: I am Isaac Held. I
11 am with NOAA's Geophysical Fluid
12 Dynamics Laboratory. And I also
13 teach at Princeton in the program in
14 atmospheric oceanic sciences.
15 MS. RUSSO: I am Jeanette Russo
16 with the American Physical Society.
17 I am the office manager with the
18 Office of Public Affairs in
19 Washington, D.C. and administrator
20 for meetings like this.
21 DR. ROSNER: I am Bob Rosner.
22 I am professor of physics and
23 astrophysics at the University of
24 Chicago and chair of the Panel on
25 Public Affairs at the American
8
1 APS CLIMATE CHANGE STATEMENT REVIEW WORKSHOP
2 Physical Society, which is the parent
3 committee of the committee that Steve
4 chairs.
5 DR. HOLLAND: Mike Holland, I
6 am the chief of staff here at CUSP.
7 DR. SLAKEY: Francis Slakey,
8 associate director of public affairs
9 for APS.
10 DR. JAFFE: I am Bob Jaffe. I
11 am a professor of physics at MIT.
12 DR. SEESTROM: I am Susan
13 Seestrom. I am a senior fellow at
14 Los Alamos National Laboratory and a
15 member of the subcommittee.
16 MR. COYLE: Philip Coyle,
17 member of the Panel on Public
18 Affairs, of course, and most recently
19 associate director for National
20 Security and International Affairs at
21 OSTP. I am currently with the Center
22 for Arms Control and
23 Non-Proliferation.
24 DR. BEASLEY: I am Mac Beasley,
25 currently president of the American
9
1 APS CLIMATE CHANGE STATEMENT REVIEW WORKSHOP
2 Physical Society and I am a professor
3 of applied physics at Stanford.
4 DR. KIRBY: Kate Kirby,
5 executive officer of the American
6 Physical Society and formerly senior
7 research physicist at Harvard
8 Smithsonian Center for Astrophysics.
9 DR. KOONIN: And our Court
10 Reporter?
11 THE REPORTER: Joshua Edwards,
12 good morning.
13 DR. KOONIN: I am sure he urges
14 us again to speak up.
15 DR. BEASLEY: I have sympathy
16 for this gentleman.
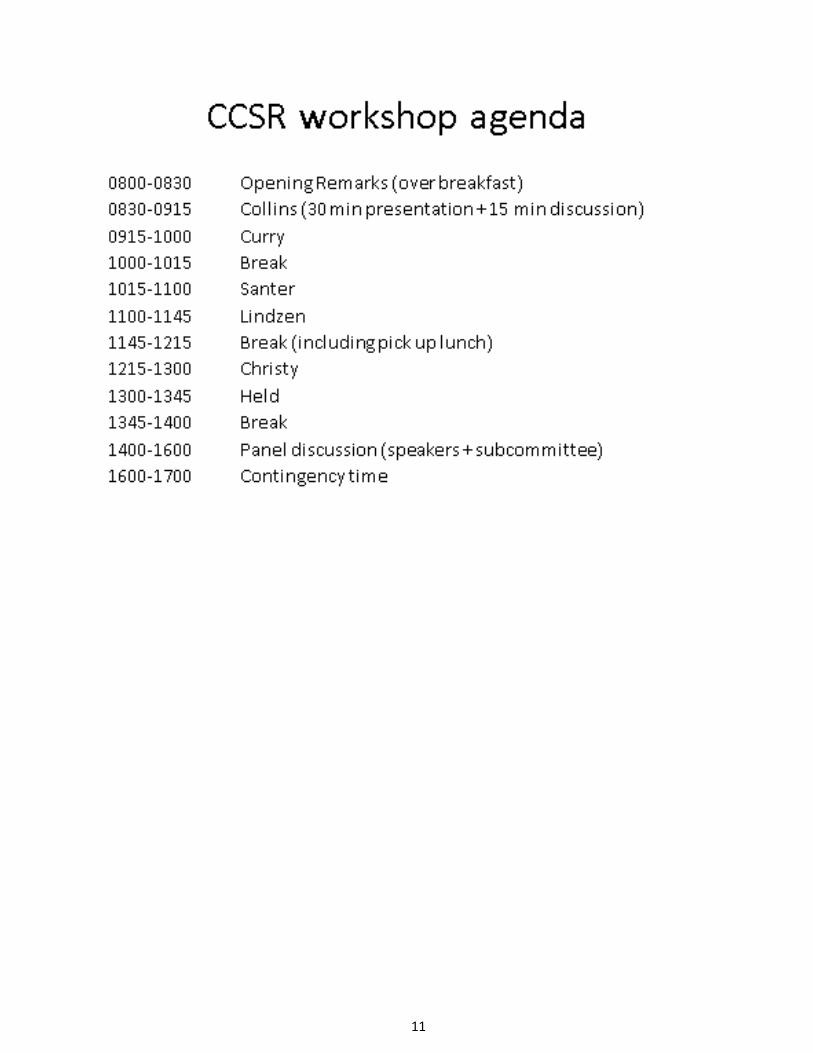
17 DR. KOONIN: We are going to
18 organize our discussion around the
19 agenda [next page] you have seen in outline
20 form. And now I have tried to put in a
21 batting order for our outside
22 experts. My suggestion is we start
23 with Bill, go to Judy, take a break,
24 then have Ben and Dick, we will have
25 a brief break, pick up lunch and then
10
11
1 APS CLIMATE CHANGE STATEMENT REVIEW WORKSHOP
2 John and then finish up with Ike.
3 If you all have thought about a
4 different batting order, I am fine 5 with that, but this seems about as
6 good as any. And I am sure we will
7 thread themes throughout the discussion.
8 And then again, another break and we will
9 run a panel discussion for as long as it
10 seems useful or until people have to
11 leave. And as you can see, there is
12 an hour of contingency built in, 13 (which we are not up to using
14 yet!).
15 We will have a transcript and
16 each of the participants (the experts
17 and the subcommittee) within a week,
18 I hope, will have an opportunity
19 to clarify the transcript, which
20 will eventually be made public
21 according to the procedures that we
22 sent around.
23 To help in the transcription, I
24 am going to try to make sure that
25 only one person at a time is
12
1 APS CLIMATE CHANGE STATEMENT REVIEW WORKSHOP
2 speaking. And if you want to be
3 recognized, I think we are trying to
4 get some pieces of paper that you
5 can wave around.
6 And we will try to get you (indicating
7 stenographer) the names and a seating chart
8 so that you will be able to know 9 who is talking.
10 This workshop and its
11 transcript will likely not be the
12 final technical input to what we are
13 about, as the issues raised will no
14 doubt be discussed further by the
15 subcommittee and the broader APS
16 membership.
17 The scope today: I would like to
18 really keep rigorously to Working
19 Group 1, namely the physical basis
20 for climate change and focus on the
21 science. As important as they might
22 be, we are not going to cover other
23 broader issues like programmatics,
24 communications, climate impacts or
25 societal responses, except perhaps we
13
1 APS CLIMATE CHANGE STATEMENT REVIEW WORKSHOP
2 will touch on them a bit during the
3 panel discussion.
4 While not all or even most of
5 the APS membership are experienced in
6 climate, it's important to realize
7 that physicists do bring a body of
8 knowledge and set of skills that are
9 directly relevant to assessing the
10 physical basis for climate science.
11 Radiation transfer, including the
12 underlying atomic and molecular
13 processes, fluid dynamics, phase
14 transitions, all the underpinnings of
15 climate science are smack in the
16 middle of physics.
17 Physicists also have a deep
18 expertise in the handling of large
19 observational data sets and in
20 modeling complex physical systems.
21 And indeed, there has been enough APS
22 interest among the membership that a
23 topical group on the physics of
24 climate was established two years
25 ago.
14
1 APS CLIMATE CHANGE STATEMENT REVIEW WORKSHOP
2 Those of you who know me know I
3 am not inexperienced in wielding a
4 gavel. And so I won't hesitate to
5 cut off remarks that are out of
6 scope, that go on too long, or that are
7 unproductive toward the goals that we
8 are trying to establish.
9 As you go about the day, you
10 might just bear in mind that
11 unsupported appeals to authority just
12 aren't going to fly with the APS
13 membership. And our discussions
14 today are going to be read and
15 commented upon by an extraordinarily
16 technically literate and experienced
17 group of more than 50,000 physicists
18 from all over the world. So, in that
19 sense, this is on the record.
20 Finally, the real
21 practicalities; there is ongoing
22 coffee available over there, and
23 there is even stronger coffee in the
24 pantry which you probably all walked
25 by. Don't hesitate to just step out
15
1 APS CLIMATE CHANGE STATEMENT REVIEW WORKSHOP
2 and grab whatever you need. Signs in
3 the hallway are pointing to the
4 restrooms.
5 We are also not expecting any
6 fire drills today, but if the alarm
7 does sound and we need to evacuate,
8 just follow one of the locals down
9 the stairs in the center of the floor
10 and then out of the building. People
11 with the yellow hats are particularly
12 important if that exercise should
13 happen.
14 With that, I think we are ready
15 to start unless somebody else has any
16 questions or comments?
17 Okay, Isaac?
18 DR. HELD: Can we expect the
19 presentations to be more or less
20 uninterrupted?
21 DR. KOONIN: Oh, I missed that,
22 yes, the flow, I'm sorry. I had
23 notes here and just didn't read them.
24 What I would like is that during the
25 30 minutes of the talk, we will take
16
1 APS CLIMATE CHANGE STATEMENT REVIEW WORKSHOP
2 clarifying questions only from the
3 subcommittee.
4 After that, we will do
5 subcommittee questions and then we
6 will open it up to the experts. 7 And what I hope will be a
8 productive freeform dialogue.
9 Okay, Bill…?
10 DR. COLLINS: Thank you.
11 Good morning. So first, thanks for
12 inviting us to talk with you about
13 the recent findings of IPCC and the
14 scientific context for them.
15 I think this is a particularly
16 timely time to have this conversation
17 because, as you know, the first
18 volume of the fifth IPCC assessment
19 was issued electronically to the
20 world sort of in two stages, in late
21 September, first the summary for
22 policymakers on September 27th, and
23 then the electronic version of the
24 Working Group 1 report which deals
25 with the science and physics of
17
1 APS CLIMATE CHANGE STATEMENT REVIEW WORKSHOP
2 climate change on September 30th.
3 Those reports are still going
4 through a set of final edits to get
5 them ready for publication. But this
6 is a good time to be talking about
7 the findings. And I oriented my
8 presentation --
9 DR. KOONIN: Bill, I think that
10 podium mic is live.
11 DR. COLLINS: How about that?
12 Much better, yes. And I think I
13 elected to sort of hew to the
14 questions that you raised in your
15 notes that you sent to us. So, my
16 presentation actually deals somewhat
17 specifically with several of the
18 topics that came up that you raised
19 in connection with this report.
20 So again, to reiterate my role
21 in the IPCC, I have served now twice
22 as lead author, once for the chapter
23 dealing with projections in the
24 fourth assessment and now as a lead
25 author on the chapter dealing with
18
1 APS CLIMATE CHANGE STATEMENT REVIEW WORKSHOP
2 evaluation of models, chapter 9 in
3 the fifth IPCC assessment.
4 And I have also been heavily
5 involved in constructing one of the
6 climate models that has been used in
7 these reports for a number of
8 different iterations and I am still
9 directing effort in that direction.
10 So, I do climate modeling basically
11 in my professional life.
12 And I would be happy to both
13 ask for your input on that and also
14 answer any questions you might have
15 about modeling. And there are a
16 number of us here who do that for one
17 of our day jobs.
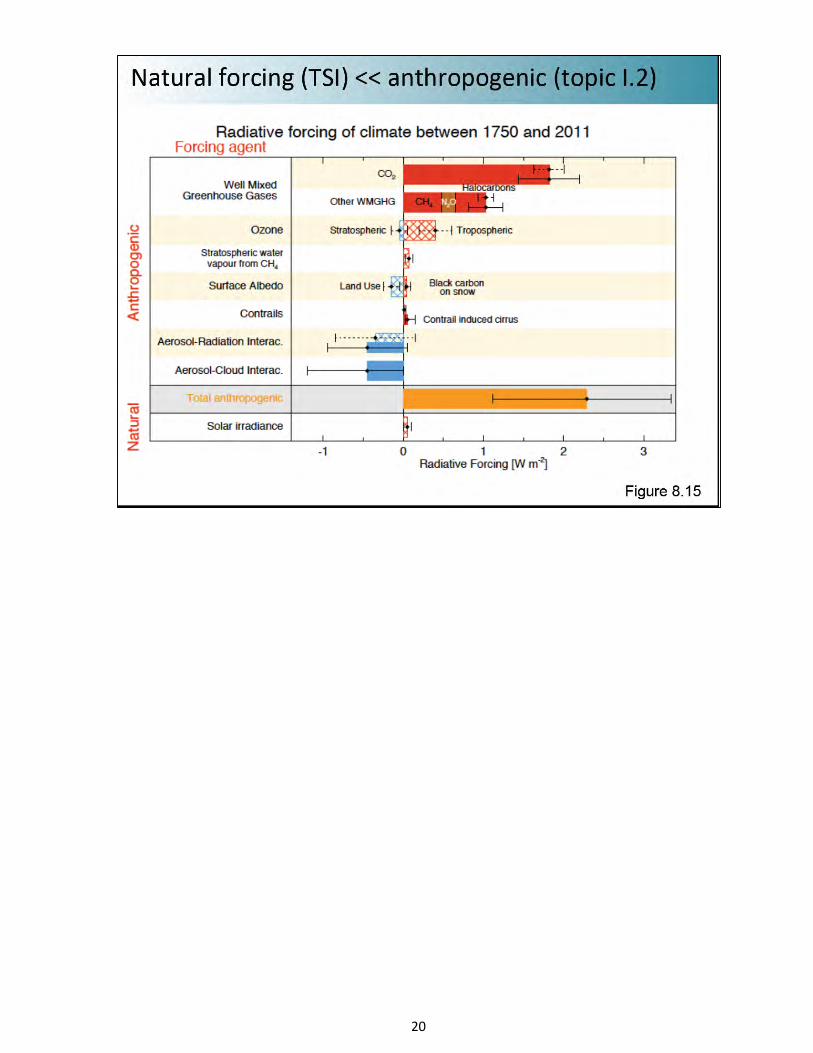
18 I thought I would start with
19 the issue of radiative forcing
20 because, after all, this is a forced
21 problem that we are looking at. And
22 just to remind you what the current
23 state of that forcing information
24 looks like [next page], one of the issues
25 that you raised in your notes repeatedly
19
20
1 APS CLIMATE CHANGE STATEMENT REVIEW WORKSHOP
2 was the difference between change
3 that is forced by evolution of the
4 boundary conditions?
5 And we considered the radiative
6 forcing for this problem, radiative
7 forcing meaning the net radiative
8 balance of the earth's climate system
9 at the tropopause, the boundary
10 between the troposphere and the
11 stratosphere.
12 We regard that essentially as a
13 boundary condition problem to which
14 the climate system responds. And a
15 number of your questions dealt with
16 the issue of whether or not change in
17 the climate system is forced by
18 evolution in these boundary
19 conditions or by essentially
20 uncertainty in the initial
21 conditions.
22 And I think a number of us will
23 touch on that topic today in our
24 presentations, because this was a
25 thread in the comments that you
21
1 APS CLIMATE CHANGE STATEMENT REVIEW WORKSHOP
2 brought back to us from the Working
3 Group 1 report.
4 This is the way that the
5 climate science community looks at
6 radiative forcing. And this is in
7 watts meters squared. Just to sort
8 of set the scale here, and this was
9 also noted in your questions back to
10 us, the global annual incident solar
11 radiation at the top of the earth's
12 atmosphere is about 340 watts per
13 meter squared.
14 So, all of these numbers that
15 you see here are less than one
16 percent of the incident solar at the
17 top of the earth's atmosphere. And
18 approximately 70 percent of that is
19 absorbed by the climate system.
20 So again, that sort of just
21 sets the scale. These numbers, and
22 these are, perturbations to the
23 energy budget are about one percent
24 of incident solar.
25 And one of the questions that
22
1 APS CLIMATE CHANGE STATEMENT REVIEW WORKSHOP
2 you raised, of course is, is this
3 enough to actually force climate
4 change? I will come back to the
5 issue of where these numbers come
6 from in a moment because there is another
7 important issue. And I think perhaps
8 there is a little bit of, I think, a
9 hint of a misunderstanding in some of
10 the questions coming back to us.
11 This is broken out. All the
12 numbers to the right of zero, of
13 course, are terms where greenhouse
14 gases have added and have reduced the
15 amount of emission to space and
16 enhanced the greenhouse effect of the
17 earth's atmosphere.
18 And several of these deal with
19 well-mixed greenhouse gases like CO2
20 and other gases which have lifetimes
21 in the troposphere of 100 years plus.
22 They are effectively very well
23 mixed compared to the mixing time for
24 the troposphere of about a month.
25 And WMGHG stands for "well-mixed
23
1 APS CLIMATE CHANGE STATEMENT REVIEW WORKSHOP
2 greenhouse gases."That includes
3 methane, nitrous oxide, halocarbons
4 and molecular carbons a bunch of
5 other carbons. Those are all in red
6 and those represent heating for the
7 climate system.
8 The aerosol interactions and
9 aerosol climate interactions, which
10 were highly uncertain, you will note
11 that, because of the large error bars
12 in blue and represent, we believe,
13 slight coolings in the climate
14 system.
15 One of the reasons why the
16 aerosol radiative interactions (and
17 this is just the direct effect of
18 scattering of absorption of sunlight)
19 actually has a slight uncertainty
20 is because of the large uncertainty
21 of the amount of black carbon in the
22 earth's atmosphere.
23 That's very hard to sense
24 remotely from space and that has
25 proven to be a major source of
24
1 APS CLIMATE CHANGE STATEMENT REVIEW WORKSHOP
2 uncertainty of these estimates.
3 The final feature of this is
4 the total anthropogenic, which is a
5 summary of everything above it,
6 has a very large error bar. This is
7 going to come back to haunt us when
8 we talk about the estimate of
9 transient climate response which
10 appeared in your notes because, I'm
11 sorry to say, that error bar was not
12 propagated into that calculation, and
13 it's a large error bar. So, we will
14 come back that to that point in a
15 bit.
16 The main reason I wanted to
17 show you this graph is to emphasize
18 how large the anthropogenic part is
19 of the estimate. And again, this is
20 a model estimate. And it is an
21 unknown to you relative to the solar
22 radiance, which is the number
23 immediately below. So, these differ
24 by, well, easily over an order of
25 magnitude.
25
1 APS CLIMATE CHANGE STATEMENT REVIEW WORKSHOP
2 And this is one of the reasons
3 why the climate community, and we
4 have records of this thanks to
5 Galileo that are quite good because
6 we can count sunspot number and
7 correlate that to the sunspot of SOHO
8 with the solar radiance back for 350
9 years plus.
10 And so, this number for the
11 solar radiance variations over the
12 last 500 years is -- I will show you
13 in a moment -- there is still some
14 uncertainty, but it is not huge.
15 One other thing I want to call
16 out to your attention about this
17 graph so that you are all aware of it
18 is that these are model calculations.
19 These are not measurements. In many
20 cases, they are based on
21 observations.
22 So, for example, we have very
23 good records down to parts per
24 million of the well-mixed greenhouse
25 gases, et cetera. There are the radiative
26
1 APS CLIMATE CHANGE STATEMENT REVIEW WORKSHOP
2 transfer codes which are backstopped
3 by Maxwell's equations. .
5 So I would argue, and we have
6 very good evidence, that the
7 radiative forcing by CO2 and
8 well-mixed greenhouse gases on this
9 figure are quite good. But I am
10 happy to take that point of
11 discussion if you wish.
12 This is radiative forcing. And
13 the main thing I want to call out to
14 you is, this is the boundary
15 condition on the climate system.
16 Yes, the changes are small, but the
17 one component in this that is --
18 well, there are two components.
19 The other one that is not shown
20 is volcanic and that turns out to be
21 even smaller than solar.
22 Both of those are dwarfed by
23 our estimates of the anthropogenic.
24 So, that is one of the reasons we
25 think if this is a boundary condition
27
1 APS CLIMATE CHANGE STATEMENT REVIEW WORKSHOP
2 force problem, the IPCC is quite
3 confident that the anthropogenic
4 component of this is the main driver.
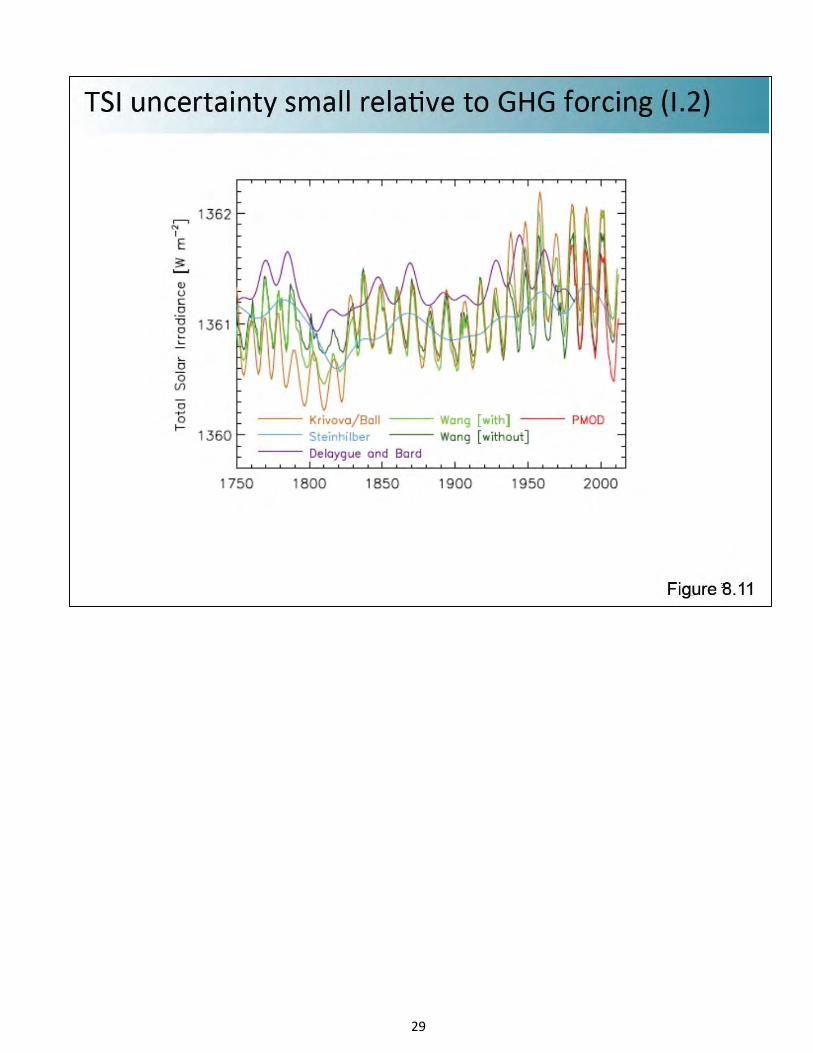
5 These are various reconstructions
6 of the total solar radiance.
7 I just wanted to show this [next page]
8 to you to kind of get this off the
9 table. These are time series where
10 you can clearly see the solar cycle
11 built into the oscillations. This
12 time series runs back to the
13 introduction of the steam engine.
14 But, of course, if we take it
15 back another 400 years, thanks to
16 Galileo, the reconstructions differ
17 because of sort of the means by which
18 you interpret the modern sunspot
19 record and its relation to solar
20 radiance in time.
21 There are other ways of
22 constructing this from isotope
23 proxies. But in any case, these
24 numbers of uncertainty in total solar
25 radiance are tiny.
28
29
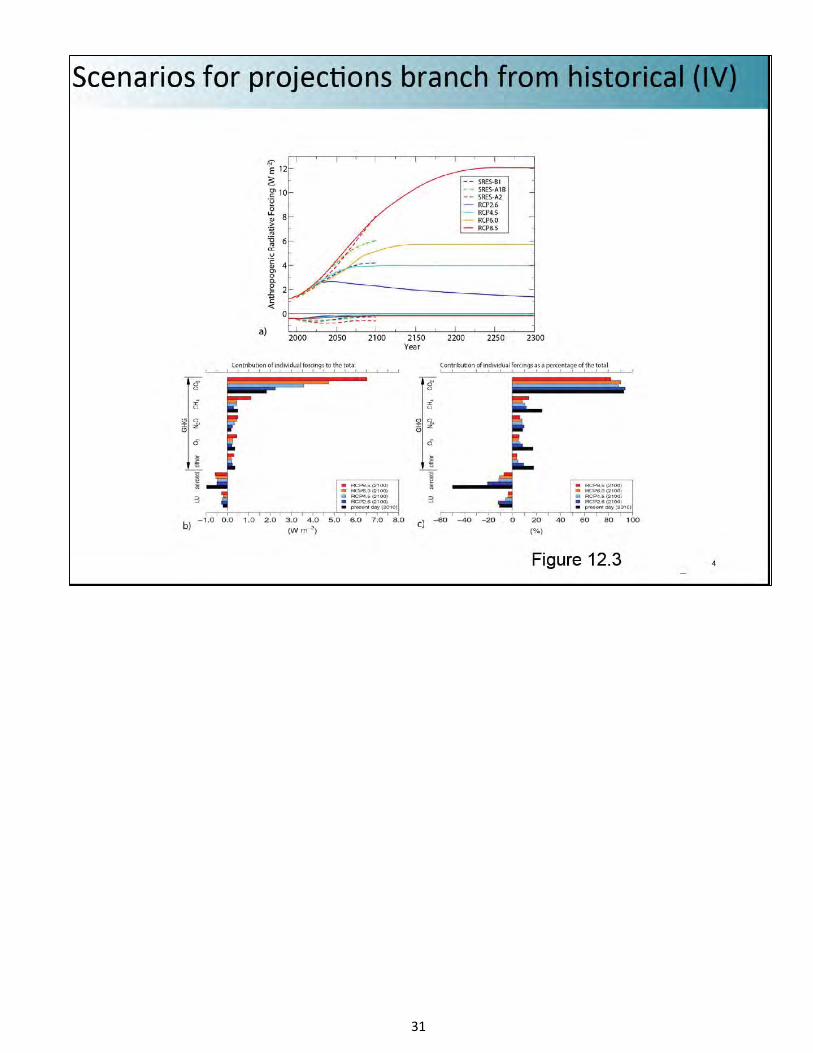
1 APS CLIMATE CHANGE STATEMENT REVIEW WORKSHOP
2 So, what is done for the
3 projections [next page] that also form
4 some of the topics for discuss today
5 is that we use that information for the
6 historical climate record and take
7 climate models that have been brought
8 into quasi-equilibrium so they are in
9 equilibrium state so that they are
10 not varying very much in time at the
11 start of industrialization.
12 So, we build climate models.
13 We assume when we construct those
14 models that the net energy balance of
15 the planet was identically zero or
16 effectively zero at the start of
17 industrialization.
18 We ensure that the climate
19 models produce a steady-state climate
20 for the millennia under those
21 conditions, and then we begin
22 subjecting them to the historical
23 time series of forcing, bring them up
24 to the present day, and then we spawn
25 a series of model runs off the end of
30
31
1 APS CLIMATE CHANGE STATEMENT REVIEW WORKSHOP
2 the present day.
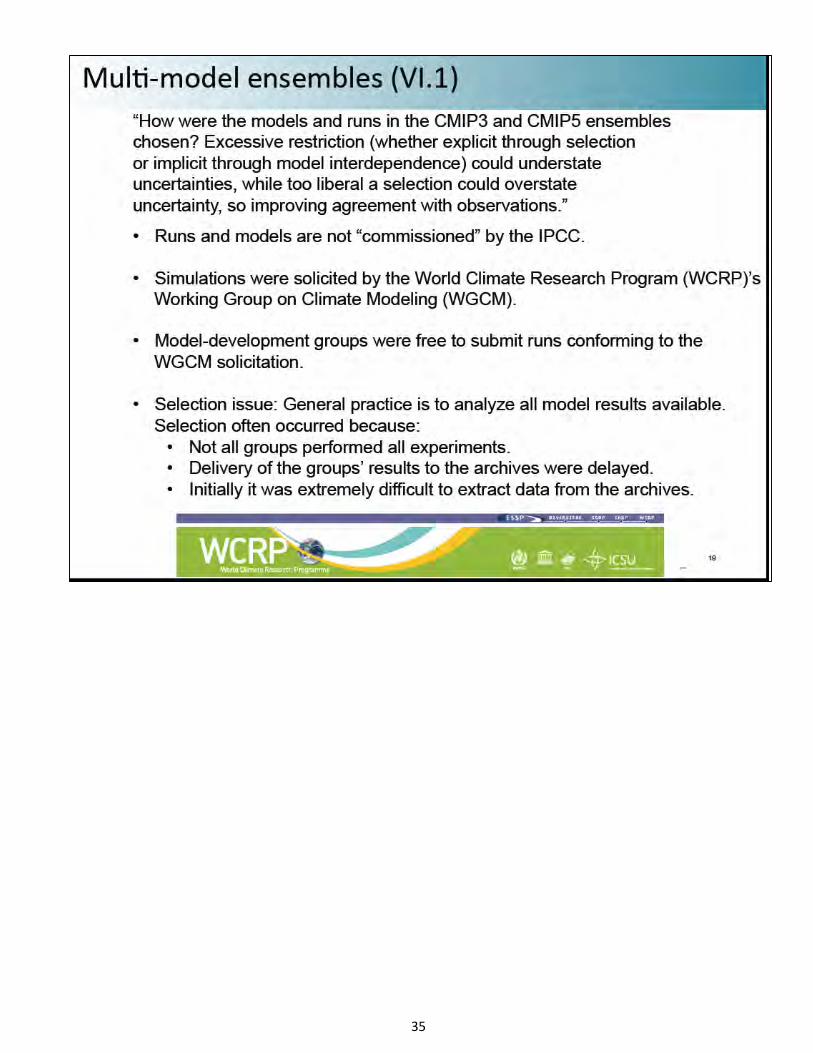
3 This also came up in connection
4 with, what was the experimental
5 design here? I should also say that
6 these runs are not commissioned by
7 the IPCC.
8 These are actually done as a
9 service to the IPCC, but it's done
10 through the Working Group for Climate
11 Modeling, which is part of the World
12 Climate Research Program.
13 So actually, IPCC does not
14 commission these runs. I will come
15 back to this point in a minute. But
16 they are sort of done for the IPCC.
17 And we are trying to deal with
18 several sources of uncertainty.
19 One of them is the huge
20 uncertainties even in historical
21 forcing. And I want to highlight to
22 you the graph in the lower right
23 which shows the contribution of the
24 forcing from various components and
25 how large the negative component of
32
1 APS CLIMATE CHANGE STATEMENT REVIEW WORKSHOP
2 the aerosol is. It's about minus
3 40 percent.
4 This number is one of the most
5 uncertain in this figure. And this
6 will also come back to haunt us, I
7 think, a little bit in terms of the
8 interpretation of the historical
9 record.
10 We have very poor
11 information -- we have essentially no
12 measurements of aerosol radiative
13 forcing that go back of any utility
14 back much further than about 40 to 50
15 years.
16 And our information regarding
17 the concentration of aerosols in the
18 atmosphere becomes quite problematic
19 once you go back more than a few
20 decades. At that point, we are
21 literally relying on high school
22 records. So, the aerosol number in
23 this graph is particularly uncertain.
24 What we do is take the models
25 up to the present day and then spawn
33
1 APS CLIMATE CHANGE STATEMENT REVIEW WORKSHOP
2 several different runs. In this case
3 we did four. And they are called
4 representative concentration
5 pathways, RCPs. And they have a
6 number on the end. So, throughout
7 the report, you will see RCP 8.5,
8 2.6, et cetera.
9 That 8.5 refers to the
10 anthropogenic radiative forcing in
11 watts per meter squared. So, that is
12 what "RCP" means.
13 DR. KOONIN: At the end of some
14 time period?
15 DR. COLLINS: In 2100. What we 16 are trying to do, so, what we have, 17 what is done is that we accumulate
18 models from around the world [next page].
19 There were 45 plus, I think, that
20 participated in the round of model
21 comparisons that form the basis for
22 what I am going to show you.
23 We do that in order to account
24 for structural uncertainty among the
25 climate models, because there are a
34
35
1 APS CLIMATE CHANGE STATEMENT REVIEW WORKSHOP
2 number of processes in the climate
3 system we just do not understand
4 from basic physical principles.
5 For example, let me be careful
6 how I state that exactly. We
7 understand a lot of the physics in
8 its basic form. We don't understand
9 the emergent behavior that results
10 from it. And so, a good example for
11 that would be cumulus convection.
12 Well, we know, okay, it's
13 anisotropic turbulence occurring,
14 anisotropic because it's dealing
15 with a buoyancy gradient. It's got
16 an internal heat engine fluid in the
17 form of condensation of water vapor.
18 So, it's nasty, it's
19 turbulence, it's anisotropic and it
20 has a heat engine at intervals
21 physics across twelve orders of
22 magnitude. So, it’s a multiphysics
23 problem.
24 We account for the structural
25 uncertainties by using 45 different
36
1 APS CLIMATE CHANGE STATEMENT REVIEW WORKSHOP
2 climate models. Those are not
3 selected -- essentially, it's a very
4 democratic system. And I will come
5 back to that point, too. That's one
6 source of uncertainty.
7 The second source of
8 uncertainty is what mankind is going
9 to do. And we are not going to talk
10 too much about that today. And the
11 solutions on this graph don't really
12 separate out until 2040 or so.
13 Most of the climate change
14 between now and 2040 is committed
15 from historical emissions, about
16 two-thirds of the common signal.
17 Robert?
18 DR. ROSNER: So, are you saying
19 that you accounted for model
20 uncertainty by basically assuming
21 that all these models were created
22 independently, that they explore the
23 parameters of basic possible models?
24 DR. COLLINS: They do not. And
25 this has been now examined carefully
37
1 APS CLIMATE CHANGE STATEMENT REVIEW WORKSHOP
2 by Reto Knutti and colleagues. There
3 has been sort of a careful analysis
4 of the clustering models as they
5 appeared in the literature, that
6 appeared, actually before the fifth
7 IPCC report went to press.
8 So yes, there are a number of
9 these models are certainty cousins,
10 first or second cousins. But they
11 are cousins for sure.
12 I can see from the way I am
13 consuming time on the introduction
14 that some of the material I have in
15 my talk will be covered by the
16 speakers.
17 In particular, I have some
18 slides I have borrowed from Ben
19 without his knowing, and he will show
20 those. And parts of the talk where I
21 am going to cover stuff by other
22 people, I will go quickly. And Ben
23 mentioned that he is going to talk
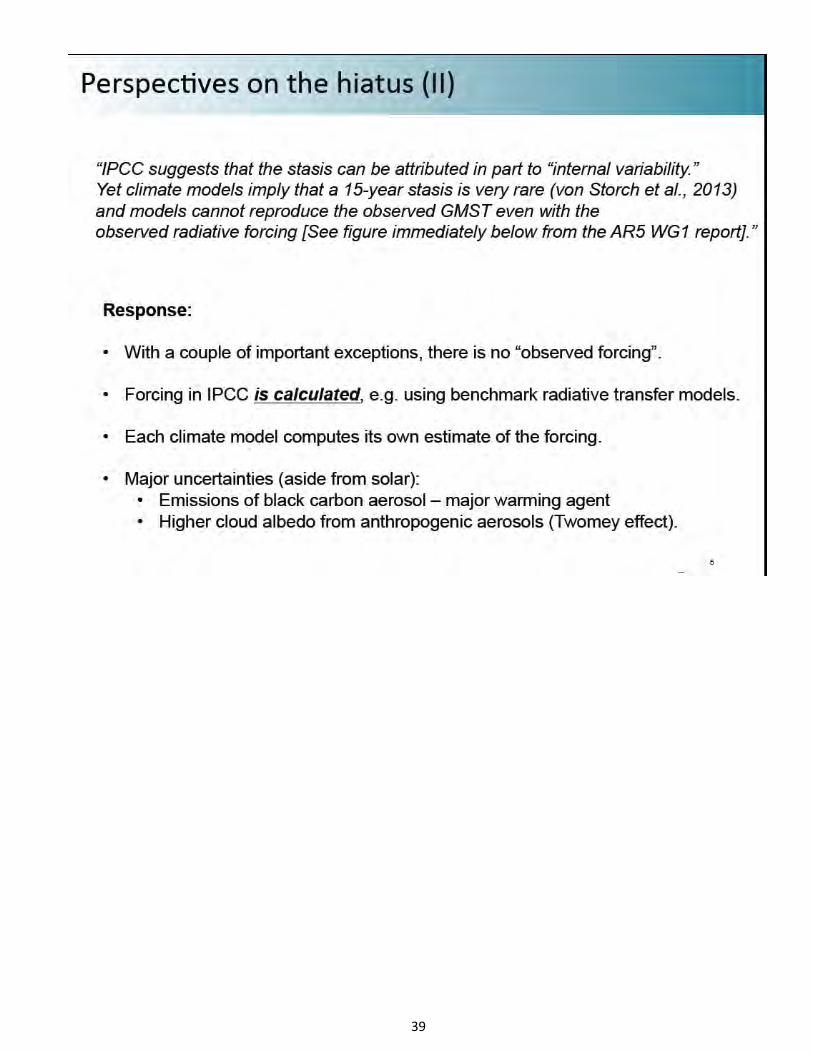
24 about the hiatus.
25 I did want to say here [next page] that
38
39
1 APS CLIMATE CHANGE STATEMENT REVIEW WORKSHOP
2 just, so, the nit I wanted to pick
3 with one statement, and I am going
4 request to pick nits with you; I'm
5 sorry. This is going to be a
6 give-and-take here a little bit. So,
7 I put your statement in quotes with
8 regards to the hiatus. And I
9 specifically want to point out the
10 issue of radiative forcing.
11 You say, "Models cannot
12 reproduce the observed global mean
13 surface temperature even with the
14 observed radiative forcing." The
15 reason I went through this whole
16 exercise on forcing is that it is not
17 observed. It is calculated. And the
18 aerosol competent of that is highly
19 uncertain.
20 The models we use for the
21 greenhouse gases, those are really
22 good, but the aerosol component is
23 uncertain. Dealing with uncertainty
24 in chemistry, the microphysics of the
25 aerosol is a mess. It's basically
40
1 APS CLIMATE CHANGE STATEMENT REVIEW WORKSHOP
2 the physics the dirt, quite
3 literally. So, it's messy.
4 And each model is computing its
5 own radiative forcing. We do not
6 prescribe that information. We hand
7 them concentrations. They are asked
8 to compute forcing there that.
9 And even under controlled
10 circumstances, we can show that
11 something like maybe a quarter, in
12 fact, about a quarter of the response
13 variation we see in the ensemble is
14 just due to uncertainties in the
15 forcing.
16 Even though we try to control
17 for that, even though we claim we are
18 handing them exactly the same climate
19 conditions, we are handing them
20 chemical boundary conditions and not
21 radiative forcing boundary conditions
22 to compute from that the radiative
23 forcing.
24 And that's about a quarter of
25 the variation we see in response
41
1 APS CLIMATE CHANGE STATEMENT REVIEW WORKSHOP
2 across the model ensemble. Major
3 uncertainties associated with black
4 carbon and particularly with
5 cloud-radiative interactions for
6 reasons I will be happy to come back
7 to. It's called the Twomey effect.
8 So, one of the issues that you
9 raised because of the tininess of
10 this perturbation of the boundary
11 conditions is [see slide], how can you be
12 sure, given the fact that uncertainties and
13 fluxes in the climate system are
14 quite large and these perturbations
15 and boundary conditions are small,
16 how can you be sure that, when you
17 look at a field like temperature
18 which has a lot of stuff, a lot of
19 different processes that contribute
20 to its variations, how can you be
21 sure that you are correctly
22 interpreting the influences?
23 This is also a drawing on work
24 that Ben and his colleagues
25 pioneered. But you can use gradients
42
1 APS CLIMATE CHANGE STATEMENT REVIEW WORKSHOP
2 in the temperatures as a clue and a
3 means to get through that thicket of
4 different influences on the
5 temperature.
6 And one of the most powerful
7 tools -- and a number of people in
8 this room have contributed to this
9 literature John, Ben, others -- has
10 to do with the vertical gradients in
11 temperature in the earth's
12 atmosphere.[next page]
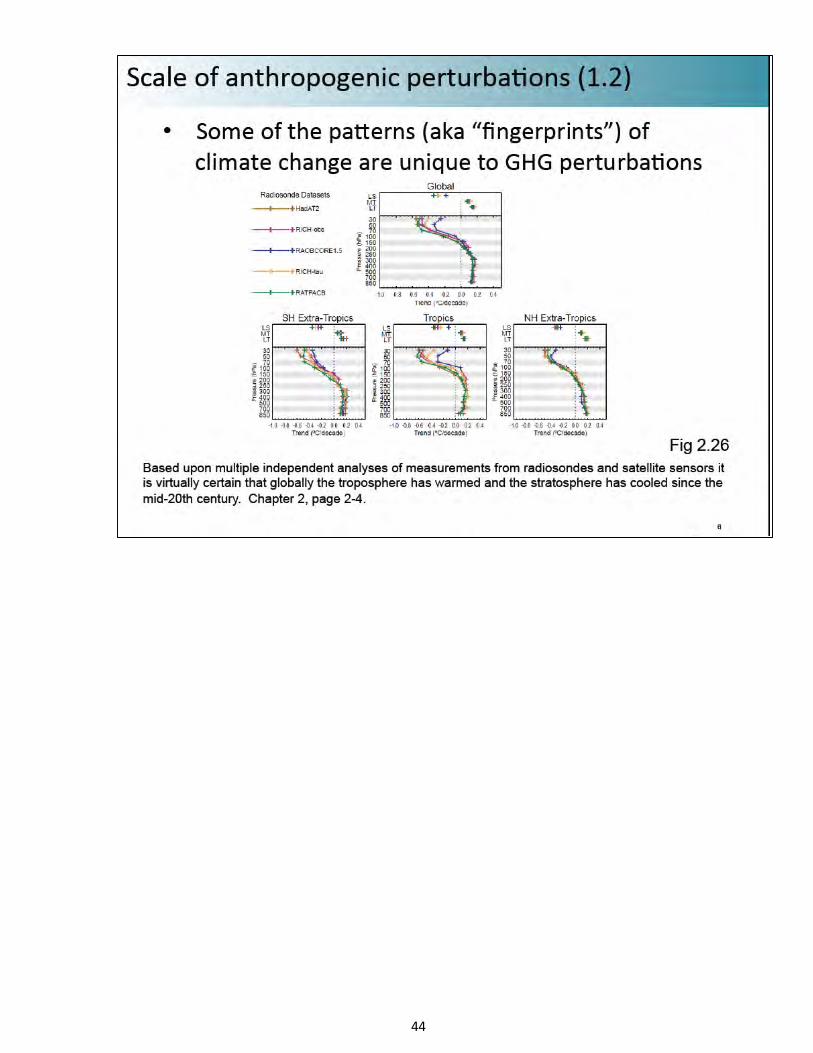
13 And one of the particularly
14 strong fingerprints for global
15 warming is a dipole, warming of the
16 troposphere, cooling of the
17 stratosphere due to the physics of
18 the radiative transfer and the
19 interactions between the two and the
20 effect of carbon dioxide on the
21 stratosphere.
22 The reason I am showing this to
23 you is that this is also a tiny
24 signal. I don't know if you can read
25 these numbers, but they are tenths of
43
44
1 APS CLIMATE CHANGE STATEMENT REVIEW WORKSHOP
2 a degree Celsius per decade. So,
3 these are small numbers, but this
4 dipole is a very robust pattern.
5 And more interestingly, and
6 this is the insight Ben had almost 20
7 years ago, 25 years ago, this pattern
8 is very hard to get from sources of
9 climate change other than well-mixed
10 greenhouse gases.
11 So, I won't go through this
12 graph. We can come back to it at the
13 end in discussion. But one can
14 compute, for example, what would
15 happen if the sun increased its
16 luminosity.
17 The earth's atmosphere includes
18 a lot of gases that are quite
19 effective absorbers of infrared in
20 which he finds that, when you
21 increase luminosity, you heat the
22 whole column.
23 You don't heat just the
24 troposphere and the close the
25 stratosphere. You heat everything
45
1 APS CLIMATE CHANGE STATEMENT REVIEW WORKSHOP
2 because, of course, the ozone in the
3 stratosphere is also an excellent
4 absorber.
5 Volcanos have sort of the same
6 effect, although in the opposite
7 direction. So essentially, we don't
8 know the physical mechanism for
9 getting this dipole out of solar
10 variations, volcanic variations. The
11 only way that we can explain it is
12 with well-mixed greenhouse gases.
13 DR. KOONIN: And again, the
14 dipole is focused on the warming
15 troposphere?
16 DR. COLLINS: That's correct.
17 That's right. This is one of the
18 reasons why this tiny gradient is
19 actually a very big fingerprint for
20 climate change and one of the reasons
21 we think they can sort this problem
22 out by looking at a signal of
23 well-mixed greenhouse gases that is
24 essentially, we don't know of a
25 mechanism for getting it from natural
46
1 APS CLIMATE CHANGE STATEMENT REVIEW WORKSHOP
2 sources, including natural
3 variability, by the way.
4 So, natural variability, for
5 example, if you were to heat the
6 ocean's surface, because of some
7 internal mode, it would not produce
8 the signal that we are seeing with
9 this dipole. So, that's another
10 reason we are having these boundary
11 conditions.
12 So, I will skip this
13 (indicating slide).
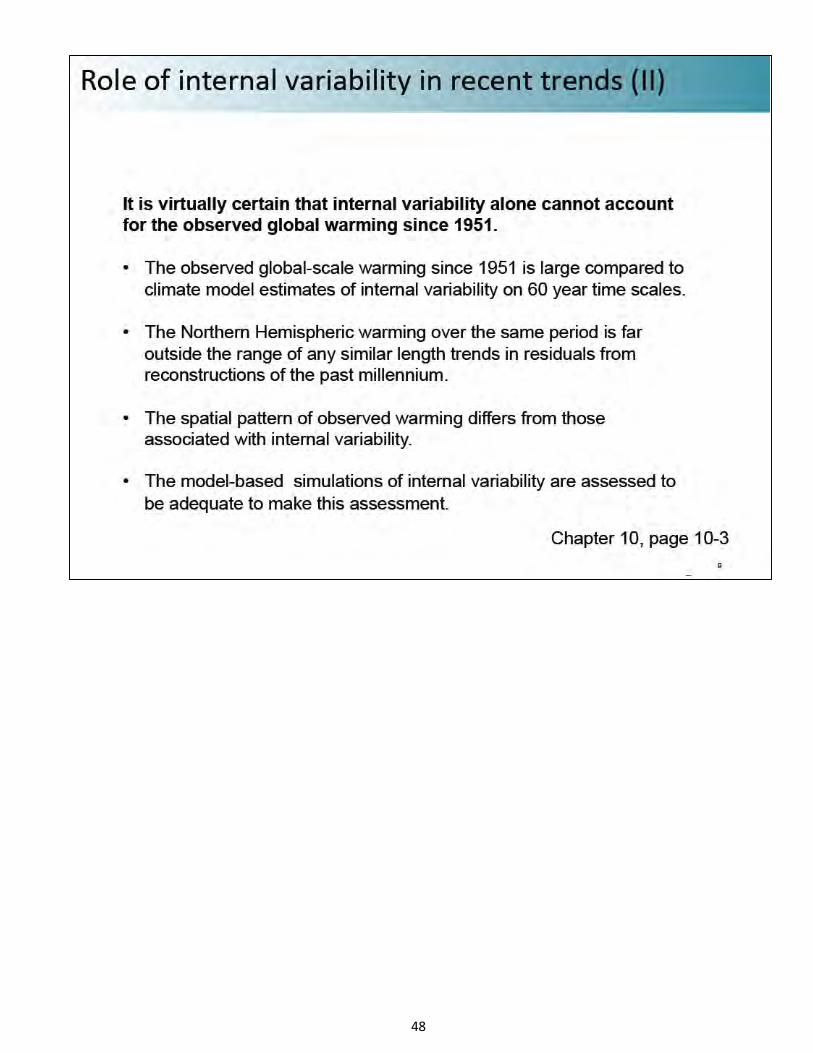
14 So, this [next page] is the reason why
15 there are such strong statements in
16 the report that, "It is virtually
17 certain that internal variability
18 alone," because just heating the
19 ocean alone will not produce this
20 dipole, "cannot account for the
21 observed warming since 1951."
22 There are some other reasons
23 why this warming is large compared to
24 climate model estimates, internal
25 variability. And I will come back to
47
48
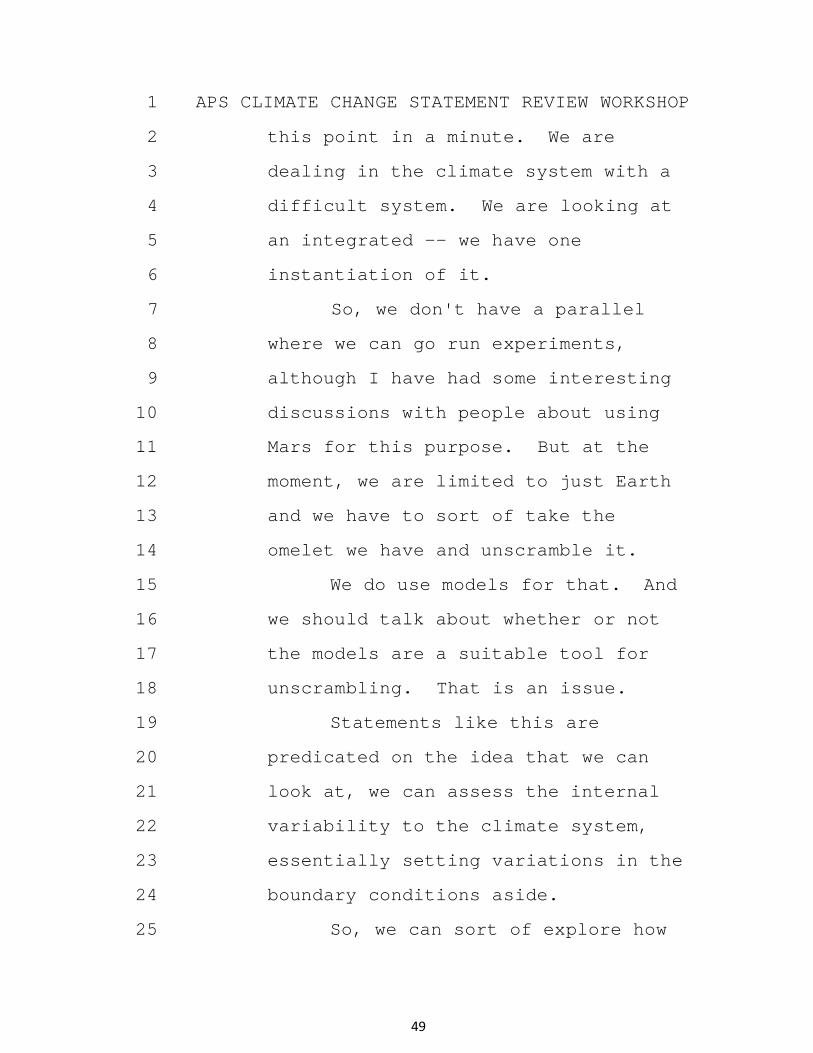
1 APS CLIMATE CHANGE STATEMENT REVIEW WORKSHOP
2 this point in a minute. We are
3 dealing in the climate system with a
4 difficult system. We are looking at
5 an integrated -- we have one
6 instantiation of it.
7 So, we don't have a parallel
8 where we can go run experiments,
9 although I have had some interesting
10 discussions with people about using
11 Mars for this purpose. But at the
12 moment, we are limited to just Earth
13 and we have to sort of take the
14 omelet we have and unscramble it.
15 We do use models for that. And
16 we should talk about whether or not
17 the models are a suitable tool for
18 unscrambling. That is an issue.
19 Statements like this are
20 predicated on the idea that we can
21 look at, we can assess the internal
22 variability to the climate system,
23 essentially setting variations in the
24 boundary conditions aside.
25 So, we can sort of explore how
49
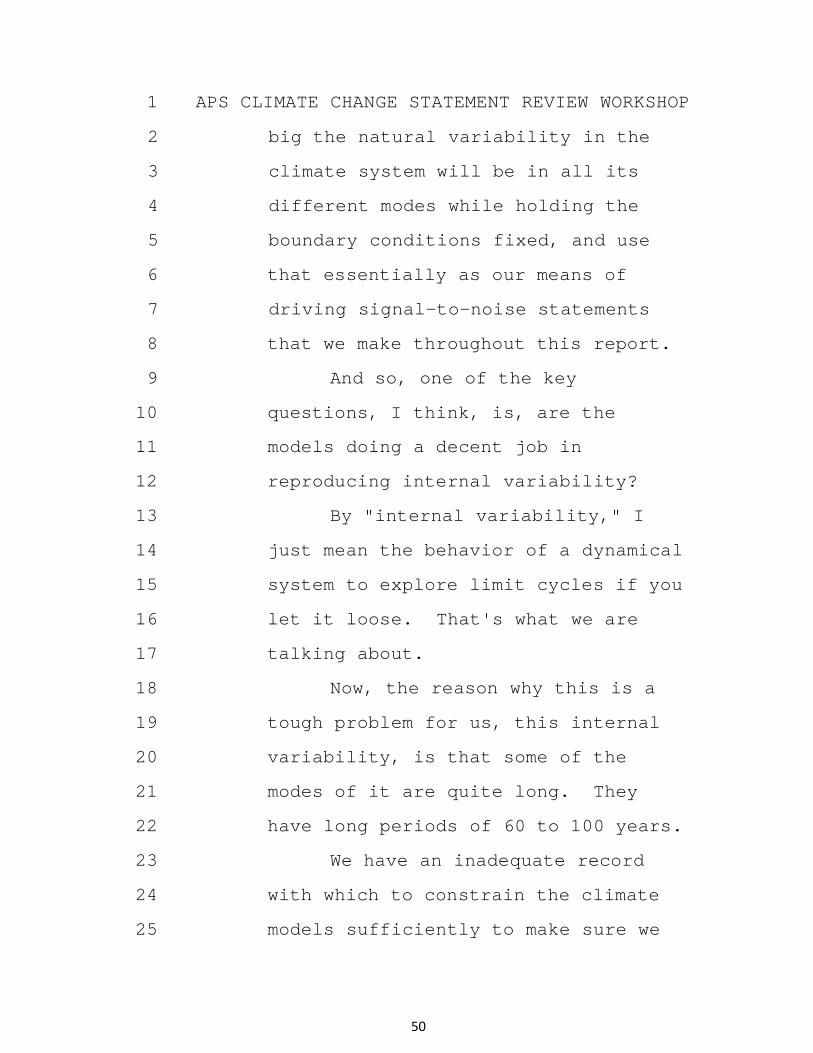
1 APS CLIMATE CHANGE STATEMENT REVIEW WORKSHOP
2 big the natural variability in the
3 climate system will be in all its
4 different modes while holding the
5 boundary conditions fixed, and use
6 that essentially as our means of
7 driving signal-to-noise statements
8 that we make throughout this report.
9 And so, one of the key
10 questions, I think, is, are the
11 models doing a decent job in
12 reproducing internal variability?
13 By "internal variability," I
14 just mean the behavior of a dynamical
15 system to explore limit cycles if you
16 let it loose. That's what we are
17 talking about.
18 Now, the reason why this is a
19 tough problem for us, this internal
20 variability, is that some of the
21 modes of it are quite long. They
22 have long periods of 60 to 100 years.
23 We have an inadequate record
24 with which to constrain the climate
25 models sufficiently to make sure we
50
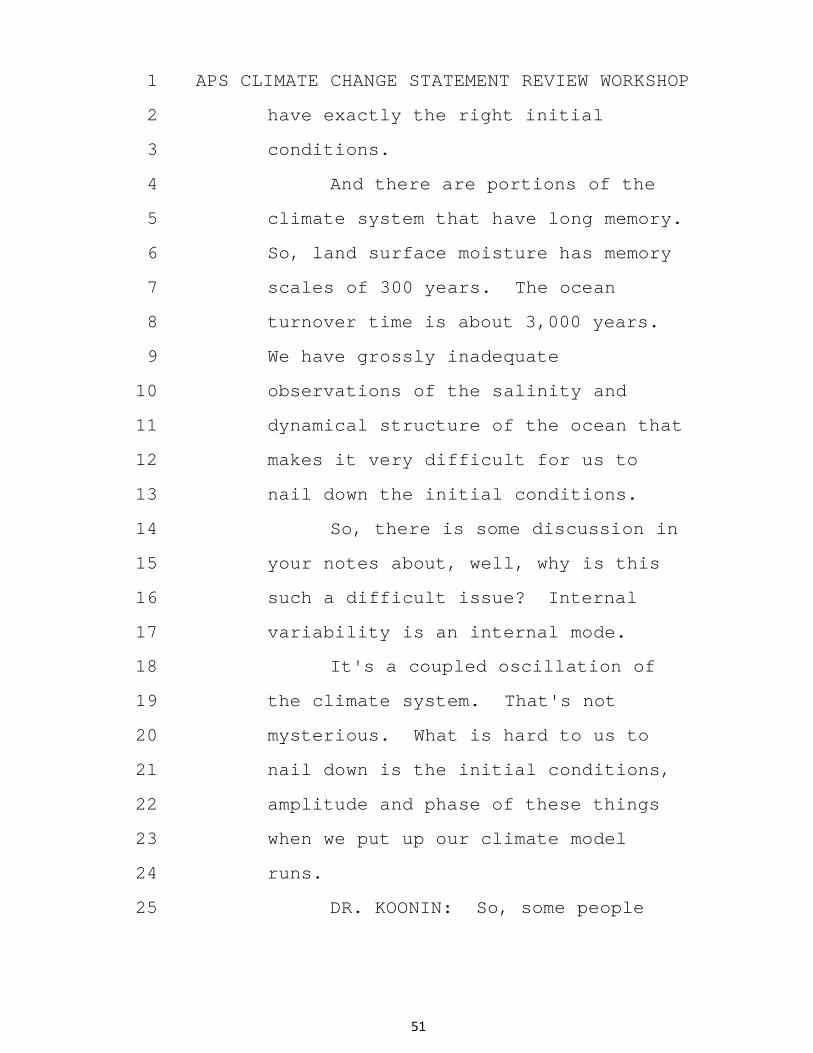
1 APS CLIMATE CHANGE STATEMENT REVIEW WORKSHOP
2 have exactly the right initial
3 conditions.
4 And there are portions of the
5 climate system that have long memory.
6 So, land surface moisture has memory
7 scales of 300 years. The ocean
8 turnover time is about 3,000 years.
9 We have grossly inadequate
10 observations of the salinity and
11 dynamical structure of the ocean that
12 makes it very difficult for us to
13 nail down the initial conditions.
14 So, there is some discussion in
15 your notes about, well, why is this
16 such a difficult issue? Internal
17 variability is an internal mode.
18 It's a coupled oscillation of
19 the climate system. That's not
20 mysterious. What is hard to us to
21 nail down is the initial conditions,
22 amplitude and phase of these things
23 when we put up our climate model
24 runs.
25 DR. KOONIN: So, some people
51
1 APS CLIMATE CHANGE STATEMENT REVIEW WORKSHOP
2 explore “if I initialize the ocean in
3 a different way –“
4 DR. COLLINS: Yes.
5 DR. KOONIN: They do?
6 DR. COLLINS: We have certainly
7 done so. They do that. And, in
8 fact, the ensembles, one of the other
9 dimensions in this data set that we
10 produced are perturbed initial
11 condition ensembles.
12 So, on top of all the
13 multiplicity, multiple scenarios,
14 multiple models, each model is
15 typically initialized with five to
16 ten different initial conditions and
17 then run forward in time so that we
18 can average out the effects of
19 uncertainty in the initial
20 conditions. And so, that is
21 explored.
22 And the ocean, that is
23 typically done in a separate mode.
24 But yes, that has also been explored
25 and it's not a major driver for the
52
1 APS CLIMATE CHANGE STATEMENT REVIEW WORKSHOP
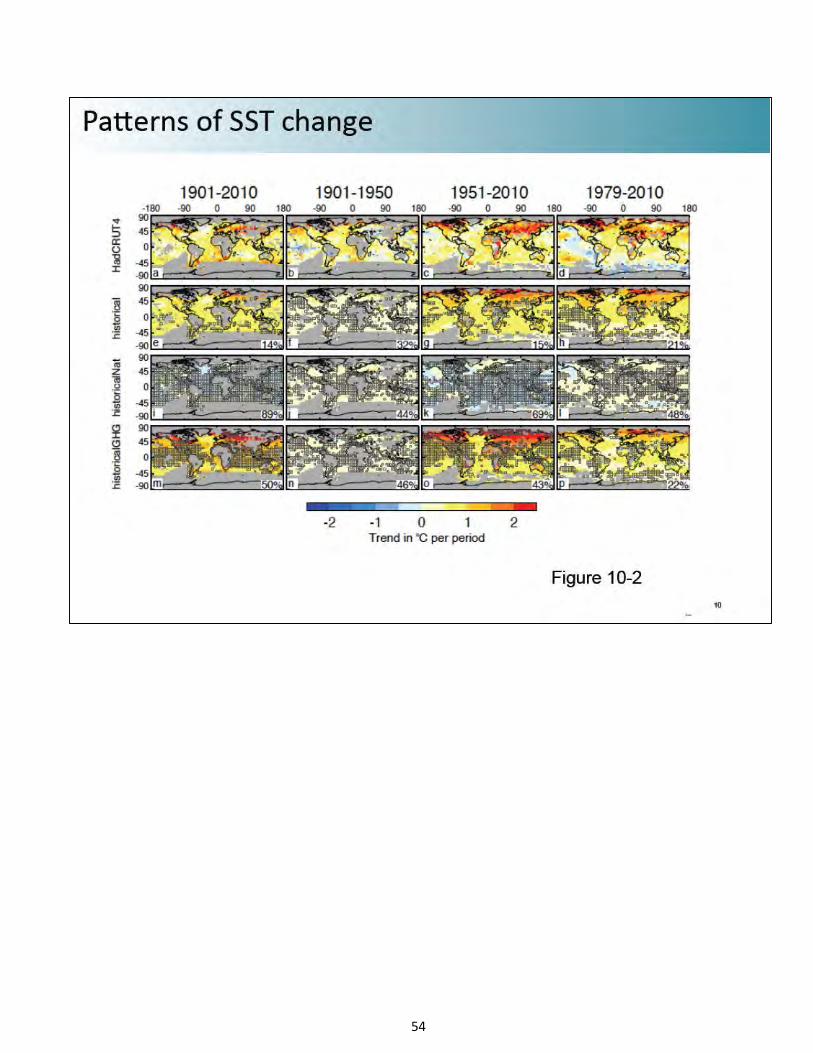
2 results I am going to show you.
3 Anyway, the IPCC concluded,
4 "Internal variability is unlikely the
5 explanation." And I will show you a
6 little bit more of that in a moment.
7 This is actually from a figure by
8 Jones that was then quoted in the
9 IPCC report. [next page]
10 And you will get a copy of this
11 in my presentation along with the
12 source citation and the notes that
13 went along with it.
14 But the top line of this figure
15 shows temperature change over various
16 periods of time from a temperature
17 reconstruction. And what you will
18 notice is that, if you take a run
19 called historical in the middle which
20 is the next row down.
21 And then these are model runs,
22 the second row from the top, and
23 apply to it our best knowledge of
24 radiative forcing. You will
25 qualitatively reproduce those
53
54
1 APS CLIMATE CHANGE STATEMENT REVIEW WORKSHOP
2 patterns.
3 Places without hashing are
4 places where the data and the model
5 are in agreement. If you go down to
6 the third row from the top and just
7 apply reconstruction of natural
8 forcings from volcanos and from the
9 sun, you notice that most of the
10 figures are hashed and we cannot
11 reproduce, according to our models,
12 we cannot reproduce the historical
13 record.
14 Again, let's be very clear.
15 These statements hinge on the
16 fidelity of models. That's the
17 reason why I included this statement.
18 We did look at this issue. How badly
19 would the models have to be wrong for
20 these statements of attribution to be
21 blown?
22 And chapter 10, which deals
23 with detection and attribution
24 concluded that we have to be
25 underestimating the variability by a
55
1 APS CLIMATE CHANGE STATEMENT REVIEW WORKSHOP
2 factor of three. And we don't see
3 any evidence for that. Let me show
4 you one of the sources for this
5 statement.
6 So, the lower graph is the one
7 I wanted to focus on. [next page] It's CMIP5.
8 It's a measure of standard deviation
9 in temperature, standard deviation in
10 time. And the observations are
11 plotted on top of model results.
12 And you can see that there is
13 no -- and we will go through exact
14 error analysis here -- but the
15 evidence shows on the basis of this
16 graph, at least, the observations and
17 the models lie on top of each other
18 in terms of their estimates of
19 temporal variation in temperature.
20 DR. KOONIN: Bill, we want to
21 finish in five minutes.
22 DR. COLLINS: Yes, I know. I
23 am going to accelerate.
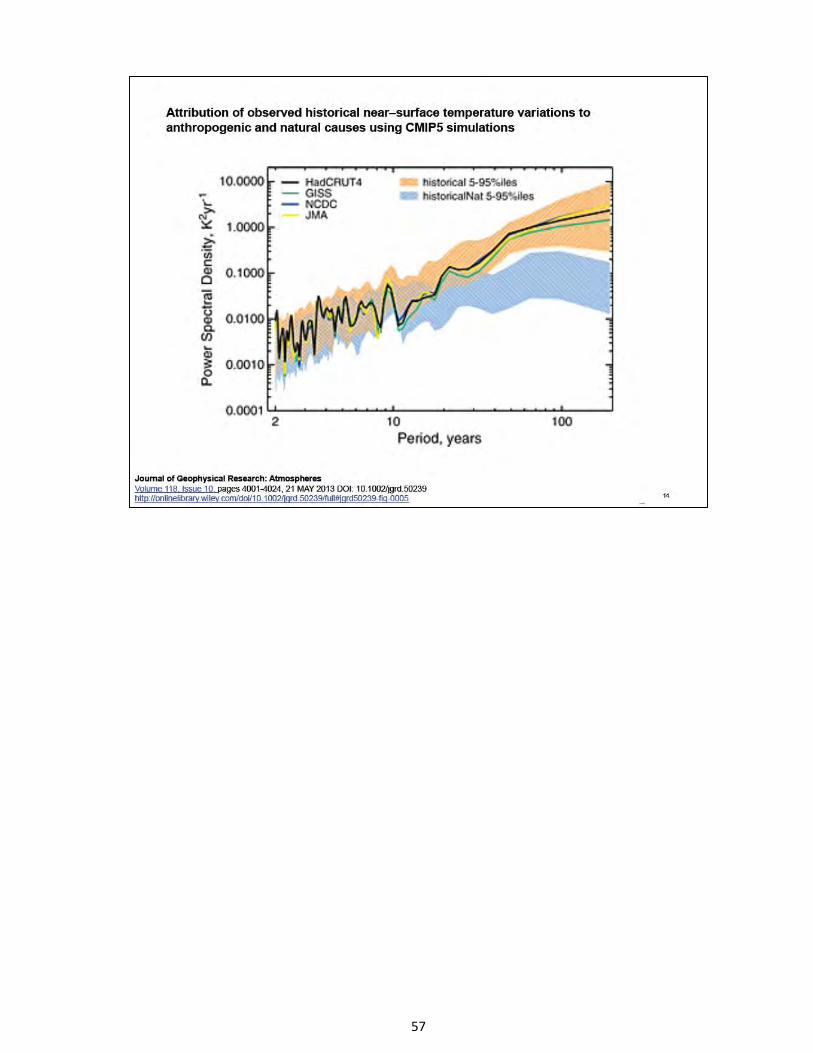
24 This [next page] is also another way of
25 looking at the same problems. This
56
57
1 APS CLIMATE CHANGE STATEMENT REVIEW WORKSHOP
2 is spectral power difference, now on
3 a much longer time scale. This is
4 over a century. And the data that is
5 shown in black, green, blue and
6 yellow are observational estimates of
7 that power spectrum.
8 The orange on this figure are
9 the historical reconstructions of
10 models which overlay the model
11 estimates. And it you take out the
12 variations in the boundary
13 conditions, you get the light blue
14 period.
15 And what you find is you start
16 really misrepresenting or
17 underestimating the power in the
18 climate system once you get out
19 beyond about 20 years, 20 to 30
20 years.
21 There is a real departure
22 between a run with and without
23 anthropogenic influences, especially
24 in longer time periods. Again, this
25 is the evidence that we think we are
58
1 APS CLIMATE CHANGE STATEMENT REVIEW WORKSHOP
2 getting variability about right.
3 And this [next page] is the projection
4 of the natural modes. I won't go
5 through this. But this is, again,
6 evidence, what this graph shows, and
7 I will be happy to talk about this in
8 questions, we don't think there is a
9 lot of power associated with these
10 longer modes. We did leave open that
11 question to IPCC.
12 Okay, there are a few nits I
13 want to pick here. So, one [next page] of
14 them, you were looking at a chapter dealing
15 with the ocean and said well, look,
16 we only have 10-percent confidence we
17 separate long-term trends from
18 regular variability.
19 You are looking at a section of
20 the report that dealt with ocean
21 dynamics and not with temperature.
22 So that, I think, was a point of
23 perhaps slight misreading of the IPCC
24 report on the part of people who put
25 together those notes.
59
60
1 APS CLIMATE CHANGE STATEMENT REVIEW WORKSHOP
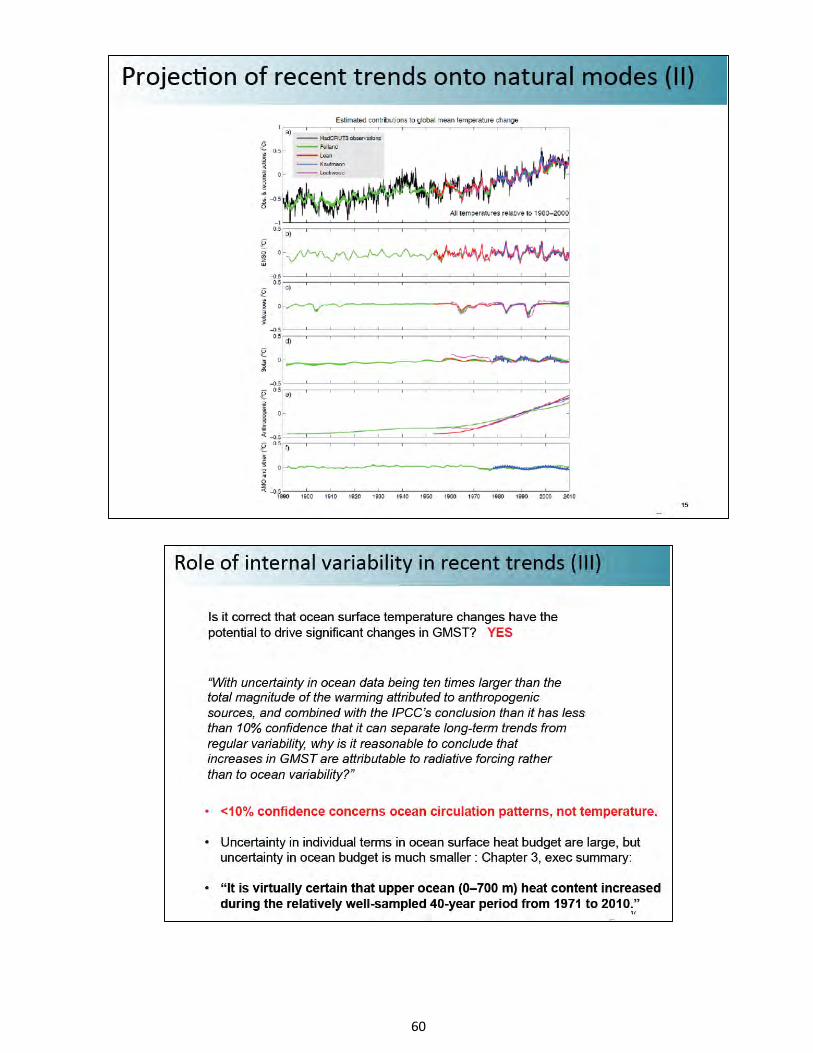
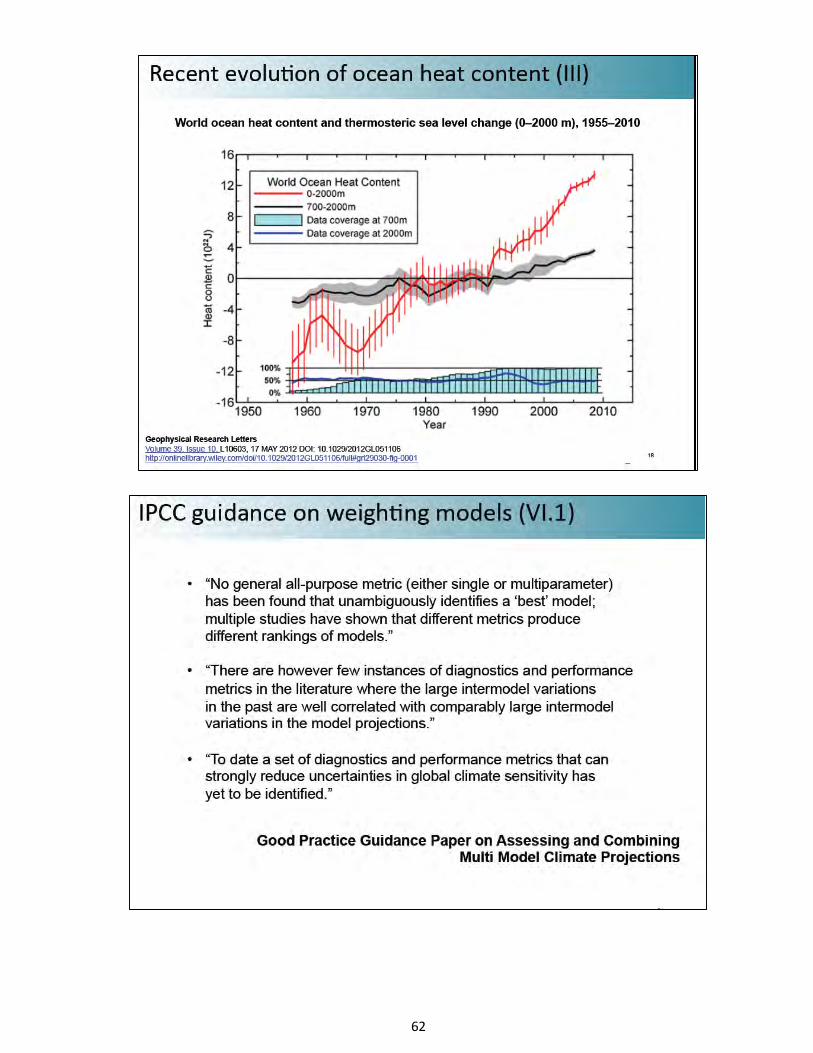
2 We are virtually certain that
3 the ocean heat content has increased.
4 This is a graph [next page] showing you
5 in tens of zettajoules the ocean heat
6 content. The heat content for the
7 upper two kilometers of the ocean is
8 shown in red with error bars and the
9 coverage of the globe is shown in
10 that light blue in the bottom of the
11 graph.
12 We have very good coverage.
13 There is a reason why those error
14 bars come down so sharply by the year
15 2010. And we are quite confident
16 that the ocean heat content has been
17 increasing since the start of this
18 record 50 years ago.
19 I am not going to have time to
20 talk about model ensembles. I will
21 be happy to come back to this in
22 question. So, I have some discussion
23 here about how we constructed these,
24 how we dealt with model means.
25 I do want [next page] to point out that
61
62
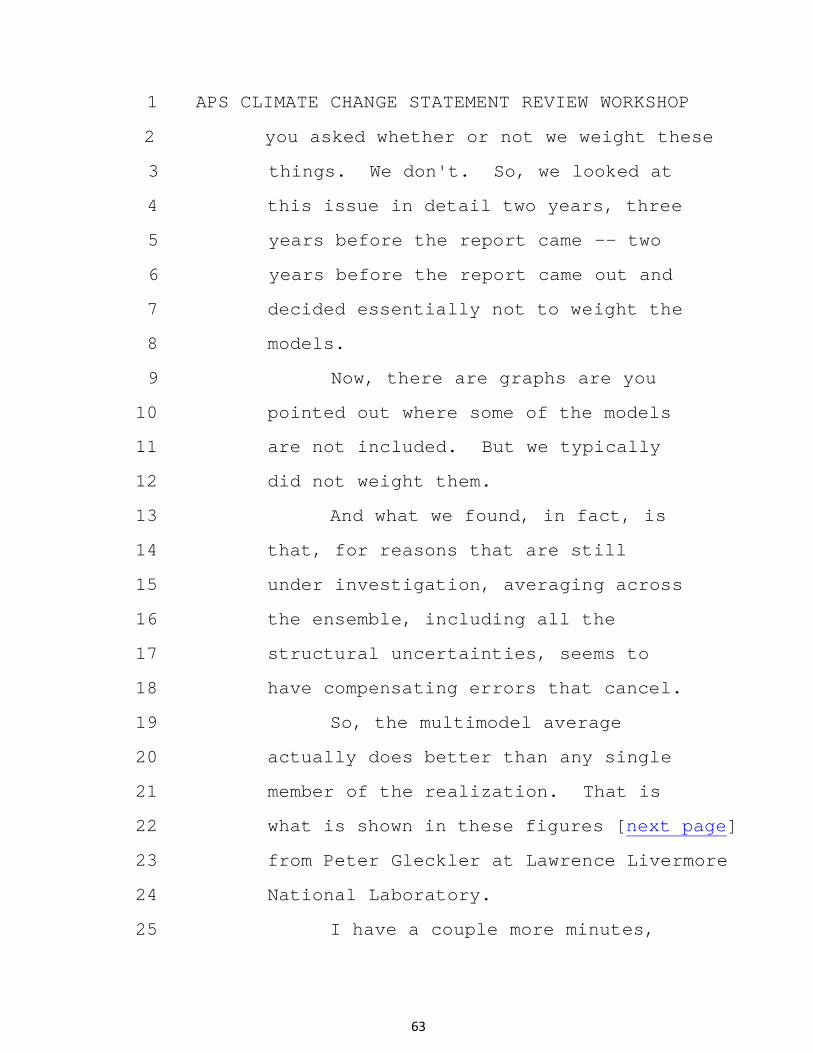
1 APS CLIMATE CHANGE STATEMENT REVIEW WORKSHOP
2 you asked whether or not we weight these
3 things. We don't. So, we looked at
4 this issue in detail two years, three
5 years before the report came -- two
6 years before the report came out and
7 decided essentially not to weight the
8 models.
9 Now, there are graphs are you
10 pointed out where some of the models
11 are not included. But we typically
12 did not weight them.
13 And what we found, in fact, is
14 that, for reasons that are still
15 under investigation, averaging across
16 the ensemble, including all the
17 structural uncertainties, seems to
18 have compensating errors that cancel.
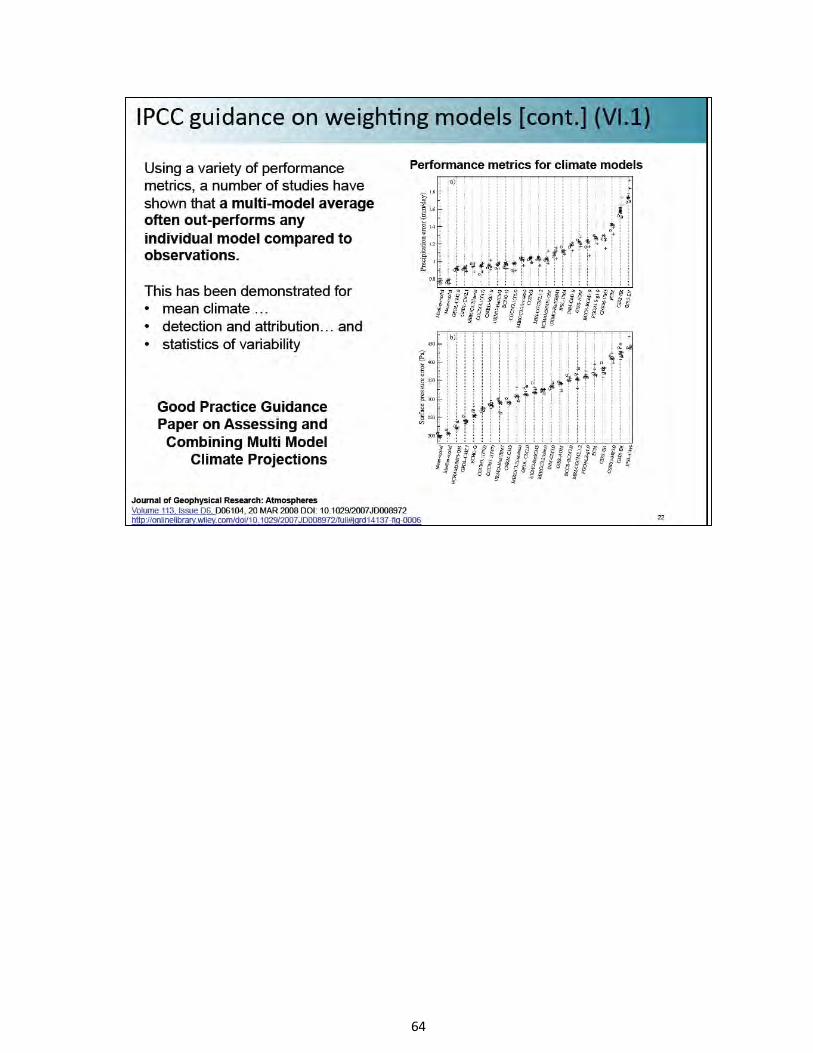
19 So, the multimodel average
20 actually does better than any single
21 member of the realization. That is
22 what is shown in these figures [next page]
23 from Peter Gleckler at Lawrence Livermore
24 National Laboratory.
25 I have a couple more minutes,
63
64
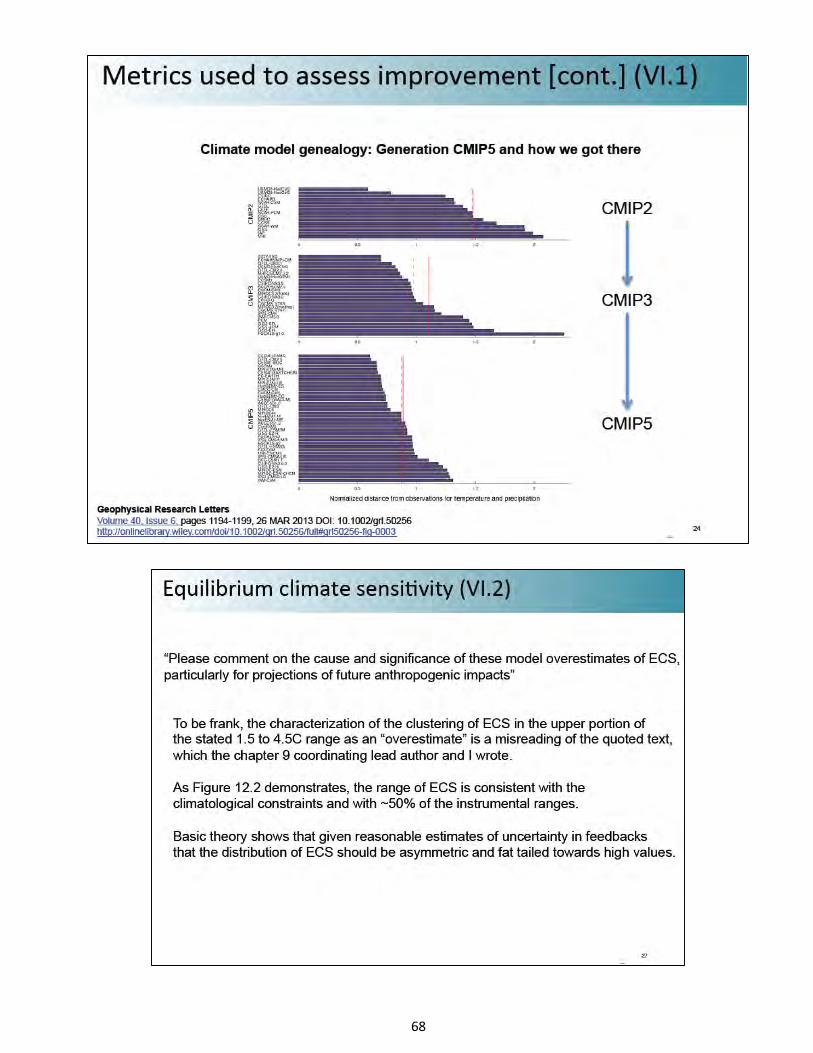
1 APS CLIMATE CHANGE STATEMENT REVIEW WORKSHOP
2 and so I wanted to also point out to
3 you since you raised the issue what
4 metrics you used to assess
5 improvement. And this is a figure
6 from my chapter.
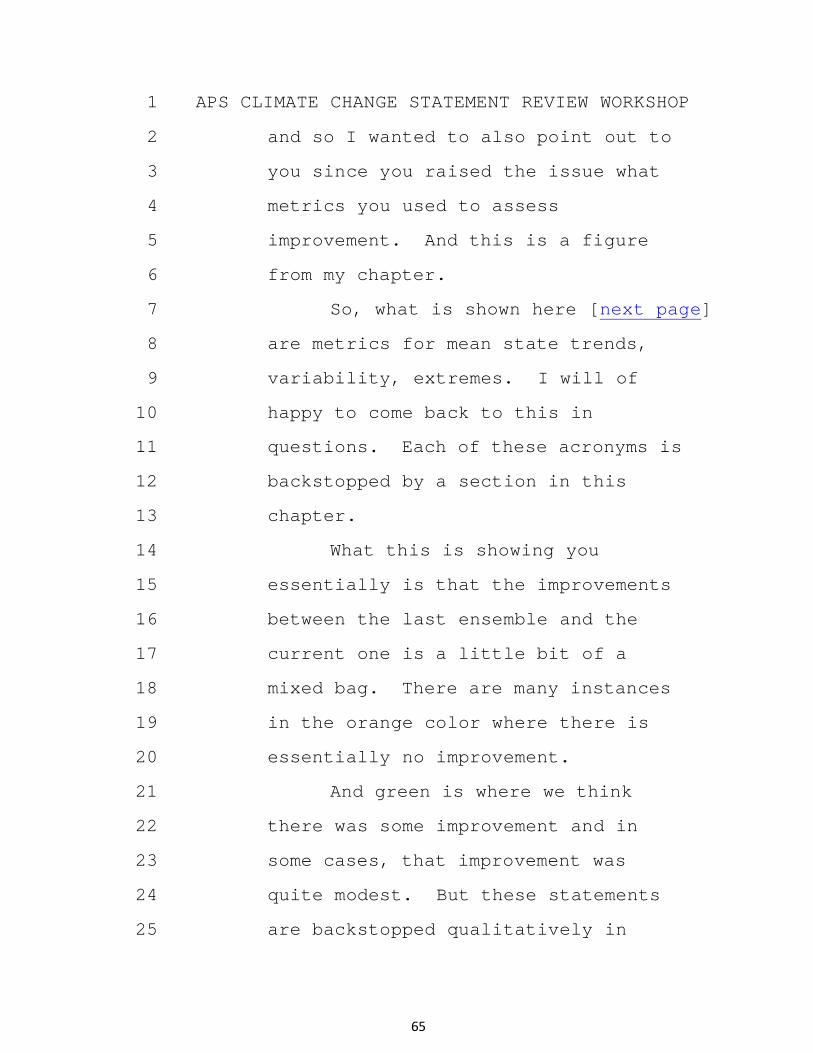
7 So, what is shown here [next page]
8 are metrics for mean state trends,
9 variability, extremes. I will of
10 happy to come back to this in
11 questions. Each of these acronyms is
12 backstopped by a section in this
13 chapter.
14 What this is showing you
15 essentially is that the improvements
16 between the last ensemble and the
17 current one is a little bit of a
18 mixed bag. There are many instances
19 in the orange color where there is
20 essentially no improvement.
21 And green is where we think
22 there was some improvement and in
23 some cases, that improvement was
24 quite modest. But these statements
25 are backstopped qualitatively in
65
66
1 APS CLIMATE CHANGE STATEMENT REVIEW WORKSHOP
2 chapter 9. I will be happy to come
3 back to this point in question.
4 And further evidence that the
5 ensemble will improve in time, this
6 [next page] is actually from a paper by
7 Reto Knutti showing errors in precipitation
8 between this ensemble two generations
9 ago and the current one, showing how
10 the mean and the range has been
11 collapsing with time.
12 These are errors in
13 precipitation and temperature, so,
14 direct evidence that the model
15 ensemble has been improving.
16 I will skip this because Ben is
17 going to cover it (indicating slide).
18 I am going to use my last
19 40 seconds wisely. So [next page], one of
20 the statements that was in your notes
21 was, "Please comment on the cause and
22 significance of these model
23 overestimates of equilibrium
24 sensitivity, particularly for
25 projections of future anthropogenic
67
68
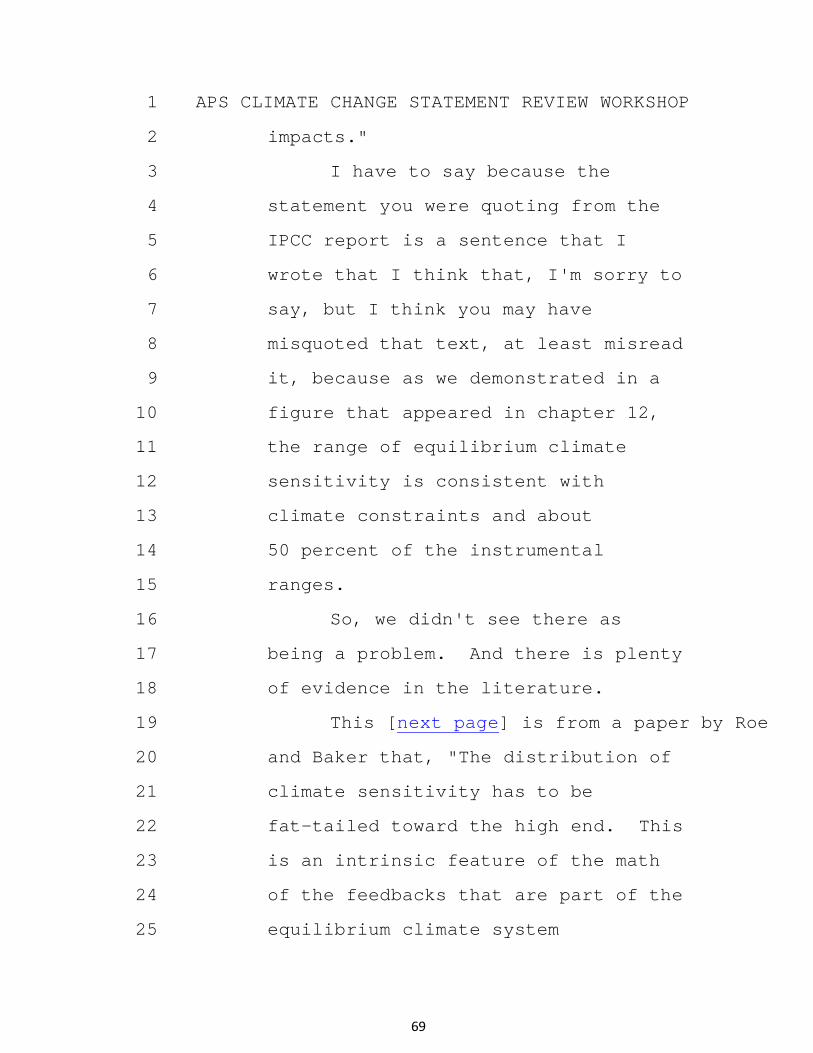
1 APS CLIMATE CHANGE STATEMENT REVIEW WORKSHOP
2 impacts."
3 I have to say because the
4 statement you were quoting from the
5 IPCC report is a sentence that I
6 wrote that I think that, I'm sorry to
7 say, but I think you may have
8 misquoted that text, at least misread
9 it, because as we demonstrated in a
10 figure that appeared in chapter 12,
11 the range of equilibrium climate
12 sensitivity is consistent with
13 climate constraints and about
14 50 percent of the instrumental
15 ranges.
16 So, we didn't see there as
17 being a problem. And there is plenty
18 of evidence in the literature.
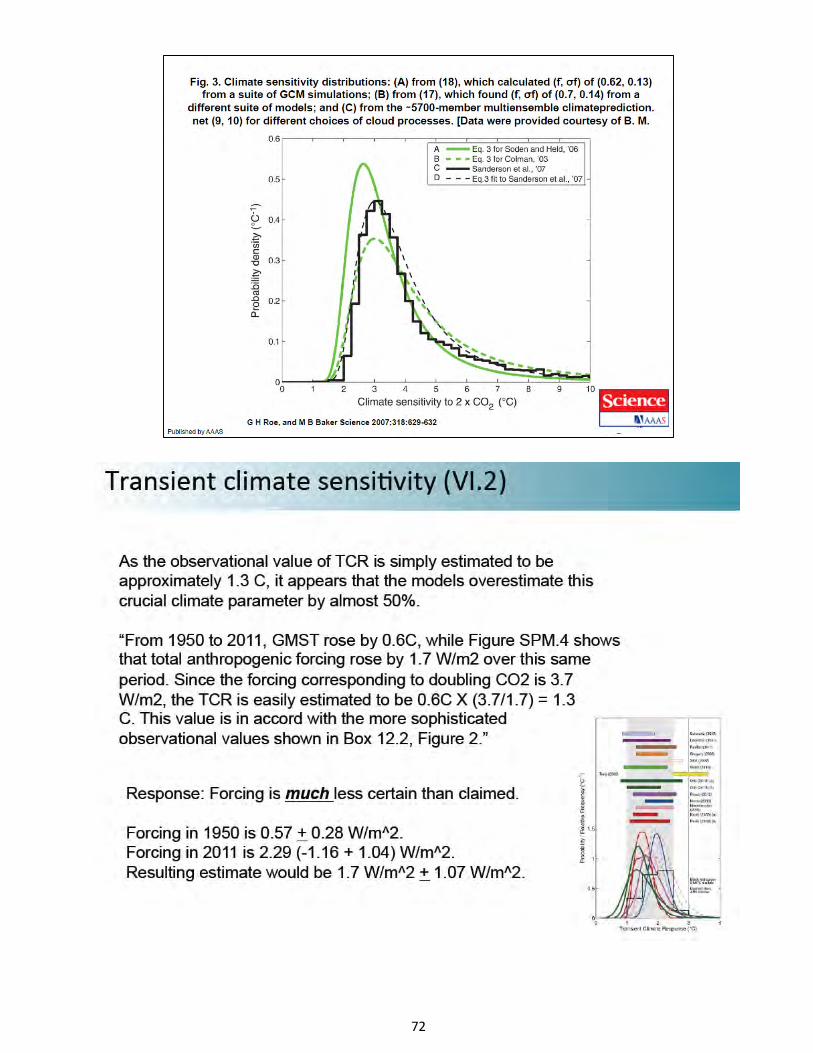
19 This [next page] is from a paper by Roe
20 and Baker that, "The distribution of
21 climate sensitivity has to be
22 fat-tailed toward the high end. This
23 is an intrinsic feature of the math
24 of the feedbacks that are part of the
25 equilibrium climate system
69
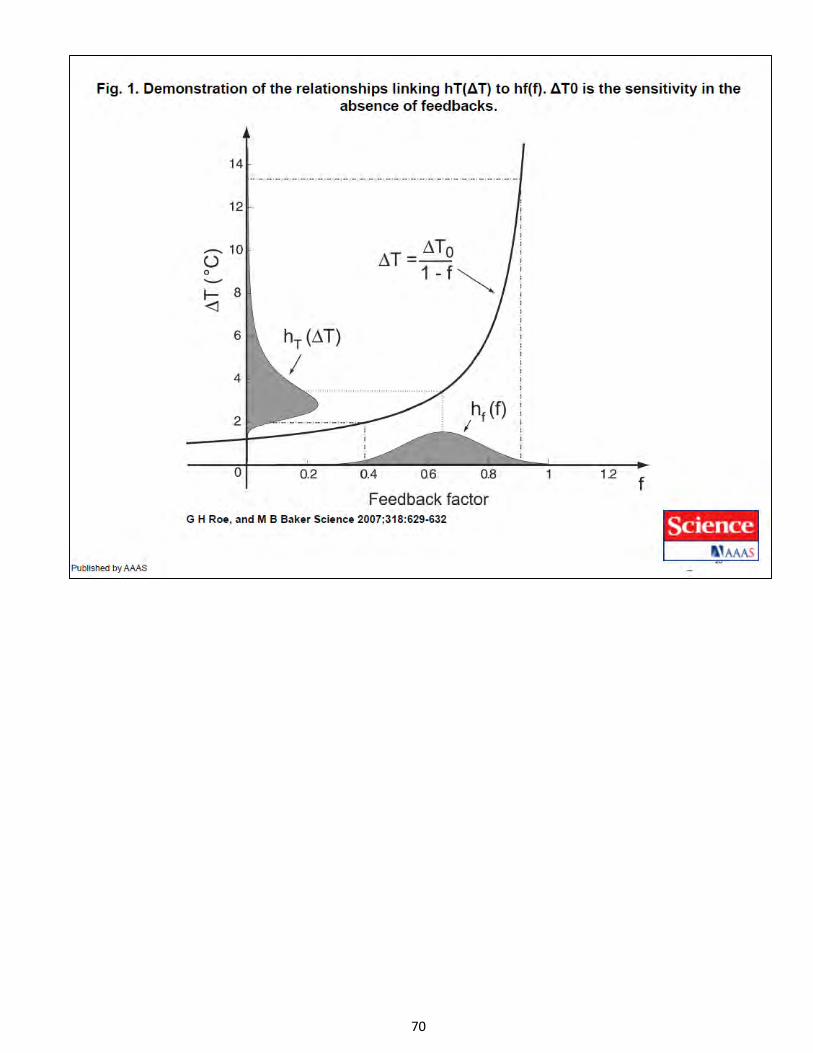
70
1 APS CLIMATE CHANGE STATEMENT REVIEW WORKSHOP
2 calculation."
3 So [next page], you are going to tend
4 to see models sort of turning toward
5 this fat-tail to a high climate sensitivity
6 seems to be just part of the math. You
7 can't avoid it.
8 The last thing I want to end on,
9 and this [next page] is my last slide, is,
10 and I think a number of other people
11 will go to bat on this particular
12 issue. I am just going to deal with
13 the issue, a very simple one.
14 There are more sophisticated
15 analyses you will hear later in the
16 day about error propagation.
17 So, one of the interesting
18 footnotes in your notes was dealing
19 with your estimate of transient
20 climate response, which is how much
21 climate response, say, of doubling of
22 carbon dioxide, say, 70 years just in
23 relation.
24 This is not the asymptote.
25 This is the intermediate response to
71
72
1 APS CLIMATE CHANGE STATEMENT REVIEW WORKSHOP
2 the climate system to being forced
3 with greenhouse gases. And we
4 typically use a number for what would
5 happen if you doubled carbon dioxide.
6 And you posed the question or
7 at least raised the issue it appears
8 the models are overestimating this by
9 about 50 percent relative to the
10 back-of-the envelope calculation that
11 you have in your notes, which I
12 quoted here.
13 You used the central estimate
14 of the forcing. This is one of the
15 issues with this estimate. There
16 will be others. But you used the
17 central estimate of the forcing for
18 that calculation. And the forcing,
19 as I pointed out, is much less
20 certain than claimed.
21 So, I am quoting you here, now,
22 the numbers from the report. You
23 looked at the difference between 2010
24 and 1950 and said, oh look, it's 1.7.
25 What if, in fact, it's 1.7 plus or
73
1 APS CLIMATE CHANGE STATEMENT REVIEW WORKSHOP
2 minus one watt per meter squared?
3 If you do the most naïve
4 propagation of that, through the
5 calculation you will find that you
6 get, the range of this explodes
7 toward the high end.
8 And, in fact, there is no, as
9 far as we can tell, no issue with the
10 time and transient climate response,
11 at least based on this using this
12 kind of back-of-envelope calculation.
13 So, this is one of those places
14 where I think we greatly appreciate
15 all the attention that you paid to
16 the report. You clearly read it very
17 carefully, disturbingly carefully.
18 This is one of the places where
19 I think this simple addition to your
20 calculation would, I think, would
21 help improve the interpretation of
22 the results.
23 DR. KOONIN: Will these
24 uncertainties in the forcings get
25 propagated into the projections for
74
1 APS CLIMATE CHANGE STATEMENT REVIEW WORKSHOP
2 the next several decades or into the
3 projection after 2100?
4 DR. COLLINS: They are sort of
5 inadvertently in the following sense.
6 We have looked carefully at the range
7 of aerosol radiative forcing, which
8 is the major driver for the
9 uncertainty in the present day in the
10 climate models.
11 And it's actually larger than
12 one. I think it is one watt per meter
13 squared that is quoted in here.
14 So, the models are started from
15 actually a quite diverse set of
16 estimates for the aerosol radiative
17 forcing under present-day conditions
18 relative to preindustrial.
19 So yes, in some sense, it was
20 propagated, although I have to say,
21 sort of unintentionally, but it has
22 been propagated into the ensemble.
23 With that, let me conclude and
24 see what questions you have for me.
25 Thank you very much.
75
1 APS CLIMATE CHANGE STATEMENT REVIEW WORKSHOP
2 DR. KOONIN: Thanks for getting
3 us off to a good start.
4 DR. COLLINS: Good, Thank you.
5 DR. KOONIN: The floor is open.
6 Subcommittee first. Go ahead, Bob.
7 DR. ROSNER: So, I guess I
8 don't understand the issue of the
9 weighting.
10 DR. COLLINS: Yes.
11 DR. ROSNER: Or not weighting.
12 DR. COLLINS: Yes.
13 DR. ROSNER: Clearly, the
14 models, I have seen graphs that show
15 the various capabilities, claimed
16 capabilities of the models, and they
17 are remarkably diverse.
18 DR. COLLINS: Yes.
19 DR. ROSNER: And having uniform
20 weighting seems, to me, surprising,
21 to say the least. So, I just don't
22 get it.
23 DR. COLLINS: One of the key
24 questions, I think, that the subtext,
25 I think, for your question is how
76
1 APS CLIMATE CHANGE STATEMENT REVIEW WORKSHOP
2 contingent are findings, well, first
3 off, would weighting be a sensible
4 idea?
5 I am going to answer a second
6 question which you implicitly asked
7 first. How robust are our results to
8 the presence or absence of weighting?
9 In other words, that's one way of
10 putting it.
11 DR. ROSNER: Let me add
12 something to it. I asked earlier
13 about the models because obviously,
14 there are two kinds of errors, right,
15 the errors with the data that you
16 spoke about and then the errors
17 having to do with model
18 uncertainties.
19 DR. COLLINS: That's correct.
20 DR. ROSNER: And to me it's
21 completely unclear which dominate,
22 especially if you don't have really
23 good estimates for what the model
24 errors would be.
25 DR. COLLINS: That's right.
77
1 APS CLIMATE CHANGE STATEMENT REVIEW WORKSHOP
2 Ben, may I just check, Isaac, and I
3 will come back to you in a second.
4 Could I just check with you, are you
5 going to discuss your PNAS paper
6 showing the robustness of the water
7 vapor attribution to scrambling model
8 error and the ranking of the models?
9 Is that something you are going to
10 show?
11 DR. SANTER: I suspect I am
12 going to run into the same difficulty
13 that you did. So, I do have it in my
14 talk, but it's right at the end. So,
15 if I don't cover the detection and
16 attribution and the hiatus, I won't
17 get to it.
18 DR. KOONIN: We will make sure
19 to ask about it.
20 DR. COLLINS: Robert, before I
21 take Isaac's point, one of the
22 figures I had to rush over because
23 Ben is the author and I defer to him,
24 we have an example of attributing
25 change in atmospheric moisture.
78
1 APS CLIMATE CHANGE STATEMENT REVIEW WORKSHOP
2 And the question is what if you
3 rank the models or weighted them or
4 used a subset of them, depending on
5 which fidelity to which metric, how
6 robust are the results to that?
7 And you can show actually
8 through a careful common study that
9 the results are remarkably robust
10 regardless of how you rank the models
11 according to whatever weighting
12 scheme you want. And Ben explored
13 several.
14 So, this is an example where
15 the detection and attribution of
16 anthropogenic signal is remarkably
17 insensitive to how one precisely
18 weights the models, which I would
19 regard as a confidence-building
20 measure because that weighting is
21 highly subjective.
22 Let me come back to Ike's
23 question.
24 DR. KOONIN: Ike doesn't get to
25 talk yet!
79
1 APS CLIMATE CHANGE STATEMENT REVIEW WORKSHOP
2 So, I have a question. What is
3 the gateway for getting included in
4 CMIP5 ensemble? If I write a model,
5 it would probably be pretty lousy and
6 pretty simple, if I could do it
7 at all. Can I get included? Who decides
8 what gets included?
9 DR. COLLINS: So, you have to
10 meet some experimental protocols.
11 But there is a statement. One of the
12 statements in this good guidance
13 document [next page] is that there is --
14 so, I will be honest with you. It sort of
15 shocked me.
16 One of the statements in this
17 good guidance document, and you can
18 find it yourselves, so I am just
19 going to quote it to you, "There is
20 no minimum fidelity requirement for
21 inclusion in the ensemble."
22 DR. KOONIN: So, how was the
23 ensemble, in fact, constructed? Is
24 it just everybody who came forward
25 and said "I have got a model," or was
80
81
1 APS CLIMATE CHANGE STATEMENT REVIEW WORKSHOP
2 there some hurdle that you had to get
3 over?
4 DR. COLLINS: Well, the models,
5 of course, we are not inviting models
6 that have been scrawled down on
7 somebody's shower wall.
8 DR. KOONIN: I understand that.
9 DR. COLLINS: Right? So,
10 assuming these models, they are
11 backstopped by peer-reviewed
12 literature.
13 So, the Working Group 1 climate
14 models issues letter of invitation to
15 the major modeling centers in the
16 world, and these entities are
17 well-known, to submit findings to the
18 IPCC. So, there are about 25 of
19 these letters that go out.
20 And there are new groups that
21 submitted runs or runs that weren't
22 directly commissioned as part of the
23 CMIP5 for analysis. So, it is
24 actually a quite democratic process.
25 DR. KOONIN: Yes.
82
1 APS CLIMATE CHANGE STATEMENT REVIEW WORKSHOP
2 DR. COLLINS: So, the results
3 are not biased by some sort of
4 preconceived notion of the fact that
5 the model has to be exhibiting nice,
6 robust climate change, just to sort
7 of take that off the table.
8 DR. KOONIN: The ensemble
9 consists of how many models
10 altogether?
11 DR. COLLINS: 45, roughly.
12 DR. KOONIN: I cannot believe
13 that you or Ben or other people who
14 look at them closely don't have some
15 favorites.
16 DR. COLLINS: Oh, sure we do.
17 DR. KOONIN: You must have
18 favorites because you think they do
19 better?
20 DR. COLLINS: Well, we don't
21 think. We know.
22 DR. KOONIN: So, what happens
23 if you take only the models that do
24 better and look at all the kinds of
25 results you have been showing us?
83
1 APS CLIMATE CHANGE STATEMENT REVIEW WORKSHOP
2 DR. COLLINS: So, may I, I am
3 going to elect to deflect -- may I,
4 Steve, to deflect that question to
5 Ben?
6 DR. KOONIN: Okay. You can
7 answer now, Ben, or when you have the
8 floor in an hour or so.
9 DR. SANTER: In the study that
10 Bill mentioned or paper published in
11 PNAS 2009, we looked at that
12 question, whether it made a
13 difference in terms of our ability to
14 identify a human fingerprint on
15 changes in atmospheric moisture over
16 oceans if one used just the top ten
17 models in some Letterman-type sense,
18 or the bottom ten.
19 And we selected those top ten
20 and bottom ten models in 70 different
21 ways looking at a whole bunch of
22 different metrics, how well these
23 models captured today's mean state,
24 seasonal cycle and amplitude and
25 pattern of variability for water
84
1 APS CLIMATE CHANGE STATEMENT REVIEW WORKSHOP
2 vapor and ocean surface temperature.
3 It turned out that in that
4 particular study, it didn't make much
5 of a difference because the
6 underlying physics was very simple.
7 Essentially, you heat the surface.
8 You heat the lower atmosphere. Water
9 vapor increases.
10 Because of the non-linearities,
11 you get the biggest bang for your
12 buck over the warmest areas of the
13 ocean in equatorial regions. And
14 that sort of equatorial amplification
15 for water vapor is very different
16 from the dominant pattern of natural
17 variability which has this
18 El Niño-like, horseshoe-type pattern.
19 DR. KOONIN: How about if you
20 go to projections over two decades,
21 five decades? Presumably the width
22 gets narrower in the dispersion of
23 the ensemble, among the best, or not?
24 DR. SANTER: Well, you are
25 saying if one looks for clever
85
1 APS CLIMATE CHANGE STATEMENT REVIEW WORKSHOP
2 transfer functions between
3 present-day observables and the
4 projection uncertainty. So, lots of
5 people have been trying to do that.
6 DR. COLLINS: That turns out to
7 be, I quoted statements from this
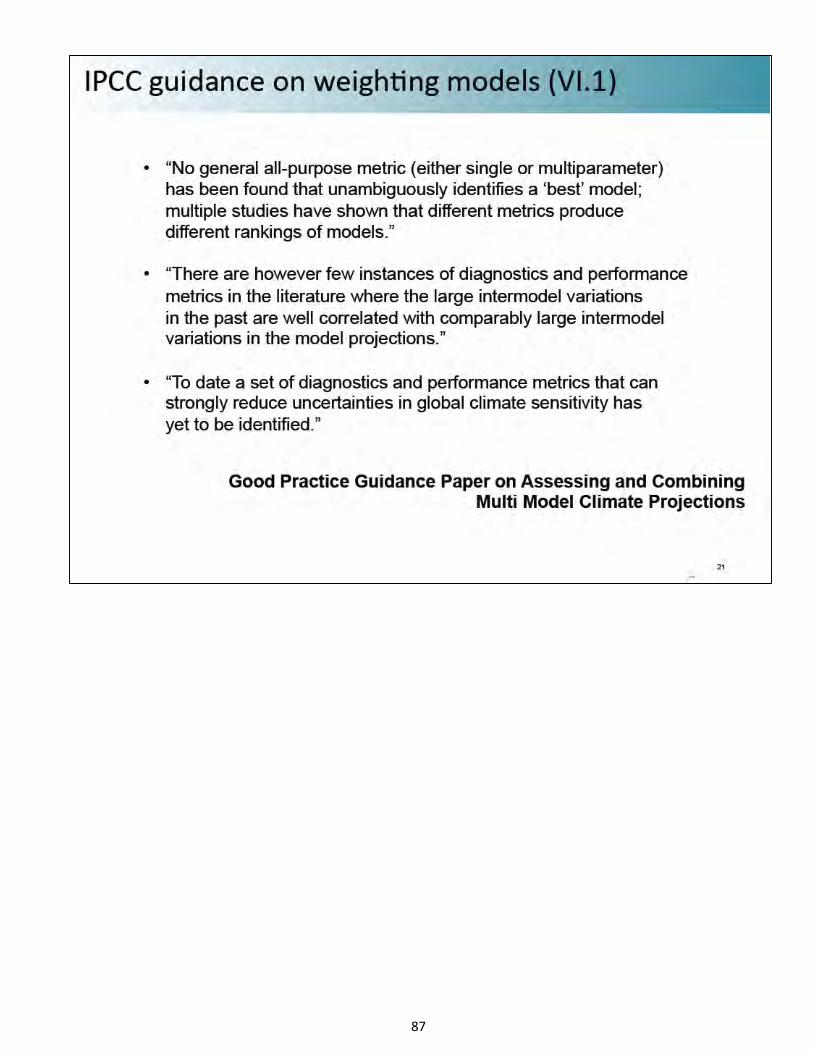
8 expert document. But let me just
9 show those to you. This again [next page],
10 this is the guidance on weighting models,
11 which is this good practice paper.
12 And you can get it off the IPCC's
13 website. So, let me just read these
14 so they are on the record.
15 (Reading): "No general,
16 all-purpose metric has been found
17 that unambiguously identifies a best
18 model. Multiple studies have shown
19 that different metrics produce
20 different rankings of models."
21 And so, for example, some
22 models do a great job of reproducing
23 internal variability. Other models
24 do a great job reproducing a
25 time-mean climatology. In many cases
86
87
1 APS CLIMATE CHANGE STATEMENT REVIEW WORKSHOP
2 those are not the same model.
3 (Reading): "There are few
4 instances of diagnostics where larger
5 intermodel variations in the past are
6 well-correlated with comparably large
7 intermodel variations in the model
8 projections."
9 It actually turns out to be
10 very hard to use past as prologue.
11 That's the bottom line here. And
12 believe me, a lot of people are
13 looking.
14 And there are some spectacular
15 examples. For example, snowfall,
16 that is possible, or snow coverage.
17 But there are very few examples in
18 literature. And this has been done
19 exhaustively using ensembles of
20 hundred-thousand member ensembles;
21 very little luck there so far.
22 Finally, and this is perhaps
23 the core thing for a group like this,
24 we don't have a first-principles
25 theory that tells us what we have to
88
1 APS CLIMATE CHANGE STATEMENT REVIEW WORKSHOP
2 get right in order to have an
3 accurate projection.
4 So, let's just make sure that
5 that's clear. We do not have a
6 first-principles theory for that.
7 This is sort of an emergent knowledge
8 base.
9 So, that's the translation of
10 this last statement, "To date, a set
11 of diagnostics and performance
12 metrics that can strongly reduce
13 uncertainties in global climate
14 sensitivity," a la projections, "has
15 yet to be identified."
16 DR. KOONIN: I am happy to take
17 one more question, but I want to move
18 on so we can try to stay on time.
19 Ike, did you have --
20 DR. COLLINS: Isaac had a
21 point, I think.
22 DR. HELD: No.
23 DR. KOONIN: Phil?
24 MR. COYLE: I understand that
25 Ben is going to talk about the hiatus
89
1 APS CLIMATE CHANGE STATEMENT REVIEW WORKSHOP
2 later.
3 DR. SANTER: Yes.
4 MR. COYLE: But while you have
5 the floor, do you have any comments
6 you want to make? You must get
7 questions about that all the time.
8 DR. COLLINS: Well, yes. That
9 actually was dealt with by chapter 9,
10 which is the chapter I was on. I
11 think you accurately captured the
12 state of the field currently.
13 We are unsure about what -- we
14 know that there are several possible
15 causes. And they are stated in the
16 report. And also, you capture them
17 correctly as well.
18 They could be errors in the
19 forcing. It could being a mode of
20 natural variability that the models
21 are not correctly reproducing. And
22 it could be cases or it could be that
23 the models are overly sensitive. And
24 so, all three are noted in that the
25 IPCC report and will be actively
90
1 APS CLIMATE CHANGE STATEMENT REVIEW WORKSHOP
2 investigated.
3 I do not have an opinion. We
4 thought while we were writing this
5 report that it was aerosols. And
6 there were a number of -- people
7 became very alarmed. There were four
8 meetings that went into this report,
9 four face-to-face meetings.
10 As of the second, we were
11 having these frantic meetings between
12 people like myself on radiative
13 forcing and the later chapters that
14 were looking at these projections
15 saying oh, my God. The models are
16 running hot. Why are they running
17 hot? By "running hot," I mean
18 running hot for 2011, 2012 as we were
19 writing the report.
20 So, there was a lot of
21 speculation that the projections had
22 sort of overcooked the level of air
23 pollution controls that were going to
24 cause aerosol loading to decrease in
25 the near future. That is a plausible
91
1 APS CLIMATE CHANGE STATEMENT REVIEW WORKSHOP
2 explanation.
3 Other people have looked at
4 subtle amounts of volcanic activity
5 that have since gone undetected.
6 This is work by Susan Solomon, other
7 changes in the stratosphere. This is
8 one of those topics that I think is
9 going to have to be sorted out.
10 Now, I am hedging a bet
11 because, to be honest with you, if
12 the hiatus is still going on as of
13 the sixth IPCC report, that report is
14 going to have a large burden on its
15 shoulders walking in the door,
16 because recent literature has shown
17 that the chances of having a hiatus
18 of 20 years are vanishingly small.
19 DR. KOONIN: Okay, thank you.
20 DR. COLLINS: Thank you.
21 DR. KOONIN: All right. I have
22 got to say, I come away, Bill, and
23 thanks for being so clear, that this
24 business is even more uncertain than
25 I thought, uncertainties in the
92
1 APS CLIMATE CHANGE STATEMENT REVIEW WORKSHOP
2 forcing, uncertainties in the
3 modeling, uncertainties in historical
4 data. Boy, this is a tough business
5 to navigate.
6 DR. COLLINS: Can I respond to
7 that?
8 DR. KOONIN: Yes, please.
9 DR. COLLINS: I mean, yes and
10 no. The first calculations of
11 greenhouse gas warming done by
12 Arrhenius were done using the tools
13 of the trade circa 1880.
14 And he got most of the facts
15 right because he knew, obviously, how
16 to alter the greenhouse effect of the
17 climate system and could write down
18 essentially a zero-dimensional model
19 of the climate system which
20 reproduces a lot of the qualitative
21 behavior we see here.
22 So yes, we are asking the
23 climate models to do things that --
24 we are no longer looking at this as a
25 point problem, which is the way
93
1 APS CLIMATE CHANGE STATEMENT REVIEW WORKSHOP
2 Arrhenius looked at it. We are
3 looking at the model in detail as we
4 have in the past.
5 But I think to come away with
6 the fact this whole thing is highly
7 uncertain, we fail to recognize both
8 the insight that Arrhenius had, which
9 I think still holds true today, and
10 the fact that the climate models,
11 despite the fact that they have those
12 uncertainties, have on a number of
13 cases predicted behavior that was
14 subsequently verified, which is
15 certainly a nice thing to see in
16 cosmology. And it's very nice to see
17 in the climate.
18 There is actually a beautiful
19 book written by Ray Pierrehumbert
20 called "The Warming Papers." I
21 strongly urge you to look at that
22 book because it deal with -- there
23 are a number of cases where the
24 climate models anticipated behavior
25 the observing systems at the time
94
1 APS CLIMATE CHANGE STATEMENT REVIEW WORKSHOP
2 could not see and they subsequently
3 saw. And these include changes of
4 large scale beyond the earth's
5 atmosphere due, we think, to the
6 influence of energy.
7 So, I want to make sure, Steve,
8 we don't come away with too much.
9 DR. KOONIN: That's good.
10 Okay, Judy, you might as well
11 start taking the podium.
12 DR. LINDZEN: I think there are
13 certain things here that are a little
14 bit peculiar, the business of the
15 fingerprint. The only thing you are
16 saying is when you are nearly
17 transparent to space, you are going
18 to have cooling to space.
19 And when you get further in,
20 you are deep and then you will get
21 warming, but that depends on the
22 feedback. And there is no signature
23 that will distinguish different
24 sensitivities in that. So, it's a
25 little bit awkward.
95
1 APS CLIMATE CHANGE STATEMENT REVIEW WORKSHOP
2 DR. KOONIN: We are going to
3 get onto that, I suspect.
4 DR. LINDZEN: Also, black
5 carbon isn't the only reason you can
6 get the sign wrong.
7 DR. KOONIN: Sure.
8 DR. LINDZEN: Aerosols can, for
9 instance, cause condensation of ice
10 and change the character.
11 DR. KOONIN: That was the
12 indirect aerosol?
13 DR. COLLINS: Yes, Dick is
14 exactly right. There are a number of
15 reasons why the science can change.
16 DR. KOONIN: Judy …?
17 DR. CURRY: I would like to
18 start off, as a member of the
19 Executive Committee of the Topical
20 Group on Climate Change, I would like
21 to applaud this committee for the
22 process that you are undertaking.
23 It is much better than anything
24 that I anticipated and I think it's
25 very good. And this workshop is a
96
1 APS CLIMATE CHANGE STATEMENT REVIEW WORKSHOP
2 real good step and I would like to
3 thank you for inviting me to be a
4 part of it.
5 For a little bit of context for
6 where I am coming from on this issue,
7 I am not involved in the IPCC. I had
8 some minor involvement in a third
9 assessment report as a contributing
10 author and as a reviewer. The more
11 recent ones, I have not been involved
12 at all.
13 I am not a climate modeler,
14 although I use climate models, and
15 some parameterizations for my
16 research group on cloud microphysics
17 and sea ice have made it into a few
18 climate models. But I am not what
19 you would call a climate modeler.
20 My areas of expertise are in
21 clouds including cloud aerosol
22 interactions, sea ice, air/sea
23 interactions and the climate dynamics
24 of extreme events. So, my
25 perspective comes from a little bit
97
1 APS CLIMATE CHANGE STATEMENT REVIEW WORKSHOP
2 more the observational
3 theoretical side than climate
4 modeling. So, it's sort of a
5 counterpoint to some of the other
6 people in the group.
7 And in trying to decide what to
8 cover in 30 minutes, I decided to
9 keep it very focused on your
10 questions and also tried to pick
11 topics that I anticipated other
12 people wouldn't cover that I could
13 speak to with some sort of expertise.
14 So to start [next page], I will
15 address your two first questions which
16 sort of gives you a little bit of a
17 perspective of where I am coming from
18 and the rest of my presentation.
19 So, what do I consider to be
20 the greatest advance? And it's
21 really the narrowing of uncertainty
22 in the aerosol indirect effect.
23 I think this is the biggest
24 deal. It's an important scientific
25 advance, but it has a number of
98
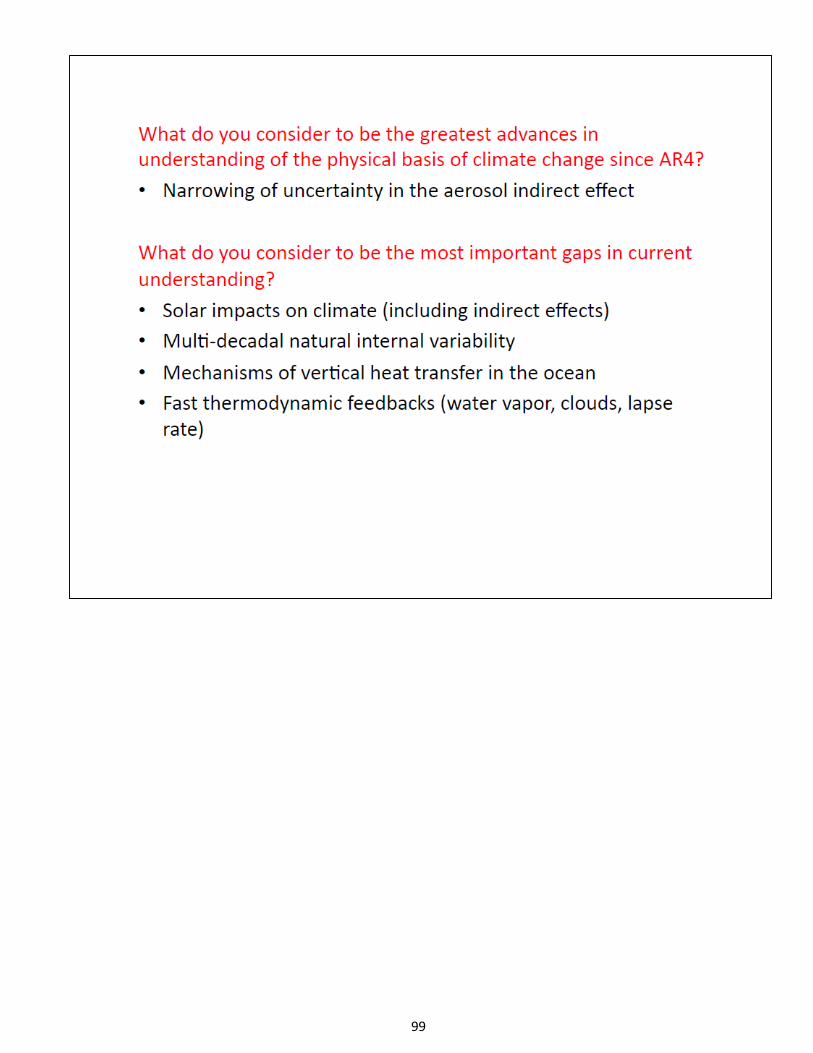
99
1 APS CLIMATE CHANGE STATEMENT REVIEW WORKSHOP
2 implications because we can't so
3 easily blame all the uncertainties on
4 aerosols anymore. It's getting
5 tougher.
6 DR. KOONIN: The uncertainty
7 narrowed and the mean shift also?
9 DR. CURRY: Yes, it's not as
10 big overall as we thought. Yes,
11 there is some canceling of black
12 carbon and other stuff. So, there is
13 less wiggle room and we can't blame
14 everything on aerosols anymore.
15 DR. KOONIN: But it also means
16 that the aerosols are contributing
17 a bit less to cooling. If you start to
18 tune the models, it means the
19 sensitivity is too high.
20 DR. CURRY: Right, it has those
21 implications. I am sure we will be
22 hearing more about that.
23 What do I consider to be the
24 most important gaps in current
25 understanding? The solar impacts,
100
1 APS CLIMATE CHANGE STATEMENT REVIEW WORKSHOP
2 and this is really indirect effects,
3 a whole host of things some of which
4 I will mention later.
5 The issue of multidecadal
6 natural internal variability,
7 mechanisms of vertical heat transfer
8 in the ocean and the fast
9 thermodynamic feedbacks, water vapor
10 clouds and lapse rate, these are the
11 issues that I regard as the biggest
12 outstanding uncertainties.
13 You asked the question with all
14 the things that have to go on in a
15 climate model to get any kind of a
16 plausible agreement between
17 observations and the climate model
18 output, it's fairly amazing when you
19 think about it.
20 Not only do the climate models
21 have to be working, but you have to
22 have confidence in your forcing and
23 in the observations against which you
24 are comparing it with.
25 So, [next page] what do we derive our
101
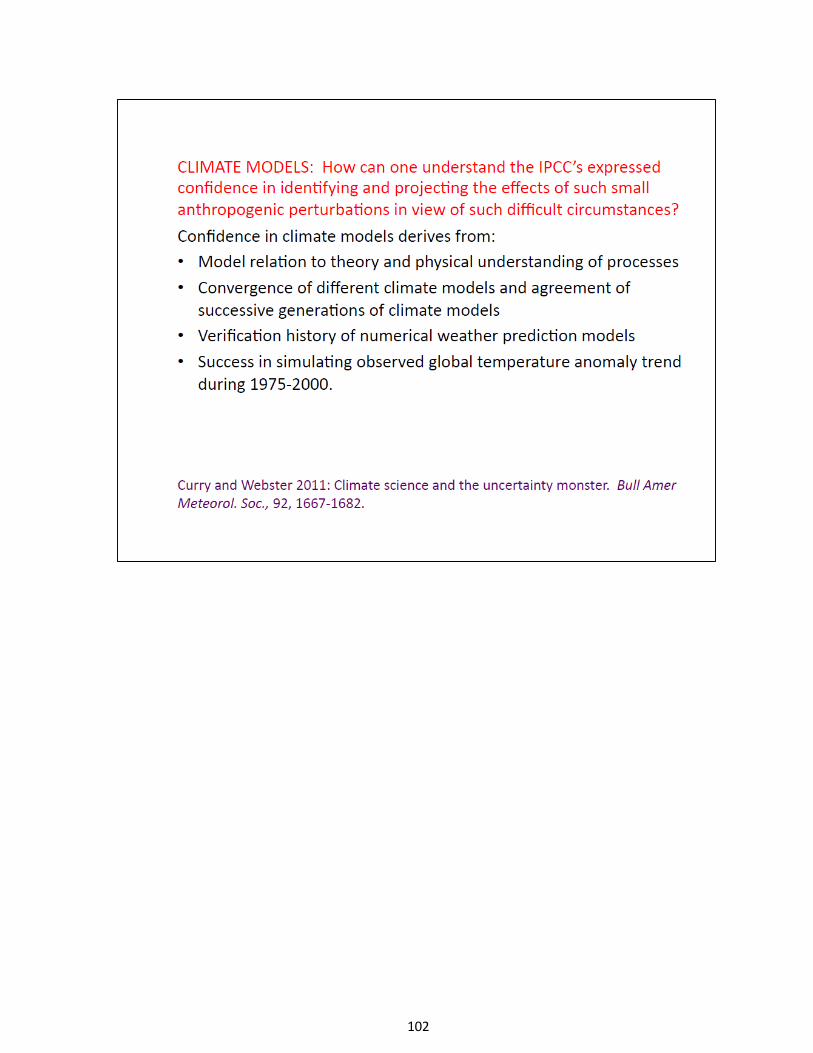
102
1 APS CLIMATE CHANGE STATEMENT REVIEW WORKSHOP
2 confidence in climate models from?
3 We have heard some from Bill already.
4 But we have the model relation to
5 theory and the physical understanding
6 of the processes. Again, these
7 aren't statistical models. They are
8 based on thermodynamics and fluid
9 dynamical equations.
10 The convergence of different
11 climate models and agreement of
12 successive generations of climate
13 models, and then the verification
14 history of numerical weather
15 prediction models also play into
16 this because that is the heritage of
17 the atmospheric piece of this.
18 You know, the fact that we can
19 predict weather using these models
20 trickles down to the confidence of
21 climate models.
22 DR. KOONIN: Just to clarify, a
23 weather model takes the SSTs as a
24 boundary condition?
25 DR. CURRY: It's a boundary
103
1 APS CLIMATE CHANGE STATEMENT REVIEW WORKSHOP
2 condition. It's one piece. It's the
3 atmospheric piece of it, just the
4 atmospheric piece of it.
5 DR. KOONIN: The biosphere,
6 ocean dynamics are not in there.
7 DR. CURRY: And the other thing
8 is, and I was particularly impressed
9 in the AR4 report is a success in
10 simulating the observed global
11 temperature anomaly trend during the
12 period 1975 to 2000.
13 Now, the anomaly trend, climate
14 model results are presented usually
15 in terms of anomaly trends. If you
16 actually look at the absolute
17 temperatures from the climate models,
18 it doesn't look so pretty.
19 This [next page] is from a recent article.
20 I guess my references are given at
21 the back, from Fyfe, et al. And you
22 can see there is a spread of several
23 degrees centigrade amongst the CMIP5
24 ensemble, the actual model climate.
25 Some of them do a pretty good job of
104
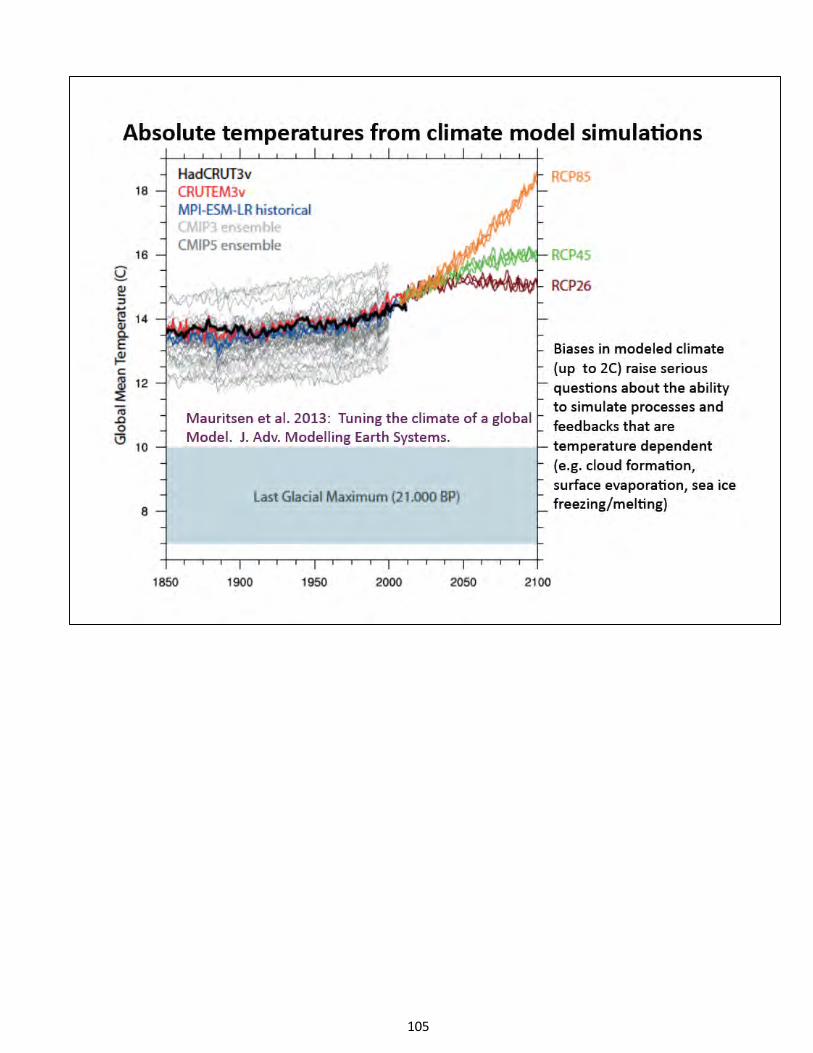
105
1 APS CLIMATE CHANGE STATEMENT REVIEW WORKSHOP
2 reproducing, but some of them are off
3 by several degrees.
4 And you say, well, it's just
5 the anomaly in the trend that
6 matters. But again, to the extent
7 that thermodynamics is important like
8 the melting temperature of snow and
9 sea ice and the formation of clouds
10 and the Clausius-Clapeyron Equation
11 is temperature-dependent, you know,
12 these temperature errors do matter.
13 And I would just love to know
14 because some of these are very far
15 off, at what temperature do they
16 actually melt sea ice? I would like
17 to know.
18 DR. KOONIN: The implication
19 being that it has been tuned?
20 DR. CURRY: Yes, there is a lot
21 of tuning that goes on. And it's
22 actually, I think, a relatively
23 difficult thing to even get the
24 climatology. I think the better
25 models that Bill discussed and his
106
1 APS CLIMATE CHANGE STATEMENT REVIEW WORKSHOP
2 favorites, I suspect, are ones that
3 do a reasonable job of model
4 climatology. I don't know.
5 But this is the spread of more
6 than 2C is larger than the trend that
7 we have seen. So, this is something
8 to keep in mind that it's a very hard
9 thing to do to get all of this right.
10 The stasis,[next page] okay, to what do
11 I attribute the stasis? Well, I think
12 it's predominantly an issue of
13 natural internal variability. And I
14 will talk more about this in a
15 minute. There is potential for solar
16 effects, but again, this is in
17 known/unknown territory.
18 I am not convinced by arguments
19 related to Chinese power plants,
20 reductions in CFCs and volcanic
21 activity. I don't think these are
22 very convincing. When I was at the
23 AGU meeting, American Geophysical
24 Union, people were talking about oh,
25 the hiatus has gone away. It's not a
107
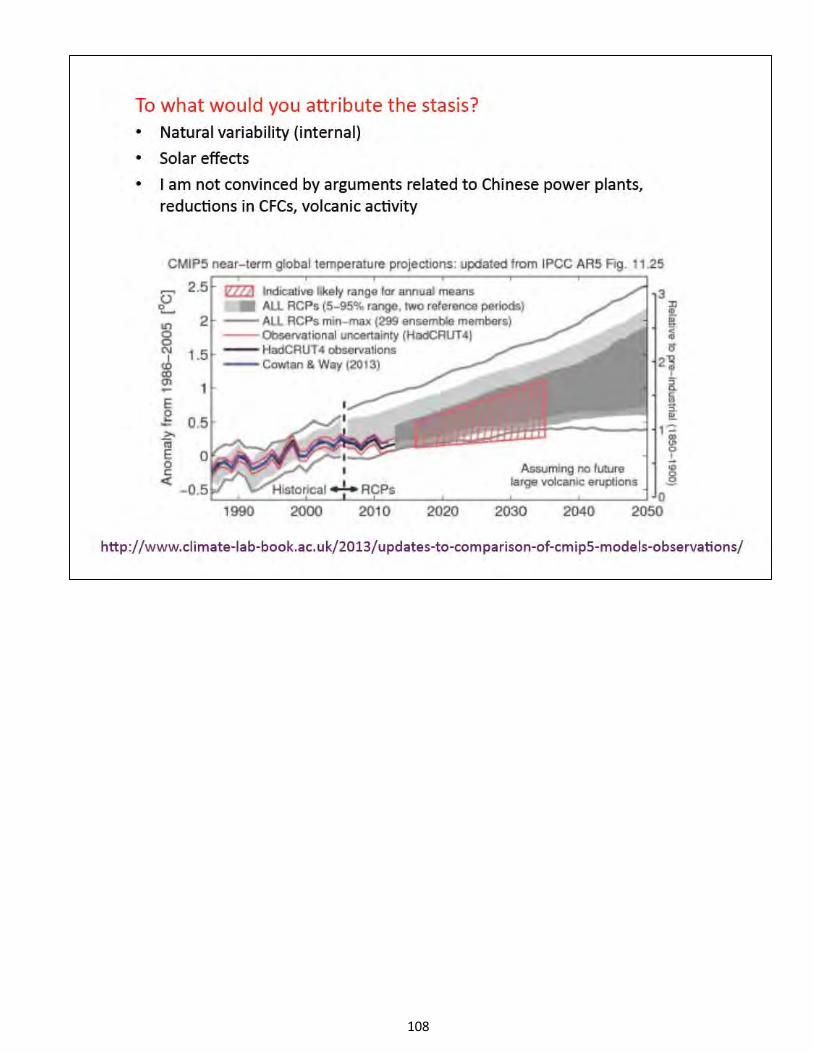
108
1 APS CLIMATE CHANGE STATEMENT REVIEW WORKSHOP
2 problem.
3 There was a paper published by
4 Cowtan and Way who extended the
5 temperature analysis of the UK group
6 to fill in for the Arctic and they
7 said well, this has gone away.
8 Well, I don't know if you can
9 see this far, but this is a diagram
10 from Ed Hawkins. This is from figure
11 11.25 from the AR5. And Ed Hawkins,
12 who did the original figure, redid it
13 with Cowtan and Way.
14 And you can hardly tell the
15 difference between the blue and the
16 black line. And the difference in
17 trend in Cowtan and Way is a little
18 lower in '98 and a little higher
19 since 2005. So, it's really in the
20 noise of the observation. This
21 doesn't make the pause go away. The
22 hiatus is still there.
23 Okay, on to internal
24 variability.[next page] As Bill mentioned,
25 pure internal variability is associated
109
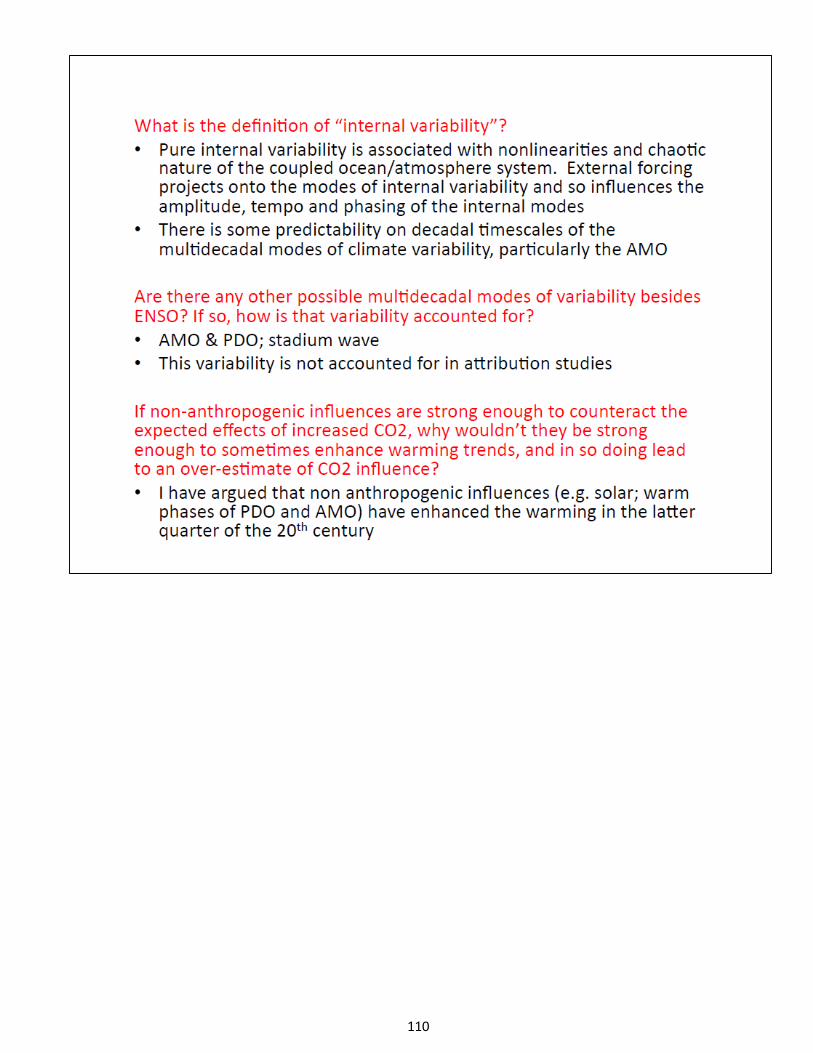
110
1 APS CLIMATE CHANGE STATEMENT REVIEW WORKSHOP
2 with non-linearities and chaotic
3 nature of the coupled atmosphere
4 ocean system.
5 Now, it's very difficult to
6 separate internal variability from
7 forcing because my understanding is
8 that the external forcing projects
9 onto the modes of variability. So,
10 this is not as easily separable as
11 you would like or would hope.
12 In terms of predictability,
13 yes, the models can simulate
14 oscillations that look something like
15 the modes. When you combine it with
16 external forcing, Bill showed a
17 figure where you get something
18 reasonable.
19 But in terms of the ones that
20 we care about in actually getting the
21 timing right, it's very hard to
22 predict these.
23 DR. KOONIN: Clarification: the
24 models don't get the timing of ENSO?
25 DR. CURRY: Yes, even with
111
1 APS CLIMATE CHANGE STATEMENT REVIEW WORKSHOP
2 initialization and the decadal
3 simulations, it looks like there is
4 some predictability of the Atlantic
5 multidecadal oscillation, maybe out
6 to ten years, but Pacific
7 multidecadal oscillation just --
8 DR. KOONIN: It's not in the
9 model?
10 DR. CURRY: Yes, just fell
11 apart. So, apart from ENSO, I mean,
12 the other modes, the longer modes,
13 the Atlantic multidecadal
14 oscillation, Pacific decadal
15 variability are important ones on
16 time scales that we were concerned
17 about, and also the stadium wave,
18 which I will mention in a minute.
19 And while the models do produce
20 oscillations that sort of look like
21 them, the timing of the variability
22 isn't right. And this kind of
23 variability doesn't get explicitly
24 included in attribution studies.
25 So, you asked a question, "If
112
1 APS CLIMATE CHANGE STATEMENT REVIEW WORKSHOP
2 nonanthropogenic influences are
3 strong enough to counteract the
4 expected effects of increased CO2,
5 why wouldn't be they strong enough to
6 sometimes enhance the warming trends
7 and in so doing lead to an
8 overestimate of CO2 influence?"
9 Well, if you are attributing
10 the hiatus to natural internal
11 variability, this immediately raises
12 a question well, what about the
13 warming from '75 to 2000? And so, I
14 think that was probably juiced to
15 some extent by natural variability.
16 Just to show you what I am
17 talking about, the Atlantic
18 multidecadal oscillation is shown on
19 the top one.[next page] Pacific decadal
20 oscillation is shown on the bottom
21 one. The Pacific decadal oscillation
22 temperatures in the Pacific are,
23 well, unreliable before 1980, but
24 really unreliable before about 1920.
25 So, other than proxies, we don't have
113
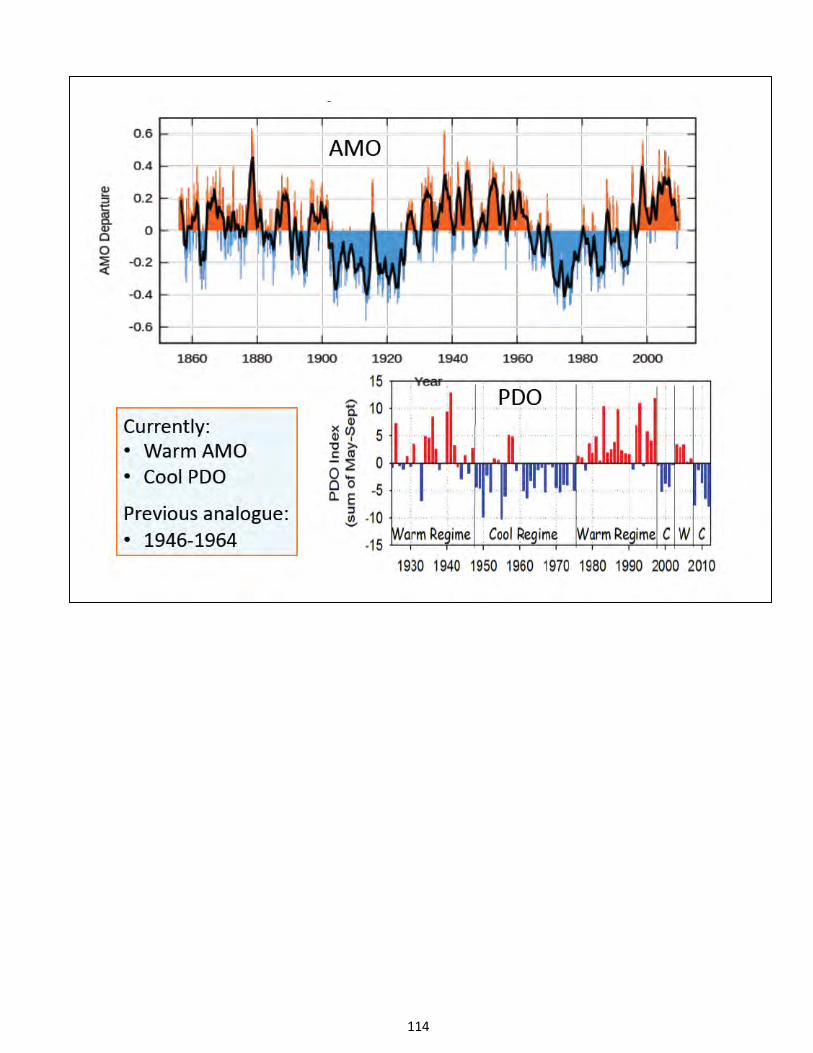
114
1 APS CLIMATE CHANGE STATEMENT REVIEW WORKSHOP
2 really good estimates going back.
3 DR. KOONIN: These are
4 constructed from differences in
5 pressures or temperatures or
6 something?
7 DR. CURRY: Yes, this is really
8 constructed from mostly temperatures
9 and patterns and stuff. So, since
10 1995, we have been in the warm phase
11 of the Atlantic multidecadal
12 oscillation.
13 And we started flickering in
14 the PDO going to the cool phase in
15 the latter years of the 20th century.
16 And we have been decisively in the
17 cool phase for the last couple of
18 years.
19 Now, [next page] a recent paper
20 that I coauthored called "The Stadium
21 Wave," what it does is it takes a bunch of
22 these teleconnection indices of
23 natural variability and linked them
24 into a network. And we saw a
25 progression of all of these things
115
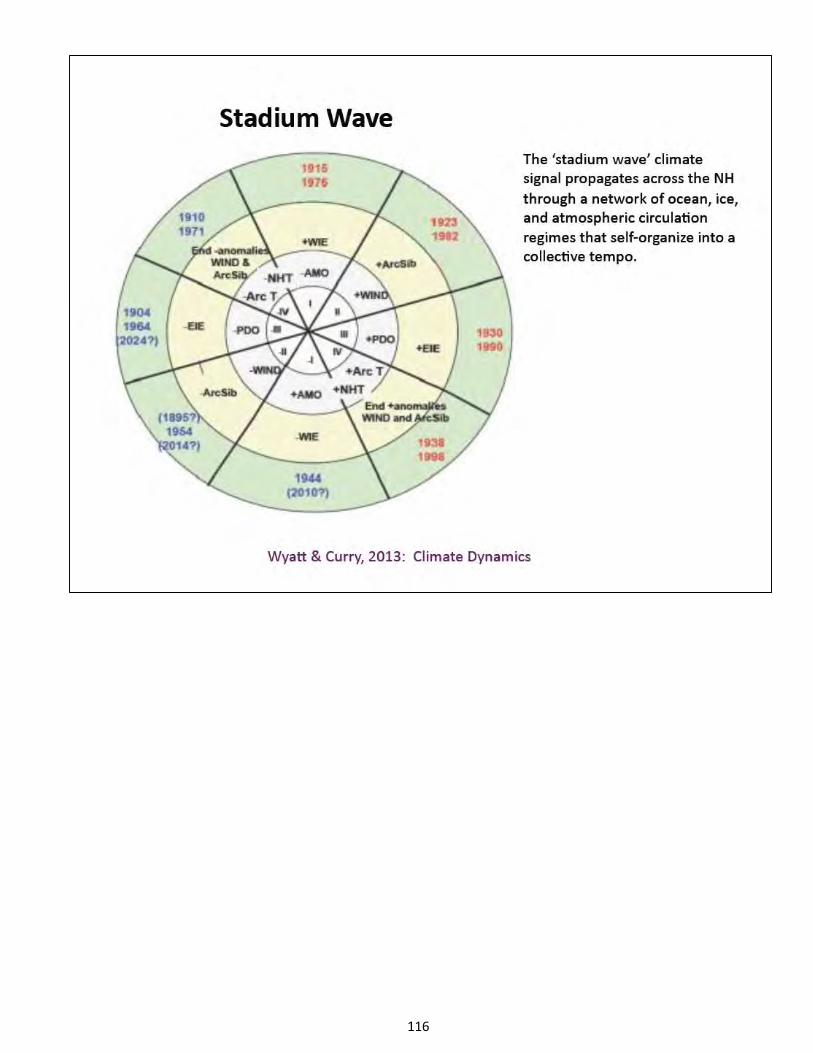
116
1 APS CLIMATE CHANGE STATEMENT REVIEW WORKSHOP
2 integrating. I don't have time to
3 explain it here, but this is a
4 simplified version of the diagram.
5 Here we see peak AMO, negative
6 AMO, peak PDO and negative PDO. And
7 in the second row are some indices
8 related to sea ice and around this
9 outer ring. So, for the past several
10 hundred years, we have sort of seen a
11 little bit of a repeat in the
12 progression of how this goes.
13 And the implications: I think
14 we have seen a transition. We are in
15 the midst of a little transition from
16 here to here (indicating slide). And
17 this makes a couple of sort of
18 simplified, if you continue the
19 network, it makes predictions.
20 The bottom line is that we
21 could see the hiatus if it is natural
22 variability continuing into the 2030s
23 and starting to see a mini-sea ice
24 recovery like the Western Eurasian
25 Arctic. Kara Sea around there I
117
1 APS CLIMATE CHANGE STATEMENT REVIEW WORKSHOP
2 think has bottomed out already and is
3 starting to recover a little bit.
4 So, there is a natural
5 variability component here. To what
6 extent this is important relative to
7 the forest, I mean, to me, that's the
8 big request question.
9 But there is a component here.
10 And the natural variability piece of
11 this will tend, I think, if this is
12 right, to want to keep cooling for
13 another two decades, potentially.
14 DR. KOONIN: The world has been
15 around this wheel at least once?
16 DR. CURRY: Okay, with proxies,
17 we have gone back 300 years. For the
18 last maybe 150 years it has been
19 nominally a 60, 65, but it's shorter
20 in previous times. It's more in the
21 50 years.
22 So, I think the external
23 forcing does change the tempo and
24 things like that. Again, this is
25 just an idea, but it's a potential
118
1 APS CLIMATE CHANGE STATEMENT REVIEW WORKSHOP
2 explanation for the hiatus. And if
3 this is correct, we could be seeing
4 it for another two decades.
5 Now, with regards to the
6 climate models, like as Bill said,
7 vanishingly small after 20 years.
8 And I think somebody has smoked out a
9 CMIP3 simulation that showed a hiatus
10 looking similar to the current one of
11 21 years.
12 But that is, yes, so that's
13 sort of it. So, you know, time will
14 tell as to whether this general idea
15 is right. But I think this helps
16 organize the modes of natural
17 variability.
18 It doesn't answer the question
19 the relative magnitude of the natural
20 variability versus the forced
21 variability. But what we are seeing
22 happening right now could continue
23 for another two decades.
24 So,[next page] "How would the model's
25 underestimate of internal variability
119
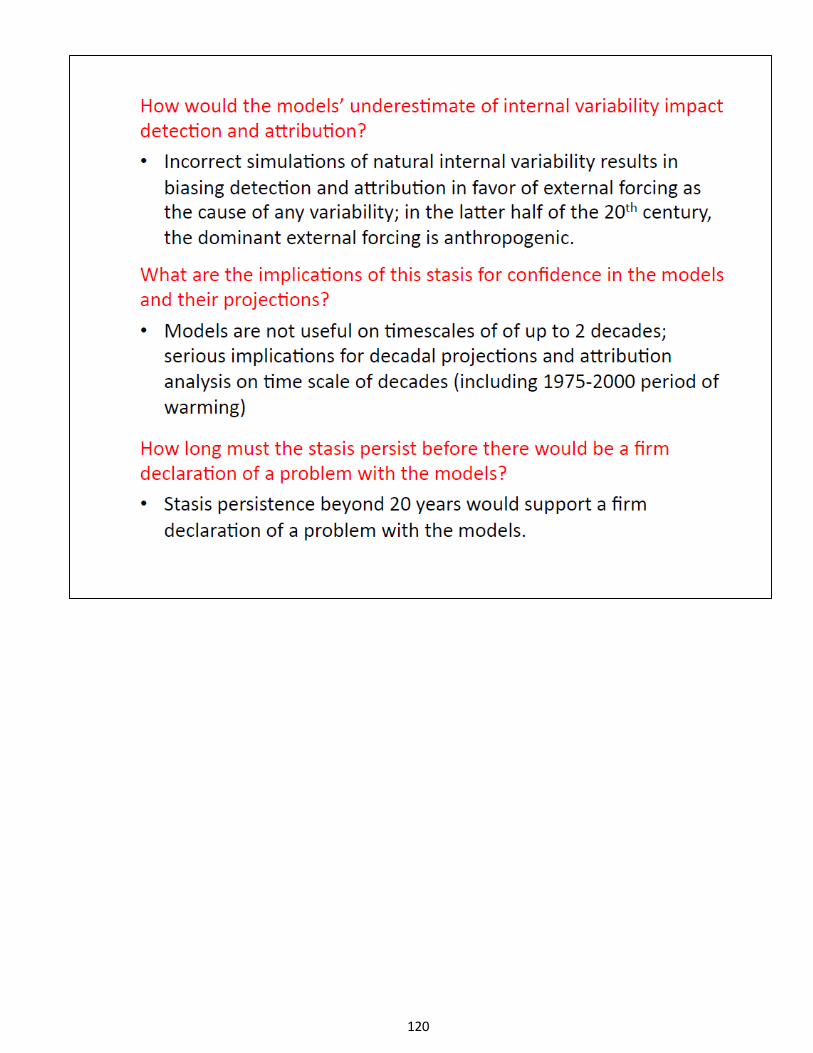
120
1 APS CLIMATE CHANGE STATEMENT REVIEW WORKSHOP
2 impact detection and attribution?"
3 Well, incorrect simulations of
4 the natural internal variability,
5 even if you have the amplitude right
6 getting the phasing and the timing
7 right, it results in biasing
8 detection and attribution in favor of
9 external forcing as the cause of any
10 variability.
11 And in the latter half of the
12 20th century, the dominant external
13 force is anthropogenic. So, this is
14 potentially how it could lead to an
15 overestimate.
16 So, "What are the implications
17 of the hiatus or stasis for
18 confidence in the models and their
19 performance?"
20 Well, to me, this tells me the
21 models aren't useful on time scales
22 of two decades or less, because if
23 they are regarding natural internal
24 variability as unpredictable, we are
25 sort of seeing evidence that they are
121
1 APS CLIMATE CHANGE STATEMENT REVIEW WORKSHOP
2 not predicting it. And it may mean
3 potentially even longer. They only
4 get the very longer-term trend.
5 If we have high-amplitude
6 stuff, 60 years, then the climate
7 models aren't going to give us
8 terribly useful predictions on
9 decadal time scales.
10 And so, "How long must the
11 stasis persist before there would be
12 a firm declaration of a problem with
13 the model?"
14 I would say 20 years. When you
15 actually start it at '98 or at 2001,
16 when I think was the more fundamental
17 shift in the circulation patterns.
18 We can debate, but I don't think we
19 will be splitting hairs. Either it
20 is going to turn around quickly or
21 it's going to stay for a while.
22 So, it will be interesting. By
23 the time of the sixth assessment
24 report, I think we will have gotten
25 to an interesting time. It's either
122
1 APS CLIMATE CHANGE STATEMENT REVIEW WORKSHOP
2 turned around or it's still flat.
3 So, I am not signing up for that
4 assessment report.
5 DR. KOONIN: What is the
6 expected timing on that?
7 DR. COLLINS: 2020, roughly.
8 We will all have new day jobs by
9 then.
10 DR. CURRY: Now,[next page] if that
11 occurs, what would the fix entail?
12 To me, this is a really fascinating
13 question. I don't think it's an issue
15 of tuning. Again, the model
16 fundamentals are sound, so there is
17 something in between. Well, what?
18 I think the problem is the
19 ocean circulation and the coupling to
20 the atmosphere. Higher resolution, I
21 think, can solve some of this. But I
22 suspect getting it down for the
23 ocean, you need really high
24 resolution. So, even if we get to
25 the desired resolution, is that going
123
124
1 APS CLIMATE CHANGE STATEMENT REVIEW WORKSHOP
2 to solve the problem? Not really.
3 I mean, the key issue is how
4 the oceans transport heat in the
5 vertical. And the models are keeping
6 the heat in the upper ocean. And we
7 are seeing lots of stuff going on in
8 the deeper ocean.
9 And there are some ideas on how
10 that occurs, but actually getting
11 that into the climate models in a
12 sensible way is a challenge.
13 You asked the questions of
14 solar influences beyond TSI. This is
15 a subject that intrigues me greatly.
16 It's sort of in the known/unknown
17 category. All you can do is sort of
18 speculate on ideas.
19 That might be cosmic rays,
20 global electric circuit, magnetic
21 field. We simply don't know. But I
22 wouldn't be surprised if they are
23 important.
24 And when I talked to people
25 doing planetary atmospheres, a
125
1 APS CLIMATE CHANGE STATEMENT REVIEW WORKSHOP
2 question that -- why don't you people
3 pay attention to the magnetic field
4 in planetary atmosphere? This is a
5 big deal.
6 And we don't really pay much
7 attention to the magnetic field in
8 context. So, there are things like
9 this, questions that we haven't
10 really asked. So, I don't know, but
11 some very intriguing possibilities.
12 Issues [next page] related to ocean
13 heat content and the measurements, I want
14 to give you a sense of the
15 uncertainties. The top figure is the
16 ocean heat content zero to 700 meters
17 from the AR4. You see a very narrow
18 uncertainty range.
19 You also see there is a bump
20 (indicating 1975-1985). What is this bump?
21 Now, we look at the same figure from
22 the AR5, much broader range of
23 uncertainty and the bump disappeared,
24 okay.
25 Well, the issue is that, apart
126
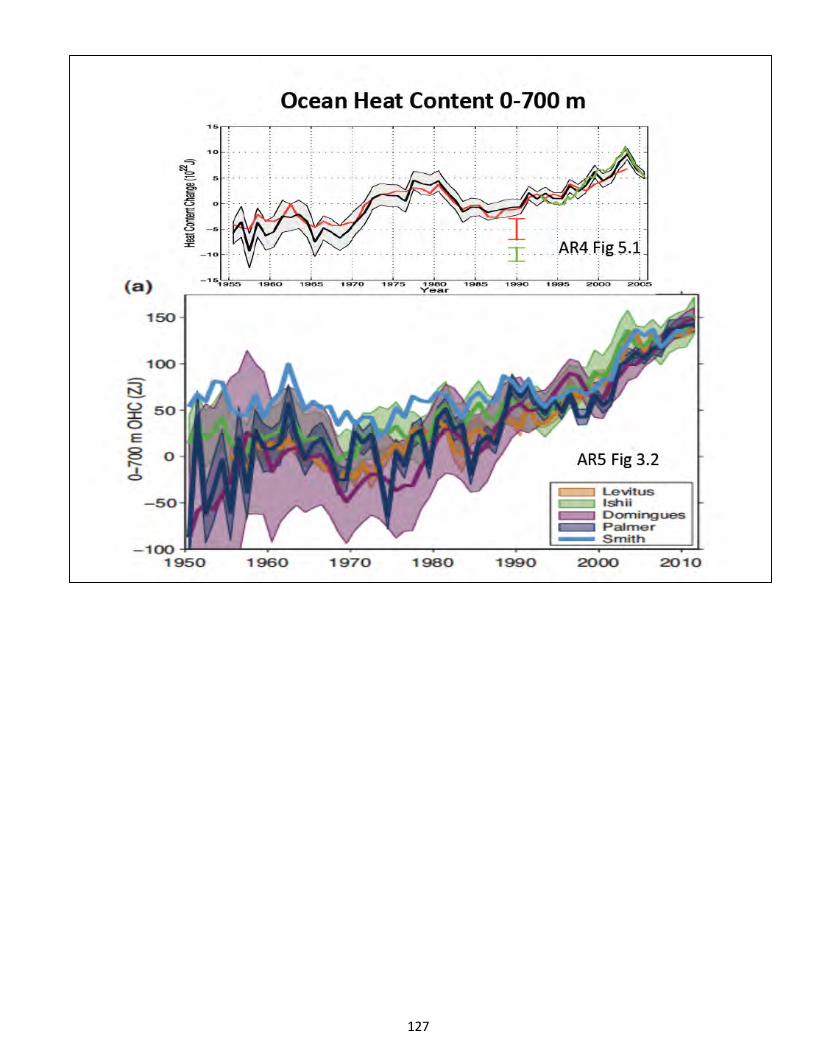
127
1 APS CLIMATE CHANGE STATEMENT REVIEW WORKSHOP
2 from the issue of spatial coverage,
3 which I will get to on the next
4 slide, it is not simple to process
5 these measurements, especially the
6 expendable bathythermographs with
7 little things that are just dropped.
8 You have figure out how to calculate
9 it from the voltages kind of thing.
10 So, in the '70s and '80s, it
11 was a lot of reliance on these XBTs
12 as people are trying to figure out
13 how to process. And before that, it
14 was NBTs. And there are questions
15 about how to process that, also.
16 So, a lot of this, apart from
17 spatial coverage, there is a lot of
18 uncertainties in how you do the
19 calibration and the processing.
20 Now, the next figure [next page]
21 gives you a sense of the impact of the
22 sampling. This is a recent paper
23 that I like. We have different
24 layers in the ocean. And the
25 vertical line is the date when you
128
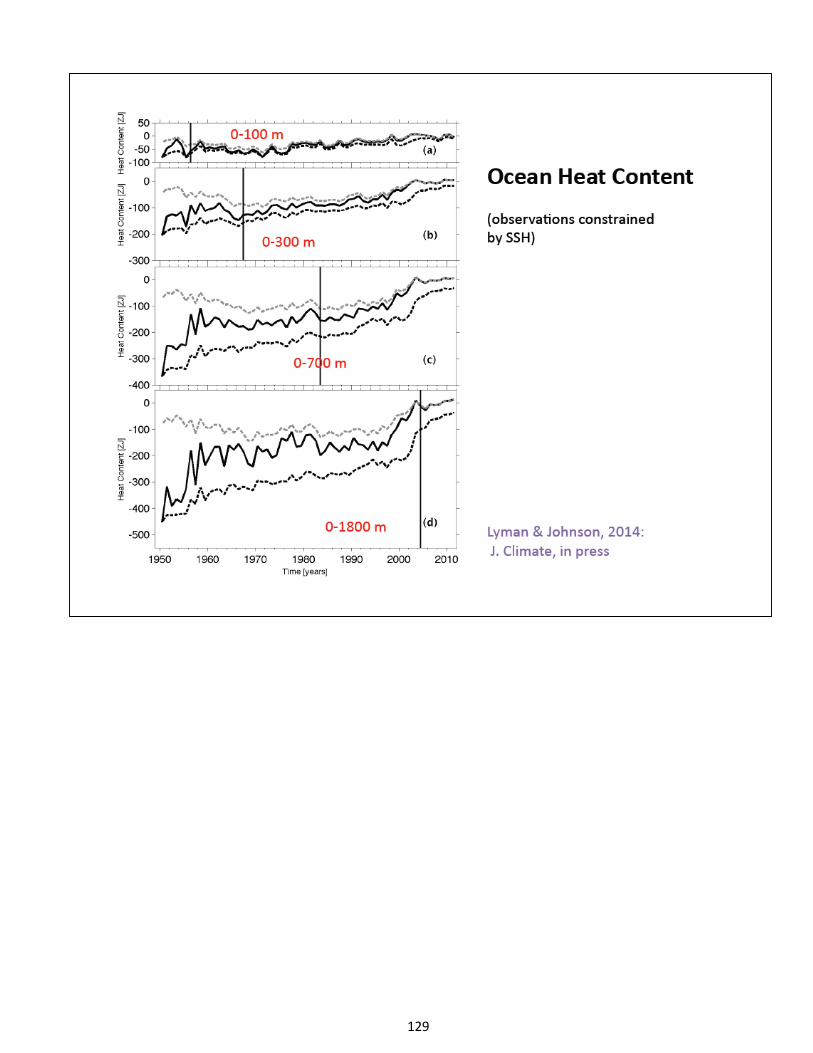
129
1 APS CLIMATE CHANGE STATEMENT REVIEW WORKSHOP
2 had 50-percent coverage of the ocean.
3 So, we see since the '50s, we
4 had it in the upper ocean. But it's
5 really only been very recently with
6 the Argo that we have any kind of
7 coverage really below 700 meters.
8 And so, the different curves
9 represent different assumptions that
10 you make about the stuff that you
11 can't measure. So, this gives you a
12 crude estimate of the uncertainty in
13 the coverage in trying to make a
14 global estimate.
15 So, what do you see? A
16 feature, most climatologies agree
17 that there was a little peak in 2003
18 and since 2003, it has been
19 relatively flat, although there is
20 uncertainty there.
21 A big increase, really, since
22 1995 to 2003, it's a big part of the
23 increase, and then relatively flat in
24 the stuff before 1960 is probably
25 pretty implausible. So, this is sort
130
1 APS CLIMATE CHANGE STATEMENT REVIEW WORKSHOP
2 of what the observations seem.
3 Now, the other way of sort of
4 filling in the gaps is through ocean
5 reanalysis.[next page] And this is done by
6 the way you initialize inverse -- okay, I
7 don't need to explain how this goes.
8 But this is probably the most
9 reliable of the ocean reanalyses.
10 This is from ECMWF. And so, for the
11 first time, we get something below
12 1800 down to the deep ocean down to
13 several thousand meters.
14 And so, they are effectively
15 filling in the gaps through the
16 ocean's circulation model, which
17 seems like a sensible thing to do.
18 But we see some features that don't
19 look all that much like the observed.
20 We see this big spike which we
21 see around '92, which we didn't
22 really see anything there. We see in
23 the observations we were seeing
24 starting around '95 there was a big
25 increase and a relatively flat right
131
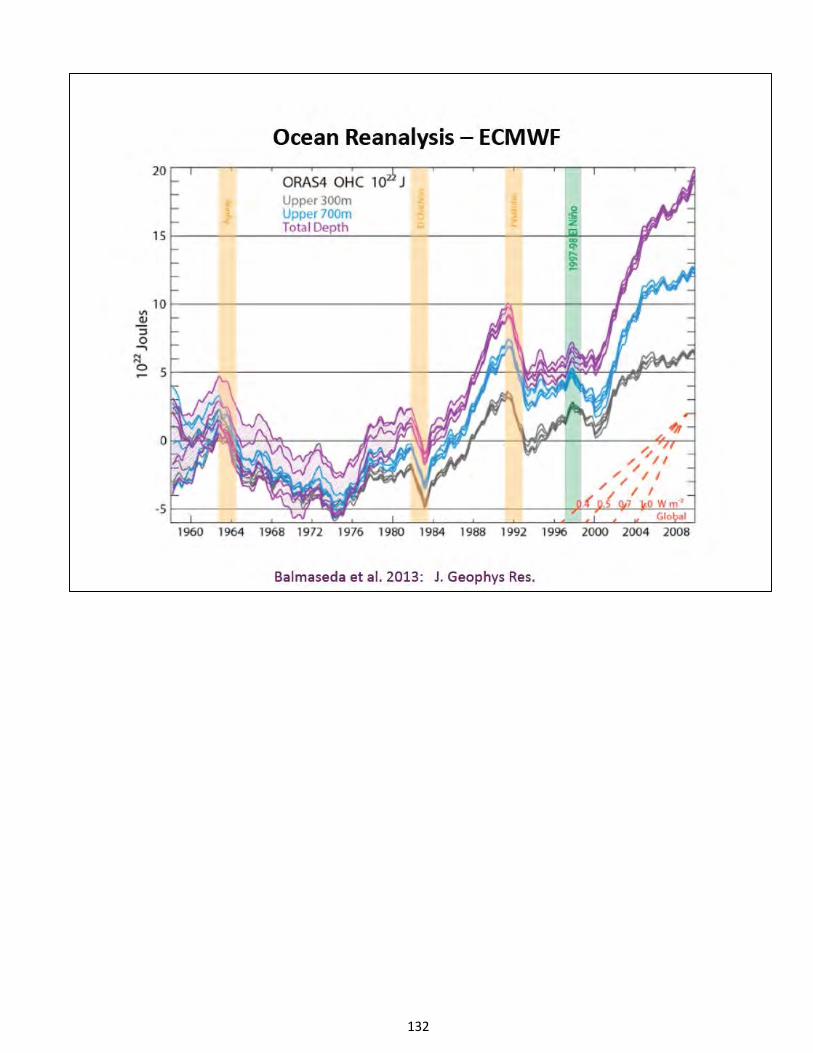
132
1 APS CLIMATE CHANGE STATEMENT REVIEW WORKSHOP
2 here.
3 DR. KOONIN: Just so I
4 understand: Again, this is some
5 combination of models driven by
6 observations?
7 DR. CURRY: Yes, models that
8 simulate the observation in the same
9 way that a numerical weather
10 prediction initializes the weather
11 model. They are sort of initializing
12 the ocean weather model, if you will.
13 DR. KOONIN: Regarding the
14 model data as --
15 DR. CURRY: Right. So, there
16 is a background circulation and then
17 they assimilate observations where
18 it's available. So, I think this is
19 eventually a very promising approach,
20 but it doesn't quite have the
21 fidelity to the observations yet.
22 But you see a lot of heat going
23 into this layer that goes down to the
24 total depth. And so, how is that
25 heat getting there? The models keep
133
1 APS CLIMATE CHANGE STATEMENT REVIEW WORKSHOP
2 it all in the upper layers. They are
3 not sending it down below.
4 So to me, this is one of the
5 big issues. The ocean seems to
6 transfer heat vertically more rapidly
7 than we know how to do it in the
8 model.
9 So, [next page] as far as your question
10 goes, some have suggested that the
11 missing heat is going into the deep
12 ocean. Okay, if you average this
13 heat over the depth of the ocean,
14 it's .05 kelvins since 1960. So,
15 it's the big heat reservoir, so there
16 is not a big temperature change.
17 So, why would the heat
18 sequestration have turned on at the
19 turn of this century? Well, if this
20 is a robust thing, presumably it has
21 something to do with natural internal
22 variability.
23 And so, what could make it turn
24 off? Natural internal variability.
25 And if this is related to the stadium
134
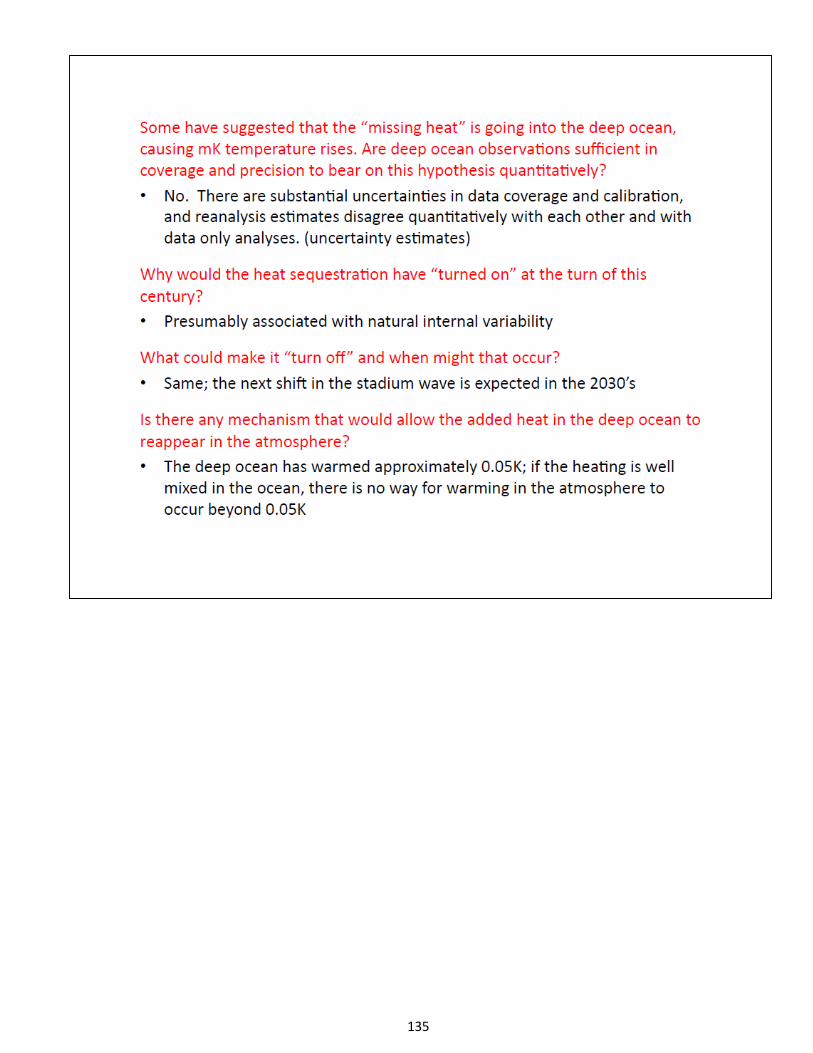
135
1 APS CLIMATE CHANGE STATEMENT REVIEW WORKSHOP
2 wave idea, whatever, we could see
3 this dynamic changing sometime in the
4 2030s.
5 Now, in the media, I think that
6 the phrase has been used the heat
7 will come back to haunt us. Well, if
8 this heat is genuinely well-mixed in
9 the ocean, you have got the second
10 law of thermodynamics on your side.
11 This heat is not going to, other than
12 .05 kelvin, this heat isn't coming
13 back.
14 So, the question is, to what
15 extent is this well-mixed or is it
16 indiscreet plumes or whatever? So,
17 this whole issue of ocean mixing, to
18 me is, like, one of the biggest
19 issues out there.
20 So, I don't think too much of
21 this. I mean, this is actually quite
22 a way that people hadn't thought of
23 sequestering heat in the deep ocean.
24 If you can well-mix it, that's an
25 interesting way to sequester it.
136
1 APS CLIMATE CHANGE STATEMENT REVIEW WORKSHOP
2 On to the issue of sea level
3 rise, now, I am not a particular
4 expert on the methods of determining
5 this, but I want to remark on
6 something. Again, what this is, it's
7 in your document, this figure. [next page]
8 The issue is this bump here
9 (indicating 1945). And it's the
10 same rate here as here, basically
11 (indicating red bar). And again, sea-level
13 rise is one of the things we have done in
14 the stadium wave, and it really does fit
15 with that kind of an explanation in the
16 context of natural variability.
17 So, you are seeing this big
18 signal of natural internal
19 variability in the sea-level rise
20 data as well.
21 DR. KOONIN: So, you would say
22 from the stadium wave it is going to
23 come back down again?
24 DR. CURRY: Yes. At some
25 point, by 2040, the natural
137
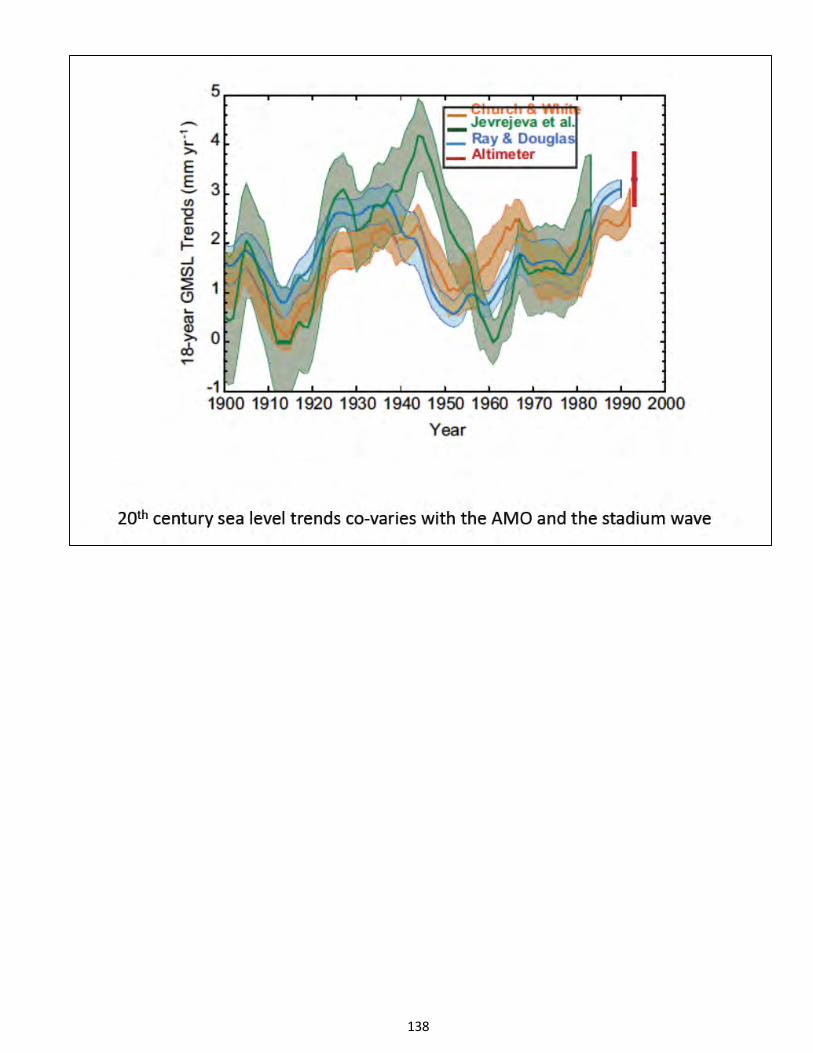
138
1 APS CLIMATE CHANGE STATEMENT REVIEW WORKSHOP
2 variability would support warming,
3 which would enhance, yes. So, at
4 some point it will turn around.
5 But again, so, if you look at
6 this from the perspective of 2100,
7 all this may look like noise. But
8 from where we sit right now, it
9 doesn't feel like noise and is
10 challenging, you know, the climate
11 models.
12 With regards to sea ice, this
13 [next page] is the anomaly of Arctic sea
14 ice. And you see the decline particularly
15 over the last two decades. You see
16 the two record-breaking years.
17 Now, Antarctic shows a slight
18 positive trend with some of the
19 biggest values in the last decade.
20 There is almost sort of an "anti"
21 with the two hemispheres.
22 Now, to what extent is this
23 natural variability versus forced
24 variability, particularly the Arctic?
25 You can't tell just looking at data
139
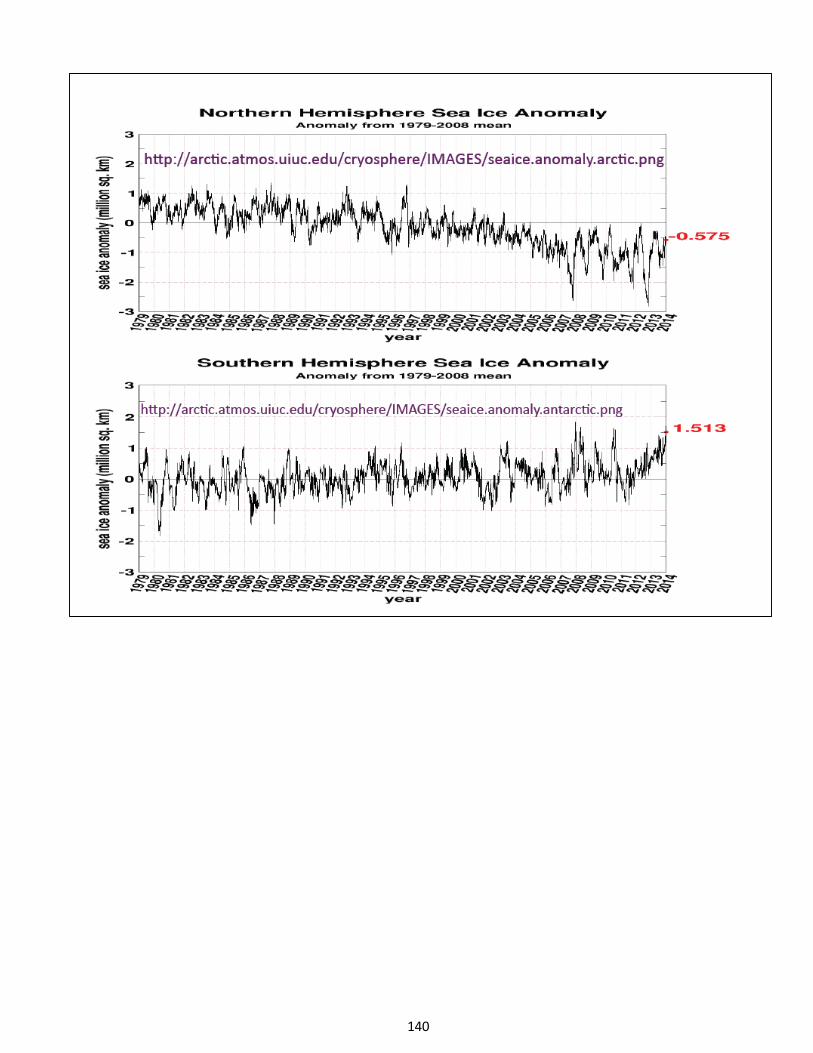
140
1 APS CLIMATE CHANGE STATEMENT REVIEW WORKSHOP
2 from 1979. So, you want data to go
3 farther back and there isn't a heck
4 of a lot of it.
5 This [next page] was a paper that
6 is in press that, I think, synthesizes the
7 data sets that are available going
8 back in time with some sort of
9 sufficient resolution.
10 Some of the paleo stuff doesn't
11 have good enough resolution for you
12 to resolve something out of the
13 decadal time scale. And what they
14 were particularly looking for was
15 some signal from the Atlantic
16 multidecadal oscillation.
17 And you certainly see it in the
18 Fram Strait. You see it in the
19 Atlantic Arctic. You do see a pretty
20 big signal of the Atlantic
21 multidecadal oscillation.
22 So again, this is early days of
23 trying to sort of out what the
24 internal variability piece might be.
25 So, at this point, we don't know to
141
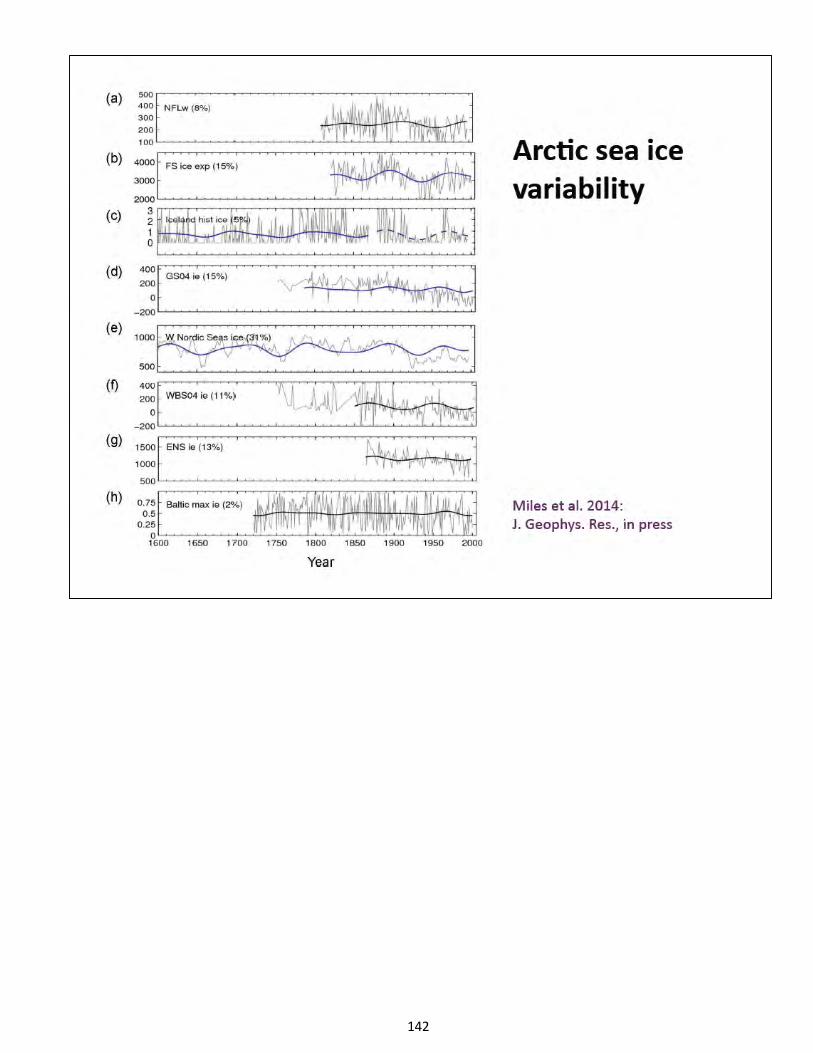
142
1 APS CLIMATE CHANGE STATEMENT REVIEW WORKSHOP
2 what extent --
3 DR. KOONIN: Five minutes.
4 DR. CURRY: Yes, I am getting
5 very close to being done.
6 So,[next page] what extent do we
7 believe the recent Arctic decline is unusual?
8 It's probably unusual. The extent to
9 what is natural variability versus
10 forced, we still don't know. The
11 thing that raises questions is the
12 models predict the Antarctic to be
13 declining, not increasing.
14 So, the fact that we don't
15 understand that one, there are some
16 ideas related to hydrological cycle,
17 wind patterns and stuff that might
18 explain that. But we don't have a
19 good understanding and the models
20 don't get it right.
21 So, if you don't get it right
22 in both hemispheres, do you
23 understand what is going on, either?
24 And I would argue that I am concerned
25 as to whether we really understand
143
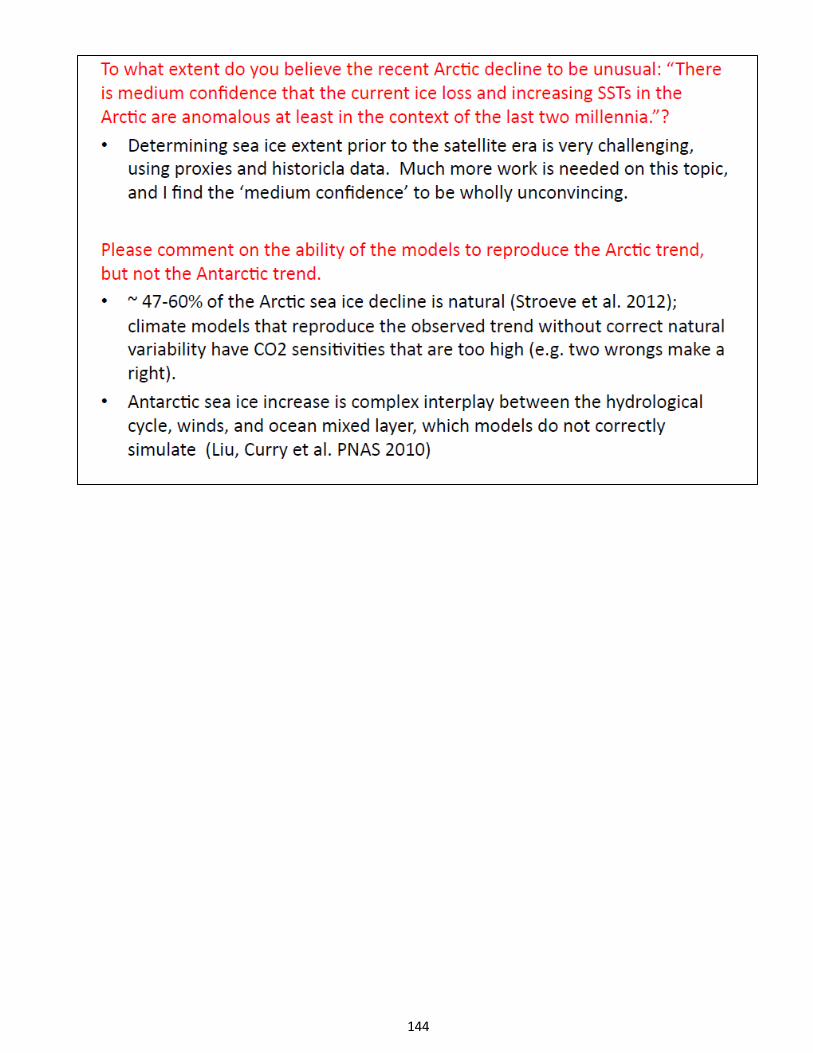
144
1 APS CLIMATE CHANGE STATEMENT REVIEW WORKSHOP
2 what is with going on.
3 And the interplay between
4 natural variability and forced
5 variability in the sea ice is
6 fascinating, but we need more data.
7 And trying to piece this together is
8 key, not simple.
9 I already mentioned that
10 predicting from natural variability a
11 gradual recovery of the Arctic sea
12 ice progressing from the Eurasian
13 Arctic around the Russian Arctic that
14 we might see over the next 20 years.
15 Okay, I think that's all I want
16 to cover.
17 DR. KOONIN: Thank you. It's
18 open for questions.
19 DR. ROSNER: Earlier on, you
20 showed a plot of the data for the
21 ocean warming. Could you go back to
22 that slide. [next page] And what you showed
23 us a plot that dates back to the fourth
24 assessment, yes, that one.
25 So, I have to say that that
145
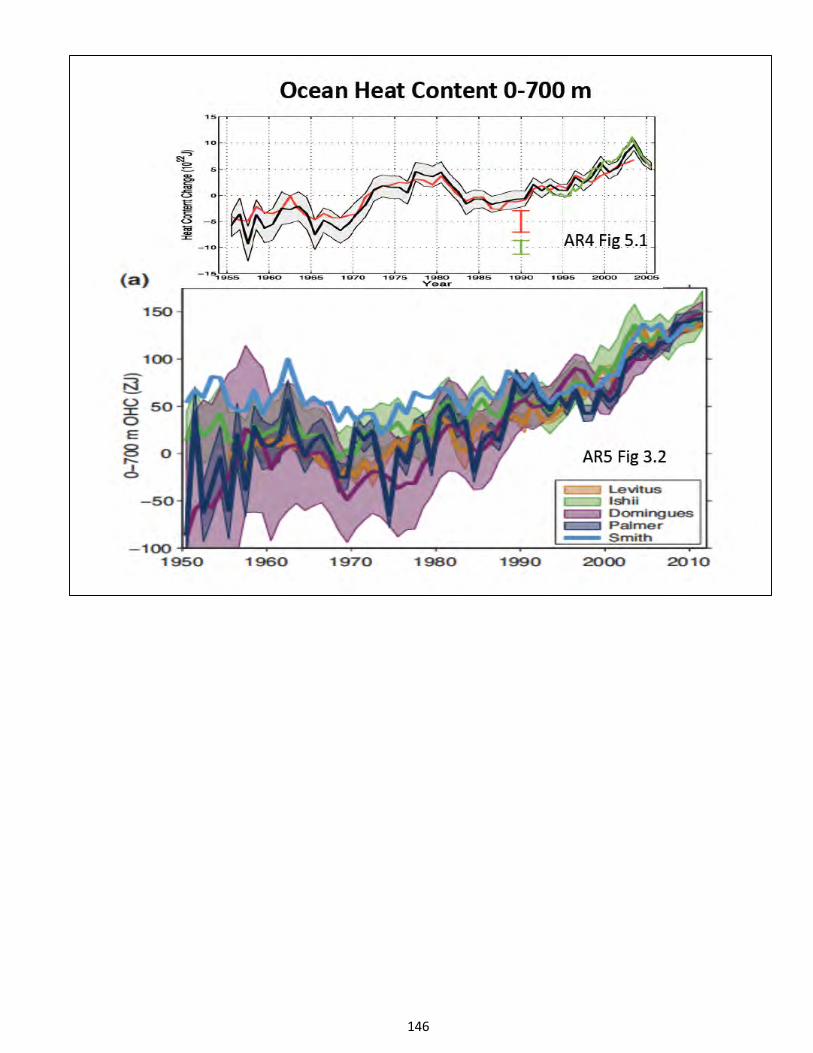
146
1 APS CLIMATE CHANGE STATEMENT REVIEW WORKSHOP
2 graph, that picture surprised me
3 hugely because I am used to
4 progression advanced in science.
5 And I would think that, as we
6 get better in measuring, that we do
7 better in our error estimates and in
8 our assessment of what the data
9 really is. And this seems to state
10 the opposite.
11 Could you comment on that? I
12 guess what I am asking is, do we
13 understand the errors or not?
14 DR. CURRY: We are starting to.
15 We are starting to. Even in surface
16 temperature, I would say it's only
17 literally a paper in the last two
18 months by John Kennedy at the UK Met
19 office did a really good error
20 analysis of sea surface temperatures,
21 much better than anything we have
22 seen.
23 Every time somebody does a
24 really good job, the error bars get
25 bigger because they are incorporating
147
1 APS CLIMATE CHANGE STATEMENT REVIEW WORKSHOP
2 more sources of error and better
3 understanding of what the errors
4 actually are.
5 So again, these aren't
6 laboratory measurements. In physics,
7 what you say holds. But when you
8 have a natural system that you are
9 just sort of dealing with the wild
10 cards that you have been dealt, it's
11 difficult to decipher.
12 DR. LINDZEN: Also indirect
13 measurements.
14 DR. CURRY: Indirect
15 measurements, yes, these are indirect
16 measurements. These are inferences.
17 And even if they are direct
18 measurements, they are not direct
19 measurements of what you really want.
20 DR. KEMP: At the beginning of
21 your talk, you reminded us that the
22 models are rooted
23 in more than just statistics, that
24 they are based in physics, and
25 therefore they are somehow
148
1 APS CLIMATE CHANGE STATEMENT REVIEW WORKSHOP
2 inherently, I don't want to say good,
3 but in the right direction; and
4 that the discrepancies that we might
5 observe right now are about timing of
6 the internal variability; but that in
7 the long run, because the physics is
8 basically right, it seems like what
9 you might be saying is in a 100-year
10 time scale, model-predicted things
11 like ECS would be basically right; is
12 that correct?
13 DR. CURRY: There are two other
14 big uncertainties on my list on the
15 first page. One is the solar
16 indirect effect, a wild card we don't
17 know. And the other one --
18 DR. LINDZEN: Sensitivity.
19 DR. CURRY: Sensitivity, yes,
20 the sensitivity the fast feedbacks,
21 water vapor, cloud, lapse rate.
22 Again, this is the big wild card, big
23 wild card. I mean, this is the name
24 of the game. And all of these things
25 are related to subgrid-scale
149
1 APS CLIMATE CHANGE STATEMENT REVIEW WORKSHOP
2 parameterizations.
3 So, the things related to the
4 fast feedbacks aren't things we have
5 good, fundamental equations for at
6 that scale, because it's related to
7 very small-scale processes that are
8 hidden in the parameterizations that
9 are subject to a lot of tuning.
10 DR. KEMP: Those are additional
11 issues. But my question is this: To
12 what extent are the models predictive
13 if we are predicting outside of the
14 range in which we can calibrate them?
15 Say if it were a purely
16 statistical model, the answer would
17 be there or not. But with these models
18 there is some amount of physics — but then
19 there is also calibration parameters
20 which are based on historical
21 observations — can you give me a
22 sense to what extent 100-year,
23 200-year, 300-year predictions with
24 exogenous forcing can be predicted by
25 the models?
150
1 APS CLIMATE CHANGE STATEMENT REVIEW WORKSHOP
2 DR. CURRY: This is a big
3 question. It depends on what time
4 scales. I mean, you have already
5 seen that we have got noise on
6 60-year time scales that the model
7 can't really predict.
8 So, once you go beyond a
9 century or two centuries, then it
10 relies on forcing and correct
11 feedbacks in the model. And so,
12 that's the big question, I mean, what
13 you asked.
14 So, a lot of
15 these parameterizations are
16 regime-dependent. If we go into a
17 regime that is very different than
18 our current climate, then it depends
19 on how robust those degrees of
20 freedom are.
21 And that's the big unknown. I
22 mean, if you are taking the climate
23 to something very different, ten
24 degrees, I would think all bets are
25 off.
151
1 APS CLIMATE CHANGE STATEMENT REVIEW WORKSHOP
2 Whether two or three degrees is
3 sufficiently close to the regime for
4 which the model can handle, I don't
5 know, maybe more likely than ten
6 degrees. But that's the big
7 question.
8 DR. KEMP: It seems like the
9 historical observations are so poor
10 that even two or one degree goes
11 outside really the calibration to me.
12 You only have calibration data of
13 meaning in the last decade.
14 DR. CURRY: It could be, yes.
15 DR. KOONIN: Phil?
16 MR. COYLE: The stadium wave
17 analysis that you showed, I think
18 it's very interesting. From where
19 I am sitting, I couldn't read all of
20 the notations and all the rings. To
21 what extent does that analysis
22 include human activity?
23 For example, does it include at
24 all much more CO2, much more methane?
25 DR. CURRY: We remove a secular
152
1 APS CLIMATE CHANGE STATEMENT REVIEW WORKSHOP
2 trend, whatever caused it. We
3 removed the secular trend and look at
4 the variability. So, it says nothing
5 about external forcing other than
6 there is a secular increase.
7 MR. COYLE: Have you thought
8 about a way to include it?
9 DR. CURRY: Not yet. Some
10 other people have used the stadium
11 wave in observationally determined
12 attribution-type sensitivity-type
13 studies. So, a couple of people have
14 tried it and have shown it to me.
15 Nothing has been published yet. So,
16 other people are trying it.
17 MR. COYLE: Thank you.
18 DR. KOONIN: Judy, since you
19 raised the ocean heat content, I want
20 to ask a question. I want to put a
21 picture up there to frame it.[next page] It
22 probably takes you back to the first
23 or second week of the courses you all
24 teach about the climate system. But it's
25 something I don't understand and I
153
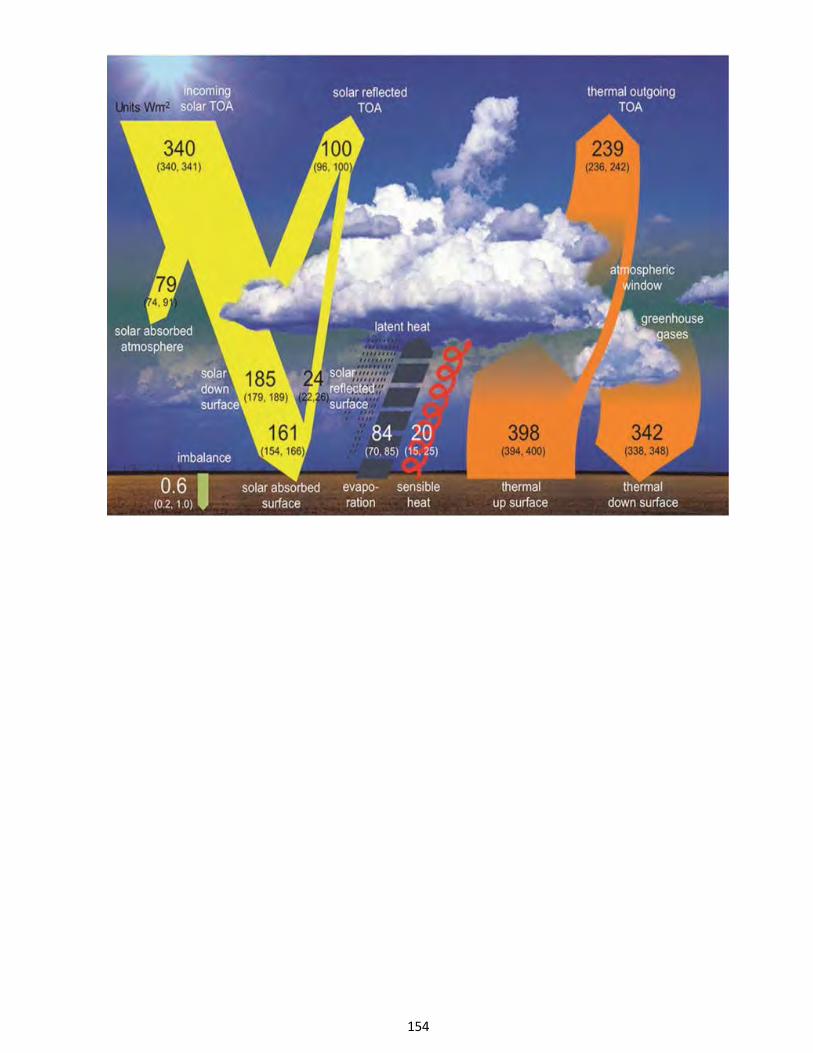
154
1 APS CLIMATE CHANGE STATEMENT REVIEW WORKSHOP
2 expect other people don't as well.
3 I want to talk about energy
4 balance in the system as a whole. 5 Ocean heat content: I sort of
6 got that little green arrow at the
7 bottom left, 0.6 watts per square
8 meter, I calculated proudly is ten
9 zettajoules per year.
10 So, it works. That is good.
11 So, I understand where that number
12 came from. That's the slope of the
13 ocean heat content over the last
14 decade.
15 There are other numbers
16 floating around in watts per square
17 meter that I don't quite understand.
18 So, there is radiative forcing,
19 right? We heard about that, two and
20 a half with big error bars. And as
21 Bill said, that is the net, the
22 change in the net flux downward at 60
23 years or whatever.
24 Suppose I rolled the clock back
25 to 1750. Then the radiative balance
155
1 APS CLIMATE CHANGE STATEMENT REVIEW WORKSHOP
2 is zero at the top, by definition,
3 right?
4 DR. COLLINS: I will say maybe
5 not identically zero. There has been
6 some evidence now converging that
7 heat from burning rice paddy work
8 from the Chinese produces enough
9 methane to interpret it down
10 slightly.
11 DR. KOONIN: I will give you
12 half a watt for that, all right.
13 Let's go back to 1000 or maybe older.
14 That number goes to zero, right?
15 There isn't much energy stored in the
16 atmosphere in the surfaces, I
17 understand it. Most of the storage
18 is in the ocean.
19 So, does that mean that the .6
20 number goes down to minus one and a
21 half or something like that? What do
22 we expect for that number down at the
23 bottom in preindustrial times? Judy
24 had the floor first, but if she wants
25 to --
156
1 APS CLIMATE CHANGE STATEMENT REVIEW WORKSHOP
2 DR. CURRY: No, no, go ahead.
3 DR. HELD: I think you are
4 getting the concept of radiative
5 forcing wrong.
6 DR. KOONIN: Thank you. Please
7 tell me.
8 DR. HELD: It's a hypothetical
9 quantity how much the balance would
10 change if you fixed temperature.
11 It's not showing up on this picture.
12 DR. KOONIN: So, the
13 temperature would be very different
14 in 1700?
15 DR. HELD: Colder.
16 DR. CURRY: Colder, yes.
17 DR. KOONIN: So then, maybe the
18 second question related to that, the
19 ocean is cold. Isn't the ocean
20 always warming as a result of, I mean,
21 the long-term average heat flow from
22 the surface of the ocean. Is it always in
23 that direction?
24 I am trying to understand to
25 what extent we believe the 0.6 (or 0.8
157
1 APS CLIMATE CHANGE STATEMENT REVIEW WORKSHOP
2 number in more recent analysis). Is
3 it unusual or not?
4 DR. HELD: If it was sustained,
5 the ocean would have a big
6 temperature gradient.
7 DR. KOONIN: And it doesn't?
8 DR. HELD: It doesn't. We can
9 go back to measurements of the deep
10 ocean from the Challenger expedition
11 and changes are in the hundredths of
12 a degree.
13 DR. KOONIN: But I don't
14 understand the mixing in the deep
15 ocean.
16 DR. HELD: I think we have
17 CFCs. We have radiocarbon. We have
18 a lot of things we look at, not just
19 heat. So, it's not that simple.
20 DR. COLLINS: We have a nice
21 many choices, in other words.
22 DR. LINDZEN: The issue of deep
23 water formation is still a little
24 dicey.
25 DR. KOONIN: All right, other
158
1 APS CLIMATE CHANGE STATEMENT REVIEW WORKSHOP
2 questions for Judy, or comments from
3 everybody?
4 DR. BEASLEY: Judy, you talked
5 about solar influences. And I
6 thought that Bill nailed one of the
7 influences, which is changes in the
8 solar. It's hard to understand how
9 that would happen. I can really see
10 that.
11 But then you mentioned a bunch
12 of others that kind of surprised me,
13 quite frankly. And so, for example,
14 the magnetic field, I can't resist
15 picking that one. Do you have a
16 physics notion of what --
17 DR. CURRY: Okay, this is
18 known/unknown. Some people with
19 publishing papers speculating.
20 DR. ROSNER: This is based on
21 they are certain that there is an
22 effect or they have a physical
23 process in mind that actually would
24 do something?
25 DR. CHRISTY: There is the
159
1 APS CLIMATE CHANGE STATEMENT REVIEW WORKSHOP
2 cosmic --
3 DR. CURRY: Well, that is one
4 example. I can't recite all the
5 arguments off the top of my head.
6 But people are publishing papers that
7 present some intriguing
8 possibilities. These are obviously
9 not in the mainstream. But we have
10 only really started looking at these
11 kind of topics.
12 If you are interested, I can
13 send you a list of papers I have been
14 recently. But this is known/unknown
15 category.
16 DR. LINDZEN: They all relate
17 to particle processes influencing
18 cloud condensation.
19 DR. ROSNER: Right.
20 DR. LINDZEN: And that has long
21 been, that has been about 40 years
22 that people have identified cloud
23 condensation as the big magnifier,
24 potentially.
25 DR. KOONIN: Scott?
160
1 APS CLIMATE CHANGE STATEMENT REVIEW WORKSHOP
2 DR. KEMP: Just a clarification
3 question [to Dr. Collins]: Earlier you
4 pointed out that, when we sent in our
5 questions from the ocean-circulation
6 chapter, which perhaps not everyone
7 agrees with it, that the confidence
8 in separating the variability from
9 the trends was very good?
10 DR. COLLINS: The reason I was
11 calling you on that was that
12 statement was specifically ocean
13 dynamics, not with thermal structure.
14 DR. KEMP: This is my question.
15 Is that not related to understanding
16 AMO and PDO trends? Or is it related
17 to understanding AMO and PDO trends?
18 DR. CURRY: It's related to
19 understanding how the whole processes
20 on those time scales work. You can
21 calculate the AMO and PDO out
22 understanding the deep ocean.
23 But in terms of understanding
24 the processes of how all this would
25 influence sea ice, for example, you
161
1 APS CLIMATE CHANGE STATEMENT REVIEW WORKSHOP
2 need to understand those
3 circulations.
4 DR. COLLINS: Please understand
5 when the projection is done on these
6 modes of variability, what we are
7 looking at is a mode of variability
8 that we know the phase is left
9 indeterminant.
10 Specifically, we asked whether
11 or not the observations can be
12 projected onto that mode with the
13 phase as a degree of freedom in that
14 projection.
15 So, I think there is a little
16 bit of disagreement about whether or
17 not the phase matters. But I just
18 wanted to make -- I didn't want to
19 pick nits over the issue. I want to
20 be clear that the thermal structure
21 is better understood.
22 And I do have a point to your
23 question about modeling that I would
24 like to come back to.
25 DR. KOONIN: I think Ben?
162
1 APS CLIMATE CHANGE STATEMENT REVIEW WORKSHOP
2 DR. SANTER: Judy, I guess my
3 question relates to your claim that
4 models can't capture AMO and PDO
5 variability. You showed that the
6 observations were uncertain by SST.
7 You showed that there is some
8 projection of model external forcing
9 onto the modes of variability.
10 We also know that the human
11 influence isn't just a simple linear
12 trend. If you look at the ice core
13 record, there are very large changes
14 in anthropogenic sulfates over the
15 20th century. So, that
16 deconvolution --
17 DR. CURRY: Is not external.
18 DR. SANTER: -- of external
19 forcing on internal variability is
20 not straightforward, very, very
21 difficult.
22 DR. CURRY: Oh, I agree.
23 DR. SANTER: Given the short
24 observational records, it is kind of
25 difficult to uniquely determine what
163
1 APS CLIMATE CHANGE STATEMENT REVIEW WORKSHOP
2 the characteristics of a 60-year mode
3 of variability are.
4 DR. CURRY: I agree. I agree.
5 DR. SANTER: I think that's
6 very difficult to make the statements
7 models cannot do this when we have
8 such a poor observational record.
9 DR. CURRY: The decadal, my
10 comment there was based on the
11 decadal simulations from CMIP5.
12 And I published a paper on it,
13 Kim Webster and Curry, that basically
14 showed that we didn't look at all the
15 models, only the ones that were
16 available early, but found that they
17 were able to hang onto the AMO for
18 about eight years even after being
19 initialized. But even after one
20 year, they weren't able to hang onto
21 an initialized PDO.
22 So, that was the context that
23 that statement was made. That said,
24 just running a model for multicentury
25 runs, you will get oscillations that
164
1 APS CLIMATE CHANGE STATEMENT REVIEW WORKSHOP
2 resemble those.
3 DR. SANTER: But how well you
4 capture the observed PDO or AMO is
5 critical how you initialize how much
6 subsurface information you get --
7 DR. CURRY: Absolutely,
8 absolutely.
9 DR. SANTER: -- and how
10 representative that is of what
11 happened in the real world. And as
12 you showed, even now that's
13 problematic.
14 DR. CURRY: I agree. So, is
15 the default position the models do it
16 right or the models do wrong? I
17 think the right interpretation is
18 there is a whole lot of uncertainty
19 in all of this.
20 DR. LINDZEN: There is a quip
21 among oceanographers that the PDO is
22 not an oscillation, it's not decadal,
23 but it is in the Pacific. But one of
24 the things that I think has to be
25 remembered is the coupling of the
165
1 APS CLIMATE CHANGE STATEMENT REVIEW WORKSHOP
2 atmosphere in the ocean, at least as
3 far as heat goes, is a function of
4 climate sensitivity. So, the higher
5 the sensitivity, the weaker the
6 coupling.
7 Gerard Roe put forward an
8 interesting suggestion which we
9 followed up, namely things like the
10 PDO are pretty much an AR1 process
11 and they have a time constant,
12 response time associated with them
13 much shorter than a decade. It's
14 about 15 months, something like that
15 in the data.
16 We went through the
17 preindustrial historic runs in the
18 CMIP. And that time scale for
19 Pacific temperature, North Pacific
20 temperature is about double what it
21 is in the data. So, there is a
22 suggestion the coupling isn't right.
23 DR. KOONIN: Bill?
24 DR. COLLINS: Scott, I wanted
25 to return to the issue that you
166
1 APS CLIMATE CHANGE STATEMENT REVIEW WORKSHOP
2 raised about model calibration and
3 also what the models do. Just so
4 everybody understands what a climate
5 model is, the two major components
6 traditionally were atmosphere and
7 ocean. And I'm sorry. I am not
8 dissing anybody. There are several
9 other components of it.
10 They are solving the Euler
11 equations for the fluid. They are
12 solving fluid equations. There is a
13 scale separation issue. You might
14 imagine that we are dealing with a
15 multiphysics situation that extends
16 over 14 orders of magnitude.
17 So, we do have to parameterize
18 just as one would have to in a
19 multiphysics model of the operation
20 of the universe. So, it's the same
21 class of problem, almost the exact
22 same major scales. And one must
23 parameterize in that instance.
24 The issue that you raised about
25 model preparation is a tricky one.
167
1 APS CLIMATE CHANGE STATEMENT REVIEW WORKSHOP
2 It is one that we are acutely aware
3 of. And although we don't have
4 multiple instantiations of the earth
5 in the present day, we can use the
6 paleo record as a means of probing
7 how the models will do out of sample.
8 And the out-of-sample that we
9 use there is the Milankovitch cycle,
10 {garbled transcription: the variations of all the powers of
11 the earth, the dry variations and
12 solar insolation and its position on
13 the surface as a function of
14 seasonal cycle, and its particularly
15 larger use of to the earth to
16 disappear from the sun} and the
17 orientation of the lower hemisphere
18 landmasses to the sun during the
19 summer.
20 And there is an extensive
21 amount of literature on that work.
22 The models are exercised extensively
23 using the paleo record. There is a
24 very large amount of work that is
25 done to analyze models of the
168

169
1 APS CLIMATE CHANGE STATEMENT REVIEW WORKSHOP
2 samples.
3 I really want to make clear to
4 you these are regimes which have a
5 very different thermal characteristic
6 than the present day. So, the models
7 are exercised routinely and tested
8 routinely by a very large cottage
9 industry out of sample.
10 So, just please be aware of
11 that before concluding that the
12 record is so lousy over the last 30
13 years that we are in danger of
14 extrapolating wrong.
15 And the final thing I want to
16 point out to you, there is a lot more
17 known about the physics on small
18 scales that we haven’t been incorporating
19 in the models because of computational
20 limitations.
21 These problems are inherently
22 too long in time because the model
23 time scales are long. They are
24 millennia. So, a lot of what we know
25 and get emulated in process models
170
1 APS CLIMATE CHANGE STATEMENT REVIEW WORKSHOP
2 and test against measurements has to
3 be used in statistical fashion
4 regarding the models.
5 But nonetheless, the
6 understanding at process level is
7 there, for example, the formation of
8 stratus clouds.
9 So again, I don't want the
10 community to come away with the fact
11 that there is this -- model is
12 resting on a large amount on mystery
13 meat. They are not. There is
14 mystery meat for sure.
15 But there is a very large
16 amount of process modeling and
17 process observations and backstop
18 data that we can't incorporate simply
19 because of computational limitations.
20 DR. KOONIN: Bill, as long as
21 you raised the Milankovitch cycle, is
22 there a way to phrase the
23 Milankovitch forcing in watts per
24 square meter so that one can compare
25 it with the current anthropogenic
171
1 APS CLIMATE CHANGE STATEMENT REVIEW WORKSHOP
2 influences? How would that
3 comparison go?
4 DR. COLLINS: Well, in some
5 cases, six watts.
6 DR. KOONIN: Six, roughly?
7 DR. COLLINS: Yes, it's quite
8 large.
9 DR. KOONIN: But not an order
10 of magnitude?
11 DR. COLLINS: No.
12 DR. CHRISTY: But high
13 latitudes can be much larger than
14 six.
15 DR. LINDZEN: Averaged over the
16 globe and over the years, it's small.
17 DR. COLLINS: That's right, but
18 locally --
19 DR. LINDZEN: Locally, it's
20 100 watts per meter squared in the
21 Summer Arctic.
22 DR. COLLINS: It's big.
23 DR. KOONIN: I think we have
24 reached a time when we should take
25 a break. Why don't we break until
172
1 APS CLIMATE CHANGE STATEMENT REVIEW WORKSHOP
2 10:30 and pick up then. Thank you.
3 (Whereupon, a recess was
4 taken.)
5 DR. KOONIN: Okay Ben, you're
6 on.
7 DR. SANTER: Thank you very
8 much for giving me this opportunity.
9 I would like to talk about a couple
10 of things. Since a number of your
11 questions related to detection and
12 attribution, I thought I would give
13 an example of a recent study that
14 Bill mentioned.
15 Then I am going to spend some
16 time talking about the stasis.
17 Since, again, it figured prominently
18 in your questions, I wanted to
19 present some work that is currently
20 under review at Nature Geoscience
21 about that; finally, some
22 conclusions.
23 If I get time, I would likely
24 to revisit this issue that turned up
25 after Bill's presentation of
173
1 APS CLIMATE CHANGE STATEMENT REVIEW WORKSHOP
2 multimodel ensembles and how we
3 actually exploit them for what I do,
4 detection and attribution work, and
5 do differences in model quality
6 really matter for the work do I? Do
7 they affect our ability to identify
8 an anthropogenic fingerprint on
9 climate?
10 These[next page] are slices through
11 the earth's atmosphere. These are all
12 model calculations. This is from the
13 so-called parallel climate model that
14 was developed jointly at the National
15 Center for Atmospheric Research in
16 Los Alamos.
17 And in each case, this
18 particular model was run with changes
19 in just one factor alone, except in
20 the bottom-right panel.
21 And that one factor was changes
22 in well-mixed greenhouse gases,
23 changes in volcanic aerosols, changes
24 in the sun's energy output, changes
25 in anthropogenic sulfate aerosols,
174
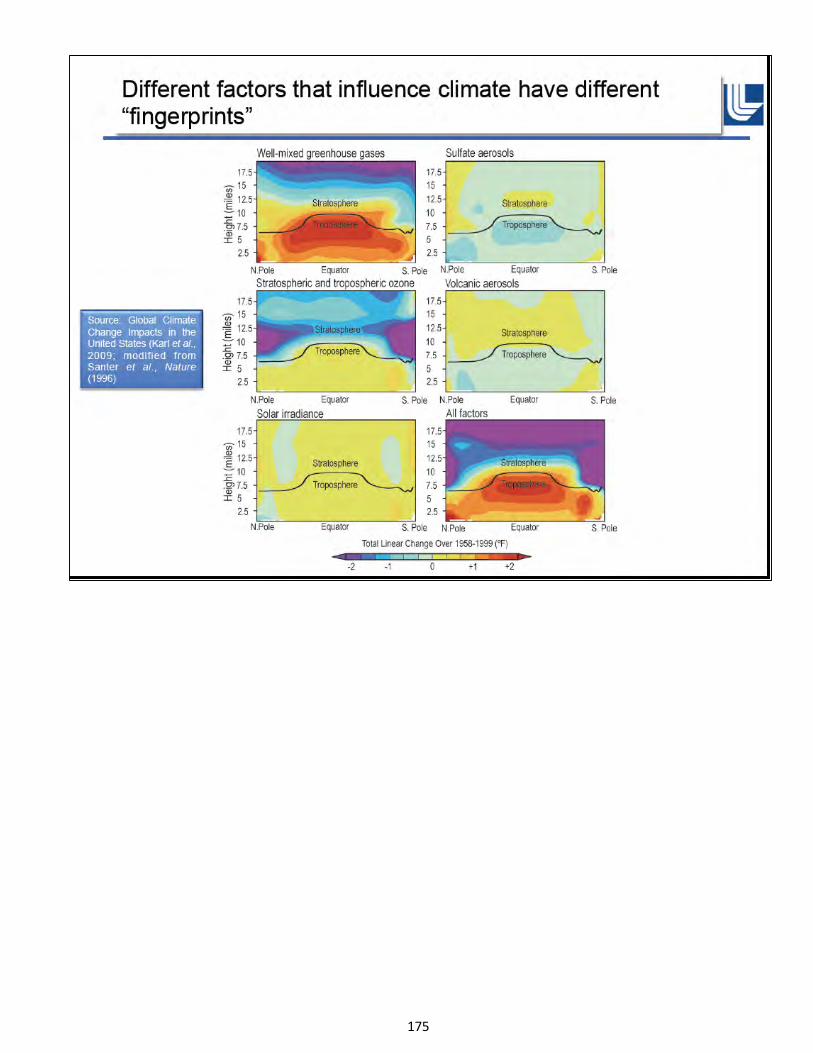
175
1 APS CLIMATE CHANGE STATEMENT REVIEW WORKSHOP
2 changes in tropospheric and
3 stratospheric ozone according to our
4 best understanding of how these
5 things actual did change over the
6 20th century.
7 And I won't get into the
8 details of the differences between
9 these pictures here. But what they
10 show you is that in fingerprinting,
11 we don't just look at global mean
12 changes.
13 We probe beyond one global mean
14 number. And understanding a
15 discriminatory power comes in looking
16 at complex geographical, or in this
17 case, altitudinal patterns of climate
18 change.
19 Now, much of the attention has
20 focused on these two patterns [next page],
21 the vertical pattern of the response to
22 human-caused changes in CO2 and other
23 greenhouse gases, and the vertical
24 pattern of change associated with the
25 dialing up of the sun.
176
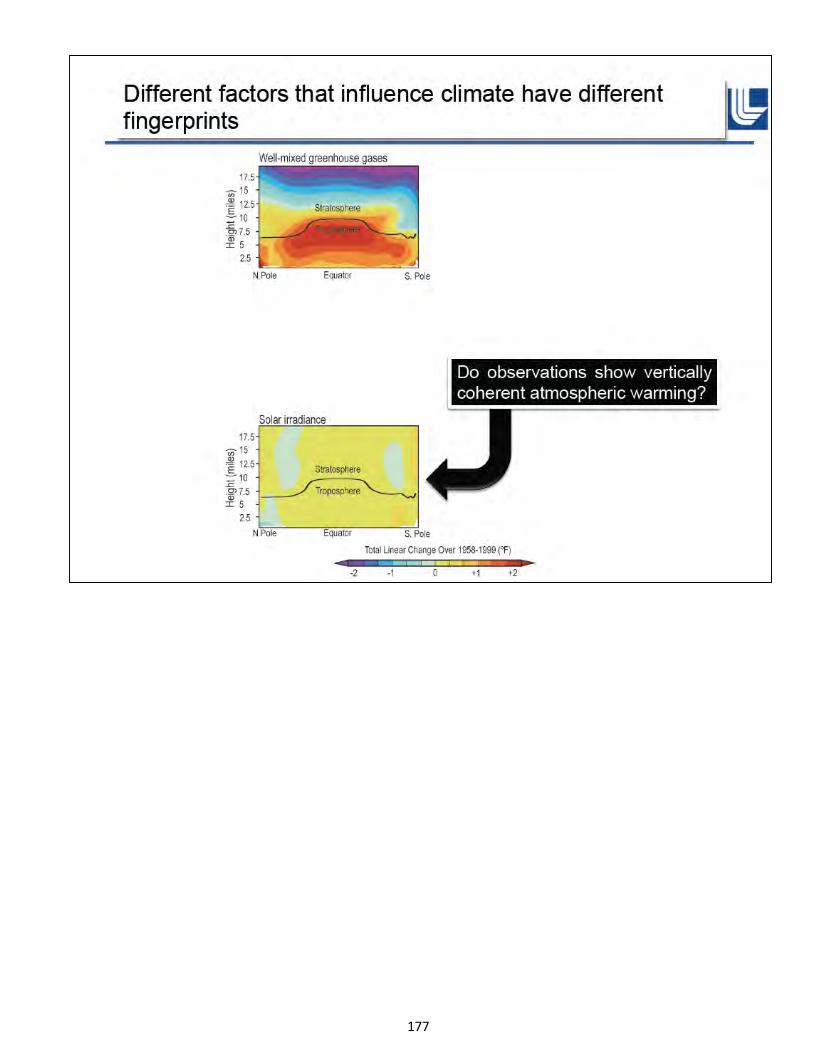
177
1 APS CLIMATE CHANGE STATEMENT REVIEW WORKSHOP
2 As Bill pointed out, although
3 our estimates of solar radiance
4 changes over the 20th century are
5 uncertain, people think that there
6 may have been some small
7 low-frequency increase in total solar
8 radiance over the 20th century.
9 If that happened, then we would
10 expect to see heating throughout the
11 full vertical extent of the
12 atmosphere.
13 Now, we have known since the
14 1960s, since Suki Manabe, Warren
15 Washington and others performed the
16 first simulations where they doubled
17 preindustrial CO2 that the vertical
18 fingerprint of response to
19 human-caused changes in greenhouse
20 gases is very different, and it
21 involves this dipole as we discussed,
22 the warming of the troposphere, the
23 cooling of the stratosphere.
24 I just wanted to point out here
25 that folks often say models are not
178
1 APS CLIMATE CHANGE STATEMENT REVIEW WORKSHOP
2 falsifiable. They cannot make
3 predictions that we can actually
4 test. That's not true.
5 Back in the '60s when Suki
6 Manabe and Warren and others did
7 these simulations, we really didn't
8 have the satellite data and we had
9 sparse weather balloon data.
10 It was not possible to
11 determine back then whether there
12 were sustained multidecadal changes
13 in the temperature of the troposphere
14 and the stratosphere. These early
15 pioneers could have been wrong. I
16 will try and convince you that they
17 were not.
18 So, one of the questions that
19 we will get onto is, do observations
20 actually show vertically-coherent
21 atmospheric warming, do they look
22 like sun fingerprint or do they look
23 like the CO2-increase fingerprint?
24 I am going to give you an
25 example of a recent study. [next page]
179
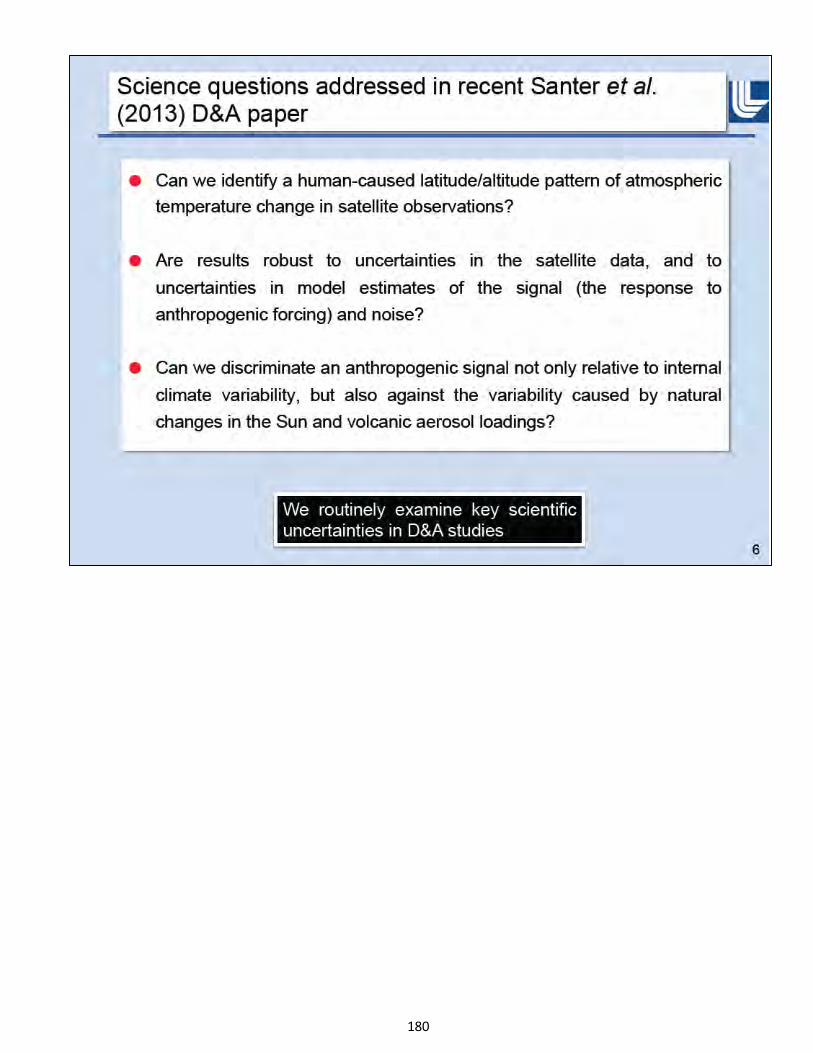
180
1 APS CLIMATE CHANGE STATEMENT REVIEW WORKSHOP
2 Bill mentioned this. It came out of a few
3 months ago in PNAS. And we wanted to
4 look at the following science
5 questions.
6 The first was revisiting some
7 of the early work we did about 15
8 years ago. Can we identify some
9 human-caused pattern of climate
10 change in the vertical structure of
11 atmospheric temperature?
12 Another question was
13 uncertainties. Judy has raised the
14 question of uncertainties. And there
15 is some, I think, misperception that
16 detection and attribution studies
17 sweep these uncertainties under the
18 carpet. I will try and convince you
19 that that is not the case.
20 In fact, we wouldn't be able to
21 get this kind of work published if we
22 did not routinely and comprehensively
23 look at uncertainties in model
24 estimates of the response to forcing,
25 uncertainties in model estimates of
181
1 APS CLIMATE CHANGE STATEMENT REVIEW WORKSHOP
2 internal variability and at
3 uncertainties in the observations
4 themselves.
5 And the real opportunities to
6 do that now, as I will show you in a
7 few minutes, one of the groups we
8 work with, Remote Sensing Systems in
9 Santa Rosa has developed an ensemble
10 of observations for atmospheric
11 temperature.
12 So, they played through all of
13 uncertainties in data set
14 construction, how you account for
15 satellite orbital drift, the impact
16 of that drift on the sampling of
17 Earth's diurnal cycle, how you
18 account for inter-instrument
19 calibration biases using a nice Monte
20 Carlo approach.
21 And they generate a 400-member
22 ensemble model of observations that
23 you can use in this kind of
24 fingerprinting work and see whether
25 your ability to detect is sensitive
182
1 APS CLIMATE CHANGE STATEMENT REVIEW WORKSHOP
2 to those uncertainties in the
3 observations.
4 Another thing that we do in
5 this study that is a little unusual,
6 typically fingerprint work tests
7 against internal variability alone
8 that they estimate from models.
9 We are also going to ask the
10 question, given these new
11 world-without-us simulations in
12 CMIP5, so, the simulations that Bill
13 mentioned that have natural external
14 forcing, the sun and volcanos from
15 1850 through to the present and some
16 of them over the last millennium.
17 You can ask this sort of
18 worse-case scenario statistical
19 significance testing question; could
20 larger solar radiance changes or the
21 recovery from larger volcanic
22 eruptions that have occurred over the
23 past 1,000 years screw up
24 anthropogenic signal detection?
25 Could we misidentify that
183
1 APS CLIMATE CHANGE STATEMENT REVIEW WORKSHOP
2 dipole pattern of tropospheric
3 warming and stratospheric cooling?
4 Could it really be due to something
5 else?
6 Okay,[next page] we are going to
7 do all of this in satellite space. So, as
8 John Christy, I am sure, will talk about
9 later, the microwave sounding unit
10 estimates of atmospheric temperature
11 change which he and Roy Spencer
12 pioneered look at the temperature
13 changes over broad layers of the
14 atmosphere based on the microwave
15 emissions from oxygen molecules.
16 We are going to be working in
17 this vertically-smooth space looking
18 at the temperature of the lower
19 troposphere. That's the cyan curve,
20 the temperature of the mid to upper
21 troposphere and the temperature of
22 the lower stratosphere.
23 And what we have done is we
24 have actually calculated synthetic
25 satellite data from the model
184
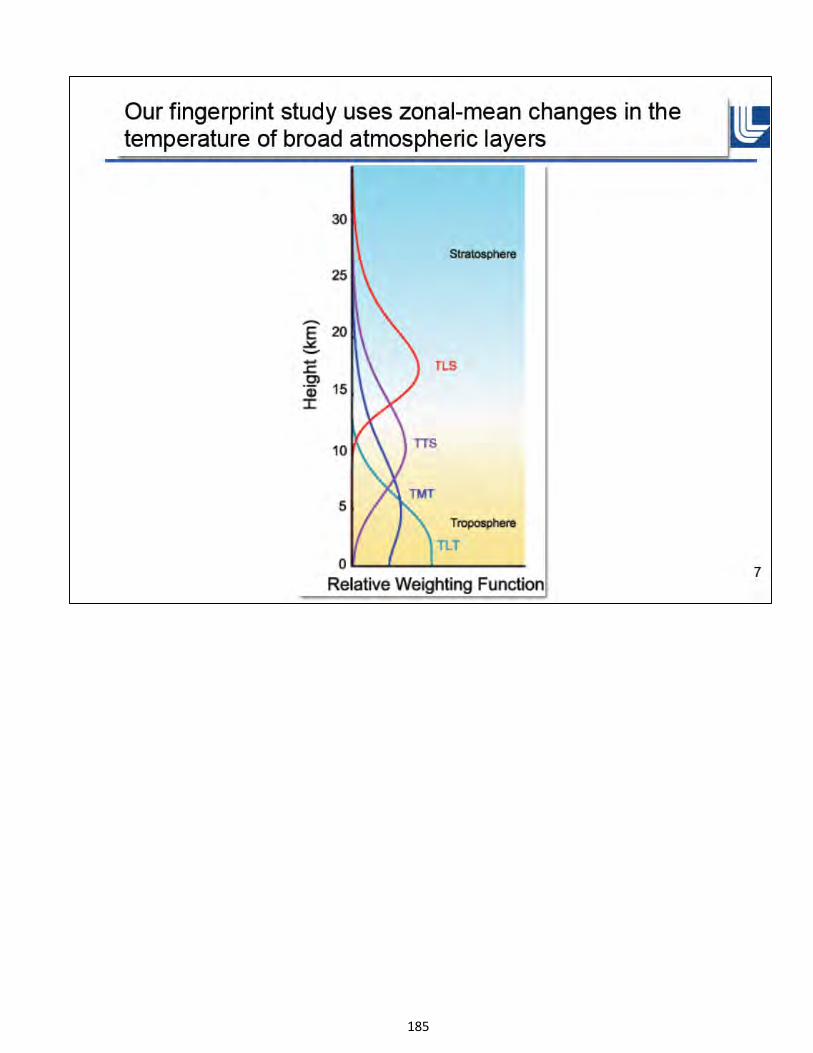
185
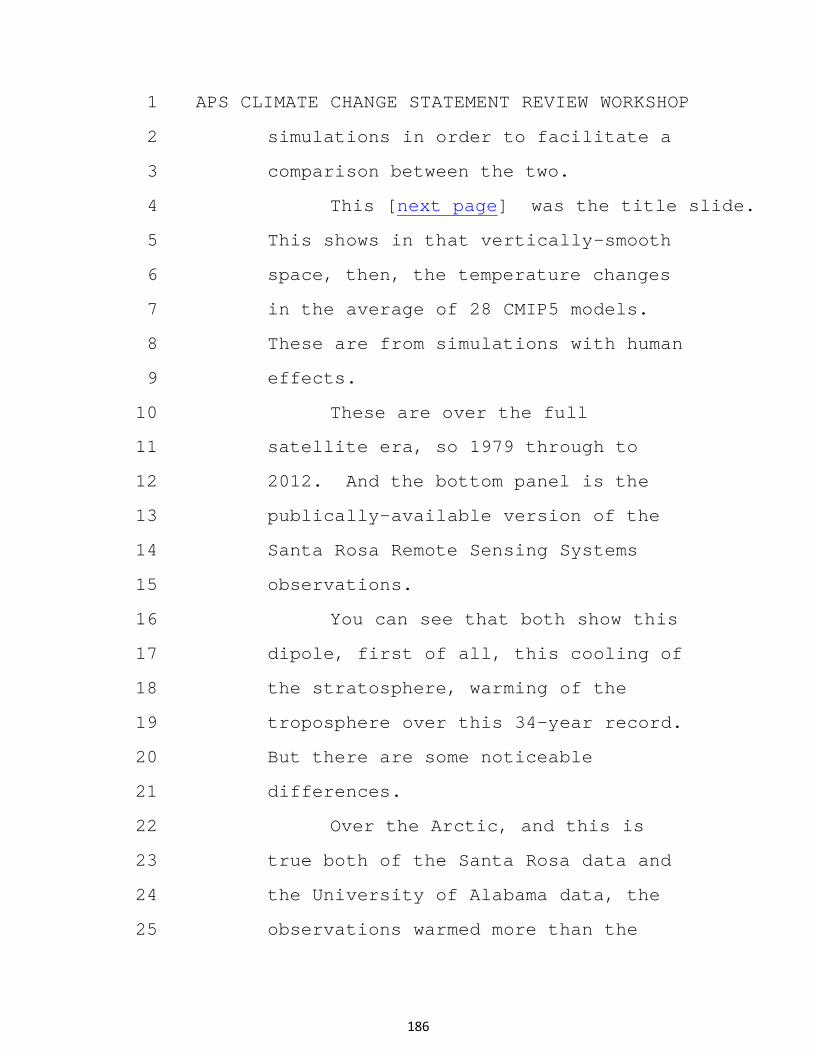
1 APS CLIMATE CHANGE STATEMENT REVIEW WORKSHOP
2 simulations in order to facilitate a
3 comparison between the two.
4 This [next page] was the title slide.
5 This shows in that vertically-smooth
6 space, then, the temperature changes
7 in the average of 28 CMIP5 models.
8 These are from simulations with human
9 effects.
10 These are over the full
11 satellite era, so 1979 through to
12 2012. And the bottom panel is the
13 publically-available version of the
14 Santa Rosa Remote Sensing Systems
15 observations.
16 You can see that both show this
17 dipole, first of all, this cooling of
18 the stratosphere, warming of the
19 troposphere over this 34-year record.
20 But there are some noticeable
21 differences.
22 Over the Arctic, and this is
23 true both of the Santa Rosa data and
24 the University of Alabama data, the
25 observations warmed more than the
186
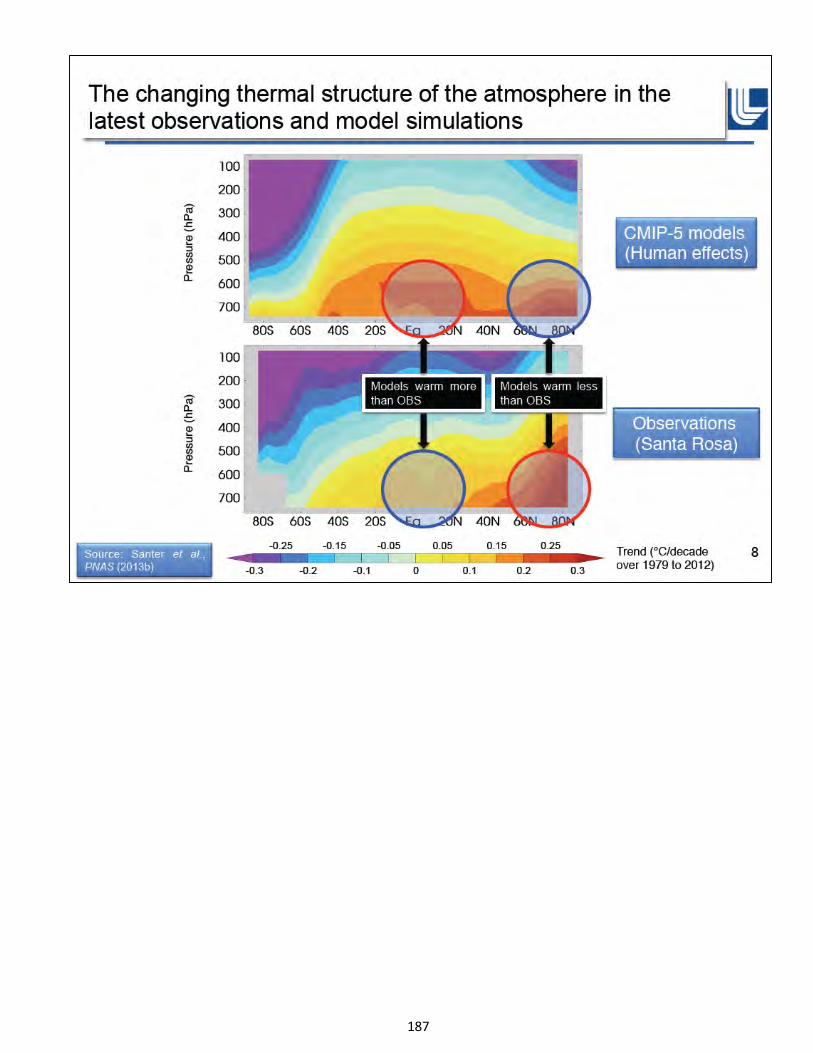
187
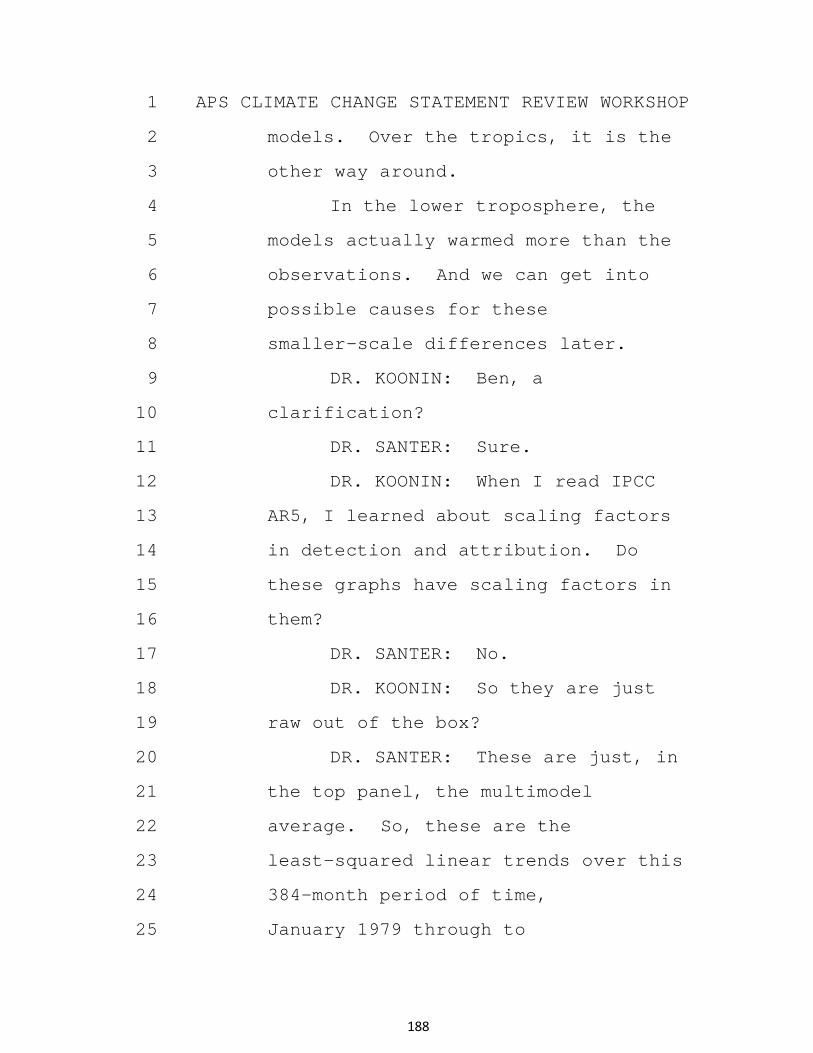
1 APS CLIMATE CHANGE STATEMENT REVIEW WORKSHOP
2 models. Over the tropics, it is the
3 other way around.
4 In the lower troposphere, the
5 models actually warmed more than the
6 observations. And we can get into
7 possible causes for these
8 smaller-scale differences later.
9 DR. KOONIN: Ben, a
10 clarification?
11 DR. SANTER: Sure.
12 DR. KOONIN: When I read IPCC
13 AR5, I learned about scaling factors
14 in detection and attribution. Do
15 these graphs have scaling factors in
16 them?
17 DR. SANTER: No.
18 DR. KOONIN: So they are just
19 raw out of the box?
20 DR. SANTER: These are just, in
21 the top panel, the multimodel
22 average. So, these are the
23 least-squared linear trends over this
24 384-month period of time,
25 January 1979 through to
188
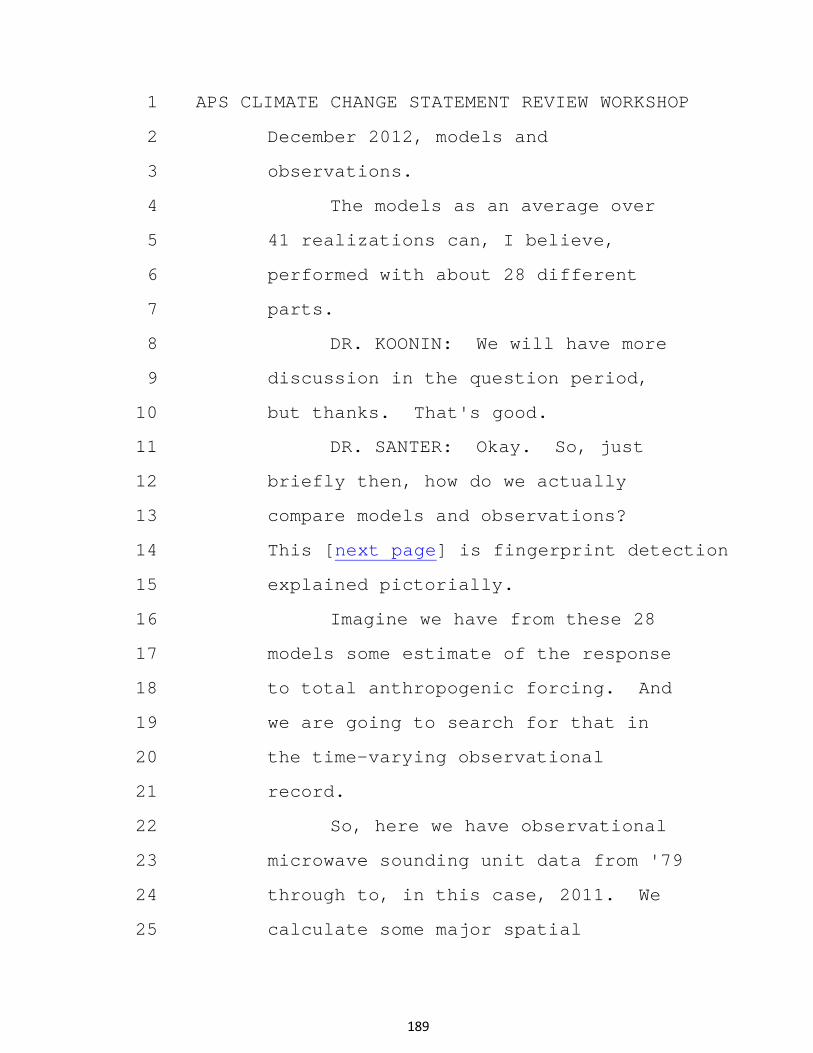
1 APS CLIMATE CHANGE STATEMENT REVIEW WORKSHOP
2 December 2012, models and
3 observations.
4 The models as an average over
5 41 realizations can, I believe,
6 performed with about 28 different
7 parts.
8 DR. KOONIN: We will have more
9 discussion in the question period,
10 but thanks. That's good.
11 DR. SANTER: Okay. So, just
12 briefly then, how do we actually
13 compare models and observations?
14 This [next page] is fingerprint detection
15 explained pictorially.
16 Imagine we have from these 28
17 models some estimate of the response
18 to total anthropogenic forcing. And
19 we are going to search for that in
20 the time-varying observational
21 record.
22 So, here we have observational
23 microwave sounding unit data from '79
24 through to, in this case, 2011. We
25 calculate some major spatial
189
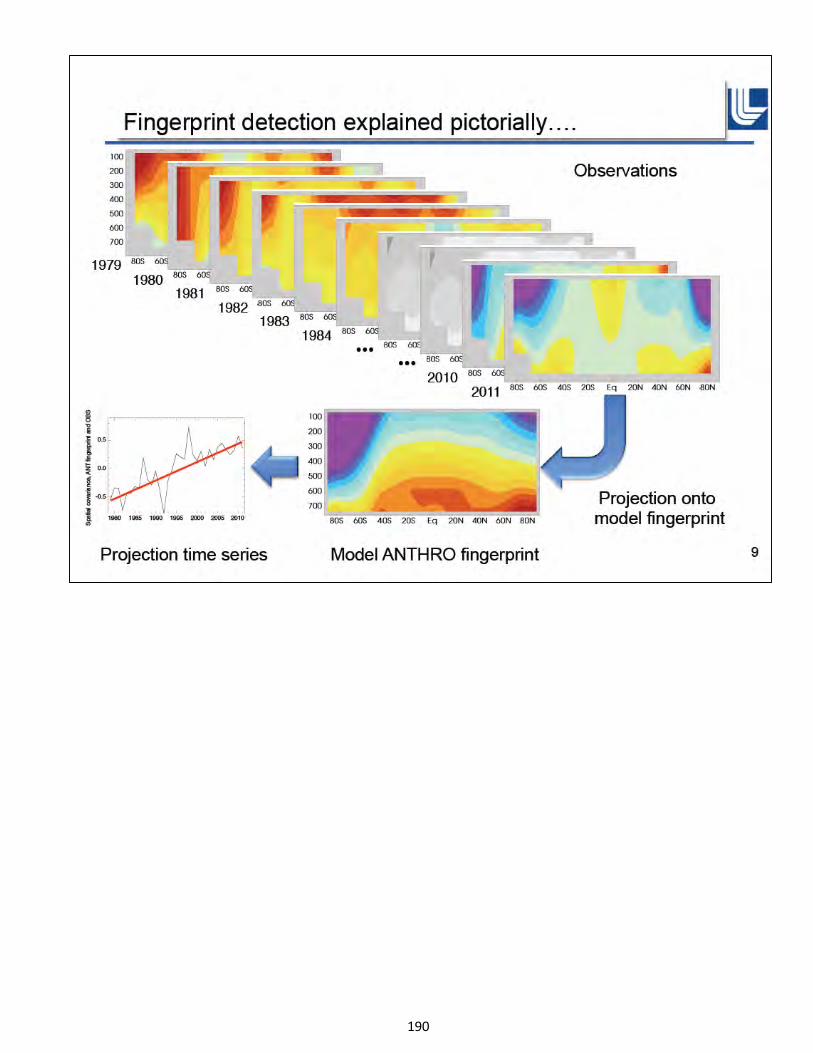
190
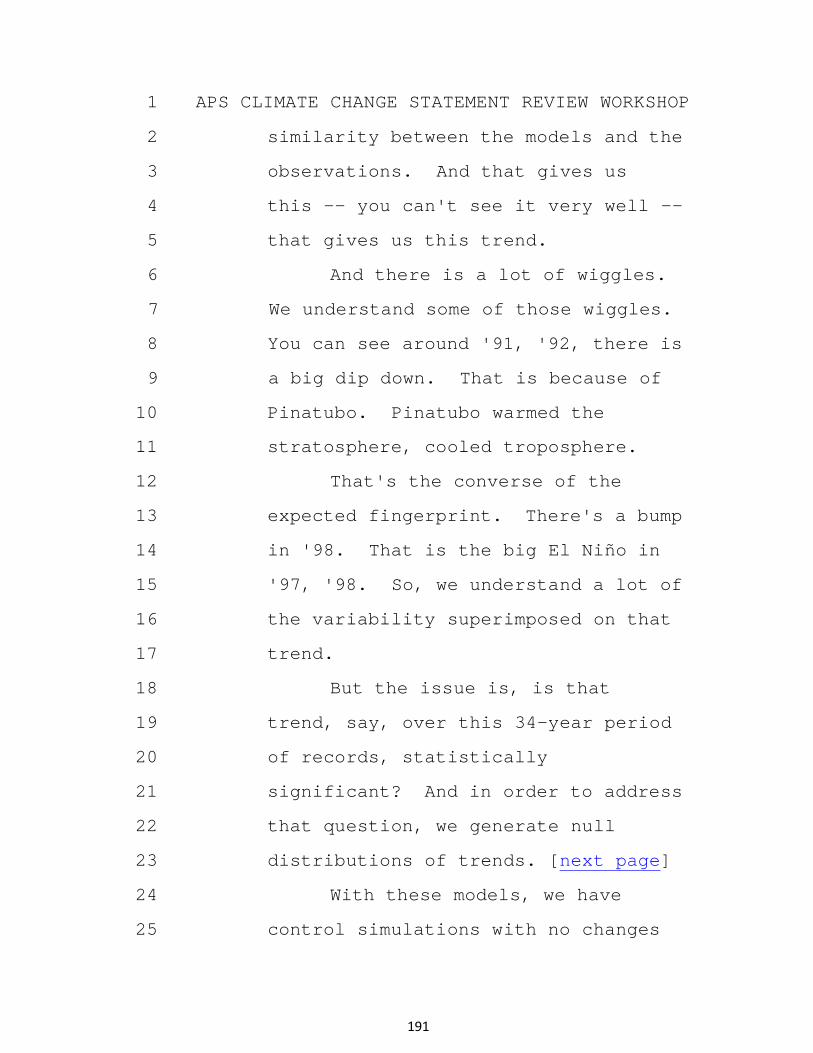
1 APS CLIMATE CHANGE STATEMENT REVIEW WORKSHOP
2 similarity between the models and the
3 observations. And that gives us
4 this -- you can't see it very well --
5 that gives us this trend.
6 And there is a lot of wiggles.
7 We understand some of those wiggles.
8 You can see around '91, '92, there is
9 a big dip down. That is because of
10 Pinatubo. Pinatubo warmed the
11 stratosphere, cooled troposphere.
12 That's the converse of the
13 expected fingerprint. There's a bump
14 in '98. That is the big El Niño in
15 '97, '98. So, we understand a lot of
16 the variability superimposed on that
17 trend.
18 But the issue is, is that
19 trend, say, over this 34-year period
20 of records, statistically
21 significant? And in order to address
22 that question, we generate null
23 distributions of trends. [next page]
24 With these models, we have
25 control simulations with no changes
191
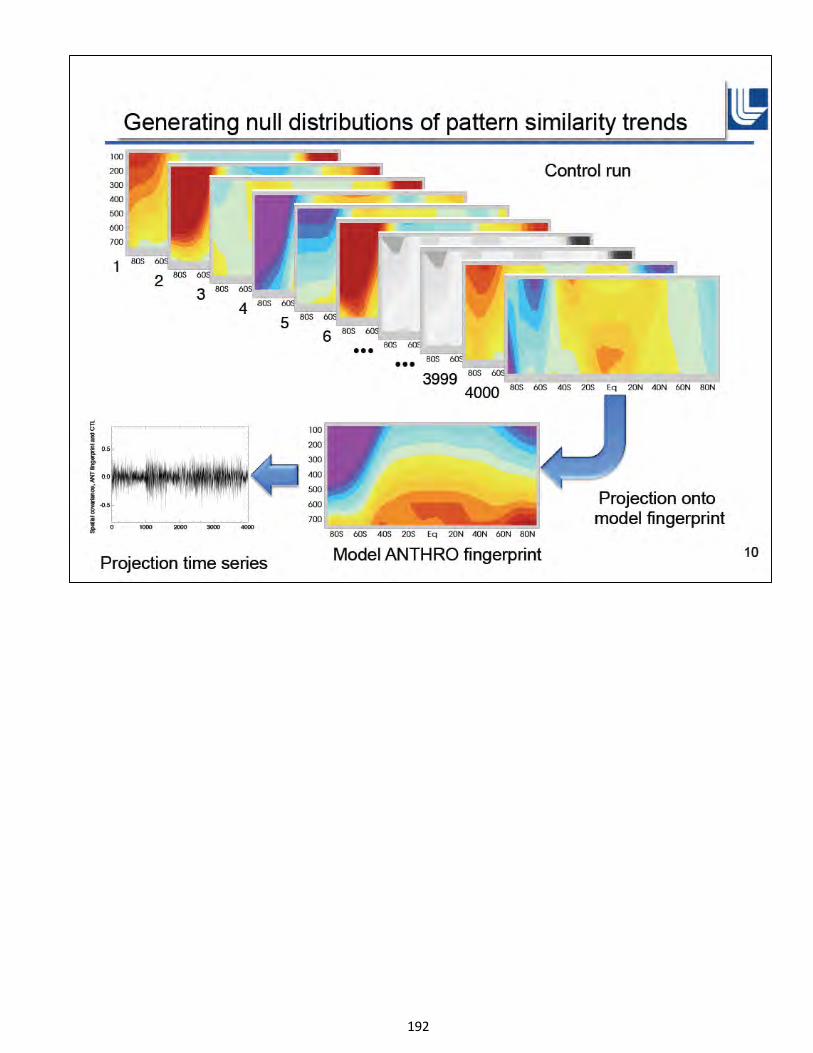
192
1 APS CLIMATE CHANGE STATEMENT REVIEW WORKSHOP
2 in external forcing. We are going to
3 use results from over 4,000 thousand
4 years of simulation. And you can do
5 the same thing.
6 You can look at the pattern
7 agreement that you might expect by
8 chance between the model unforced
9 variability and the searched-for
10 anthropogenic signal.
11 And [next page] you get some
12 projection time series. You can look at
13 trends on any time scale in that projection
14 series, and then can you look at
15 signal to noise.
16 You can look at the observed
17 trend that I showed you in the
18 previous picture relative to these
19 unforced trends and pattern
20 similarity. And that enables you to
21 look at signal to noise as a function
22 of time scale.
23 Now, the first trend is for the
24 first ten years, '79 to 1988. Since
25 the satellite record starts in 1979,
193

194
1 APS CLIMATE CHANGE STATEMENT REVIEW WORKSHOP
2 the longest trend is over the full
3 period of satellite record, '79 in
4 this case, through to 2011.
5 The light green lines there
6 show you these realizations from the
7 Santa Rosa results. I have used the
8 five, ten, 15, percentiles of that
9 400-member ensemble of observations
10 to be able to look at the uncertainty
11 in the observations and how that
12 projects onto our ability to detect.
13 The key thing here is that if
14 you look over the full period of the
15 satellite record, remember that plot
16 that I showed you before with the
17 tropospheric warm and stratospheric
18 cooling, natural internal variability
19 can't give you that. The
20 signal-to-noise ratio is nine to
21 eleven.
22 It's kind of interesting to
23 compare that, say, with the big
24 discussion that we have had in the
25 last year or two about the
195
1 APS CLIMATE CHANGE STATEMENT REVIEW WORKSHOP
2 significance of a five-sigma result
3 with the detection of the Higgs
4 boson.
5 So, basically this says that
6 model-based estimates of internal
7 variability, if credible, cannot give
8 you this kind of result.
9 You can also, then, [next page] look at
10 the second question, whether model
11 responses to solar forcing and very
12 large volcanic eruptions could mimic
13 the kind of things we see in the
14 observations there.
15 We know we did have two big
16 volcanic eruptions, El Chichón,
17 Pinatubo. We know we have had
18 changes in solar radiance. How about
19 if we looked in the deep past, if we
20 looked at things like Krakatoa here?
21 This is the stratospheric
22 temperature changes here, MSU Channel
23 4 from 16 different models. And you
24 can see that most of these have some
25 representation of volcanic aerosol
149 196
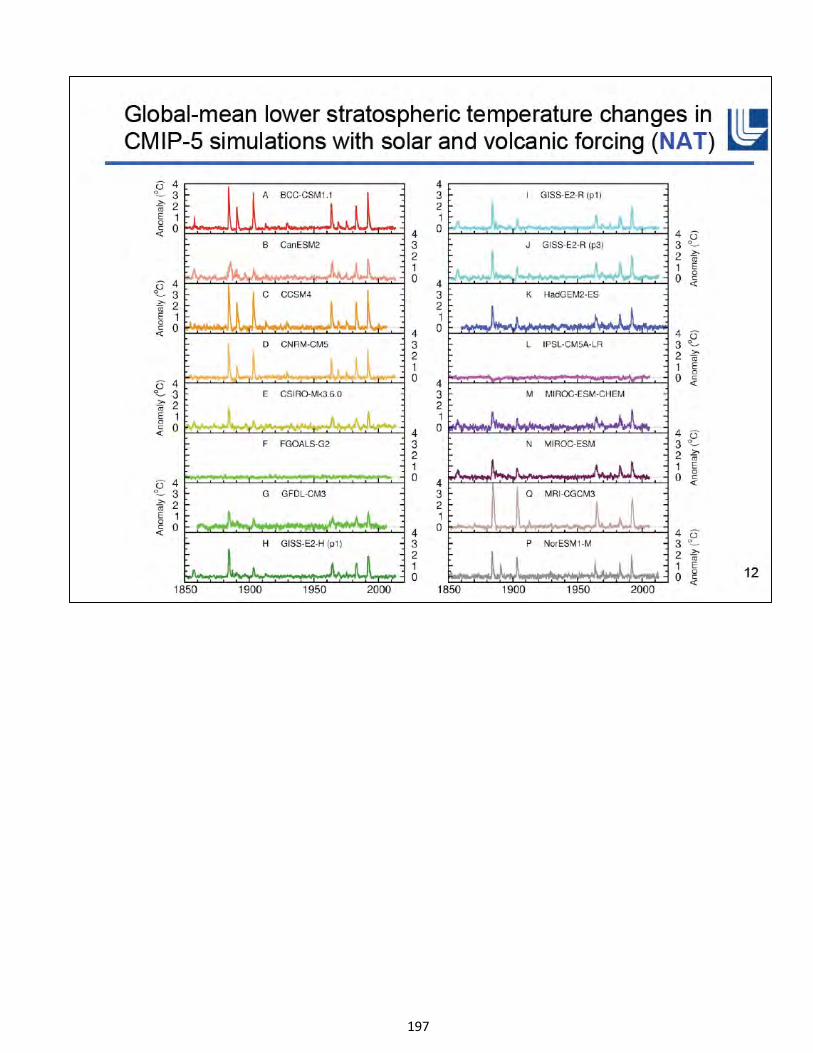
197
1 APS CLIMATE CHANGE STATEMENT REVIEW WORKSHOP
2 changes and solar changes from 1850
3 through to the present.
4 So, you can use this as your
5 noise basis for trying to do signal
6 detection. And [next page] you can look
7 back deeper in time at these last
8 millennium runs that typically start
9 in 850 AD and have very large
10 eruptions like this in 1258 here.
11 And again, when you have a big
12 eruption, you warm the stratosphere.
13 You cool the troposphere. You have
14 some recovery time scale, which we
15 will get into in discussion of the
16 stasis.
17 So, the question is whether
18 that warming that you see in the
19 recovery phase could cause you to
20 misidentify anthropogenic
21 fingerprints.
22 DR. KOONIN: So, just hold on
23 for a minute. Go back.
24 DR. SANTER: Sure.
25 DR. KOONIN: The models have
198
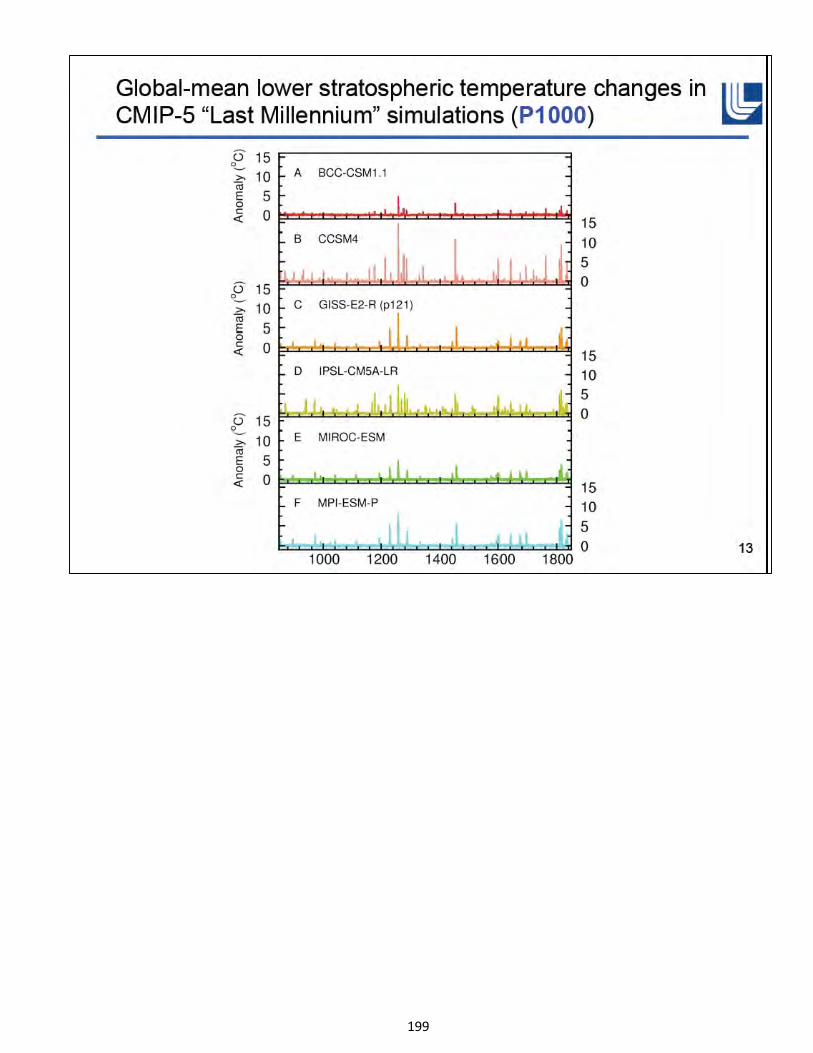
199
1 APS CLIMATE CHANGE STATEMENT REVIEW WORKSHOP
2 different responses?
3 DR. SANTER: Very different
4 responses, yes, that's true.
5 DR. KOONIN: Right. So, do you
6 just average them all together?
7 DR. SANTER: No, we use all of
8 them. We use all of them. So, we
9 concatenate these control runs and we
10 look at all of these model-based
11 noise estimates.
12 I should say that for the
13 control runs what we do is we make
14 sure that, since model control runs
15 are a different length, we have the
16 same length control run from each
17 model so that we are not
18 preferentially giving weight to one
19 model relative to another.
20 DR. KOONIN: I look at CCSM4,
21 for example. So, it's pretty
22 responsive to some of the --
23 DR. SANTER: Well, that's
24 right. It has global mean
25 15 degrees C warming of the lower
200
1 APS CLIMATE CHANGE STATEMENT REVIEW WORKSHOP
2 stratosphere after this big eruption
3 in 1258, and about four degrees
4 Celsius cooling of the global mean
5 troposphere.
6 So, that's a very big eruption.
7 And the question is, could that
8 interfere with anthropogenic signal
9 detection and recovery from that very
10 large eruption? And the answer is
11 no.
12 So, [next page] the blue and the red
13 now are testing against this world
14 without us, but with solar and
15 volcanic forcing. The blue lines are
16 from 1850 through to the present,
17 these naturally-forced simulations,
18 and the red is the last millennium
19 simulations.
20 Since the red has very much
21 larger volcanic eruptions and larger
22 solar radiance changes around the
23 time of the modern millennium, signal
24 to noise goes down, but it's still in
25 every case above the one-percent
201
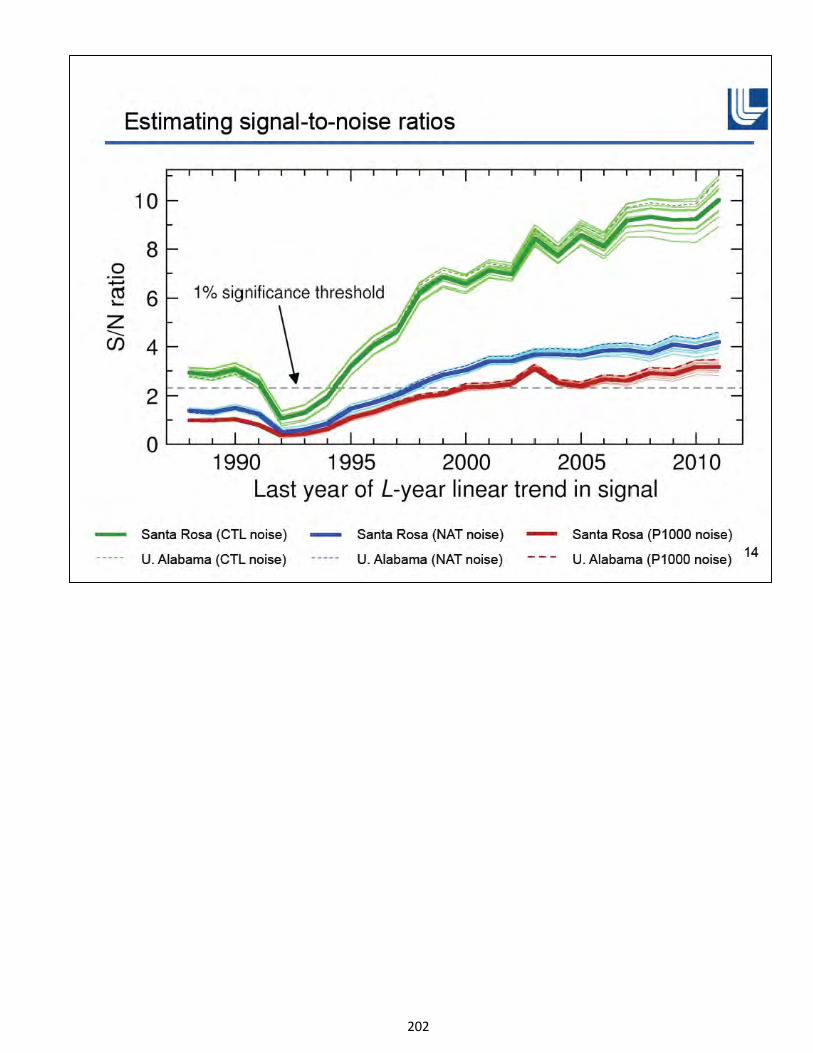
202
1 APS CLIMATE CHANGE STATEMENT REVIEW WORKSHOP
2 significance threshold.
3 Incidentally, this little dip
4 here [indicating 1992] is the effect of
5 Pinatubo in the observations which, again,
6 warmed the lower stratosphere, cooled the
7 troposphere. That's the converse of
8 the expected anthropogenic signal.
9 So,[next page] the question is why?
10 Why do we get those results? Again, let
11 me take you back to these patterns
12 here. And they do show latitudinally
13 pretty coherent cooling of the
14 stratosphere and warming of the
15 troposphere.
16 And [next page] it turns out that when
17 you look at these 28 control runs and you
18 do an EOF analysis and look at the
19 dominant modes of variability, they
20 don't do that.
21 They don't generate sustained
22 warming of the troposphere and
23 cooling of the lower stratosphere on
24 these long time scales, nor do the
25 naturally-forced runs. They can't
203
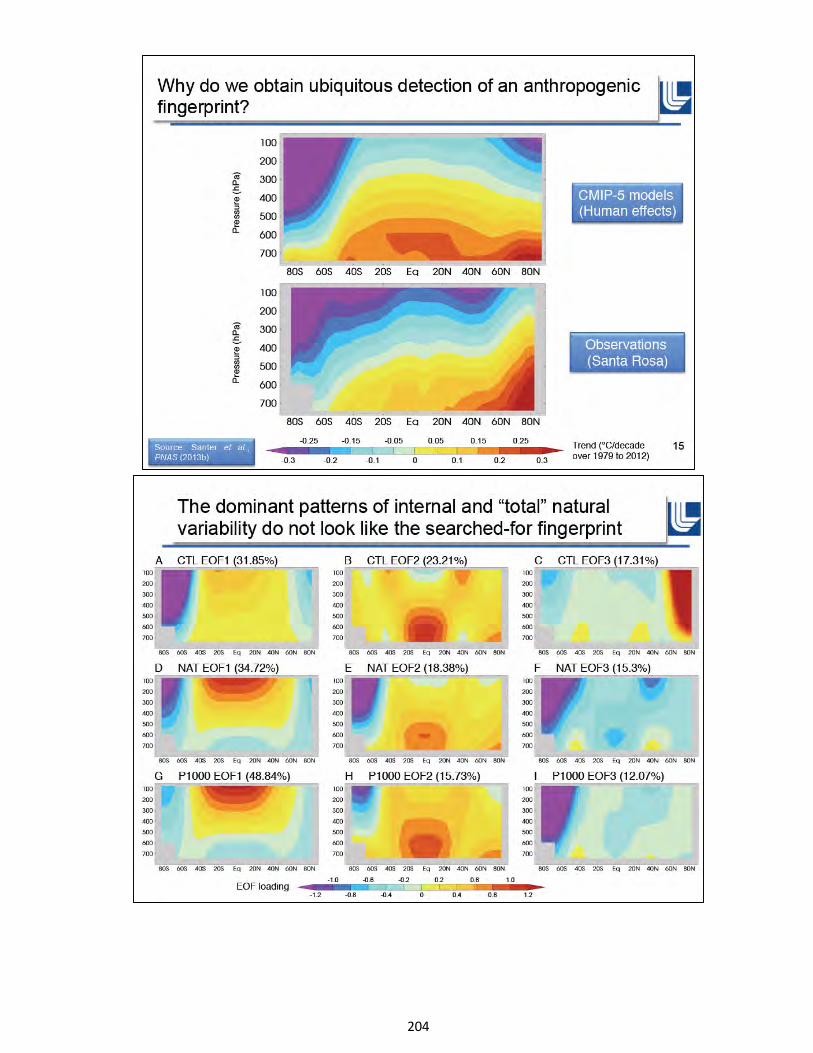
204
1 APS CLIMATE CHANGE STATEMENT REVIEW WORKSHOP
2 generate those kind of patterns, and
3 nor do the last millennium runs.
4 Now, Judy raised the question
5 here of model-based estimates of
6 internal variability. They are a
7 crucial underpinning this have work.
8 So, if we systematically
9 underestimated the true unforced
10 variability, particularly on these
11 multidecadal time scales that are
12 crucial to the identification of an
13 anthropogenic system, then the
14 signal-to-noise ratio would be biased
15 high. It would be systemically too
16 high.
17 So, let's look at that. [next page]
18 We have done some band-pass filtering
19 for ocean surface temperature,
20 tropospheric temperature,
21 stratospheric temperature.
22 Basically what we have done is
23 we have windowed in on variability of
24 time scales of ten years. Recall,
25 again, that the microwave sounding
205
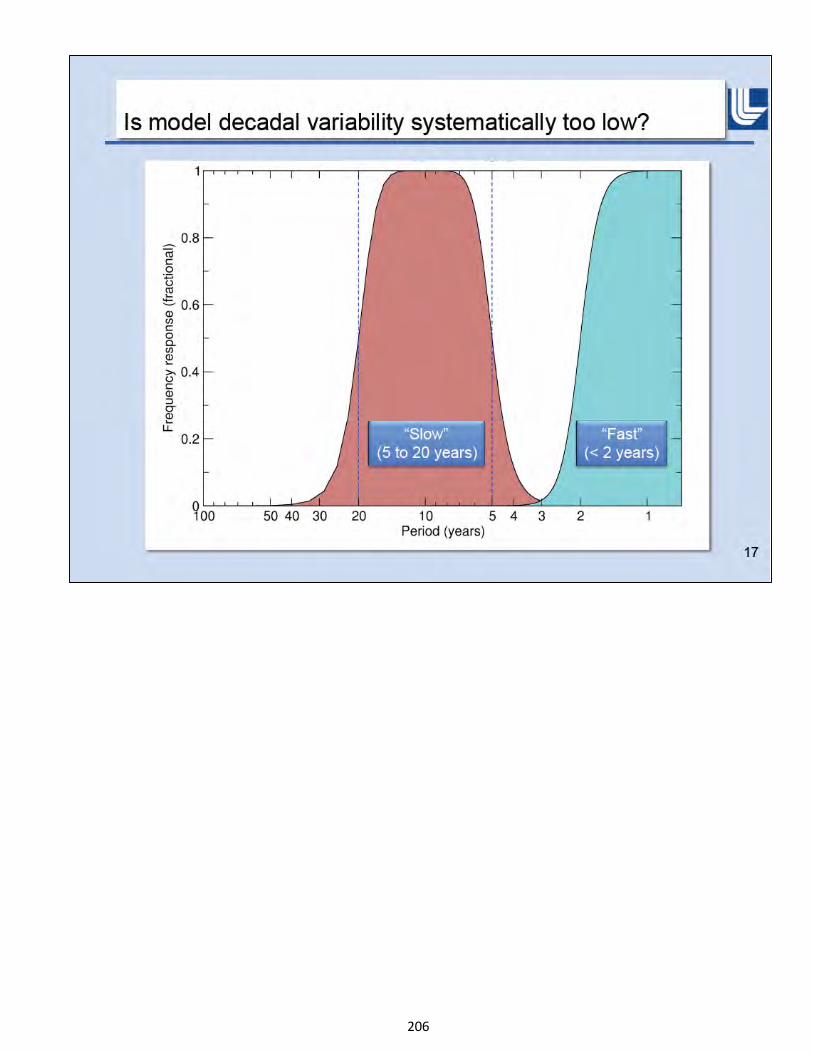
206
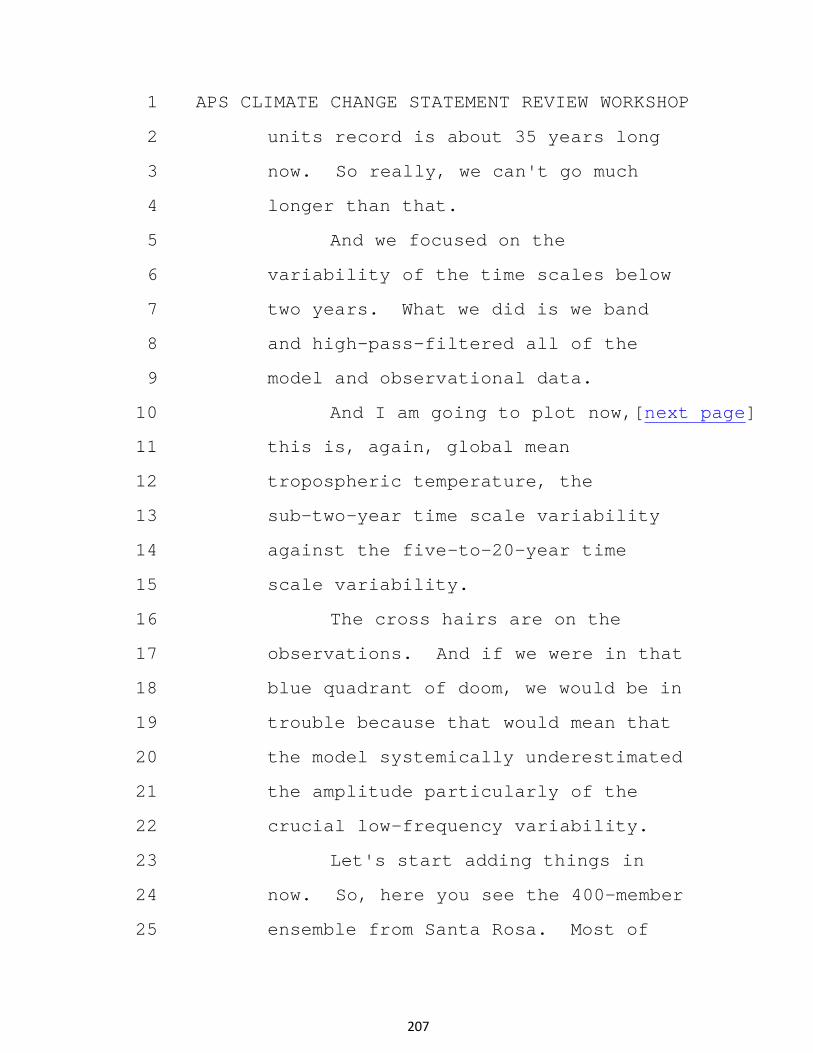
1 APS CLIMATE CHANGE STATEMENT REVIEW WORKSHOP
2 units record is about 35 years long
3 now. So really, we can't go much
4 longer than that.
5 And we focused on the
6 variability of the time scales below
7 two years. What we did is we band
8 and high-pass-filtered all of the
9 model and observational data.
10 And I am going to plot now,[next page]
11 this is, again, global mean
12 tropospheric temperature, the
13 sub-two-year time scale variability
14 against the five-to-20-year time
15 scale variability.
16 The cross hairs are on the
17 observations. And if we were in that
18 blue quadrant of doom, we would be in
19 trouble because that would mean that
20 the model systemically underestimated
21 the amplitude particularly of the
22 crucial low-frequency variability.
23 Let's start adding things in
24 now. So, here you see the 400-member
25 ensemble from Santa Rosa. Most of
207
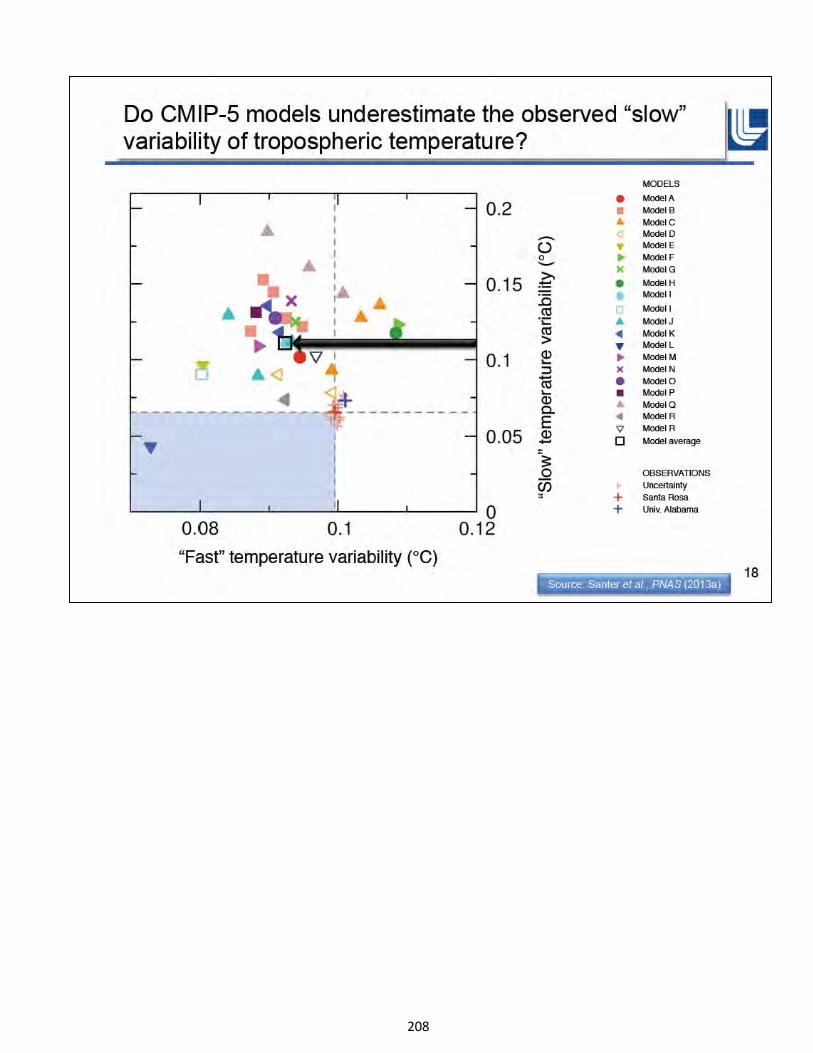
208
1 APS CLIMATE CHANGE STATEMENT REVIEW WORKSHOP
2 the uncertainty is in the
3 low-frequency direction there pretty
4 much as expected, because that's
5 where different decisions in how to
6 adjust for satellite orbital drift
7 effects really become manifest.
8 Now we are going to start
9 adding in model results. You can
10 see, as Bill mentioned, that some of
11 these have multiple realizations.
12 That's why I say in the case of
13 Model B, there are five squares
14 there.
15 Adding in a bunch of models
16 still, you can see that only one is
17 in the quadrant of doom and that on
18 average, the CMIP5 multimodel average
19 actually overestimates the
20 low-frequency variability by about 40
21 to 50 percent.
22 We found this for SST as well
23 as Bill showed from the spectrum,
24 there is no real evidence, at least
25 on these kind of time scales, of some
209
1 APS CLIMATE CHANGE STATEMENT REVIEW WORKSHOP
2 fundamental error in the amplitude of
3 variability.
4 That, of course, doesn't get at
5 the pattern-of-variability issue
6 which is equally important in
7 detection and attribution work.
8 Okay, the stasis. [charts following have been removed at Santer’s request to avoid prepublication release]
9 So this, again, is global mean change in
10 lower tropospheric temperature from both
11 Remote Sensing Systems and from
12 John's group.
13 And you can see that it's there
14 in tropospheric temperature, too.
15 This is not something that is
16 confined to surface temperature.
17 And remember Bill mentioned and
18 Judy mentioned, I think, the Cowtan
19 and Way paper that looks at these
20 coverage issues for surface
21 temperature.
22 If that alone were the
23 explanation for the stasis, then MSU,
24 which pretty much has global
25 coverage, would not show this kind of
210
1 APS CLIMATE CHANGE STATEMENT REVIEW WORKSHOP
2 behavior, but it does.
3 So, science questions here. In
4 the observations, what factor or
5 factors have contributed to the
6 stasis in tropospheric and surface
7 warming and why are the tropospheric
8 temperature trends in CMIP5 models,
9 on average, larger than those
10 observed over the stasis period?
11 You can see if we go back to
12 this figure that -- well, you
13 actually can't see this pink envelope
14 very well. You can see that a couple
15 of models actually simulate behavior
16 that looks reminiscent of the stasis,
17 but very few. Most of them are
18 systemically above.
19 DR. KOONIN: Well, actually, do
20 we know that? Because it may be one
21 model is at the bottom of the
22 distribution for some years and then
23 goes to the high end of the
24 distribution for other years and so
25 on.
211
1 APS CLIMATE CHANGE STATEMENT REVIEW WORKSHOP
2 DR. SANTER: It is a couple of
3 different models. It isn't multiple
4 realizations of the same model. And
5 I can tell you which models are at
6 the bottom of the distribution later.
7 So, as Bill mentioned, a number
8 of different explanations have been
9 posited. One is model sensitivity
10 errors, and John had mentioned this
11 in his Congressional testimony.
12 Another is forcing errors.
13 Even the perfect model, the
14 hypothetical perfect model with
15 perfect representation of all the
16 physical processes that drive the
17 real-world climate system, if you
18 give it the incorrect external
19 forcings, it will get the wrong
20 spatiotemporal resolution.
21 There are concerns about the
22 stratospheric ozone depletion. We
23 think that, on average, the models
24 that specified stratospheric ozone
25 changes over the observational period
212
1 APS CLIMATE CHANGE STATEMENT REVIEW WORKSHOP
2 probably underestimated the changes,
3 even in the tropics down to about 150
4 to 200 hectopascals.
5 There are concerns about
6 volcanic aerosols that we will get
7 onto in a minute, and their
8 representation after Pinatubo in
9 1991. There are concerns that Bill
10 mentioned about anthropogenic sulfate
11 aerosols and possible underestimate
12 of Chinese sulfate aerosol pollution.
13 And there are concerns about
14 solar forcing in that most of these
15 models do not have the unusually
16 broad solar minimum over the last
17 solar cycle.
18 Also, there are concerns about
19 residual errors in observational
20 temperature data both in the
21 tropospheric temperature data and in
22 the surface temperature data.
23 And then there is this issue of
24 an unusual manifestation of natural
25 variability in the observations
213
1 APS CLIMATE CHANGE STATEMENT REVIEW WORKSHOP
2 associated with ENSO, the PDO or some
3 combination thereof.
4 So, let's look at this first.
5 Do ENSO effects explain the stasis?
6 So, what we did is we used some
7 iterative regression-based method to
8 remove ENSO effects.
9 Turns out you have got to be a
10 little careful because there's
11 co-linearity between ENSO and
12 Volcanos. And that matters over this
13 period of record.
14 So, if you just plug everything
15 into some multiple regression
16 framework, you get the wrong answer.
17 So, using this method, we remove ENSO
18 effects and the hiatus is still
19 there.
20 So, at least when you
21 statistically remove ENSO effects,
22 you cannot fully explain this
23 discrepancy between models and
24 observations or the failure of the
25 observations to warm much over the
214
1 APS CLIMATE CHANGE STATEMENT REVIEW WORKSHOP
2 last 15 years.
3 All right, next question.
4 DR. KOONIN: When you remove
5 ENSO effects, do you do that model by
6 model to the extent that --
7 DR. SANTER: Yes, sir.
8 DR. KOONIN: -- that the models
9 show ENSO?
10 DR. SANTER: We do it model by
11 model for every model, and we do it
12 in a whole bunch of different ways.
13 It turns out that one of the unknowns
14 is this what we call tau, the
15 recovery time scale, which is related
16 to the transient climate response and
17 the equilibrium sensitivity.
18 We do that removal both with
19 each model's individual estimated
20 value of tau based on their estimated
21 equilibrium sensitivity from the
22 four-time CO2 runs.
23 And we also do it with
24 stipulated values of tau that span
25 an ECS range of one degree to about
215
1 APS CLIMATE CHANGE STATEMENT REVIEW WORKSHOP
2 five and a half degrees. It doesn't
3 make much difference. That
4 uncertainty in tau does not make much
5 difference to these results that I am
6 going to show you here.
7 So, the next question is, do
8 CMIP5 models capture the observed
9 changes in warming rate after
10 El Chichón and Pinatubo, El Chichón,
11 again, in 1982, Pinatubo in 1991?
12 What we are looking at here is
13 maximally-overlapping ten-year
14 trends. So, it's another noise
15 filter. We have reduced some of the
16 noise by removing ENSO effects. Now
17 we are going to look at overlapping
18 ten-year trends.
19 And a gentleman at a meeting at
20 the Royal Society in London presented
21 something like this for surface
22 temperature and was saying well, we
23 really need to get away from looking
24 just at one specific period. We have
25 got to look at many, many different
216
1 APS CLIMATE CHANGE STATEMENT REVIEW WORKSHOP
2 overlapping trends.
3 And he obtained very similar
4 twin peaks there without any
5 understanding why they were there.
6 Well, we do know why they were
7 there.
8 So, the models do capture, on
9 average, at least, all of the
10 slowdown in warming after both
11 El Chichón and Pinatubo and the
12 gradual recovery thereafter.
13 You can actually see that the
14 conditional probability of getting a
15 ten-year warming trend around this
16 time and this time is obviously
17 critically dependent on this, on
18 where you start the ten-year trend
19 relative to the peak volcanic
20 cooling.
21 So, if you are starting at the
22 peak volcanic cooling associated with
23 Chichón or Pinatubo, you have
24 background anthropogenic forcing
25 acting in concert with this recovery
217
1 APS CLIMATE CHANGE STATEMENT REVIEW WORKSHOP
2 phase.
3 DR. KOONIN: And again, in
4 these comparisons or these analyses
5 of models, no scaling factors for
6 aerosols, nobody reduces the aerosols
7 by 20 to 30 percent model by model to
8 match something?
9 DR. SANTER: No.
10 DR. COLLINS: Not that I know.
11 DR. SANTER: No. And I think
12 that for the sulfate aerosols --
13 correct me if I am wrong here, Bill
14 and Isaac -- what was done is that
15 most groups used the same history of
16 sulfate aerosol emissions.
17 That is put through some
18 atmospheric chemistry transport model
19 in order to calculate spatiotemporal
20 changes in atmospheric burdens of
21 sulfur dioxide.
22 DR. KOONIN: Then I am really
23 confused about something in the IPCC.
24 I will show you later.
25 DR. SANTER: Maybe we can get
218
1 APS CLIMATE CHANGE STATEMENT REVIEW WORKSHOP
2 onto that a little bit later and I
3 can finish this.
4 DR. CURRY: The AR4 was, I
5 think, a lot squishier about what
6 they used for aerosols, although this
7 was tightened up in AR5.
8 DR. KOONIN: Okay, good.
9 DR. SANTER: So, in the final
10 third of the satellite record, this
11 good agreement that we saw over the
12 first two-thirds breaks down. Why?
13 What is going on there?
14 How can you, on the one hand,
15 successfully capture the amplitude
16 and phase of the temperature response
17 to El Chichón and Pinatubo with the
18 first two-thirds of the record, but
19 get this divergence over the final
20 third?
21 And if this divergence is
22 really due to some fundamental errors
23 in model physics and ocean heat
24 uptake and, therefore, in sensitivity
25 as, say, John Christy, has posited,
219
1 APS CLIMATE CHANGE STATEMENT REVIEW WORKSHOP
2 then why don't you see that in the
3 response to El Chichón and Pinatubo?
4 It seems like a real conundrum.
5 So, let me try and convince
6 you, Judy. You said you weren't
7 really very convinced by
8 post-Pinatubo or recent volcanic
9 aerosol forcing.
10 This is a record of
11 stratospheric aerosol optical depth;
12 beautiful measurements. So, these
13 things look at the occultation of
14 sunlight and moonlight at different
15 wavelengths.
16 This is roughly from about 15
17 to 35, in the case of Sato,
18 kilometers, 15 to 40 kilometers in
19 the case of Vernier, et al., a whole
20 bunch of different satellite
21 instruments that are spliced together
22 in different ways.
23 And you can see that each of
24 these vertical lines is an eruption.
25 The solid lines are tropical
220
1 APS CLIMATE CHANGE STATEMENT REVIEW WORKSHOP
2 eruptions within 20 north to 20
3 south. The dashed lines are
4 extratropical eruptions.
5 And this was the assumption in
6 CMIP5 that, after Pinatubo,
7 stratospheric aerosol optical depth
8 decayed to zero or to background
9 values by the end of the 20th
10 century.
11 Now, that's not what happened
12 in the real world. In the real
13 world, there were, as Tim Barnett
14 likes to call it, a swarm of over 17
15 eruptions with a volcanic explosivity
16 index of three to four after
17 Pinatubo. So, this is an instance of
18 a systematic error in volcanic
19 aerosol forcing.
20 All right, this is now looking
21 in the tropics specifically at
22 stratospheric aerosol depth. Again,
23 vertical lines are eruptions. You
24 can see the signatures of these early
25 21st-century eruptions across the
221
1 APS CLIMATE CHANGE STATEMENT REVIEW WORKSHOP
2 electromagnetic spectrum.
3 So again, we see them in the
4 visible in stratospheric aerosol
5 optical depth. Look at the two
6 largest here, at Tavurvur in
7 Indonesia in 2006, and Nabro in
8 Africa in 2011.
9 You can see that the increase
10 in stratospheric aerosol optical
11 depth leads to this increase in net
12 reflected shortwave at the top of the
13 atmosphere. That backscattering is
14 the primary signature we are picking
15 up here.
16 You can see it, too, in the MSU
17 data in the tropics after you
18 statistically remove ENSO effects.
19 Again, after each of these eruptions
20 there is cooling of the lower
21 troposphere in the tropics within,
22 say, three to six months. So, that's
23 in the microwave.
24 Now, you can also ask the
25 question well, okay, how about if I
222
1 APS CLIMATE CHANGE STATEMENT REVIEW WORKSHOP
2 look at the correlation between
3 stratospheric aerosol optical depth
4 and lower tropospheric temperature,
5 we lag things because there is some
6 lag between forcing and response?
7 How about if we look at the
8 instantaneous correlation between
9 stratospheric aerosols and reflected
10 shortwave at the top of the
11 atmosphere? That is pretty much
12 instantaneous.
13 And because volcanic activity
14 non-stationary, we look at these
15 things in 60-month sliding windows.
16 And what you see is that, during the
17 Pinatubo period, you have this very
18 strong, highly significant negative
19 relationship where aerosol optical
20 depth leads to cooling.
21 But even in the most recent
22 period here where you have these big
23 three, Manam, Tavurvur and Nabro, we
24 have highly significant cooling of
25 the lower troposphere associated with
223
1 APS CLIMATE CHANGE STATEMENT REVIEW WORKSHOP
2 increases in aerosol optical depth.
3 And we also get significant
4 results. This is the series
5 shortwave record there which only
6 goes back to March 2000. So, you
7 can't push it back as far in time.
8 But there, too, we see
9 statistically significant
10 relationships between the recent
11 aerosol optical depth changes and the
12 shortwave changes. So, there clearly
13 is some signal there.
14 Okay, conclusions. [next page]
15 From the fingerprinting, we find that some
16 human-caused latitude/altitude
17 pattern of atmospheric change is
18 consistently identifiable in the
19 satellite observations.
20 And we can discriminate this
21 not only from the background noise of
22 internal variability in the models,
23 but also from the larger total
24 variability caused by changes in
25 volcanic forcing and solar radiance.
224
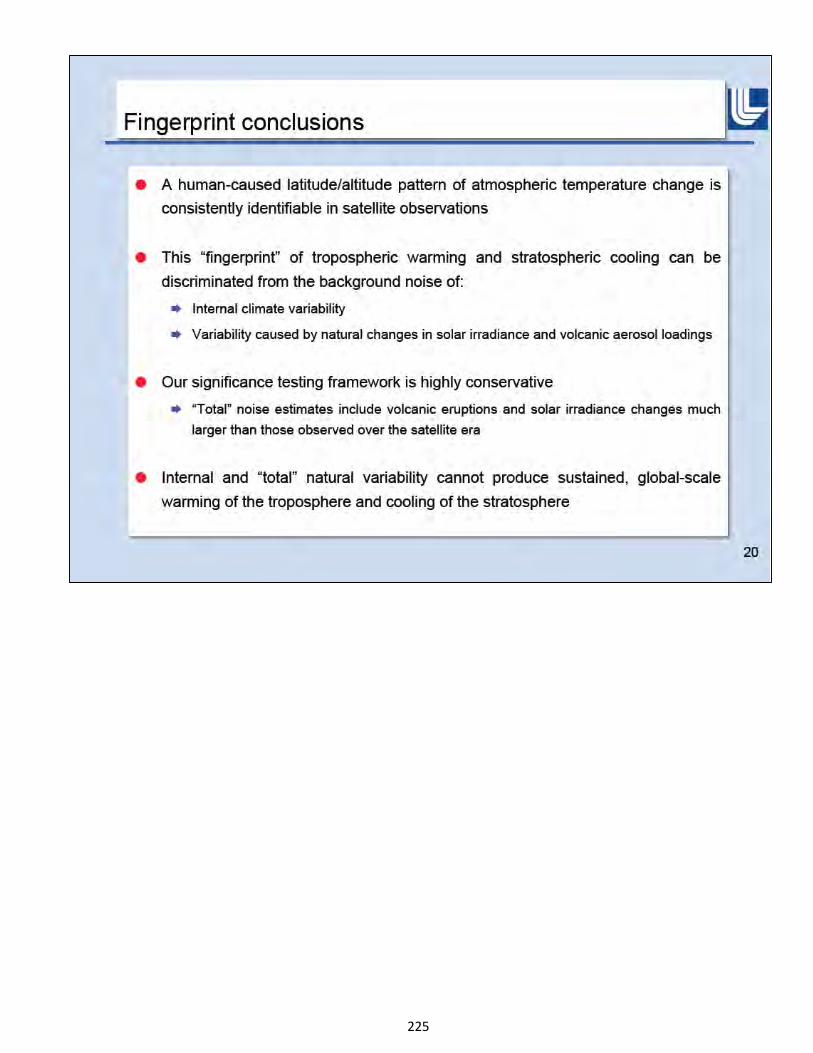
225
1 APS CLIMATE CHANGE STATEMENT REVIEW WORKSHOP
2 And this significance testing
3 strategy is highly conservative
4 because we are looking at much larger
5 changes in solar radiance, say around
6 the time of the Maunder Minimum, much
7 larger volcanic eruptions than we
8 have actually observed.
9 So, I think the bottom line
10 here is that internal and total
11 natural variability in the CMIP5
12 suite of models just can't produce
13 patterns of change like we have
14 actually seen in the observations.
15 And I think that is what we are
16 seeing, the direct radiative
17 signature in the stratosphere of
18 ozone depletion, to a lesser extent
19 over the last 35 years of CO2
20 increases and of the troposphere of
21 greenhouse gas increases.
22 Stasis. Anthropogenic changes
23 in greenhouse gases have this slowly
24 evolving tropospheric warming signal
25 which is superimposed on background
226
1 APS CLIMATE CHANGE STATEMENT REVIEW WORKSHOP
2 volcanic cooling.
3 And it's this juxtaposition of
4 the anthropogenic and volcanic
5 signals that leads to decadal changes
6 in warming rates after El Chichón and
7 Pinatubo.
8 I note that Richard Muller in
9 an op-ed in The New York Times a few
10 months ago claimed that volcanos have
11 no impact on decadal warming rates.
12 I think this analysis clearly shows
13 that he is wrong.
14 After removing ENSO signals,
15 many aspect of the observed
16 temperature response to El Chichón
17 and Pinatubo were well captured by of
18 CMIP5 multimodel average.
19 And again, for me at least,
20 this is difficult to reconcile with a
21 claim that we fundamentally screw up,
22 on average, in estimates of transient
23 climate response to external forcing.
24 However, there are still
25 important questions. As I showed,
227
1 APS CLIMATE CHANGE STATEMENT REVIEW WORKSHOP
2 there are still differences over the
3 last 15 years during what you call
4 the stasis period. Models don't show
5 this. And the hiatus is still
6 present in observations even after
7 removal of ENSO effects.
8 Clearly, the missing volcanic
9 forcing contributes to that
10 discrepancy between modeled and
11 observed behavior. The question is
12 how much? Susan Solomon and
13 colleagues have estimated about
14 25 percent. We get something similar
15 to that.
16 There is a lot of uncertainty.
17 And much of that uncertainty relates
18 to the representation of volcanic
19 aerosol effects in models. Eruptions
20 are different. If I have learned
21 anything over the last six months,
22 it's that.
23 You can't take Pinatubo as a
24 model for every other eruption in
25 terms of the particle size
228
1 APS CLIMATE CHANGE STATEMENT REVIEW WORKSHOP
2 distributions, the optical and
3 chemical properties. We know from
4 direct measurements these eruptions
5 are different.
6 And it's very encouraging to me
7 that, based on this work, modeling
8 groups at NCAR and actually around
9 the world are now trying to look more
10 closely at the decisions that have to
11 be made in translating observational
12 estimates of aerosol optical depth
13 into a volcanic radiative forcing.
14 I think that the bottom line is
15 this. The stasis is not due to one
16 factor alone. It's not internal
17 variability alone. It's not external
18 forcing alone. It's some combination
19 of multiple factors.
20 And the real scientific
21 challenge as I see it is to reliably
22 quantify the contributions of
23 different factors to the stasis and
24 to the differences that we see
25 between models and observations.
229
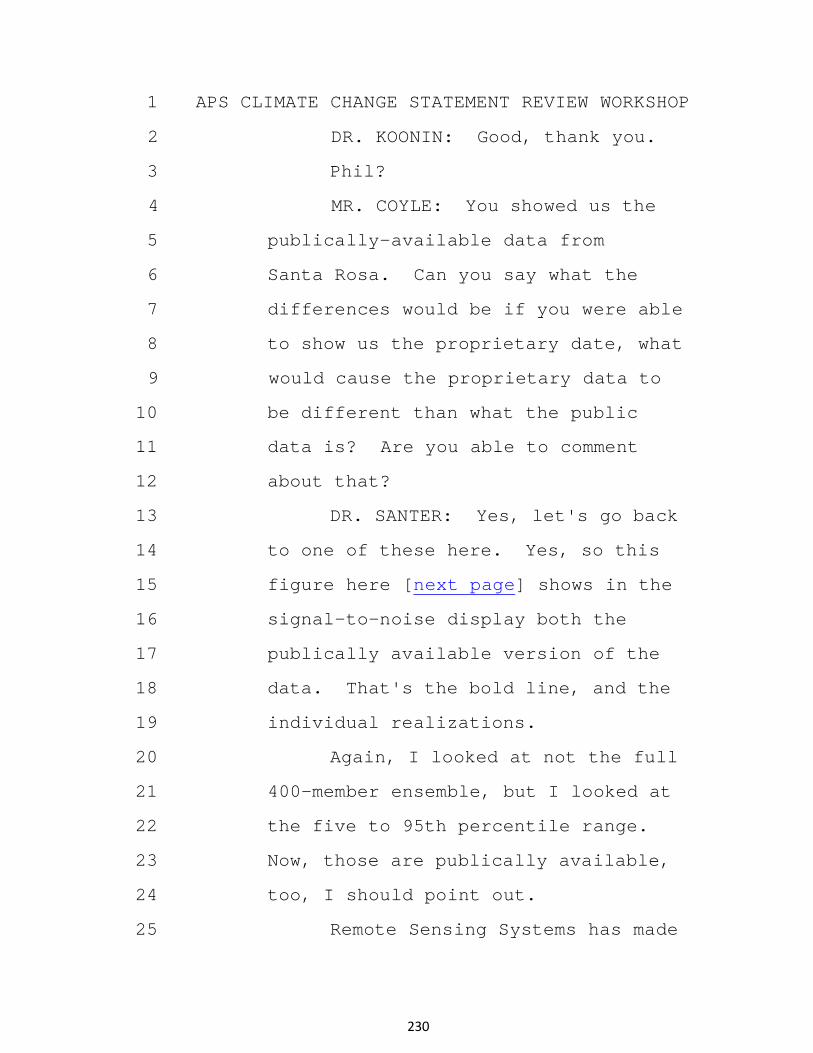
1 APS CLIMATE CHANGE STATEMENT REVIEW WORKSHOP
2 DR. KOONIN: Good, thank you.
3 Phil?
4 MR. COYLE: You showed us the
5 publically-available data from
6 Santa Rosa. Can you say what the
7 differences would be if you were able
8 to show us the proprietary date, what
9 would cause the proprietary data to
10 be different than what the public
11 data is? Are you able to comment
12 about that?
13 DR. SANTER: Yes, let's go back
14 to one of these here. Yes, so this
15 figure here [next page] shows in the
16 signal-to-noise display both the
17 publically available version of the
18 data. That's the bold line, and the
19 individual realizations.
20 Again, I looked at not the full
21 400-member ensemble, but I looked at
22 the five to 95th percentile range.
23 Now, those are publically available,
24 too, I should point out.
25 Remote Sensing Systems has made
230

231
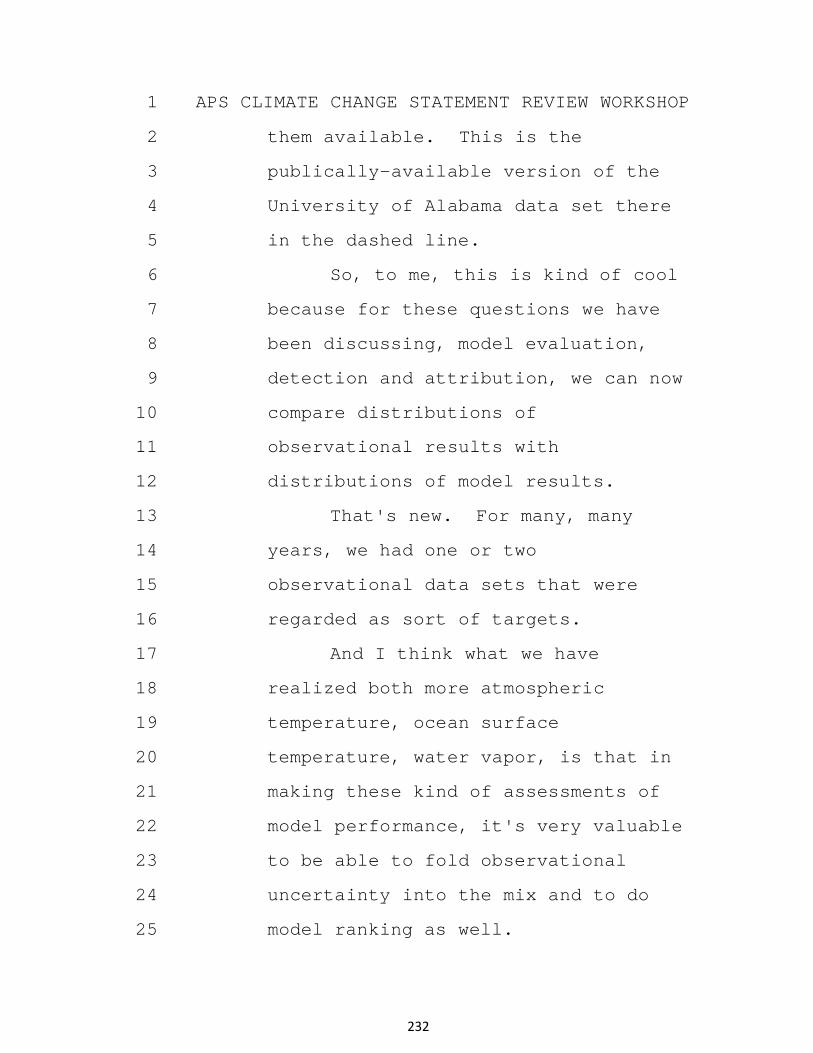
1 APS CLIMATE CHANGE STATEMENT REVIEW WORKSHOP
2 them available. This is the
3 publically-available version of the
4 University of Alabama data set there
5 in the dashed line.
6 So, to me, this is kind of cool
7 because for these questions we have
8 been discussing, model evaluation,
9 detection and attribution, we can now
10 compare distributions of
11 observational results with
12 distributions of model results.
13 That's new. For many, many
14 years, we had one or two
15 observational data sets that were
16 regarded as sort of targets.
17 And I think what we have
18 realized both more atmospheric
19 temperature, ocean surface
20 temperature, water vapor, is that in
21 making these kind of assessments of
22 model performance, it's very valuable
23 to be able to fold observational
24 uncertainty into the mix and to do
25 model ranking as well.
232
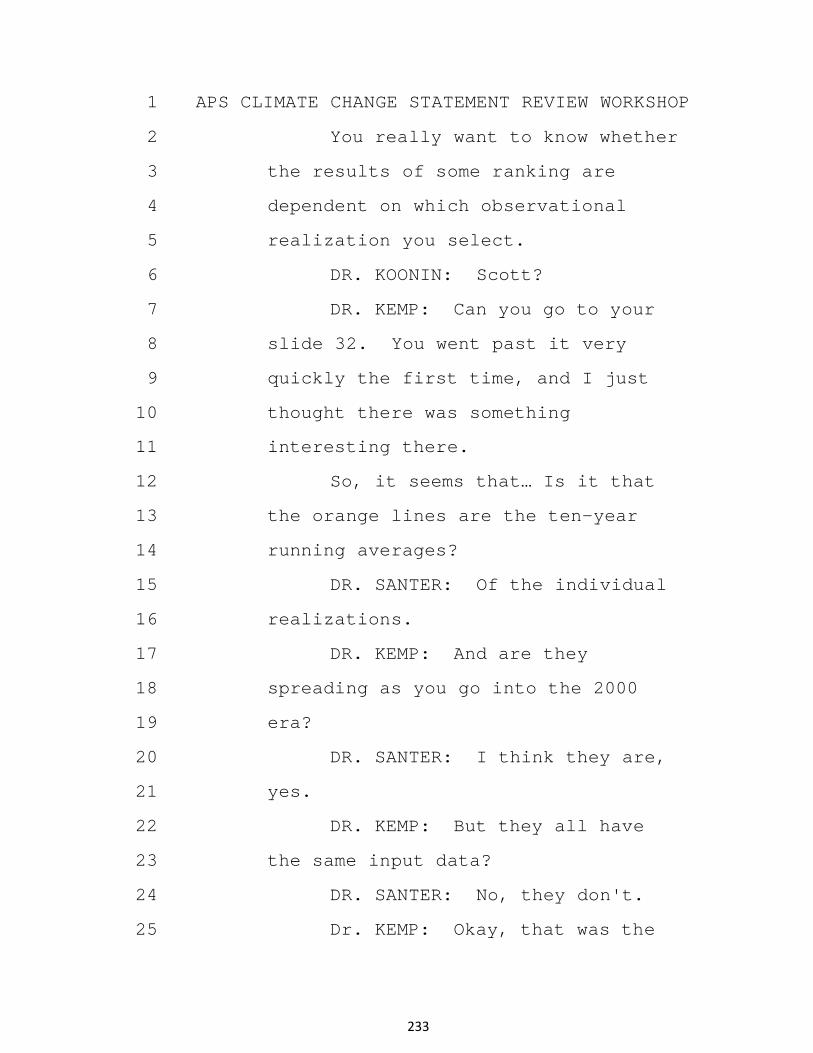
1 APS CLIMATE CHANGE STATEMENT REVIEW WORKSHOP
2 You really want to know whether
3 the results of some ranking are
4 dependent on which observational
5 realization you select.
6 DR. KOONIN: Scott?
7 DR. KEMP: Can you go to your
8 slide 32. You went past it very
9 quickly the first time, and I just
10 thought there was something
11 interesting there.
12 So, it seems that… Is it that
13 the orange lines are the ten-year
14 running averages?
15 DR. SANTER: Of the individual
16 realizations.
17 DR. KEMP: And are they
18 spreading as you go into the 2000
19 era?
20 DR. SANTER: I think they are,
21 yes.
22 DR. KEMP: But they all have
23 the same input data?
24 DR. SANTER: No, they don't.
25 Dr. KEMP: Okay, that was the
233
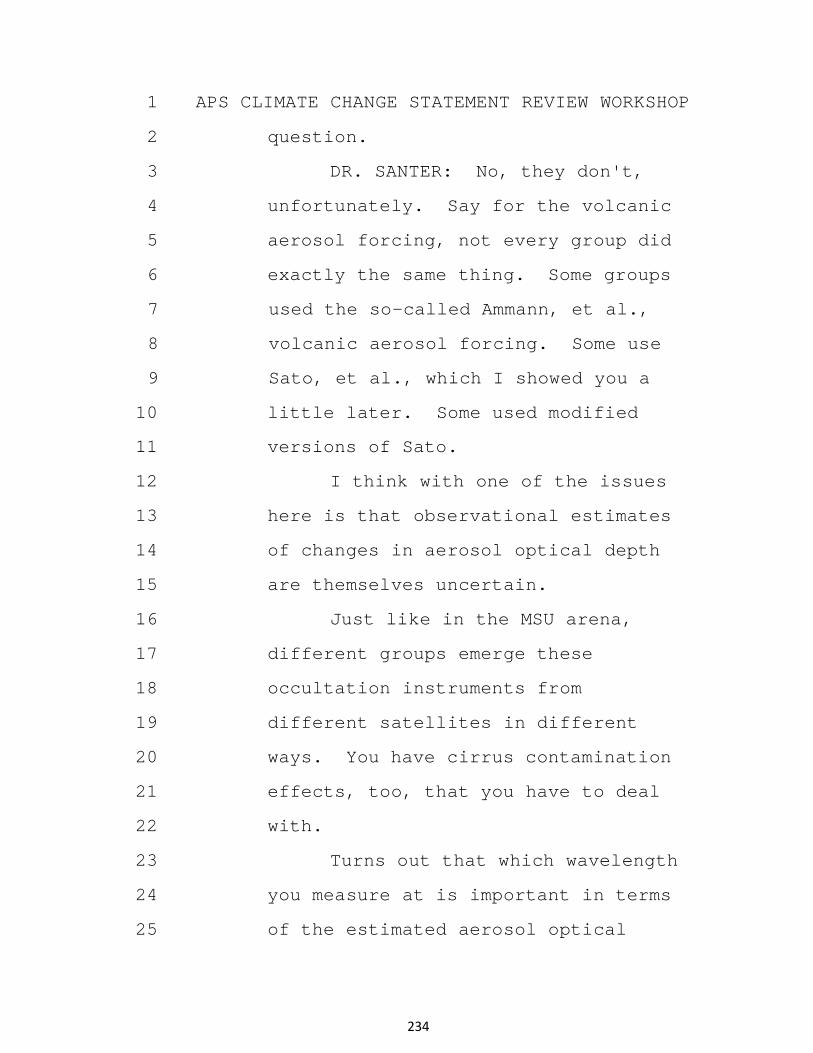
1 APS CLIMATE CHANGE STATEMENT REVIEW WORKSHOP
2 question.
3 DR. SANTER: No, they don't,
4 unfortunately. Say for the volcanic
5 aerosol forcing, not every group did
6 exactly the same thing. Some groups
7 used the so-called Ammann, et al.,
8 volcanic aerosol forcing. Some use
9 Sato, et al., which I showed you a
10 little later. Some used modified
11 versions of Sato.
12 I think with one of the issues
13 here is that observational estimates
14 of changes in aerosol optical depth
15 are themselves uncertain.
16 Just like in the MSU arena,
17 different groups emerge these
18 occultation instruments from
19 different satellites in different
20 ways. You have cirrus contamination
21 effects, too, that you have to deal
22 with.
23 Turns out that which wavelength
24 you measure at is important in terms
25 of the estimated aerosol optical
234
1 APS CLIMATE CHANGE STATEMENT REVIEW WORKSHOP
2 death and which attitude range you
3 look at. So, different groups do
4 this in different ways and they get
5 different results. And I think that
6 is some of this spread that we see
7 here.
8 Also, there are other things
9 that are not identical. For
10 stratospheric ozone, a number of
11 these models actually have integrated
12 stratospheric ozone chemistry models.
13 So, they compute historical
14 changes in stratospheric ozone rather
15 than actually specifying them.
16 That's another reason for some of the
17 differences that we see here. And I
18 am sure that Bill and Isaac can
19 expound on those issues.
20 DR. KEMP: Is this kind of
21 saying that, as models get better and
22 data gets more detailed, it’s actually
23 pushing the models apart, but that
24 with time, maybe all the models will
25 eventually adopt all of the
235
1 APS CLIMATE CHANGE STATEMENT REVIEW WORKSHOP
2 enhancements and maybe they will come
3 back together?
4 DR. SANTER: Well, I think the
5 issue is this is an ensemble of
6 opportunity. And unfortunately, the
7 forcings, so the estimates of changes
8 in natural and anthropogenic
9 constituents in the atmosphere, are
10 not identical.
11 They are for CO2 to first
12 order. They are not for ozone. They
13 are certainly not for volcanic
14 aerosols.
15 They are probably pretty close
16 for solar, although some models just
17 look at TSI. Others actually
18 spectrally resolve the changes in
19 solar radiance over the solar cycle.
20 So, this is a sort of
21 fundamental dilemma in what we do,
22 that we are convolving intermodel
23 differences in forcing with
24 intermodel differences in response.
25 And that makes it a little bit
236
1 APS CLIMATE CHANGE STATEMENT REVIEW WORKSHOP
2 more difficult to figure out, well,
3 are these particularly a
4 manifestation of forcing error or
5 response error?
6 Again, as I showed you for the
7 volcanic aerosols, it is pretty clear
8 that, in all models, there is this
9 systematic error in forcing here.
10 Essentially, we flat-lined and
11 that's not what the real world did.
12 In the real world, background
13 stratospheric aerosol increased by
14 about four to seven percent per year
15 from 2000 through to 2009.
16 DR. ROSNER: From small
17 eruptions?
18 DR. SANTER: From this
19 concatenation, this series of small
20 eruptions that you see in blown-up
21 form here.
22 DR. ROSNER: Could you go back
23 to the slide that Scott just asked
24 about, the previous one. Yes, that
25 one, okay. So, presumably there is a
237
1 APS CLIMATE CHANGE STATEMENT REVIEW WORKSHOP
2 subset of the models that really
3 treated the aerosols exactly the
4 same; is that true?
5 DR. SANTER: Sorry, which
6 aerosols are we talking about here?
7 DR. ROSNER: The contributions
8 from the volcanic eruptions.
9 DR. SANTER: There is a subset
10 of models that used the same estimate
11 of historical changes in aerosol
12 optical depth. They then made
13 probably very, very different --
14 DR. ROSNER: No, no, that's
15 good enough. So, if you had plotted
16 the results from just that set --
17 DR. SANTER: Sure.
18 DR. ROSNER: -- you would have
19 then revealed what the differences
20 are in the models? What is the
21 answer to that question?
22 DR. SANTER: That's a great
23 point. And actually what we have
24 done is we have retrospectively
25 calculated the radiative forcing in
238
1 APS CLIMATE CHANGE STATEMENT REVIEW WORKSHOP
2 each of these models associated with
3 volcanos.
4 And it turns out that for the
5 two volcanic forcings I mentioned,
6 Ammann developed at NCAR and Sato
7 developed at GISS, there are
8 differences, quite substantial
9 differences in the peak radiative
10 forcing around the time of El Chichón
11 and Pinatubo.
12 So, if one does that
13 stratifying, you should be able to
14 pick up those kind of things. And we
15 think that some of these differences
16 here are associated with those
17 fundamental differences in the
18 forcing.
19 We are not showing them in this
20 analysis here, but they are very
21 relevant to this issue of trying to
22 estimate transient climate response
23 from the response to volcanos.
24 And in order to do that
25 reliably, you really need to know
239
1 APS CLIMATE CHANGE STATEMENT REVIEW WORKSHOP
2 about the differences in the volcanic
3 aerosol forcing.
4 DR. KOONIN: Good. So, I want
5 to open it up to our experts and then
6 after that, I have a question that is
7 related but it will take us off in a
8 slightly different pursuit.
9 Sue?
10 DR. SEESTROM: I have a
11 question about this same picture.
12 So, it's clear that the spread in the
13 models get bigger, but the red and
14 the blue curves are two observations?
15 DR. SANTER: Yes.
16 DR. SEESTROM: Why is the
17 difference so much greater in the
18 period 1997 on than anywhere else in
19 the historical record between the two
20 sets of observations?
21 DR. SANTER: I don't know the
22 answer to that question. These two
23 groups, John Christy
24 presumably will --
25 DR. CHRISTY: It's a difference
240
1 APS CLIMATE CHANGE STATEMENT REVIEW WORKSHOP
2 in the way we make a correction for
3 the diurnal drift of the satellite.
4 DR. SANTER: Basically our
5 knowledge of the diurnal cycle is
6 incomplete. As a function, the
7 diurnal cycle and temperature is a
8 function of latitude, altitude,
9 season.
10 And in order to adjust for the
11 effects of satellite orbital drift on
12 the sampling of the diurnal cycle,
13 you have to have some model of what
14 you think the diurnal cycle actually
15 is.
16 And differences in how groups
17 treat that diurnal cycle are
18 responsible for some of these
19 differences.
20 DR. SEESTROM: Did they
21 correct for that change?
22 DR. CHRISTY: We did not use a
23 model, by the way. We did not use a
24 model. We used empirical evidence
25 for calculation of the diurnal
241
1 APS CLIMATE CHANGE STATEMENT REVIEW WORKSHOP
2 effect. Because it turns out some
3 satellites don't drift, and so you
4 can use those as references to show
5 the difference.
6 DR. SANTER: Remote Sensing
7 Systems doesn't use models
8 exclusively. They also use GPS.
9 They do other things, too.
10 DR. CHRISTY: Right, but the
11 climate model is the basis for the --
12 DR. SANTER: No, it doesn't,
13 actually. They use multiple. In
14 their Monte Carlo-based technique --
15 DR. CHRISTY: No, I am talking
16 about the original diurnal, the
17 fundamental diurnal correction that
18 is applied.
19 DR. SANTER: In their ensemble
20 of observations, one of the reasons
21 they get that spread is because they
22 have different estimates of what the
23 diurnal cycle is.
24 DR. CHRISTY: Right. What you
25 described as the publically-available
242
1 APS CLIMATE CHANGE STATEMENT REVIEW WORKSHOP
2 data set is the one that has a
3 different diurnal correction. We use
4 exclusively empirical. That's a nit.
5 DR. KOONIN: Right, right.
6 DR. SANTER: Anyway, the key
7 thing here is that as in the surface
8 temperature, as Judy showed, there
9 are residual uncertainties in the
10 observations. Different groups get
11 different results.
12 To me, it seems important to
13 incorporate that kind of information
14 when comparing with model results.
15 DR. KOONIN: Fair enough.
16 Bill?
17 DR. COLLINS: So, just a couple
18 things to note with regards to some
19 of the discussion about the
20 volcanics.
21 Also, the volcanic aerosols
22 have effects both in the shortwave
23 part of the spectrum and they also
24 have effects in the infrared. So,
25 they affect the thermal emission to
243
1 APS CLIMATE CHANGE STATEMENT REVIEW WORKSHOP
2 space.
3 There is actually quite
4 appreciable differences in whether or
5 not the models even include those
6 infrared effects and if so, how they
7 do it. So, that's another difference
8 here.
9 Even if they specify exactly
10 the same optical depth, how they
11 treat it, that is more likely to make
12 sure that they are all the same in
13 the shortwave. But there could still
14 be diversity in the longwave.
15 And the other thing to keep in
16 mind just to place this uncertainty
17 in the volcanic aerosols in context
18 is that we would be delighted if we
19 understood tropospheric aerosol
20 optical depth to a level of accuracy
21 of .01.
22 This actually is a testament to
23 their ability to remotely sense the
24 stratosphere certainly down to that
25 level.
244
1 APS CLIMATE CHANGE STATEMENT REVIEW WORKSHOP
2 One final point just to
3 translate that into watts per meter
4 squared, that is on the order of
5 about two to three tenths of a watt
6 per meter squared. So, it's about
7 one tenth of the anthropogenic
8 forcing. It's a small number, but
9 nonetheless those small numbers do
10 make a difference.
11 DR. KOONIN: John and then
12 Scott.
13 DR. CHRISTY: I just noticed
14 that these volcanic incidents in the
15 past ten years or so on the order of
16 .01 optical depth or less, that is
17 much, much less, much, much less than
18 Pinatubo and El Chichón.
19 And I think those little
20 excursions on the MSU data there, I
21 don't think you can identify those as
22 volcanic. They are on the bottom,
23 because, look, There are others.
24 DR. SANTER: I disagree
25 completely. I mean, the message from
245
1 APS CLIMATE CHANGE STATEMENT REVIEW WORKSHOP
2 this is you can. What matters here,
3 since we are looking at 60-month
4 sliding windows, is whether you could
5 by chance simultaneously get five
6 coolings after five of these early
7 21st-century eruptions. You can't.
8 We have looked at this very,
9 very carefully. And the same with
10 the shortwave up here, it's clear
11 that, after these volcanic eruptions,
12 you can see this, particularly if you
13 look at this geographically. You can
14 see the pancakes of these things in
15 the reflected shortwave.
16 DR. CHRISTY: What caused the
17 2002 and 2004 cooling?
18 DR. SANTER: Excuse me?
19 DR. CHRISTY: What caused the
20 2002 to 2004 cooling?
21 DR. SANTER: Well, remember, we
22 are looking at a given altitude
23 range. Not all of these things make
24 it up into the stratosphere. We are
25 looking --
246
1 APS CLIMATE CHANGE STATEMENT REVIEW WORKSHOP
2 DR. CHRISTY: No, no, I am
3 talking about the temperature.
4 DR. SANTER: Excuse me. Let me
5 finish, please.
6 DR. CHRISTY: Bottom line.
7 DR. SANTER: Yes, I know. Not
8 all of these volcanic eruptions like
9 this one here, Anatahan, actually
10 make it up into the stratosphere.
11 Some of them have a significant
12 component to the troposphere. There
13 are forest fires that have signatures
14 in stratospheric aerosol optical
15 depth.
16 The largest ones, again, these
17 measurements look at different wave
18 lengths, different altitude ranges.
19 It is not surprising to me that there
20 is some evidence of residual noise
21 here that is uncorrelated with the
22 stratospheric aerosol.
23 But what we actually do, again,
24 is look at the probability of getting
25 cooling after this guy, after this
247
1 APS CLIMATE CHANGE STATEMENT REVIEW WORKSHOP
2 guy, after Sarychev, after all of the
3 major eruptions in the 21st century.
4 And when you do that, then
5 residual noise is a very poor
6 explanation for the simultaneous
7 cooling that we see after multiple
8 events.
9 DR. KOONIN: So, it's the
10 correlation of all three of these
11 measurements, which are independent?
12 DR. SANTER: Yes, they are all
13 independent measurements. And again,
14 they clearly show some multivariate
15 signal of early 21st-century volcanic
16 activity.
17 DR. KOONIN: John, you want to
18 respond?
19 DR. CHRISTY: Look how rapid
20 that temperature bounces back. That
21 would not really be a volcanic
22 signature if it did that. Talking
23 about months.
24 DR. SANTER: These are small
25 eruptions. These are not sustained
248
1 APS CLIMATE CHANGE STATEMENT REVIEW WORKSHOP
2 for years, John. Look at the
3 stratospheric aerosol optical depth.
4 DR. CHRISTY: They are little
5 blips.
6 DR. SANTER: This isn't
7 Pinatubo. This isn't El Chichón
8 lasting for years. No wonder it's
9 responding quickly.
10 DR. KOONIN: I have got a
11 question that sort of leverages off
12 of the detection and attribution, a
13 little bit of the models and then
14 onto projection.
15 This is probably the right time
16 to raise it, since you are the
17 detection and attribution guy. I
18 have got about two or three slides I
19 would like to just show to set it up,
20 and maybe we will do that discussion
21 for five minutes.
22 DR. SANTER: Sure.
23 DR. KOONIN: Let me put up
24 those charts.
25 DR. KEMP: While you are doing
249
1 APS CLIMATE CHANGE STATEMENT REVIEW WORKSHOP
2 that, can I ask a quick question?
3 DR. KOONIN: Sure.
4 DR. KEMP: Ben, it seems that a
5 general approach of the attribution
6 studies is to look for spatial
7 fingerprints and say you cannot
8 recreate these spatial patterns
9 through natural forcing. What is the
10 statistical probability that this is
11 just a natural effect?
12 Is there any interest in
13 actually taking that a step further
14 and saying let's compute the
15 coefficients on the natural and
16 anthropogenic forcings with the
17 spatial patterns?
18 Are you not hearing me or not
19 following what I am saying?
20 DR. SANTER: I didn't hear the
21 last part of what you said.
22 DR. KEMP: Is there any
23 interest in moving beyond just asking
24 the statistical question about what
25 is the chance that this pattern is
250
1 APS CLIMATE CHANGE STATEMENT REVIEW WORKSHOP
2 anthropogenic or not anthropogenic
3 and moving to actually trying to
4 estimate the coefficients?
5 DR. SANTER: Yes. So, what I
6 do is quite difference from what
7 people like Myles Allen and others
8 do.
9 They cast all of this in some
10 regression framework and they
11 actually estimate what they call the
12 betas, the scaling factors on some
13 model-based spatiotemporal signal,
14 say, associated with greenhouse gases
15 only or sulfate aerosols only.
16 And then they try and estimate
17 that beta in the observations and see
18 whether the model, on average, gets
19 the right strength of that particular
20 response to forcing in the
21 observations, or whether that has to
22 be scaled down or scaled up.
23 So, they cast all of this in
24 terms of explicitly estimating the
25 strength of individual model signals
251
1 APS CLIMATE CHANGE STATEMENT REVIEW WORKSHOP
2 in observations.
3 I don't do that. One of the
4 issues associated with trying to do
5 that individual signal search and
6 quantification is degeneracy. If you
7 have things that look like each
8 other, then that's a bit of a
9 problem.
10 And to me, when you put things
11 together into one combined
12 spatiotemporal factor, you lose this
13 kind of pattern information.
14 It is not easy to decompose it
15 again after the fact into altitudinal
16 patterns or geographical patterns and
17 figure out why you do or do not get
18 correspondence between models and
19 observations.
20 That, I think, is one of the
21 advantages of what we do. But the
22 advantage of what they do is that
23 explicit quantification of individual
24 factors and observations.
25 DR. KOONIN: Good. So, let me
252
1 APS CLIMATE CHANGE STATEMENT REVIEW WORKSHOP
2 ask some questions about what is in
3 the IPCC report. I understand it may
4 be different than what you have just
5 talked about.
6 DR. SANTER: Can I sit down?
7 DR. KOONIN: Yes, might as
8 well. This is going to be a
9 discussion.
10 So, look,[next page] I find in IPCC
11 chapter 10 -- I understand, Bill,
12 this is not your chapter, but you
13 should know something about this. I
14 would assume everybody -- IPCC is a
15 consensus, so presumably everybody
16 agrees.
17 And it's about the scaling
18 factor discussion. And I have
19 highlighted in red the relevant piece
20 here.
21 (Reading): "Responses to
22 individual forcings can be scaled up
23 or down in order to be consistent
24 with observations."
25 And then I look at one of the
253
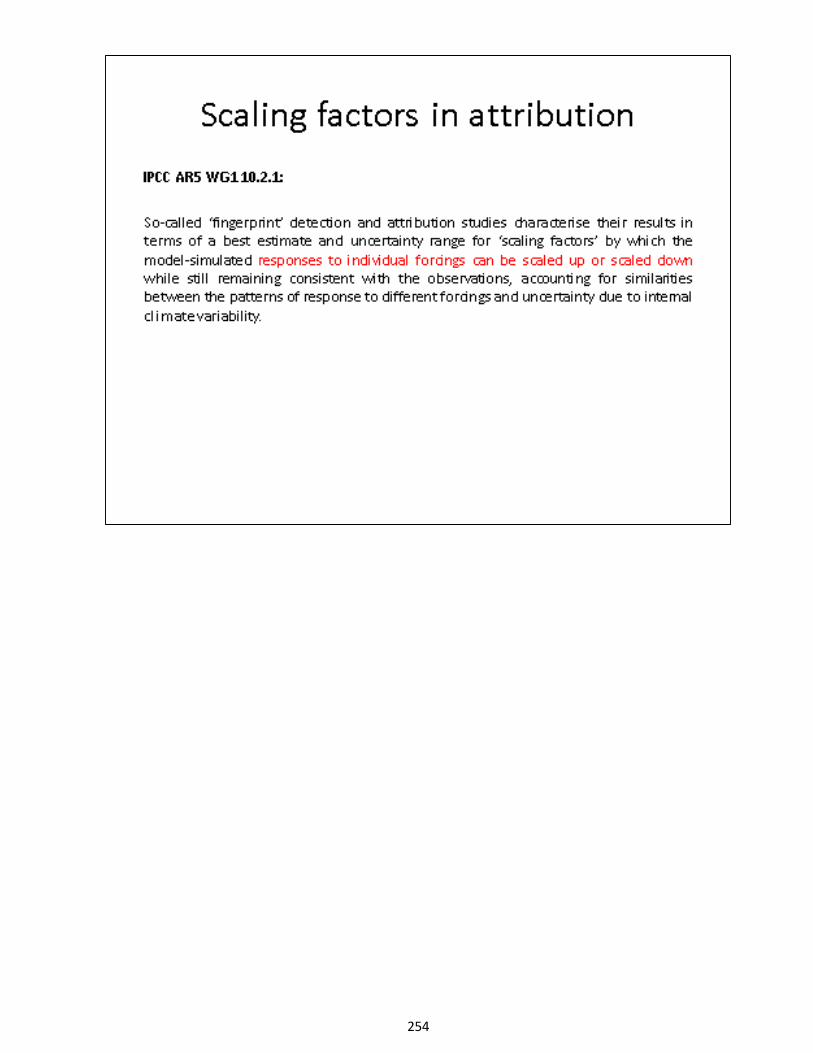
254
1 APS CLIMATE CHANGE STATEMENT REVIEW WORKSHOP
2 figures, 10.4, [next page] and I see
3 for a range of models shown there, this is
4 for GMST, the surface temperature, that
5 there are a set of scaling factors
6 for the greenhouse gases, which are
7 the green bars, the anthropogenic,
8 other anthropogenic, and natural.
9 And there are three numbers for
10 each the models. And the surprising
11 things are, (A), they are not one. I
12 understood, Ben, that the
13 corresponding things in the studies
14 you showed, they were all one. You
15 didn't scale things.
16 DR. SANTER: I don't do any
17 scaling at all.
18 DR. KOONIN: I understand. But
19 here, evidently IPCC needs to scale
20 in order to match the observations;
21 second, that many of the scaling factors
22 are not consistent with
23 one; they are smaller than one. The
24 tightest ones are smaller than one.
25 And there is a fair bit of
255
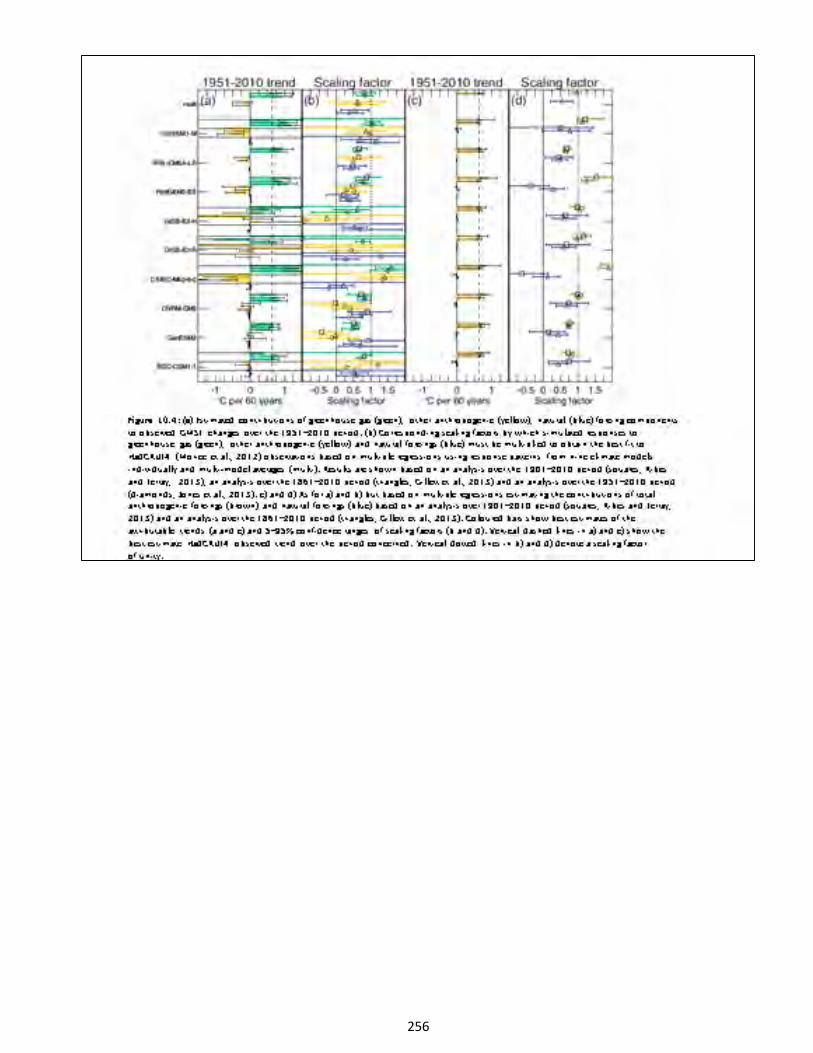
256
1 APS CLIMATE CHANGE STATEMENT REVIEW WORKSHOP
2 variability in them.
3 Go ahead, Ben.
4 DR. SANTER: Excuse me. I
5 think for the greenhouse gas
6 component, many of them are
7 consistent with one.
8 DR. KOONIN: Well, there are
9 some, for example (indicating slide).
10 There are a couple over there. There
11 is one up there, the greens that are
12 not consistent with one.
13 And the model mean is up there
14 and it's about 75 percent. Yes, it's
15 consistent with one, but the mean is
16 less. In some cases, there are negative
17 scaling factors.
18 And then I go into chapter 11.
19 [next page] And I asked, “did you account
20 for that scaling?” In other words, did you
21 calibrate the model? And then did
22 you use that when you went to the
23 decadal projections?
24 I find, in general, no. But
25 they have this method, right,
257
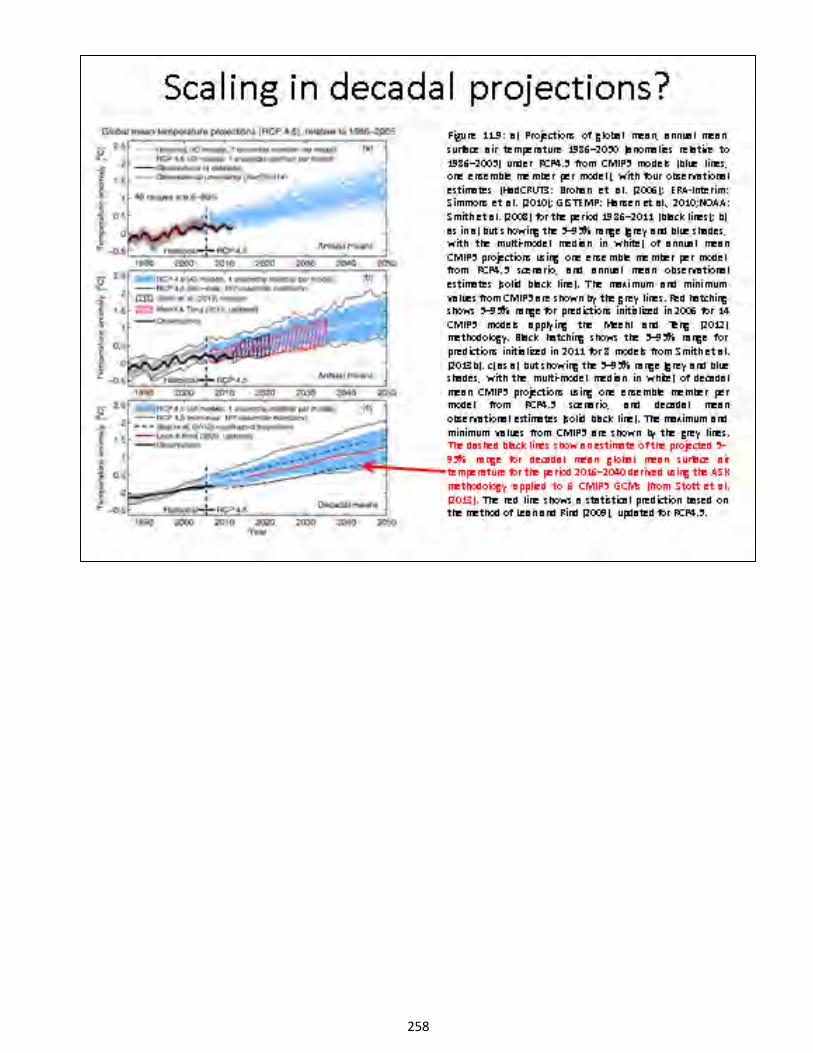
258
1 APS CLIMATE CHANGE STATEMENT REVIEW WORKSHOP
2 where they can do it for some subset
3 of the models. And as Bill remarked,
4 most of the warming is already
5 committed over the next decades, so
6 it doesn't matter much. And that's
7 the dashed lines up there.
8 But then I go to the centennial
9 projections in chapter 12 and it says
10 that,[next page] "The likely ranges do not
11 take into account these factors because
12 the influence of these factors on the
13 long-term projections cannot be
14 quantified."
15 So, to me, it looks like they
16 set a calibration against the
17 historical data and then they wiped
18 out that calibration in doing the
19 centennial projections resulting in
20 probably a 25, 30 percent
21 overprediction of the 2100 warmings.
22 So, is that right? Am I
23 reading IPCC right or have they done
24 what I would have thought is the
25 scientifically correct thing to do?
259
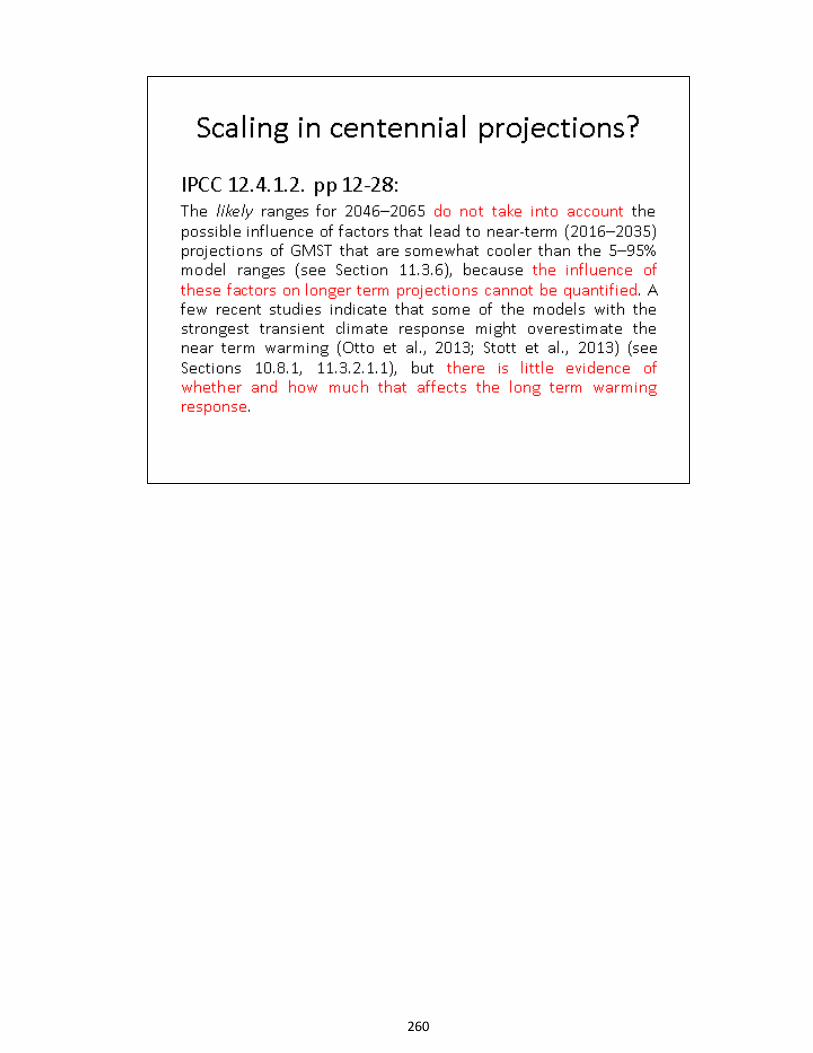
260
1 APS CLIMATE CHANGE STATEMENT REVIEW WORKSHOP
2 DR. COLLINS: So, the place
3 where you are getting the
4 overestimate is that you are
5 concluding that it has been
6 overestimated because, during what
7 looks like, I supposed could be
8 inferred as a calibration exercise in
9 chapter 10?
10 DR. KOONIN: Correct.
11 DR. COLLINS: The models had to
12 be scaled down in their greenhouse
13 gas component, which is the dominant
14 thing by 2100, leading you to
15 conclude that one should apply
16 similar scaling for the projections
17 into 2100.
18 DR. KOONIN: Probably 25,
19 30 percent, maybe more. I don't
20 know. So, have I understood what
21 they did right or not? Have I
22 correctly understood what they did
23 and if so, is that the right thing to
24 have done?
25 If you wanted to do it right,
261
1 APS CLIMATE CHANGE STATEMENT REVIEW WORKSHOP
2 you would need to do the ASK method
3 for the centennial simulations. And
4 they haven't done that because they
5 have only done it for a few of the
6 decadal simulations.
7 Judy?
8 DR. CURRY: It was a relatively
9 last-minute thing to do that. If you
10 look at the second order draft, they
11 hadn't done any of the --
12 DR. KOONIN: To do which?
13 DR. CURRY: The second order
14 draft of the Working Group 1 report,
15 you didn't see any sign of that
16 downscaling. So, it was something
17 that was done relatively last-minute
18 by, I guess, the Chapter 11 authors.
19 DR. KOONIN: This downscaling?
20 (Indicating slide.)
21 DR. CURRY: I'm not sure about
22 that one, but I am talking about --
23 go back -- this one, that red-hashed
24 box. That was a new addition.
25 DR. KOONIN: It was kind of
262
1 APS CLIMATE CHANGE STATEMENT REVIEW WORKSHOP
2 halfway step or even a third of the
3 way.
4 DR. CURRY: Yes, so it was done
5 by the chapter 11 authors. And I
6 think it was generally a sensible
7 thing to do. But chapter 12, it did
8 not trickle into chapter 12, that
9 kind of thinking.
10 DR. KOONIN: At least I
11 conclude now from what I understand
12 that the centennial scale projections
13 of temperatures are probably high?
14 DR. CURRY: I think so.
15 DR. KOONIN: By 30 percent, at
16 least for RCP8.5 which is dominated
17 by greenhouse gases?
18 DR. COLLINS: Well, I would be
19 unwilling to do sort of an error
20 assessment of this in public without
21 having looked at it a lot more
22 closely.
23 As Ben pointed out, one of the
24 issues with what chapter 10 did is
25 that you have signals that have
263
1 APS CLIMATE CHANGE STATEMENT REVIEW WORKSHOP
2 similar spatial patterns. They are
3 using, so, in some cases the
4 uncertainty in aerosols, for example,
5 is quite large. It is the dominant
6 source of uncertainty during this
7 time period.
8 The extent to which that has
9 been properly accounted for in the
10 error propagation, frankly, I don't
11 know how chapter 10 did this
12 exercise. I haven't looked at it
13 closely enough to be able to answer
14 your question. I think that is an
15 interesting question.
16 But some of the issue about
17 whether or not the relationship of
18 that scaling factor to one hinges on
19 their ability to deconvolve aerosol
20 forcing from greenhouse gas forcing,
21 as a for-instance.
22 DR. KOONIN: We know they are
23 coupled, right?
24 DR. COLLINS: They were
25 coupled, yes, because when you burn
264
1 APS CLIMATE CHANGE STATEMENT REVIEW WORKSHOP
2 fossil fuel, you are emitting sulfur
3 dioxide and you are emitting carbon
4 dioxide.
5 DR. KOONIN: I had it more in
6 the sense that they were coupled when
7 you tried to reproduce the historical
8 data.
9 DR. COLLINS: Yes. Well, they
10 are coupled in two ways, yes.
11 DR. KOONIN: The models
12 overpredict the Pinatubo response,
13 but they overpredict the CO2
15 response as well.
16 DR. SANTER: We don't find
17 overprediction, not significant
18 overprediction of Pinatubo, as I was
19 trying to show here.
20 DR. KOONIN: So, you are one of
21 the models that are in the wings, not in
22 the bulk? You are a high outlier?
23 DR. SANTER: I would say two
24 things, Steve. One thing is that, as
25 I tried to show and as discussed in
265
1 APS CLIMATE CHANGE STATEMENT REVIEW WORKSHOP
2 the IPCC hiatus box, it's clear that
3 there are some systematic errors in
4 the forcing over the last 15 years.
5 We underestimated the cooling
6 associated with post-Pinatubo
7 volcanic aerosols. We underestimated
8 the cooling associated with the
9 unusually broad solar minimum in the
10 last solar cycle.
11 We probably underestimated
12 systematically some of the cooling
13 associated with stratospheric ozone.
14 So, if you are estimating some
15 beta that from the observations, and
16 the models simulations do not
17 incorporate those negative influences
18 that the real world experienced --
19 DR. KOONIN: You are not going
20 to get it?
21 DR. SANTER: Yes, you are not
22 going to get the right beta. So, to
23 me, that's the scientific challenge,
24 to deconvolve the errors in beta that
25 arise from incorrect simulation of
266
1 APS CLIMATE CHANGE STATEMENT REVIEW WORKSHOP
2 internal variability or an unusual
3 manifestation of internal variability
4 that we didn't capture from bona fide
5 errors in model response and errors
6 in model forcing. All of the above
7 are at play.
8 DR. COLLINS: I would have made
9 a similar conclusion to the statement
10 you just made for a zeroth-order
11 physics error that was made in the
12 very first assessments where they did
13 not include aerosol forcing.
14 So, what happened in the early
15 days of the assessments, the aerosols
16 were not such a big player.
17 They were essentially looking
18 at a system where you had the solar
19 boundary condition, changes in the
20 well-mixed greenhouse gases and no
21 aerosols.
22 And they found, sure enough,
23 that they were overestimating the
24 warming without looking at the
25 historical record.
267
1 APS CLIMATE CHANGE STATEMENT REVIEW WORKSHOP
2 That's sort of a zeroth-order
3 forcing error because they had left
4 out something we know we can see by
5 eye in the earth's atmosphere, and
6 would have led to a similar
7 conclusion which is sure, you have
8 the models. If you leave out
9 aerosols, they are overestimating in
10 the historical record.
11 I think the important thing to
12 recognize is that the historical
13 record is different from what we
14 think will be happening at the end of
15 the 21st century.
16 So, up until now, we have been
17 dealing with a signal where there are
18 a strong influences of both positive
19 and negative from greenhouse gases in
20 the positive and aerosols in the
21 negative, as I showed you, about
22 40 percent of the signal currently.
23 By the year 2100, we believe
24 that people will be wisely improving
25 air quality, but that's removing the
268
1 APS CLIMATE CHANGE STATEMENT REVIEW WORKSHOP
2 shielding effect of aerosols. And so
3 we think that, by the year 2100, the
4 forcing -- and this is just a
5 projection -- will be dominated by
6 well-mixed greenhouse gases.
7 DR. KOONIN: But if the model
8 tells you that you got the response
9 to the forcing wrong by 30 percent,
10 you should use that same 30-percent
11 factor when you project out a
12 century.
13 DR. COLLINS: Yes. And one of
14 the reasons we are not doing that is
15 that we are not using the models as
16 statistical projection tool.
17 DR. KOONIN: What are you using
18 them as?
19 DR. COLLINS: Well, we took
20 exactly the same models that got the
21 forcing wrong and which got sort of
22 the projections wrong up to 2100.
23 DR. KOONIN: So, why do we even
24 show centennial-scale projections?
25 DR. COLLINS: Well, I mean, it
269
1 APS CLIMATE CHANGE STATEMENT REVIEW WORKSHOP
2 is part of the assessment process.
3 And the uncertainty, I think there is
4 a point not to get confused about
5 what the driving uncertainties there
6 are. By the year 2100, it's not --
7 DR. KOONIN: If you calibrated
8 the model against historical data,
9 discovered you needed .7 to be
10 applied to the greenhouse gas, you
11 should keep that same .7 when you run
12 it forward, no?
13 DR. COLLINS: No.
14 DR. KOONIN: You keep all the
15 other parameters. You don't change
16 any of the other parameters.
17 DR. COLLINS: No, that
18 calibration factor is due to an error
19 in the boundary condition.
20 DR. KOONIN: Which boundary?
21 DR. COLLINS: In the aerosol
22 boundary condition. Beta is
23 accounting for an error in a boundary
24 condition.
25 DR. KOONIN: You can't untangle
270
1 APS CLIMATE CHANGE STATEMENT REVIEW WORKSHOP
2 the aerosol in greenhouse gases well
3 enough? Is that what you are telling
4 me?
5 DR. COLLINS: I think that's a
6 large source of uncertainty.
7 DR. LINDZEN: I think he is
8 saying there is a specific assumption
9 that the aerosol will disappear.
10 DR. KOONIN: Well, that's in
11 RCP and whatever the RCP is, that's
12 what it is. That's a boundary
13 condition.
14 But the greenhouse part of RCP,
15 which is dominant in 8.5, you should
16 take the greenhouse sensitivity that
17 you determined from the historical
18 data, shouldn't you?
19 DR. SANTER: Can I respond to
20 that. So, the kind of thing that you
21 mentioned has been done by Peter
22 Scott, Myles Allen and colleagues
23 where they calculate some beta for
24 their model results over some
25 calibration period and then apply
271
1 APS CLIMATE CHANGE STATEMENT REVIEW WORKSHOP
2 that beta to the projections.
3 DR. KOONIN: That's the ASK method?
4 DR. SANTER: Right. And what
5 they show is they shrink the
6 uncertainty range in the projections.
7 DR. KOONIN: And bring it down
8 a bit?
9 DR. SANTER: Yes. And I think
10 what Bill is saying, and what I agree
11 with, is that it is clear the reason
12 we need to scale down is not only
13 associated with some fundamental
14 model error insensitivity.
15 That's possible, but we know
16 beyond a shadow of the doubt that we
17 got some of the forcing wrong
18 systematically.
19 So, some of the that
20 downscaling is associated with
21 incorrect representation of cooling
22 influences that the real world
23 experienced but that the CMIP5
24 multimodel archive did not.
25 Now, to me, when I look at that
272
1 APS CLIMATE CHANGE STATEMENT REVIEW WORKSHOP
2 figure, I showed you, the first
3 two-thirds agreement, last two-thirds
4 disagreement, if modelers were really
5 so skilled and so focused on tuning
6 to get a desired result, we would
7 have done a lot better job than that.
8 There is no way, there is no
9 way we would have gotten that
10 fundamental disconnect.
11 DR. KOONIN: You said you are
12 not representative of what IPCC does.
13 Certainly some modelers are
14 well-focused on tuning and they
15 discovered they need .6, .5, .7 in
16 the greenhouse gas response in order
17 to tune properly.
18 And what bothers me is that
19 they throw away that tuning when they
20 project out a century. That's what I
21 am worried about.
22 DR. SANTER: Again, to me the
23 real problem as a scientist here is
24 in partitioning forcing error from
25 the response error. It's not easy to
273
1 APS CLIMATE CHANGE STATEMENT REVIEW WORKSHOP
2 do that with this ensemble. I think
3 what you need are experiments where
4 you systemically explore some of the
5 these forcing uncertainties. And we
6 have not done a good job of that.
7 We have done a good job
8 exploring parameter uncertainty that
9 I would argue that we have not done a
10 comparably good job exploring forcing
11 uncertainty --
12 DR. CURRY: Thank you. That's
13 very important.
14 DR. SANTER: -- which is large
15 and as I indicated, affects
16 critically the correspondence between
17 models and observations.
18 So, if you care about the
19 parameter uncertainty, you ought to
20 care equally about the forcing
21 uncertainty. And that forcing
22 uncertainty affects the betas that
23 you are concerned with.
24 DR. KOONIN: Absolutely, yes.
25 Thank you. Dick?
274
1 APS CLIMATE CHANGE STATEMENT REVIEW WORKSHOP
2 DR. LINDZEN: I am the one who
3 stands between you and lunch. Thank
4 you, Steve.
5 DR. KOONIN: Before you launch
6 in, Isaac, did you want to say
7 something?
8 DR. HELD: No.
9 DR. KOONIN: You will get to
10 it?
11 DR. HELD: I still have my
12 chance later.
13 DR. BEASLEY: The last word.
14 DR. KOONIN: All right, Dick?
15 DR. LINDZEN: At any rate,
16 thank you for having this. I think
17 it is a good idea to discuss this
18 instead of assert.
19 I find a little bit of
20 strangeness in the incompatibility
21 between major uncertainties in
22 understanding sensitivity and so on
23 and the kind of bookkeeping approach
24 that I include two percent here and
25 one percent there.
275
1 APS CLIMATE CHANGE STATEMENT REVIEW WORKSHOP
2 I am more or less in the first
3 category. And the question I am
4 addressing -- it's already been
5 addressed -- is what gives rise to
6 the large uncertainties in
7 sensitivity?
8 And secondarily, how is the
9 IPCC expression of increasing
10 confidence in the detection
11 attribution consistent with the
12 persistent uncertainty? Wouldn't
13 detection of anthropogenic signal
14 necessarily improve estimates of the
15 response?
16 At any rate, let's start with
17 the first question. And it has been
18 pointed out somewhat obscurely, it's
19 intrinsic to feedback systems.
20 So, you have this diagram. [next page]
21 So, you know, you have a forcing and the
22 node here and the zero-feedback gain
23 and so you get the zero-feedback
24 response. If you have a feedback
25 then you have this circuit here,
276
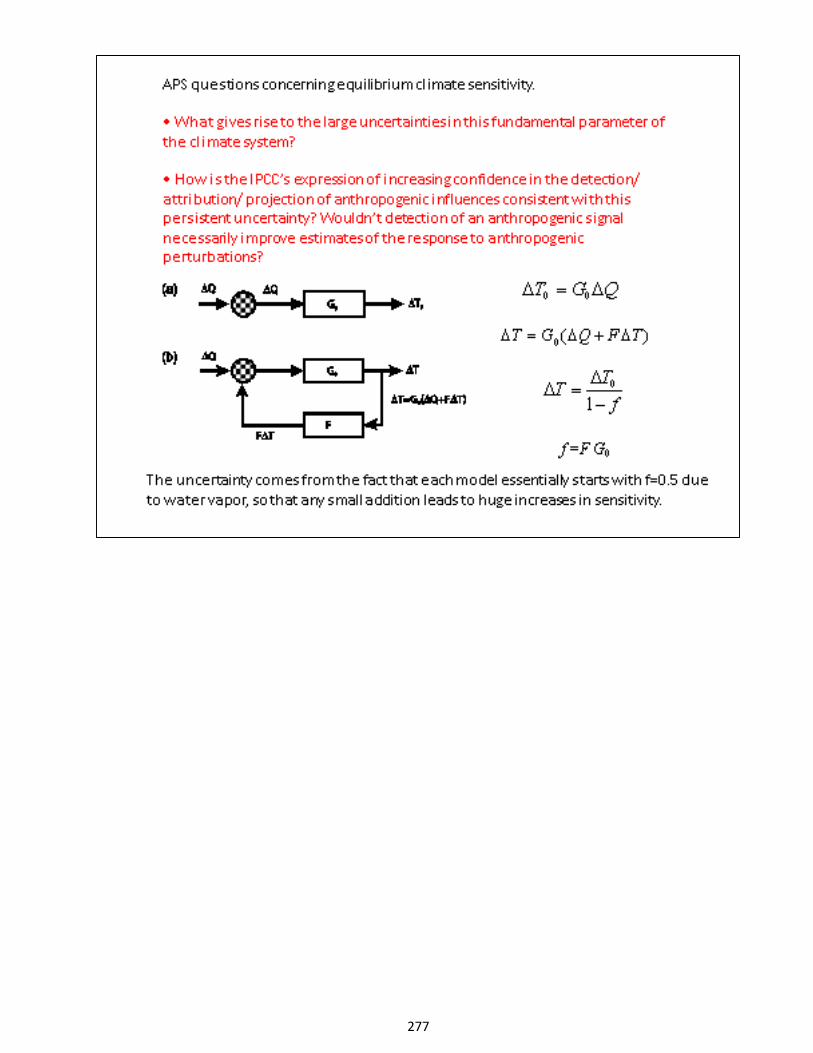
277
1 APS CLIMATE CHANGE STATEMENT REVIEW WORKSHOP
2 adding to the forcing.
3 And so, you solve and you have
4 delta T naught over one minus f. At
5 any rate, the uncertainty comes from
6 something that was mentioned, the
7 Manabian water vapor feedback.
8 Early on in the '70s, there was
9 the discovery that if you assumed
10 relative humidity stayed constant,
11 you could double the response to CO2
12 with water vapor simply because as
13 temperature increases relative
14 humidity is fixed, so specific 15 humidity must increase.
16 Once you start out with 0.5 for f, of
17 course anything you add to it
18 including 0.5, which will bring you to
19 infinity, gives you the range. What
20 you have is a curve like this. [next page]
21 For positive feedbacks,
22 relatively small variation in the
23 feedback lead to large changes in the
24 response. But it's equally true that
25 if you didn't have the strong
278
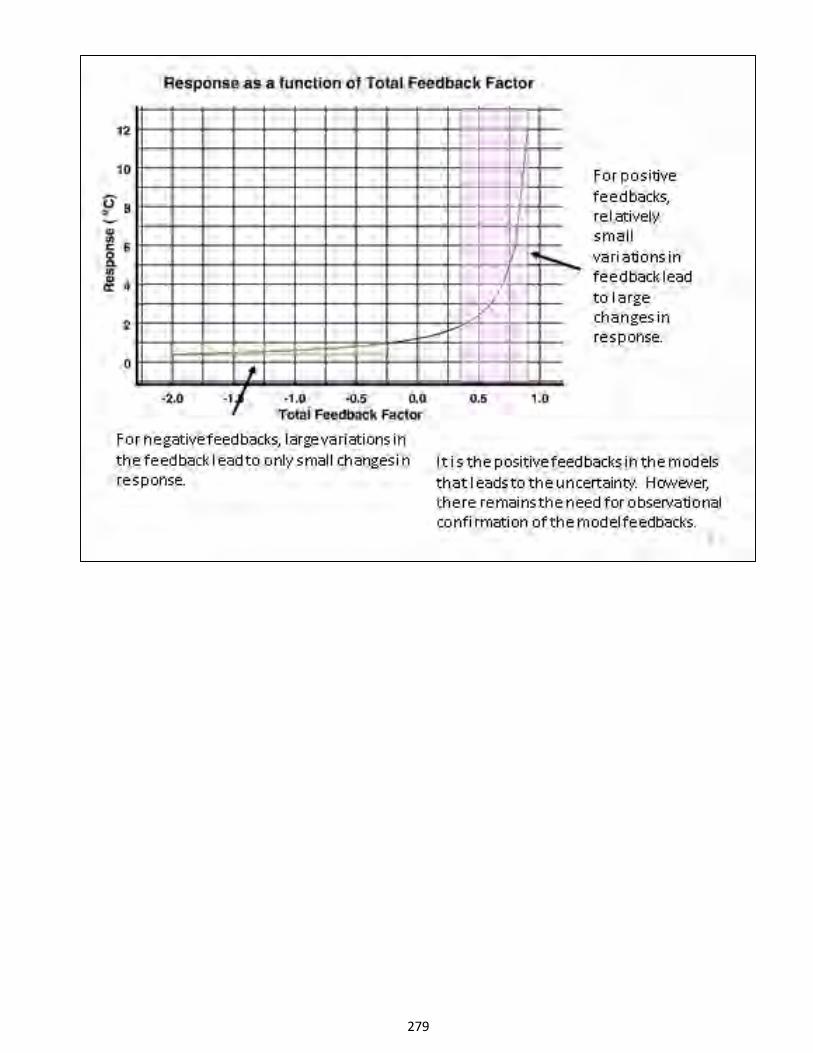
279
1 APS CLIMATE CHANGE STATEMENT REVIEW WORKSHOP
2 positive feedback to begin with, you
3 would be in a very much more
4 constrained region.
5 The point is, it is the
6 existence in the models of a basic
7 positive feedback that leads to the
8 uncertainty. And this would lead to
9 the suggestion that you
10 would like an observational basis for
11 the feedbacks.
12 And [next page] a number of people,
13 including myself and Choi, Spencer
14 and Braswell, Trenberth and Fasullo,
15 Gregory and others, have tried to
16 find this in looking at the outgoing
17 radiation from ERBE and CERES and so
18 on, various satellites in recent
19 years.
20 And the idea is simple enough.
21 I mean, these pictures are not that
22 helpful, but they are describing the
23 feedback. You start out in
24 equilibrium. You add some greenhouse
25 gas.
280
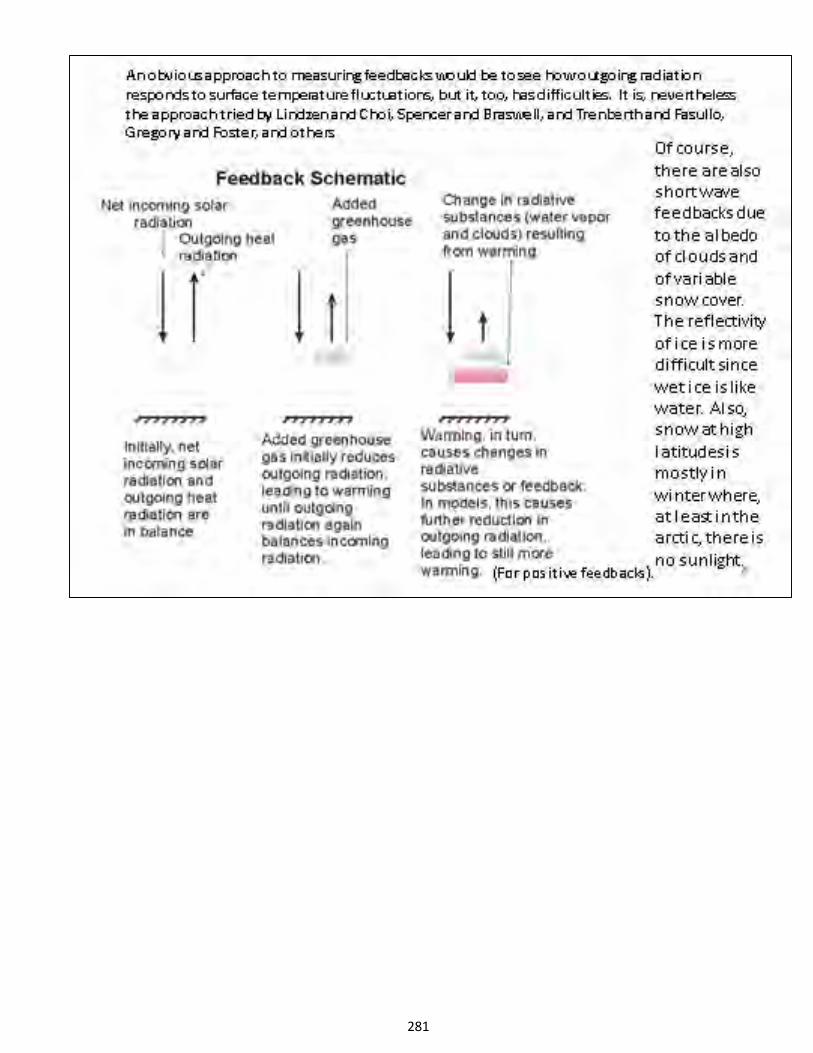
281
1 APS CLIMATE CHANGE STATEMENT REVIEW WORKSHOP
2 You now reduce the emission
3 temperature because you have raised
4 the level. And then if you have a
5 feedback that is positive, you do
6 this more. This is the longwave
7 feedback. There are shortwave
8 feedbacks due to albedo and
9 variability and so on.
10 And these are actually it turns
11 out much tougher to deal with. But
12 they are the ones that are giving you
13 a lot of this uncertainty. We’ll come back
14 to it.
15 If you want to measure it, [next page]
16 basically what you are saying is, a
17 feedback doesn't care where the
18 temperature change came from. So,
19 you look at fluctuations in
20 temperature.
21 If you get more response in
22 terms of outgoing radiation than you
23 would get from zero feedback, which
24 may be Planck black body, then you
25 have negative feedback. If you get
282
283
1 APS CLIMATE CHANGE STATEMENT REVIEW WORKSHOP
2 less, you have a positive feedback.
3 So, you have something to look
4 at. And you have model comparisons
5 to look at. All the models have not
6 only CMIP but AMIP so you even have
7 models that are forced by exactly the
8 same temperatures you are looking at.
9 Okay, so you do that. In
10 principle, [next page] it sounds
11 straightforward. In practice, it's not.
12 First of all, there are obvious
13 considerations of time scale.
14 So, for instance, if you have a
15 perturbation in temperature and you
16 wait forever and the system equilibrates,
17 you now have a change in temperature
18 without a change in flux. That's a
19 bias. So, you have to make it
20 shorter than that.
21 You need to consider the
22 process. Most of the feedbacks we
23 are looking at involve very
24 short-term changes in water vapor,
25 cloudiness and so on. They are
284
285
1 APS CLIMATE CHANGE STATEMENT REVIEW WORKSHOP
2 associated with things on the order
3 of days. And so, certainly you want
4 your period to be longer than that.
5 As a practical matter, this is
6 not a problem. Time scales on the
7 order of one month, three months are
8 fine. The problem with
9 the equilibration, by the way,
10 is it depends on sensitivity
11 itself.
12 So, for instance, if you have a
13 sensitivity of five degrees for
14 doubling of CO2, time scale is many
15 decades. But if your sensitivity was
16 only a half degree, the time scale
17 would be on the order of a year. So,
18 you have a range that you don't want.
19 Okay, you have other problems,
20 seasonal effects so on. And each of
21 the papers I mentioned deals with
22 this.
23 The problem [next page] that is
24 hardest to deal with, though, and that has
25 to deal with the shortwave mostly, is
286
287
1 APS CLIMATE CHANGE STATEMENT REVIEW WORKSHOP
2 outgoing radiation is not simply a
3 matter of the temperature
4 perturbation.
5 There are changes in outgoing
6 radiation going on all the time
7 because of large changes in clouds
8 that have nothing to do with
9 feedbacks.
10 And this normal variability,
11 short-term variability, not the
12 long-term variability we are talking
13 about, in turn induces changes in
14 temperature in the surface.
15 And so, there is a distinct
16 need to consider lags and so on to
17 make sure you are looking at
18 responses. And even then, there are
19 decorrelation times which screw
20 things up.
21 At any rate, you can go through
22 the list of problems with
23 incompatibility between CERES and
24 ERBE. And we deal with it and you
25 get a result.
288
1 APS CLIMATE CHANGE STATEMENT REVIEW WORKSHOP
2 These are results. [next page] The top
3 diagram is delta flux over sea
4 surface temperature as a function of
5 lag. And the bottom is correlation
6 as a function of lag. And the left
7 is longwave and the right is
8 shortwave.
9 What you will notice is, for
10 the longwave, you have a single peak,
11 reasonably well-defined. Now, this
12 is largely tropical. You get poorer
13 results globally, but I think there are good
14 reasons to focus on the tropics and
15 both I think are fairly unambiguous.
16 And they unambiguously show a
17 negative feedback with an
18 uncertainty. So, it's like replacing f=.5 from 19 Manabe’s water vapor feedback with
20 minus 0.3 plus or minus 0.2.
21 On the other hand, when you get
22 to the shortwave, you have this kind
23 of S-pattern. And it's clear that at zero
24 lag, you are still getting what
25 looks like a positive feedback, but
289
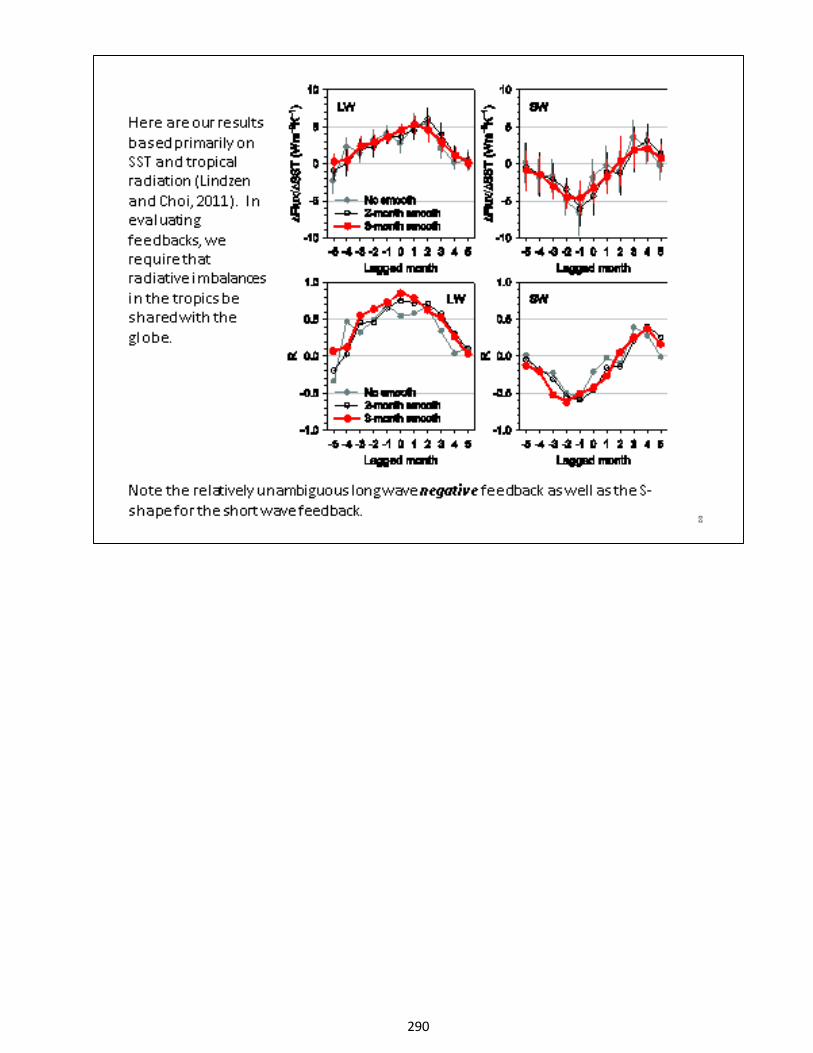
290
1 APS CLIMATE CHANGE STATEMENT REVIEW WORKSHOP
2 that could have been produced by a
3 nonfeedback change in temperature
4 with the decorrelation time.
5 Recently, Choi and Hee-Je
6 Cho -- I am a distant author on this
7 paper -- did a couple of thousand
8 Monte Carlo runs with noise and so on
9 to see what happens.
10 And what we found was,[next page] if
11 you had sufficiently low noise, you got
12 the curves like you got for the
13 longwave. As you increased the
14 noise, a product of the noise was the
15 S-shape.
16 And so, that leaves me with a
17 fairly pessimistic view of our
18 ability at this point to detect the
19 shortwave feedback. But the
20 important point is the longwave
21 feedback was essential to the huge
22 uncertainty.
23 And so, for example,[next page]
24 if you start out with a longwave feedback of
25 .5, and you have a shortwave feedback
291
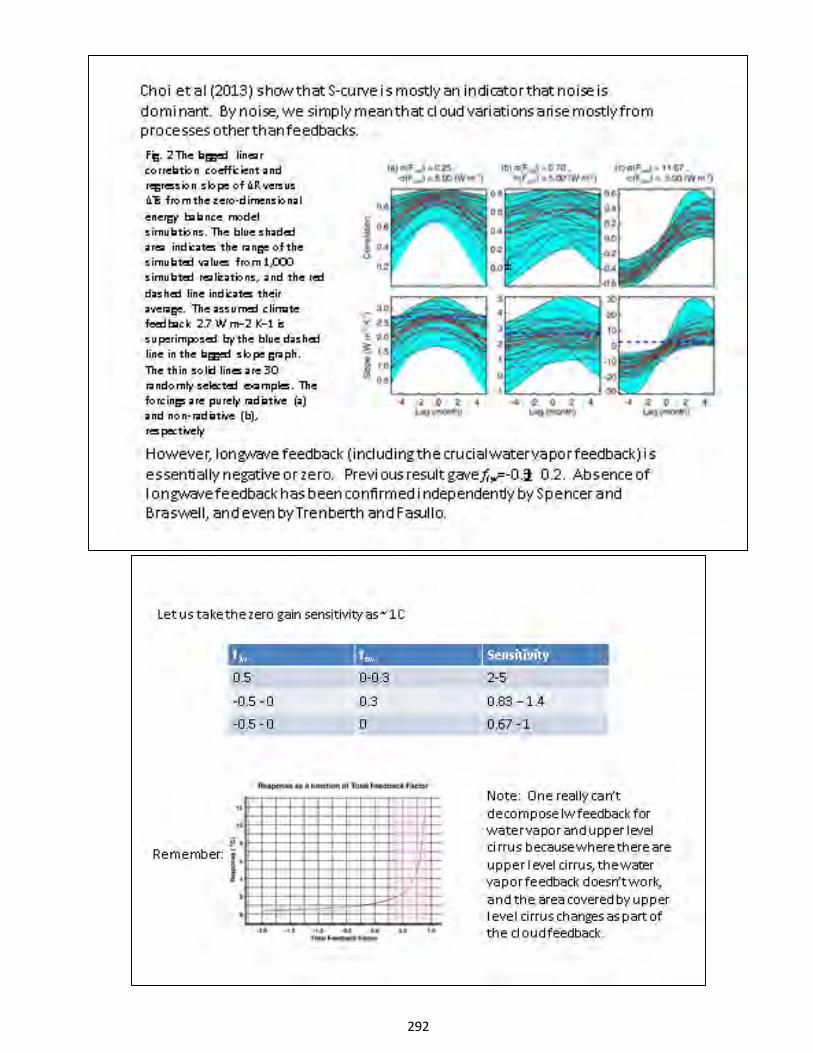
292
1 APS CLIMATE CHANGE STATEMENT REVIEW WORKSHOP
2 that is between zero and
3 plus 0.3, you, of course, get a range
4 of equilibrium sensitivity of two to
5 five degrees.
6 But if instead you had the
7 longwave being uncertain between
8 minus 0.5 and zero, let's say, and you
9 had a shortwave feedback that was 0.3,
10 that would give you 0.83 to 1.4.
11 If you had no shortwave
12 feedback, you would be at 0.67 to 1.
13 But you would be in this constrained
14 range of the feedback behavior.
15 I should mention that longwave
16 feedback here is what we deal with,
17 not water vapor feedback. And the
18 reason is, you cannot disentangle the
19 two.
20 So, for instance, the feedback
21 depends on changing the emission
22 level for infrared. Where you have
23 upper-level clouds, thin cirrus, the
24 water vapor doesn't matter. Clouds
25 determine the emission level.
293
1 APS CLIMATE CHANGE STATEMENT REVIEW WORKSHOP
2 So, you cannot get the longwave
3 feedback independently for the clouds
4 and the water vapor. The area is
5 varying all the time. These are very
6 large changes. I will come back to
7 that.
8 If you look at normal variance
9 of clouds, you know, for instance, to
10 equal three and a half watts per
11 meter squared, let's say, it would be
12 like ten percent in upper-level
13 cirrus, a fraction of a percent you 14 have in your document for the lower 15 level 16 It would be a 500 meter change in altitude
17 for upper level cirrus. If
18 you look at the normal variations,
19 they are much larger than that.
20 So, these things are happening
21 all the time. So, that is the reason
22 for the uncertainties in sensitivity
23 and where we may be way off.
24 Now, attribution, that has been
25 discussed here.[next page] And the problem
294

295
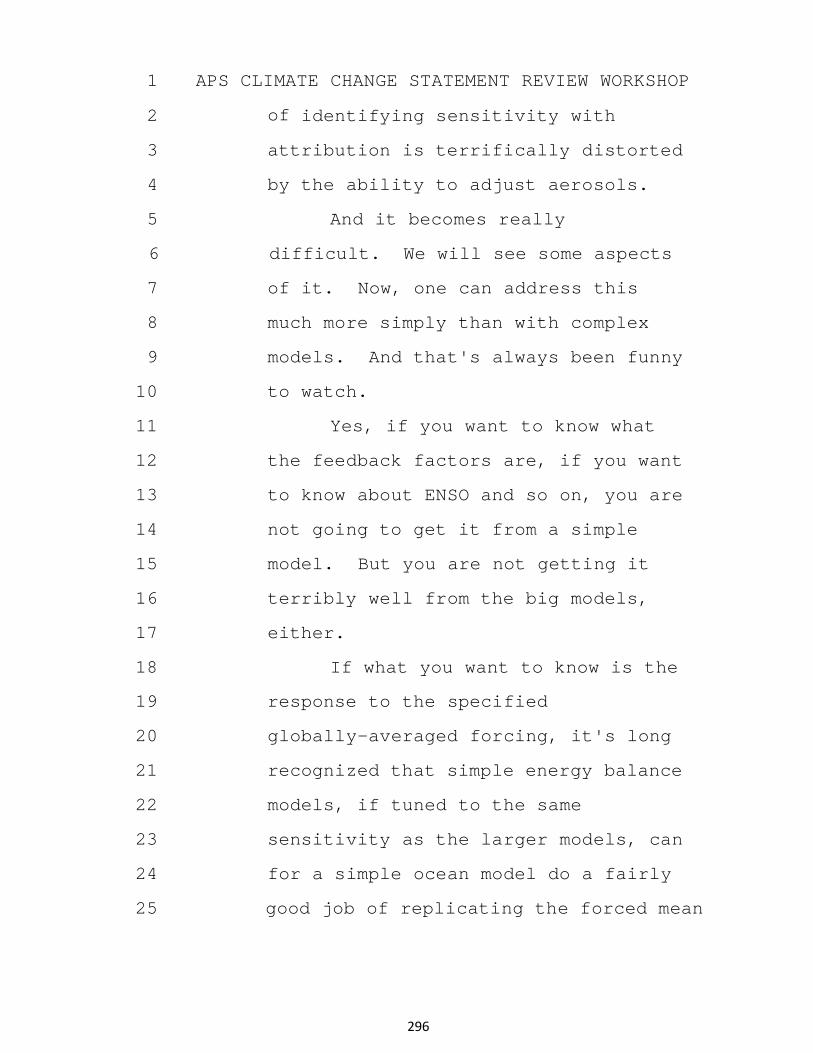
1 APS CLIMATE CHANGE STATEMENT REVIEW WORKSHOP
2 of identifying sensitivity with
3 attribution is terrifically distorted
4 by the ability to adjust aerosols.
5 And it becomes really
6 difficult. We will see some aspects
7 of it. Now, one can address this
8 much more simply than with complex
9 models. And that's always been funny
10 to watch.
11 Yes, if you want to know what
12 the feedback factors are, if you want
13 to know about ENSO and so on, you are
14 not going to get it from a simple
15 model. But you are not getting it
16 terribly well from the big models,
17 either.
18 If what you want to know is the
19 response to the specified
20 globally-averaged forcing, it's long
21 recognized that simple energy balance
22 models, if tuned to the same
23 sensitivity as the larger models, can
24 for a simple ocean model do a fairly
25 good job of replicating the forced mean
296
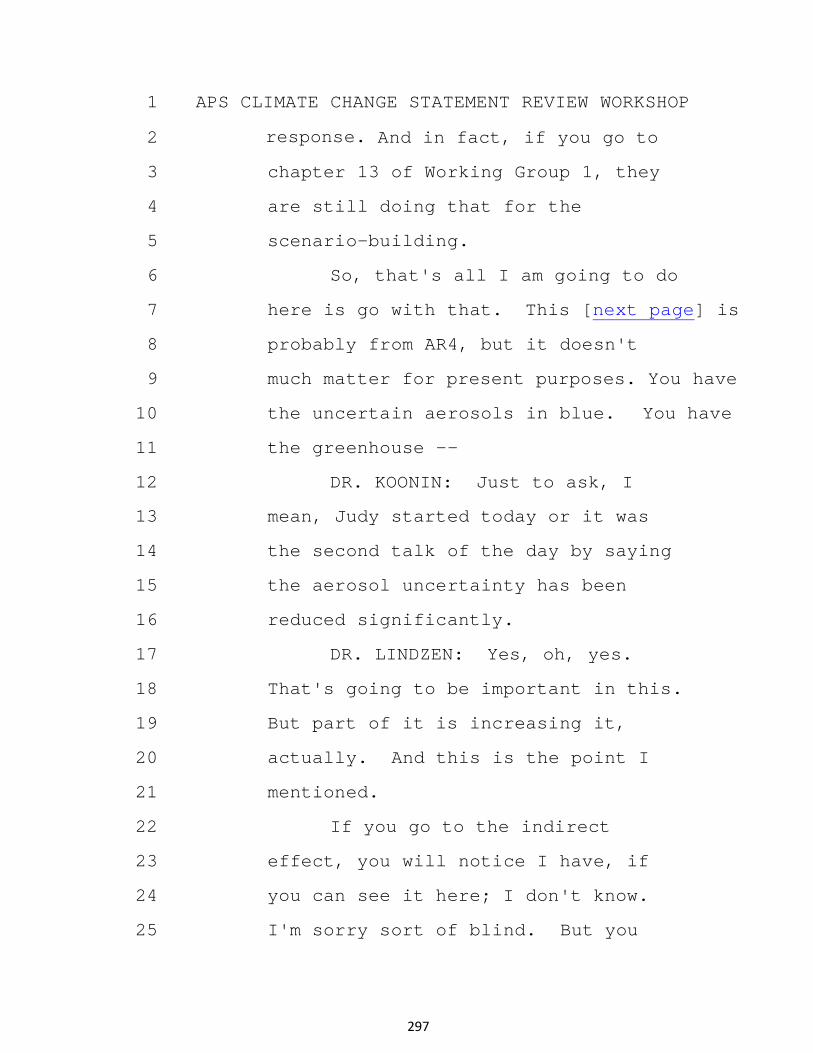
1 APS CLIMATE CHANGE STATEMENT REVIEW WORKSHOP
2 response. And in fact, if you go to
3 chapter 13 of Working Group 1, they
4 are still doing that for the
5 scenario-building.
6 So, that's all I am going to do
7 here is go with that. This [next page] is
8 probably from AR4, but it doesn't
9 much matter for present purposes. You have
10 the uncertain aerosols in blue. You have
11 the greenhouse --
12 DR. KOONIN: Just to ask, I
13 mean, Judy started today or it was
14 the second talk of the day by saying
15 the aerosol uncertainty has been
16 reduced significantly.
17 DR. LINDZEN: Yes, oh, yes.
18 That's going to be important in this.
19 But part of it is increasing it,
20 actually. And this is the point I
21 mentioned.
22 If you go to the indirect
23 effect, you will notice I have, if
24 you can see it here; I don't know.
25 I'm sorry sort of blind. But you
297
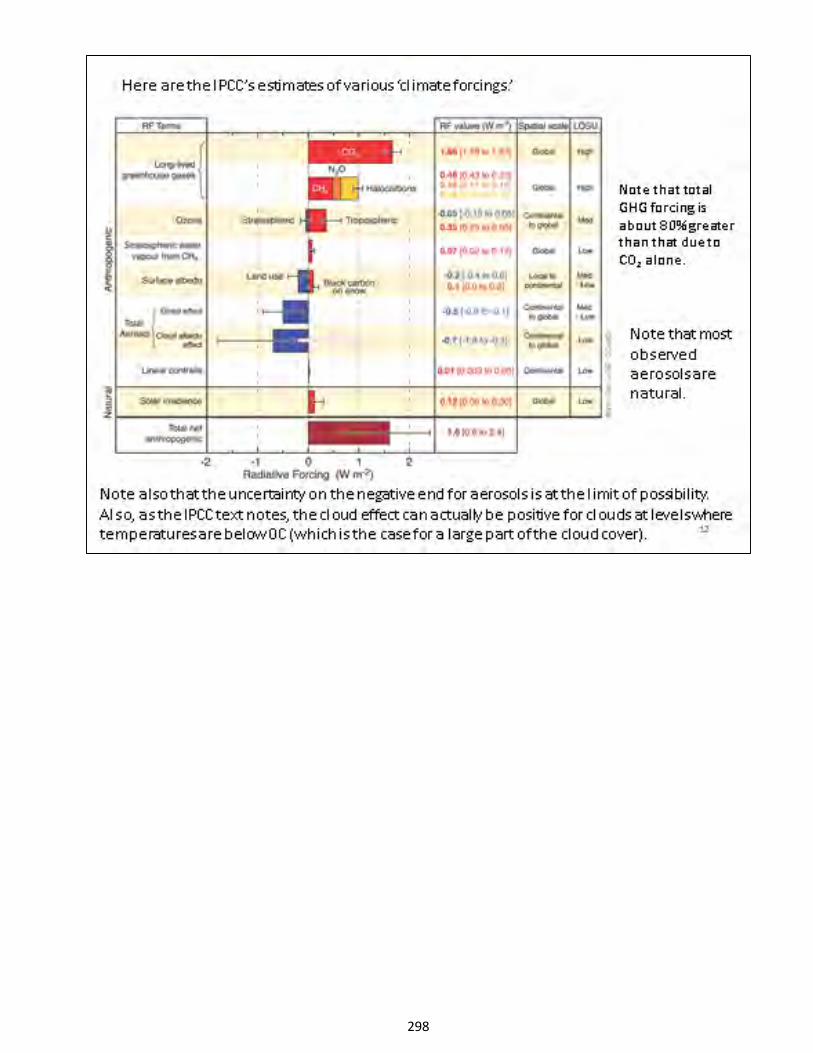
298
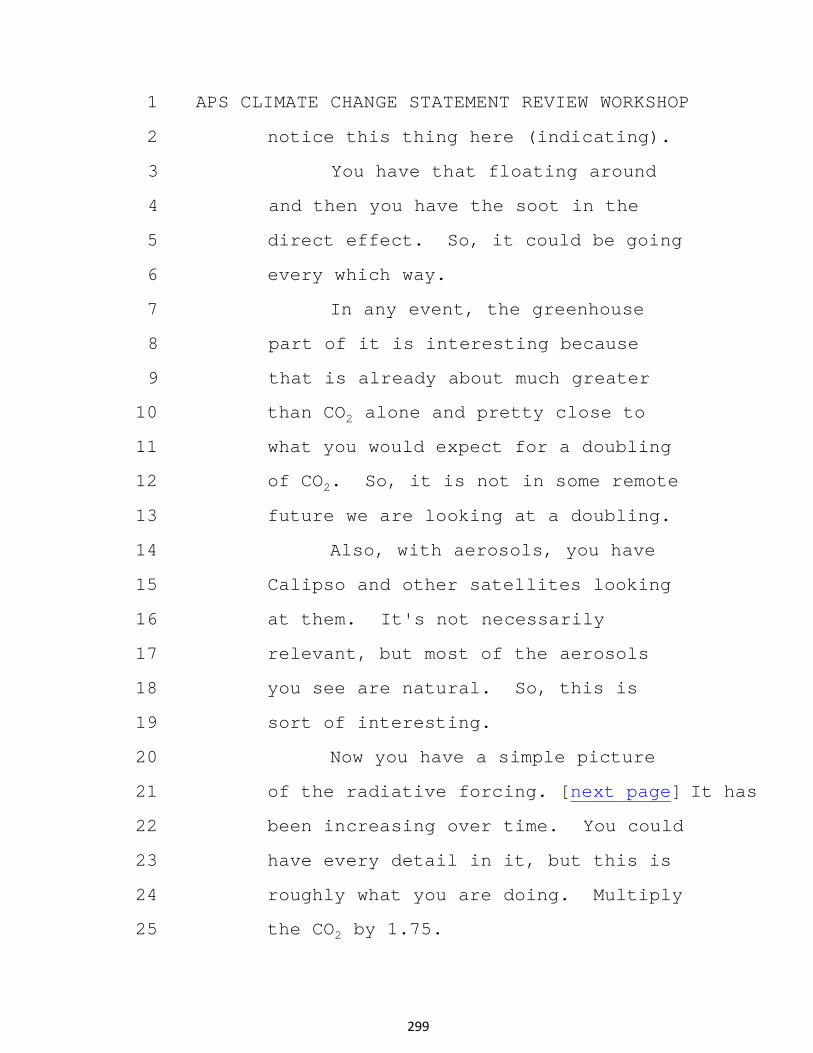
1 APS CLIMATE CHANGE STATEMENT REVIEW WORKSHOP
2 notice this thing here (indicating).
3 You have that floating around
4 and then you have the soot in the
5 direct effect. So, it could be going
6 every which way.
7 In any event, the greenhouse
8 part of it is interesting because
9 that is already about much greater
10 than CO2 alone and pretty close to
11 what you would expect for a doubling
12 of CO2. So, it is not in some remote
13 future we are looking at a doubling.
14 Also, with aerosols, you have
15 Calipso and other satellites looking
16 at them. It's not necessarily
17 relevant, but most of the aerosols
18 you see are natural. So, this is
19 sort of interesting.
20 Now you have a simple picture
21 of the radiative forcing. [next page] It has
22 been increasing over time. You could
23 have every detail in it, but this is
24 roughly what you are doing. Multiply
25 the CO2 by 1.75.
299
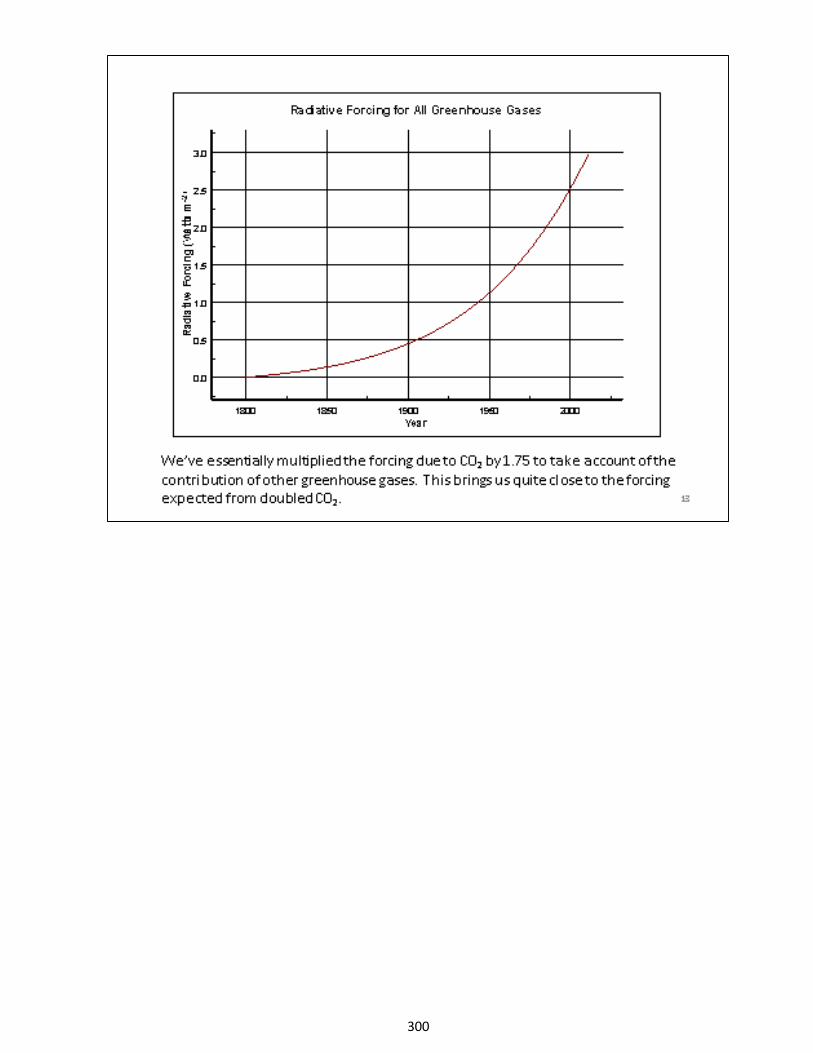
300
1 APS CLIMATE CHANGE STATEMENT REVIEW WORKSHOP
2 Sato's picture of the aerosol
3 forcing,[next page] the volcanic forcing is
4 used by a lot of the models. I put it in
5 here. It doesn't have the latest
6 ones, but that isn't relevant to what
7 I am talking about.
8 It's often been pointed out
9 they cluster. This is, however,
10 probably a property of random
11 processes. They cluster. It's one
12 of these oddities.
13 At any rate, the response to
14 the volcanos depends on the
15 sensitivity of the model. So, here
16 [next page] you have different models with
17 different sensitivities ranging from
18 0.75 to five degrees.
19 For 0.75, you also have very
20 short response times. So, you only
21 see the blips in the red. As you go
22 down to the higher sensitivities, you
23 begin seeing a secular effect.
24 Now, if you look at this
25 literatures, you know from the UK Met
231 301
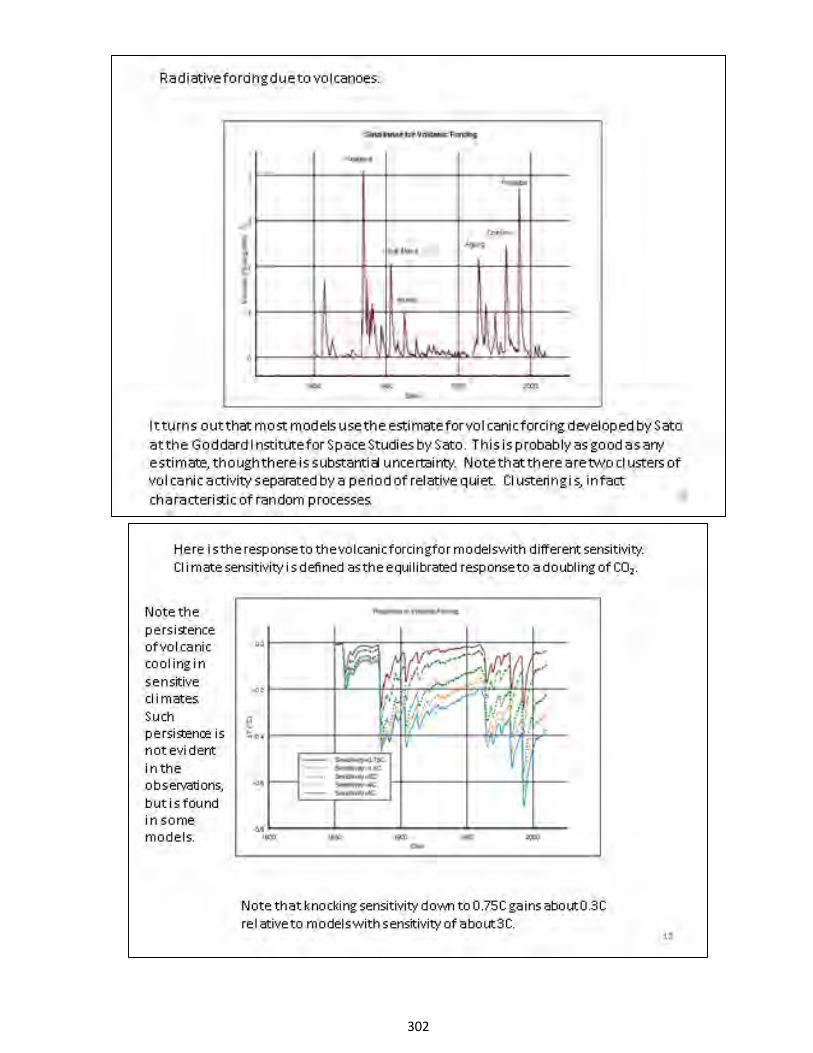
302
1 APS CLIMATE CHANGE STATEMENT REVIEW WORKSHOP
2 Office, Gregory and others have been
3 complaining that their model shows an
4 influence of Krakatoa to the present.
5 Now, the question is, is this real or
6 not?
7 DR. HELD: In sea level.
8 DR. LINDZEN: In sea level, but
9 they also are seeing it in other
10 things.
11 DR. SANTER: Not on surface
12 temperature.
13 DR. HELD: Not on surface
14 temperature.
15 DR. LINDZEN: May not.
16 DR. SANTER: No, definitely
17 not.
18 DR. LINDZEN: Well, this would
19 not be a big thing on that issue,
20 either. It's 0.3 degrees. It's
21 saying you would get something on the
22 order of a third of a degree cooling
23 that you might not have in a
24 high-sensitivity model.
25 In any event, the persistence
303
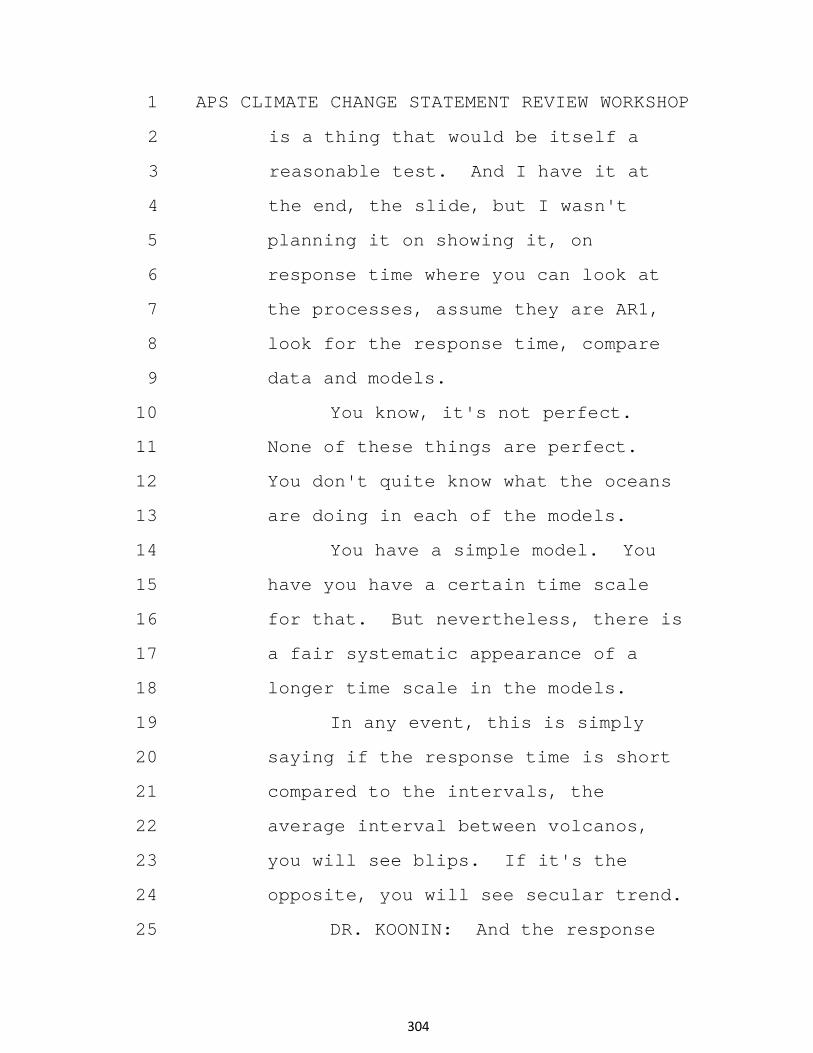
1 APS CLIMATE CHANGE STATEMENT REVIEW WORKSHOP
2 is a thing that would be itself a
3 reasonable test. And I have it at
4 the end, the slide, but I wasn't
5 planning it on showing it, on
6 response time where you can look at
7 the processes, assume they are AR1,
8 look for the response time, compare
9 data and models.
10 You know, it's not perfect.
11 None of these things are perfect.
12 You don't quite know what the oceans
13 are doing in each of the models.
14 You have a simple model. You
15 have you have a certain time scale
16 for that. But nevertheless, there is
17 a fair systematic appearance of a
18 longer time scale in the models.
19 In any event, this is simply
20 saying if the response time is short
21 compared to the intervals, the
22 average interval between volcanos,
23 you will see blips. If it's the
24 opposite, you will see secular trend.
25 DR. KOONIN: And the response
304
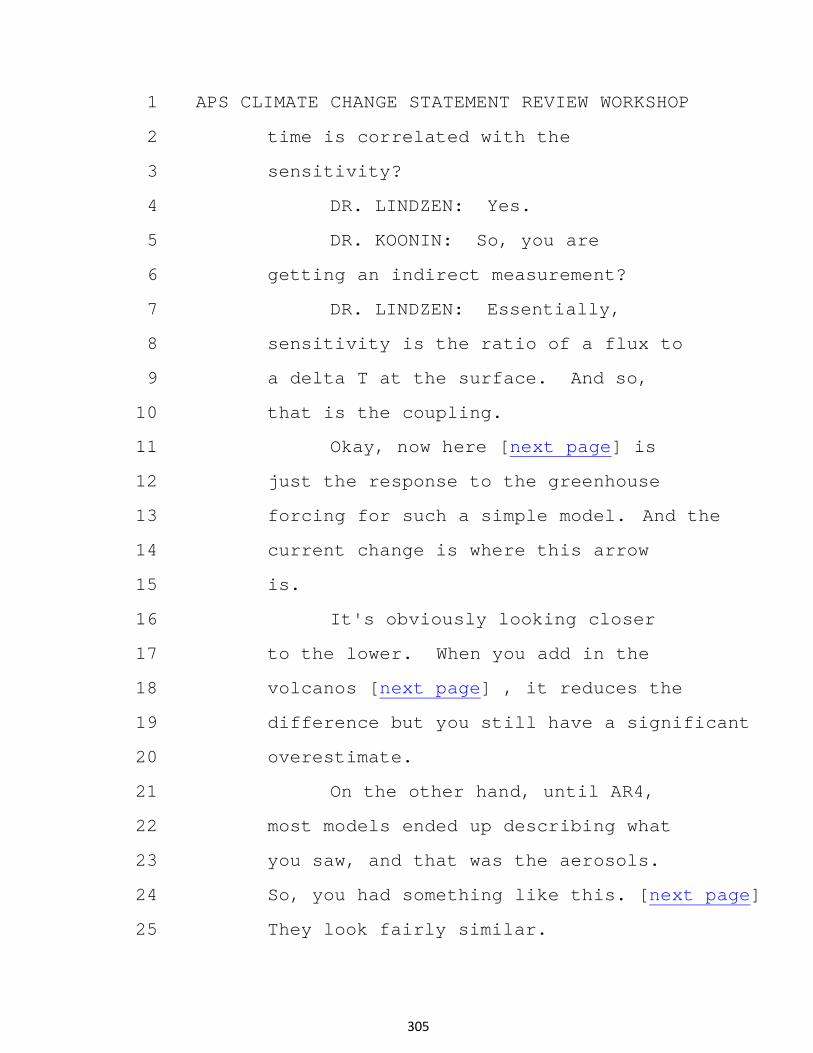
1 APS CLIMATE CHANGE STATEMENT REVIEW WORKSHOP
2 time is correlated with the
3 sensitivity?
4 DR. LINDZEN: Yes.
5 DR. KOONIN: So, you are
6 getting an indirect measurement?
7 DR. LINDZEN: Essentially,
8 sensitivity is the ratio of a flux to
9 a delta T at the surface. And so,
10 that is the coupling.
11 Okay, now here [next page] is
12 just the response to the greenhouse
13 forcing for such a simple model. And the
14 current change is where this arrow
15 is.
16 It's obviously looking closer
17 to the lower. When you add in the
18 volcanos [next page] , it reduces the
19 difference but you still have a significant
20 overestimate.
21 On the other hand, until AR4,
22 most models ended up describing what
23 you saw, and that was the aerosols.
24 So, you had something like this. [next page]
25 They look fairly similar.
305
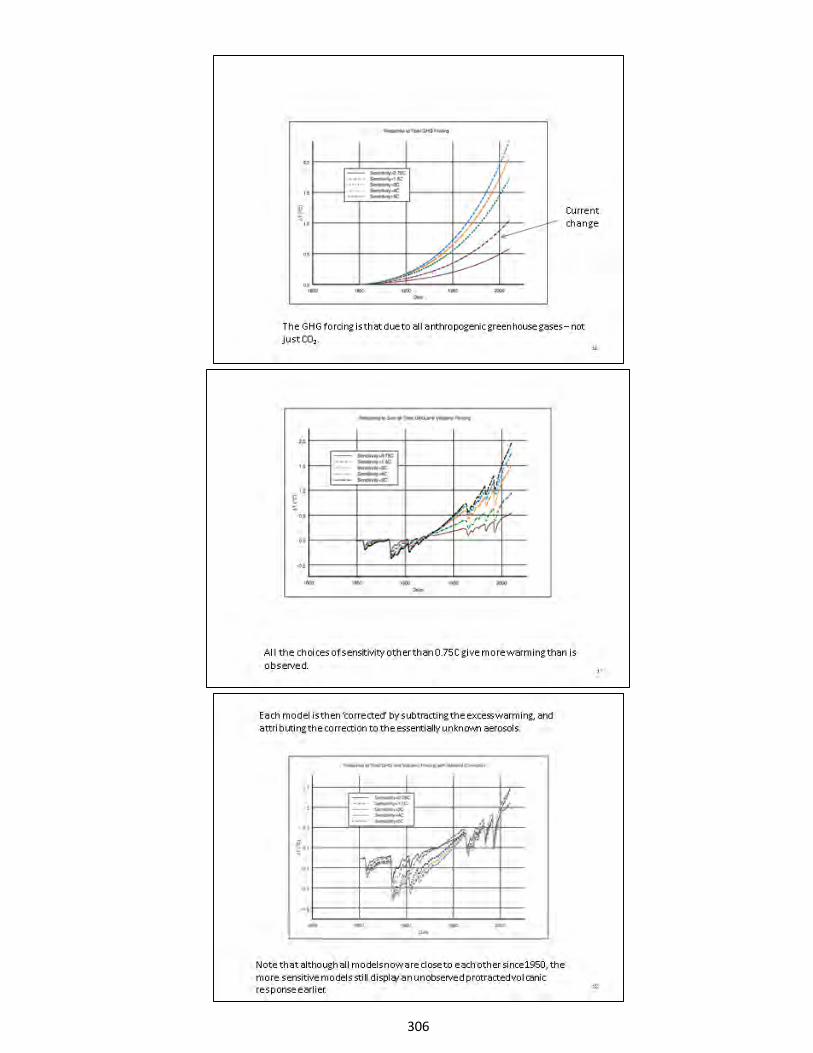
306
1 APS CLIMATE CHANGE STATEMENT REVIEW WORKSHOP
2 And the only difference is that
3 you might have had a slight
4 difference in the response to
5 volcanos in the in-between period,
6 but people rarely focus on that.
7 And the question is how much
8 did you have to subtract?
9 [next page] And so, obviously, if you had
10 0.75, you didn't subtract anything.
11 By the time you had one and a
12 half degrees for doubling, you had to
13 take 25 percent out. And then for
14 the rest, it really didn't matter
15 much.
16 You had to take about half out.
17 And that's because you are in that
18 part of the sensitivity curving. It
19 changes a lot for a little.
20 In any event, that's where you
21 are at. And you are so far assuming
22 everything is due to the specified
23 forcing. But there have been a
24 number of papers in recent years --
25 this stuff is from Tung and Zhao from
307
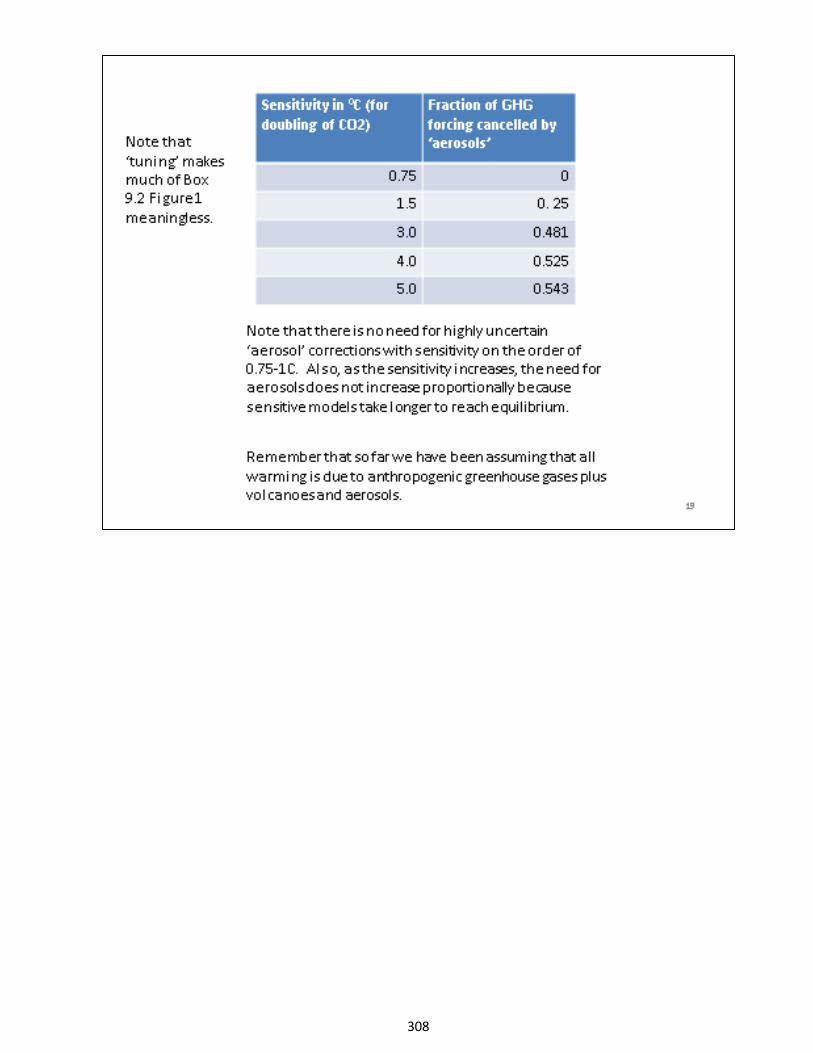
308
1 APS CLIMATE CHANGE STATEMENT REVIEW WORKSHOP
2 PNAS.
3 There has also been a set of
4 papers by Tsonis and Swanson and
5 others who are trying to estimate how
6 much comes from internal variability.
7 The general conclusion is it's on the
8 order of half, [next page] although you
9 could account for more, depending on what
10 model you wanted to use.
11 And, of course, each of these
12 things puts more and more constraints
13 on the attribution and the related
14 sensitivity.
15 Now, I would suggest that most
16 independent attempts to find
17 sensitivity end up with less
18 sensitivity than the models are
19 displaying. But paleo is an
20 interesting exception. [next page]
21 There, the fact that
22 Milankovitch parameters, orbital
23 parameters are giving you no change
24 in mean insolation, essentially.
25 And you are getting a big climate
309
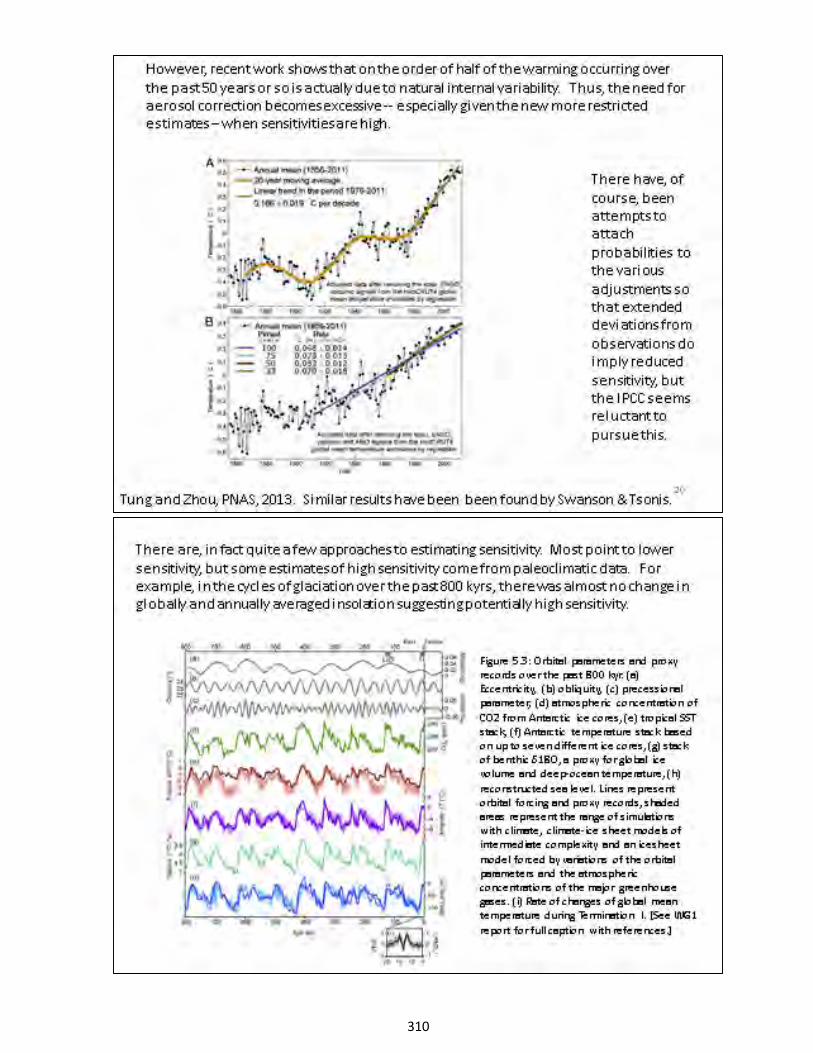
310
1 APS CLIMATE CHANGE STATEMENT REVIEW WORKSHOP
2 change, which suggests sensitivity.
3 And here, it's interesting
4 Isaac is here because he was a
5 post-doc with me and he was the
6 person who got me interested in the
7 Milankovitch thing. I had not
8 thought about it much.
9 And it seemed to me very
10 interesting that you had almost no
11 forcing and you were getting a big
12 response. And I worked on this for a
13 few years and suddenly realized I am
14 thinking wrong.
15 This [next page] is not a problem with
16 globally averaged, annually averaged
17 forcing. Milankovitch was probably
18 right. What Milankovitch did was
19 simply say you have these orbital
20 variations, the obliquity, the
21 eccentricity, precession of the
22 equinoxes.
23 But what was important for
24 glaciers was the insolation in the
25 Arctic in summer. Almost every
311
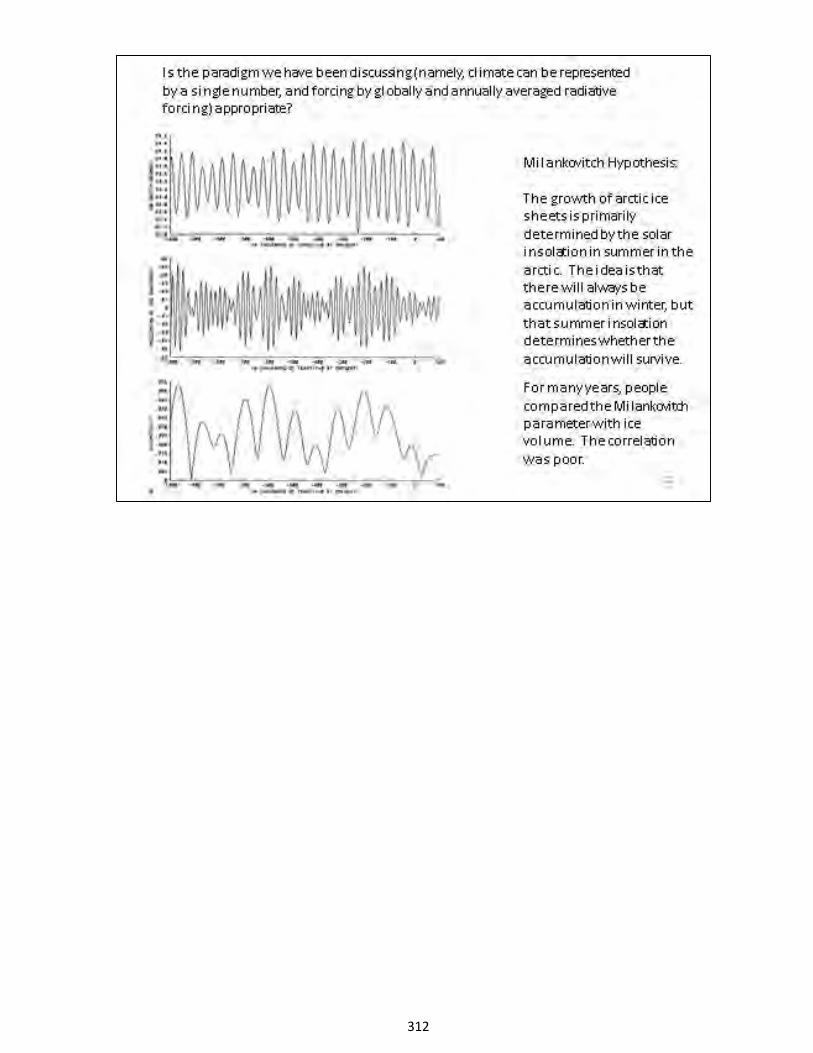
312
1 APS CLIMATE CHANGE STATEMENT REVIEW WORKSHOP
2 glaciologist will say that.
3 Essentially, you will always get snow
4 in the winter.
5 It will always accumulate.
6 What determines whether you build up
7 an ice sheet over a long period of
8 time how much survives the summer.
9 Now, at first, people looked at
10 that. And this is a funny field and
11 all of us make errors that are pretty
12 gross in retrospect.
13 But what happened with the
14 CLIMAP program is they compared
15 Milankovitch parameter with ice
16 volume and they didn't get an awfully
17 good correlation.
18 Eventually, I feel embarrassed
19 because I realized at some point I
20 was looking at tropical influence. Three
21 Swedish astronomers, Edvardsson and some
22 other names studied this. [next page]
23 They did the obvious thing,
24 which was to look at the time
25 derivative of the ice volume versus
313
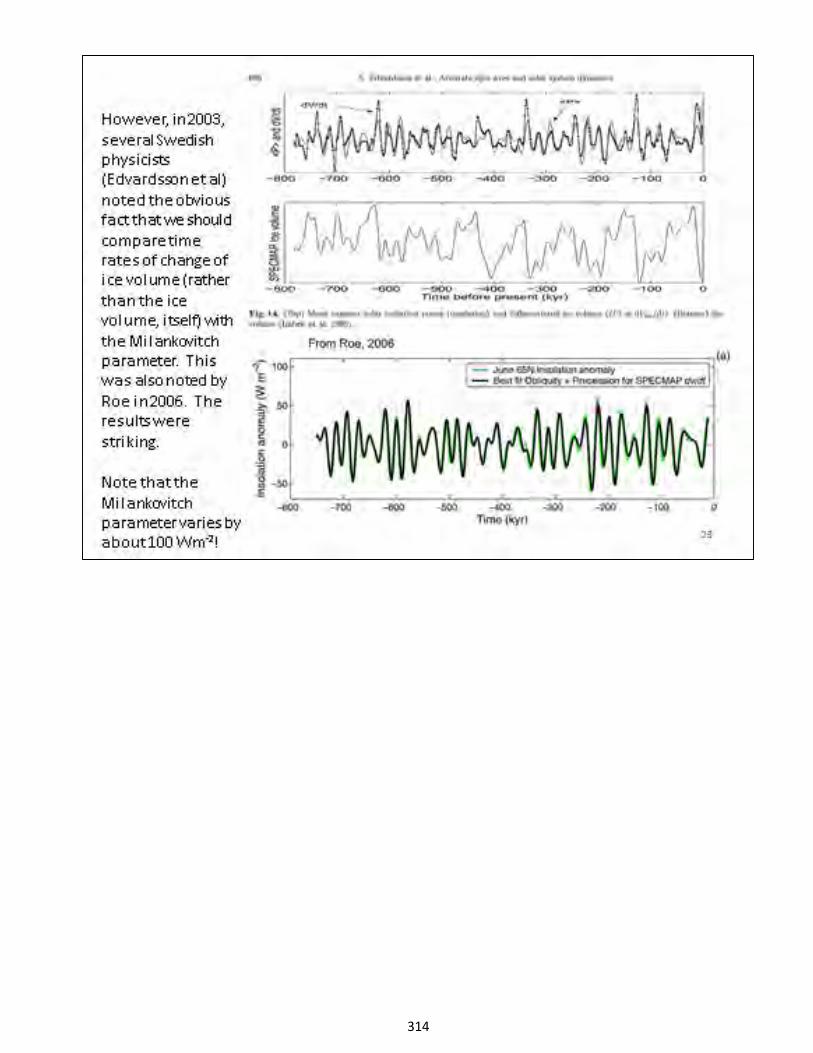
314
1 APS CLIMATE CHANGE STATEMENT REVIEW WORKSHOP
2 the Milankovitch parameter. And what
3 you get is at the top there.
4 I mean, I don't know of a
5 better correlation in geophysics.
6 And at the bottom, you see the ice
7 volume itself. Of course, that
8 doesn't look nearly as good.
9 Other people have independently
10 discovered this because Edvardsson,
11 et al. was the astronomical
12 literature and nobody saw it.
13 But they also went so far as to
14 ask whether the range of variability
15 of insolation due to the
16 Milankovitch parameter was compatible
17 with the heat of fusion for the ice
18 volume.
19 And even that was very, very
20 close. Just to give you an idea of
21 the range, that's in the bottom.
22 Gerard Roe's paper had that. It's
23 100 watts per meter squared.
24 DR. KOONIN: Over what region
25 is that?
315
1 APS CLIMATE CHANGE STATEMENT REVIEW WORKSHOP
2 DR. LINDZEN: Pardon me?
3 DR. CHRISTY: 65 north.
4 DR. LINDZEN: Yes.
5 DR. KOONIN: Wow!
6 DR. LINDZEN: That's the
7 Arctic. So, this is big time.
8 Now, the question is, is the
9 current paradigm reasonable? [next page]
10 Is it true that there is a profound problem
11 with the Milankovitch hypothesis
12 because the orbital parameters leads
13 to almost no change in globally or
14 annually averaged insulation?
15 Is it really that one and a
16 half watts per meter squared that is at
17 issue? And I think that makes no
18 sense.
19 What you have, and this is what
20 we saw in the sensitivity
21 measurements from space, you have
22 huge amount of variability in clouds
23 and other things. And they are not
24 feedbacks.
25 Why aren't they degrees of
316
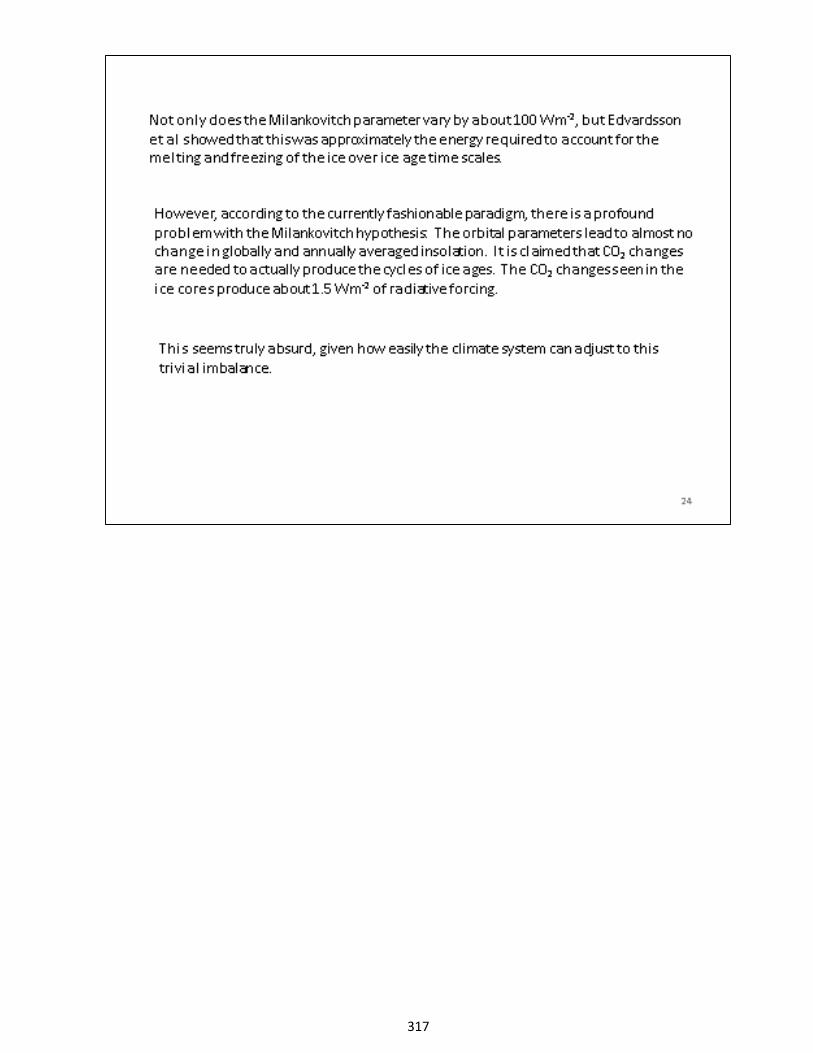
317
1 APS CLIMATE CHANGE STATEMENT REVIEW WORKSHOP
2 freedom that the system has to adjust
3 to the small imbalances here? And I
4 think that is probably the way one
5 ought to look at the climate system.
6 This is from a paper on
7 different models. [next page] I mean, the
8 range of variability they are getting in
9 precipitation in cloud radiative
10 effects is huge compared to what you
11 need.
12 But it is also on the order of
13 our uncertainty on this and probably
14 on the order of the normal
15 variability.
16 Okay, I will end it at that. I
17 don't want to keep people from lunch.
18 DR. KOONIN: If I could try to
19 summarize my own words. What I just
20 heard in the last two minutes is
21 that the CO2 feedbacks are too small
22 to plausibly play a significant role
23 in driving the Ice Ages?
24 DR. LINDZEN: My feeling is
25 that the CO2 effects are not as
318
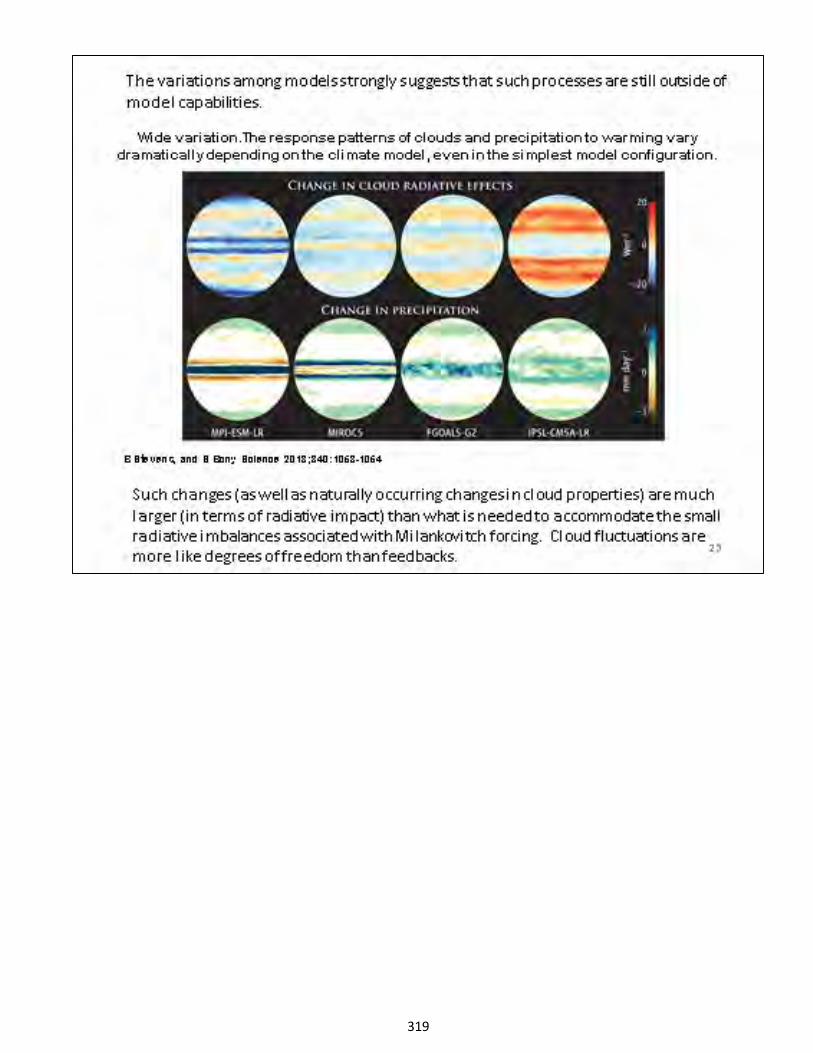
319
1 APS CLIMATE CHANGE STATEMENT REVIEW WORKSHOP
2 focused as Milankovitch.
3 Milankovitch is telling you whether
4 the ice survives or not.
5 Then you are saying, if I have
6 ice over this and it is changing the
7 thermodynamic balance, does the
8 system have the capacity adjust to
9 that? And the answer I think is
10 almost certainly yes.
11 DR. KOONIN: Good, thank you.
12 Other questions from the
13 subcommittee, comments? From our
14 experts? Ben has a question.
15 DR. SANTER: Two quick points,
16 Dick. One, you said that in the
17 observations, there is not much
18 evidence of some longer-term,
19 multiyear response to volcanic
20 eruptions.
21 We certainly see that and so
22 have many other studies, even the
23 original Christy and McNider paper
24 back in 1994 that statistically
25 removed ENSO effects from lower
320
1 APS CLIMATE CHANGE STATEMENT REVIEW WORKSHOP
2 tropospheric temperature better
3 reveals that that long tail, the long
4 goodbye.
5 And many, many studies not only
6 with satellite data but also with
7 weather balloon data show that
8 longer-term response there.
9 So, I would disagree with the
10 premise that there isn't some long
11 response in the observations.
12 DR. LINDZEN: You think it's as
13 big as these tails?
14 DR. SANTER: Well, again, we
15 tried to look at this issue.
16 DR. LINDZEN: I mean, what I
17 found was dealing with one volcano,
18 for instance, the tail was too small
19 to really be significant in the data.
20 I found that, for instance, if
21 I looked at a single volcano, given
22 the uncertainties, it was hard to
23 distinguish one sensitivity from
24 another. And people using two years
25 to distinguish were probably, I
321
1 APS CLIMATE CHANGE STATEMENT REVIEW WORKSHOP
2 thought, stretching things.
3 The only place we saw the
4 significant tail, regardless of
5 sensitivity, was the sequence of
6 volcanos. If the sequence was such
7 that one volcano came sufficiently
8 soon after another one so that the
9 response time included it, then you
10 started building a secular trend.
11 DR. SANTER: Just to follow up
12 on that, we have looked at this in
13 the same way that you have with
14 simple energy balance models and
15 looked at the expectation of volcanic
16 parameters, the maximum cooling, the
17 timing of the cooling after
18 El Chichón and what happens for
19 different plausible ranges of
20 sensitivity from one to five and a
21 half.
22 And there are many, many things
23 that you can see and may be able to
24 discern occasionally that, as I tried
25 to show there, lead me to suspect
322
1 APS CLIMATE CHANGE STATEMENT REVIEW WORKSHOP
2 there is not some real big
3 fundamental error in ocean heat
4 changes after El Chichón and
5 Pinatubo, and therefore, not some
6 fundamental error in TCR.
7 DR. LINDZEN: Perhaps; I don't
8 know.
9 DR. SANTER: The other thing
10 was, there is this paper by Piers
11 Forster, et al., that has looked at
12 this tuning issue you mentioned.
13 So, they looked at total
14 anthropogenic aerosol forcing and the
15 relationship between that and global
16 mean surface temperature changes over
17 the 20th century.
18 As you may remember, Jeff Kiehl
19 looked at this at CMIP3 and showed
20 that there was some evidence of a
21 relationship there. But Forster,
22 et al., don't find that at CMIP5.
23 So, I don't think there is strong
24 evidence --
25 DR. LINDZEN: You are saying
323
1 APS CLIMATE CHANGE STATEMENT REVIEW WORKSHOP
2 for CMIP5, the aerosol adjustments
3 are not related to the sensitivity?
4 DR. SANTER: Are not related to
5 what Forster, et al., looked at,
6 which was the size of the global mean
7 surface temperature trend over the
8 20th century. I think they looked at
9 a couple of other things as well.
10 But there was no evidence of
11 that strong functional relationship
12 that Jeff had found looking at CMIP3
13 results. This appeared a year or two
14 ago in JGR, I think?
15 DR. COLLINS: Yes.
16 DR. LINDZEN: So, you are
17 saying in CMIP5, that relation that
18 Jeff found disappeared?
19 DR. SANTER: What I am saying
20 is, there is not evidence for some
21 strong relationship between what each
22 modeling group did with anthropogenic
23 aerosol forcing, total forcing and
24 that model's global mean temperature
25 change over the 20th century.
324
1 APS CLIMATE CHANGE STATEMENT REVIEW WORKSHOP
2 DR. LINDZEN: It is something
3 that has to be looked at more closely
4 because obvious the time scales
5 differ according to the ocean
6 modeling.
7 DR. SANTER: I agree, but it's
8 a very different result from the
9 CMIP3 result.
10 DR. LINDZEN: Interesting.
11 DR. KOONIN: Bill?
12 DR. COLLINS: This is just more
13 a point of information. But I think
14 Dick shared an intriguing analysis of
15 the outgoing longwave. There is
16 quite a lot of literature on both the
17 how cloud changes in the tropics
18 occur, and in water vapor feedback.
19 So, we saw a particular aspect
20 this morning. There is a large body
21 of literature on this topic. Let me
22 just sort of end that discussion
23 there. And I think, with all due
24 respect, I think there is some
25 diversity of opinion on this topic.
325
1 APS CLIMATE CHANGE STATEMENT REVIEW WORKSHOP
2 DR. LINDZEN: It is
3 interesting. There is a large body
4 of literature there and there are
5 particularities. But I mentioned the
6 Trenberth and Fasullo paper. When you
7 break it into longwave and
8 shortwave --
9 DR. COLLINS: Which I have
10 done, yes.
11 DR. LINDZEN: -- I find it's
12 the shortwave where you have most of
13 the uncertainty.
14 DR. COLLINS: Well, in any
15 case, I just wanted to point this out
16 to the committee.
17 DR. KOONIN: Scott?
18 DR. KEMP: This is a general
19 question. You wrote down and
20 mentioned several times, and again
21 here, and that is if you assume that
22 the feedback parameter is normally
23 distributed, then you get this tail
24 in ECS?
25 DR. LINDZEN: If it's normally
326
1 APS CLIMATE CHANGE STATEMENT REVIEW WORKSHOP
2 distributed about a not high-value
3 to begin with.
4 DR. KEMP: And this is used to
5 explain why the range of ECS is
6 large. But why has the range of ECS
7 not changed since --who am I trying to
8 think of -- 1984, basically?
9 Charney. Thank you.
10 DR. COLLINS: To give you a
11 very quick answer, we don't know what
12 we can't know, and we can't go back
13 and fix a lousy observational record.
14 And it's just, we can't do it.
15 In the absence of knowing
16 having that information on how
17 aerosol radiative forcing, for
18 example, has changed over the 20th
19 century, we are stuck.
20 And that is a place where you
21 can't, with temperature, you can't go
22 back and take instruments out of the
23 Naval Observatory in Greenwich and
24 calibrate them against modern
25 instruments and figure out how the
327
1 APS CLIMATE CHANGE STATEMENT REVIEW WORKSHOP
2 temperature records, how to compare
3 bucket records from the 18th century
4 to the present day.
5 We have no such data for
6 aerosols except for high school
7 records.
8 DR. KEMP: Aerosols?
9 DR. COLLINS: Well, it's one of
10 them. I don't want to be cavalier
11 about it. But remember we are
12 looking at a situation where, in
13 essence, you are solving delta T
14 which we think we know reasonably
15 well equals lambda times delta F.
16 So, lambda equals delta T over
17 delta F. And uncertainties in
18 delta F are a problem because they
19 appear in the denominator.
20 DR. KOONIN: Ben, did you want
21 to comment?
22 DR. SANTER: I think I will
23 defer to Isaac here.
24 DR. HELD: I was going to
25 respond to the same question, because
328
1 APS CLIMATE CHANGE STATEMENT REVIEW WORKSHOP
2 I think the answer is different
3 depending on whether you are talking
4 about top-down or bottom-up
5 constraints.
6 And Bill is talking about the
7 top-down constraint. You have
8 observed warming. You are trying to
9 understand it. And there the problem
10 is aerosols. The problem is forcing,
11 basically, by definition.
12 But as far as bottom-up, I
13 think the answer is also one word.
14 It's clouds. It's clouds that
15 prevent us from fundamentally in some
16 reductive fashion understanding the
17 climate system. They are two
18 different things.
19 DR. COLLINS: Yes.
20 DR. KOONIN: Okay, good. A good
21 morning. Let us take 20 minutes to
22 grab lunch and begin eating and we
23 will do whatever else we need to do
24 and pick up about 12:30 or 12:35.
25 (Whereupon, a luncheon recess
329
1 APS CLIMATE CHANGE STATEMENT REVIEW WORKSHOP
2 was taken.)
3 DR. KOONIN: All right, we are
4 going to continue. For those of you
5 who did not get a chance to sample
6 the cookies or the brownies, in a few
7 minutes we are going to have
8 cheesecake coming in from Junior's.
9 All right, John?
10 DR. CHRISTY: It is a real
11 pleasure to be here. And I
12 particularly was pleased to see the
13 way you had framed the discussion
14 here and the questions that you had.
15 There are many that those of us
16 in the climate field do have and
17 wonder about when something like the
18 IPCC presents a report as it did.
19 My main aspect in this endeavor
20 is that I am one of those people that
21 builds climate data sets. So,
22 whether it is the digital count from
23 a microwave sensor in space or a
24 dusty archive in the UK Met office, I
25 get those data to create climate data
330
1 APS CLIMATE CHANGE STATEMENT REVIEW WORKSHOP
2 sets to basically tell us what is
3 happening with the climate as best we
4 can.
5 So, I boiled some of your
6 framing questions by this blue
7 expression here. [next page]
8 One of the things you asked is,
9 "Why did confidence regarding the
10 assertion that human influences
11 dominate the climate system increase
12 in AR5 when (A), so many of the
13 climate processes are poorly known
14 and modeled, and (B), the global
15 temperature failed to warm as
16 expected?"
17 And it kind of filtered in
18 through several of those places in
19 the framing document. And really,
20 the truth is the answer must come
21 from the convening lead authors of
22 the IPCC AR5 because I am baffled.
23 And that is exactly what I told the
24 Congressional committee just a month
25 ago.
331
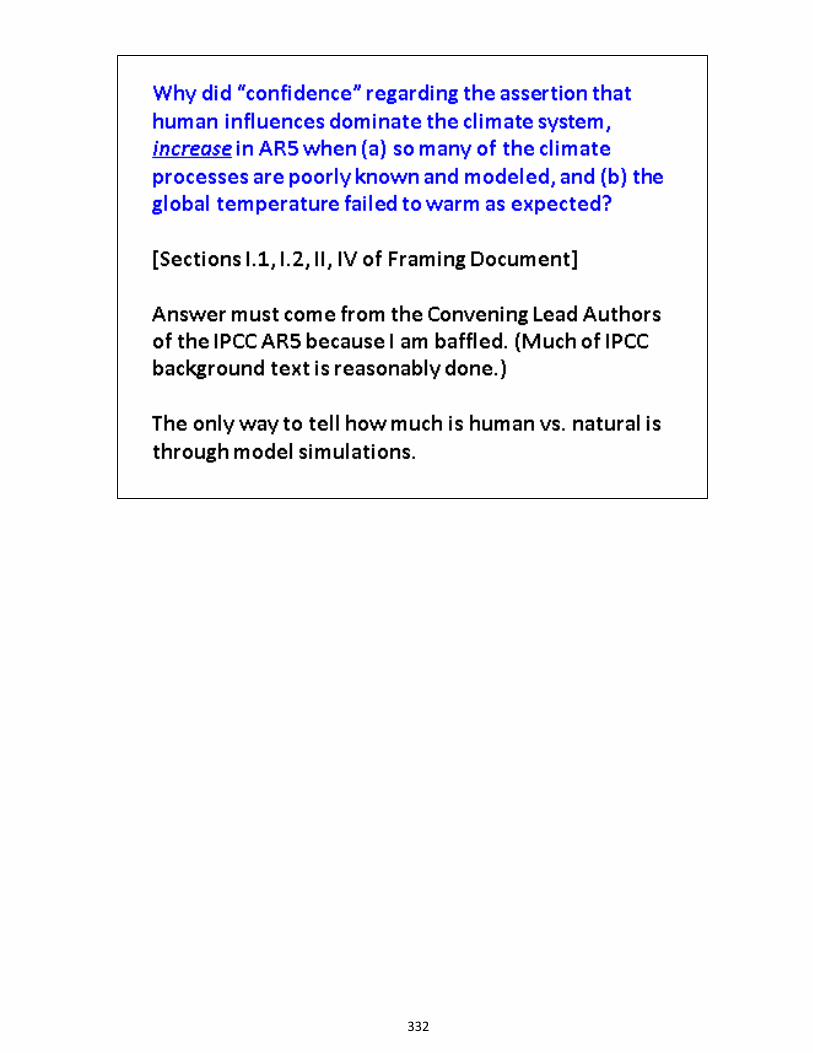
332
1 APS CLIMATE CHANGE STATEMENT REVIEW WORKSHOP
2 Now, as you probably saw much
3 of the background material and the
4 text of the IPCC was reasonable. It
5 has lots of caveats and concerns and
6 so on. But when it came down to the
7 final statements, it really wandered.
8 Well, the only way to tell how
9 much global warming is due to human
10 or natural is basically through model
11 simulations because we found out that
12 we can't put a thermometer out
13 there that will say this much
14 was due to Mother Nature and this
15 much was due to Mankind.
16 We just don't have instruments
17 like that. So, using models is the
18 way to do this.
19 And the statement [next page] that is
20 explicit in this from the IPCC is,
21 "It is extremely likely," and that
22 meant 95 percent certainty, "that
23 human influence has been the dominant
24 cause of observed warming since the
25 mid-20th century."
333
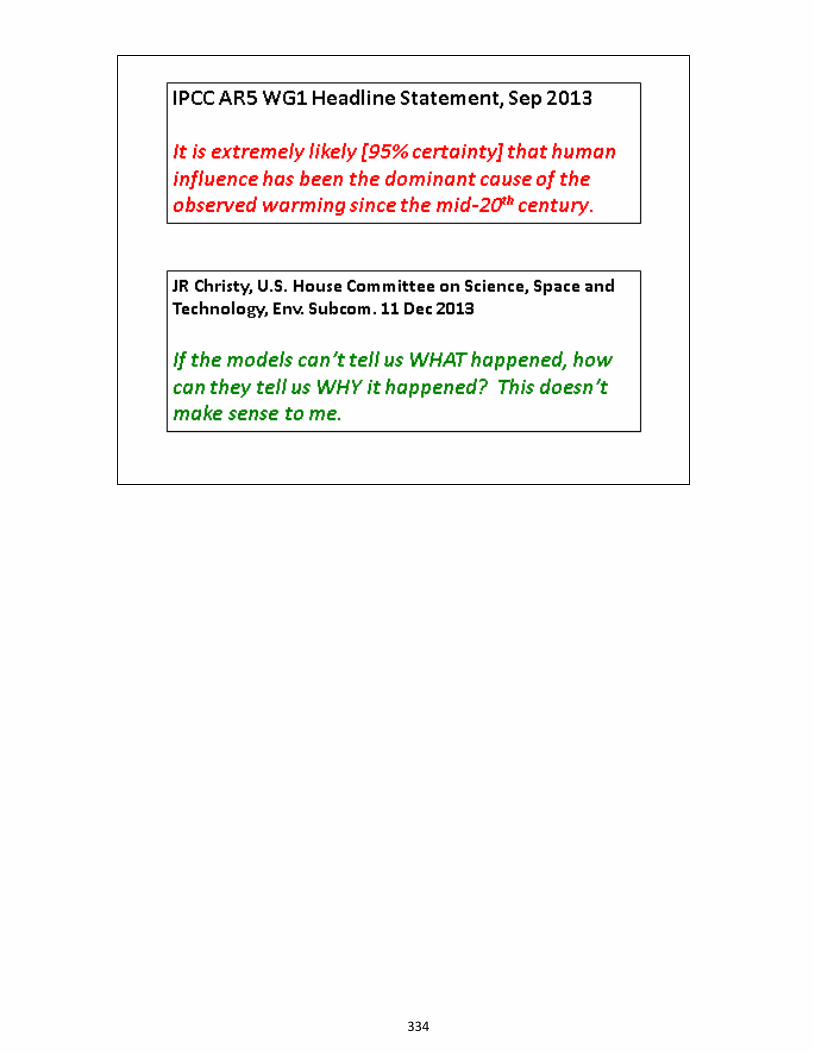
334
1 APS CLIMATE CHANGE STATEMENT REVIEW WORKSHOP
2 So, as I said a month ago, if
3 the models can't tell us what
4 happened, how can they tell us why it
5 happened? This doesn't make sense to
6 me. So, I will explain to you why
7 this doesn't make sense to me.
8 Ben showed this or a similar
9 figure to this. [next page] This is a
10 cross-section of the atmosphere, so
11 the North Pole, South Pole surface,
12 stratosphere. This is the tropics.
13 Huge amount of mass right here.
14 If you want to look at
15 something that has a greenhouse
16 signature from model simulations,
17 that would be the place to do it
18 because it has the biggest signal,
19 the most mass.
20 So, now we are talking about
21 the joules, the most joules of energy
22 that are going to affect the system.
23 And so right there it's commonly
24 called the tropical hot spot response
25 in climate models.
335
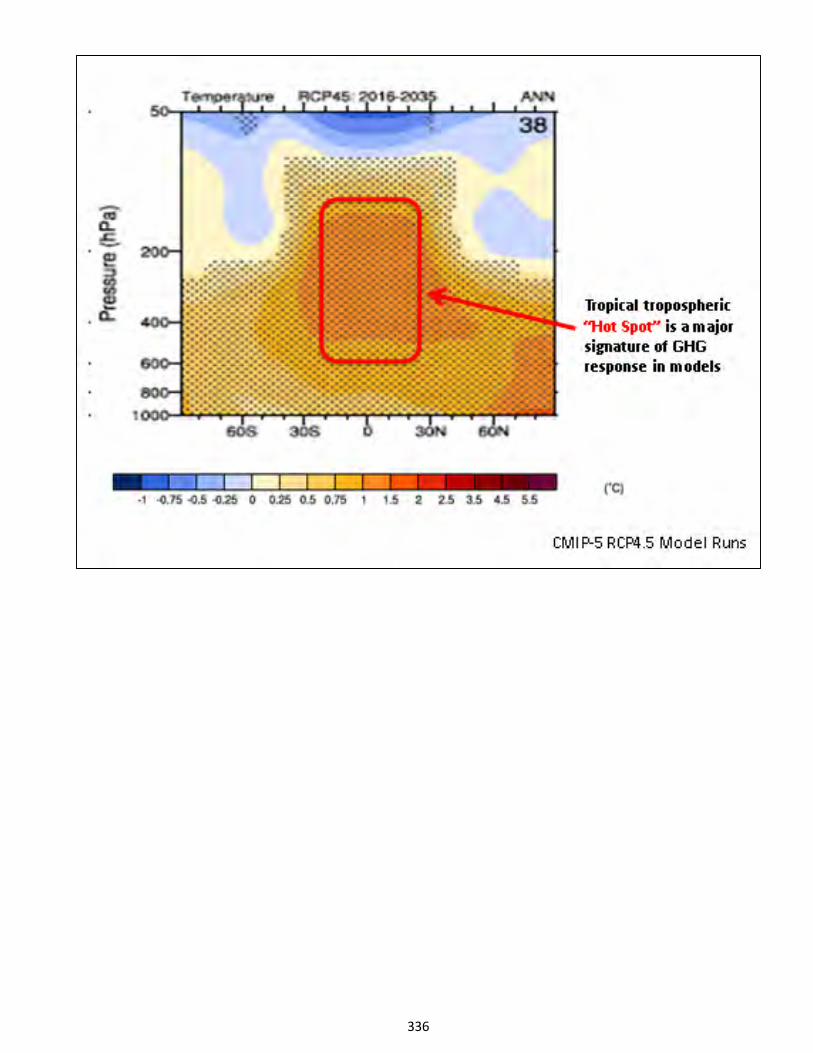
336
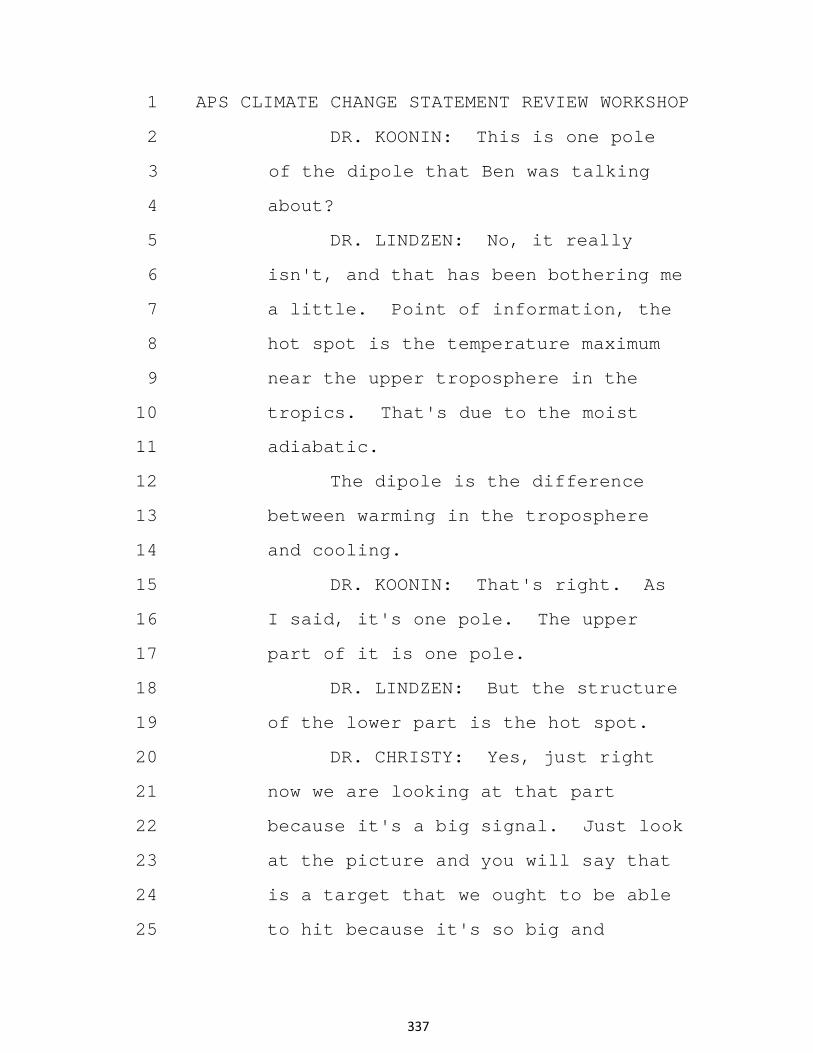
1 APS CLIMATE CHANGE STATEMENT REVIEW WORKSHOP
2 DR. KOONIN: This is one pole
3 of the dipole that Ben was talking
4 about?
5 DR. LINDZEN: No, it really
6 isn't, and that has been bothering me
7 a little. Point of information, the
8 hot spot is the temperature maximum
9 near the upper troposphere in the
10 tropics. That's due to the moist
11 adiabatic.
12 The dipole is the difference
13 between warming in the troposphere
14 and cooling.
15 DR. KOONIN: That's right. As
16 I said, it's one pole. The upper
17 part of it is one pole.
18 DR. LINDZEN: But the structure
19 of the lower part is the hot spot.
20 DR. CHRISTY: Yes, just right
21 now we are looking at that part
22 because it's a big signal. Just look
23 at the picture and you will say that
24 is a target that we ought to be able
25 to hit because it's so big and
337
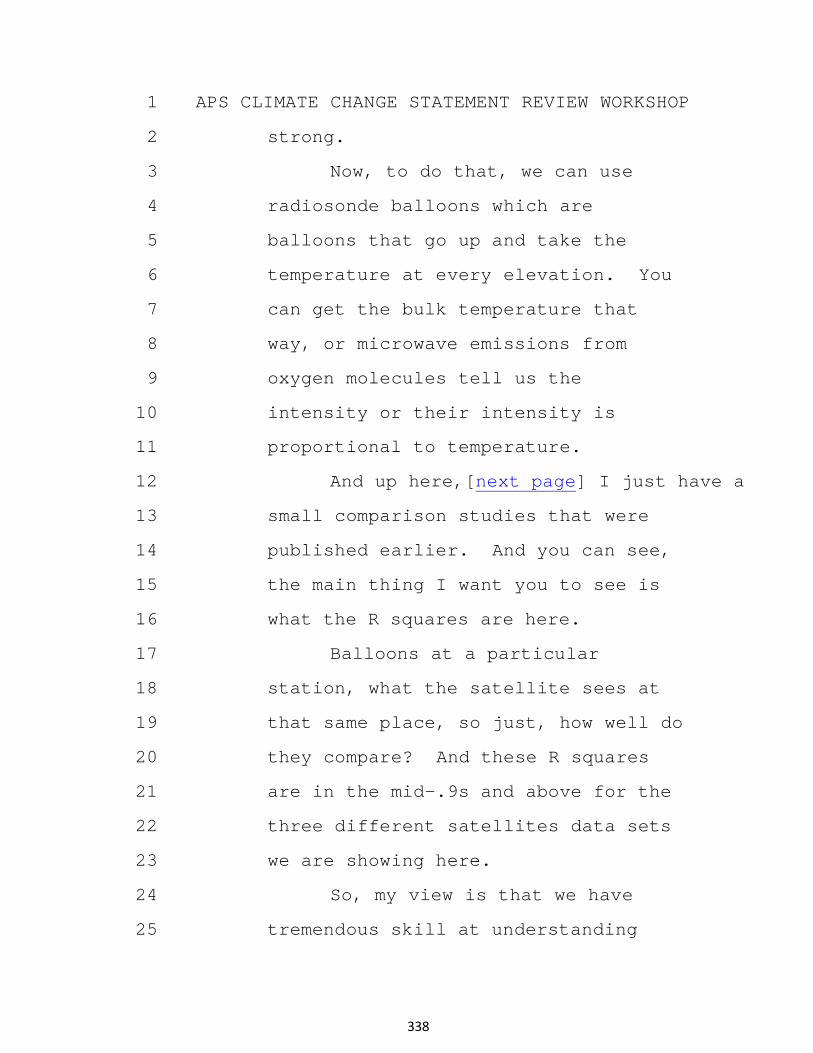
1 APS CLIMATE CHANGE STATEMENT REVIEW WORKSHOP
2 strong.
3 Now, to do that, we can use
4 radiosonde balloons which are
5 balloons that go up and take the
6 temperature at every elevation. You
7 can get the bulk temperature that
8 way, or microwave emissions from
9 oxygen molecules tell us the
10 intensity or their intensity is
11 proportional to temperature.
12 And up here,[next page] I just have a
13 small comparison studies that were
14 published earlier. And you can see,
15 the main thing I want you to see is
16 what the R squares are here.
17 Balloons at a particular
18 station, what the satellite sees at
19 that same place, so just, how well do
20 they compare? And these R squares
21 are in the mid-.9s and above for the
22 three different satellites data sets
23 we are showing here.
24 So, my view is that we have
25 tremendous skill at understanding
338
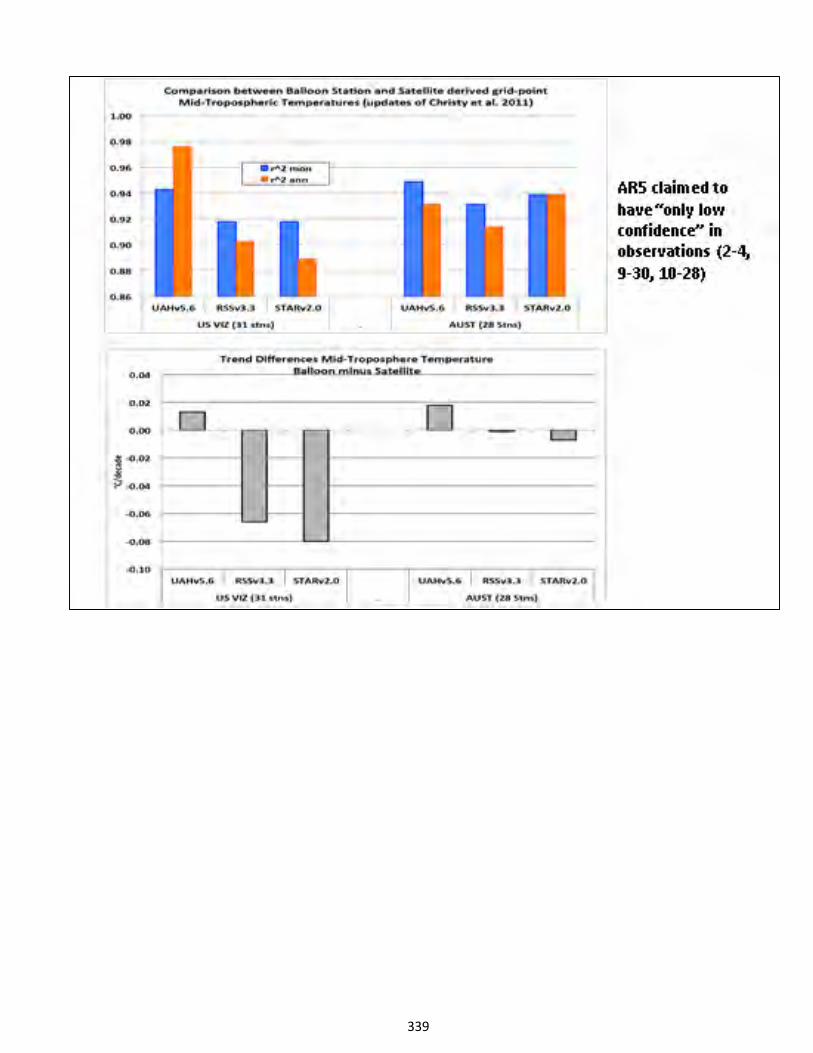
339
1 APS CLIMATE CHANGE STATEMENT REVIEW WORKSHOP
2 what the tropical tropospheric
3 temperature is doing because of these
4 kinds of independent measurements.
5 The IPCC said, however, we have
6 only low confidence in the
7 observations. And that bled into
8 later chapters where they said well,
9 the models and observations don't
10 agree, but that could largely be due
11 to poor observations.
12 But I don't think that's the
13 case. I think we do have good
14 information on observations and we
15 have pretty good confidence.
16 DR. KEMP: This is not because
17 of a question of old radiosonde data?
18 Is this comparing the old weather
19 balloon data to current data only?
20 DR. CHRISTY: No, the one on
21 the left is comparing the United
22 States VIZ stations. So, that is a
23 single type of radiosonde that was
24 launched from the tropics to
25 Port Barre, Alaska, 31 stations.
340
1 APS CLIMATE CHANGE STATEMENT REVIEW WORKSHOP
2 At those points is where we
3 take our satellites measurements as
4 well. And they line up. I mean,
5 getting an R squared of .98, for
6 atmospheric science, this is another
7 planet.
8 DR. KEMP: I thought the AR5
9 statement was related to historical
10 radiosonde data. That's what I
11 thought.
12 DR. CHRISTY: Well, these data
13 do go back to 1979 when the satellite
14 launched, so you could call them
15 historical in that sense.
16 The key thing is, IPCC is
17 correct. A lot of radiosonde data is
18 not very good at all. But where you
19 take the best radiosonde data, do the
20 comparisons with the satellite data,
21 then you get this kind of result.
22 So,[next page] let's look at climate
23 model simulations just in the simple metric
24 of linear trend from 1979 when
25 satellites started onward. And there
341
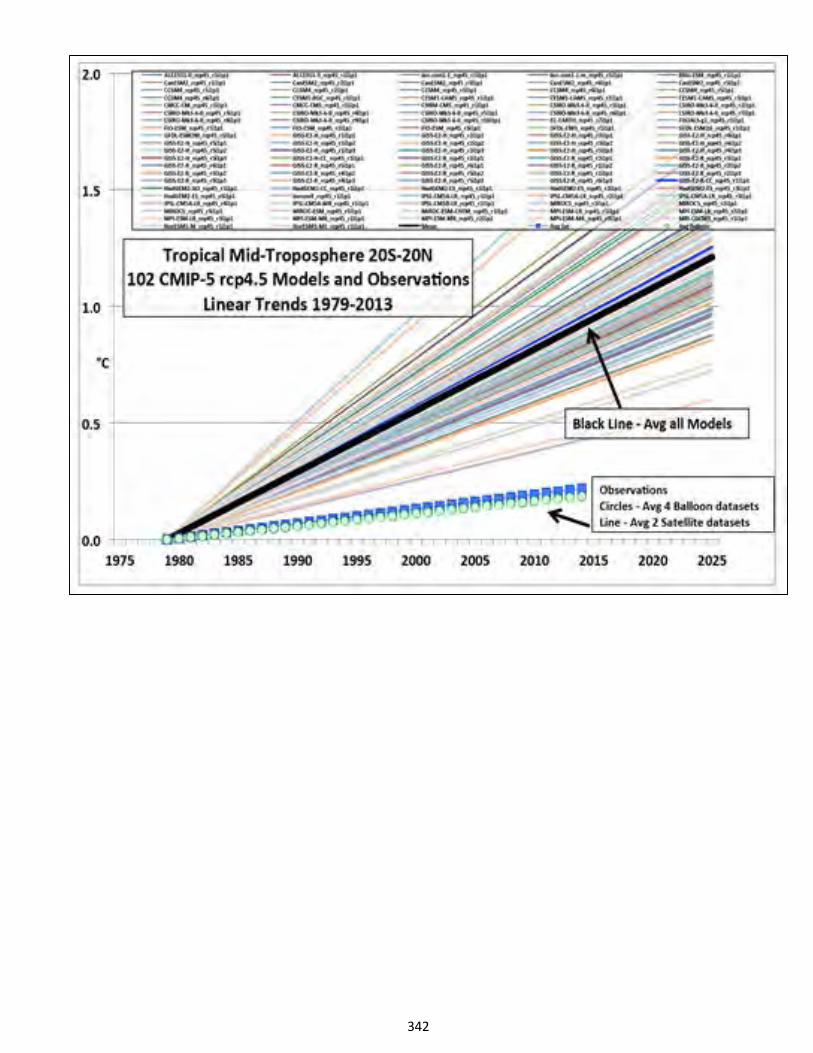
342
1 APS CLIMATE CHANGE STATEMENT REVIEW WORKSHOP
2 I have the spread of 102 RCP 4.5
3 model runs with both the balloons and
4 the satellites below.
5 In every case, all 102, they
6 are much warmer than the observations
7 showed. So, this is a 35-year trend
8 depiction. It is not a 15-year trend
9 projection. So, this is over a third
10 of a century we are looking at here.
11 And I think what you see is the
12 observations from the two independent
13 data sets are almost on top of each
14 other, whereas the models have a huge
15 spread and every single one is warmer
16 than the observations, and the
17 average is quite a bit warmer.
18 Ben?
19 DR. SANTER: Sorry, John. Are
20 the model trends plotted out to 2025?
21 Are they estimated over '79 to 2025?
22 DR. CHRISTY: Yes, they were
23 just extended from 2013.
24 DR. SANTER: So, you calculated
25 the model trends over '79 to 2025?
343
1 APS CLIMATE CHANGE STATEMENT REVIEW WORKSHOP
2 DR. CHRISTY: Yes, all trends
3 from 1979 to 2013. And those are
4 just extrapolated. But the next
5 picture will demonstrate that --
6 DR. KOONIN: Could I just go
7 back. This is RCP4.5.
8 If you used the lower one, what
9 is it, 2.8 or something like that?
10 DR. CHRISTY: They were all the
11 same.
12 DR. KOONIN: They were locked
13 in, basically?
14 DR. CHRISTY: Right. They
15 don't start diverging until about
16 2030, 2040.
17 DR. KOONIN: And again, just to
18 really emphasize what Ben asked: the
19 models have actually been run from
20 1980 to 2013, and you just extended
21 the lines up?
22 DR. CHRISTY: The models have
23 1860 to 2100.
24 DR. KOONIN: But you calculated
25 the trend in this picture?
344
1 APS CLIMATE CHANGE STATEMENT REVIEW WORKSHOP
2 DR. CHRISTY: Apples to apples
3 in this picture, apples to apples.
4 DR. SANTER: So, these are
5 synthetic MSU temperatures?
6 DR. CHRISTY: Yes.
7 DR. SANTER: That you have
8 calculated from the models?
9 DR. CHRISTY: Yes.
10 DR. SANTER: Using a global
11 mean weighting function-type
12 approach?
13 DR. CHRISTY: A tropical mean
14 weighting function which, by the way,
15 was also done with the balloons. So,
16 they were identical in that way.
17 This [next page] now gets you to the
18 five-year running average of all
19 those things, except instead of 102
20 realizations, and those were all that
21 were available to me at the time, I added
22 them together into 24 families of
23 models so that you can see how the
24 spread occurs from the different
25 families in five-year averages.
345
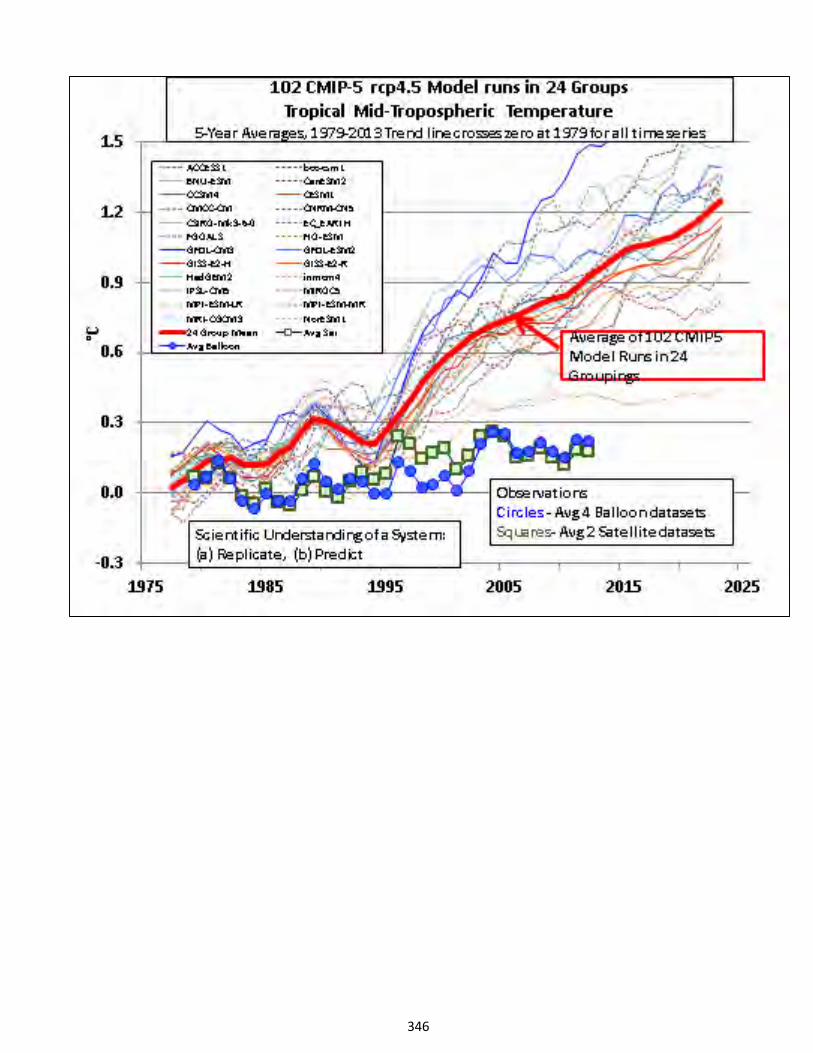
346
1 APS CLIMATE CHANGE STATEMENT REVIEW WORKSHOP
2 And I think you can see that,
3 for this particular system, there is
4 a lot of concern because none of the
5 models were able to come within the
6 range of observations there.
7 And the general rule is, if you
8 have a good, confident understanding
9 of a system, you ought to be able to
10 at least replicate what it does and
11 then predict what it does.
12 And I think can you see here
13 that really none of the models were
14 able to do that. And most, a great
15 majority of them did not do it
16 closely at all.
17 DR. KOONIN: These models also do
18 not reproduce the surface
19 temperature; is that correct?
20 DR. CHRISTY: Oh, they do.
21 DR. KOONIN: They do reproduce
22 surface temperature?
23 DR. CHRISTY: Yes. Oh, I mean,
24 they have the surface temperature in
25 them. I don't have a surface
347
1 APS CLIMATE CHANGE STATEMENT REVIEW WORKSHOP
2 temperature plotted here.
3 DR. KOONIN: I am asking
4 whether the same models reproduce
5 GMST and the error is in the vertical
6 structure, or they also do a bad job
7 on GMST?
8 DR. CHRISTY: It is not as bad
9 as this on GMST. It looks more like
10 this (indicating slide).
11 DR. KOONIN: Yes. Judy showed
12 some of that. We have some of that.
13 DR. CHRISTY: But as
14 physicists, I hope you would
15 understand what I am looking at is
16 the big, mass bulk of the atmosphere
17 where there is lots of kilograms of
18 air and lots of joules are going to
19 make a difference.
20 So, that's what you want to
21 measure, whereas I will show a little
22 later why I don't like to use surface
23 temperature for these kinds of
24 studies.
25 So, [next page] that's just taking away all
348
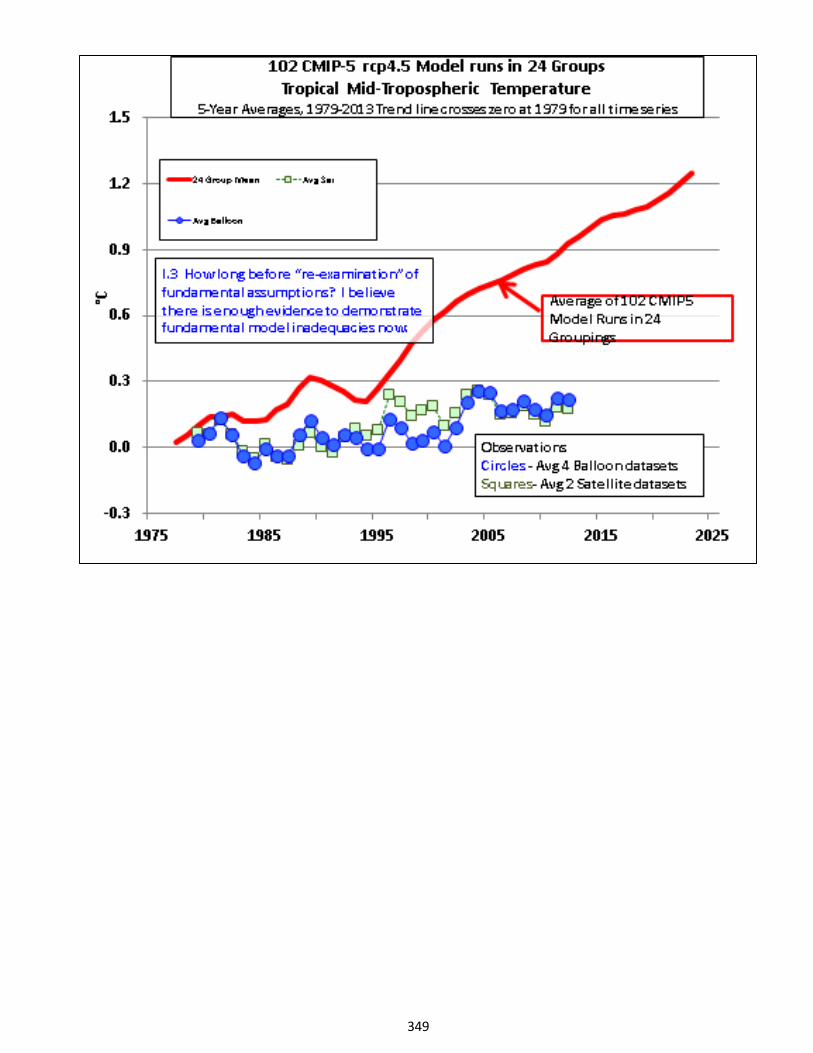
349
1 APS CLIMATE CHANGE STATEMENT REVIEW WORKSHOP
2 the different realizations and
3 showing you just the average. And I
4 think from your question 9.3, "How
5 long before reexamination of the
6 fundamental assumptions," I believe
7 we are already there, that the
8 fundamental assumptions need to be
9 examined because, before the most
10 recent 15-year hiatus occurred,
11 models were already over what the
12 atmosphere was doing.
13 DR. SEESTROM: Question, what
14 was the basis for the groupings,
15 difference science in the models?
16 DR. CHRISTY: Oh, no, the
17 organization. So, like, GFDL I think
18 had two groupings of their model
19 runs.
20 DR. KOONIN: Can you go back
21 one?
22 DR. CHRISTY: So, when you get
23 this, you can see GFDL. I have two.
24 They are the blue ones. They were
25 pretty hot, by the way.
350
1 APS CLIMATE CHANGE STATEMENT REVIEW WORKSHOP
2 DR. KOONIN: If I were to
3 phrase this in terms of TCR?
4 DR. CHRISTY: I really don't
5 want to get into that, but I have one
6 slide about that.
7 DR. HELD: The key thing is
8 tropical versus global.
9 DR. KOONIN: Right, okay, fair
10 enough, fair enough.
11 DR. HELD: It's not just the
12 vertical dimension.
13 DR. CHRISTY: The reason I
14 do the tropical is that's where the
15 signal is.
16 DR. HELD: I am just trying to
17 clarify.
18 DR. KOONIN: Good, I learned
19 something!
20 DR. CHRISTY: So, we are
21 through with that.
22 Now let's go in the vertical
23 dimension. [next page] It's still in the
24 tropics, but from the surface all the
25 way up to the stratosphere. And you
351
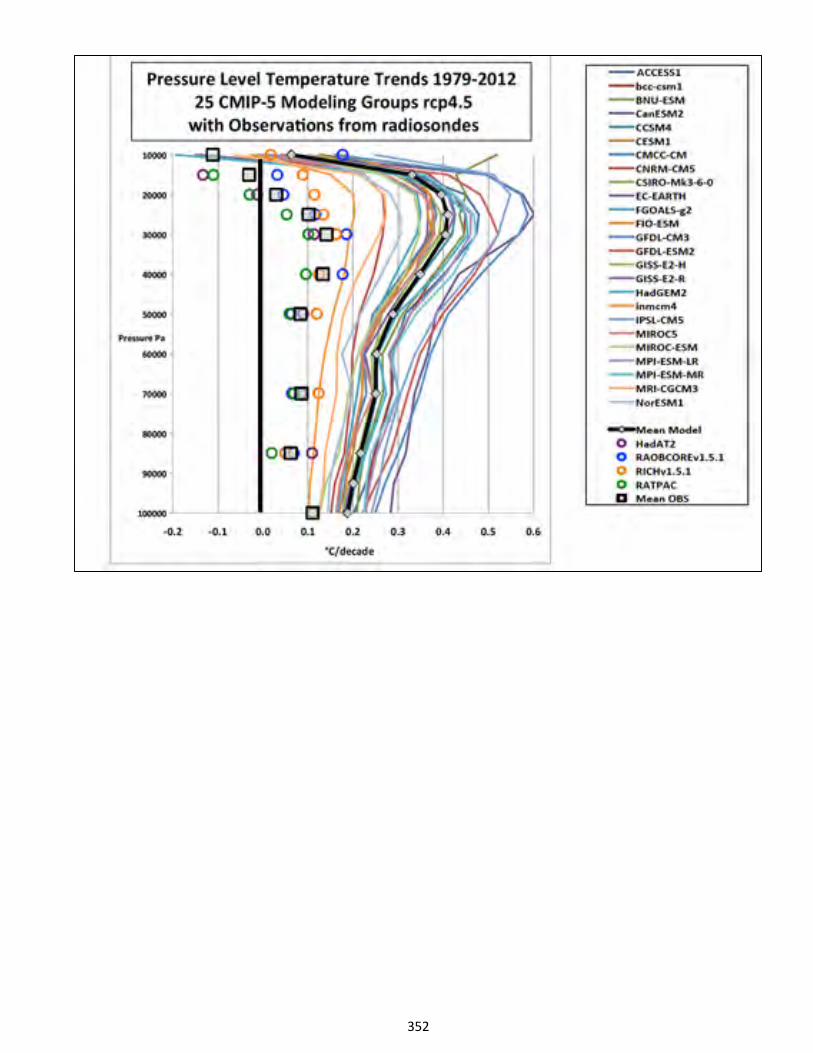
352
1 APS CLIMATE CHANGE STATEMENT REVIEW WORKSHOP
2 can see that, yes, you can say you
3 have low confidence in a balloon
4 measurement at 500 millibars because
5 at the .01-degree C per decade, you
6 have low confidence.
7 But how can you say you have
8 low confidence when all the range of
9 results are here and these are all
10 the model projections?
11 And so, I think I would fault
12 the IPCC for saying since we have low
13 confidence, we are not going to talk
14 a lot about the disagreement that we
15 see in this diagram. In my reviews,
16 I hit and hit. I wanted this picture
17 in there.
18 DR. KOONIN: Is there a diagram
19 like this in IPCC?
20 DR. CHRISTY: No. And you can
21 read and when the reviews will be
22 published sometime way down the road
23 when all of this has blown over, you
24 will see people like me and others
25 are saying please show pictures like
353
1 APS CLIMATE CHANGE STATEMENT REVIEW WORKSHOP
2 this to demonstrate where the models
3 are right now.
4 And they were pretty much
5 ignored. There was one that started
6 in 1961, but it's an odd one. No
7 satellite comparisons were done.
8 Then, what about sensitivity?
9 This [next page] is those same trends, but
10 now organized by equilibrium climate
11 sensitivity. And it's pretty simple.
12 I mean, the more sensitive the model
13 was the worse it did in terms of
14 reproducing the action.
15 And this is the entire range of
16 the observations. And I think this
17 one is too hot. That one is probably
18 too cold. But that is the entire
19 range of the observations, both
20 balloon and satellite.
21 DR. KOONIN: And the horizontal
22 axis is the global equilibrium of
23 climate sensitivity in terms of the
24 model run?
25 DR. CHRISTY: Right, right.
354
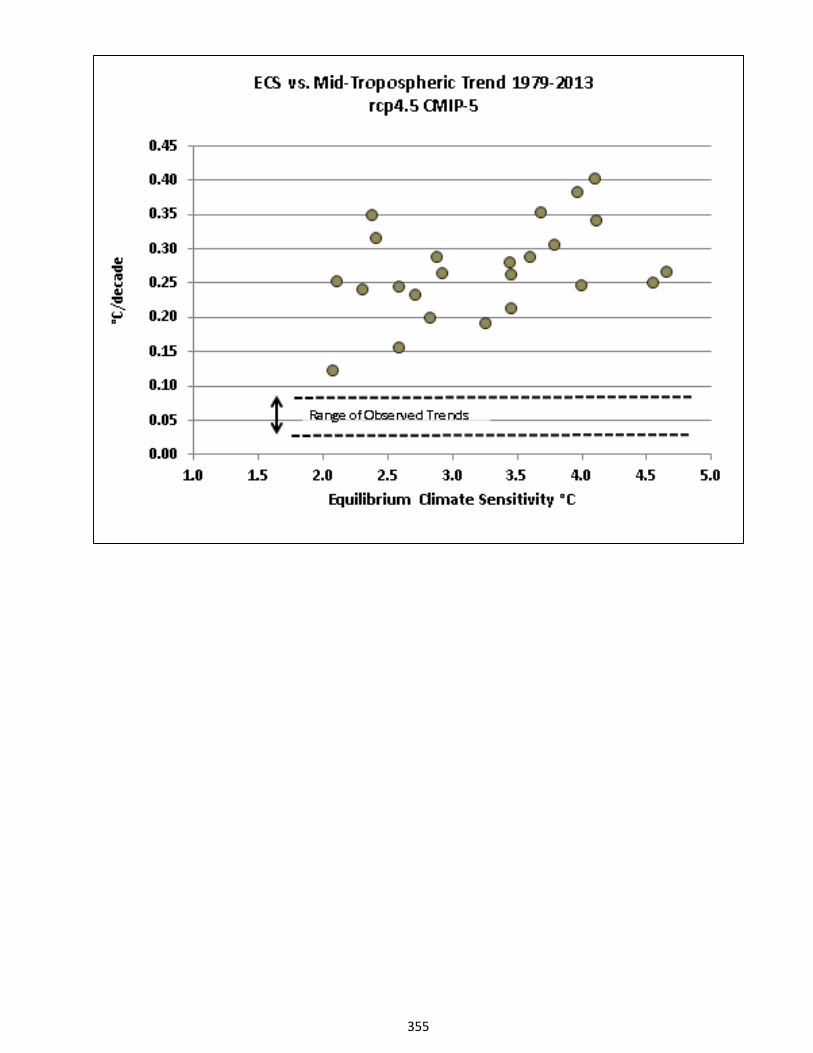
355
1 APS CLIMATE CHANGE STATEMENT REVIEW WORKSHOP
2 DR. KOONIN: It's not as great
3 a correlation, at least, as I would
4 have thought.
5 DR. CHRISTY: Well, you could
6 throw a line through it, but I
7 didn't. I did throw a line in there
8 to see where it would intersects, and
9 it didn't come out with a good
10 picture.
11 Now, Ben brought up the
12 diagnostic tool of the pattern
13 stratosphere cooling and the
14 tropospheric warming which is very
15 strong here. [next page]
16 But if you actually look at the
17 real data like this, [next page] you will
18 find that, in the stratosphere, we have
19 the warming from El Chichón and
20 Pinatubo here. And since that has
21 happened, nothing has happened. In
22 fact, the global is also no trend in
23 the last 20 years.
24 DR. KOONIN: Even the stasis,
25 while we can say 1999 or something is
356
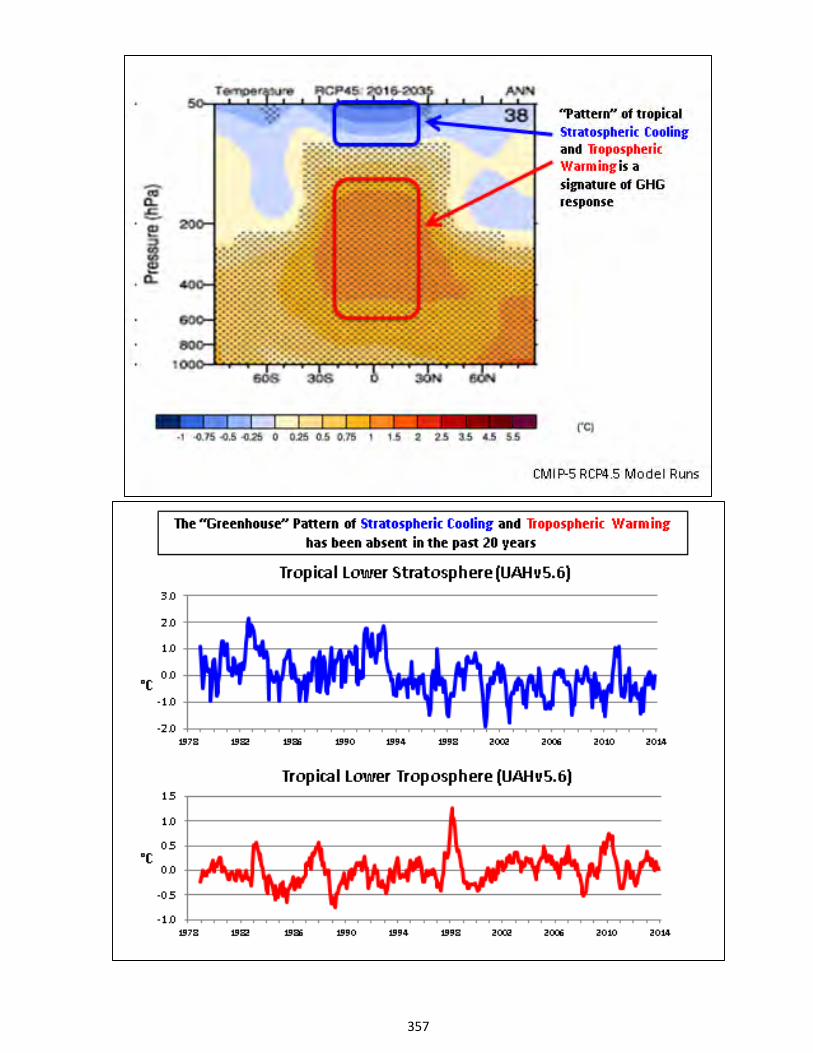
357
1 APS CLIMATE CHANGE STATEMENT REVIEW WORKSHOP
2 when the stasis started, it was
3 already dropping in --
4 DR. CHRISTY: This is
5 stratosphere. This is the cold part.
6 DR. KOONIN: Oh, sorry, okay.
7 DR. CHRISTY: So, what you do
8 see here in the tropics is, boy, lots
9 of ups and downs, a huge amount of
10 variance just explained by the
11 El Niño southern oscillation. And
12 not much has happened at all. In
13 fact, there is hardly any trend there
14 overall.
15 This [next page] is a paper by Swanson
16 I think that someone referred to
17 before. Just one of the interesting
18 conclusions -- it came out about a
19 month ago -- is that, in his
20 analysis, the CMIP5 models are worse
21 than the CMIP3 models because they
22 cluster further away from
23 observational metric.
24 This is just an odd metric.
25 But there is the metric there and the
358
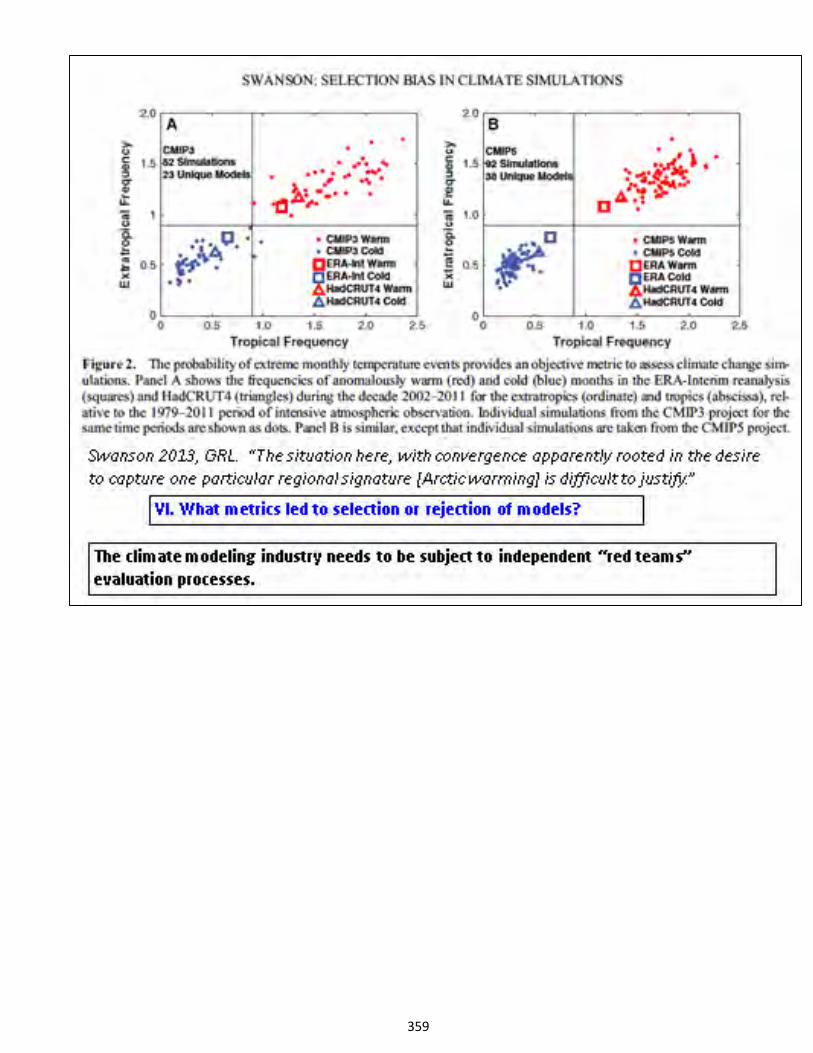
359
1 APS CLIMATE CHANGE STATEMENT REVIEW WORKSHOP
2 observations. The model results in
3 CMIP5 cluster and go away from what
4 had happened in CMIP3.
5 And so, I don't know how you
6 would select the best models under
7 something like that.
8 DR. KOONIN: One of the
9 questions comes to me as I listen to
10 the discussion about the troposphere
11 is, how important is it that the
12 models get that right?
13 To phrase it maybe in a crude
14 way, are you picking some minor
15 feature of the climate system that,
16 okay, it doesn't really matter
17 whether you get it right or not, or
18 is this kind of the nut of the
19 problem we are talking about?
20 DR. KEMP: Can I add onto that?
21 If the stratosphere cooling is the
22 signature, but you are going back
23 further, I was just trying to figure
24 out if you would expect it to
25 disappear with the stasis if the
360
1 APS CLIMATE CHANGE STATEMENT REVIEW WORKSHOP
2 stasis were to perform internal
3 variability?
4 DR. CHRISTY: Well, what
5 surprises me is this doesn't have a
6 more downward trend because of the
7 ozone issue. That is really what is
8 driving it.
9 DR. LINDZEN: What height is
10 that?
11 DR. CHRISTY: That's about 70,
12 60 millibars is the average. It has
13 a piece of the troposphere in it.
14 DR. KOONIN: Could I get a
15 clean response to the question I
16 asked without Scott's addendum? Do
17 you think that the models don't reproduce
18 the observations?
19 DR. CHRISTY: That was what I
20 tried to -- well, no, let's just go
21 right to it.
22 DR. KOONIN: The answer is
23 "yes"?
24 DR. CHRISTY: That's the
25 biggest target you have to shoot at.
361
1 APS CLIMATE CHANGE STATEMENT REVIEW WORKSHOP
2 And what I would say is that there
3 have been 112 shots, 110 shots taken
4 at that target and they all shot
5 high. And yet you come up and say,
6 we have more confidence than we are
7 getting it right. It doesn't make
8 sense to me.
9 DR. KOONIN: Okay.
10 DR. CHRISTY: What about
11 natural variability, their magnitudes
12 and roles in the recent climate?
13 [next page] You mentioned this in
14 these sections here.
15 The IPCC states, "There is low
16 confidence in explaining the stasis."
17 And I am right there with them. I
18 can't explain it for you either.
19 My comment to the committee
20 when something like that was asked to
21 me a month ago was, "Mother Nature
22 has within her all the necessary
23 tools to generate extreme events that
24 exceed what we have seen in the past
25 50 years."
362
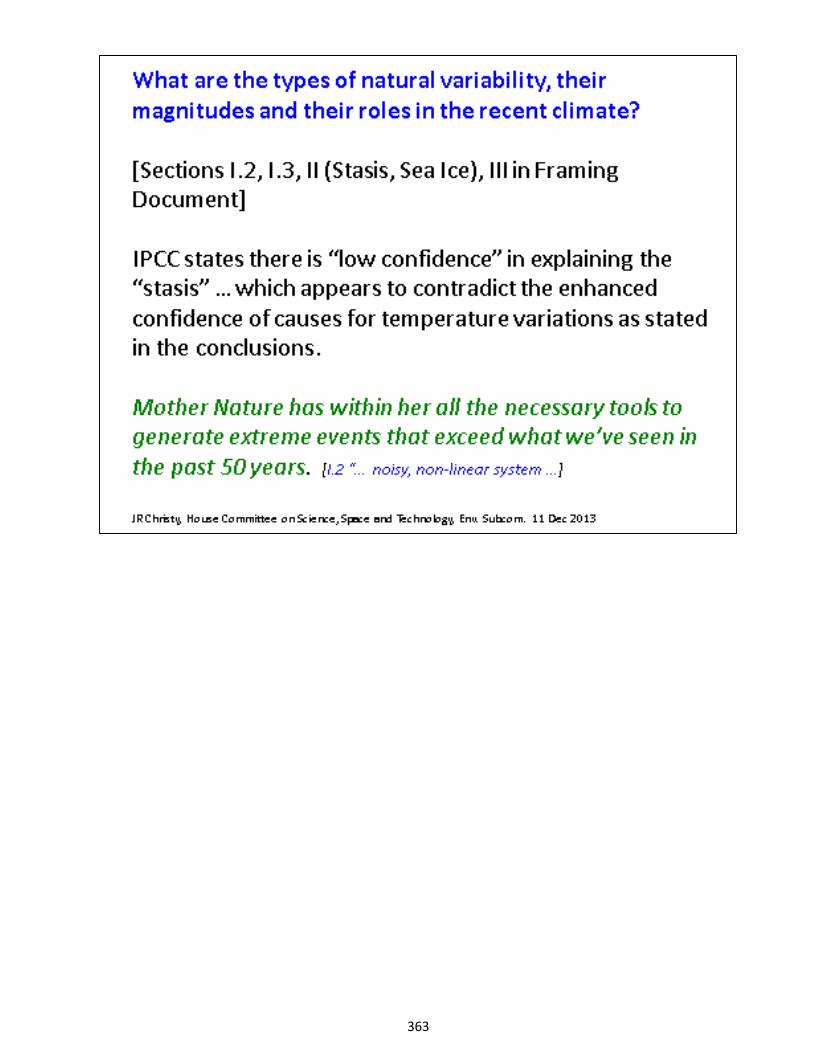
363
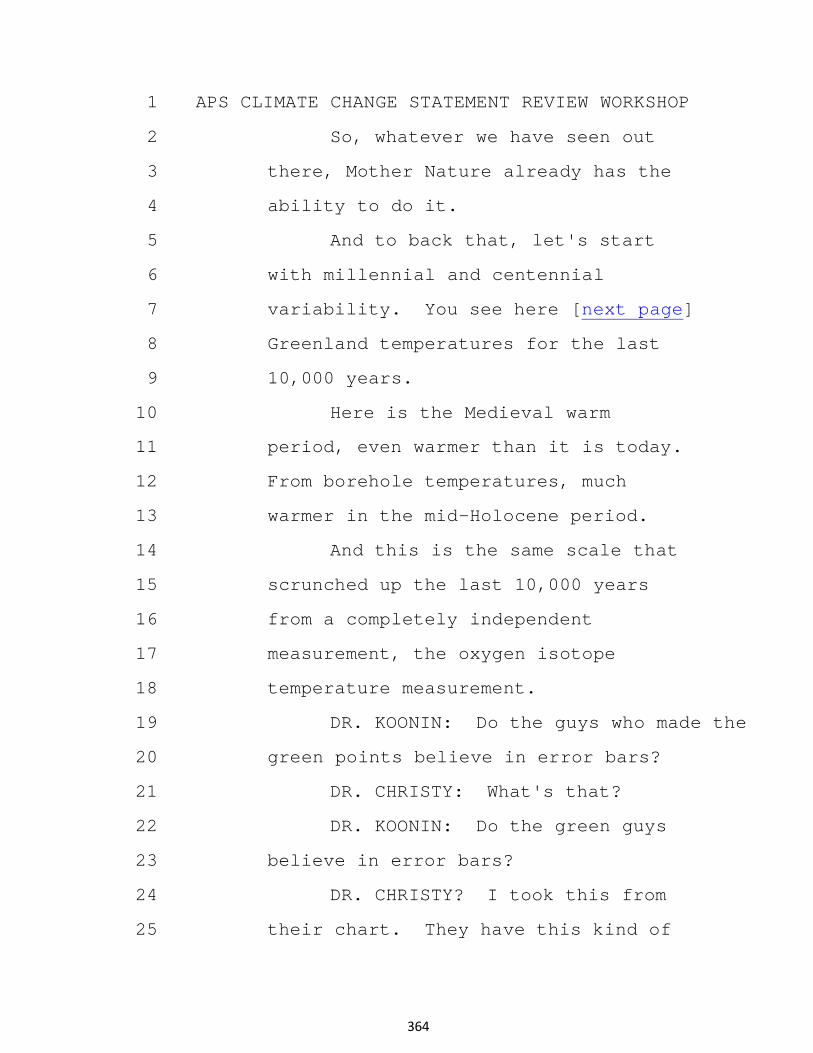
1 APS CLIMATE CHANGE STATEMENT REVIEW WORKSHOP
2 So, whatever we have seen out
3 there, Mother Nature already has the
4 ability to do it.
5 And to back that, let's start
6 with millennial and centennial
7 variability. You see here [next page]
8 Greenland temperatures for the last
9 10,000 years.
10 Here is the Medieval warm
11 period, even warmer than it is today.
12 From borehole temperatures, much
13 warmer in the mid-Holocene period.
14 And this is the same scale that
15 scrunched up the last 10,000 years
16 from a completely independent
17 measurement, the oxygen isotope
18 temperature measurement.
19 DR. KOONIN: Do the guys who made the
20 green points believe in error bars?
21 DR. CHRISTY: What's that?
22 DR. KOONIN: Do the green guys
23 believe in error bars?
24 DR. CHRISTY? I took this from
25 their chart. They have this kind of
364
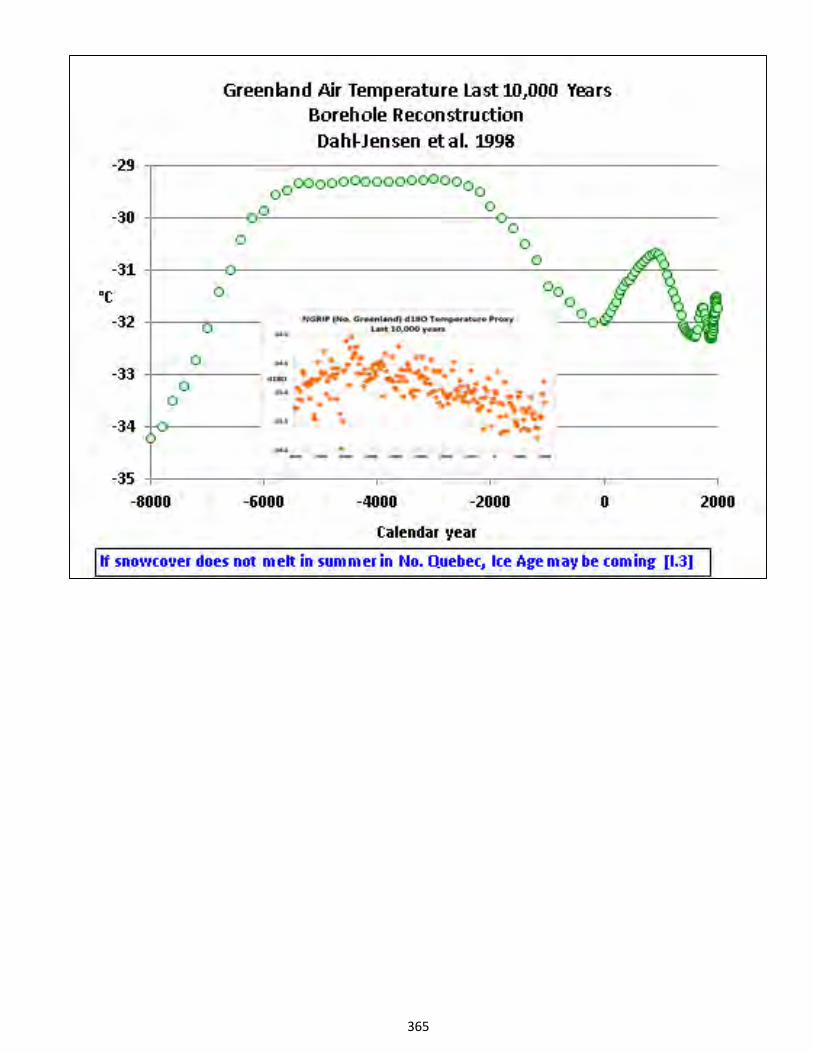
365
1 APS CLIMATE CHANGE STATEMENT REVIEW WORKSHOP
2 thing going with it, but I did it
3 really fast.
4 DR. KOONIN: Okay, but they do.
5 DR. CHRISTY: But this is
6 outside the error from this. So, as
7 we mentioned earlier, your question
8 9.3, "If snow cover does not melt in
9 the summer in northern Québec, Ice
10 Age might be coming."
11 That was millennial/centennial
12 scale. Here [next page] is sort of a
13 centennial scale in terms of climate. This
14 is drought and water resource problems.
15 This is from the Colorado River
16 flow. And you see in the past there
17 have been centuries that the
18 so-called megadroughts, 11th, 12th
19 13th century shown here in a
20 tree-ring reconstruction as well,
21 huge droughts that occurred.
22 But I like this picture the
23 best. I like to show two because
24 these are taken in Alpine Lakes in
25 California in the Sierra Nevada that
366
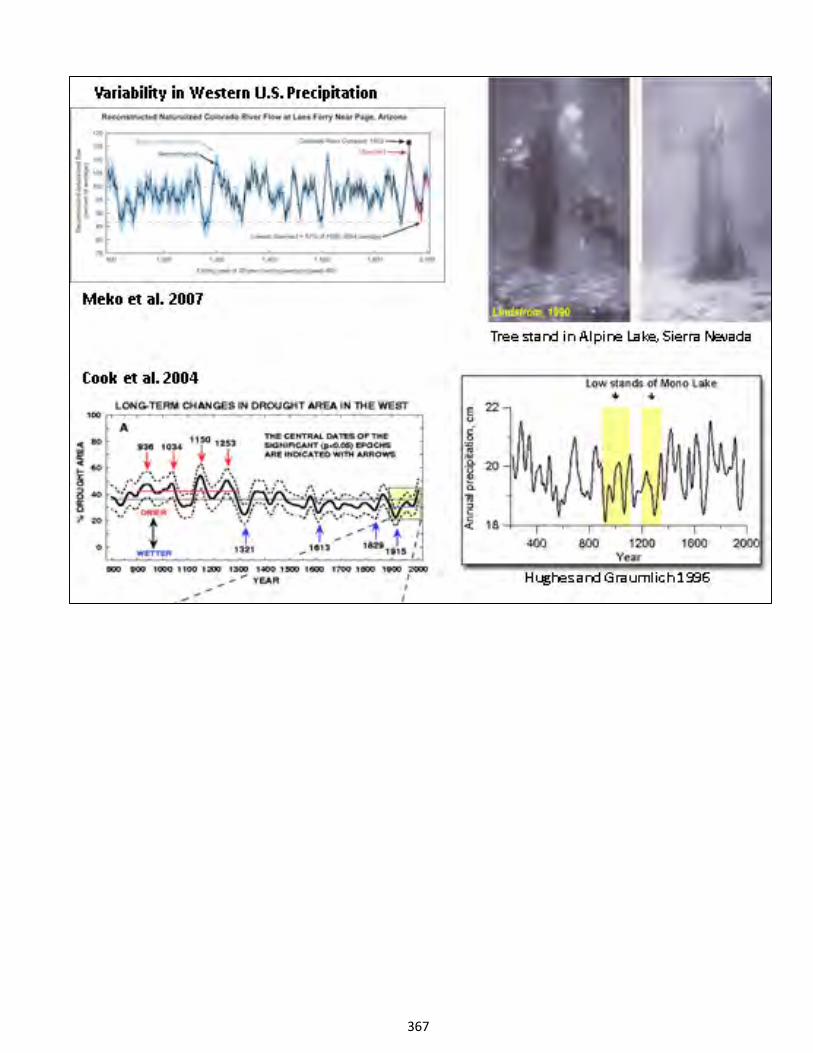
367
1 APS CLIMATE CHANGE STATEMENT REVIEW WORKSHOP
2 shows trees grew on what are now
3 lakes.
4 It was so dry for so long back
5 in the megadrought 900 years ago that
6 huge conifers grew year after year,
7 hundreds of years old, or a hundred
8 old, that shows climate or Mother
9 Nature has huge centennial-scale
10 things going on with it as well.
11 We were talking about 60-year
12 scales and 30-year. Millennial,
13 100-year scales are going on in the
14 background as well.
15 Let's go down to Antarctica.
16 This [next page] paper is about a month old
17 as well. 300 years of West Antarctic
18 temperatures here and you see
19 variability down there is huge.
20 I mean, year to year, it just
21 goes up and down. But there is also
22 this decadal variability you see
23 quite strongly here. And most
24 recently, it's actually come down a
25 bit.
368
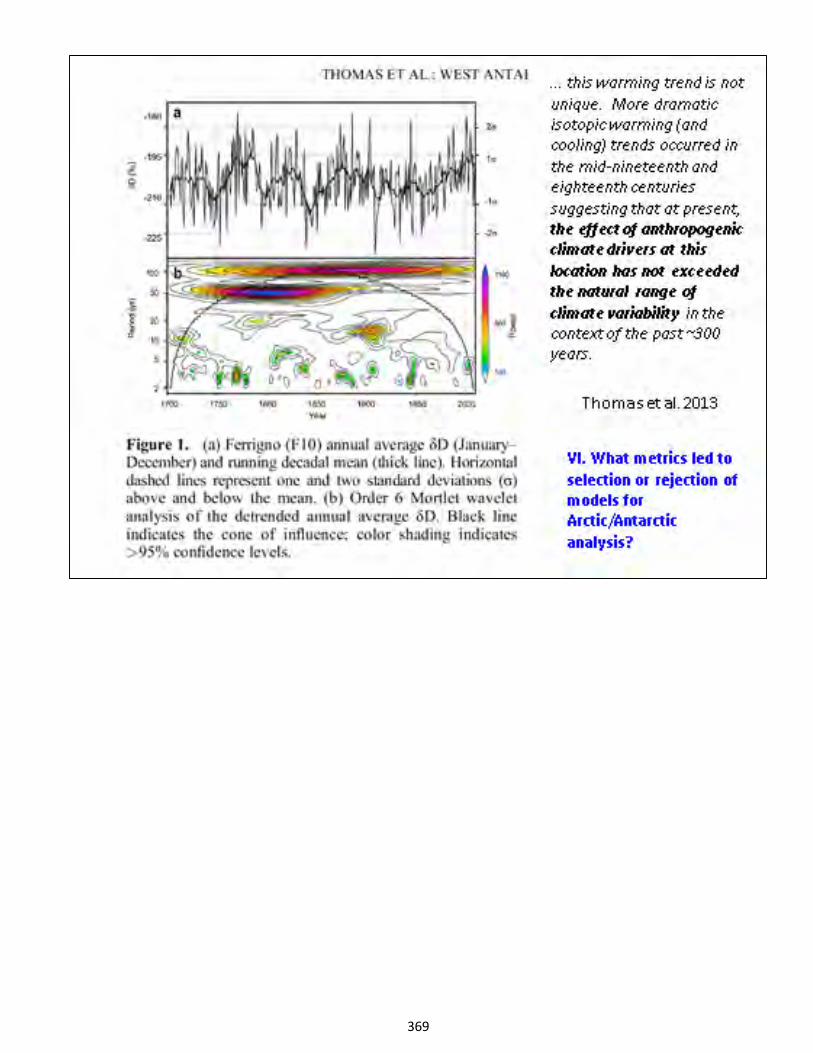
369
1 APS CLIMATE CHANGE STATEMENT REVIEW WORKSHOP
2 The authors just said you can't
3 see any kind of greenhouse gas signal
4 at all in the temperature scale.
5 It's gotten hotter. It's warmed
6 faster in the past than it has now.
7 And so, as I like to say when I
8 am talking in some venues, in terms
9 of a legal system, it's very hard to
10 convict carbon dioxide of a crime
11 here when you can go back and see the
12 same crime committed when there was
13 no way carbon dioxide could have been
14 the one forcing the crime.
15 It's a very expectative
16 defendant argument, by the way.
17 DR. KOONIN: Do we understand
18 who the perpetrators were in the
19 previous incidents?
20 DR. CHRISTY: Natural
21 variability. All I would say is
22 Mother Nature. That's right. I
23 don't know.
24 But I think -- I am back to my
25 original thing -- what has happened
370
1 APS CLIMATE CHANGE STATEMENT REVIEW WORKSHOP
2 with the climate system? We can say
3 these kinds of things happened in the
4 past where carbon dioxide was not the
5 driver.
6 Then going down to, say, a
7 smaller scale, a couple of years, I
8 built this [next page] data set
9 from snowfall records when I heard that
10 some predictions were that by now, the
11 snowfall in California should have
12 pretty much gone away at the lower
13 elevations and so on.
14 And so I built a data set. I
15 actually got the Southern Pacific
16 Railroad records because way back in
17 1878, they had to know how much snow
18 was there before the sent the trains
19 over the pass. So, they were just
20 meticulous in the records they kept.
21 So, I was able to build long,
22 130-year time series which don't show
23 any loss in terms of snow. But you
24 can see that you have four- or
25 five-year periods of huge droughts
371
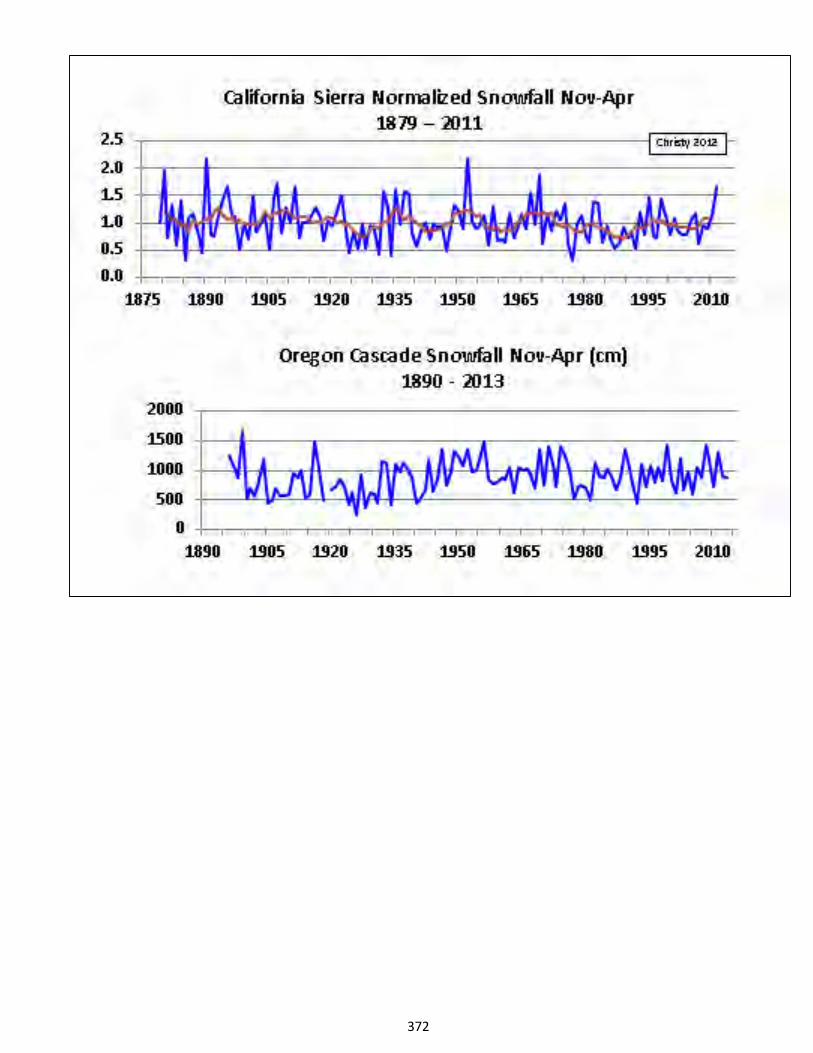
372
1 APS CLIMATE CHANGE STATEMENT REVIEW WORKSHOP
2 that happen, single years followed by
3 other years that are hugely wet.
4 When this year comes in, this
5 looks like another 1977 right now out
6 in California. It's just very, very
7 dry right now.
8 Cascades, also same sort of
9 thing that the interannual
10 variability is huge. It is the
11 biggest signal for metrics like this
12 with which the population has to
13 contend.
14 Now, [next page] the last section I
15 have is what affects the surface
16 temperature? You kind of addressed that
17 in a couple of your questions. And I
18 don't think -- well, I do think it's
19 a poor proxy for assessing what the
20 thermal content of the climate system
21 is.
22 Surface temperature is just
23 something measured about a meter and
24 a half off the ground. When I showed
25 you the satellite balloon thing,
373
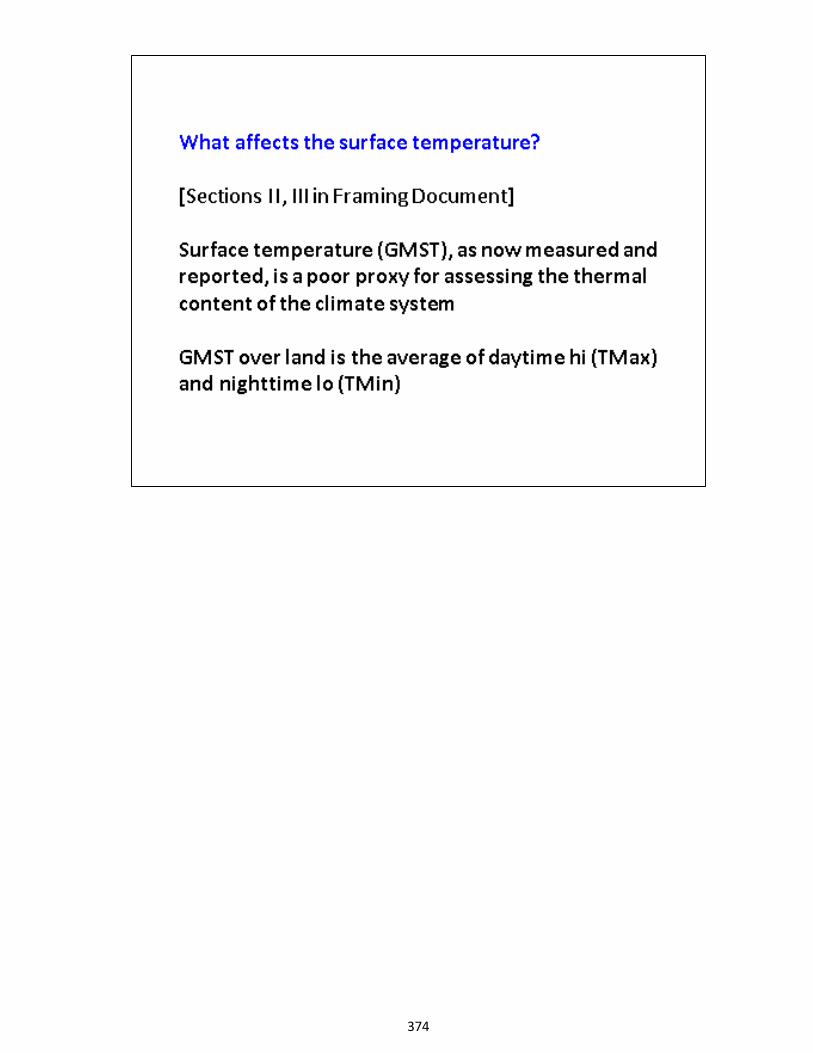
374
1 APS CLIMATE CHANGE STATEMENT REVIEW WORKSHOP
2 there were volumes, massive
3 atmosphere was being used in that.
4 And I will show you why for
5 land, GMST over land is the average
6 of the daytime high which you are all
7 familiar with, and the nighttime low,
8 which around here last night was
9 something like eight degrees or
10 something like that.
11 And here is the problem. [next page] In
12 a pristine situation, the general rule
13 is that, at night, the boundary layer
14 decouples from the air above. It
15 cools by radiation rapidly. It
16 settles.
17 And so, you have two types of
18 atmospheres. You have the cold
19 boundary layer. And that's where the
20 thermometer shelter is. It's in the
21 cold boundary layer. The air doesn't
22 change temperature up here much at
23 all.
24 The daytime, however, when you
25 have heating of the surface and
375
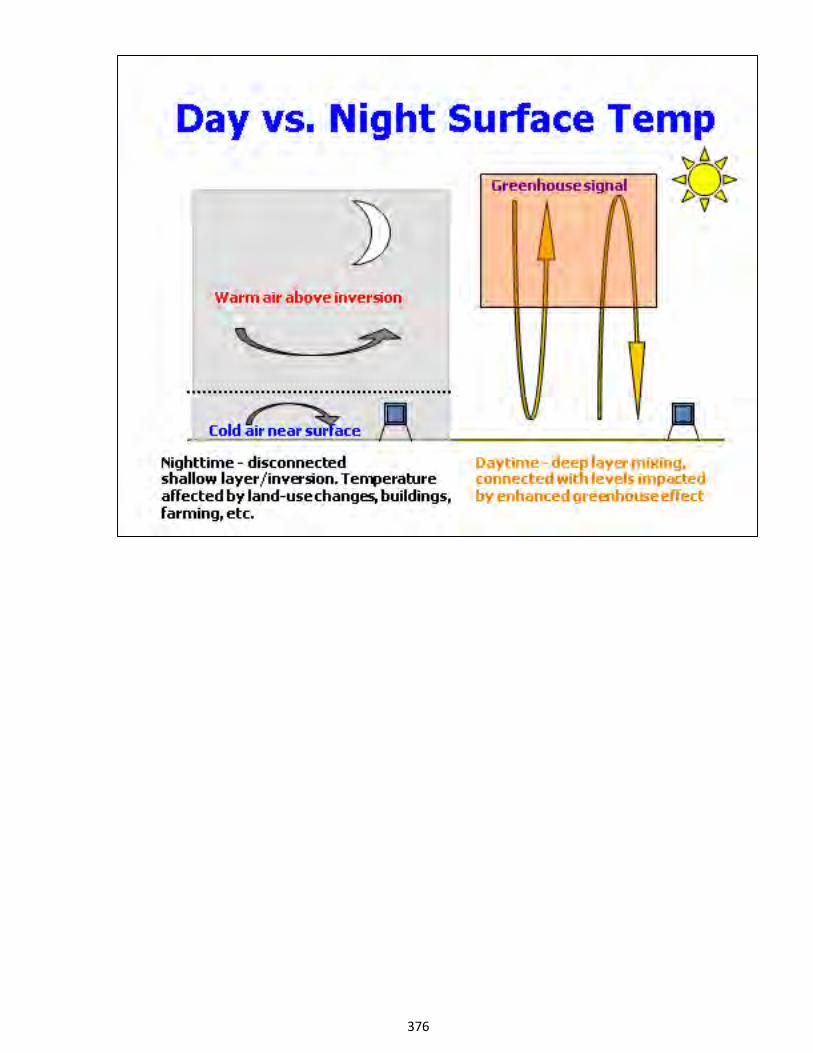
376
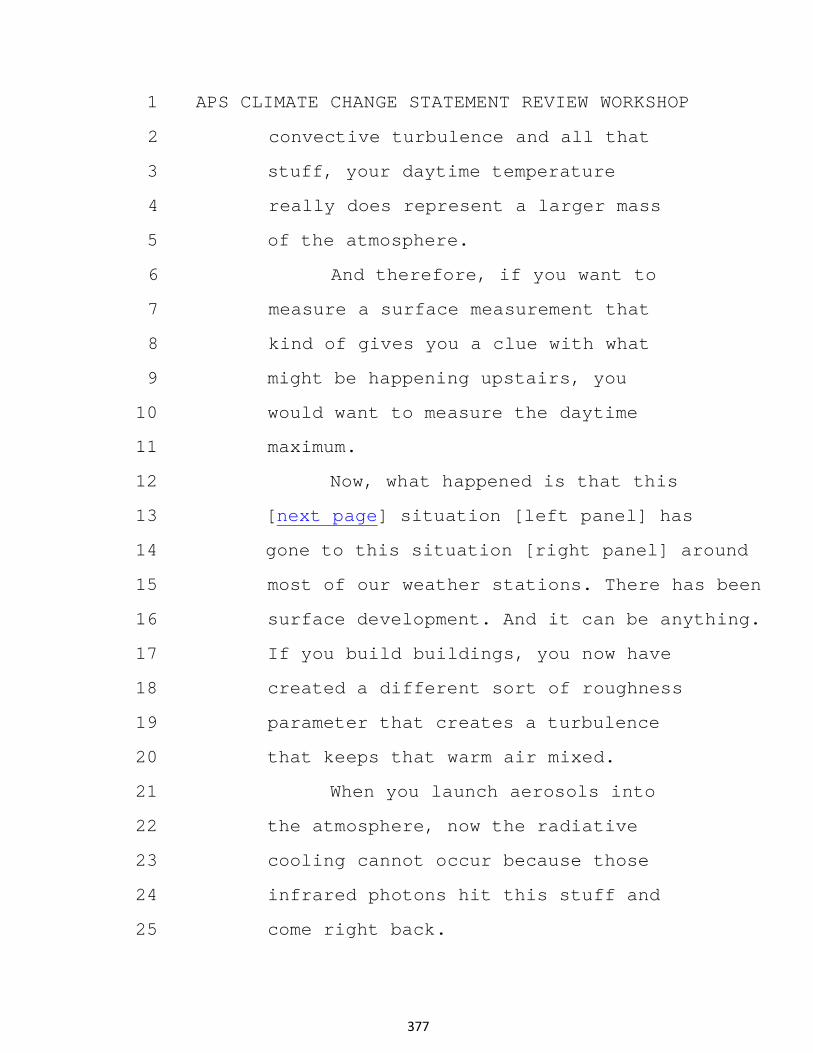
1 APS CLIMATE CHANGE STATEMENT REVIEW WORKSHOP
2 convective turbulence and all that
3 stuff, your daytime temperature
4 really does represent a larger mass
5 of the atmosphere.
6 And therefore, if you want to
7 measure a surface measurement that
8 kind of gives you a clue with what
9 might be happening upstairs, you
10 would want to measure the daytime
11 maximum.
12 Now, what happened is that this
13 [next page] situation [left panel] has
14 gone to this situation [right panel] around
15 most of our weather stations. There has been
16 surface development. And it can be anything.
17 If you build buildings, you now have
18 created a different sort of roughness
19 parameter that creates a turbulence
20 that keeps that warm air mixed.
21 When you launch aerosols into
22 the atmosphere, now the radiative
23 cooling cannot occur because those
24 infrared photons hit this stuff and
25 come right back.
377
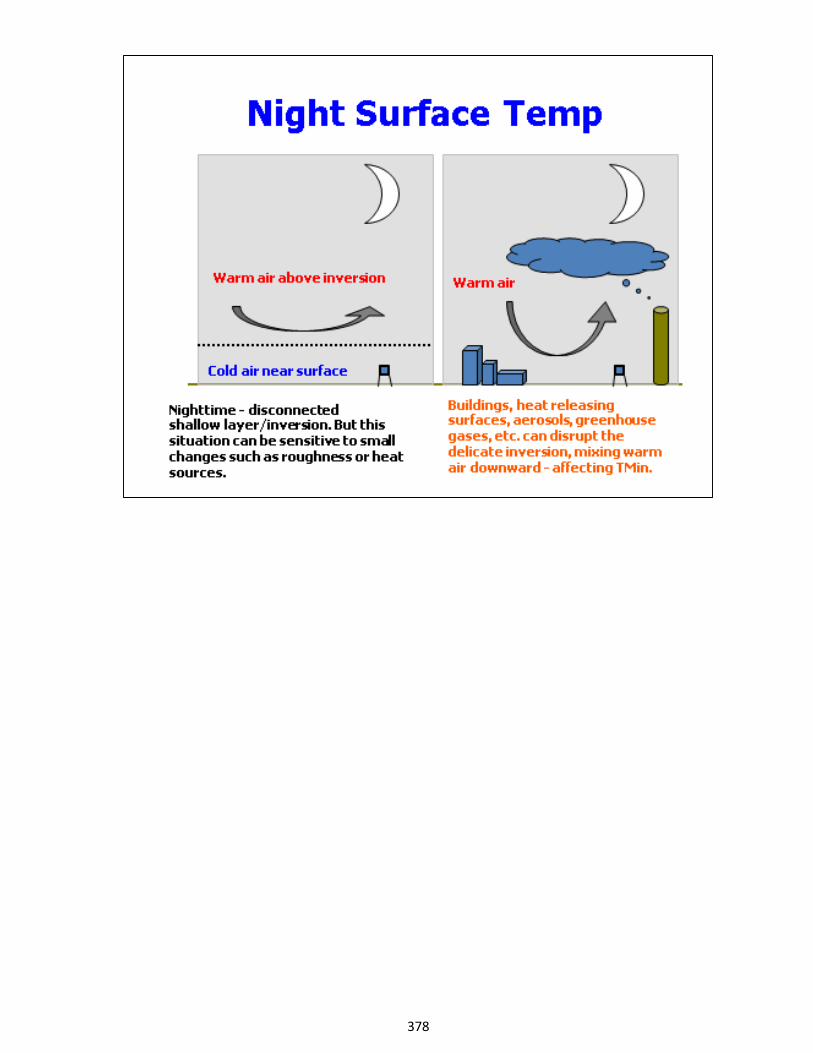
378
1 APS CLIMATE CHANGE STATEMENT REVIEW WORKSHOP
2 Tremendous issue in the
3 developing world. And I lived in
4 Kenya for a while. And every night,
5 they would light up the cook fires,
6 the dung fires and so on and you
7 would see that pall of aerosol.
8 Well, that's where all the
9 measurements nearly are being taken.
10 So, that system affects irrigation.
11 DR. KOONIN: John, I thought
12 that the BEST folks did a pretty
13 thorough study of urban heat island
14 and convinced themselves and me, at
15 least.
16 DR. CHRISTY: I cannot
17 reproduce their results. I tried and
18 the type of warming they have, and I
19 will show you in Africa, I just can't
20 reproduce it. I don't know what they
21 are doing there.
22 So, let's just go to
23 California, my home state. This [next page]
24 is San Joaquin Valley. And you can see
25 this green. I don't know. The
379
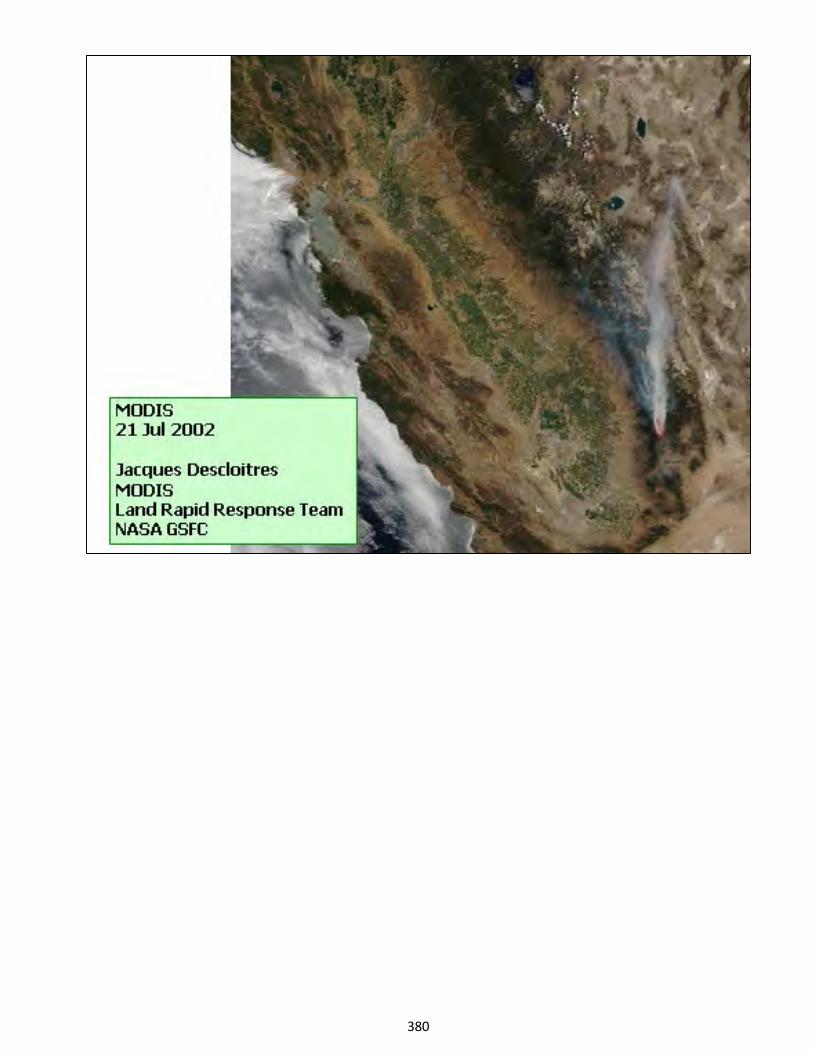
380
1 APS CLIMATE CHANGE STATEMENT REVIEW WORKSHOP
2 colors might not be too great there.
3 This is the Pacific Ocean, Sierra
4 Nevada here, very developed.
5 This should be that color right
6 there. Before human habitation, it
7 was a desert. It is a desert. I
8 used to chase tumbleweeds when I was
9 a kid growing up here.
10 So, this surface has been
11 changed significantly. And so, I
12 thought this is a good experiment. I
13 will build a data set here of what's
14 happening in the valley versus what's
15 happening in the foothills right
16 next. That's an experiment-control
17 kind of thing.
18 This took me a long time,
19 years, because I had to go through
20 something like 1,500 pages, physical
21 pages of information about the data,
22 about the instrument that took
23 temperature in various places.
24 So, I would read about we moved
25 the thermometer shelter 20 feet
381
1 APS CLIMATE CHANGE STATEMENT REVIEW WORKSHOP
2 because a sprinkler was hitting in
3 the afternoon watering time.
4 Or a great story about a guy in
5 Sequoia National Park up in the
6 mountains. And he said the forest
7 ranger wouldn't let us put up the
8 white screen that reflects sunlight
9 in order to measure the temperature.
10 We had to paint it dark green
11 to match the forest which, you know,
12 that's a problem for temperature
13 measurement. So, all that stuff I
14 read through and took care of.
15 So, I built these data sets.
16 And what we find, experiment, this
17 [next page] is the trend in the valley
18 [upper panel], with the actual annual
19 temperatures. This was in the foothills
20 right next to it. So you see, when you
21 disturb the surface by building buildings,
22 having farmland, I mean, those crops
23 are green and they are wet.
24 And so, that sun is just
25 absorbed all day long because there
382
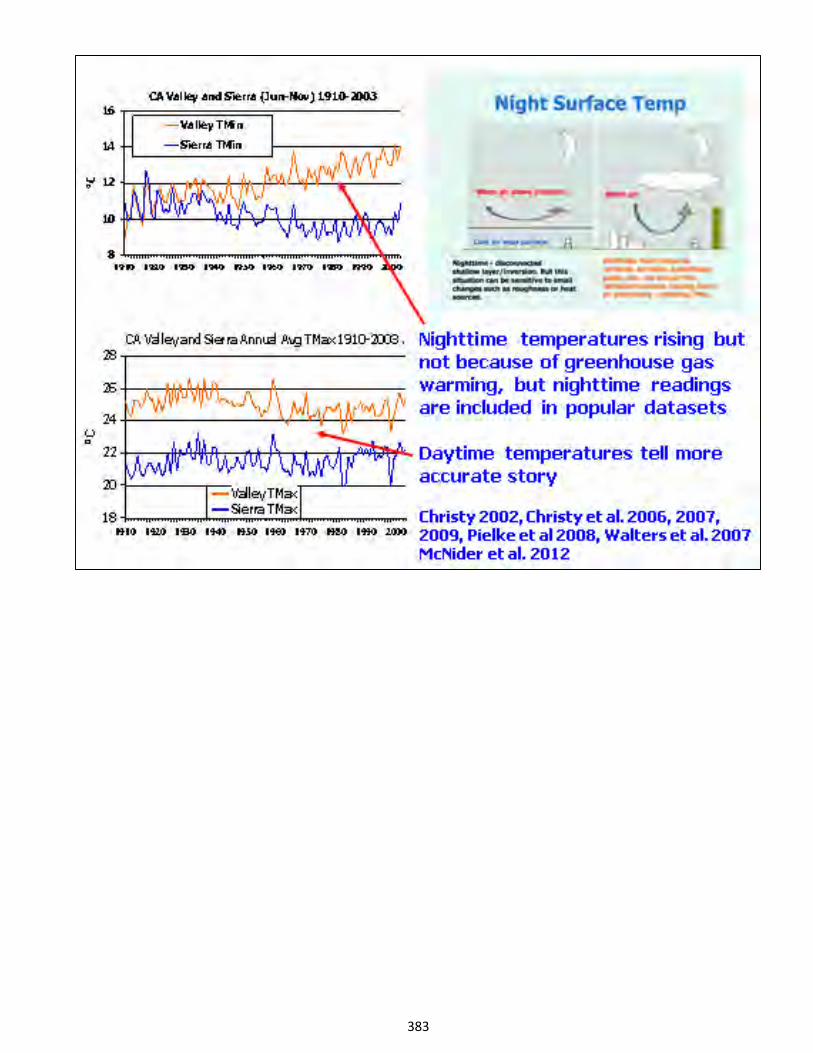
383
1 APS CLIMATE CHANGE STATEMENT REVIEW WORKSHOP
2 is no clouds during the summer there,
3 especially. But it warms up the
4 night and prevents this boundary
5 layer from forming like it should.
6 Well, I have another experimented
7 control. I can look at the daytime
8 maximum. And this [lower panel]is
9 what I found, that you see the same
10 temperature variations there, in
11 fact.
12 And correlation is very high
13 because the scale, the large-scale
14 effects like a hot summer and so on
15 affected both equally. So, this is
16 one of the reasons I don't like to
17 use GMST because of the nighttime
18 warming there.
19 I built data sets for Uganda,
20 Kenya and Tanzania. This one [next page]
21 was just published three or four months
22 ago. Again, I went through thousands
23 of pages of old documents to get the
24 numbers necessary to produce this.
25 They have different time frames
384
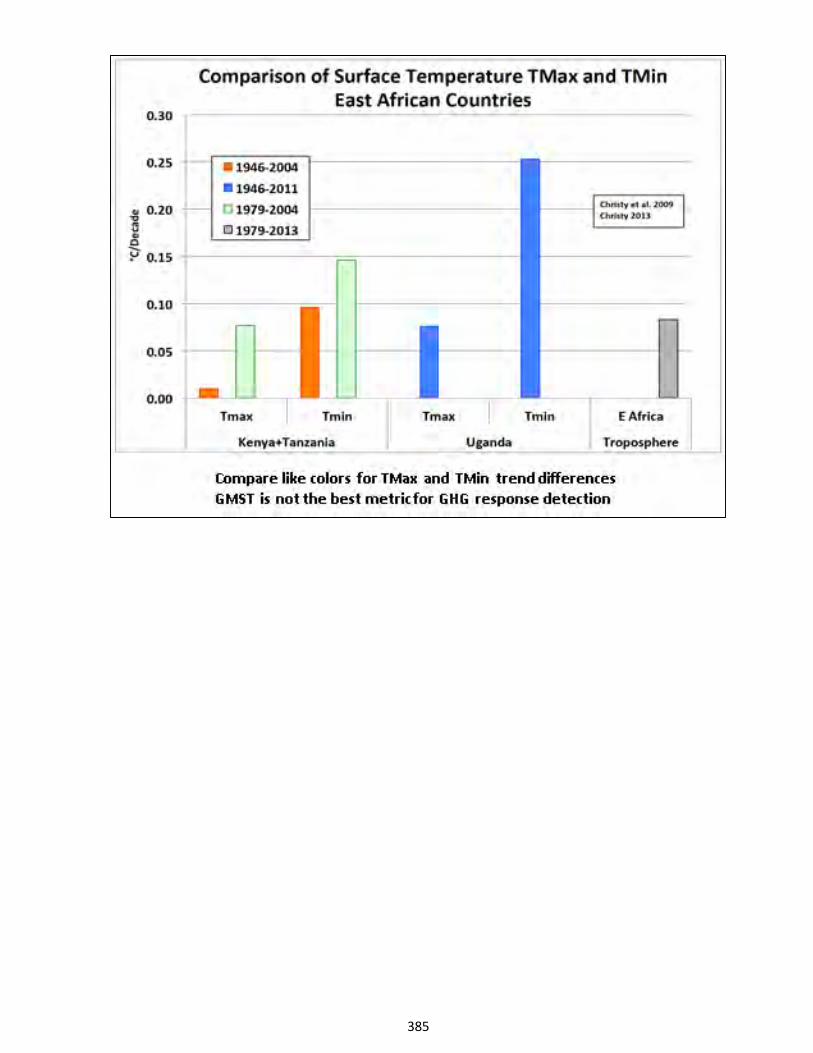
385
1 APS CLIMATE CHANGE STATEMENT REVIEW WORKSHOP
2 on the trends because I published
3 them at different times, but so just
4 compare the like colors.
5 And so, on the like colors, you
6 see the nighttime warmer than the
7 daytime, nighttime warmer than the
8 daytime, nighttime warmer than the
9 daytime.
10 And so, there again, I think
11 it's the aerosol effect of all the
12 fires that are burning around
13 stations and so on that causes that.
14 Well, the point there is
15 something other than greenhouse
16 effect is causing a temperature rise
17 in the common data sets now being
18 used. I like the bulk atmospheric
19 measurement. That's why that picture
20 is there.
21 So finally, to wrap it up,[next page]
22 to me, and I built my first climate data
23 set 50 years ago, (reading):
24 "Climate science is an immature and
25 murky science."
386
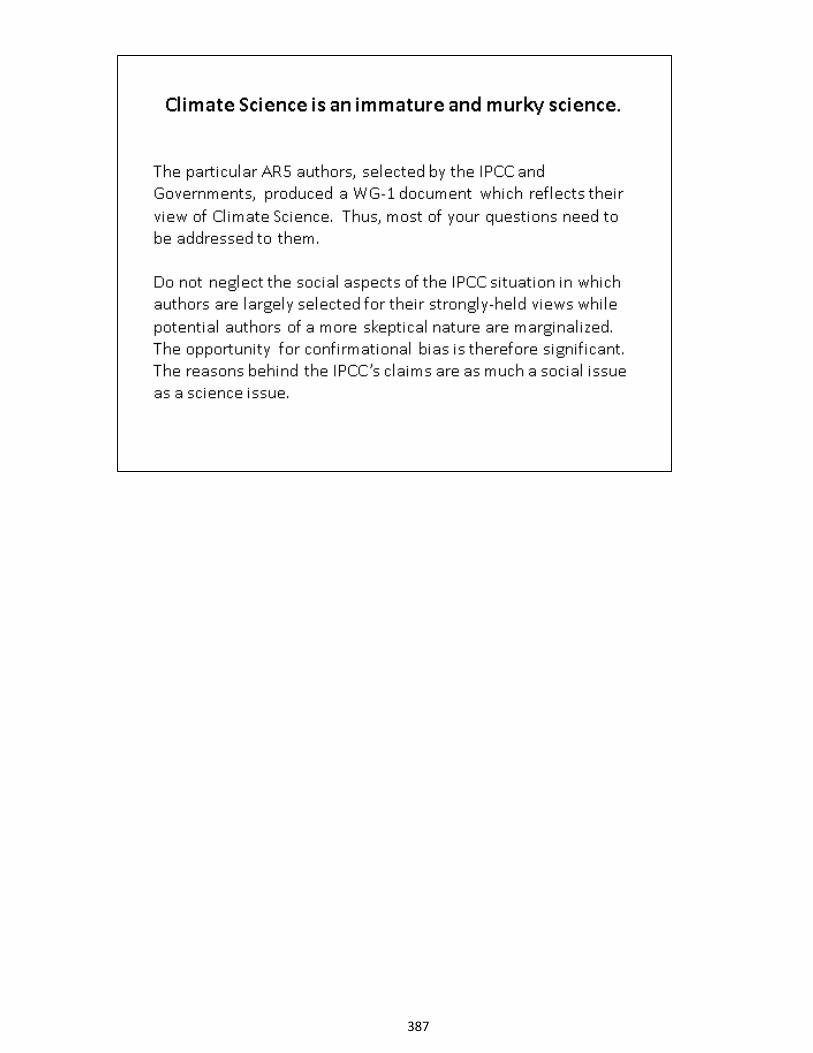
387
1 APS CLIMATE CHANGE STATEMENT REVIEW WORKSHOP
2 The particular AR5 authors
3 selected by the IPCC and governments
4 produced a Working Group 1 document
5 which reflects their view of climate
6 science. Thus, most of your
7 questions really need to be addressed
8 to them that you had about the IPCC.
9 (Reading): "But do not neglect
10 the social aspects of the IPCC
11 situation in which authors are
12 largely selected for their
13 strongly-held views while potential
14 authors of a more skeptical nature
15 are marginalized. Therefore, the
16 opportunity for conformational bias
17 is therefore significant."
18 The reasons behind the IPCC's
19 claims are as much a social issue as
20 a science issue. And [next page] like I
21 said early today, arguments from authority
22 unfortunately in our science tend to
23 carry the day in a lot of places
24 because laboratory experiments are
25 just not available to us.
388
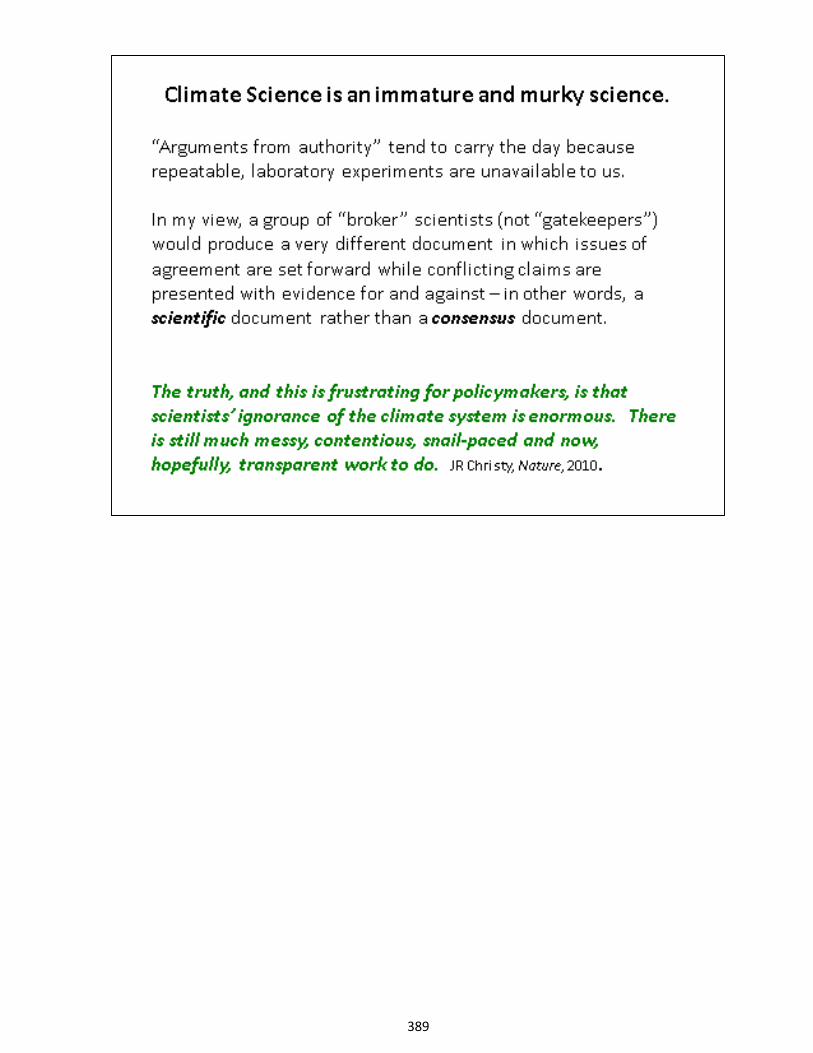
389
1 APS CLIMATE CHANGE STATEMENT REVIEW WORKSHOP
2 So in my view, "A group of
3 broker scientists, not gatekeepers,
4 would produce a very different
5 documents in which issues of
6 agreement are set forward while
7 conflicting claims are presented with
8 evidence for and against," in other
9 words, a scientific document rather
10 than a consensus document.
11 And in a sense, you are going
12 to be, if I understand the APS charge
13 to you, you are going to be the
14 brokers of what this is. You don't
15 have a dog in the fight or anything
16 like that.
17 You want to, as best you can,
18 understand what the evidence says and
19 what you can be sure about and what
20 you cannot be sure about.
21 Unfortunately, I don't see that in
22 the IPCC because of the author
23 selection process and the point of
24 which consensus has to be driven home
25 for.
390
1 APS CLIMATE CHANGE STATEMENT REVIEW WORKSHOP
2 Well, in "Nature," they asked
3 me to write a little op-ed one time
4 and I closed it with this statement.
5 (Reading): "The truth, and
6 this is frustrating for policymakers,
7 is that the sciences' ignorance of
8 the climate system is enormous.
9 There is much messy, contention and
10 snail-paced and now, hopefully" --
11 that was a prayer at the time --
12 "transparent work to do."
13 But it didn't quite pan out
14 that way. So with that, I am
15 through.
16 DR. KOONIN: Thank you.
17 Subcommittee?
18 Phil?
19 MR. COYLE: Do you have a view
20 about what we, the United States,
21 should do differently or additionally
22 than what we are doing now given your
23 observations? Do you have a view?
24 DR. CHRISTY: That's a science
25 question, right?
391
1 APS CLIMATE CHANGE STATEMENT REVIEW WORKSHOP
2 MR. COYLE: Yes, yes.
3 DR. KOONIN: We are still on
4 science. We can get to the social
5 and political aspects of that in the
6 panel, but yes, science now, please.
7 DR. CHRISTY: My view, because
8 I have seen the problem, is the
9 degradation of the observational
10 network. I mean, if we can't
11 understand what is happening with the
12 climate system, how are we ever going
13 to figure out why it's happening?
14 I might have to close down a
15 climate reference network here this
16 year because of funding cuts. So,
17 that would be the main thing I would
18 say is the observational network,
19 especially at the surface and the
20 balloon network, would be one thing I
21 would like to see.
22 DR. LINDZEN: The balloon
23 network has degraded over the years
24 steadily, hasn't improved as a result
25 of interest.
392
1 APS CLIMATE CHANGE STATEMENT REVIEW WORKSHOP
2 DR. KOONIN: Although you could
3 argue that the satellite
4 observations --
5 DR. LINDZEN: No. For
6 instance, for weather forecasting,
7 resolution is very important for both
8 vertical and horizontal. The
9 satellites have no vertical
10 resolution.
11 DR. KOONIN: Right, good, good.
12 DR. CHRISTY: They are good at
13 bulk numbers. But like Dick said,
14 they are not going to tell the
15 difference between 10,000 feet and
16 15,000 feet.
17 DR. KOONIN: Scott?
18 DR. KEMP: Do your
19 mid-troposphere data match ocean
20 data?
21 DR. CHRISTY: They are pretty
22 close in terms of the 35-year trend.
23 DR. KEMP: The trends, do they
24 follow?
25 DR. CHRISTY: Yes, they do,
393
1 APS CLIMATE CHANGE STATEMENT REVIEW WORKSHOP
2 yes. They are pretty close, yes.
3 DR. KOONIN: Isaac?
4 DR. HELD: Just on that point,
5 I think it is important, and there is
6 some literature on this, but there is
7 a lot of work in progress that, if
8 you take these models which look so
9 bad in John's pictures and you impose
10 the observed ocean surface
11 temperatures as a boundary condition
12 on those models, the fit is much
13 better.
14 We argue about whether it's
15 completely consistent. There still
16 may be some discrepancy, but it's
17 not like -- the problem is more in
18 whether the ocean hasn't warmed as
19 much as the models, their surface
20 temperature, not so much the vertical
21 structure.
22 DR. CHRISTY: I would say yes
23 and no on that. Yes, if you took all
24 these models and shoved them back to
25 where they had this as the bottom
394
1 APS CLIMATE CHANGE STATEMENT REVIEW WORKSHOP
2 boundary condition (indicating) -- I
3 have actually written a paper on
4 this -- they still go warmer, but not
5 as much.
6 DR. HELD: Right. So, we have
7 some work that is coming out that
8 gives the opposite answer to that
9 question. We do very well with our
10 model at simulating the RSS
11 temperature trends.
12 DR. KOONIN: Bob?
13 DR. ROSNER: I may be getting
14 inserted right into the middle of the
15 argument here. But I was struck by
16 your comment that if you focus on
17 what you would expect most of the
18 physics to be, which are where most
19 of the mass is, that the models do so
20 much worse.
21 So, I am just curious whether
22 or not there is an understanding of
23 why that is. What is it that the
24 models are missing? Is there even a
25 hint of an understanding what the
395
1 APS CLIMATE CHANGE STATEMENT REVIEW WORKSHOP
2 issue is?
3 DR. CHRISTY: I imagine there
4 is, but it probably varies from model
5 to model.
6 DR. KOONIN: Ben, Bill?
7 DR. SANTER: Let me tackle that
8 one. I think one of the issues is
9 this forcing uncertainty.
10 Again, as I mentioned this
11 morning, all of the models in CMIP5
12 that did not have interactive
13 stratospheric ozone chemistry
14 specified historical changes in
15 ozone, and they used something called
16 the Chioni, et al., database to do
17 that.
18 That has subsequently been
19 compared, that database of ozone loss
20 with more recent estimates. Susan
21 Solomon's group has done this.
22 And what it shows is that there
23 are profound differences in the
24 tropics, just where John is looking,
25 extending down as far as 200
396
1 APS CLIMATE CHANGE STATEMENT REVIEW WORKSHOP
2 hectopascals.
3 Our best estimate from these
4 kind of comparisons is that Chioni,
5 et al., underestimated the observed
6 ozone loss over the satellite era,
7 which certainly factors into some of
8 these differences that John is seeing
9 here.
10 So, my problem with this kind
11 of comparison is that it presents
12 only one explanation for the model
13 versus observed differences-
14 sensitivity error.
15 I don't think one can make a
16 single interpretation of those
17 discrepancies when there is a priori
18 evidence that we got some of the
19 forcings wrong, particularly in these
20 key regions.
21 Now, what people are doing now
22 is using improved ozone data sets to
23 rerun simulations. And I would point
24 out that the whole problem with
25 developing ozone data sets is you are
397
1 APS CLIMATE CHANGE STATEMENT REVIEW WORKSHOP
2 fitting to sparse observational data.
3 You have some rocket sondes. You have
4 some SAGE measurements.
5 And people fit statistical
6 models with some volcano terms, some
7 anthropogenic terms, some QBO terms.
8 And they do it differently and they
9 get different results.
10 And that is part of the reason
11 for these discrepancies that John is
12 showing here, not just model
13 sensitivity error.
14 DR. CHRISTY: I would just like
15 to say I did not say everything goes
16 on sensitivity here. In fact, I just
17 answered your question that I did
18 not.
19 DR. SANTER: John, I think in
20 your Congressional testimony, all you
21 discuss is model sensitivity error.
22 In your testimony from a couple of
23 years ago, you said this shows that
24 models are two to three times too
25 sensitive to anthropogenic greenhouse
398
1 APS CLIMATE CHANGE STATEMENT REVIEW WORKSHOP
2 gas increases.
3 I don't think one can make that
4 kind of inference from this
5 comparison.
6 DR. KOONIN: The related
7 question is, if you sought to adjust
8 the forcing, are the adjustments
9 plausibly within the uncertainties
10 that you would need in order to bring
11 things up?
12 DR. SANTER: Well, again, this
13 is why I said earlier I think in
14 tandem with the exploration of
15 parameter uncertainty, what we need
16 to do is not just have this ensemble
17 of opportunity, but have individual
18 modeling groups look a little bit
19 more carefully at the sensitivity of
20 stuff we really care about like the
21 vertical structure of atmospheric
22 temperature change to plausible
23 uncertainties in some of these key
24 external forces.
25 DR. KOONIN: Bill?
399
1 APS CLIMATE CHANGE STATEMENT REVIEW WORKSHOP
2 DR. COLLINS: I did want to
3 revisit the issue of global mean
4 surface temperature just briefly.
5 So, John was presenting some analysis
6 with respect to heat island effects,
7 as it's known.
8 DR. CHRISTY: It's much more
9 than heat island.
10 DR. COLLINS: Right.
11 DR. CHRISTY: It's irrigation,
12 everything.
13 DR. COLLINS: Something that is
14 at issue, of course, one can also
15 look at this issue over the open
16 ocean, including the remote open
17 ocean.
18 And I would just like to think
19 this sort of partitioning has been
20 done. And I think we can reasonably
21 assert that this is the issue of --
22 that is probably not a major player
23 in the Southern Pacific Ocean. And
24 the temperature trends do look quite
25 similar.
400
1 APS CLIMATE CHANGE STATEMENT REVIEW WORKSHOP
2 DR. CHRISTY: Between what and
3 what?
4 DR. COLLINS: Between the land
5 and the ocean. So, this issue of
6 whether or not the global mean
7 surface temperature record that we
8 are looking is biased by heat island
9 effects, has been partitioned the
10 data and looked at remote ocean
11 regions and the signal that we are
12 seeing is very coherent and it shows
13 up in very remote ocean regions.
14 DR. CHRISTY: You do now show
15 land warming more than the ocean,
16 though, right?
17 DR. COLLINS: No. The
18 temperature transfers are essentially
19 both three quarters of a kelvin.
20 DR. CHRISTY: What data sets
21 are you talking about?
22 DR. COLLINS: Pick one of four.
23 So, it doesn't really matter. The
24 IPCC analyzed four different
25 temperature reconstructions. They
401
1 APS CLIMATE CHANGE STATEMENT REVIEW WORKSHOP
2 all came to the exactly the same
3 conclusion.
4 DR. CHRISTY: I don't agree
5 with that as a data set builder.
6 DR. KOONIN: We can look.
7 DR. CHRISTY: You can look.
8 DR. KOONIN: I have to just say
9 the statement about what fraction of
10 the earth's surface is occupied by
11 people, it seems to me urban heat
12 island is probably not an issue.
13 DR. CHRISTY: Well, actually,
14 it's where the thermometer is.
15 That's what counts.
16 DR. KOONIN: Well, you don't
17 use ten thermometers in the same
18 city. You take one and you know the
19 correlation methods of 600 or 1,000
20 kilometers or something like that.
21 So, you sample them at some sensible
22 intervals.
23 DR. CHRISTY: It's very clear
24 that the land has shown more warming
25 in the data set. The land has shown
402
1 APS CLIMATE CHANGE STATEMENT REVIEW WORKSHOP
2 more warming than the ocean.
3 DR. KOONIN: And I thought that
4 that is physics. I could be wrong.
5 DR. CHRISTY: It could be, but
6 if you take the data sets that we
7 built and others that just have the
8 maximum temperature, it comes out
9 better in comparison with the upper
10 air.
11 DR. KOONIN: As long as
12 you are on T-max, BEST has this funny
13 compression of the diurnal range and
14 then it turns around about a decade
15 ago. Maybe it's a little more; I
16 can't remember. Bill is smiling. He
17 probably remembers that.
18 DR. COLLINS: No, I am smiling
19 for other reasons involving BEST, but
20 let's not go there.
21 DR. CHRISTY: You know, I
22 looked at the African data from
23 there, and I probably had three to
24 four times as much data stations as
25 BEST had. And I cannot reproduce.
403
1 APS CLIMATE CHANGE STATEMENT REVIEW WORKSHOP
2 They have a very large warming
3 in the last 30 years in the daytime
4 of the maximum temperature there.
5 And it's just not there in the data.
6 I don't know where it's coming from.
7 DR. KOONIN: I see, okay, good.
8 Scott?
9 DR. KEMP: I guess, there is a
10 question of, if these issues,
11 persistent issues with model forcings
12 and so on remain an issue today, what
13 is the alternative approach of doing
14 a regression and not having the
15 underlying physics in the model?
16 Is that an appropriate way to
17 proceed in lieu of agreement on the
18 models?
19 DR. SANTER: I think one of the
20 issues there, again, is this
21 co-linearity that in the real world,
22 at least, you have co-linearity
23 between ENSO, volcanos, some solar
24 terms.
25 So, if you just plug everything
404
1 APS CLIMATE CHANGE STATEMENT REVIEW WORKSHOP
2 into a multiple regression framework
3 in the observations or in the model
4 and you are looking at short periods
5 of record, it's very difficult to do
6 an unambiguous separation of these
7 individual terms.
8 One thing I would say about two
9 other points that John raised here is
10 one on the claim of cessation of
11 lower stratospheric cooling. I think
12 one of the issues there is, indeed,
13 this signal from early 21st-century
14 volcanic eruptions.
15 So, that increase of four to
16 seven percent per year in background
17 stratospheric aerosol optical depth
18 is warming the lower troposphere in
19 the observations. How much a
20 contribution that is, I don't know.
21 But clearly that is part of it.
22 The other thing relates to the
23 R squares that you showed initially,
24 John. They are very impressive, but
25 I would contend that they are largely
405
1 APS CLIMATE CHANGE STATEMENT REVIEW WORKSHOP
2 dictated by that high-amplitude,
3 high-frequency monthly time scale
4 variability, and not necessarily
5 indicative of whether there is really
6 good agreement in terms of the lower
7 frequency changes.
8 DR. CHRISTY: Did you see that
9 the annual was higher than the
10 monthly?
11 DR. SANTER: Well, the annual
12 is going to be affected by ENSO time
13 scale variability, so I am not really
14 surprised.
15 DR. CHRISTY: Not so much in
16 these.
17 DR. SANTER: Those were
18 tropical?
19 DR. CHRISTY: No, no, those
20 were from the tropics to Port Barre.
21 Those were all the VIZ stations in
22 the U.S. network.
23 DR. SANTER: But still, it's
24 primarily that large-amplitude,
25 high-frequency variability that is
406
1 APS CLIMATE CHANGE STATEMENT REVIEW WORKSHOP
2 dictating those large R squares that
3 you are getting there.
4 It doesn't necessarily tell you
5 all that much about agreement or lack
6 thereof the low-frequency changes.
7 DR. KOONIN: So, those R
8 squares, just to understand what
9 those are, are correlation
10 coefficients between satellites and
11 balloons measurements? Balloons go
12 up four times a day or something like
13 that or how often?
14 DR. CHRISTY: Twice a day,
15 usually.
16 DR. KOONIN: Twice a day? So,
17 it's correlation at the twice-a-day
18 level?
19 DR. CHRISTY: For monthly
20 average.
21 DR. KOONIN: Monthly mean?
22 DR. CHRISTY: And then also
23 annual average. I did both of them
24 to show the shorter and the longer
25 time scale.
407
1 APS CLIMATE CHANGE STATEMENT REVIEW WORKSHOP
2 DR. KOONIN: So, there is a
3 filtering that is going on there.
4 Other comments? That's good enough.
5 All right. Isaac, you get the
6 last word. For those of you who
7 haven't noticed, the cheesecake has
8 arrived.
9 DR. HELD: Thanks for the
10 invitation. Just to introduce
11 myself, I work a lot on climate
12 models, but I think of myself as a
13 physicist. My background is in
14 physics and I am interested in the
15 fundamentals. I want to understand
16 the climate system. That's my
17 motivation.
18 I think I have a little cold.
19 I may be losing my voice a bit. I
20 will try to stay close to the mic.
21 Here is an argument. The way I
22 am presenting this is sort of a
23 crosscut across the questions that
24 you asked rather than focusing
25 question by question.
408
1 APS CLIMATE CHANGE STATEMENT REVIEW WORKSHOP
2 I think it tries to be
3 responsive. And this [next page]
4 is the way I think about the problem of
5 forced versus internal variability.
6 And this is sort of, this is
7 really my starting point which,
8 independent of any estimate of
9 internal variability for models,
10 convinces me at a very high level of
11 certainty that the warming we have
12 seen over, say, 50 years or 100 years
13 was mostly forced rather than
14 internal. So, let's just start with
15 that basic fact.
16 It doesn't say anything about
17 climate sensitivity, per se,
18 directly, because the forcing could
19 be due to other things than
20 greenhouse gases. But let's suppose
21 it's mostly forced.
22 Then what kind of picture
23 do we have? And this is meant to be
24 the ocean surface here. I will try
25 to move over here. We have some
409
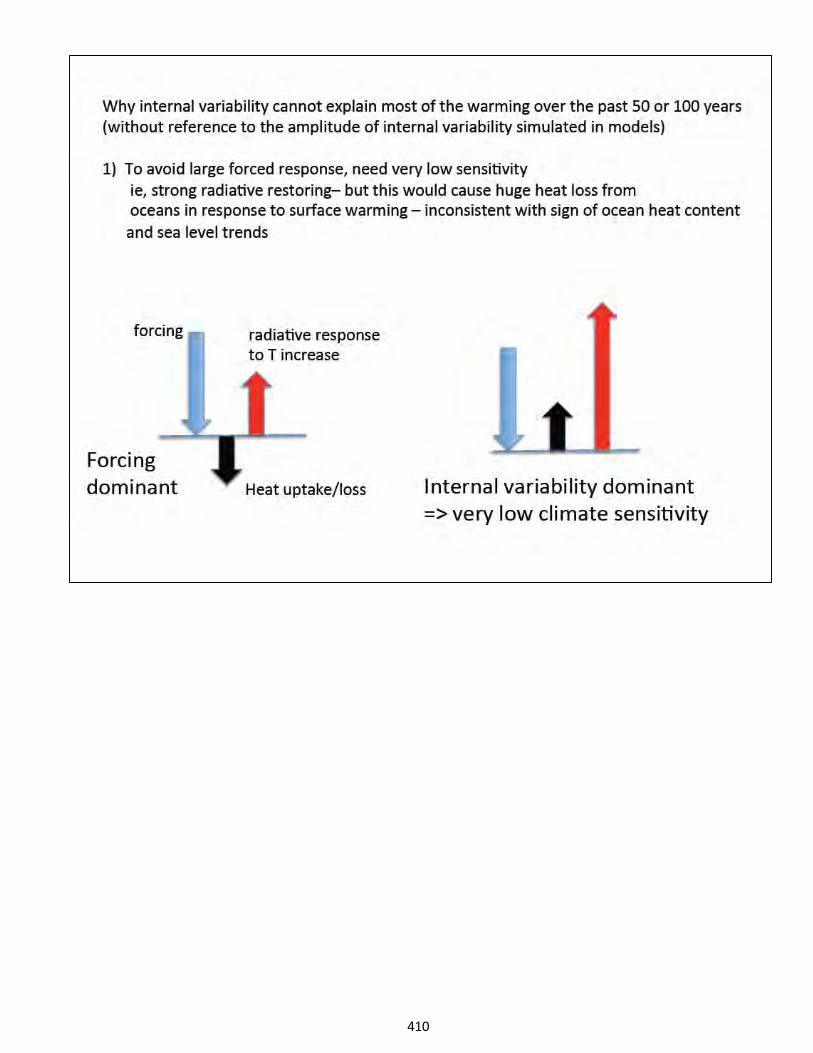
410
1 APS CLIMATE CHANGE STATEMENT REVIEW WORKSHOP
2 forcing. And this was, I think, a
3 little bit of the confusion that
4 Steve was referring to.
5 This is four watts per meter
6 squared or three or whatever, or
7 over the historical period, say two,
8 and this, going into the ocean is 0.6.
9 The rest of it has been
10 radiated away as a response to the
11 warming. And the amplitude of this
12 is the climate sensitivity,
13 effectively. So, this is a consensus
14 picture that mostly is forced.
15 So, what would things look like
16 conceivably if I was completely
17 wrong? And let's go to the extreme
18 limit, that it's pretty much all
19 internal variability.
20 Well, first of all, you are
21 talking immediately about a
22 low-climate sensitivity, much lower
23 than the consensus picture, because
24 otherwise the forced response would
25 be there.
411
1 APS CLIMATE CHANGE STATEMENT REVIEW WORKSHOP
2 If you are saying it's mostly
3 internal variability, you are talking
4 about a very low-sensitivity system
5 compared to the consensus picture,
6 which means that we are talking
7 about, say observed warming.
8 So, you would have a huge
9 outgassing of heat from the ocean
10 because that's what you mean by
11 "low-sensitivity model." For the
12 same warming, you get a huge output
13 of energy trying to restore that.
14 And for the same forcing, I am
15 assuming the forcing estimate is not
16 uncontroversial. You have heat
17 coming out of the ocean. That's the
18 bottom line. We don't see that.
19 We can argue about whether the
20 heat going into the ocean is
21 accelerating or who knows what. But
22 all the estimates are that the ocean
23 is gaining heat over this time
24 period. We have sea level going back
25 for longer periods.
412
1 APS CLIMATE CHANGE STATEMENT REVIEW WORKSHOP
2 There is no way I can construct
3 a simple model that would give me
4 heat going into the ocean if the
5 response is basically internal. I am
6 willing to discuss that with panel
7 members.
8 DR. KOONIN: Okay, keep going.
9 DR. HELD: But that's one
10 point. The other one is spatial
11 structure. [next page] And these things,
12 again,are implicit in various fingerprinting
13 studies.
14 And the first point is sort of
15 implicit in studies where people take
16 simple models and just vary the
17 parameters all over the place and see
18 what they can do.
19 Where do you expect
20 low-frequency variability to emerge
21 in the coupled climate system? It's
22 going to emerge at high latitudes
23 because, where you have memory on
24 these multidecadal time scales is in
25 the deep ocean.
413
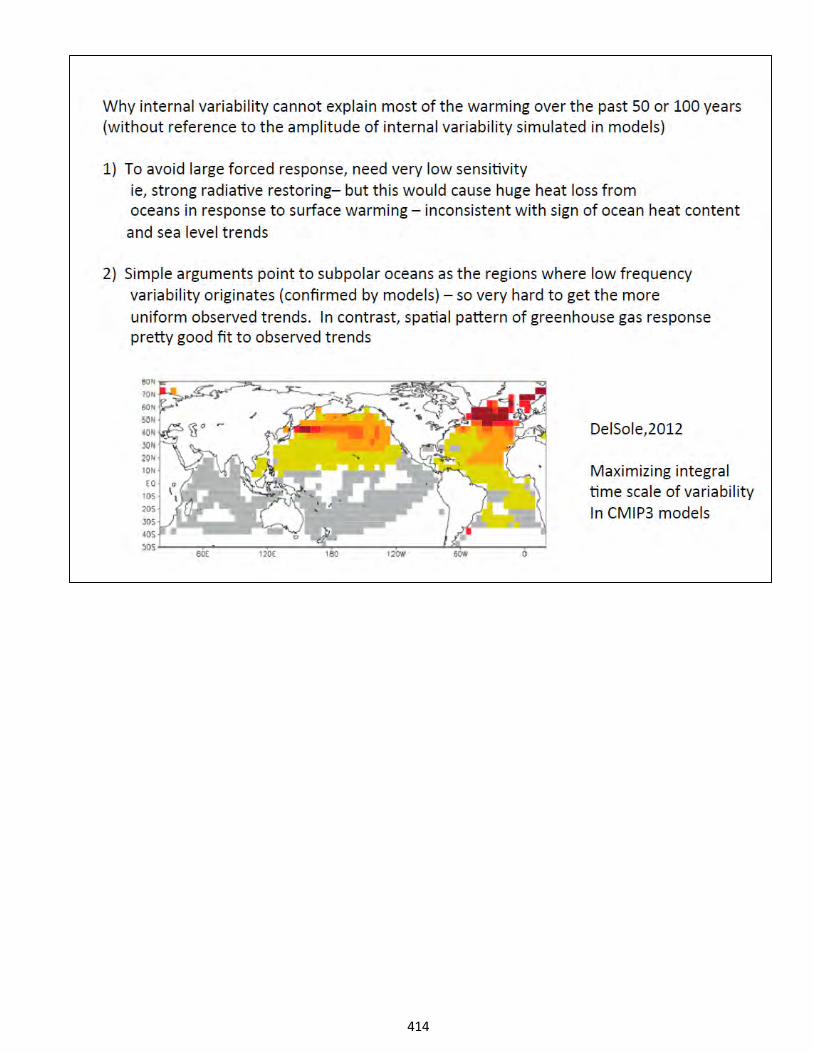
414
1 APS CLIMATE CHANGE STATEMENT REVIEW WORKSHOP
2 And where is the deep ocean
3 coupled efficiently to the surface?
4 It's in subpolar regions. That's
5 where the ocean is least stratified.
6 The tropics are just too
7 strongly stratified for those time
8 scales. You look at where models
9 predict their lowest-frequency
10 variability.
11 There was a nice paper by
12 Del Sole looking at the models. And
13 he finds a pattern in all the models
14 that have the largest integral time
15 scale or decorrelation time.
16 They are at high latitudes,
17 especially the northern North
18 Atlantic. This plot doesn't go to the
19 Southern Ocean, but you would see
20 high variability in the Southern
21 Ocean as well.
22 And that's just the opposite of
23 what you see in reality. In fact, in a
24 forced response, you expect to see an
25 orthogonal pattern, more or less,
415
1 APS CLIMATE CHANGE STATEMENT REVIEW WORKSHOP
2 because those are the regions that
3 are coupled strongly to the deep
4 ocean.
5 You basically have big heat
6 capacity. So, you have the smallest
7 response to the forcing-- so, it
8 shouldn't be that hard to separate
9 internal variability from forced
10 patterns. They tend to have the
11 opposite structures.
12 And this doesn't look -- and
13 basically, we don't see
14 subpolar-dominated warming over the
15 ocean. In the subpolar North Atlantic, we
16 have seen very little warming over the
17 century time scale. Over the last 20 years,
18 we have seen quite a bit.
19 And that's why a couple of
20 people talked about there might have
21 been some contribution to the recent
22 ramp-up, say, of the last 30 years
23 from the North Atlantic variability,
24 which is entirely plausible.
25 But you don't see a magnified
416
1 APS CLIMATE CHANGE STATEMENT REVIEW WORKSHOP
2 subpolar Atlantic warming over the
3 50- to 100-year time scale. So, to
4 combine those two things, without any
5 reference to the magnitude of
6 internal variability in the models,
7 it's pretty inconceivable to me. And we
8 haven't seen it.
9 I don't think it's a -- it's
10 not a mystery to me that no one has
11 produced a model that gives you
12 something that looks like the warming
13 over the last 50 or 100 years from
14 internal variability.
15 I just don't think you can do
16 it. I haven’t tried to put a number on it.
17 I don't know if I come up with
18 95 percent or 90 percent or what. I
19 am not holding my breath.
20 So, I think there is a point of
21 confusion here. [next page] Does the IPCC
22 actually say that the level, that our
23 confidence has increased from this 90
24 to 95 percent level? Actually, it
25 doesn't. There is no statement to
417
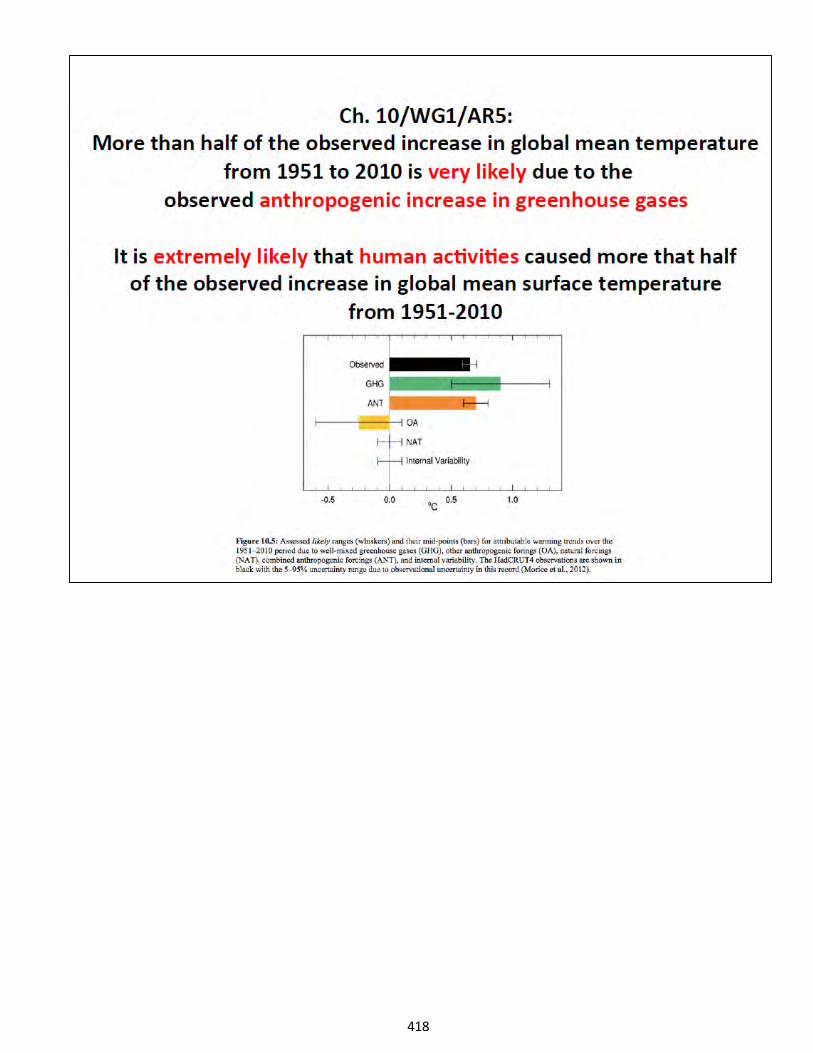
418
1 APS CLIMATE CHANGE STATEMENT REVIEW WORKSHOP
2 that effect, unfortunately.
3 If you go into chapter 10, you
4 could say this is a communication
5 problem, but I'm not sure I want to
6 talk about communication. We are
7 talking about science. These two
8 statements are different. I didn't
9 label this exactly correctly. This
10 is the AR4 statement.
11 Very likely that more than half
12 of the 20th-century warming was due
13 to an increase in greenhouse gases.
14 That means well-mixed greenhouse
15 gases.
16 The statement didn't say
17 "well-mixed," but if you read the
18 text. Now this is the statement in AR5,
19 "extremely likely." That seems like
20 a stronger statement.
21 DR. KOONIN: Just what is the
22 origin of the two different
23 statements?
24 DR. HELD: This one is about
25 human activities. This one is about
419
1 APS CLIMATE CHANGE STATEMENT REVIEW WORKSHOP
2 greenhouse gases.
3 DR. KOONIN: They are both in
4 AR5?
5 DR HELD: No -- well, yes, they
6 are. I'm sorry. They are both in
7 chapter 10 of AR5. In fact, they
8 are both right next to each other in the
9 summary of chapter 10.
10 And so, for people who read
11 chapter 10, these are two different
12 statements. And it's discussed in
13 some detail in chapter 10.
14 DR. CURRY: The issue is what
15 showed up in the summary for
16 policymakers.
17 DR. LINDZEN: And the press
18 release.
19 DR. CURRY: And the press
20 release, yes.
21 DR. KOONIN: That's not
22 science, but it's important.
23 DR. HELD: I want to stick to
24 the science. I am not saying it's
25 not important.
420
1 APS CLIMATE CHANGE STATEMENT REVIEW WORKSHOP
2 And so, what is going on here
3 is a statement about, this statement
4 is dividing up the response into two
5 pieces, the human activities and
6 everything else. "Everything else"
7 is basically internal variability and
8 natural forces, volcanos, solar.
9 This is dividing up into, like,
10 three pieces. There is the
11 greenhouse gas and there is the other
12 forcing, as well as the natural
13 forcing internal variability.
14 And this is one of the pictures
15 from chapter 10. I think this is
16 kind of a detail. I'm not sure. So,
17 why is it that this statement, which
18 is different than this one, is more
19 popular than this one?
20 Well, it has to do with this.
21 This is their error bar on the total
22 anthropogenic forcing, which is
23 equivalent to an error bar on
24 internal natural variability, because
25 it's just a two-part decomposition.
421
1 APS CLIMATE CHANGE STATEMENT REVIEW WORKSHOP
2 DR. KOONIN: Where are the
3 anthropogenic aerosols in that
4 picture?
5 DR. HELD: Well, it's
6 greenhouse gas plus aerosols will
7 give you this. So, this error bar is
8 a lot smaller than this one.
9 You have this issue that we
10 have been talking about, compensation
11 between greenhouse and aerosol. And
12 this error bar is basically similar
13 to these.
14 DR. KOONIN: To the extent that
15 they compensate well, the top
16 statement becomes even more accurate.
17 DR. HELD: This is a statement
18 about natural variability. This is a
19 statement about greenhouse gases. I
20 don't know if we have enough time to go into
21 exactly why one is stronger than the other.
22 But I would encourage you to
23 read chapter 10 if you are interested
24 in focusing on this. I don't focus that much
25 on 90 versus 95 percent. To me, I
422
1 APS CLIMATE CHANGE STATEMENT REVIEW WORKSHOP
2 don't get into a tizzy about that
3 sort of thing.
4 DR. KOONIN: Nobody should, but
5 the media do.
6 DR. HELD: Yes, they do.
7 Just, I don't.
8 How about the hiatus? I like
9 the word "hiatus." This [next page] is the
10 way I plot it. This is a standard
11 Hadley Center data set.
12 And this is just a blowup
13 showing El Niño years and La Niña
14 years. The red is El Niño and the
15 green is La Niña by some standard
16 definition. And the magnitude of
17 these boxes is the magnitude of the
18 El Niño or La Niña.
19 And you can plot this in
20 different ways. Superficially, a lot
21 of the hiatus is, it looks like an
22 extended La Niña-like period.
23 And this also gives you a
24 little flavor of what we are talking
25 about here. We are not talking about
423
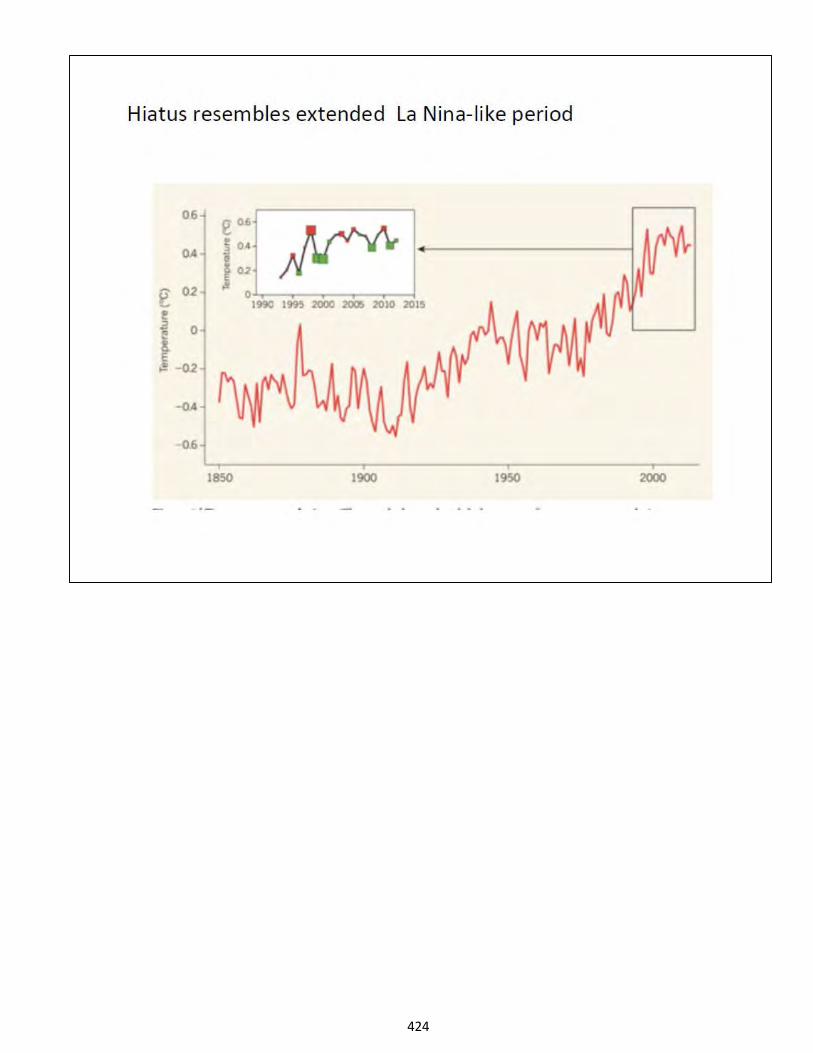
424
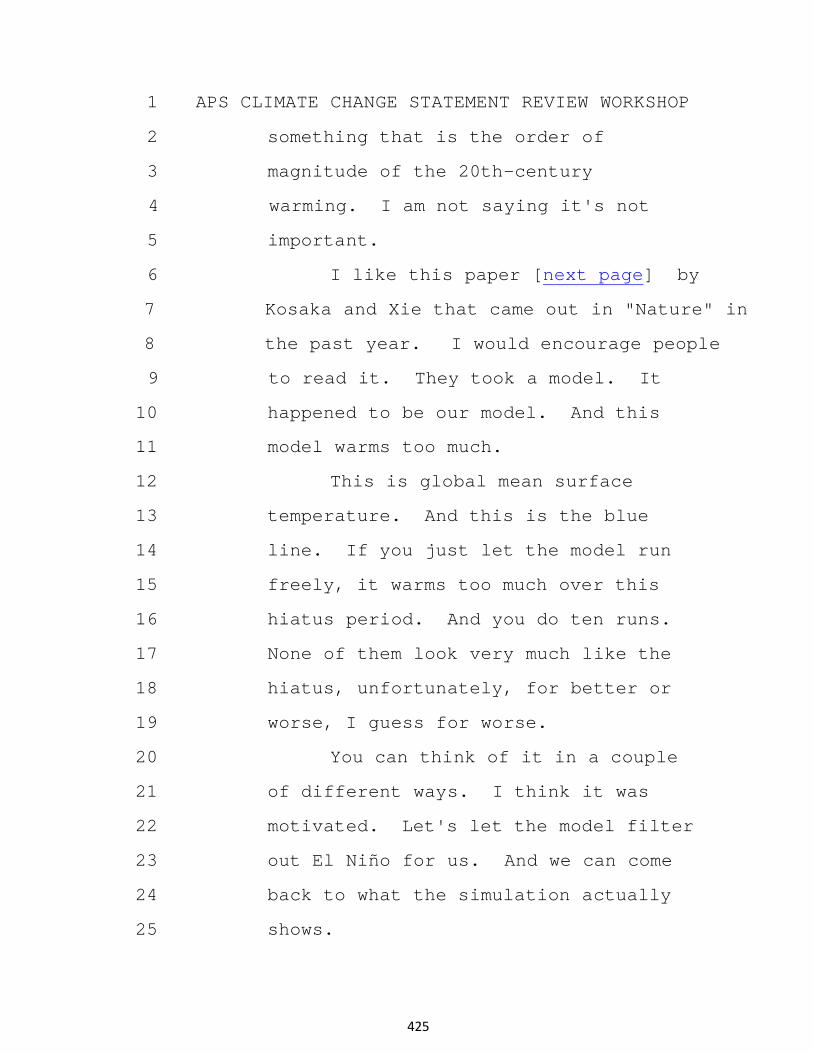
1 APS CLIMATE CHANGE STATEMENT REVIEW WORKSHOP
2 something that is the order of
3 magnitude of the 20th-century
4 warming. I am not saying it's not
5 important.
6 I like this paper [next page] by
7 Kosaka and Xie that came out in "Nature" in
8 the past year. I would encourage people
9 to read it. They took a model. It
10 happened to be our model. And this
11 model warms too much.
12 This is global mean surface
13 temperature. And this is the blue
14 line. If you just let the model run
15 freely, it warms too much over this
16 hiatus period. And you do ten runs.
17 None of them look very much like the
18 hiatus, unfortunately, for better or
19 worse, I guess for worse.
20 You can think of it in a couple
21 of different ways. I think it was
22 motivated. Let's let the model filter
23 out El Niño for us. And we can come
24 back to what the simulation actually
25 shows.
425
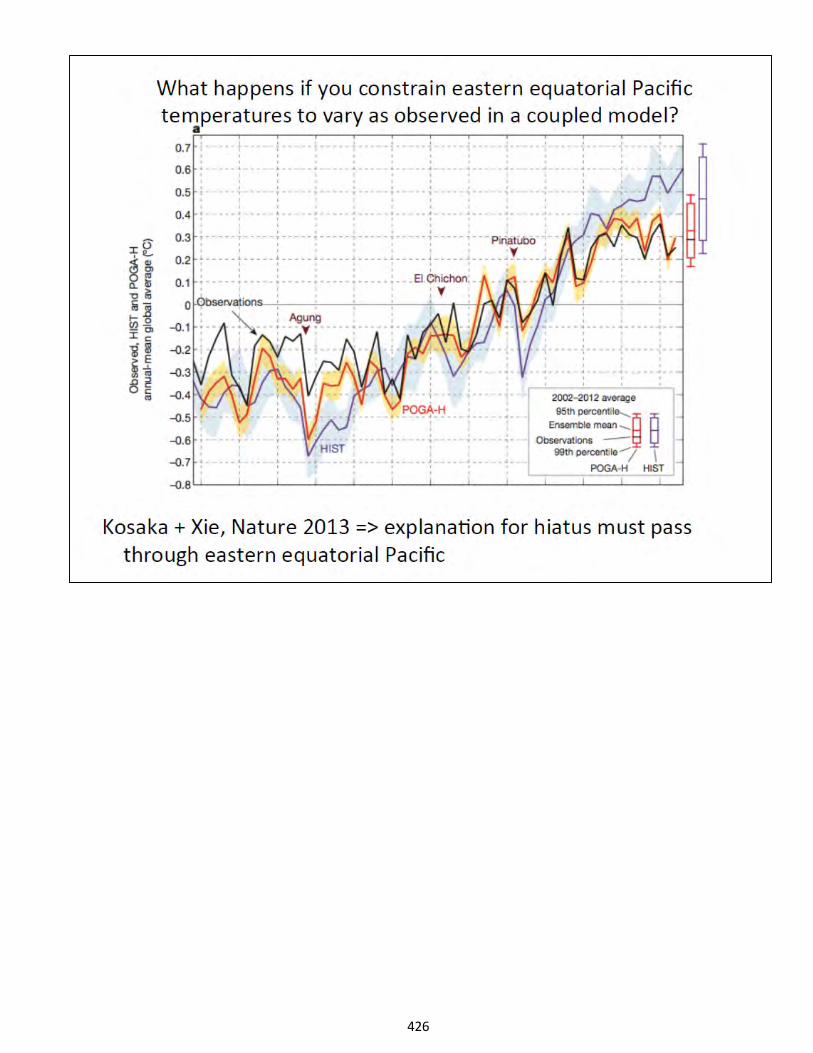
426
1 APS CLIMATE CHANGE STATEMENT REVIEW WORKSHOP
2 Let's go into the Eastern
3 Equatorial Pacific in a region which
4 is in the order of, I don't know,
5 12 percent or something of the global
6 area of the earth, and just specify
7 the ocean temperatures in that region
8 to be those that were observed in
9 that period.
10 And then you get the observed
11 here in black and the red line is
12 what you get from this constrained
13 model, just constrained in the
14 Equatorial Eastern Pacific.
15 So, you are forcing the model,
16 if you like, to absorb some heat to
17 keep those temperatures from warming,
18 at least in that little region. And
19 it looks pretty good.
20 It even improves Pinatubo.
21 It's a way of removing ENSO effects.
22 People say oh, the model is
23 overestimating the response to
24 Pinatubo. If you constrain the
25 Eastern Equatorial Pacific, it looks
427
1 APS CLIMATE CHANGE STATEMENT REVIEW WORKSHOP
2 pretty good.
3 DR. KOONIN: If you had taken
4 some other region of the ocean, the
5 Atlantic somewhere, would it have
6 done the same thing?
7 DR. HELD: No, it wouldn't work
8 very well. The tropical Pacific
9 is powerful.
10 DR. KOONIN: That's where the
11 action is.
12 DR. HELD: And also it's
13 motivated. This isn't arbitrary.
14 It's motivated by the fact that it
15 looks like the recent past has been
16 La Niña-like. And so, just go in and
17 let the model do it for you. And it
18 looks pretty good.
19 And you can focus on that we still
20 have some discrepancy. The model is
21 still warming a little bit too much
22 if you go back. That could be due to
23 forcing errors as we have been
24 discussing or sensitivity errors.
25 But the hiatus period is
428
1 APS CLIMATE CHANGE STATEMENT REVIEW WORKSHOP
2 captured pretty well. So, not
3 -- what is it?
4 Is it some kind of clumping of
5 La Niña events that happened
6 randomly? Is there something going
7 on in the tropical Eastern Pacific, a
8 signature of a slower mode of the
9 ocean?
10 If it's not just a random
11 clumping, is there actually something
12 significant going on there that might
13 even be predictable? Or could it
14 even be some forcing that, for
15 whatever reason, is influencing the
16 Eastern Equatorial Pacific
17 temperatures? I don't know.
18 All I can say from this paper,
19 which, as I said, I like a lot, is
20 the explanation has to go through
21 Eastern Equatorial Pacific. If it is
22 going to be forcing, then the forcing
23 is going to have to change the
24 Equatorial Eastern Pacific,
25 especially.
429
1 APS CLIMATE CHANGE STATEMENT REVIEW WORKSHOP
2 So anyway, that's just a point
3 of, I don't think this is
4 particularly model-specific.
5 DR. CHRISTY: What section of
6 the Eastern Tropical Pacific was
7 that?
8 DR. HELD: I don't have a
9 picture here, but it's a non-trivial
10 part. I don't remember how far it
11 goes west, but I think something like
12 10 north to 10 south. I just don't
13 remember the east or west.
14 If you look at, if you take out
15 the forcing from the model, if you
16 take out the time evolution of the
17 forcing -- I didn't bring that
18 picture with me -- and just specify
19 the temperature in that region, you
20 get essentially nothing.
21 So, most of this is due to
22 forcing. So, I think this is a clue
23 as to what is going on. You have to
24 explain what is happening in the
25 Eastern Pacific to explain the
430
1 APS CLIMATE CHANGE STATEMENT REVIEW WORKSHOP
2 hiatus. That's what it's telling me.
3 And here [next page] is something else
4 that I found interesting in that paper.
5 Other people have written about this,
6 but it doesn't seem to get focused
7 on. The hiatus is a wintertime
8 phenomenon. If you look in the
9 summer, there is no hiatus. There is
10 still warming.
11 Global mean temperatures are
12 increasing in northern summer. And
13 this is the seasonal cycle of the
14 observed trend over this hiatus
15 period. And their model is pretty
16 good. It captures that roughly, not
17 perfectly.
18 And that is a pretty high bar
19 for explanation in terms of forcing.
20 I am not saying it's impossible,
21 but you have to explain that seasonal
22 cycle from volcanos or something. I
23 think it's hard. Volcanos could be a
24 part of it. But I don't think they
25 could do it all, clearly.
431
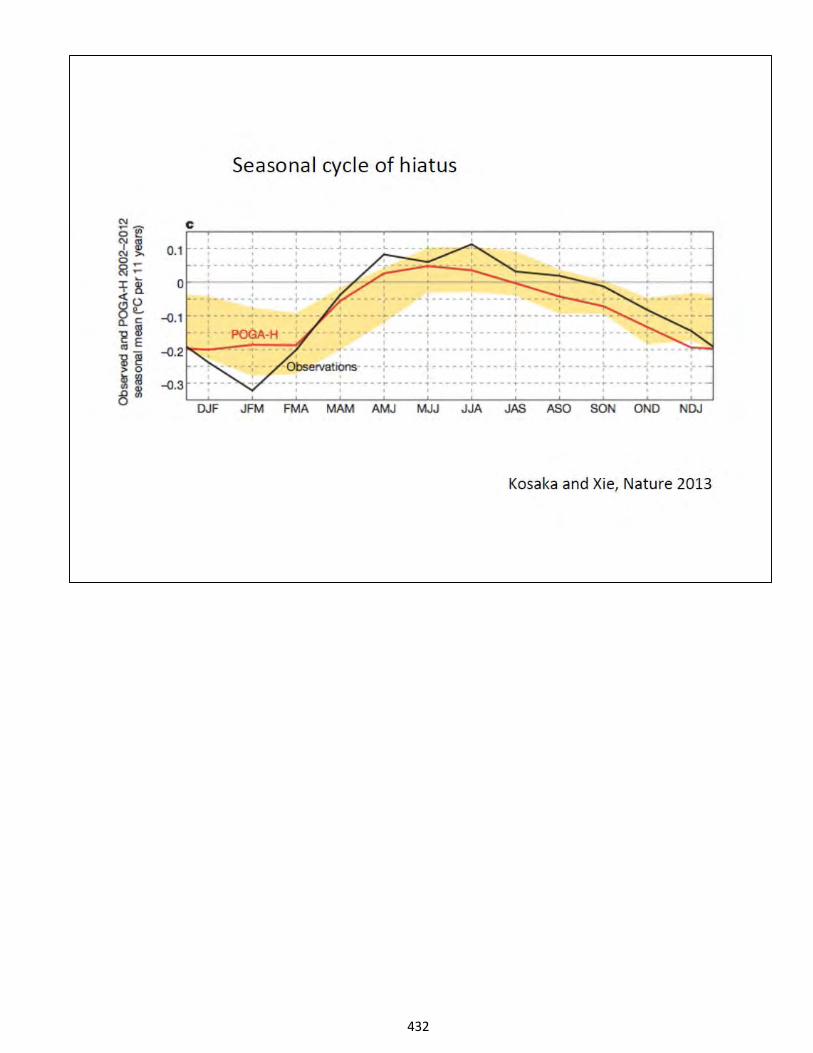
432
1 APS CLIMATE CHANGE STATEMENT REVIEW WORKSHOP
2 Okay, so that's my hiatus talk.
3 Some of the questions that came
4 through in your background document I
5 thought were a little off, if I can
6 be frank --
7 DR. KOONIN: That's fine. We
8 are not experts.
9 DR. HELD: -- in the sense that
10 they don't conform to my picture of
11 how the climate system works. So, I
12 have my null hypotheses. And I have
13 been doing this for over 30 years, so
14 I have developed a lot of hypotheses.
15 Some of them turn out to be wrong.
16 I don't like this argument from
17 complexity saying oh, it's a chaotic
18 system. There is all sorts -- you
19 can get a nonlinear system to do
20 anything you want. That just doesn't
21 tell me anything.
22 But whenever I look at the forced
24 response of the climate system, it
25 looks linear to me. And what is the
433
1 APS CLIMATE CHANGE STATEMENT REVIEW WORKSHOP
2 best example we have of forced
3 responses? The seasonal cycle.
4 Seasonal cycles are remarkably
5 linear-looking.
6 I grew up in Minneapolis which
7 is why I plotted Minneapolis here.
8 [next page] I just repeated it twice for
9 clarity. This is just the seasonal cycle.
10 It's almost perfectly inside the
11 squiggle.
12 There is an awful lot of
13 nonlinear fluid dynamics and cloud
14 formation stuff going on underneath
15 this. My analogy here is the
16 thermodynamic limit of statistical
17 mechanics.
18 The smaller response, you seem
19 to worry about the fact that the
20 external forcing is so small, but
21 that just makes it more likely to be
22 linear.
23 DR. KOONIN: Although, in real
24 thermodynamics, since you have a
25 good separation of scale, there is a
434
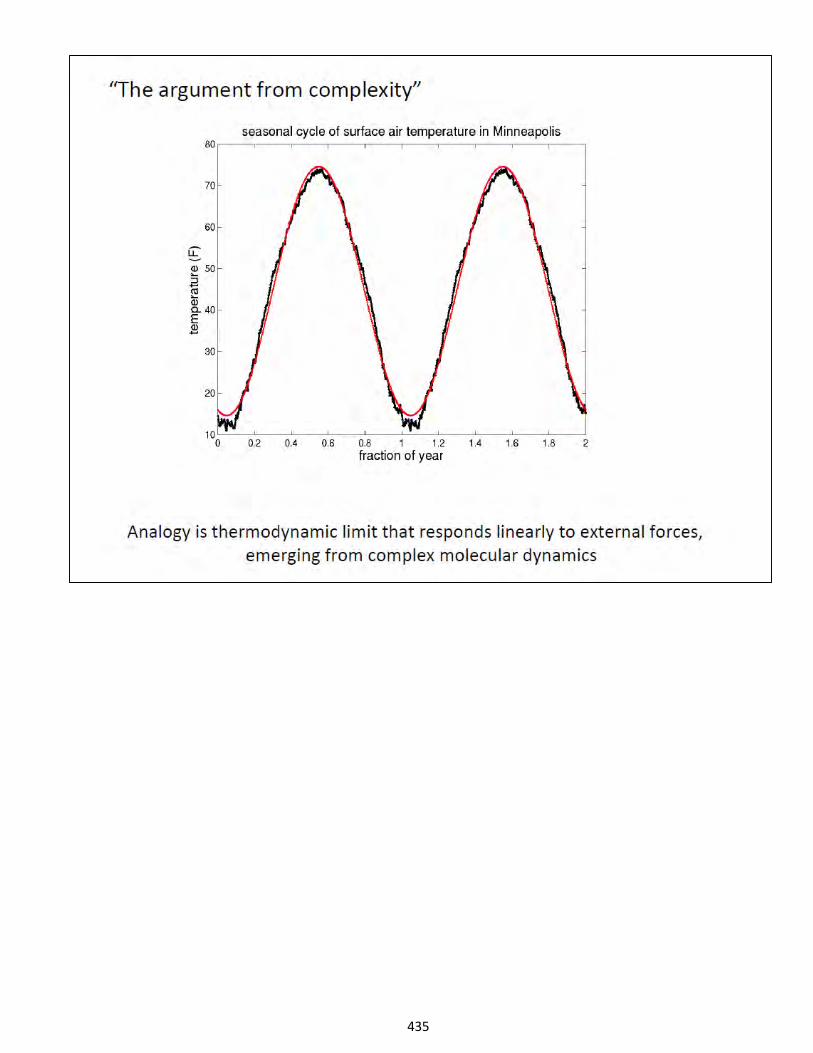
435
1 APS CLIMATE CHANGE STATEMENT REVIEW WORKSHOP
2 small parameter or a big parameter,
3 right? The size of the atoms or the
4 number of atoms or something?
5 DR. HELD: I am not saying it
6 is as good as thermodynamics, but
7 that's my underlying picture.
8 One other example of forced
9 response that Dick referred to, we
10 have Milankovitch. We don't have
11 anything really in between -- I mean, we
12 have the sunspots, but that's hard to
13 see, it's so small.
14 So, we have the seasonal cycle and
15 Milankovitch. Those are both changes in our
17 orbit. And that looks pretty linear, too,
18 at least in the sense that you see the
19 periods of the orbital changes coming
20 out.
21 DR. KOONIN: If you take a
22 given model, one of the ones in the
23 middle of the pack, and start doing
24 the linear study on one or several of
25 the forces, start cranking up the
436
1 APS CLIMATE CHANGE STATEMENT REVIEW WORKSHOP
2 solar constant or the aerosol loading
3 or CO2, does it behave in a linear
4 way?
5 DR. HELD: Yes.
6 DR. KOONIN: Over the range of
7 what we are talking about?
8 DR. HELD: A lot of people
9 looked at that. It's very linear.
10 DR. COLLINS: Yes, it is very
11 linear.
12 DR. HELD: The whole language,
13 the whole forcing-feedback language
14 we look at is assuming that this
15 linear picture is useful. Otherwise,
16 what is forcing and what is feedback?
17 I don't even know where to start.
18 DR. COLLINS: At the risk of
19 breaking protocol, may I?
20 DR. KOONIN: Yes.
21 DR. COLLINS: You can force the
22 model separately with different
23 forcing agents, look at the separate
24 response, add the response and then
25 add the forcings and compare the
437
1 APS CLIMATE CHANGE STATEMENT REVIEW WORKSHOP
2 total response to the total forcings.
3 That has been done ad nauseam, not a
4 problem.
5 DR. HELD: The models look
6 pretty linear. The observed
7 seasonal cycle, that looks linear.
8 Even if in the Ice Age times, things
9 look pretty linear. We don't know
10 that much about it.
11 So, why should I assume that
12 things are, gee, the anthropogenic
13 CO2 pulse is going to interact in
14 some exotic way with internal modes
15 of variability? Well, it's
16 conceivable. But I am not convinced. I
17 don't think that is particularly
18 relevant.
19 DR. KOONIN: But to come back
20 to my earlier hobbyhorse, that means
21 that the sensitivity you determined
22 to, let's say, CO2 from the last 30
23 years, you should use in
24 extrapolating out of next century?
25 DR. HELD: Yes, I don't think
438
1 APS CLIMATE CHANGE STATEMENT REVIEW WORKSHOP
2 there is much evidence that there is
3 much secular variation in
4 sensitivity.
5 DR. LINDZEN: But I think this
6 is important. For instance, when I
7 presented the simple analysis, I was
8 assuming it was all due to
9 anthropogenic. Sensitivity is a
10 separate question. And I think in
11 conflating the two issues, we are
12 confusing things.
13 DR. HELD: I was trying to
14 separate them here. I don't think
15 there is so much a collection of
16 sensitivity as you are saying.
17 I just think if you want
18 internal variability to be important, you
19 have to be in a low-sensitivity model
20 by definition. And then you are
21 going to have the heat going in the
22 wrong direction. It's just so basic
23 to me, I don't see why we talk
24 about it.
25 DR. KOONIN: Some of us haven't
439
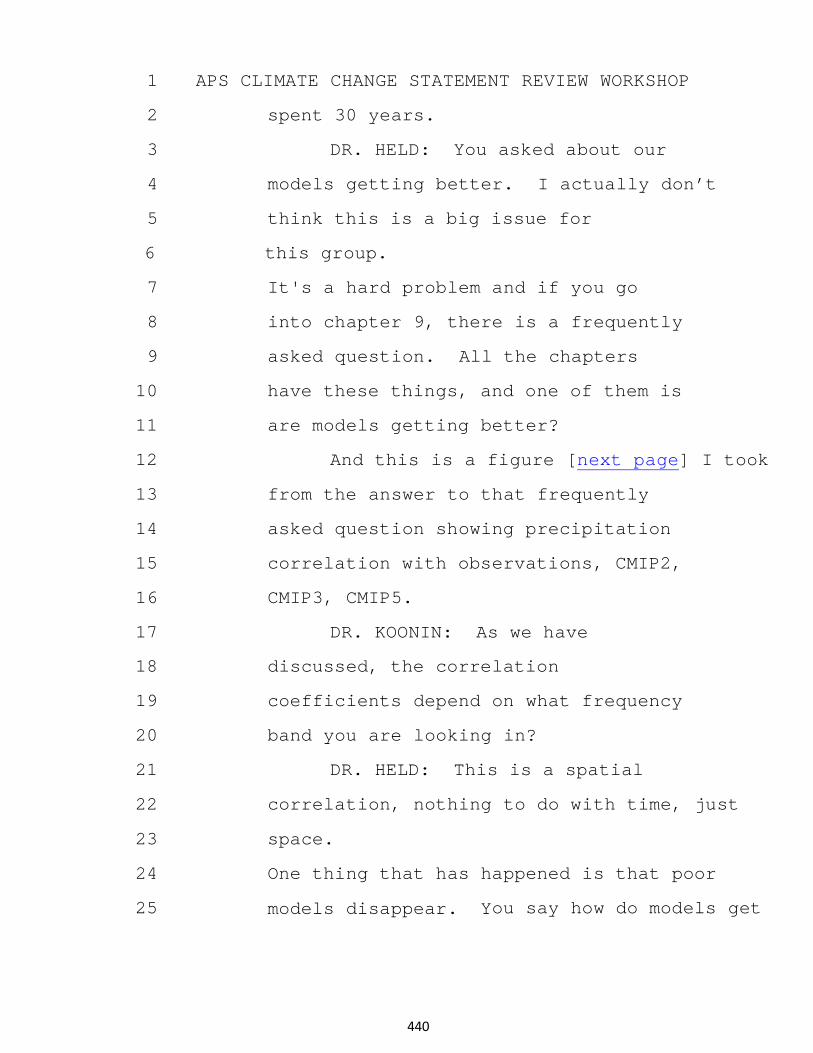
1 APS CLIMATE CHANGE STATEMENT REVIEW WORKSHOP
2 spent 30 years.
3 DR. HELD: You asked about our
4 models getting better. I actually don’t
5 think this is a big issue for
6 this group.
7 It's a hard problem and if you go
8 into chapter 9, there is a frequently
9 asked question. All the chapters
10 have these things, and one of them is
11 are models getting better?
12 And this is a figure [next page] I took
13 from the answer to that frequently
14 asked question showing precipitation
15 correlation with observations, CMIP2,
16 CMIP3, CMIP5.
17 DR. KOONIN: As we have
18 discussed, the correlation
19 coefficients depend on what frequency
20 band you are looking in?
21 DR. HELD: This is a spatial
22 correlation, nothing to do with time, just
23 space.
24 One thing that has happened is that poor
25 models disappear. You say how do models get
440
441
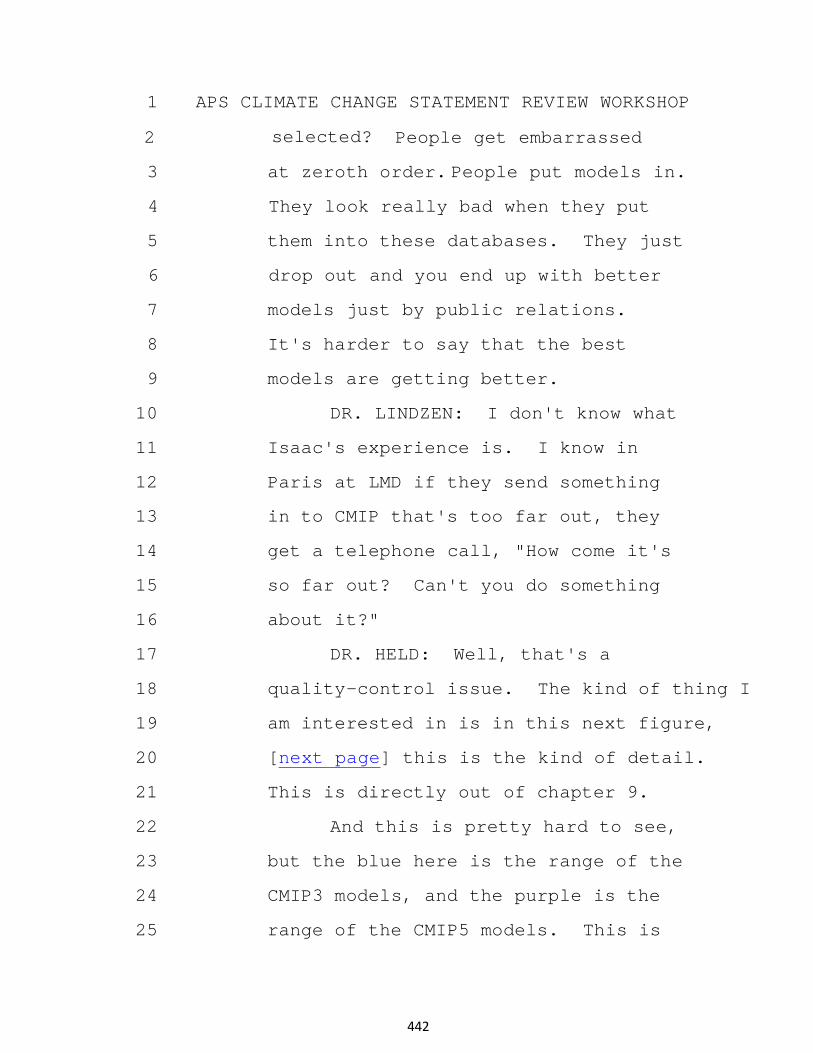
1 APS CLIMATE CHANGE STATEMENT REVIEW WORKSHOP
2 selected? People get embarrassed
3 at zeroth order. People put models in.
4 They look really bad when they put
5 them into these databases. They just
6 drop out and you end up with better
7 models just by public relations.
8 It's harder to say that the best
9 models are getting better.
10 DR. LINDZEN: I don't know what
11 Isaac's experience is. I know in
12 Paris at LMD if they send something
13 in to CMIP that's too far out, they
14 get a telephone call, "How come it's
15 so far out? Can't you do something
16 about it?"
17 DR. HELD: Well, that's a
18 quality-control issue. The kind of thing I
19 am interested in is in this next figure,
20 [next page] this is the kind of detail.
21 This is directly out of chapter 9.
22 And this is pretty hard to see,
23 but the blue here is the range of the
24 CMIP3 models, and the purple is the
25 range of the CMIP5 models. This is
442
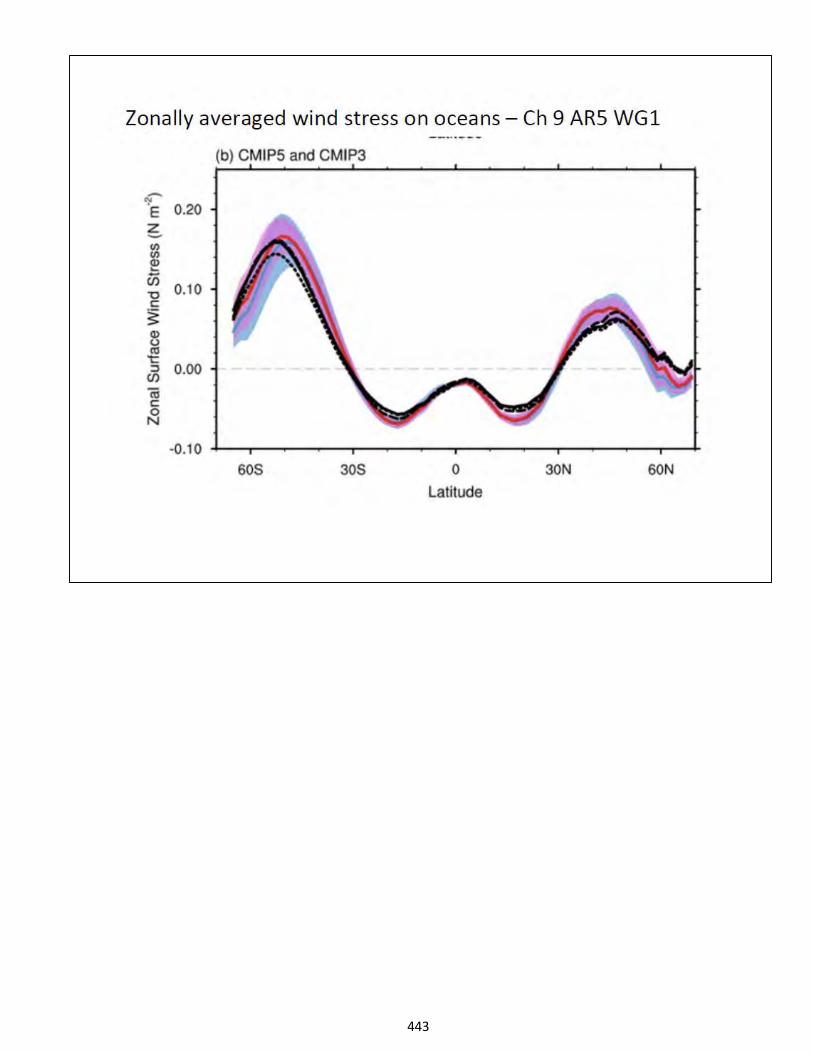
443
1 APS CLIMATE CHANGE STATEMENT REVIEW WORKSHOP
2 the zonal-average wind stress on the
3 ocean. That turns out to be a pretty
4 interesting quantity.
5 DR. KOONIN: Is that anomaly
6 relative to some absolute?
7 DR. HELD: This is just the
8 climatology. This is the absolute.
9 DR. KOONIN: Which is the data?
10 DR. HELD: The two estimates
11 are these black lines, two different
12 estimates.
13 DR. KOONIN: Good.
14 DR. HELD: And one thing that
15 happens, a lot of older models have
16 the Surface Westerlies, the roaring 40s
17 too far equatorward.
18 It turns out to be important
19 for stratosphere and troposphere
20 coupling in response to the ozone hole.
21 You get a rather different wind
22 response to the ozone hole just
23 because the ozone hole is happening
24 in the Antarctic; not too surprising.
25 That turns out to be important.
444
1 APS CLIMATE CHANGE STATEMENT REVIEW WORKSHOP
2 What we have left kind of,
3 and this turns out to be important as
4 well, is that the models are giving
5 us too-strong stresses on average, which
6 you can sort of vaguely see.
7 Why is that? I think that is
8 responsible for some other biases we
9 have. It's a signature of it. I
10 think it's a mystery.
11 As the models have gotten
12 better, they sort of converge on the
13 value of the wind stress. That means
14 the model is transporting too much
15 angular momentum horizontally
16 on average.
17 So, that's the kind of thing we
18 focus on. It's at higher order.
19 You can see the models are getting a
20 little better when you look at these
21 kinds of things-- here is another.
22 [next page] I just blew up the location of
23 the ozone hole.
24 I think this is one of the
25 great success stories of climate
445
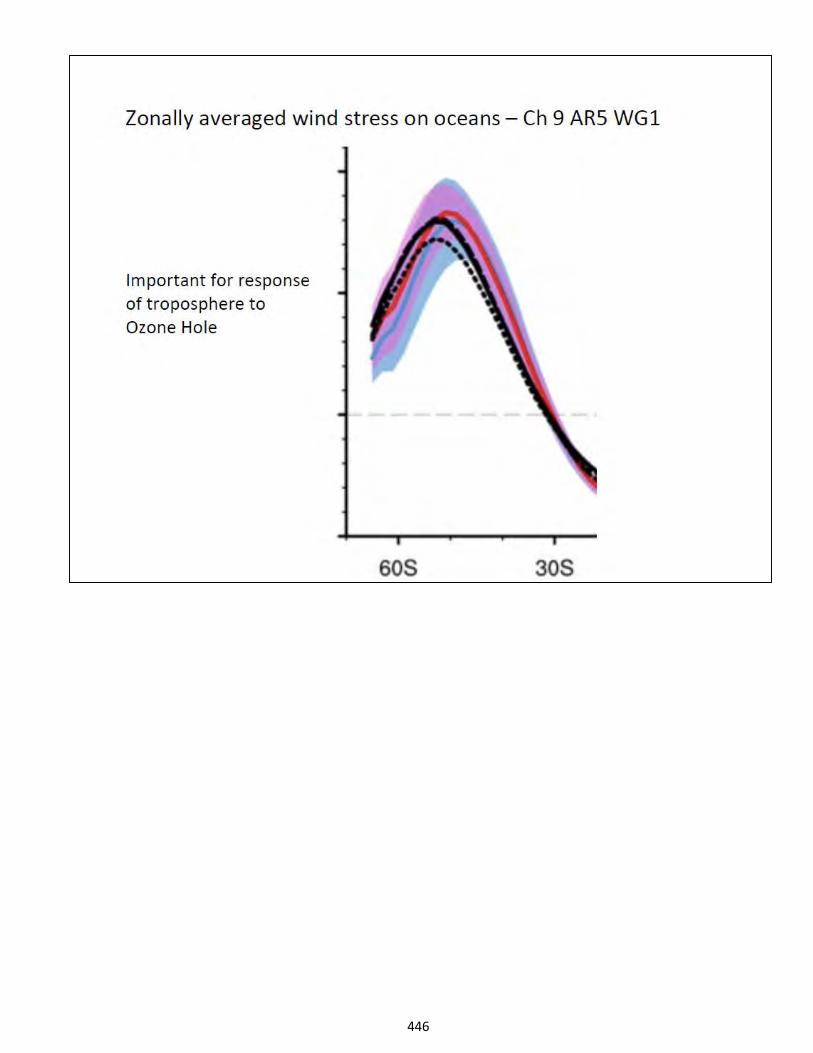
446
1 APS CLIMATE CHANGE STATEMENT REVIEW WORKSHOP
2 modeling in the last ten years. It
3 doesn't have too much to do with
4 greenhouse warming.
5 But there are observational
6 studies that suggest, and pretty
7 strongly, that when the ozone hole
8 developed, the Surface Westerlies
9 moved poleward. But, how
10 are you going to prove something like
11 that?
12 Current-generation models
13 do that very robustly. Every single
14 model, when you put in the ozone
15 hole, differ almost by a factor
16 of two in how much the Westerlies
17 move.
18 But that is arguably the
19 biggest circulation change we have
20 seen, because the ozone hole
21 developed so fast, it just had a big
22 effect, a little easier to discern.
23 We think the effect on the circulation of
24 the ozone hole and greenhouse gases
25 are comparable.
447
1 APS CLIMATE CHANGE STATEMENT REVIEW WORKSHOP
2 We talked about how do you
3 decide what metrics to use when you
4 are trying to rank models or weight a
5 model? That is a huge question.
6 There is a lot of question about
7 that. The problem is there are
8 literally thousands of things you can
9 compare. How do you choose between
10 all those?
11 And I think a good argument is,
12 to start with, to use those things
13 that are relevant for what you are
14 trying to predict. How do you know
15 what metric is relevant for what you
16 are trying to predict?
17 Well, you can start just by
18 looking at your ensemble of models
19 and say, within that ensemble, what
20 distinguishes between, say, a model
21 that dries the Sahel in the future and those
22 that don’t. You can look at something that
23 is observable in the present-day
24 simulation or 20th-century historical
25 simulation that distinguishes between
448
1 APS CLIMATE CHANGE STATEMENT REVIEW WORKSHOP
2 those models that dry the Sahel and those
3 that make the Sahel wetter. And that
4 is essentially defining a metric, I
5 think, and then you use the
6 observations.
7 And I think this approach [next page]
8 is becoming very popular. Bill
9 referred to it. Sometimes it's called
10 emerging constraints.
11 And Bill referred to this one
12 [left panel]which is usually the poster boy,
13 referring to snow albedo feedback
14 which, they are looking at the
15 seasonal cycle of snow cover in
16 models, saying that correlates very
17 well with the changes in snow cover
18 as you go forward in the projections.
19 And then you can look at the
20 observational constraint on the
21 seasonal cycle of snow cover and you
22 can improve your projection by
23 potentially an order of magnitude.
24 We have to believe that the
25 ensemble of models is certainly
449
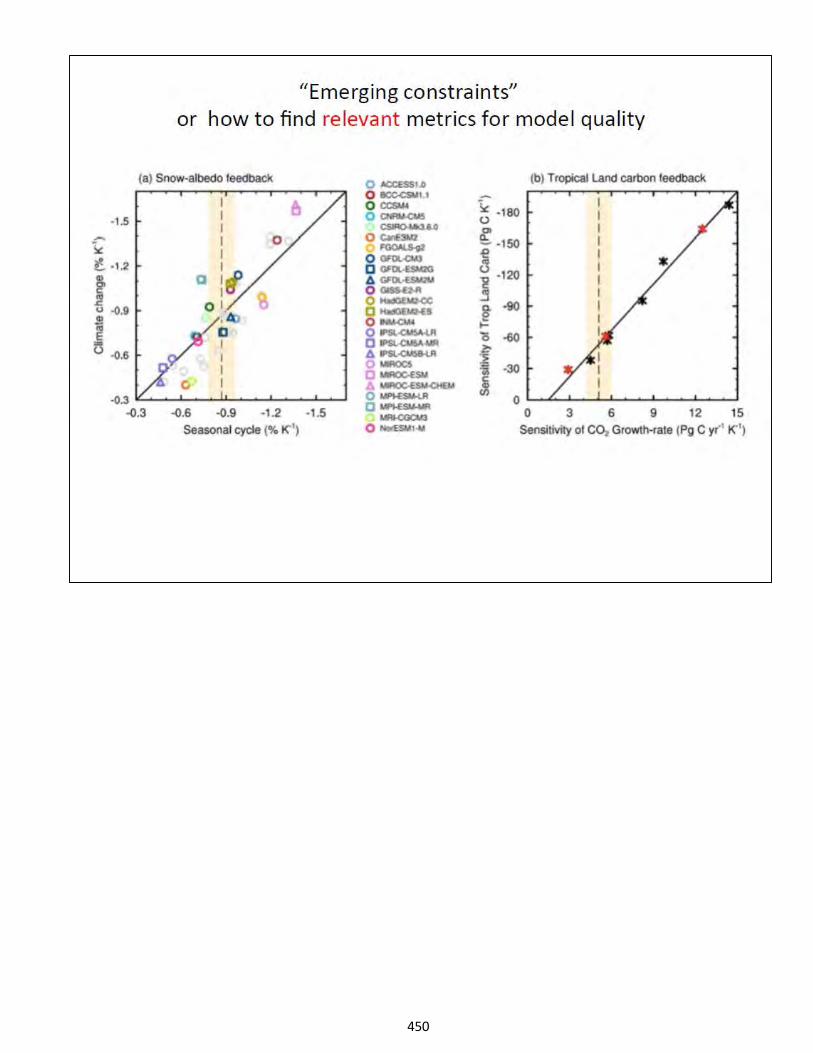
450
1 APS CLIMATE CHANGE STATEMENT REVIEW WORKSHOP
2 capturing this functional relationship.
3 And then there is some cancellation
4 of errors or something.
5 And this [right panel] is another one
6 that came up recently that is attracting a
7 lot of attention and a lot of
8 skepticism.
9 This relates to the question of
10 how much carbon the land surface is
11 going to take up in the future, which
12 is actually a pretty big uncertainty
13 in the big picture here, almost as
14 important as climate sensitivity
15 uncertainty, maybe as important.
16 And this claim was, actually, I
17 don't have the references here. I'm
18 sorry. The claim here is that you
19 can look at El Niño and look at how
20 much carbon the land is taking up
21 due to El Niño.
22 And that turns out to be in
23 this small ensemble. And here there
24 is a lot more skepticism with the
25 models at capturing all the physics
451
1 APS CLIMATE CHANGE STATEMENT REVIEW WORKSHOP
2 of snow. Snow albedo is simpler.
3 This works the same way.
4 Use the observed changes in CO2 on
5 ENSO time scales, which are mostly a
6 land absorption of carbon. Even
7 though El Niño is in the ocean, it is
8 mostly the land fluxes of the carbon
9 that are dominating the response of
10 CO2 to El Niño and use that as a constraint
11 on the models. And that seems to
12 constrain. Also, the model ensemble
13 mean is biased pretty high there.
14 So, that's one way of trying to
15 find constraints or metrics with which
16 to weight models. I don't use the
17 word "weight." In fact, some of
18 these outliers are valuable in
19 determining the functional
20 relationship. You want variations in
21 models.
22 So, you can try the same thing with
23 climate sensitivity, I have done this, a lot
24 of people have. I haven't done this
25 with CMIP5, though. Can you use the
452
1 APS CLIMATE CHANGE STATEMENT REVIEW WORKSHOP
2 historic, something about historical
3 temperature change?
4 In fact, if you use the
5 historical temperature change, the
6 models predict for greenhouse gas
7 only or something to try to -- I
8 mean, use observed temperature change
9 to predict future temperature change.
10 Doesn't seem to work. Certainly
11 doesn't work as well as these things.
12 So, that's kind of, you have to
13 be careful about what metrics you
14 use. If you are interested in
15 precipitation over the Sahel, we
16 tried all sorts of things.
17 I happen to be interested in
18 that. We haven't found a way to
19 distinguish between models that dry the
20 Sahel and models that don’t. We don't
21 have a metric for that.
22 DR. KOONIN: So, the ability to
23 then reproduce historical data is
24 neither necessary nor sufficient to
25 predict the future? Is that what I
453
1 APS CLIMATE CHANGE STATEMENT REVIEW WORKSHOP
2 understand?
3 DR. HELD: Well, there might be
4 something else you can use. And
5 people are looking at things. There
6 is a paper I just brought. I had a
7 copy of "Nature" on the train to read
8 the latest article on the subject.
9 People are trying to use
10 information about the simulation of
11 the observed cloud field to
12 distinguish between models with high-
13 and low-climate sensitivity.
14 So, let me talk about
15 Arctic/Antarctic. I didn't check the
16 time when I started, so just cut me
17 off, Steve.
18 DR. KOONIN: Let's go for
19 another two or three minutes and then
20 we will take some discussion and then
21 take a break.
22 DR. HELD: This [next page] will
23 be my last. Let me mention this one,
24 because this is one place I disagree
25 with John. So, we do a lot of these
454
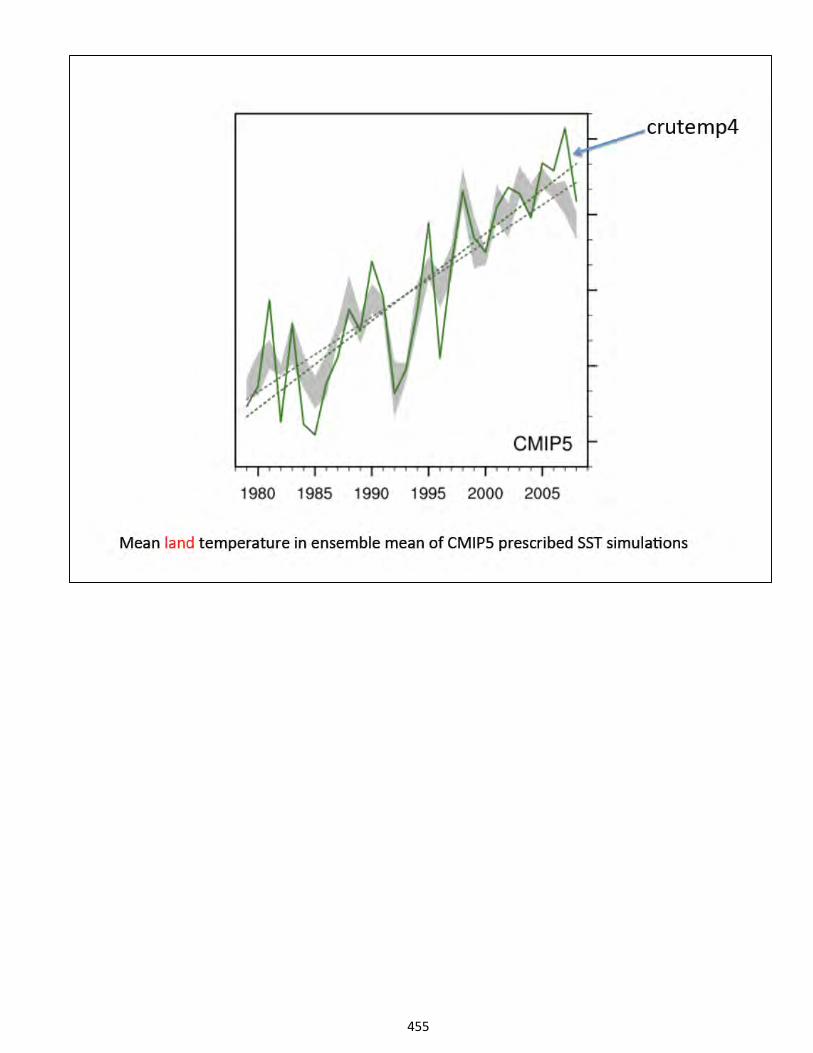
455
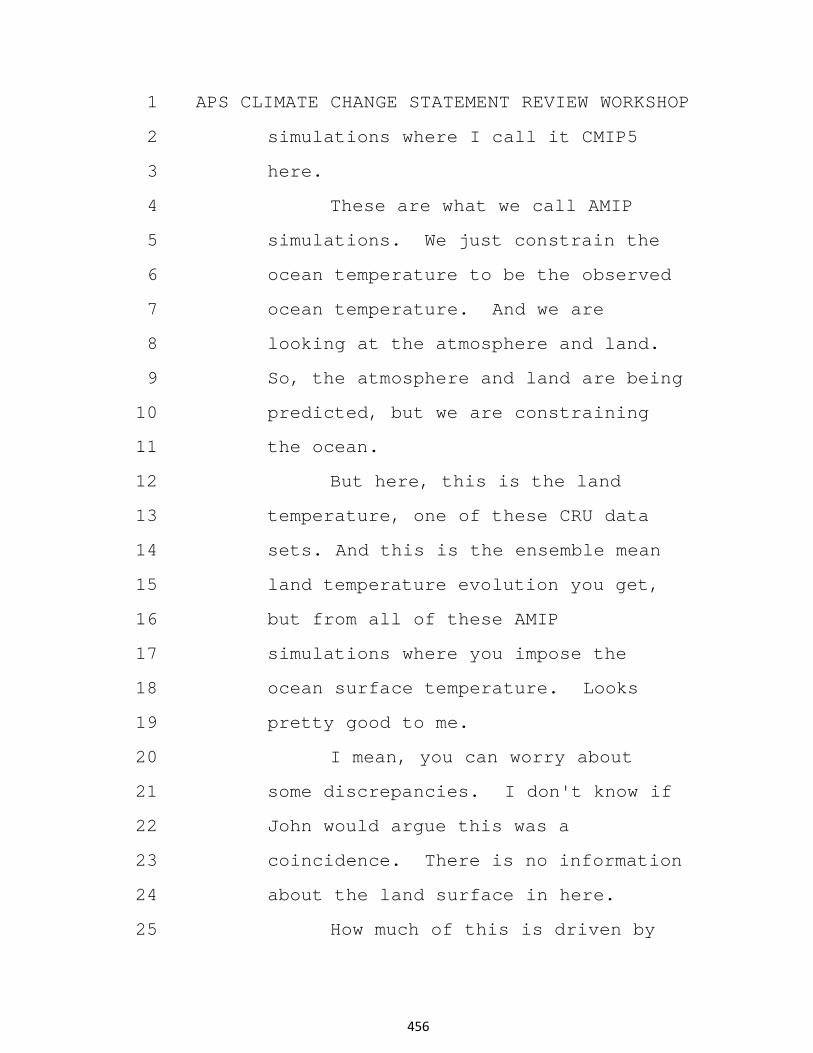
1 APS CLIMATE CHANGE STATEMENT REVIEW WORKSHOP
2 simulations where I call it CMIP5
3 here.
4 These are what we call AMIP
5 simulations. We just constrain the
6 ocean temperature to be the observed
7 ocean temperature. And we are
8 looking at the atmosphere and land.
9 So, the atmosphere and land are being
10 predicted, but we are constraining
11 the ocean.
12 But here, this is the land
13 temperature, one of these CRU data
14 sets. And this is the ensemble mean
15 land temperature evolution you get,
16 but from all of these AMIP
17 simulations where you impose the
18 ocean surface temperature. Looks
19 pretty good to me.
20 I mean, you can worry about
21 some discrepancies. I don't know if
22 John would argue this was a
23 coincidence. There is no information
24 about the land surface in here.
25 How much of this is driven by
456
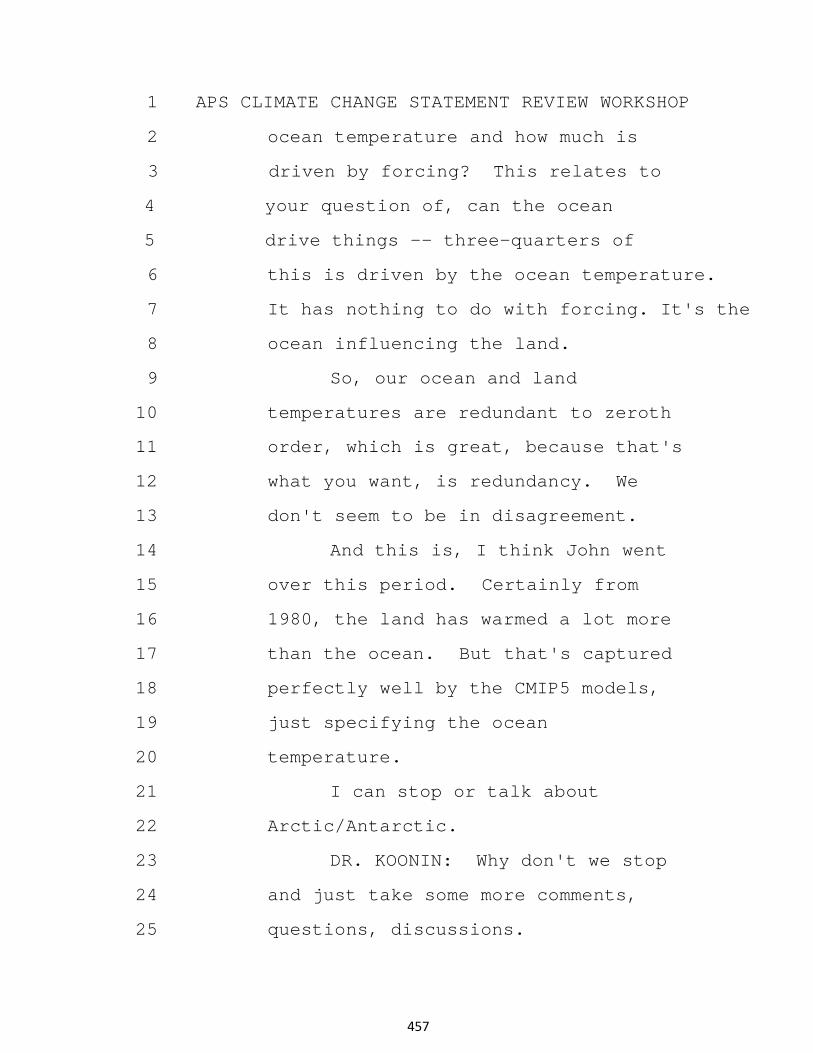
1 APS CLIMATE CHANGE STATEMENT REVIEW WORKSHOP
2 ocean temperature and how much is
3 driven by forcing? This relates to
4 your question of, can the ocean
5 drive things -- three-quarters of
6 this is driven by the ocean temperature.
7 It has nothing to do with forcing. It's the
8 ocean influencing the land.
9 So, our ocean and land
10 temperatures are redundant to zeroth
11 order, which is great, because that's
12 what you want, is redundancy. We
13 don't seem to be in disagreement.
14 And this is, I think John went
15 over this period. Certainly from
16 1980, the land has warmed a lot more
17 than the ocean. But that's captured
18 perfectly well by the CMIP5 models,
19 just specifying the ocean
20 temperature.
21 I can stop or talk about
22 Arctic/Antarctic.
23 DR. KOONIN: Why don't we stop
24 and just take some more comments,
25 questions, discussions.
457
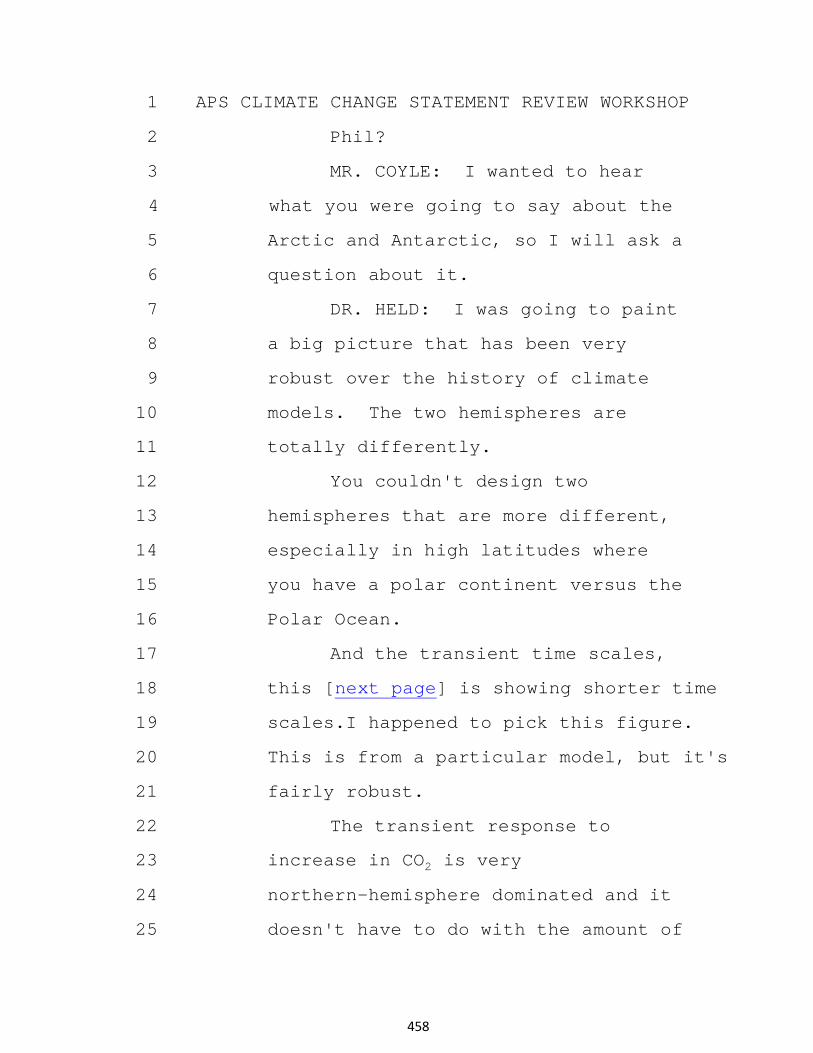
1 APS CLIMATE CHANGE STATEMENT REVIEW WORKSHOP
2 Phil?
3 MR. COYLE: I wanted to hear
4 what you were going to say about the
5 Arctic and Antarctic, so I will ask a
6 question about it.
7 DR. HELD: I was going to paint
8 a big picture that has been very
9 robust over the history of climate
10 models. The two hemispheres are
11 totally differently.
12 You couldn't design two
13 hemispheres that are more different,
14 especially in high latitudes where
15 you have a polar continent versus the
16 Polar Ocean.
17 And the transient time scales,
18 this [next page] is showing shorter time
19 scales.I happened to pick this figure.
20 This is from a particular model, but it's
21 fairly robust.
22 The transient response to
23 increase in CO2 is very
24 northern-hemisphere dominated and it
25 doesn't have to do with the amount of
458
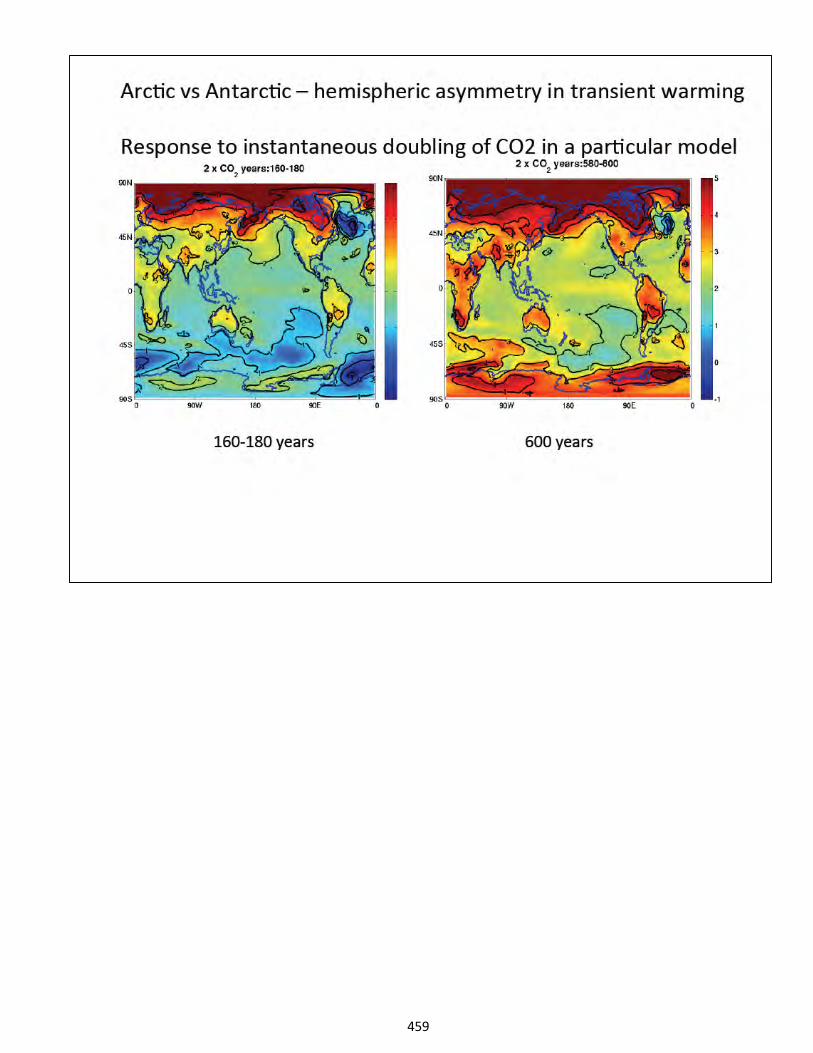
459
1 APS CLIMATE CHANGE STATEMENT REVIEW WORKSHOP
2 land versus ocean. What that has to
3 do with, is that on this time scale, the
4 surface ocean, down to a few hundred
5 meters has plenty of time to adjust.
6 It's really where your deep
7 ocean is coupled strongly to surface
8 ocean. So, northern North Atlantic
9 and the Southern Ocean are where we
10 have strong coupling to really deep
11 water.
12 DR. CHRISTY: What color is the
13 zero?
14 DR. HELD: Pardon?
15 DR. CHRISTY: What color is the
16 zero?
17 DR. HELD: The blue is not
18 cooling here. I'm sorry. That is
19 kind of a poor choice. But the very
20 dark blue is a cooling. Is that your
21 question?
22 DR. CHRISTY: Yes, I just
23 wondered about zero.
24 DR. HELD: Sorry about that.
25 Yes, the numbers get cut off.
460
1 APS CLIMATE CHANGE STATEMENT REVIEW WORKSHOP
2 DR. SEESTROM: On the right you
3 can see it.
4 DR. HELD: The zero is sort of
5 the blue. Sorry. This isn't
6 actually cooling except in this
7 particular model. And then you go
8 out to equilibrium. Of course you
9 get a picture with more symmetry.
10 DR. KOONIN: So again, the
11 essential physics here is the
12 coupling of the surface of the ocean
13 down to the deep --
14 DR. HELD: To the deep ocean.
15 And "deep," you really mean deep here
16 on these time scales. So, you are
17 starting with a prediction that, for
18 CO2, that you expect the Arctic to be
19 warming. The Antarctic isn't going
20 to do a whole lot on this time scale.
21 That's the starting point.
22 Now, this is actually a bigger
23 gradient between the hemispheres that
24 you see in observations, and that
25 suggests there are some aerosols.
461
1 APS CLIMATE CHANGE STATEMENT REVIEW WORKSHOP
2 It's another piece of evidence for
3 aerosol cooling in the north.
4 But so, zeroth order says,
5 well, you don't expect too much would
6 happen with Antarctic sea ice. And I
7 think with zeroth order, that's kind
8 of what you see. But you do see this
9 increase which the models I think
10 have a hard time getting.
11 So, what's going on with Antarctic
12 sea ice? The variability is
13 mostly wind-driven. That's thin ice.
14 It's not multiyear ice like we used
15 to have in the Arctic.
16 And you get stronger winds and
17 we are getting stronger winds from
18 the ozone hole, for example. You can
19 blow that ice through Ekman Drift, as
20 we call it. Combination of the
21 stress and the rotation drives the
22 ice further equator and then it sort
23 of fills in by cooling.
24 But the zeroth order is just
25 the wind drift driving gives you a
462
1 APS CLIMATE CHANGE STATEMENT REVIEW WORKSHOP
2 lot of variability in this thin
3 Antarctic ice. And it may be that
4 the models aren't responding strongly
5 enough to the ozone hole. It might
6 be the coupling with the ocean is off
7 or something.
8 We are not getting that
9 increase in Antarctic ice in most
10 models, anyway. But I think the
11 zeroth order, the picture from
12 greenhouse gases, you don't expect
13 the Antarctic to do that much.
14 DR. KOONIN: Phil, you got your
15 answer?
16 MR. COYLE: Thank you.
17 DR. KOONIN: Ben?
18 DR. SANTER: Just adding to
19 that, Isaac, that's one region over
20 Antarctica where there are also big
21 differences between these different
22 ozone forcing data sets, Chioni, et
23 al., and this new one that Susan and
24 colleagues have been working on.
25 DR. HELD: I get the impression
463
1 APS CLIMATE CHANGE STATEMENT REVIEW WORKSHOP
2 the models are underestimating the
3 ozone hole.
4 DR. SANTER: So, that could be
5 part of it.
6 I had one more question about
7 the Kosaka and Xie paper. So, in the
8 abstract of their paper, they claim
9 that the hiatus is basically internal
10 variability alone.
11 And I would just point out
12 that, of course, in the observed SST
13 changes over this region of the
14 Eastern Equatorial Pacific that they
15 are prescribing, it is possible that
16 there are volcanic signatures in
17 that. As I mentioned, most of these
18 eruptions are tropical.
19 We do see signatures of those
20 tropical eruptions in MSU lower
21 tropospheric temperature after
22 removing ENSO effects.
23 And given the tight coupling
24 between tropical SST and tropical
25 lower-tropospheric temperature, I
464
1 APS CLIMATE CHANGE STATEMENT REVIEW WORKSHOP
2 would expect something to be there in
3 the SSTs that they are specifying.
4 DR. HELD: I think it's mostly
5 internal variability myself.
6 DR. SANTER: Well, you may be
7 right. But I think where are they
8 are wrong is claiming that it was all
9 internal variability.
10 DR. HELD: I don't think you
11 can claim that based on their
12 experiment.
13 DR. SANTER: Yes.
14 DR. HELD: You can claim, as I
15 tried to say, that the explanation
16 has to flow through the Eastern
17 Equatorial Pacific one way or the
18 other.
19 DR. SANTER: It has to, but
20 their experimental design does not
21 cleanly separate bona fide internal
22 variability.
23 DR. HELD: I agree.
24 DR. KOONIN: Okay, anybody
25 else?
465
1 APS CLIMATE CHANGE STATEMENT REVIEW WORKSHOP
2 DR. LINDZEN: In the models,
3 what causes the 1919 to 1940 warming?
4 DR. HELD: The models tend to
5 underestimate it. There is no model
6 shown here.
7 DR. LINDZEN: No, no, I am
8 saying what do they do?
9 DR. HELD: Well, they miss the
10 peak of the warming. The greenhouse
11 gases leveled off in the World War II
12 years.
13 DR. LINDZEN: It's not going to
14 be greenhouse.
15 DR. HELD: I think there is
16 some internal variability there in
17 the models. And there are some
18 models that can produce this with
19 internal variability.
20 So, it's not implausible that
21 some of this hiatus period or most of it is
22 internal variability as well, which I
23 think is what Kosaka and Xie point to
24 as well.
25 DR. KOONIN: Let us take a
466
1 APS CLIMATE CHANGE STATEMENT REVIEW WORKSHOP
2 15-minute break and we will convene
3 for some group discussion.
4 (Whereupon, a brief recess was
5 taken.)
6 DR. KOONIN: So, we are in what
7 we are calling a panel discussion
8 among the speakers and subcommittee.
9 And we would like to keep it largely,
10 but not exclusively focused on
11 Working Group 1 science.
12 But as I said at the beginning,
13 we will allow excursions into
14 programmatics and policy and so on to
15 the extent that they don't get out of
16 hand.
17 I would like to start off by
18 seeing to what extent among our
19 experts we can get agreement,
20 beyond-consensus agreement, to a
21 number of statements of increasing
22 import and complexity.
23 And so, I will just ask as I
24 start to read through these, if
25 anybody has any objections, please
467
1 APS CLIMATE CHANGE STATEMENT REVIEW WORKSHOP
2 speak up and that will precipitate a
3 discussion.
4 I think the first is that the
5 global temperature has risen
6 certainly from, let's say, 1980 to
7 1998 or so in a fairly steep way, and
8 that post-1998 or '99, we have seen a
9 moderation of that trend, if not
10 flat-lining of the temperature.
11 In other words, there isn't
12 much disagreement about what the
13 global mean surface temperature
14 record is now compared to, let's say,
15 ten years ago or so.
16 DR. LINDZEN: I don't disagree
17 with the statement. But I think it
18 is still terribly important to keep
19 in mind how dicey the data is, and
20 too, how small the temperature change
21 is we are talking about. When you
22 talk about sharp increase, it's a
23 sharp increase of a few tenths of a
24 degree.
25 DR. KOONIN: Yes, good. Even
468
1 APS CLIMATE CHANGE STATEMENT REVIEW WORKSHOP
2 to say at a higher level, there isn't
3 much disagreement in the community
4 about what the global temperature
5 record is.
6 DR. LINDZEN: Including even if
7 you go to the UK Met Office and so
8 on, that there is an error bar that
9 isn't far off from 50 percent.
10 DR. KOONIN: Far off from
11 50 percent of …?
12 DR. LINDZEN: The change over
13 that period.
14 DR. KOONIN: Really?
15 DR. LINDZEN: Plus or minus .2
16 I don't think would be considered
17 off.
18 DR. HELD: Over that time
19 period, that sounds too big to me.
20 DR. SANTER: Certainly the
21 error bars get much bigger as you go
22 back in time. But in this period of
23 time, I think that sounds rather
24 large to me as well.
25 DR. KOONIN: Let me try to
469
1 APS CLIMATE CHANGE STATEMENT REVIEW WORKSHOP
2 phrase it yet another way. The IPCC
3 has in either the SPM or I think
4 chapter 2, a graph of GMST annual
5 values. Would anybody dispute that
6 there is a problem with those numbers
7 with the uncertainties that are
8 indicated?
9 DR. LINDZEN: Yes. Could I
10 ask, are you talking about
11 statistical uncertainty or systematic
12 uncertainty?
13 DR. JAFFE: If you took the
14 data and you ran a line through it
15 and calculated the statistical
16 uncertainty --
17 DR. LINDZEN: I defer to John
18 on this. But if you looked at the
19 temperature change latitude band by
20 latitude band for the period from '79
21 to '98, what was the contribution
22 from the tropics vis-à-vis high
23 latitudes?
24 DR. CHRISTY: Well, the high
25 latitudes are pretty much driven at
470
1 APS CLIMATE CHANGE STATEMENT REVIEW WORKSHOP
2 both.
3 DR. LINDZEN: So, the tropics
4 were small?
5 DR. CHRISTY: Fairly small,
6 yes. But you were talking about
7 statistical uncertainty.
8 And what we call statistical,
9 which is exactly how you defined, how
10 well does the trend line depict some
11 kind of modes versus measurement
12 uncertainty, and other kinds of
13 structural uncertainties and data,
14 spatial coverage and all that kind of
15 stuff.
16 DR. JAFFE: Right, that was the
17 question.
18 DR. CHRISTY: Yes, those are
19 two different ones. And for that
20 period, they are probably about the
21 same, probably less than a tenth of a
22 degree for an annual average.
23 DR. KOONIN: All right. Let me
24 try another statement. This one is
25 going to be interesting, that
471
1 APS CLIMATE CHANGE STATEMENT REVIEW WORKSHOP
2 certainly the atmospheric CO2 has
3 gone up over the last century, and it
4 is largely, almost exclusively an
5 anthropogenic increase due mostly to
6 burning fossil fuels.
7 DR. CHRISTY: I think people
8 like me would say that's what we have
9 been told, and I don't see any reason
10 to disagree with it very strongly.
11 DR. KOONIN: You know, even I,
12 no expert, I can cite what I think
13 are several reasons why there is a
14 good reason to believe it is
15 anthropogenic. Northern hemisphere
16 is bigger than southern hemisphere.
17 The isotopes ratio is consistent with
18 fossils.
19 DR. LINDZEN: But that is one
20 measurement, I believe.
21 DR. KOONIN: Well, the isotope
22 ratios get measured all the time,
23 almost daily.
24 DR. LINDZEN: Yes.
25 DR. KOONIN: That's one method.
472
1 APS CLIMATE CHANGE STATEMENT REVIEW WORKSHOP
2 DR. CURRY: It's beyond the
3 scope of what I can critically
4 evaluate.
5 DR. KOONIN: You don't
6 disagree?
7 DR. CURRY: No, I don't have
8 any reason to disagree with that.
9 DR. KOONIN: Let me try a
10 third. Sea-level rise has continued
11 over the last, I don't know, let's
12 say 60 years. It has been going up.
13 The current rate over the last
14 decade is higher than it has been
15 historically, but not at all
16 unprecedented in the record, again,
17 consistent with the uncertainties
18 that we have seen in the figures.
19 DR. CHRISTY: How far back are
20 you going with this?
21 DR. KOONIN: Oh, I don't know.
22 Let's go in the last 100 years. That
23 was the extent of the graph that we
24 saw for the rate and all that's in
25 the framing document.
473
1 APS CLIMATE CHANGE STATEMENT REVIEW WORKSHOP
2 DR. CHRISTY: So, the rate
3 right now is higher than the average
4 rate over the past 100 years?
5 DR. KOONIN: But not
6 unprecedented if you go back to 1940
7 or so.
8 DR. CHRISTY: As Judy said,
9 that's not my area of expertise, but
10 I believe that.
11 DR. KOONIN: None of you are
12 out on the street saying this is
13 wrong?
14 DR. LINDZEN: I think Carl
15 Wunsch's statement was probably the
16 most accurate. It's impossible to
17 say if it is significantly different
18 from the long-term trend, because
19 there are different instruments.
20 You have all sorts of
21 comparisons. It's just hard to say
22 anything. The statements that it's
23 unambiguously accelerated and so on,
24 I don't think there is a basis for
25 it; may be right.
474
1 APS CLIMATE CHANGE STATEMENT REVIEW WORKSHOP
2 DR. KOONIN: That's yet a step
3 further than I was going. I mean,
4 it's certainly been going up over the
5 last century.
6 DR. LINDZEN: You know, you
7 have all sorts of new data and they
8 are measuring different things. The
9 problem with sea level is, until you
10 had satellites, you were measuring
11 differentials between land and sea
12 governed by tectonics.
13 So, that was a huge mess. Now
14 you have something that is more
15 absolute. How do you compare the
16 two?
17 DR. KOONIN: Right. Let's try
18 another one. We have signatures of
19 anthropogenic influence on the
20 climate, but there is disagreement as
21 to how strong that influence is and
22 what it will be in future decades.
23 Let me not say "disagreement,"
24 but there is uncertainty. You have
25 signatures, but what is going to
475
1 APS CLIMATE CHANGE STATEMENT REVIEW WORKSHOP
2 happen in the future is uncertain.
3 DR. HELD: It's an empty
4 statement unless you quantify it.
5 DR. KOONIN: Well, propose a
6 quantification and let's see. The
7 IPCC said 50 percent, right, half?
8 DR. CURRY: No, more than
9 50 percent.
10 DR. LINDZEN: Well, 51 you are
11 not going to argue about.
12 DR. CURRY: I really don't
13 think it's 51. When they say "most,"
14 they are really thinking it is more.
15 DR. KOONIN: So, help me here.
16 What we can have an eruption, right?
17 DR. LINDZEN: What I was
18 suggesting is, if it's 100 percent,
19 that leaves you open to any
20 sensitivity down to about .75. If
21 it's less than 100 percent, then you
22 go down proportionately as a possible
23 lower bound.
24 The thing that I find peculiar
25 about the IPCC statement is, it's
476
1 APS CLIMATE CHANGE STATEMENT REVIEW WORKSHOP
2 sort of a red herring. It's made to
3 the public. It's immediately
4 interpreted as meaning a disaster is
5 around the corner.
6 But the statement itself is
7 compatible with a wide range of
8 possibilities, some of which are
9 totally benign.
10 So, it's a case where the
11 scientific community is permitted to
12 say something sort of reasonable with
13 the assurance that the advocacy
14 community will interpret it as it
15 wishes.
16 DR. KOONIN: Let me try; we are
17 going to go back again. Would
18 anybody disagree with the statement
19 that we have seen anthropogenic
20 influence on the climate?
22 DR. CHRISTY: By "climate," you
23 mean temperature?
24 DR. KOONIN: That's probably
25 the simplest interpretation, and I
477
1 APS CLIMATE CHANGE STATEMENT REVIEW WORKSHOP
2 mean more than regional.
3 DR. CHRISTY: I agree with
4 that, but I don't know how much.
5 DR. KOONIN: That's the second
6 step -- how much?
7 DR. CHRISTY: We don't have a
8 thermometer that says Mother Nature
9 did this much and humans did that
10 much.
11 DR. KOONIN: I get a sense we
12 are starting to approach our limit of
13 agreement here.
14 DR. LINDZEN: In a sense, we
15 wouldn't have needed any data or
16 proof or anything for that agreement.
17 DR. KOONIN: Because?
18 DR. LINDZEN: The physics says
19 you should have something. You have to have
20 a huge negative feedback to not have
21 anything. You know, normally there would be
22 something.
23 DR. KOONIN: So, a lot of the
24 discussion today has been just how much?
25 DR. LINDZEN: Yes, that's a
478
1 APS CLIMATE CHANGE STATEMENT REVIEW WORKSHOP
2 common physics concern.
3 DR. KOONIN: Well, there are
4 places you can do experiments it's a
5 lot easier to answer that question.
6 DR. LINDZEN: Yes.
7 DR. KOONIN: So, evidence in
8 the historical record, how much of the
9 historical record is greenhouse gases
10 versus aerosols versus natural
11 variability versus we just don't
12 understand about what the forcing
13 is, et cetera?
14 DR. LINDZEN: Consistent with
15 what sensitivity.
16 DR. KOONIN: All of that.
17 Bill, you look like you are
18 about to speak.
19 DR. COLLINS: No, no, I am just
20 nodding.
21 DR. KOONIN: Does anybody want
22 to propose a statement that goes
23 further to see if we can get
24 consensus? Well, let's try the IPCC
25 half. More than half --
479
1 APS CLIMATE CHANGE STATEMENT REVIEW WORKSHOP
2 DR. CURRY: To me, half is a
3 very awkward divider, because I
4 probably think it's 50 percent plus
5 or minus a bit. Once you say "more
6 than half" --
7 DR. KOONIN: How about if we
8 put the "half" in quotes?
9 DR. CURRY: Or maybe divide it
10 up into three.
11 DR. KOONIN: Terciles!
12 DR. LINDZEN: The
13 interpretative statement of the IPCC
14 would probably go a long way to
15 clarifying the issue, namely, a
16 statement that a significant part,
17 say, half in quotes, whatever you
18 want, of the observed temperature
19 change over the last 50 years or
20 whatever is likely to be
21 anthropogenic. But that leaves open
22 the sensitivity over a wide range.
23 DR. KOONIN: You said "likely
24 to be anthropogenic." IPCC says --
25 DR. LINDZEN: I think Isaac is
480
1 APS CLIMATE CHANGE STATEMENT REVIEW WORKSHOP
2 right. I mean, that didn't come from
3 any statistical analysis.
4 DR. BEASLEY: But I would say
5 when addressing this question, what
6 fraction is anthropogenic, I think I
7 would like to hear the comments about
8 what is in the IPCC report or a
9 statement that we feel it's better to
10 do it this way.
11 In other words, you can't just
12 leave that hanging there, because
13 there is a big gorilla out there,
14 right? So, I think it needs to be
15 addressed as a straw man if nothing
16 else. I am not saying you have to
17 accept that as the best
18 characterization.
19 But I think from the point of
20 view of thinking through from an APS
21 point of view, and if you all think
22 that's not the best characterization
23 and this would be better, I want to
24 know.
25 DR. CURRY: Even if you say
481
1 APS CLIMATE CHANGE STATEMENT REVIEW WORKSHOP
2 it's somewhere between 51 and 95,
3 that's a huge --
4 DR. KOONIN: Range.
5 DR. CURRY: -- range. And yes,
6 so it's not, to me, I never thought
7 it was a useful statement, because
8 it's a huge range. And whether it's
9 51 versus 95 makes a huge difference.
10 So, I don't think it's useful.
11 And this is the key question that we
12 don't know. We don't know how much
13 is natural and how much is
14 anthropogenic.
15 DR. LINDZEN: But also, after
16 that, we still don't know the
17 sensitivity.
18 DR. KOONIN: That's a different
19 issue.
20 Ben, do you have anything?
21 DR. SANTER: I think Isaac was
22 going to go first.
23 DR. HELD: I think the AR4
24 statement was a statement of
25 sensitivity. The AR5 statement in
482
1 APS CLIMATE CHANGE STATEMENT REVIEW WORKSHOP
2 the SPM is not, for better or worse.
3 DR. CHRISTY: My answer is I
4 don't know.
5 DR. KOONIN: Ben?
6 DR. SANTER: What gives me
7 confidence in the reality of
8 detection of the human effect on
9 climate is the internal and physical
10 consistency of the evidence.
11 Back around the time of the
12 second assessment report, one of the
13 criticisms of the balance of evidence
14 finding, just viable criticisms was,
15 you folks have essentially only
16 looked at surface temperature.
17 If there really is some
18 human-cause-to climate-change signal
19 lurking in the system, go after it in
20 water vapor. Look at ocean heat
21 content. Look at circulation
22 changes. Look at a bunch of
23 different things.
24 And that's what has happened.
25 And to me, the power of that sort of
483
1 APS CLIMATE CHANGE STATEMENT REVIEW WORKSHOP
2 work is that it's not a house of
3 cards resting on one surface
4 temperature data set.
5 People have interrogated very,
6 very different observational
7 estimates of ocean heat content
8 change, moisture over oceans,
9 circulation changes.
10 And the bottom line in all of
11 that is, there is internal and
12 physical consistency. To me, that is
13 very powerful.
14 DR. COLLINS: I would echo that
15 I think something that reflects the
16 multiple lines of evidence and
17 analytical techniques that point to
18 what appear to be at least a
19 plausible common cause would be an
20 accurate reflection of the
21 information that you have seen
22 presented by the IPCC and heard from several
23 of us today.
24 But my understanding from our
25 discussion over lunch or actually
484
1 APS CLIMATE CHANGE STATEMENT REVIEW WORKSHOP
2 when we were milling around in the
3 hallway is that this is not going to
4 be a statement, APS's assessment of
5 the IPCC assessment, right?
6 DR. KOONIN: No, we are not
7 doing that.
8 DR. COLLINS: Nor are you going
9 to come up with necessarily with sort
10 of a well -- let's -- oh,
11 greater-than-half-less-than-half
12 number while we are sitting here
13 sipping coffee. A great deal more
14 work went into all the different
15 estimates you heard from us today
16 than that.
17 So, I am a little nervous
18 about, I know what you are trying to
19 do, but it makes me -- even putting
20 the number "half" in air quotes, I
21 think, it is probably a disservice to
22 the amount of work that has gone
23 into --
24 DR. CURRY: But a lot of this,
25 at the end of the day, the "half"
485
1 APS CLIMATE CHANGE STATEMENT REVIEW WORKSHOP
2 comes from expert judgment, right?
3 It was a different group of people
4 sitting around a different table.
5 DR. KOONIN: With a different
6 set of coffee cups.
7 DR. COLLINS: Well, but
8 remember, the IPCC is an assessment
9 of literature and of model runs. Our
10 job is not to do research. We are
11 not sitting in that room sort of
12 guesstimating what those numbers
13 were, Judy.
14 DR. CURRY: More than half,
15 more than half, more than half, that
16 is an expert judgment. That's not
17 anything that popped out of any
18 statistical analysis. It even says
19 in there "expert judgment."
20 DR. KOONIN: I might point out
21 one social or political comment. The
22 Interacademy Council review of IPCC when it 23 happened, said that, among other
24 things, the IPCC should give a clear
25 line of reasoning for whatever
486
1 APS CLIMATE CHANGE STATEMENT REVIEW WORKSHOP
2 statements it made. And "expert
3 judgment" is, for me, a little bit
4 too coarse a reason.
5 DR. CHRISTY: A reason I don't
6 have confidence in these model things
7 and the consistencies that some
8 people find is I don't find
9 consistencies in the metrics I check.
10 And I think I am checking some
11 pretty basic metrics. And the models
12 just can't tell me why what has
13 happened.
14 DR. KOONIN: Isaac and then
15 Ben.
16 DR. HELD: It gets back to
17 physical consistency. I worry, are
18 there smoking guns out there that
19 will change the consensus? I think
20 we focused on two of them, the hiatus
21 and the tropical, upper tropospheric
22 warming. Those are real issues. I
23 don't have the answer.
24 I think they are related,
25 although I think the problem with the
487
1 APS CLIMATE CHANGE STATEMENT REVIEW WORKSHOP
2 satellite data on the upper
3 tropospheric warming seems to go back
4 a little bit earlier as John showed.
5 But I think to zeroth order, they may
6 be the same problem, that the tropics
7 isn't warming up very much.
8 Over the satellite era, the
9 models have overestimated tropical
10 warming. And at least in the
11 ensemble mean forced response, they
12 are overestimating Arctic warming.
13 There are some interesting things.
14 DR. SANTER: They are
15 underestimating the observed Arctic
16 warming in the lower troposphere.
17 DR. HELD: I was thinking of
18 sort of a normalized -- anyway, this
19 is focused on the tropics. They
20 overestimated. It could be something
21 else.
22 Let me just describe another
23 side of the coin, which is a little,
24 I don't think it's esoteric. But
25 when we try to force a model to have
488
1 APS CLIMATE CHANGE STATEMENT REVIEW WORKSHOP
2 something different than, not warming
3 as much as the moist adiabatic in the
4 tropics, we get a huge increase in
5 activity in the tropics, increase in
6 hurricanes.
7 This is the model which
8 produces pretty good distributions,
9 spatial, seasonal distribution of
10 tropical cyclogenesis. This has
11 consequences. You are destabilizing
12 the atmosphere pretty dramatically if
13 you take this at face value.
14 There are arguments in the
15 literature that that is not
16 happening, that we don't see anything
17 like that. The moist adiabatic
18 assumption is the most conservative
19 one you could possibly make as far as
20 minimizing the impact of warming on
21 the tropics.
22 DR. CHRISTY: It works on a
23 monthly scale with the data as well.
24 You see it on a monthly scale just
25 like that. It does work.
489
1 APS CLIMATE CHANGE STATEMENT REVIEW WORKSHOP
2 DR. HELD: The models, as far
3 as upper tropospheric warming during
4 ENSO events, the models are pretty
5 much spot-on. What is the difference
6 in the physics? The atmosphere has a
7 time scale of a month or something.
8 DR. LINDZEN: Without a great
9 deal of experience on it, I have
10 often wondered at the upper
11 troposphere where you have the Rossby
12 radius.
13 I know from personal data and
14 analysis that you have far more
15 horizontal variance in the surface
16 boundary there. So, if you have
17 a sampling problem, the sampling
18 problem is worse at the surface.
19 DR. HELD: That has motivated a
20 lot of ongoing work on whether the
21 surface data is consistent with the
22 upper-air data. A lot of that is
23 still in press, but it's an open
24 question.
25 DR. LINDZEN: Maybe we assume
490
1 APS CLIMATE CHANGE STATEMENT REVIEW WORKSHOP
2 the surface is good and the upper is
3 bad.
4 DR. HELD: I am interested in
5 whether they are consistent, as you
6 are.
7 DR. KOONIN: Ben?
8 DR. SANTER: Getting back to
9 this issue of the interpretation of
10 "most" and what that means, Judy
11 mentioned that that largely is coming
12 from expert judgment, not wholly, I
13 would say.
14 There are studies like a study
15 Tom Wigley and I published in
16 "Climate Dynamics" where we used the
17 very same sample models that Dick was
18 talking about and comprehensively
19 explored forcing uncertainty space,
20 uncertainty space in ocean diffusion,
21 uncertainty space in climate
22 sensitivity and looked at fitting two
23 observed surface temperature data
24 over various periods of time.
25 And the results of that study
491
1 APS CLIMATE CHANGE STATEMENT REVIEW WORKSHOP
2 was that the IPCC finding was likely
3 conservative. And indeed, it's
4 extremely likely that most of the
5 observed warming observed over the
6 second half of the 20th century is
7 due to anthropogenic greenhouse gas
8 concentrations.
9 It was very difficult to find
10 combinations of climate sensitivity
11 and aerosol forcing and diffusion,
12 ocean diffusion that would give you
13 something substantially less than
14 half of the observed warming.
15 DR. CURRY: To me, that is
16 circular reasoning where you define
17 multidecadal natural internal
18 variability out of existence. It is
19 just defined out of the problem.
20 DR. SANTER: You are not
21 defining it out of the existence.
22 DR. CURRY: No, out of your
23 analysis, though, in terms of
24 attribution.
25 DR. SANTER: Well, you are
492
1 APS CLIMATE CHANGE STATEMENT REVIEW WORKSHOP
2 looking at surface temperature data
3 that are affected by both external
4 forcing and by internal variability.
5 So, it's not entirely out of the
6 analysis.
7 DR. CURRY: But there have been
8 dozens of those kind of analyses and
9 they come up with different kinds of
10 results depending on how you frame it
11 and what you look at.
12 So, I don't find that, to me,
13 all that convincing. I am still in
14 the camp we don't know. And I don't
15 rule out a 50-percent kind of answer,
16 actually lower.
17 DR. SANTER: Well, I am just
18 pointing out that that kind of
19 conclusion doesn't arise from expert
20 judgment alone.
21 There is actually a substantial
22 amount of work with the simple models
23 that tries to directly address the
24 question how much is due to
25 anthropogenic greenhouse gas
493
1 APS CLIMATE CHANGE STATEMENT REVIEW WORKSHOP
2 increases.
3 DR. KOONIN: My sense is that
4 we are just about hitting the limit
5 of what we can get everybody to agree
6 on here.
7 DR. CHRISTY: A lot of "I don't
8 know”'s coming out.
9 DR. CURRY: Some people know;
10 some people don't.
11 DR. KOONIN: We could take this
12 in another way. We could get on to “How do
13 we make the science better going
14 forward?”
15 DR. CURRY: To me, this is what
16 I think the APS statement should be
17 out, not trying to judge stuff which
18 is really outside, in many ways, the
19 expertise of the Society.
20 But what do you see from all
21 this where the Society and the
22 membership can contribute going
23 forward? To me, this is the big
24 contribution that APS can make.
25 DR. CHRISTY: We would love to
494
1 APS CLIMATE CHANGE STATEMENT REVIEW WORKSHOP
2 hear from you.
3 DR. CURRY: Yes.
4 DR. KOONIN: What we think?
5 DR. CHRISTY: Yes, you seem to
6 have a menagerie here.
7 DR. KOONIN: Well, I think we
8 haven't quite milked all the
9 information out of you all, yet.
10 One thing I heard is that a
11 longer, more consistent, more
12 precise, better coverage in the data
13 of all the relevant variables is
14 extraordinarily important.
15 DR. CURRY: And uncertainty in
16 error assessments in the data, better
17 assessments.
18 DR. KOONIN: Yes, a lot of the
19 "I don't know"’s were couched in
20 “well, we don't have good enough data
21 back far enough.” And so, it seems to
22 me that if anybody is recommending
23 anything to the decision-makers, it's
24 make sure the data get covered in a
25 continuous, precise way.
495
1 APS CLIMATE CHANGE STATEMENT REVIEW WORKSHOP
2 DR. CHRISTY: Along with that,
3 for 15 years, I have been going to
4 Congress trying to get this done, a
5 red-team assessment of the climate
6 modeling enterprise.
7 These are truly independent, I
8 mean, it would be great to have
9 people from of APS or the engineering
10 societies who know about modeling and
11 simulation and how to test and so on.
12 If that independent group could come
13 and then look at the insides of these
14 things.
15 DR. SANTER: Excuse me, John,
16 but that was the rationale behind the
17 setting of the PCMDI that the
18 Department of Energy over 20 years
19 ago wanted to set up a group that had
20 no horse in the race, that was not
21 actively involved in model
22 development to independently analyze
23 fidelity with which models capture
24 important features.
25 DR. CHRISTY: From my view,
496
1 APS CLIMATE CHANGE STATEMENT REVIEW WORKSHOP
2 that was mainly an advocacy group
3 that came out of there.
4 MR. KOONIN: I will let Ari
5 speak since he has a personal
6 involvement in that.
7 DR. PATRINOS: No, I don't
8 think it was an advocacy group.
9 DR. SANTER: Our concern is
10 getting the science right. I would
11 dispute that characterization that
12 PCMDI and other model evaluation
13 centers are advocacy centers. The
14 greatest good for us is getting the
15 science right.
16 DR. ROSNER: If anything, the
17 Department of Energy has always been
18 accused of being partial in proving
19 that this is not a problem. That's
20 the battle we used to fight with the
21 department all the time.
22 DR. CURRY: I think there is a
23 disconnect between what Ben and John
24 suggest. I think John is suggesting
25 people looking at how the models are
497
1 APS CLIMATE CHANGE STATEMENT REVIEW WORKSHOP
2 constructed and the process of how
3 they are evaluated rather than just
4 the actual verification and
5 statistics, looking at a more
6 meta-kind of look.
7 DR. KOONIN: At some of these
8 experiments that we have been talking
9 about, numerical experiments?
10 DR. CURRY: Right.
11 DR. COLLINS: I would like to
12 point out that the committee also is
13 not -- we are not handing results
14 back to the international community
15 out of black boxes.
16 I think it's very important for
17 the committee to understand that, at
18 least in a number of cases, what you
19 have seen today certainly coming out
20 of the work that Ben did with PCM,
21 the work that I have done with the
22 CCSM and Isaac's work with the GFDL
23 model, these models are all -- we
24 live in a glass house.
25 So, the source code is
498
1 APS CLIMATE CHANGE STATEMENT REVIEW WORKSHOP
2 available. The input is available.
3 The output is available. The models
4 are completely described in
5 peer-reviewed literature. If you
6 want access to it, I can show you how
7 to download the model and can run it
8 on your Mac.
9 But these models, they are not
10 black boxes. They are subject to a
11 great deal of public scrutiny.
12 DR. CHRISTY: But there is
13 virtually no funding to do that.
14 DR. COLLINS: Fair enough. But
15 I want to make it very clear --
16 DR. CHRISTY: So, it's not
17 done. It's not done.
18 DR. COLLINS: Yes, but the
19 community is at least living up to
20 its side of the transaction in terms
21 of being extremely open.
22 DR. KOONIN: For the U.S.
23 models?
24 DR. COLLINS: Also
25 increasingly, too, for the European.
499
1 APS CLIMATE CHANGE STATEMENT REVIEW WORKSHOP
2 Hadley Centre is distributing their
3 model. The ECHO model been in the
4 public domain since the 1990s.
5 DR. LINDZEN: But it's not
6 always a practical issue.
7 DR. COLLINS: I understand
8 that. But I am just saying that the
9 community, we understand there may
10 not be a partner there, John, with
11 whom to handshake.
12 But that is essentially, we
13 have negotiated our side of the
14 transaction. This information is
15 entirely in the public domain. So,
16 if you have an issue with it, have at
17 it. It's all there.
18 DR. KOONIN: John said the word
19 "red team." One of the things that
20 characterizes a red team is the
21 attitude that it goes in with, which
22 is, "I am going to show what's wrong
23 with this." And we all know that's a
24 very important attitude to have in
25 science.
500
1 APS CLIMATE CHANGE STATEMENT REVIEW WORKSHOP
2 DR. ROSNER: But if I may,
3 also, we did have that with JASON.
4 DR. COLLINS: That's right.
5 DR. ROSNER: Within 15, 20
6 years, maybe it doesn't represent the
7 entire non-climate community, but it
8 came into the picture with a
9 jaundiced eye and wanted to
10 critically look at it, and it did.
11 Now, it may be time to do it
12 again or may be time to do it again
13 on a different scale. But it's not
14 that it wasn't done. And I take
15 issue with the fact that it was an
16 advocacy group.
17 DR. CHRISTY: When I say that,
18 I mean there was very little that
19 came out that was critical of the
20 models, of the type of analyses and
21 stuff that I had done.
22 DR. SANTER: That's not true.
23 DR. KOONIN: Ben or Bill?
24 DR. SANTER: Sorry, I would
25 really dispute that.
501
1 APS CLIMATE CHANGE STATEMENT REVIEW WORKSHOP
2 DR. CHRISTY: I am sure you
3 would.
4 DR. SANTER: I think we have
5 not swept differences between models
6 and observations under the table.
7 DR. KOONIN: Whoa, whoa, whoa.
8 DR. SANTER: Excuse me. Let me
9 finish, please.
10 I would say, John, that unlike
11 you, who just presented these
12 discrepancies and threw up his hands
13 and said, oh, we don't understand
14 these things, we have actually tried
15 to understand why the differences
16 exist and whether they are bona fide
17 model response errors, whether they
18 are forcing errors, whether they are
19 internal variability errors.
20 So, I don't think it's
21 sufficient to just do the kind of
22 analysis you have done, show
23 discrepancies and say this proves
24 that all models are wrong or are too
25 sensitive to anthropogenic greenhouse
502
1 APS CLIMATE CHANGE STATEMENT REVIEW WORKSHOP
2 gas concentrations. That is not
3 helpful in advancing the state of the
4 science.
5 DR. KOONIN: So, I was
6 surprised. I thought one of the
7 heating profiles John put up in the
8 model comparisons, that is a pretty
9 powerful figure.
10 There are perhaps reasons,
11 inadequate forcings, why that kind of
12 discrepancy exists. But it does
13 exist and I cannot find a hint of it,
14 or maybe there is, in the IPCC
15 documents. That is a failure.
16 DR. COLLINS: It's hard for me
17 to respond to that since I don't
18 know. John, what is the status of
19 that publication, those results and
20 their peer review?
21 DR. CHRISTY: We have already
22 have one of those out.
23 DR. COLLINS: But the heating
24 profile paper, the profile results?
25 DR. CHRISTY: That was in 2011,
503
1 APS CLIMATE CHANGE STATEMENT REVIEW WORKSHOP
2 I believe.
3 DR KOONIN: Should have been
4 there.
5 DR. COLLINS: Okay.
6 DR. SANTER: Steve, I would
7 point out that we published similar
8 results showing vertical profiles in
9 science in 2005 showing the CMIP3
10 results compared with satellite and
11 weather balloon profiles, and in 2008
12 as well. So, it's not some
13 startling, new thing.
14 DR. KOONIN: So again, I ask, as we
15 saw it today. Gosh, that's pretty
16 interesting. Somebody needs to
17 explain that discrepancy. First time
18 I have ever heard about it. It's not
19 in the IPCC report.
20 DR. CHRISTY: It's in the IPCC.
21 But as I said in the observation
22 chapter, they called it, well, the
23 observations said, "We have only low
24 confidence in the observations."
25 That allowed the chapters 9 and 10
504
1 APS CLIMATE CHANGE STATEMENT REVIEW WORKSHOP
2 not to really address it.
3 DR. KOONIN: That's interesting
4 because I heard from Ben and Bill
5 it's the forcing we don't have
6 confidence in, not that we don't have
7 confidence in the observations.
8 DR. CHRISTY: In chapter 2,
9 which is about observations, probably
10 not observations on forcing, but
11 that's what they said. And I just
12 don't agree with that. I think for
13 this problem, those data are
14 certainly good enough.
15 DR. KOONIN: Isaac?
16 DR. HELD: We can focus on the
17 AR5, but this problem has been
18 recognized for a long time. And
19 there was an academy committee
20 specifically devoted to addressing
21 this issue.
22 DR. COLLINS: In 2000.
23 DR. HELD: Way back, yes.
24 DR. SANTER: And a USCCSP
25 report in 2006.
505
1 APS CLIMATE CHANGE STATEMENT REVIEW WORKSHOP
2 DR. HELD: You can't get a
3 model to depart from the moist
4 adiabatic very much. As far as in
5 the atmosphere, the models are very
6 stiff. You can get the ocean
7 temperature to do different things.
8 DR. KOONIN: I am going to go
9 back to a higher level. We sort of
10 entered this little discussion about
11 model red team or closer scrutiny of
12 the models.
13 Okay, that's one thing one can
14 imagine the Society will be opining
15 on, the data and others. We have
16 talked about that. Are there other
17 things?
18 Phil?
19 MR. COYLE: Well, I would like
20 to go back to the question I asked
21 Dr. Christy, namely, what do you all
22 think we, the United States, should
23 do that we are not doing now, do
24 differently, do additionally if the
25 APS says anything about this, which
506
1 APS CLIMATE CHANGE STATEMENT REVIEW WORKSHOP
2 has not yet been determined? We are
3 early in the process.
4 But if the APS says anything
5 about this, it may have policy
6 implications. So, if our experts
7 agree on certain things that you
8 think the country ought to be doing,
9 that would be important to know.
10 DR. HELD: This is in
11 relationship to science or in
12 relationship to politics?
13 DR. KOONIN: Science, science,
14 science first, science.
15 DR. CHRISTY: Back to the
16 observations --
17 MR. COYLE: Is it funding for
18 balloons? What is it?
19 DR. CHRISTY: This country
20 could establish the right kind of
21 balloon stations, for example, in
22 places that can't afford it, that
23 don't have the infrastructure to do
24 this.
25 DR. KOONIN: John, sorry, but
507
1 APS CLIMATE CHANGE STATEMENT REVIEW WORKSHOP
2 the right kind of balloons?
3 DR. CHRISTY: Balloon stations
4 and other kind of remote sensing that
5 is ground-based. Then, and Judy
6 might know about this.
7 You're still on the NASA NAC?
8 DR. CURRY: No, thank God.
9 DR. CHRISTY: Oh.
10 The satellite systems are, they
11 are threatened. And the satellite
12 systems that we have are really the
13 only way to get some global pictures
14 of this stuff.
15 DR. BEASLEY: Can I ask you,
16 just a rough answer, the balloons or
17 the ground-based stuff you are
18 talking about, that doesn't strike me
19 as something that is hugely
20 expensive, hundreds of millions?
21 DR. CHRISTY: No, it would be
22 less than that. But, you know, are
23 you going to get a guy out of
24 Kerguelen Islands in the South Indian
25 Ocean to do it?
508
1 APS CLIMATE CHANGE STATEMENT REVIEW WORKSHOP
2 DR. BEASLEY: No, no, I
3 understand. But it is not like the
4 diseconomy in energy physics where
5 it's up there in the billions now?
6 DR. CHRISTY: No, no, no.
7 DR. ROSNER: But, I think, to
8 be fair, you have to scale the needs
9 of a program like that to the size of
10 the budgets of the agency that
11 supports that work.
12 DR. BEASLEY: That's fine.
13 DR. ROSNER: NSF budgets are
14 different than NASA budgets.
15 DR. KOONIN: Again, we
16 shouldn't worry about if the APS says
17 anything at all about this. It
18 should not worry about that.
19 Bill and then Ben.
20 DR. COLLINS: I think several
21 people have mentioned that we are
22 entering an era where we need to keep
23 the observational networks running.
24 The other tension here that we
25 haven't talked about so much is the
509
1 APS CLIMATE CHANGE STATEMENT REVIEW WORKSHOP
2 fact that these networks are
3 primarily built or have been
4 traditionally built for operational
5 weather forecasting. And those
6 observations don't need to capture
7 long-term trends.
8 So, they are inherently not
9 designed to be accurate over longer
10 time scales. And what inevitably
11 happens, what is happening now, I
12 shouldn't even mention agency names,
13 but the agency that -- you frequently
14 see climate sacrificed to weather.
15 That's basically the sacrifice that
16 happens.
17 And what would be nice is a
18 statement that says both observations
19 are intrinsically valuable and it
20 would be nice to have observations
21 that are useful for both weather and
22 climate, since they are both
23 end-proposition, regardless of what
24 the observing system is.
25 And what that means, to
510
1 APS CLIMATE CHANGE STATEMENT REVIEW WORKSHOP
2 translate it into English, is that
3 the sensors need to be carefully
4 characterized so that we can build
5 long-term series for them and ideally
6 be a little bit more accurate than
7 they currently are. But a good
8 network, maintain the network.
9 DR. CHRISTY: We have written
10 in our reports about this very
11 thing, exactly what you are talking
12 about.
13 DR. COLLINS: That's right.
14 DR. KOONIN: Didn't some agency
15 that shall remain unnamed establish a
16 national climate service?
17 DR. COLLINS: No, they did not.
18 DR. HELD: They wanted to.
19 DR. KOONIN: They did not?
20 DR. COLLINS: No, they did not.
21 That went down in flames.
22 DR. SANTER: I just wanted to
23 point out that if the APS committee
24 is going to make some statement along
25 the lines John mentioned regarding
511
1 APS CLIMATE CHANGE STATEMENT REVIEW WORKSHOP
2 red teams and the need to subject
3 models, their development to more
4 scrutiny, I hope the APS will do the
5 same with observations, particularly
6 with satellite-based estimates and
7 weather balloon-based estimates of
8 atmospheric temperature change.
9 One of the things that I have
10 learned over the last 15 years in my
11 involvement with the MSU issue is the
12 extraordinary uncertainties.
13 It's a very, very difficult job
14 to construct climate-quality data
15 sets from well over a dozen drifting
16 satellites with all of these very,
17 very complex orbital drift effects
18 that affect the sampling of the
19 diurnal cycle, uncertainty in the
20 diurnal cycle.
21 And we saw that today.
22 Somebody asked the question well, in
23 those overlapping trends, why do you
24 get the difference between the red
25 and the blue lines?
512
1 APS CLIMATE CHANGE STATEMENT REVIEW WORKSHOP
2 To me, we have only a couple of
3 groups that are looking at these
4 satellites-based estimates of
5 atmospheric temperature changes.
6 They yield different results.
7 I think that having a better
8 understanding of why they differ and
9 what the real residual uncertainties
10 are in those measurements and in the
11 balloon measurements with their equal
12 difficulties with changes in
13 instrumentation, the thermal
14 shielding of the sensors, those are
15 real things.
16 And oddly, there are far fewer
17 groups looking at those issues than
18 there are climate modeling centers.
19 So, if you are going to say something
20 about the need to red-team climate
21 model development and analysis, I
22 would hope you would say the same
23 about the development of
24 observational data sets.
25 DR. BEASLEY: What about in the
513
1 APS CLIMATE CHANGE STATEMENT REVIEW WORKSHOP
2 ocean?
3 DR. SANTER: You know, the
4 ocean, it's the same thing. As Judy
5 mentioned, there are XBTs. There are
6 these Argo floats. There are buoys.
7 There are a whole bunch of different
8 measurement systems and they change
9 in a spatially and temporally
10 nonrandom way.
11 So, when you try and identify
12 biases in each of these and adjust
13 for these spatially and temporally
14 nonrandom changes over time, it's
15 tough.
16 You want to do ocean reanalysis
17 and depending on the ocean model you
18 use, you get different results if you
19 use an ocean model to fill in the
20 gaps and assimilate those
21 observations. It's an equally tough
22 problem.
23 DR. BEASLEY: Probably more
24 expensive.
25 DR. JAFFE: I would like to
514
1 APS CLIMATE CHANGE STATEMENT REVIEW WORKSHOP
2 deflect the question back to this
3 question of policy. APS statements
4 and reports are fundamentally
5 scientifically based, but they do
6 make policy recommendations.
7 And to quote from a famous APS
8 statement, "The APS also urges
9 governments, universities, national
10 laboratories and its membership to
11 support policies and actions that
12 will reduce the emission of
13 greenhouse gases."
14 And it seems to me that if we
15 write a report that makes motherhood
16 statements about supporting -- not
17 "we," but you, and then the APS
18 adopts a report that makes motherhood
19 recommendations about supporting more
20 research, makes acceptable statements
21 about holding up models to greater
22 scrutiny and data collection to
23 greater scrutiny, the elephant in the
24 room will be well, what do you think
25 about policy recommendations on
515
1 APS CLIMATE CHANGE STATEMENT REVIEW WORKSHOP
2 greenhouse gases?
3 And I wonder whether that
4 should be a subject for discussion
5 here while we have some wonderful
6 experts.
7 DR. KOONIN: We, of course,
8 talked about that in subcommittee.
9 And when you do that you start to get
10 into issues that extend beyond the
11 expertise of physicists.
12 You are into certainly
13 ecosystem. You are into economics.
14 You are into mitigation technologies.
15 You are into value judgments. How
16 much do you value today versus
17 tomorrow?
18 And it's now obvious to me that
19 we will have a discussion, I am sure
20 all of us, in the course of putting a
21 statement together, about to what
22 extent do physicists have a special
23 claim on that kind of knowledge or
24 that kind of expertise.
25 DR. JAFFE: You make very
516
1 APS CLIMATE CHANGE STATEMENT REVIEW WORKSHOP
2 strong statements about nuclear
3 weapons.
4 DR. KOONIN: Well, we can argue
5 about that. Judy, I want to hear
6 what she has to say.
7 DR. CURRY: Personally, I don't
8 think the scientific societies should
9 make statements about those kind of,
10 what I would call public policy that
11 is not related to the policy of
12 science like we need more observing
13 systems and things like that.
14 Apart from the expertise, I
15 mean, you should only speak to where
16 your expertise is and as you
17 describe. And I am not even sure
18 that APS has sufficient expertise on
19 the climate issue to be making a
20 statement at all. That is my
21 personal opinion.
22 And the AAAS held a workshop
23 and I did mail that to the committee
24 I think indirectly through -- I think
25 Steve must have gotten it -- about
517
1 APS CLIMATE CHANGE STATEMENT REVIEW WORKSHOP
2 the AAAS had a workshop on what is
3 the appropriate thing for advocacy,
4 for individual scientists and what is
5 irresponsible advocacy and for
6 institutions?
7 And it gave some criteria. And
8 the first one is speak to your area
9 of expertise. And so, not only is
10 mitigation policy outside your
11 expertise, I would even argue that
12 the whole issue of global warming
13 climate change is broadly outside the
14 expertise of the Society.
15 Now, APS has been very active
16 in talking about vaccines and all
17 sorts of things that I imagine they
18 don't have any expertise at all. So,
19 that has been sort of the history, a
20 lot of advocacy.
21 But I think the Society should
22 step back and think about, you know,
23 what defines responsible advocacy for
24 your society. And if you are going
25 to make a statement, I think it would
518
1 APS CLIMATE CHANGE STATEMENT REVIEW WORKSHOP
2 have a far greater impact if you do
3 really stick to the things like
4 better observing systems,
5 disagreement, this is how we can sort
6 it out, and some specific rules for
7 the Society and topical areas that
8 you want to get into.
9 Then I think you have a more
10 powerful and useful statement than
11 advocating for greenhouse gas
12 emission policy. That's my personal
13 take on it.
14 And it's speaking to your
15 expertise. And once you go outside
16 of your expertise as a society, apart
17 from what the members, they can raise
18 their hand and vote oh, we all want
19 to say something about mitigation,
20 but at the end of the day, it is
21 outside their expertise. I would be
22 very careful.
23 DR. KOONIN: Dick and then
24 Bill.
25 DR. LINDZEN: I would like to
519

1 APS CLIMATE CHANGE STATEMENT REVIEW WORKSHOP
2 see, getting back to the science
3 issue of improved observational
4 networks and so on, could we do, or
5 could somebody do the Gedanken
6 experiment of saying, let's say we
7 had that system and it was running
8 for five years or ten years. How
9 would it change our assessment of
10 anything?
11 DR. COLLINS: I think the
12 issue, Dick, is I am after longer
13 records.
14 DR. LINDZEN: Yes, yes, and so on. 15 So, if you are asking for something,
16 it probably would pay to show
17 explicitly what it would
18 resolve over what time.
19 DR. KOONIN: You can do
20 pseudodata experiments, right?
21 DR. LINDZEN: Sure.
22 DR. KOONIN: Take your model
23 and generate 1,000 years of data.
24 DR. LINDZEN: 1,000 years?
25 DR. KOONIN: All right, 100.
520
1 APS CLIMATE CHANGE STATEMENT REVIEW WORKSHOP
2 But then you assume you know
3 everything or you know only 50
4 percent, et cetera, or even ten
5 years? Have those things been done,
6 that kind of thing?
7 DR. LINDZEN: No.
8 DR. SANTER: Yes.
9 DR. COLLINS: Well, yes, they
10 have. We have run climate observing
11 system simulation experiments for
12 other applications, Dick, for things
13 like some of the NASA satellites.
14 We have looked at that issue,
15 tundra detection and climate change
16 using observing system networks. So,
17 it has been done.
18 DR. KOONIN: Bob and then Bill.
19 DR. ROSNER: I want to follow
20 up on what Judy said. So, it
21 struck me that one area of physics
22 uncertainty has to do with deep ocean
23 sampling.
24 The question I have is, so,
25 what would be the experimental
521
1 APS CLIMATE CHANGE STATEMENT REVIEW WORKSHOP
2 campaign that you would need to mount
3 in order to actually set up the
4 physics to be able to improve the
5 models? What is involved?
6 DR. CURRY: Okay, well, there
7 is tracers, argon and various other
8 things that are used to look at that,
9 gravity, wave breaking associated
10 with bottom topography.
11 It's something that people are
12 working on it. But to me, this is
13 looming as if the ocean ate the
14 global warming, we have to understand
15 some mechanisms.
16 DR. ROSNER: But I am asking,
17 what would you need to do? That's
18 what I am asking.
19 DR. LINDZEN: I think even in
20 the oceanographic community, the
21 people I know would not have
22 something ready at hand saying "if
23 only we had this."
24 DR. CURRY: Right. It's very
25 subtle. A lot of these things, yes,
522
1 APS CLIMATE CHANGE STATEMENT REVIEW WORKSHOP
2 it's a tough problem. But I think
3 thinking about it in a meta way would
4 be beneficial.
5 DR. ROSNER: So, for example,
6 if you wanted to understand
7 thermohaline mixing, say, deeper
8 down, are there experiments that
9 people have --
10 DR. HELD: Ongoing experiments.
11 They are quite expensive.
12 DR. ROSNER: Never mind that.
13 I am just curious what has been
14 talked about?
15 DR. HELD: There's tracer
16 release experiments. People go out,
17 release sulfur hexafluoride and come
18 back five years later to measure it.
19 DR. ROSNER: Where is it?
20 DR. HELD: Yes, where is it?
21 And there are natural tracers that
22 are arguably even more useful. CFCs
23 are the best.
24 DR. LINDZEN: And our field
25 benefitted greatly from the nuclear
523
1 APS CLIMATE CHANGE STATEMENT REVIEW WORKSHOP
2 tests.
3 DR. KOONIN: You sold out!
4 DR. HELD: I would just be
5 careful. I don't know if I still
6 have the floor here?
7 DR. KOONIN: Yes, you do.
8 DR. HELD: We have heard
9 discussions of mixing being important
10 for getting the heat down. That's
11 not necessarily the case.
12 You can get heat down below
13 a certain level just by adiabatic
14 rearrangement of water, just tilting
15 the isoclines of temperature.
16 You have to be careful when you
17 talk about mixing, quote/unquote.
18 It's not clear that's what is going
19 on on these time scales at all.
20 DR. CURRY: That's a question
21 whether to what extent it is mixed
22 versus not in terms of --
23 DR. HELD: That has a big
24 effect whether it is going to come
25 out quickly or not.
524
1 APS CLIMATE CHANGE STATEMENT REVIEW WORKSHOP
2 DR. KOONIN: Yes, yes, yes,
3 some better characterization of the
4 deep oceans.
5 DR. ROSNER: That's what I am
6 getting at.
7 DR. KOONIN: We don't have to
8 get into that.
9 DR. HELD: I think one idea
10 is getting the Argo float program to
11 go down to the bottom of the ocean.
12 Right now it doesn't. That would
13 help.
14 DR. KOONIN: I want to come
15 back to the question Bob raised and
16 Judy addressed a little bit is, how
17 appropriate is it for the Physical
18 Society to go beyond the obvious
19 scientific expertise?
20 And we have heard one instance
21 cited already, Bob, in the nuclear
22 weapons example. We can have a group
23 discussion about how effective that
24 particular set of statements has been
25 in modulating U.S. nuclear policy.
525
1 APS CLIMATE CHANGE STATEMENT REVIEW WORKSHOP
2 You know, if we had experts in
3 deterrence, if we had experts in
4 geopolitical doctrine, et cetera,
5 et cetera, then it probably would
6 have been more effective. The
7 Society does not have that, at least
8 collectively. But its individual
9 members do, some of whom we know well.
10 DR. JAFFE: When we studied
11 critical materials and made policy
12 recommendations, we had a committee
13 that had geologists, economic
14 geologists, physical chemists and so
15 on.
16 So, we did do what I thought
17 Judy was suggesting we do in getting
18 a group of expertise. That was the
19 full-fledged focus, a small group
20 getting together and making
21 recommendations.
22 DR. KOONIN: We were just five
23 random POPA members none of whom are
24 climate experts here.
25 DR. BEASLEY: Bob, this is a
526
1 APS CLIMATE CHANGE STATEMENT REVIEW WORKSHOP
2 conversation for APS for another day,
3 but I think whether we have to or
4 need to or want to get involved in
5 the bigger crosscutting thing is
6 something POPA needs to deal with.
7 DR. ROSNER: Yes, that's a POPA
8 discussion.
9 DR. KOONIN: Yes. But as
10 somebody said, it's good to get the
11 opinions of our experts, which is why
12 we're doing this.
13 DR. BEASLEY: No, no, I
14 understand. We sort of know that,
15 but we haven't done anything.
16 DR. KOONIN: Bill?
17 DR. COLLINS: In response to
18 your question, I mean, I think there
19 is an issue. The things which are
20 certainly within the APS's range of
21 expertise like radiative transfer and
22 spectroscopy where you would be on
23 extremely safe ground enumerating
24 some of the things that are obvious
25 and undisputed.
527
1 APS CLIMATE CHANGE STATEMENT REVIEW WORKSHOP
2 We have changed the chemistry
3 of the earth's atmosphere. We have
4 CO2 levels that are as big as they
5 have been in three million years. If
6 we double that again, they are going
7 to be higher than they have been in
8 34 million years. We know the CO2 is
9 anthropogenic because of isotopic
10 analysis.
11 We know exactly what it does to
12 the radiative transfer budget. It's
13 been verified by satellite. It's
14 been verified at the ground. We know
15 that CO2 is a greenhouse gas. We
16 know that we are draining the energy
17 budget out of the earth's system
18 appreciably.
19 Those are all things that are
20 completely within the APS's sphere of
21 expertise and extremely safe
22 statements to make. And even those
23 would be regarded as sort of
24 shockingly novel, I think, in certain
25 circles of the scientific community.
528
1 APS CLIMATE CHANGE STATEMENT REVIEW WORKSHOP
2 But they are extremely solid
3 statements and completely within your
4 area of expertise.
5 And by the way, many of us, as
6 Isaac pointed out, are trained as
7 physicists. It's not as if we are
8 two disjointed communities. I was
9 trained as an astrophysicist and a
10 cosmologist in Bob's department.
11 DR. KOONIN: My God!
12 DR. BEASLEY: That explains a
13 lot.
14 DR. COLLINS: In credit to me,
15 I quickly abandoned particle
16 cosmology and moved on to something
17 that was a little bit more reputable.
18 DR. LINDZEN: But, you know,
19 any such statement would be
20 misleading if it were not accompanied
21 by the fact that that alone does not
22 tell you A, B and C, which we need to
23 know for the policy.
24 And one problem with this
25 issue, and the IPCC statement is
529
1 APS CLIMATE CHANGE STATEMENT REVIEW WORKSHOP
2 difficult. As far as I was
3 concerned, that statement, even if it
4 were true, was not ominous. It said
5 it might be ominous. It might not
6 be. And that was left unclear.
7 So, if you have a statement,
8 yes, we know there is a lot of CO2
9 and it is more than it has been, less
10 than most of the earth's history, et
11 cetera, et cetera, so what have you
12 said?
13 DR. COLLINS: Well, this is a
14 point where we disagree. I would
15 actually say that you said quite a
16 lot. But this is a point of
17 disagreement.
18 DR. LINDZEN: It's a lot about
19 science, but the reason anyone is
20 interested in the statement is the
21 policy projection, and it hasn't been
22 that relevant to policy.
23 DR. COLLINS: Well, I was
24 starting to get partly down the road
25 to addressing your question.
530
1 APS CLIMATE CHANGE STATEMENT REVIEW WORKSHOP
2 DR. KOONIN: It was a useful
3 bit. But to follow on maybe where we
4 didn't go is therefore, we expect
5 significant perturbations of the
6 climate system in the future and you
7 had better start thinking about
8 adaptation or mitigation, certainly, 9 if not adaptation. That's the Full
10 Monte, so to speak.
11 DR. LINDZEN: Adaptation is the
12 safer bet.
13 DR. KOONIN: I would agree.
14 It's also much more likely to happen
15 than mitigation.
16 DR. LINDZEN: It will happen.
17 DR. CHRISTY: Of course it will
18 happen, by definition.
19 DR. KOONIN: I was going to go
20 even further into national policy.
21 DR. HELD: Can I?
22 DR. KOONIN: Isaac?
23 DR. HELD: This is a little bit
24 of a tangent, but what I would like
25 to see in the statement, I don't
531
1 APS CLIMATE CHANGE STATEMENT REVIEW WORKSHOP
2 really care about a motherhood
3 statement on observation systems. I
4 think there really is motherhood, but
5 you can say that if you like.
6 DR. KOONIN: Your mother is
7 happy when you do!
8 DR. HELD: From my perspective,
9 as Bill said, I think of myself as a
10 physicist. I haven't changed fields.
11 But for some reason, physicists
12 haven't adopted this problem as a
13 core problem in physics. This is
14 basically a problem in physics.
15 Everything we have been talking
16 about today, except maybe when we
17 talked about carbon uptake by land.
18 I think I may have mentioned that.
19 That's a little more biology than
20 physics, but a lot of it was physics.
21 But why hasn't this been
22 adopted as one of the key core
23 problems in physics? And why not
24 have the statement related to
25 education or promoting this in
532
1 APS CLIMATE CHANGE STATEMENT REVIEW WORKSHOP
2 physics departments among graduate
3 students as a problem to focus on?
4 DR. KOONIN: This is an
5 important problem you have something
6 to contribute with the schools.
7 DR. HELD: Educationally.
8 DR. LINDZEN: But Isaac just
9 mentioned the funding situation. You
10 can't hire post-docs. So, whoever we
11 train won't have work.
12 DR. CURRY: The rationale or
13 the charter for the topical group,
14 they listed the number of areas where
15 they felt that physicists could make
16 a big contribution.
17 And I think reiterating that in
18 the policy statement would be, you
19 know, these are key issues of
20 uncertainties where the expertise of
21 physics can be brought to bear and
22 the Physics Society is going to adopt
23 this and have sessions, whatever.
24 DR. HELD: It's fluid dynamics.
25 The whole thing is physics.
533
1 APS CLIMATE CHANGE STATEMENT REVIEW WORKSHOP
2 DR. KOONIN: Yes, go ahead.
3 DR. SANTER: I just wanted to
4 point out on that same vein that
5 there was a somewhat similar meeting
6 between the American Statistical
7 Society and a bunch of climate
8 scientists at NCAR a while ago.
9 And the bottom line was
10 statisticians wanted to know how they
11 could contribute and where the
12 opportunities were. And I think that
13 was extremely useful.
14 And some good things had come
15 out of that in training more
16 statisticians in the analysis of
17 observational and of model data,
18 model evaluation, detection and
19 attribution.
20 So, I see this as an
21 opportunity. That's one of the
22 reasons I am here.
23 DR. KOONIN: Good.
24 Phil, I know that there were
25 things beyond the framing document you
534
1 APS CLIMATE CHANGE STATEMENT REVIEW WORKSHOP
2 wanted to see us discuss. Have we
3 hit them all?
4 MR. COYLE: Well, I think we
5 are getting there, yes. One
6 question. There is a view, I think,
7 that it doesn't matter what experts
8 think, that the threat from global
9 warming has become accepted by the
10 general public, by the media and all
11 and internalized by the general
12 public and the media.
13 And so, what we need to address
14 is what difference can we make given
15 that situation, given the situation
16 that the so-called threat from global
17 warming has been so widely accepted?
18 What contributions could we
19 make that would help to educate
20 people better, even the APS
21 membership itself, for example, or
22 the general public or the media?
23 DR. LINDZEN: You could
24 indicate the degree to which there
25 are questions. That would be a
535
1 APS CLIMATE CHANGE STATEMENT REVIEW WORKSHOP
2 phenomenal service. I mean, this
3 Society is not just supposed to be
4 "me, too."
5 DR. KOONIN: That's why we are
6 having this kind of meeting.
7 DR. LINDZEN: Yes. I am saying
8 there is a positive use for this.
9 DR. KOONIN: I want to go off
10 the record.
11 (Whereupon, an off-the-record
12 discussion was held.)
13 DR. KOONIN: Back on the
14 record. I will turn to my fellow
15 subcommittee members. What
16 particular lines of discussion do you
17 want to take on?
18 DR. ROSNER: I asked the
19 question about deep-ocean mixing. I
20 am wondering whether, from the point
21 of view of improving the models and
22 dealing with the data, where else in
23 the modeling do you see worthwhile
24 investments?
25 For example, necessarily, you
536
1 APS CLIMATE CHANGE STATEMENT REVIEW WORKSHOP
2 showed the vertical stratification
3 issue. Is there an issue with
4 vertical mixing, for example, that is
5 not well-adjusted?
6 DR. CHRISTY: In the ocean or
7 the atmosphere?
8 DR. ROSNER: No, I am talking
9 about the atmosphere.
10 DR. LINDZEN: The data that you
11 showed, it is convection.
12 DR. ROSNER: I mean, is it
13 governed by episodic mixing? It is
14 governed by tuning?
15 DR. LINDZEN: It's clusters.
16 DR. ROSNER: Bill? Feel free,
17 Bill.
18 DR. COLLINS: I will give a
19 two-word answer then turn the floor
20 over to Isaac, but vertical velocity,
21 right? We have great measurements in
22 the horizontal.
23 DR. ROSNER: Yes.
24 DR. COLLINS: A lot of this is
25 bouncy-driven. We have squat in the
537
1 APS CLIMATE CHANGE STATEMENT REVIEW WORKSHOP
2 vertical. That was more than two
3 words.
4 DR. ROSNER: How do you
5 calibrate vertical mixing lines? I
6 don't get that.
7 DR. HELD: Well, for example,
8 we have what are sometimes called
9 process models, very high-resolution
10 models of moist convective
11 turbulence. And those are compared
12 against field programs. DOE
13 supports a lot of this effort.
14 And so, it's a multistep
15 process. You use those very
16 high-resolution models of field
17 experiments and try to fall back into
18 the global models. It's difficult to
19 do. It's not just global models and
20 trends.
21 DR. ROSNER: Yes, but there has
22 to be a huge difference. There has
23 got to be a huge difference, mixing,
24 say, about thunderstorms, for
25 example, huge cells that have scales
538
1 APS CLIMATE CHANGE STATEMENT REVIEW WORKSHOP
2 of tens of thousands of feet as
3 opposed to, say, boundary mixing,
4 gravity wave lengths, internal waves
5 and all that.
6 DR. HELD: I am sure there are
7 field programs focused on each of the
8 topics that you have mentioned.
9 DR. LINDZEN: Each is
10 separately parametrized.
11 DR. ROSNER: And separately
12 calibrated?
13 DR. LINDZEN: Oh, yes.
14 DR. HELD: Well, they are
15 studied with models of -- all sorts
16 of variety of models. And some of
17 those are directly comparing against
18 field programs designed to test those
19 particular parts of the models.
20 DR. ROSNER: Do you guys feel
21 confident that you know what you are
22 doing?
23 DR. LINDZEN: No. Can I give
24 you an example that is innocuous?
25 There is a phenomenon that I was
539

1 APS CLIMATE CHANGE STATEMENT REVIEW WORKSHOP
2 involved in many years ago called the
3 quasibiennial oscillation. You have
4 the wind going from one direction one
5 year, another direction the other
6 year back and forth.
7 And in the late '60s, early
8 '70s, it was recognized that this was
9 essentially waves interacting with
10 the flow causing the wind to change
11 and descend. Fine.
12 Almost no model comes close to
13 showing this phenomenon. And it's
14 understood the models don't represent
15 the equatorial gravity waves and
16 smaller gravity waves.
17 So, increasingly models now
18 make models a flux of gravity wave
19 that they suppose sometimes is
20 related to other things and tune it
21 so that a QBO emerges. This is not a
22 terribly satisfying thing, but they
23 are not going to resolve the waves.
24 What is bothersome to me about
25 it is, if you do this, there are
540
1 APS CLIMATE CHANGE STATEMENT REVIEW WORKSHOP
2 still things you can get. So, one of
3 the things with the model I have been
4 looking at is, when we look at these
5 tropical waves today, we look at the
6 infrared space data and we see them
7 as cold patterns.
8 When one of the models that gets a
9 QBO tries to do this with its
10 outgoing longwave, they don't see
11 them. That immediately allows you to
12 see something wrong with that model,
13 maybe not other models.
14 But this degree of interaction
15 and understanding with the
16 implications is not widespread.
17 DR. KOONIN: Go ahead. You
18 want to follow up?
19 DR. ROSNER: So, given that,
20 doesn't it bother you that this level
21 of misunderstanding or not
22 understanding, if I were doing this
23 in what I do, I would be --
24 DR. HELD: It's turbulence.
25 It's a hard problem.
541
1 APS CLIMATE CHANGE STATEMENT REVIEW WORKSHOP
2 DR. ROSNER: It's not just
3 turbulence. It's beyond turbulence,
4 right? There is no turbulence.
5 DR. LINDZEN: You have a
6 variety of things going on.
7 DR. ROSNER: It's complicated.
8 DR. SANTER: Again, what
9 Isaac's work has shown is that if you
10 give at least the GFEL model, the
11 observed changes in ocean surface
12 temperature, it does not produce that
13 error structure in the way that John
14 showed. It actually is much closer
15 to the estimated, observed changes.
16 That tells us something useful there.
17 Another things is this time,
18 scale and variance issue that, if you
19 look at amplification of surface
20 temperature changes in the deep
21 tropics on monthly, on annual, on
22 El Niño time scales, models and
23 observations are not in fundamental
24 disagreement.
25 So, one aspect of the physics
542
1 APS CLIMATE CHANGE STATEMENT REVIEW WORKSHOP
2 is time scale invariance in a big
3 way. It's on those long decadal time
4 scales where the observation results
5 were most sensitive to the
6 adjustments that you make with things
7 like orbital drift.
8 DR. ROSNER: So, here is the
9 thing that struck me. So John,
10 during your discussion, the way I
11 read your talk was that you were
12 struck by the fact that the band of
13 models was way off from what the data
14 was.
15 What struck me was something
16 else, which was the huge dispersion
17 among the models. And where does
18 that come from?
19 DR. KOONIN: Ben?
20 DR. SANTER: Ocean.
21 DR. KOONIN: The ocean?
22 DR. SANTER: Ocean, but another
23 thing. What John showed was the mid
24 to upper troposphere in the tropics.
25 That has a nontrivial contribution
543
1 APS CLIMATE CHANGE STATEMENT REVIEW WORKSHOP
2 from the cooling stratosphere. And
3 actually the model --
4 DR. CHRISTY: No, he is talking
5 about the radiosonde one.
6 DR. ROSNER: Right, the
7 radiosonde, yes.
8 DR. CHRISTY: Level by level.
9 DR. SANTER: I thought you
10 meant the band of changes that John
11 was showing for 102 models and the
12 observation being completely outside.
13 DR. ROSNER: The height and
14 then temperature brought in
15 horizontally. And there is this band
16 of solutions that went sort of like
17 this (indicating).
18 DR. CHRISTY: Ben was right
19 when he said the ocean, because if
20 you looked at the surface --
21 DR. ROSNER: All the different
22 points.
23 DR. CHRISTY: -- they had the
24 spread there.
25 DR. HELD: They are all --
544
1 APS CLIMATE CHANGE STATEMENT REVIEW WORKSHOP
2 DR. ROSNER: They are all
3 normalized in totally different ways,
4 really?
5 DR. HELD: I didn't say
6 "normalized." It's because clouds
7 are giving you different -- are
8 changing in different ways in the
9 different models. They are causing
10 the tropical ocean to warm in
11 different ways. It's influencing the
12 tropical atmospheric profile. That's the
13 picture, the zeroth order picture.
14 DR. KOONIN: Let me go in a
15 slightly different direction. One
16 thing that physicists care about and
17 some of the people sitting at this
18 end of the table care a lot about is
19 advancing high-performance
20 computing.
21 To what extent would Exa-scale
22 capability improve what one can do in
23 science?
24 DR. HELD: This is something a
25 lot of us have thought about. I
545
1 APS CLIMATE CHANGE STATEMENT REVIEW WORKSHOP
2 would say as long as it's not
3 monolithic in the sense that it's a
4 small number of people controlling
5 that facility, but it's available to
6 be used in novel ways by the climate
7 community as a whole, I think it
8 would be fabulous.
9 DR. KOONIN: You said “No, it's
10 not as though, my gosh, I've got this
11 model. If I can just get a factor of
12 100 more computing power then a
13 breakthrough?” That's not the case?
14 DR. LINDZEN: Where does the
15 Japanese program stand on this?
16 DR. HELD: There is an example
17 of the earth simulator. If I look at the
19 science there, it looks very promising but,
20 if I were to ask has it
21 revolutionized anything, the answer
22 is no.
23 The Japanese community is
24 wonderful but it's small. They have a
25 certain number of things
546
1 APS CLIMATE CHANGE STATEMENT REVIEW WORKSHOP
2 they are interested in.
3 But if you increase the computer
4 capacity of the field as a whole and
5 it's open to new ideas and younger
6 people, then I think you will get
7 something.
8 DR. KOONIN: Capacity?
9 DR. HELD: Yes, okay, that's
10 the word.
11 DR. KOONIN: So, Ben was first
12 and then you, Judy.
13 DR. SANTER: I will let Judy
14 go.
15 DR. CURRY: A couple of things
16 to advise you. First, you have the
17 potential for a much larger ensemble
18 size. You have the potential for a
19 much larger ensemble size rather than
20 this ad hoc ensemble of opportunity.
21 The other one, cranking down on
22 the horizontal resolution is
23 important to get the natural internal
24 variability right and to get the
25 blocking patterns. And you are never
547
1 APS CLIMATE CHANGE STATEMENT REVIEW WORKSHOP
2 going to get extreme weather events
3 from, of course, resolution models.
4 So, you can explicitly get some
5 of those extremes. And cranking down
6 the resolution is particularly
7 critical for the ocean because the
8 resolution that we are doing at the
9 ocean right now is extremely crude.
10 DR. KOONIN: What is it now,
11 sixth of a degree?
12 DR. CURRY: Yes, but given
13 relative to the Rossby radius --
14 DR. ROSNER: But you have the
15 data to do the calibration?
16 DR. CURRY: So, it's not the
17 answer to everything, but it's an
18 answer to some things in terms of
19 really seeing what kind of
20 information we can extract from this
21 type of model that we really need a
22 bigger ensemble and higher resolution
23 before we can feel like we really
24 explored this path that we have been
25 on.
548
1 APS CLIMATE CHANGE STATEMENT REVIEW WORKSHOP
2 Sorry, Ben.
3 DR. SANTER: No, I agree. I
4 want a larger ensemble. I want more
5 systematic exploration of forcing
6 uncertainty. To me, it seems like
7 one of the issues here is that every
8 modeling group wants to put their
9 best foot forward in IPCC. They want
10 to have the best possible physical
11 model of the climate system.
12 I think much less attention is
13 devoted to the construction of
14 forcing data sets, both natural and
15 anthropogenic. They come in kind of
16 at the end in the process of
17 performing simulations for IPCC. To
18 me, that's where the scientific
19 understanding comes.
20 It's not sufficient, again,
21 just to show some discrepancy between
22 models and observations and say
23 models are wrong. We need to
24 understand why those differences
25 exist.
549
1 APS CLIMATE CHANGE STATEMENT REVIEW WORKSHOP
2 And in order to get that
3 understanding, if I were king for a
4 day, I would use that computational
5 power to more systematically explore
6 forcing.
7 DR. CURRY: Thank you. That's
8 actually very, very important.
9 DR. SANTER: And increase model
10 sizes as well. Some of these
11 simulations that I mentioned that
12 people are performing now with more
13 realistic representation of
14 21st-century volcanic aerosols, they
15 have got ensemble sizes of five.
16 This is a relative weak
17 forcing. In order to better estimate
18 of signal and beat down the noise, we
19 need larger ensembles.
20 Finally, what I would do is I
21 would go after the seasonal stuff, as
22 Isaac showed for the hiatus. All the
23 detection and attribution work
24 essentially looks either at decadal
25 mean changes or it looks at an annual
550
1 APS CLIMATE CHANGE STATEMENT REVIEW WORKSHOP
2 changes.
3 What you lose, then, is the
4 effects of different forcings on the
5 seasonal cycle. For ozone, that's
6 profound. You look at stratospheric
7 ozone depletion and its impacts on
8 the lower stratospheric other
9 Antarctica, it's huge. You get this
10 huge signal in October or November
11 that is clearly beyond anything that
12 you can generate with noise alone.
13 Now, many of these radiative
14 forcings that we have been talking
15 about like, say, biomass burning,
16 fires up in the Congo and in the
17 Amazon at certain times of year,
18 very, very specific regional and
19 seasonal signatures.
20 We need to look at that kind of
21 thing, in my opinion, in detection
22 and attribution work in order to
23 better discriminate between different
24 anthropogenic forcings. You lose
25 that seasonal specificity when you do
551
1 APS CLIMATE CHANGE STATEMENT REVIEW WORKSHOP
2 detection and attribution work with
3 decadal mean changes.
4 DR. KOONIN: John?
5 DR. CHRISTY: The only thing,
6 Dick showed a picture of four models
7 run in this experimental mode. And
8 this is a really neat experiment
9 where the authors had runs from a
10 water-earth, very simple earth,
11 current temperature of water, warm it
12 up four degrees. How does the model
13 respond?
14 So, that kind of fundamental
15 test could be done so that you could
16 see the dispersion of how the models
17 create clouds and radiation, how
18 different they are, and perhaps come
19 up with a better way to understand
20 why they are different, what could be
21 done to better characterize that
22 process, that kind of experiment, a
23 fundamental experiment that would
24 enlighten us about how these models.
25 DR. KOONIN: Judy?
552
1 APS CLIMATE CHANGE STATEMENT REVIEW WORKSHOP
2 DR. CURRY: Yes, the point I
3 want to make is basically the same,
4 but I will reemphasize it. Because
5 of the cost of running these big
6 models for the CMIP5 and arguably the
7 IPCC production runs, there is no
8 room left over for the creative,
9 imaginative experiments to really
10 test understanding.
11 And again, you need large
12 ensembles, very long runs, whatever,
13 sensitivity to a variety of things.
14 Forcing, I agree, is very important.
15 There is not enough horsepower
16 left over to do these things. And we
17 are selling ourselves short by not
18 being able to do that.
19 DR. KOONIN: When you say
20 "horsepower," both cycles, but also
21 people?
22 DR. CURRY: Cycles and people.
23 DR. CHRISTY: Expensive.
24 DR. CURRY: Cycles and people.
25 DR. LINDZEN: I wonder
553
1 APS CLIMATE CHANGE STATEMENT REVIEW WORKSHOP
2 sometimes if it's an excuse. If you suggest
3 something to a modeling group, one of
4 the convenient answers is, "We would
5 love to do it, but we
6 are doing CMIP
7 projects."
8 DR. KOONIN: Ultimately, it
9 boils down to, if you will excuse me,
10 program direction and what the
11 funders try to nudge the system to
12 do.
13 DR. COLLINS: I think one of
14 the things that could be done with
15 such a capability -- sorry, I have
16 been wrestling with flight
17 itineraries here which is why I keep
18 running out of the room -- but
19 exploration of uncertainties that we
20 heard about.
21 For example, Ben discussed
22 systematic exploration of
23 uncertainties, but perhaps not with
24 his simple models of, but models of
25 the ilk we have been using for the
554
1 APS CLIMATE CHANGE STATEMENT REVIEW WORKSHOP
2 IPCC.
3 That is another thing one can
4 do with this capability that would be
5 extremely fruitful, a systematic
6 exploration of parametric uncertainty
7 and forcing uncertainties so really,
8 we can construct an error budget for
9 a climate model.
10 And I think that would be
11 another constructive use. Besides,
12 the natural tendency, I think, would
13 be to add a lot more complex physical
14 processes and to take them out into
15 very high resolution.
16 And I think one could argue
17 that a complementary activity that is
18 sort of saying let's assess what we
19 have got. We want to understand the
20 foundations for further development.
21 And also do hypothesis testing,
22 again, in sort of an exploratory mode
23 with this capability would be
24 extremely useful.
25 And increasingly, in at least,
555
1 APS CLIMATE CHANGE STATEMENT REVIEW WORKSHOP
2 if I could speak for the United
3 States, the luxury of having both of
4 people and the computing power to do
5 that has become harder. But it would
6 be a really constructive use of the
7 cycles.
8 DR. ROSNER: Would you agree
9 with the following statement, that
10 increasing the fidelity of models
11 without a corresponding increase in
12 the data collection capabilities is a
13 waste of time?
14 DR. COLLINS: No, for the
15 following reason. No, in the short
16 term. This is a time scale question.
17 One of the difficulties we have
18 had with climate modeling is that, at
19 the moment, the models are being run
20 at length scales where we have to
21 construct effective and often
22 less-than-ideal empirical theories
23 about how things work.
24 We actually understand how
25 things work at smaller scales. And
556
1 APS CLIMATE CHANGE STATEMENT REVIEW WORKSHOP
2 this gets back with to some of the
3 topics that Isaac was raising
4 earlier. We raise observations at
5 these small scales.
6 The moment there is a big
7 enough gap that we have to fill in
8 the middle with sort of, it's
9 physical theory, statistical physical
10 mechanics, which is often a very
11 fraught exercise, driving the models
12 down to the native skill and
13 observing networks and the process
14 models, which we will be able to do
15 soon, would be extremely useful.
16 Because at that point, we will
17 be able to essentially test the
18 models deterministically against
19 observation, against observational
20 networks. The climate community
21 should stop throwing up its hands and
22 saying, "We do climate, weather." We
23 should perhaps do both.
24 So, it's an initial
25 value-driven problem and a
557
1 APS CLIMATE CHANGE STATEMENT REVIEW WORKSHOP
2 boundary-value driven potential.
3 So, I actually would argue that
4 the exponentially increasing
5 computing power for the time being is
6 buying us something in the sense that
7 it's going to hold the climate
8 modeling community's feet to the
9 fire, I hope, further.
10 DR. ROSNER: So, you are saying
11 there is still a lot of space between
12 the grid resolutions for models and
13 the resolution at which you do data
14 sampling; is that right?
15 DR. COLLINS: Well, you have
16 seen satellite observations that are
17 conducted globally, but some of the
18 pertinent aircraft observations are
19 made at small scales, et cetera.
20 It's not clear to me that going
21 necessarily to the end result, extremely
22 small scales, is the relevant issue.
23 But what is relevant is the
24 ability to test the model in a way
25 where we can, for example, say, let
558
1 APS CLIMATE CHANGE STATEMENT REVIEW WORKSHOP
2 me run the model with observed
3 initial meteorological conditions and
4 ask which process fails, or maybe you
5 can get a convolution of both
6 large-scale atmospheric state and the
7 process. And that's currently the
8 problem that we face.
9 So, I would say in the
10 long-term they need to advance
11 commensurately, because the answers
12 will not come out of Silicon.
13 DR. ROSNER: Right, exactly,
14 yes. That's why I'm asking.
15 DR. SANTER: Just to follow up
16 from what Bill said, some of that
17 work is going on. So, at PCMDI and
18 elsewhere, modeling groups are
19 running the GFDL model, the NCAR
20 model in weather forecast mode
21 assimilating observations, making
22 forecasts comparing, say, what the
23 high temporal resolution ARM
24 measurements and learning a lot of
25 useful things about errors in certain
559
1 APS CLIMATE CHANGE STATEMENT REVIEW WORKSHOP
2 model parameterizations that manifest
3 very quickly and then propagate into
4 climate time scales.
5 And that has been extremely
6 useful, I would argue, in trying to
7 really put your finger on causes of
8 differences between models and
9 observations for some aspects of
10 these simulations.
11 DR. LINDZEN: What about
12 mesoscale modeling efforts? They
13 also have very limited success. They
14 have extremely high resolution, but
15 they are a small phenomenon.
16 DR. COLLINS: It's not a
17 panacea, I completely agree.
18 DR. LINDZEN: Pardon me?
19 DR. COLLINS: It's not a
20 panacea. Resolution is not a
21 panacea.
22 DR. ROSNER: You guys will be
23 in business for a long time.
24 DR. LINDZEN: The best way to
25 avoid it is not to depend on the
560
1 APS CLIMATE CHANGE STATEMENT REVIEW WORKSHOP
2 weather.
3 DR. COLLINS: I would like to
4 get back to a point that Isaac raised
5 about the engagement, sort of,
6 perhaps a part of the statement that
7 could address the engagement of the
8 physics community on this problem.
9 And I know from when I was a
10 graduate student at the University of
11 Chicago, the physics community
12 benefitted tremendously from the
13 influx of -- well, applied
14 mathematicians are very interested in
15 the chaos problem.
16 One could point to similar
17 examples involving general relativity
18 and the work of Roger Penrose that kind of
19 transformed general relativity in the
20 1970s. So, this kind of crosstalk
21 can be tremendously beneficial.
22 And my sense, to be honest with
23 you, is that, and I think this all
24 makes us a little bit nervous,
25 climate is not a problem that is
561
1 APS CLIMATE CHANGE STATEMENT REVIEW WORKSHOP
2 amenable necessarily to reductionist
3 treatment.
4 That's a problem. And there
5 are aspects in which it's messy and
6 it's hard to do simple -- some of the
7 simple, low-hanging fruit is also
8 gone.
9 And so, there are ways in which
10 this does not look appealing. But
11 it's a really important problem.
12 And I think we would benefit
13 tremendously from engagement of
14 people who want to think critically
15 about how to do the error right, the
16 measurement right and the modeling
17 right.
18 DR. KOONIN: I think you just
19 said “it's a mature, messy problem.”
20 DR. COLLINS: But there are
21 also examples of physicists getting
22 deeply involved in the life sciences.
23 DR. KOONIN: Bob?
24 DR. JAFFE: This is, I guess, a
25 follow-up your question. There was a
562
1 APS CLIMATE CHANGE STATEMENT REVIEW WORKSHOP
2 discussion about horsepower in terms
3 of flops and also people. I wonder,
4 what is your workforce problem like?
5 Where did your graduate students come
6 from?
7 Are there graduate students
8 flocking to your door or do they come
9 from physics? Do they come from
10 earth sciences? Do they come from
11 oceanography?
12 What is that structure like and
13 do you need the recommendations as
14 this is a field which needs workforce
15 development?
16 DR. COLLINS: Well, so, our
17 graduate students do come from the
18 physics community. Currently in my
19 department, we have three former
20 string theorists as graduate
21 students.
22 DR. JAFFE: They don't count.
23 DR. COLLINS: Is that on the
24 record?
25 DR. JAFFE: I am afraid it is.
563
1 APS CLIMATE CHANGE STATEMENT REVIEW WORKSHOP
2 DR. BEASLEY: Following your
3 inspiration.
4 DR. KOONIN: Dr. Jaffe, you will have
5 the opportunity to clarify your response.
6 DR. COLLINS: Sorry, string
7 theorists, physicists, applied
8 mathematicians, civil engineers,
9 those are several different
10 departments from which I have drawn
11 personally and my department has
12 drawn recently.
13 I actually think, I'm not sure
14 if the attraction of this field
15 because it's a hot topic is
16 necessarily the issue. But somehow I
17 think the problem is furthering along
18 people's careers, right?
19 So, the issue is how does one
20 get -- this problem looks messy.
21 It's non-reductionist. How do you do
22 the right thing to get tenure in a
23 physics department doing a problem in
24 climate?
25 That's the reason why I am
564
1 APS CLIMATE CHANGE STATEMENT REVIEW WORKSHOP
2 thinking this is a problem a little
3 bit downstream. You see what I am
4 saying?
5 DR. LINDZEN: If I could make a
6 suggestion. Now, I think the
7 business of reductionism is extremely
8 important and appealing. One problem
9 with the current, quote, practical
10 climate problem, greenhouse gases and
11 so on, is it has drained the energy
12 from phenomenology.
13 It would be terrific to have
14 students understand the Eocene, to
15 work on the glaciation cycles. There
16 are plenty of well-defined problems
17 in climate. Why did the cycle of
18 glaciation begin about 700,000 years
19 ago?
20 These are, in a way,
21 traditional problems, almost 19th
22 century, and they are exciting. And
23 the oxygen has been drained from them
24 by the environmental issue.
25 DR. KOONIN: Plus you have
565
1 APS CLIMATE CHANGE STATEMENT REVIEW WORKSHOP
2 modern modeling tools that you can --
3 DR. LINDZEN: Well, you have
4 that, but thought is --
5 DR. KOONIN: Think before you
6 compute!
7 DR. BEASLEY: I don't want to
8 get too school mom-ish here. But as
9 a condensed matter physicist, we
10 thrive on phenomenology. So, it's
11 not the existence of phenomenology
12 that is not attractive to students.
13 To throw it back to you all
14 rhetorically, what is needed is a
15 clear statement of what are the
16 fundamental problems or what are the
17 interesting outcomes that all of this
18 could lead to?
19 And I know you are busy and you
20 have got all this. But I think
21 that's part of the problem. Because
22 if you don't, if you don't get that
23 into the students' minds, then they
24 will stay close to home.
25 But if they see is that
566
1 APS CLIMATE CHANGE STATEMENT REVIEW WORKSHOP
2 excitement, they will go out and go
3 to a mechanical engineering
4 department. At least they will at
5 Stanford.
6 DR. KOONIN: One thing we
7 haven't talked about, we are the
8 American Physical Society, although
9 there is a big international
10 component. How does the U.S. stack
11 up in the science relative to EU,
12 China, Japanese?
13 Are we doing enough and do we
14 understand enough to be able to hold
15 our own in international discussions
16 of climate issues?
17 DR. LINDZEN: Alas, yes.
18 DR. KOONIN: Okay.
19 DR. CHRISTY: In many of these
20 observational data sets, we are
21 driving the bus. We are kind of the
22 ones that started the whole satellite
23 movement and many of the other
24 networks.
25 DR. BEASLEY: Will that be true
567
1 APS CLIMATE CHANGE STATEMENT REVIEW WORKSHOP
2 in ten years?
3 DR. CHRISTY: I don't know. I
4 really don't. It doesn't look
5 promising right now.
6 DR. COLLINS: There was an
7 issue I think back in the early '90s
8 that dealt with this concerning
9 climate modeling. But it is true
10 that the U.S. now has multiple, very
11 strong climate modeling efforts.
12 And the U.S. has actually
13 maintained a strength in diversity in
14 quite deliberately in this area and
15 has, as John said, been really a
16 leader along with the EU in building
17 satellites to look at, to examine the
18 earth system.
19 But certainly, NASA right now
20 is -- I was just at NASA. I was
21 talking to them about their upcoming
22 decadal survey and observations. And
23 there is a real risk to next
24 generation of satellites. That is a
25 very, very concrete risk.
568
1 APS CLIMATE CHANGE STATEMENT REVIEW WORKSHOP
2 Setting aside our posture
3 within the international community,
4 just setting a fairly high bar for
5 ourselves, I think we are at risk of
6 not grasping the bar in the next
7 decade because of the risks to, in
8 particular, the satellite systems.
9 So, the EU is drawing strength
10 in doing federated intercomparisons in
11 a way that we do not do in the United
12 States. I am thinking of Prudence
13 and Ensembles, for example, these huge
14 intercomparisons they do.
15 I think there are differences,
16 but I'm not sure if they are leading
17 to qualitative or dramatically
18 different outcomes in terms of
19 scientific quality.
20 DR. KOONIN: Anybody else? We
21 reached --
22 DR. COLLINS: The asymptote.
23 DR. SANTER: Hiatus.
24 DR. COLLINS: The hiatus.
25 DR. KOONIN: Maybe we can just
569
1 APS CLIMATE CHANGE STATEMENT REVIEW WORKSHOP
2 kind of close out by final remarks,
3 last shots?
4 DR. BEASLEY: Well, on behalf
5 of APS, I really want to thank you
6 all. Well done. I don't know
7 whether to give Steve credit or you
8 all, but there was more discipline in
9 addressing the questions posed than I
10 have been able to manage in my own
11 field. So, thank you very much.
12 DR. KOONIN: So yes, of course,
13 for me, too. But I still want to
14 give people an opportunity. I can
15 summarize. Maybe I will start with
16 that.
17 You know, at the same time in
18 some dimensions there is more confidence,
19 greater certainty in some of these
20 issues, but in other dimensions, more
21 uncertainty.
22 The uncertainty in the
23 forcings, which almost from the
24 beginning of the day became a theme
25 is something that I am now educated
570
1 APS CLIMATE CHANGE STATEMENT REVIEW WORKSHOP
2 about and more concerned about. It
3 makes all of this just a bit shakier
4 than it was for me to start. That's
5 something I wanted to say.
6 DR. LINDZEN: I think there is
7 one field that was omitted here. And
8 I was reminded of it by your
9 statement what we are confident on,
10 which is geochemistry. There are
11 plenty of gaps in our understanding
12 of carbon dioxide budget.
13 And that, of course, enters
14 into the forcing issue, but also into
15 all sorts of attribution.
16 How should I put it, the one
17 thing I feel and I think that you
18 don't want to use the word
19 "incontrovertible" unless you know
20 what you are talking about.
21 DR. ROSNER: That was an early
22 recognition.
23 DR. KOONIN: Yes.
24 DR. BEASLEY: A well-analyzed
25 problem.
571
1 APS CLIMATE CHANGE STATEMENT REVIEW WORKSHOP
2 DR. KOONIN: Sue?
3 DR. SEESTROM: So, something I
4 didn't hear you pose in your set of
5 statements that people might agree
6 on, but I think could be useful,
7 comes out of the interaction between
8 the climate models and the natural
9 multidecadal oscillations, is the
10 fact that there is complexity there
11 that makes it hard for the models to
12 be predictive on one- or two-decade
13 time scales, because I think for
14 people who haven't studied this as a
15 newcomer, the fact that you hear a
16 lot about this hiatus.
17 And it seems to me the hiatus
18 has a high probability of being able
19 to be described by interactions with
20 these natural oscillations, just
21 pulling that out and telling it to
22 the membership I think would be
23 useful.
24 DR. KOONIN: All right. So, I
25 will offer my thanks to all of you
572
1 APS CLIMATE CHANGE STATEMENT REVIEW WORKSHOP
2 for, I thought, a really good day and
3 good discussion of the science, very
4 productive, collegial, and thanks.
5 And I hope the world will
6 review what we did and it will be
7 beneficial.
8 (Whereupon, at 3:49 P.M., the
9 workshop concluded.)
10 11
12
13
14
15
16
17
18
19
20
21
22
23
24
25
573