Embed Size (px)
Citation preview
Source of Acquisition NASA Goddard Space Flight Center
The Three Gorges Dam Affects Regional Precipitation
Liguang Wu', Qiang Zhang2 and Zhihong Jian2
1. Goddard Earth and Technology Center, University of Maryland, Baltimore County and Mesoscale Atmospheric Processes Branch, Laboratory for Atmospheres, NASA Goddard Space Flight Center, Greenbelt, Maryland
2. National Climate Center of China Meteorological Administration, Beijing, China
3. Nanjing University of Information Science and Technology, Nanjing, China
Corresponding author address: Dr. Liguang Wu, NASA/GSFC, Code 613.1, Greenbelt, MD 2007 1. E-mail: [email protected]
ABSTRACT
Issues regarding building large-scale dams as a solution to power generation and flood control problems have been widely discussed by both natural and social scientists from various disciplines, as well as the policy-makers and public. Since the Chinese government officially approved the Three Gorges Dam (TGD) projects, this largest hydroelectric project in the world has drawn a lot of debates ranging from its social and economic to climatic impacts. The TGD has been partially in use since June 2003.
The impact of the TGD is examined through analysis of the National Aeronautics and Space Administration (NASA) Tropical Rainfall Measuring Mission (TRMM) rainfall rate and Moderate Resolution Imaging Spectroradiometer (MODIS) land surface temperature and high-resolution simulation using the Pennsylvania State University-National Center for Atmospheric Research (PSU-NCAR) fifth-generation Mesoscale Model (MM5). The independent satellite data sets and numerical simulation clearly indicate that the land use change associated with the TGD construction has increased the precipitation in the region between Daba and Qinling mountains and reduced the precipitation in the vicinity of the TGD after the TGD water level abruptly rose from 66 to 135 m in June 2003. This study suggests that the climatic effect of the TGD is on the regional scale (- 100 km) rather than on the local scale (-10 km) as projected in previous studies.
https://ntrs.nasa.gov/search.jsp?R=20060026168 2020-03-21T11:57:25+00:00Z
The Three Gorges Dam Affects Regional Precipitation
Liguang Wu’, Qiang Zhang’ and Zhihong Jiang3
1. Goddard Earth and Technology Center, University of Maryland, Baltimore County and Mesoscale Atmospheric Processes Branch, Laboratory for Atmospheres, NASA Goddard Space Flight Center, Greenbelt, Maryland
2. National Climate Center of China Meteorological Administration, Beijing, China
3. Nanjing University of Information Science and Technology, Nanjing, China
Corresponding author address: Dr. Liguang Wu, NASA/GSFC, Code 613.1 , Greenbelt, MD 20071. E-mail: [email protected]
ABSTRACT
The impact of the Three Gorges Dam (TGD) on regional precipitation is
examined through analysis of the National Aeronautics and Space Administration
(NASA) Tropical Rainfall Measuring Mission (TRMM) rainfall rate and Moderate
Resolution Imaging Spectroradiometer (MODIS) land surface temperature and high-
resolution simulation using the Pennsylvania State University-National Center for
Atmospheric Research (PSU-NCAR) fifth-generation Mesoscale Model (MM5). The
independent satellite data sets and numerical simulation clearly indicate that the land use
change associated with the TGD construction has increased the precipitation in the region
between Daba and Qinling mountains and reduced the precipitation in the vicinity of the
TGD after the TGD water level abruptly rose from 66 to 135 m in June 2003. This study
suggests that the climatic effect of the TGD is on the regional scale (- 100 km) rather
than on the local scale (-10 km) as projected in previous studies.
1. Introduction
As the largest hydroelectric project in the world, the Three Gorges Dam (TGD) on
the Yangtze River is going to extend a 660 km length of the Yangtze River from Yichang
City to Chongqing Municipality and to cover an area of 1040 km’, becoming a backbone
in China’s flood control system (Wang 2002). The TGD project has drawn a considerable
1
amount of debates since the National Congress of China officially approved it in April
1992. Its influences include both the natural and social environments in the reservoir area
(Wang 2002; Edmonds 1992; Gwynne and Li 1992; Xie 2003; Shen and Xie 2004; Miller
et al. 2005). How the resulting change in land use affects the regional climate is not clear.
Initial assessments, based upon several specific field experiments and idealized numerical
simulations (Zhang et al. 2005), suggested that the climatic influence of the TGD
reservoir would be primarily within tens of kilometeis of the Yangtze River waterway
(Zhang et al. 2004, Miller et al. 2005).
The land use change associated with the TGD may couple with the
complicated surrounding topography to affect the regional climate. The Yangtze
River generally flows eastward along the southern rim of the Sichuan Basin and
cuts through the Wu Mountains before reaching the TGD (Fig. 1). Joining the Wu
Mountains in the east and facing the Qinling Mountains to the north, the Daba
Mountains run southeast to northwest along the northern rim of the Sichuan Basin
with an average elevation of about 2,000 m. The TGD reservoir will inundate 632
km2 land after 2009. The average width of the waterway will increase from 0.6 km
to 1.6 km. The increased watery area can enhance the local evaporation and lower
the local temperature. As a result, the atmosphere is more stable over the watery
area, leading to anomalous downward vertical motion that extends along the 660
km waterway of the Yangtze River (Miller et al. 2005). If the resulting mesoscale
downward vertical motion interacts with the complicated topography within several
hundreds of kilometers from the TGD, the previously projected influences of the TGD
project on the climate are questionable.
The TGD has been partially in use since June 2003. Its water level rose
abruptly from 66 m to 135 m in June 2003. The expanded waterway provided an
opportunity for an observational study of the climatic impact of the TGD, which is
the main objective of this study. In this study, the data from the National
Aeronautics and Space Administration (NASA) Tropical Rainfall Measuring Mission
(TRMM) and Terra satellites are examined for the possible impact of the largest
2
hydroelectric project in the world on the regional (-100 km) climate, followed by high-
resolution numerical simulations using the Pennsylvania State University-National Center
for Atmospheric Research (PSU-NCAR) fifth-generation Mesoscale Model (MM5).
2. Analysis of the Satellite data
The monthly rainfall rate data from the NASA TRMM Multi-satellite
Precipitation Analysis (TMPA) are used to represent the precipitation in the TGD
area, where the conventional rain gauge data are scarce in the mountainous
regions. The data are produced by combining multiple precipitation estimates from
satellites (both microwave and infrared precipitation estimates), as well as the
available gauge analyses at 0.25"x0.25" resolution (Huffman et al. 2006). The
satellite-observed rainfall rate (mm month-') data are divided into two parts:
January 1998 - January 2003 and January 2004 - January 2006, representing the
periods before and after the abrupt rise of the TGD water level, respectively.
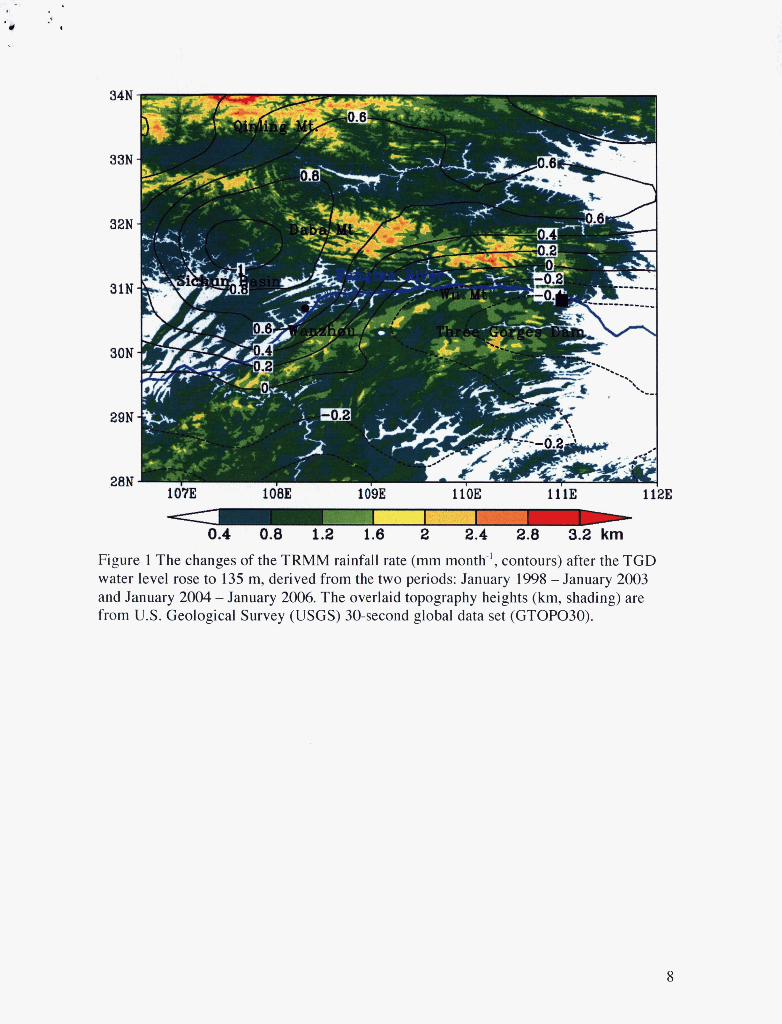
Figure 1 shows the spatial distribution of the difference of the TRMM
monthly rainfall rates between the two periods. The positive anomalies (solid
contours) occurred primarily north of the Yangtze River and the decreased rainfall
rate (dashed contours) can be found in the vicinity of the TGD and south of the
Yangtze River. The maxima of the positive anomalies are roughly parallel to the
Yangtze River with a distance of about 150 km, suggesting that the enhanced
precipitation is associated with the land use change due to the TGD construction,
although the rainfall rate anomalies also contain natural variations and
uncertainties involved in the satellite-derived data product.
Since the natural variations such as El Nino and interdecadal oscillations
are generally on a large scale, we can obtain a new time series by contrasting the
time series of the TRMM rainfall rate over the following two areas: the enhanced
rainfall region (31.0-34.OoN, 107.0-1 11 .O"E) and the whole TGD area (28.0-
34.0°N, 107.0-1ll.O"E). For these two regions, the influences of natural
variations should be very similar and thus can be significantly reduced in the new
3
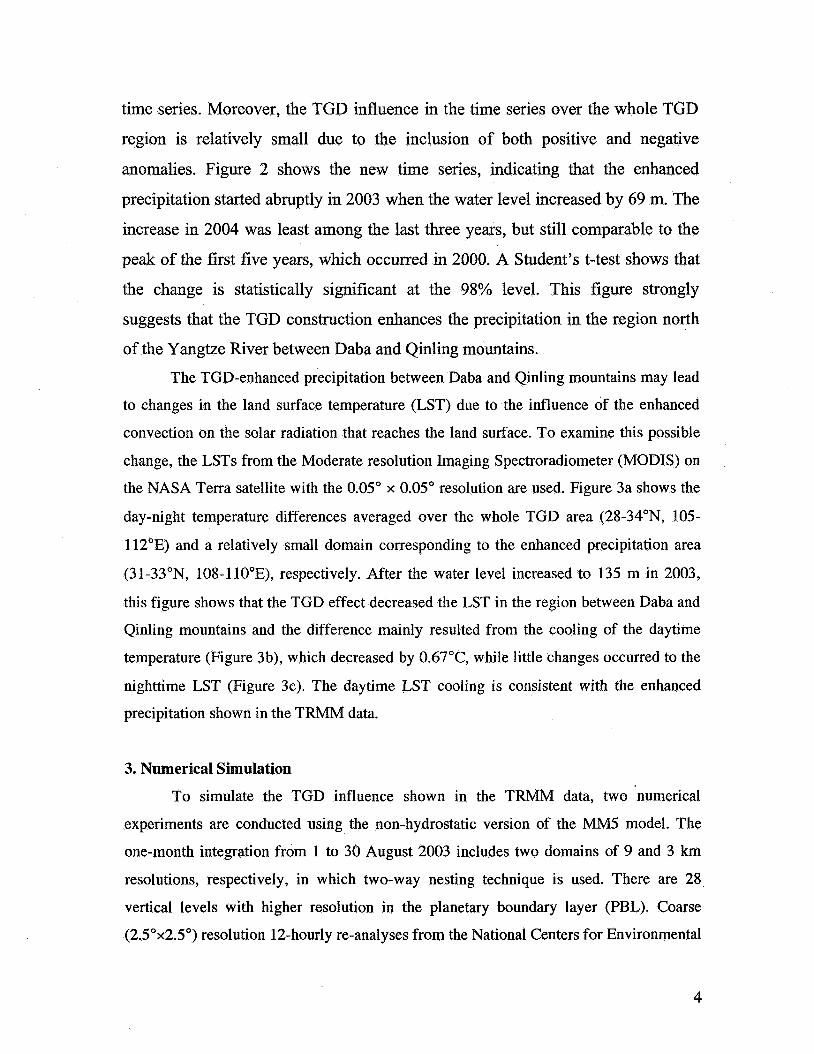
time series. Moreover, the TGD influence in the time series over the whole TGD
region is relatively small due to the inclusion of both positive and negative
anomalies. Figure 2 shows the new time series, indicating that the enhanced
precipitation started abruptly in 2003 when the water level increased by 69 m. The
increase in 2004 was least among the last three years, but still comparable to the
peak of the first five years, which occurred in 2000. A Student's t-test shows that
the change is statistically significant at the 98% level. This figure strongly
suggests that the TGD construction enhances the precipitation in the region north
of the Yangtze River between Daba and Qinling mountains.
The TGD-enhanced precipitation between Daba and Qinling mountains may lead
to changes in the land surface temperature (LST) due to the influence of the enhanced
convection on the solar radiation that reaches the land surface. To examine this possible
change, the LSTs from the Moderate resolution Imaging Spectroradiometer (MODIS) on
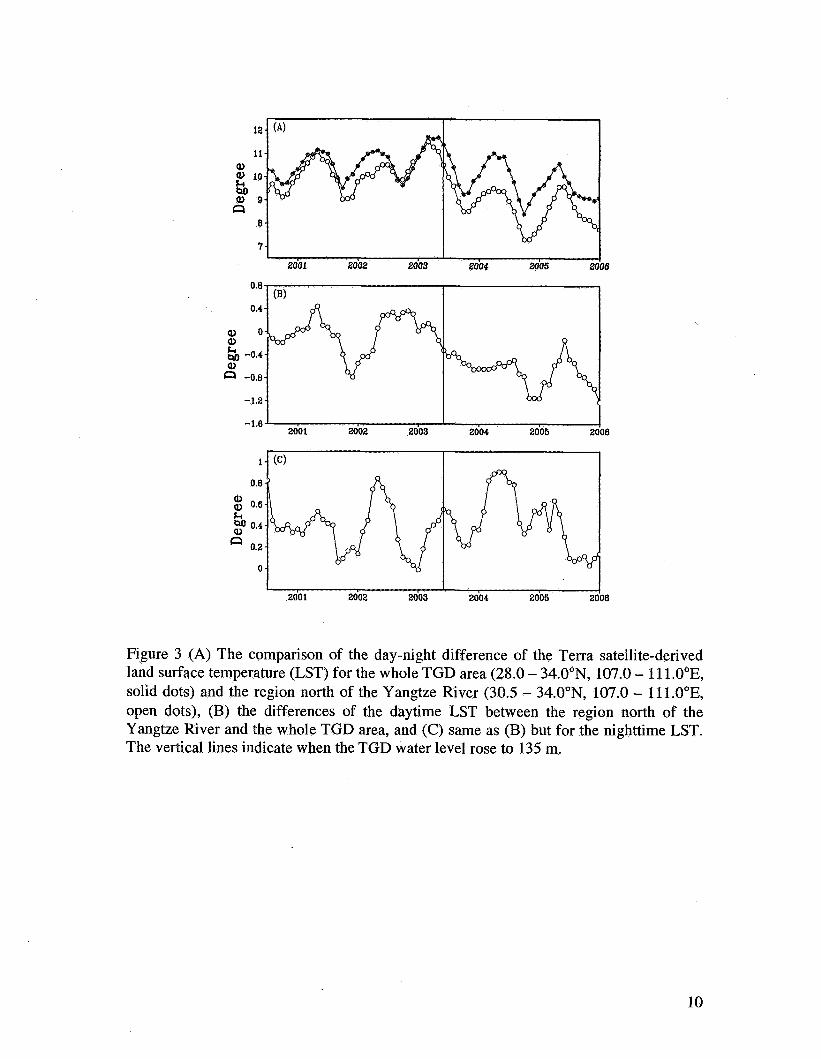
the NASA Terra satellite with the 0.05" x 0.05" resolution are used. Figure 3a shows the
day-night temperature differences averaged over the whole TGD area (28-34"N, 105-
112"E) and a relatively small domain corresponding to the enhanced precipitation area
(31-33"N, 108-l10°E), respectively. After the water level increased to 135 m in 2003,
this figure shows that the TGD effect decreased the LST in the region between Daba and
Qinling mountains and the difference mainly resulted from the cooling of the daytime
temperature (Figure 3b), which decreased by 0.67"C, while little changes occurred to the
nighttime LST (Figure 3c). The daytime LST cooling is consistent with the enhanced
precipitation shown in the TRMM data.
3. Numerical Simulation
To simulate the TGD influence shown in the TRMM data, two numerical
experiments are conducted using the non-hydrostatic version of the MM5 model. The
one-month integration from 1 to 30 August 2003 includes two domains of 9 and 3 km
resolutions, respectively, in which two-way nesting technique is used. There are 28
vertical levels with higher resolution in the planetary boundary layer (PBL). Coarse
(2.5Ox2.5") resolution 12-hourly re-analyses from the National Centers for Environmental
4
Prediction (NCEP) were used as initial and boundary conditions. Model physics options
included the Goddard explicit microphysics scheme, the high-resolution Blackadar PBL
scheme, and the Rapid Radiative Transfer Model for radiation. The land use change due
to the TGD construction is represented by a 3-km-wide water surface (a model grid)
along the Yangtze River Valley between 108 and 11 1 "E.
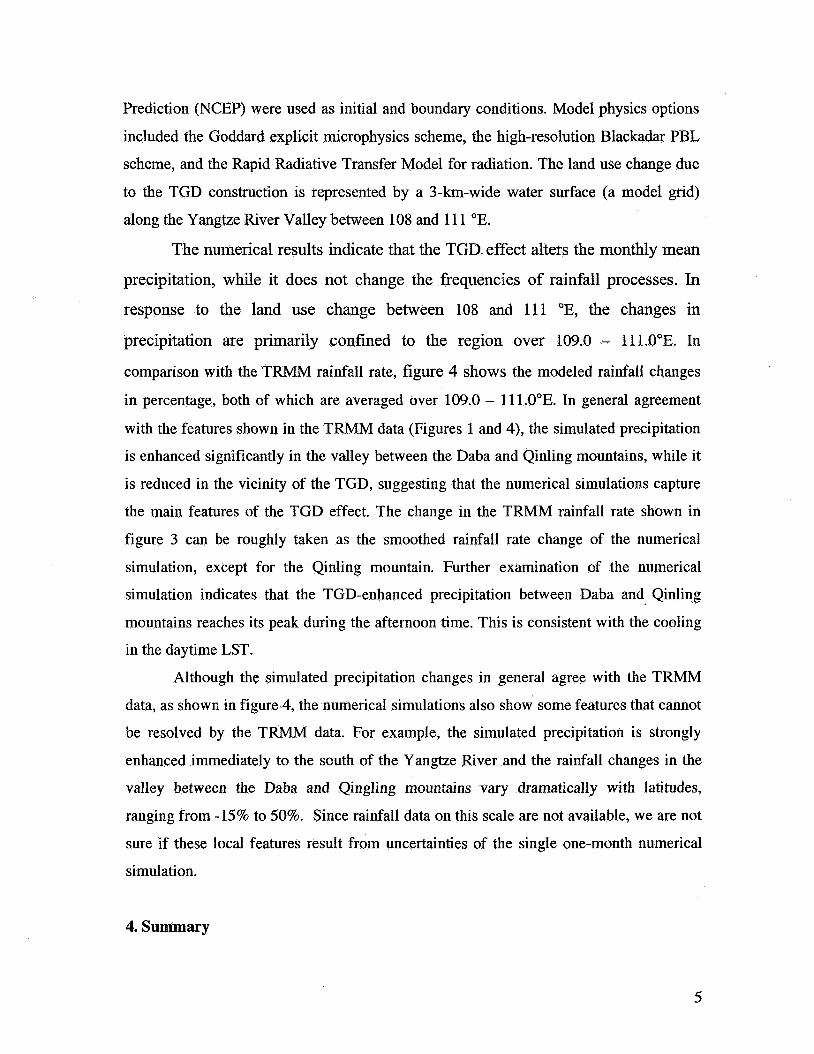
The numerical results indicate that the TGD. effect alters the monthly mean
precipitation, while it does not change the frequencies of rainfall processes. In
response to the land use change between 108 and 111 "E, the changes in
precipitation are primarily confined to the region over 109.0 - 111.O"E. In
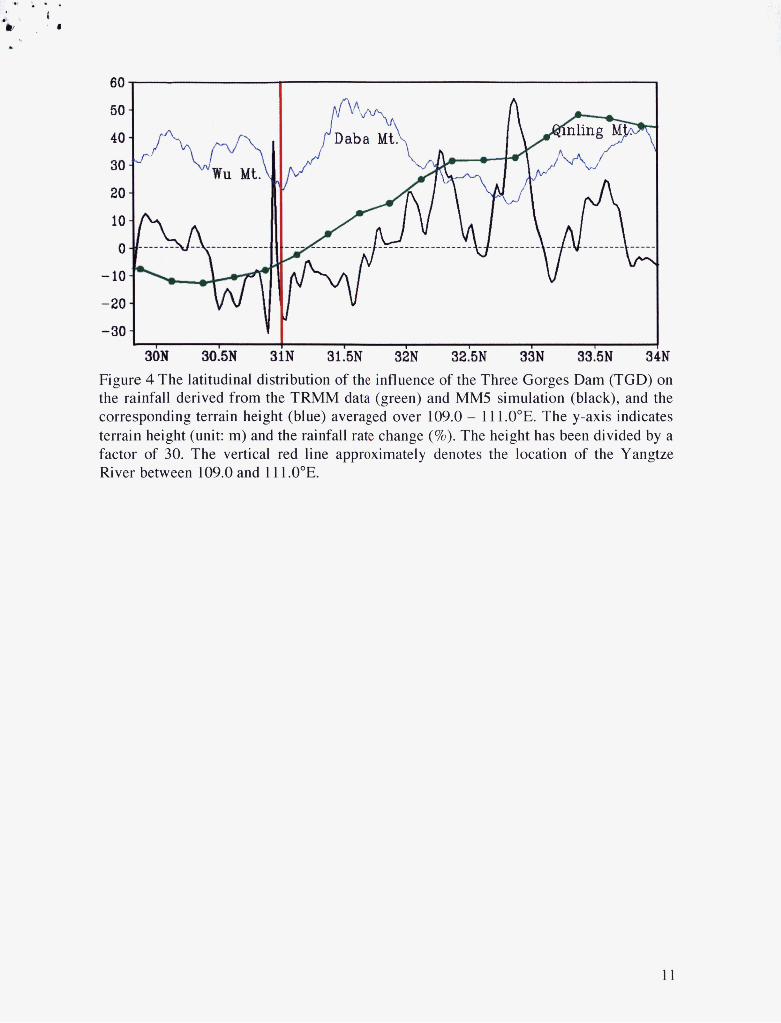
comparison with the TRMM rainfa11 rate, figure 4 shows the modeled rainfall changes
in percentage, both of which are averaged over 109.0 - 1ll.O"E. In general agreement
with the features shown in the TRMM data (Figures 1 and 4), the simulated precipitation
is enhanced significantly in the valley between the Daba and Qinling mountains, while it
is reduced in the vicinity of the TGD, suggesting that the numerical simulations capture
the main features of the TGD effect. The change in the TRMM rainfall rate shown in
figure 3 can be roughly taken as the smoothed rainfall rate change of the numerical
simulation, except for the Qinling mountain. Further examination of the numerical
simulation indicates that the TGD-enhanced precipitation between Daba and Qinling
mountains reaches its peak during the afternoon time. This is consistent with the cooling
in the daytime LST.
Although the simulated precipitation changes in general agree with the TRMM
data, as shown in figure 4, the numerical simulations also show some features that cannot
be resolved by the TRMM data. For example, the simulated precipitation is strongly
enhanced immediately to the south of the Yangtze River and the rainfall changes in the
valley between the Daba and Qingling mountains vary dramatically with latitudes,
ranging from -15% to 50%. Since rainfall data on this scale are not available, we are not
sure if these local features result from uncertainties of the single one-month numerical
simulation.
4. Summary
5
In summary, analysis of the NASA TRMM rainfall rate indicates that the land use
change associated with the TGD construction increased the precipitation in the region
between Daba and Qinling mountains and reduced the precipitation in the vicinity of the
Yangtze River after the TGD water level rose abruptly to 135 m in June 2003. The
enhanced precipitation can be numerically simulated by considering the TGD effect in
the MM5 model, and is consistent with the LST decrease derived from the MODISlTerra
data product. This study suggests that the climatic effect of the man-made water reservoir
such as the TGD is on the regional scale (w 100 km) rather than on the local scale (-10
km) as projected in previous studies (e.g., Zhang et al. 2004, Miller et al. 2005). By 2009,
the TGD is expected to fully submerge a 660 km length of the Yangtze River and the
water level will further rise to 175 m. It is likely that the TGD may further change the
regional precipitation. It should be pointed out that the TRMM-based rainfall product
might contain significant uncertainties because it relies heavily on less-accurate rainfall
estimates from Geosynchronous infrared data and available gauge data to offset the
temporal/spatial limitation of the TRMM microwave data (Huffman et al. 2006). Further
study is still needed to fully understand the TGD effect on the regional climate.
Acknowledgments. Liguang Wu would like to acknowledge funding provided by
Ramesh Kakar through the NASA EOS project (EOS/03-0000-0144). We thank Dr.
Guojun Gu for obtaining the TRMM data. The comments by the three anonymous
reviewers are gratefully acknowledged for helping to improve the presentation of the
manuscript.
References
Edmonds, R. L., 1992: The Sanxia (Three Gorges) project: The environmental argument
surrounding China’s super dam. Global Ecology and Biogeography Letters, 2,
105- 125.
Gwynne, P, and Y. Q. Li, 1992: Yangtze project dammed with taint praise. Nature, 356,
736.
Huffman, G. J., R F. Adler, D. T. Bolvin, G. Guy E. J. Nelkin, K. Bowman, E. F. Stocker,
and D. Wolff, 2006: The TRMM multi-satellite precipitation analysis (TMPA):
6
Quasi-global, multi-year, combined-sensor precipitation estimates at fine scales.
Submitted to Journal of Hydrology.
Miller, N. L., J. Jin, and C-F Tsang, 2005: Local climate sensitivity of the Three Gorges
Dam. Geophysics Research Letters, 32, doi: lO.l029/2005GLO22821.
Shen, G., and Z. Xie, 2004. Three Gorges Project: Chance and challenge. Science, 304,
681.
Wang, J., 2002: Three Gorges Project: The largest water conservancy project in the
world. Public Admin. Dev. 22,369-375.
Zhang, Q., S. Wai, Y. Mao, Z. Chen, and Y. Liao, 2005: Characteristics of temperature
changes around the Three Gores with complex topography. Advances in Climate
Change Research, 4, 16-20 (In Chinsese).
Zhang, H., C. Zhuo, X Ju, and Q. Zhang, 2004: Numerical modeling of microclimate
effects of Shanxia Reservoir, Resources and Environment in the Yangtze Basin,
13, 133-137 (in Chinese).
7
34N
33N
32N
30N
29N
28N 107E 109L llOE i l lE 112E
c
0.4 0.U 1.Z 1.U z.8 3.2 Km z ~
2.4
Figure 1 The changes of the TRMM rainfall rate (mm month-’, contours) after the TGD water level rose to 135 m, derived from the two periods: January 1998 -January 2003 and January 2004 - January 2006. The overlaid topography heights (km, shading) are from U.S. Geological Survey (USGS) 30-second global data set (GTOP030).
8
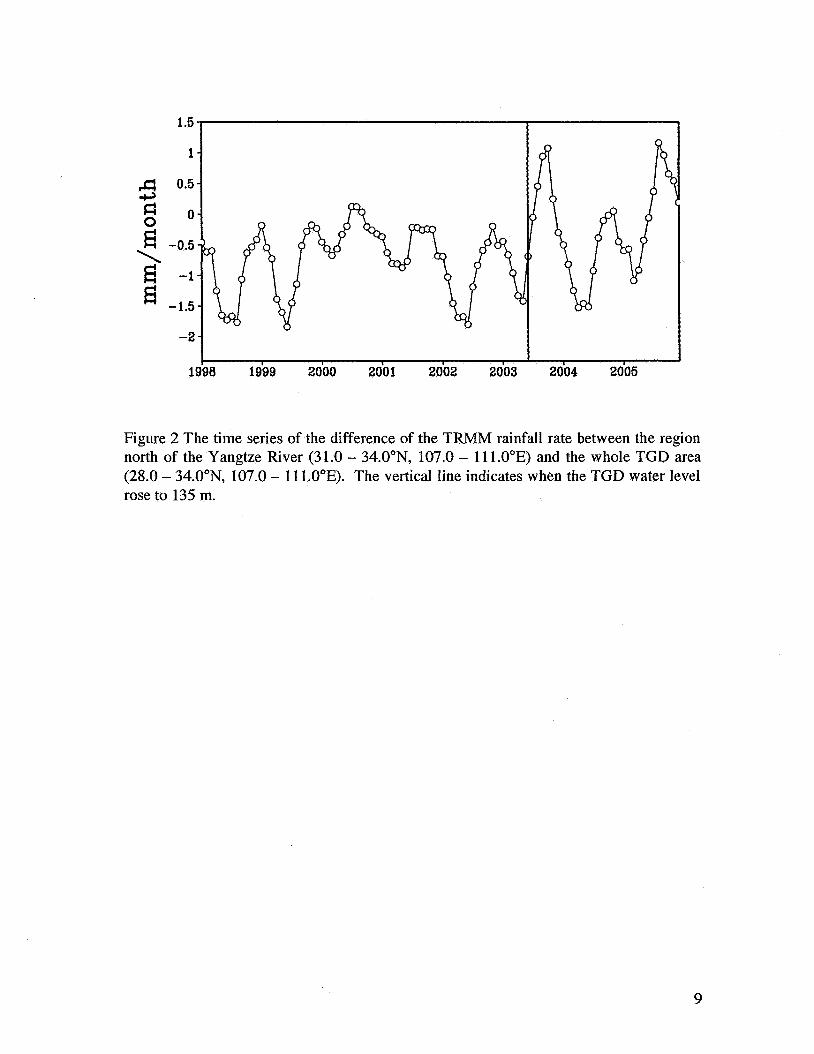
Figure 2 The time series of the difference of the TRMM rainfall rate between the region north of the Yangtze River (31.0 - 34.0°N, 107.0 - 1ll.O"E) and the whole TGD area (28.0 - 34.0°N, 107.0 - 11 1.0"E). The vertical line indicates when the TGD water level rose to 135 m.
9
12
11 a,
10 k M a s F1
8
1 I I 2001 2w2 2009 2004 2005 20oB
0.8 I I 0.4
Q ) o Q)
& -0.4 9) a -0.8
-1.2
-1.8 2001 2002 2003 2004 2005 2008
I I I 2001 2002 2003 2004 2005 2006
Figure 3 (A) The comparison of the day-night difference of the Terra sa-Alite-derived land surface temperature (LST) for the whole TGD area (28.0 - 34.0°N, 107.0 - 11 l.OoE, solid dots) and the region north of the Yangtze River (30.5 - 34.0°N, 107.0 - lll.O"E, open dots), (B) the differences of the daytime LST between the region north of the Yangtze River and the whole TGD area, and (C) same as (B) but for the nighttime LST. The vertical lines indicate when the TGD water level rose to 135 m.
10
6or 50
30N 30.5N 3
I'Daba Mtk I \ Pnrmg
N 31.5N 32N 32.5N 33N 35.5N :N Figure 4 The latitudinal distribution of the influence of the Three Gorges Dam (TGD) on the rainfall derived from the TRMM data (green) and MM5 simulation (black), and the corresponding terrain height (blue) averaged over 109.0 - 1 1 1 .O"E. The y-axis indicates terrain height (unit: m) and the rainfall rate change (%). The height has been divided by a factor of 30. The vertical red line approximately denotes the location of the Yangtze River between 109.0 and 1 11 .O"E.
11