Embed Size (px)
Citation preview

THE TENDENCY OF FIBERS TO BUILD FLOCS
LUCIANO BEGHELLO
LABORATORY OF PAPER CHEMISTRY FACULTY OF CHEMICAL ENGINEERING
ÅBO AKADEMI UNIVERSITY ÅBO 1998
The tendency of fibers to build flocs 2
Preface This work has been carried out at the Department of Paper Chemistry of Åbo Akademi University during the years 1993-1996. The research has been done under the guidance of Prof. Dan Eklund, Head of the Department of Paper Chemistry. I am deeply indebted to him for his competent advice and constructive criticism throughout the entire duration of this project. I also wish to express my cordial thanks to all of my colleagues who were involved in the construction of the floc measuring device. Special thanks are directed to Martti Toivakka, for his great contribution in the development of the method for the treatment of the results based on image analysis. Financial support was provided by a consortium comprising five companies: - Enso Gutzeit Oy, Helsinki - Kymmene Oy, Helsinki - MoDo AB, Örnsköldsvik (Sweden) - Stora Teknik AB, Falun, (Sweden) - Valmet Paper Machinery Oy, Jyväskylä I should like to gratefully acknowledge the representatives of these companies, Dr. Ilkka Kartovaara, Prof. Kari Ebeling, Prof. Tom Lindström, Prof. Douglas Wahren and Dr. Pekka Taskinen for the continuous encouragement they have given me during this work. Special thanks are extended to Mr Lennart Bergstedt, CEO of AB Tumba Bruk, for his support and encouragement so that this thesis could be concluded and to Dr. Anthony Bristow for linguistic revision of this manuscript. Finally, I owe my family heartfelt thanks for their generosity of spirit throughout my studies. Tumba, December 1997 Luciano Beghello
The tendency of fibers to build flocs 3
Abstract The aim of the work described in this thesis has been to clarify some of the factors which influence fiber flocculation prior to the addition of typical papermaking chemicals. The work has also been focused on the construction and calibration of an advanced flocculation measurement apparatus, in order to study experimentally the role of some basic factors in flocculation (Paper I). This thesis addresses three main issues to papermakers: • How the physical and mechanical aspects of suspended fibers influence the
flocculation process prior to the addition of wet end chemicals (Paper II and a part of Paper III)
• How the chemical and physical environments in the fiber suspension influence and/or
contribute to the flocculation process (Papers III and V) • How changes in the surface chemistry of suspended fibers influence the flocculation
process (Paper IV) This thesis includes the following documents: I “A device for measuring fiber floc sizes in highly turbulent fiber suspensions”
Luciano Beghello, Martti Toivakka, Dan Eklund and Tom Lindström Nordic Pulp & Paper Research Journal, 11:4, 249-253, (1996)
II “Some mechanisms that govern fiber flocculation”
Luciano Beghello and Dan Eklund Nordic Pulp & Paper Research Journal, 12:2, 119-123, (1997)
III “The influence of the chemical environment on fiber flocculation” Luciano Beghello and Dan Eklund Submitted for publication in Journal of Pulp and Paper Science IV “The influence of carboxymethylation on the fiber flocculation process” Luciano Beghello and Tom Lindström Submitted for publication in Nordic Pulp & Paper Research Journal

The tendency of fibers to build flocs 4
V “Some factors that influence fiber flocculation” Luciano Beghello Submitted for publication in Journal of Pulp and Paper Science Keywords: Fiber, flocculation, floc size, floc measuring device, image analysis, fiber length, fiber diameter, form factor, fiber aspect ratio, fiber consistency, beating degree, fiber flexibility, fiber curl, electrolytes, carboxymethylcellulose, carboxymethylation, viscosity, yield stress and pH.
The tendency of fibers to build flocs 5
Contents PREFACE............................................................................................................................ 2
ABSTRACT ........................................................................................................................ 3
CONTENTS ........................................................................................................................ 5
LIST OF PRINCIPAL SYMBOLS AND ABBREVIATIONS .......................................... 7
Greek symbols........................................................................................................... 7 Latin symbols and abbreviations............................................................................... 7
1. INTRODUCTION ........................................................................................................... 9
2. FLOCCULATION OF PULP FIBERS ......................................................................... 11
2.1 Flocculation mechanisms......................................................................................... 11 2.1.1 The mechanical and statistical approach........................................................ 11 2.1.2 The chemical approach................................................................................... 16 2.1.3 The network strength...................................................................................... 17
2.2 Floc size measurements ........................................................................................... 19
3. A NEW MEASUREMENT TECHNIQUE (PAPER I)................................................. 20
3.1 The Image-Analysis-based measuring device ......................................................... 20 3.1.1 The lighting system and observation area ...................................................... 21 3.1.2 The "loop" ...................................................................................................... 22 3.1.3 The camera system ......................................................................................... 23
3.2 Data processing........................................................................................................ 24 3.3 Advantages and limitations of the method .............................................................. 24
4. FLOC SIZE IS DEPENDENT ON FIBER CONSISTENCY (PAPER II) ................... 26
4.1 Preparation of the fiber furnish................................................................................ 26 4.2 Fiber characterization .............................................................................................. 27 4.3 Effect of fiber consistency, fiber length, fiber curl index, coarseness and beating on floc size..................................................................................................................... 27
5. THE CROWDING FACTOR IS DECISIVE FOR FLOC SIZE (PAPERS II AND III) ............................................................................................................................ 31
5.1 Effect of fiber crowding factor - bleached sulfate fibers......................................... 31 5.2 Effect of fiber crowding factor - viscose fibers....................................................... 32
5.2.1 Raw material .................................................................................................. 32 5.2.2 Preparation and characterization of viscose fibers......................................... 32 5.2.3 Preparation of viscose fibers suspensions ...................................................... 33 5.2.4 Dependence of floc size on crowding factor.................................................. 33

The tendency of fibers to build flocs 6
6. THE EFFECTS OF THE CHEMICAL ENVIRONMENT ON FLOC SIZE (PAPERS III AND V) ....................................................................................................... 35
6.1 The chemical environment has no effect on floc size for bleached kraft pulps and viscose fibers ................................................................................................................. 35
6.1.1 Raw material and preparation of viscose fiber suspensions........................... 35 6.1.2 pH adjustment and preparation of electrolytes............................................... 36 6.1.3 The impact of the suspending pH and electrolyte content on floc size.......... 36
6.2 Effect of the chemical environment on native cellulose fibers ............................... 37 6.2.1 Raw material and preparation of fibers and pulp suspensions....................... 37 6.2.2 The impact of the suspension pH and electrolyte content on floc size .......... 38
7. THE CARBOXYMETHYLATION OF PULP FIBERS INFLUENCES FLOC SIZE (PAPER IV) ....................................................................................................................... 40
7.1 Effect of the carboxymethylation on fiber suspensions........................................... 40 7.1.1 Outline and experimental design.................................................................... 41 7.1.2 Materials and preparation of the suspensions ................................................ 41 7.1.3 Effect of the degree of substitution on floc size............................................. 41 7.1.4 Effect of carboxymethylation on yield stress ................................................. 42 7.1.5 Effect of carboxymethylation on fiber flexibility........................................... 44
7.2 Discussion of and conclusions from this experiment .............................................. 44
8. THE VISCOSITY OF THE SUSPENSION INFLUENCES FLOC SIZE (PAPER V) 47
8.1 The impact of the liquid viscosity on floc size ........................................................ 47 8.1.1 Choice of materials for increasing the viscosity ............................................ 47 8.1.2 Effect of viscosity on floc size ....................................................................... 48 8.1.3 Effect on floc size of the viscosity induced by the suspension temperature .. 49
9. FILLERS AND FINES HAVE NEGLIGIBLE EFFECTS ON FIBER FLOC SIZE (PAPER V) ........................................................................................................................ 50
9.1 The impact of fines and fillers on flocs ................................................................... 50 9.1.1 Raw materials................................................................................................. 50
10. CONCLUDING REMARKS....................................................................................... 52
APPENDIX I ..................................................................................................................... 54
REFERENCES .................................................................................................................. 55
PAPERS
The tendency of fibers to build flocs 7
List of principal symbols and abbreviations Greek symbols σσσσ Standard deviation µµµµ Coefficient of friction µµµµ Fluid dynamic viscosity ωωωω Coarseness ηηηη Dynamic viscosity φφφφ Floc diameter ρρρρ Fluid density αααα Specific volume of a cylinder λλλλchar. Characteristic wavelength ττττzy Shear stress ττττy Yield stress δδδδ Fiber deformation Latin symbols and abbreviations A Fiber aspect ratio (L/d) (c)v Fiber concentration for a little volume v (w)A Local basis weight measured in a large number of small areas A BW Basis Weight C Average fiber concentration of suspension Csed Sediment concentration CD Cross direction Cm Mass concentration CMC Carboxymethylcellulose co Critical concentration Cv Volume concentration E Young’s modulus E Energy f Fiber length factor LP / L FF Fine fiber fraction FSchar Characteristic floc size Ge Shear rate
The tendency of fibers to build flocs 8
I Moment of inertia of a fiber segment I.A Image analysis k Function constant L Axial (real) fiber length l Fiber length l/d Fiber aspect ratio (length/breadth) LF Long fiber fraction LP Projected fiber length M Molar concentration MD Machine direction MF Middle fiber fraction mx Average number of fiber segments per unit length in x-direction my Average number of fiber segments per unit length in y-direction mz Average number of fiber segments per unit length in z-direction N Crowding factor nc Average number of contact points per fiber r Ratio of the radius of the sphere generated by a cylinder during rotation
with the radius of the cylinder Re Reynolds number ReF Fiber Reynolds number SD Spectral density SR Schopper-Riegler number (Drainage resistance) T Parameter including distribution of contact points along a fiber W Average basis weight Vm Measurement volume Vp Volume of a particle
The tendency of fibers to build flocs 9
1. Introduction In the manufacture of paper on a paper machine, the sheet formation, i.e. the local variation in the mass distribution or small-scale basis weight variation, is determined largely by the state of flocculation and turbulence in the stock that is deposited on the wire. In both the paper sheet and the stock from which it is formed, there is a large but defined number of fibers per unit weight. The lowest concentration at which a coherent fiber network forms is the so-called sediment concentration (Csed). This can be measured by mixing a known amount of fibers with water, and then letting the motion in the mixture decay so that the fibers can sediment without any external forces acting upon them. The volume of the network can then be measured and the sediment concentration calculated. Therefore, for purely statistical reasons, the basis weight (BW) of the sheet, as well as the consistency of the stock, varies from point to point. That fibers in a suspension and in a flowing state tend to form mechanically entangled fiber networks is well known. The forces that affect the fibers and hold them together in a semi-ordered state may be dependent on the surface charge of the fibers or actually on purely physical, mechanical and geometrical factors, the relative importance of which is largely unknown. To give an illustrative description of a fiber network the following can be quoted from Meyer and Wahren (1964): ”...A fiber network is a system of fibers in contact where every fiber is locked in position in the network by contact with at least three other fibers in the network and in such a way as to be able to transmit forces...” Meyer and Wahren (1964) have elucidated how a fiber network can be achieved. Their explanation of how and why fiber networks form is as follows: ” ...When a fiber suspension is agitated, the fibers are exposed to viscous and dynamic forces that tend to bend them. When agitation ceases, the fibers tend to regain their original unstrained shape. However, if there are many fibers per unit volume, they can not straighten out freely but will come in contact with other fibers. A fraction of the fibers will come in contact with so many others that they will come to rest in a strained position, and forces will be transmitted from fiber to fiber. These fibers become interlocked by normal and frictional forces, constituting a fiber network, where forces can be

The tendency of fibers to build flocs 10
transmitted through the fibers and from fiber to fiber. Thus, fiber networks are coherent because of internal stresses...” Wahren (1980) also postulated that for a fiber network to form, and if the fibers are to be kept in a strained condition, there must be at least three contact points per fiber and these have to be arranged in an alternate manner. Fibers in a fiber suspension they have not entangled with other fibers do not participate in the network structure. Wahren (1980) makes a classification of the fibers that are not included in the fiber network and those which are. The fibers that do belong to the network are called active fibers and those that are not entangled in the network structure are called inactive fibers. Improvements in paper formation are a prerequisite for the quality development of papers and boards. A fundamental knowledge of the fiber properties that govern fiber flocculation is a keystone on which quality development is founded. It is well known that longer fibers and a higher fiber consistency increase the flocculation tendency of fiber suspensions. Factors such as fiber flexibility and fiber curl under dynamic conditions play an important role in this context. The significance of the fiber surface chemistry and of the chemical and physical characteristics of the suspending environment for fiber flocculation are almost unknown, in spite of the fact that several technically well documented cases clearly demonstrate their key role. An attempt is made in this work to investigate and characterize the flocculation process further by using a new measuring technique. The approach has been to carry out floc measurements under certain conditions with regard to practical papermaking operations, and to compare them with previously reported results.
The tendency of fibers to build flocs 11
2. Flocculation of pulp fibers There are many relevant studies on the flocculation of papermaking fibers. The literature quoted here is of specific interest for the treated outlines and for the measuring techniques used in the work reported in this thesis. 2.1 Flocculation mechanisms The materials involved in the papermaking process characterize the fiber suspension. The fundamental elements of a suspension are the fibers, with a given fiber length and width distribution, the typical wet-end chemicals added in optimized amounts to the stock suspension in order to retain fines and filler materials, the suspending medium and some other specific materials. In normal papermaking operations, these materials are suspended in water in a consistency range of 0.5-1.5 %. Some mechanisms may cause particles in suspensions to agglomerate and form more or less coherent flocs. The mechanisms are of two basically very different kinds, namely mechanical and chemical. The mechanical flocculation is due to mechanical entanglement of long fibers. Fibers in particular have a tendency to agglomerate. Flocs also affect the behavior and the rheology of the pulp suspension influencing the network strength. In order to retain fines and fillers, retention aids are used in papermaking. These additives are usually high molecular weight polyelectrolytes that flocculate the stock and lead to a deterioration in paper formation. Without polymeric additives, the extent of flocculation is basically determined by mechanical entanglements between fibers. It is generally believed that the simple charge properties of fibers are of less importance for the floc formation between fibers, but in practical papermaking, retention aids are almost always used and they are strong fiber flocculants. 2.1.1 The mechanical and statistical approach Mason (1954) and Robertson (1957) in Montreal were the first to show and measure the cohesive properties of networks of ordinary papermaking fibers. The accepted view of mechanism of the formation of a continuous fibrous structure is based on the hypothesis of Mason (1954) assuming a limited volume for the free rotational movement of the fibers in suspensions of industrial consistency which, as a rule, is higher than the critical con-sistency, i.e. the sediment concentration. The flow of the suspension causes entrapment and deformation of the fibers since, according to Mason's hypothesis, the freedom of movement decreases as the number of fibers per unit volume increases. When the content
The tendency of fibers to build flocs 12
of fibers in unit volume exceeds a predetermined limit, the fibers become so linked to each other that they cannot straighten out and they remain in this trapped and deformed state upon release of the shearing stress. In this case, a normal pressure arises at the contact points and determines the frictional forces. The fibers are bound to the extent that they can transmit applied external forces to each other, and a three-dimensional fiber lattice structure is thus formed. The mechanical interactions between the fibers are in this case the determining factors in the formation of the structure, the strength of which increases with increasing consistency, increasing fiber length, increasing fiber surface roughness, increasing fiber curl and increasing fibrillation (Mason 1950 b). These concepts were further developed by Wahren (1972). He was able to show that fiber networks can be coherent for purely geometrical and mechanical reasons. The variation in the local fiber concentration is a measure of the flocculation intensity. The flocs can be characterized through measurement and by mapping their geometry and floc intensity. The intensity of flocculation has been defined by Wahren (1967) as:
Flocculation intensity = C
c v)(σ [2.1.1]
where σ(c)v is the standard deviation of the local fiber concentration measured in volume, v, and C is the average fiber concentration in the stock. The local fiber concentration term, (c)v requires the observation of a sufficiently large volume in order for it to be meaningful to talk about concentration at all. The volume must not, however, be larger than the size of the smallest floc to be observed. The smaller the volume to be measured, the larger will σ (c)v be. By analogy, the formation of the sheet produced can be defined as:
Formation = ( )W
w Aσ [2.1.2]
where σ(w)A is the standard deviation of the local basis weight measured in a large number of small areas, A, and W is the average basis weight (Wahren 1967). It is well known that flocs form more readily under conditions of high than of low concentration, because the fibers have several points of contact with each other and the freedom of motion is reduced. The flocs in a flowing suspension are not permanent, as a constant breakdown of some flocs takes place while others are being formed. Shearing stresses are not alone in breaking down the flocs. The pioneer within the field of fiber flocculation in conjunction with papermaking was Mason (1950, 1950 b, 1954, 1954 b). In one of his first articles (1950), he presented
The tendency of fibers to build flocs 13
mathematical models that describe fiber and floc dynamics when a fiber, or more specifically a floc, is subject to a flow, through pumping, for example, with the resultant speed gradients. This gives rise to a shearing profile in the direction of the flow of the fiber. Thus, the formed flocs undergo rotation. All these rotations are believed to be of considerable importance in connection with the theory of flocculation, formation, and so on. Mason’s studies extend further to a consideration of fiber orientation in the XY-plane and to an attempt to include the critical fiber concentration as an important parameter in conjunction with free rotation. When the concentration limit for free rotation is exceeded, flocculation inevitably occurs. It has been proven that these concentration limits are far from the fiber concentrations that are conventionally used at the wet end of the papermaking machine (usually around 1%). Only the expression for the critical concentration, co, is given here:
20 23rc α
= [2.1.3]
where the critical concentration co is expressed in g/ml of a suspension of cylinders, the specific volume of which is α (in units of ml/g). In this expression, r is the radius of the sphere that is generated when the cylinder rotates, divided by the radius of the cylinder. All the mathematical observations form a good starting point, but they seem far too theoretical in nature to be used in any form in conjunction with the papermaking machine. Several years later, Mason returned with more specific contributions (Mason 1954, 1954 b, 1950) in which the fibers appear in the form of oblong cylinders. Fiber flexibility terminology such as "flexible rotation", "flexible spin" and "Snake Turn", appear for the first time. Single fibers could be photographed with the aid of an instrument constructed in conjunction with these studies. Elongation caused by the acceleration of the flowing medium also plays a role, e.g. in the case of constriction. Kerekes (1983) studied the behavior and dynamics of a suspension of a long-fibered pulp flowing under constriction through holes in the construction, i.e. narrow columns and openings. With the aid of a camera, he studied the movement and deformation of individual flocs in the state of flow in conjunction with sudden changes in the pipe dimensions. The models illustrated describe the flow dynamics in relation to the mass flow in narrow columns and openings when there is a significant acceleration of the flow, as well as in relation to the lateral flow. The elongational strain of the floc which originates with the stretching of the floc at the entrance to the column (due to acceleration of the flow) deforms the floc slightly but not enough to break down the floc completely. However, the stretching increases as the dimensions of the constriction opening become much smaller than the size of the floc

The tendency of fibers to build flocs 14
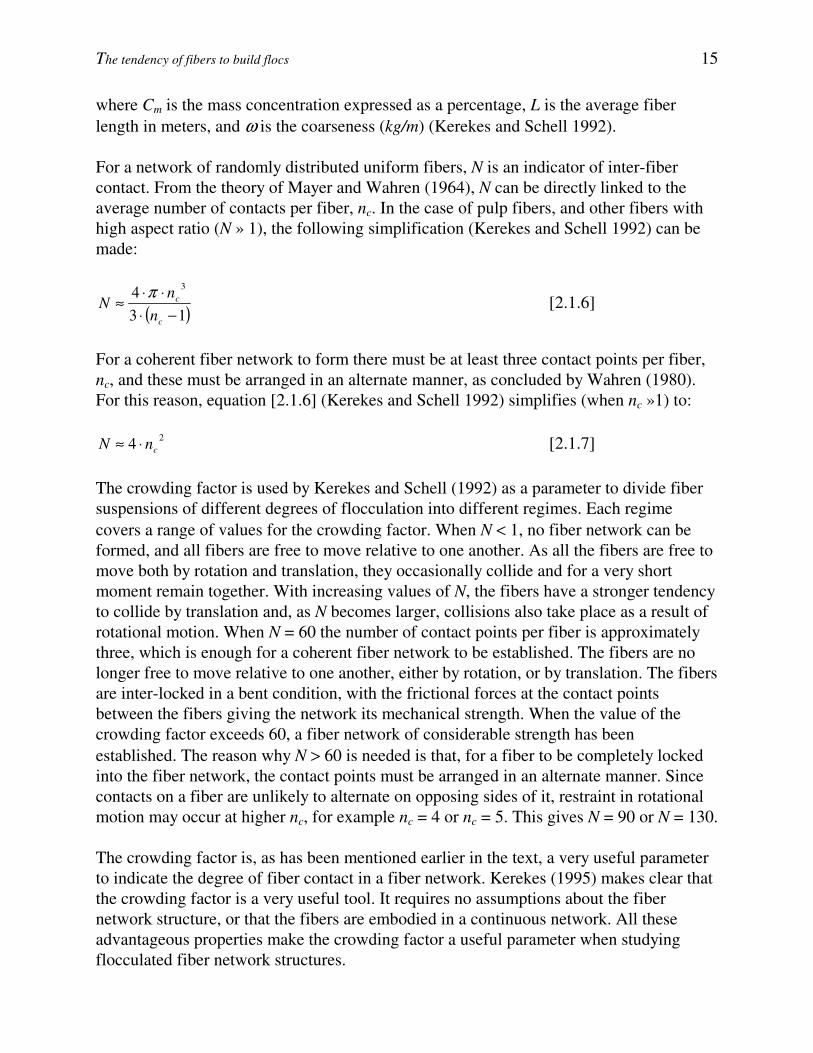
itself. A breakdown of the floc can occur when the floc is made to undergo a 90° change in direction before it is forced into the opening along the pipe path. The breakdown in question can, however, be attributed more to the elongation strain than to the shearing itself. Kerekes et al. studied the formation of flocs and the characterization of flocculation potential of fibers in connection with flow (1983, 1983 b, 1992, and 1995). With this new addition, an attempt to revise earlier contributions was made. Particular importance was placed upon the condition of flocculation and upon the flocculation process in decaying turbulence. In addition, the mechanisms that govern re-flocculation were partially clarified. Many postulations based on both earlier and present studies were presented and an attempt was made to describe the behavior of a suspension under conditions of decaying turbulence. In a recent article, Kerekes (1992) coins a new expression. He introduces the “fiber crowding factor”, N, defined as the number of fibers in the spherical volume produced by a single fiber in rotation (Figure 2.1.1). The crowding factor is, according to this definition, dependent on the volumetric concentration of the fibers, the fiber length, L, and the fiber diameter, d:
N CLdv= ⋅ ⋅ �
��
���
23
2
[2.1.4]
This equation is written using the expression derived by Meyer and Wahren (1964), for the volumetric concentration Cv.
Fig. 2.1.1 The crowding factor, N, represents the number of fibers in the volume having a diameter equal to a fiber length (Kerekes and Schell 1992). For pulp fiber suspensions, the crowding factor N is more conveniently expressed as
N � ω
25 LCm [2.1.5]
The tendency of fibers to build flocs 15
where Cm is the mass concentration expressed as a percentage, L is the average fiber length in meters, and ω is the coarseness (kg/m) (Kerekes and Schell 1992). For a network of randomly distributed uniform fibers, N is an indicator of inter-fiber contact. From the theory of Mayer and Wahren (1964), N can be directly linked to the average number of contacts per fiber, nc. In the case of pulp fibers, and other fibers with high aspect ratio (N » 1), the following simplification (Kerekes and Schell 1992) can be made:
( )134 3
−⋅⋅⋅
≈c
c
nn
Nπ
[2.1.6]
For a coherent fiber network to form there must be at least three contact points per fiber, nc, and these must be arranged in an alternate manner, as concluded by Wahren (1980). For this reason, equation [2.1.6] (Kerekes and Schell 1992) simplifies (when nc »1) to:
24 cnN ⋅≈ [2.1.7] The crowding factor is used by Kerekes and Schell (1992) as a parameter to divide fiber suspensions of different degrees of flocculation into different regimes. Each regime covers a range of values for the crowding factor. When N < 1, no fiber network can be formed, and all fibers are free to move relative to one another. As all the fibers are free to move both by rotation and translation, they occasionally collide and for a very short moment remain together. With increasing values of N, the fibers have a stronger tendency to collide by translation and, as N becomes larger, collisions also take place as a result of rotational motion. When N = 60 the number of contact points per fiber is approximately three, which is enough for a coherent fiber network to be established. The fibers are no longer free to move relative to one another, either by rotation, or by translation. The fibers are inter-locked in a bent condition, with the frictional forces at the contact points between the fibers giving the network its mechanical strength. When the value of the crowding factor exceeds 60, a fiber network of considerable strength has been established. The reason why N > 60 is needed is that, for a fiber to be completely locked into the fiber network, the contact points must be arranged in an alternate manner. Since contacts on a fiber are unlikely to alternate on opposing sides of it, restraint in rotational motion may occur at higher nc, for example nc = 4 or nc = 5. This gives N = 90 or N = 130. The crowding factor is, as has been mentioned earlier in the text, a very useful parameter to indicate the degree of fiber contact in a fiber network. Kerekes (1995) makes clear that the crowding factor is a very useful tool. It requires no assumptions about the fiber network structure, or that the fibers are embodied in a continuous network. All these advantageous properties make the crowding factor a useful parameter when studying flocculated fiber network structures.
The tendency of fibers to build flocs 16
Local crowding of fibers occurs in decaying flow because the fibers cannot follow the fluid. To obey the law of conservation of mass, fiber networks densify, i.e. crowd. Fibers crowd to a level at which hydrodynamic forces causing crowding equal fiber network forces resisting crowding (Kerekes 1995). The fibers will not crowd if the fluid viscous forces acting on individual fibers are large, i.e. if the fibers follow the fluid. This phenomenon is governed by the fiber Reynolds Number, ReF:
ReF = µ
ρ LGd e ⋅⋅⋅ [2.1.8]
where ρ is the fluid density, kg/m3, Ge the shear rate, s-1, L the fiber length and µ the fluid dynamic viscosity, Pa s. Physically, ReF reflects the ratio of inertial forces to viscous forces acting upon the fiber. When ReF ≈1, no flocculation occurs (Kerekes 1995). An interesting issue is the flocculation of fibers suspended in aqueous solutions when the suspending liquid viscosity has been increased by the addition of a suitable polymer. Recent work by Soszynski and Kerekes (1988) and by Zhao and Kerekes (1993) shows that an increase in the suspending liquid viscosity leads to an improvement in fiber suspension uniformity, which may reach levels close to perfect uniformity at consistencies where water alone would yield gross flocculation. 2.1.2 The chemical approach Earlier literature, before Mason, conceived fiber flocculation as being determined by the classical laws of coagulation, i.e. by the balance of electrostatic forces and Van der Waals-London attractive dispersion forces. The work by Mason and co-workers revealed that fiber flocculation was largely determined by mechanical entanglements, whereas the state of agglomeration of fines material was affected by the chemical environment (Mason 1954). Van der Waals attractive forces are generally too weak to be important under papermaking conditions where shear forces are strong. Retention aids, however, do affect the state of flocculation of fibers (Lindström et al. 1989) and investigations using laser-optical measuring gauges have shown the usefulness of this technology for such studies (Wågberg 1987). Less studied are how chemical dispersion or formation aids affect the state of fiber dispersion. There are several classes of additives known to affect fiber dispersion. They may be grouped into the following classes: * Additives increasing the dispersion medium viscosity (Zhao and Kerekes 1993, Soszynski and Kerekes 1988).
The tendency of fibers to build flocs 17
* Formation aids, class I. Gums and mucilages believed to decrease the coefficient of friction between fibers (De Roos 1958). * Formation aids, class II. High molecular weight polymers affecting the rheological properties of the suspending media (Wasser 1978, Lee and Lindström 1989). No systematic studies have dealt with the possible effects of fiber surface chemistry on fiber dispersion in the region of high surface charge densities. Under such conditions charges may solubilize the interface layer and macromolecules protruding out in solution may affect friction forces or act as a steric stabilizer. Many years ago it was, however, noticed (Nelson and Kalkipsakis, 1964) by visual observation that the extent of agglomeration of carboxymethylated fibers was affected by the chemistry (ionic form of the carboxyl groups). This was the impetus for this study of the effect of carboxymethylation on the state of dispersion of fibers. 2.1.3 The network strength The network strength of fiber suspensions arises from the cohesive forces that act between fibers at fiber-fiber contact points. Meyer and Wahren (1964) derived a mathematical description of two different classes of properties concerning fiber networks. The first included the basic mechanical parameters that influence the fiber network such as the fiber length, the fiber width and especially the aspect ratio A = L/d, between fiber length and fiber diameter. The second was the shear modulus G, which describes the rheological state of fiber networks. Before Meyer and Wahren (1964) outlined their mathematical model, for the description of the shear modulus of fiber networks, there was no simple and accepted model. They predicted that the deformations due to elongation or compression are very small in comparison to the deformation due to bending of the fiber segments, when a fiber suspension is subjected to a shearing force. The deformation of a segment δ, is proportional to the shear stress τ per unit area, inversely proportional to the number of segments per unit area, proportional to the third power of the segment length and inversely proportional to the modulus of elasticity E of the segment and to the moment of inertia I of the segment. With these proportionalities the following equation for the deformation of fibers (in the z-direction) is obtained:
δτ
= ⋅⋅
⋅⋅
km m
LE I
zy
x y1
3
[2.1.9]
where k1 is a constant. To obtain the total deformation in the direction of the applied shear stress, the number of fiber segments in the z - direction mz must be multiplied by the total deflection per segment:

The tendency of fibers to build flocs 18
δ δzy zm= ⋅ [2.1.10] The shear modulus G is defined as the ratio of the shear stress τ to the total deformation δ:
Gk
EA T
nAn
nn
= ⋅ ⋅⋅ ⋅ +
−�
�
��
1
11
3
π [2.1.11]
In this equation, the fibers have been assumed to be cylindrical which simplifies the expression for the moment of inertia, I = π⋅r4/4. T is a parameter including the distribution of contact points along a fiber and A is the fiber aspect ratio. The models derived by Meyer and Wahren (1964) describing the fiber network properties have some disadvantages concerning their universal applicability, partly because the distribution function for the radius is assumed rather than properly modeled. The derived equations are also applicable only to fibers of circular cross-section and fiber networks with random segment directions. Many different forces contribute to the network strength, but the main forces, according to Bennington et al. (1990), arise from the interlocking of elastically bent fibers. They made assumptions similar to those of Meyer and Wahren (1964). The factors affecting the magnitude of the network strength are the fiber concentration and the aspect ratio A. Bennington et al. also included the effect of the stiffness of the fibers and the coefficient of friction between the fibers. The shear stress which the fiber network as a whole can sustain will be the product of the number of fibers affected and the force per fiber. The following expression for the yield stress τ y is obtained:
32v
y CAaE
⋅⋅=τ
[2.1.12]
where a is a constant, E the Young’s modulus of the fiber cell wall, A the fiber aspect ratio (l/d), Cv the fiber volumetric concentration. Yield stress phenomena may be reduced to a tensile stress problem with fiber-interlocking mechanisms investigated by various authors (Meyer and Wahren 1964, Bennington et al. 1990, Wahren 1980). The yield stress may also be expressed as: τ y = k⋅ µ⋅ E⋅ A 2⋅ Cv
3 [2.1.13] where µ is the coefficient of friction and k a constant.

The tendency of fibers to build flocs 19
It is obvious that a decrease in the coefficient of friction will lead to a decrease in the yield stress of a fiber network. 2.2 Floc size measurements Persinger and Meyer (1975) as well as Sanders and Meyer (1971) performed flocculation measurements under different conditions of turbulence. The aim of these studies was to develop a technique that could provide indications of local flocs, or actually of the local time-dependent fiber concentration. The techniques available in the mid-1970s were, in retrospect, highly limited. On the basis of the experimental results, however, suitable mathematical models were formulated. They described the effects of fiber concentration and of the Reynolds number on the size of the floc and its distribution. Jokinen and Ebeling (1985) characterized the intensity of flocculation with a floc measuring device using a mathematical relation in which the local concentration is a function of the received laser signal. Wågberg (1985 and 1987) has further studied the process of flocculation in conjunction with the addition of retention aids. A laser-based measuring apparatus was used for the purpose. The measuring system was based on the signal received from the reflected quantity of laser light. The advantage of a laser over other sources of light is that the laser can provide much light in a little volume due to its narrow, highly intense beam. The optical unit of the laser divides the light beam into two beams, which then intersect. The intersection takes the form of an ellipsoid which corresponds to the measurement volume, the size of which is partially dependent on the angle and partially on the diameter of the beam. The amount of light reflected is actually the information carrier of the flocculation process. The signal, which is received via the detector, is transmitted to the signal treatment unit. The recorded signal is there converted into a file which is transmitted to a computer for storage of the data and for further treatment. A mathematical program performs the calculations. Kaji et al. (1991) studied flocculation with the aid of a floc measuring device that is in principle similar to the system constructed at the Department of Paper Chemistry at Åbo Akademi University. Floc measurements were carried out with the aid of laser technology, which makes possible both the characterization of floc size and the statistical treatment required in this connection. In addition to these technical ingredients, Kaji employed image analysis, which immediately provides a real picture of the substrate by a visual observation, i.e. the flocs can be seen. Kaji studied the relation between the received signal of the laser (the transmitted light) and the average fiber length in suspensions of different wood types with additions of chemicals.
The tendency of fibers to build flocs 20
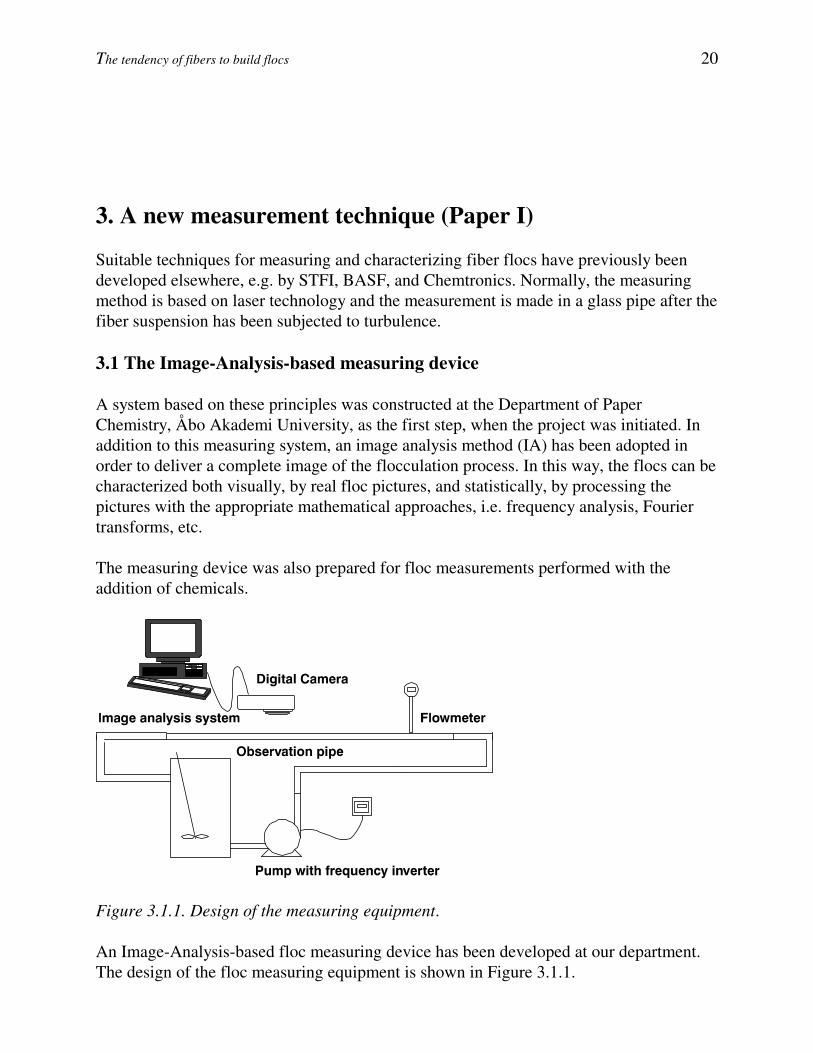
3. A new measurement technique (Paper I) Suitable techniques for measuring and characterizing fiber flocs have previously been developed elsewhere, e.g. by STFI, BASF, and Chemtronics. Normally, the measuring method is based on laser technology and the measurement is made in a glass pipe after the fiber suspension has been subjected to turbulence. 3.1 The Image-Analysis-based measuring device A system based on these principles was constructed at the Department of Paper Chemistry, Åbo Akademi University, as the first step, when the project was initiated. In addition to this measuring system, an image analysis method (IA) has been adopted in order to deliver a complete image of the flocculation process. In this way, the flocs can be characterized both visually, by real floc pictures, and statistically, by processing the pictures with the appropriate mathematical approaches, i.e. frequency analysis, Fourier transforms, etc. The measuring device was also prepared for floc measurements performed with the addition of chemicals.
Figure 3.1.1. Design of the measuring equipment. An Image-Analysis-based floc measuring device has been developed at our department. The design of the floc measuring equipment is shown in Figure 3.1.1.

The tendency of fibers to build flocs 21
Figure 3.1.1 shows the simplicity of the measuring device. One objective, when the planning of the operation system of the device started, was to obtain something both easy and flexible to work with. The loop-system can easily be used for further applications, for instance adding typical flocculation chemicals to the system, either to the suspension tank or directly to the observation pipe, at the turbulence generator level (Figures 3.1.1 and 3.1.3). This research has been focused on the construction of a suitable measuring device able to characterize fiber flocs, based on the need for a device able to render an immediate response of high scientific fidelity in a relatively short time. In order to estimate the degree of turbulence, the Reynolds number for flow through a channel has been calculated assuming a dynamic viscosity of 0.6 mPa s at a temperature of 24 oC and a channel height of 10 mm. The data are shown in Figure 3.1.2.
Figure 3.1.2. The calculated Reynolds number versus flow velocity in the observation pipe. Reynolds numbers are calculated with a dynamic viscosity (η) of 0.6 mPa s at a temperature of 24 oC (Ljungqvist 1984). The size of the Reynolds number indicates that the suspension has been in a turbulent state in the measurement channel. A description of the different sequences of the entire system is given here, taking into consideration the functions and the parts involved in this device. 3.1.1 The lighting system and observation area A dark room is adopted in order to achieve a homogeneous distribution of the flash illumination on the observation area.
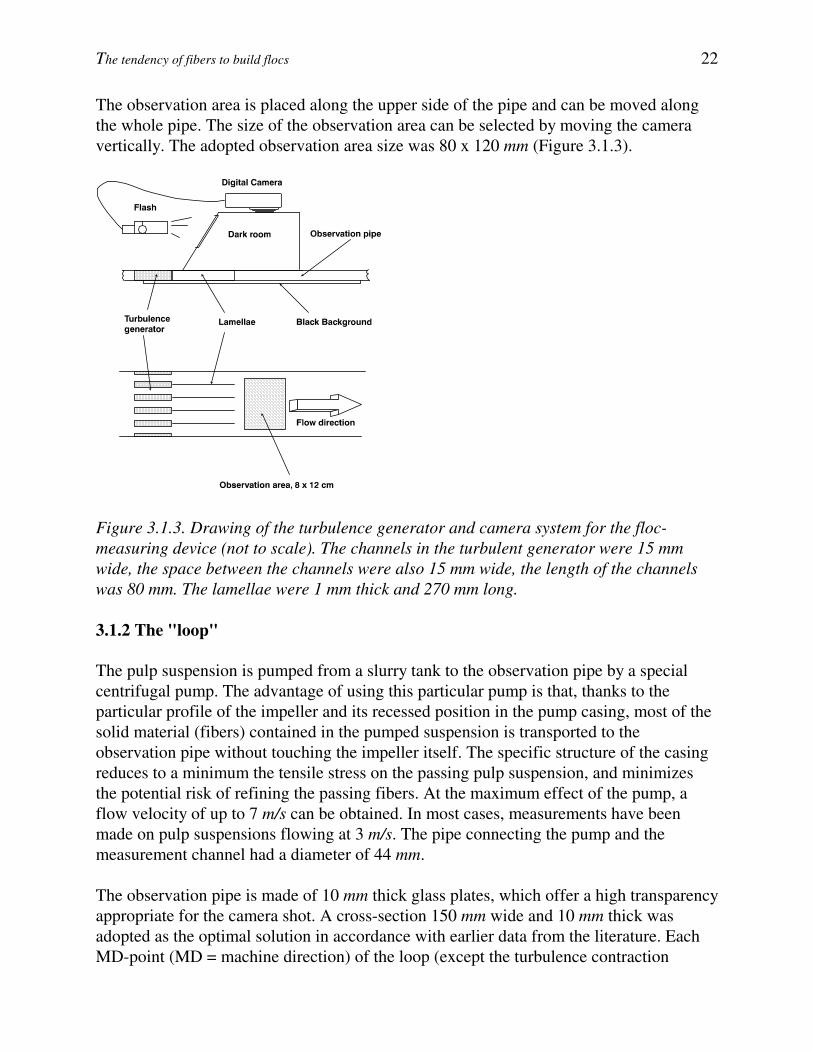
The tendency of fibers to build flocs 22
The observation area is placed along the upper side of the pipe and can be moved along the whole pipe. The size of the observation area can be selected by moving the camera vertically. The adopted observation area size was 80 x 120 mm (Figure 3.1.3).
Figure 3.1.3. Drawing of the turbulence generator and camera system for the floc-measuring device (not to scale). The channels in the turbulent generator were 15 mm wide, the space between the channels were also 15 mm wide, the length of the channels was 80 mm. The lamellae were 1 mm thick and 270 mm long. 3.1.2 The "loop" The pulp suspension is pumped from a slurry tank to the observation pipe by a special centrifugal pump. The advantage of using this particular pump is that, thanks to the particular profile of the impeller and its recessed position in the pump casing, most of the solid material (fibers) contained in the pumped suspension is transported to the observation pipe without touching the impeller itself. The specific structure of the casing reduces to a minimum the tensile stress on the passing pulp suspension, and minimizes the potential risk of refining the passing fibers. At the maximum effect of the pump, a flow velocity of up to 7 m/s can be obtained. In most cases, measurements have been made on pulp suspensions flowing at 3 m/s. The pipe connecting the pump and the measurement channel had a diameter of 44 mm. The observation pipe is made of 10 mm thick glass plates, which offer a high transparency appropriate for the camera shot. A cross-section 150 mm wide and 10 mm thick was adopted as the optimal solution in accordance with earlier data from the literature. Each MD-point (MD = machine direction) of the loop (except the turbulence contraction
The tendency of fibers to build flocs 23
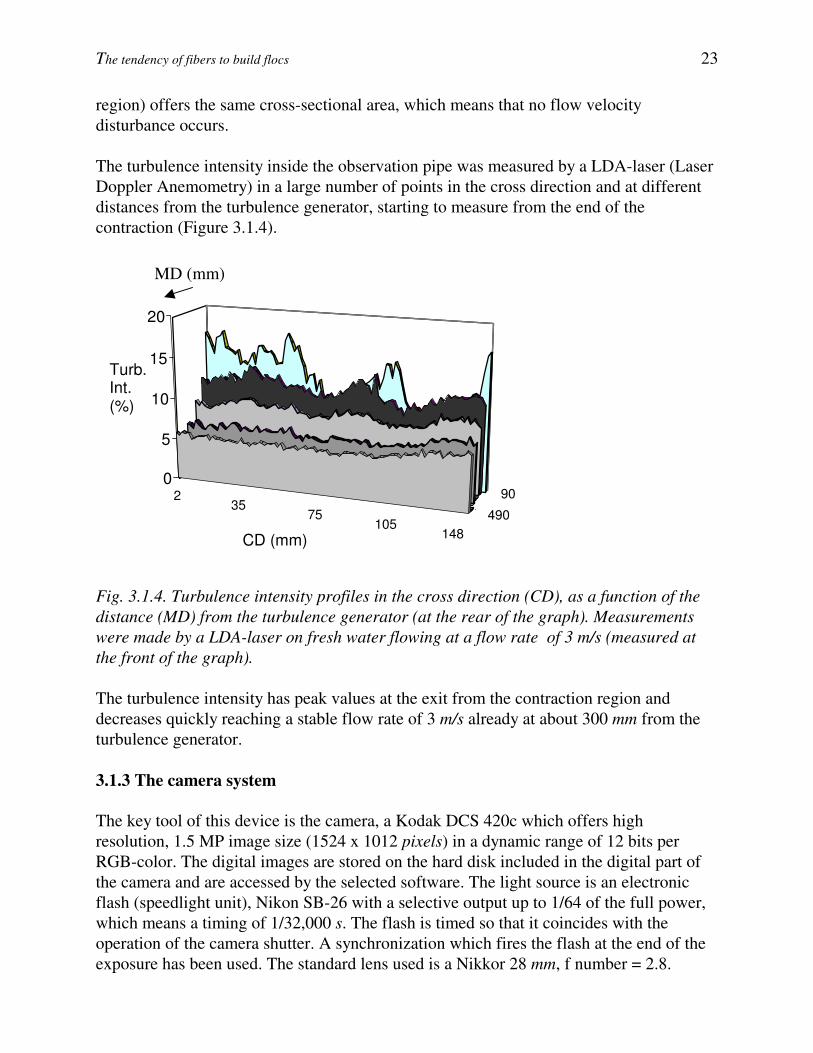
region) offers the same cross-sectional area, which means that no flow velocity disturbance occurs. The turbulence intensity inside the observation pipe was measured by a LDA-laser (Laser Doppler Anemometry) in a large number of points in the cross direction and at different distances from the turbulence generator, starting to measure from the end of the contraction (Figure 3.1.4).
Fig. 3.1.4. Turbulence intensity profiles in the cross direction (CD), as a function of the distance (MD) from the turbulence generator (at the rear of the graph). Measurements were made by a LDA-laser on fresh water flowing at a flow rate of 3 m/s (measured at the front of the graph). The turbulence intensity has peak values at the exit from the contraction region and decreases quickly reaching a stable flow rate of 3 m/s already at about 300 mm from the turbulence generator. 3.1.3 The camera system The key tool of this device is the camera, a Kodak DCS 420c which offers high resolution, 1.5 MP image size (1524 x 1012 pixels) in a dynamic range of 12 bits per RGB-color. The digital images are stored on the hard disk included in the digital part of the camera and are accessed by the selected software. The light source is an electronic flash (speedlight unit), Nikon SB-26 with a selective output up to 1/64 of the full power, which means a timing of 1/32,000 s. The flash is timed so that it coincides with the operation of the camera shutter. A synchronization which fires the flash at the end of the exposure has been used. The standard lens used is a Nikkor 28 mm, f number = 2.8.
235
75105
148490
900
5
10
15
20
Turb.Int.(%)
CD (mm)
MD (mm)

The tendency of fibers to build flocs 24
3.2 Data processing An experiment usually consists of 10-20 digital images. The image area is 80 x 120 mm. Each image is analyzed separately in MD (machine direction) and CD (cross direction) modes. The final result is then expressed as the average of all the images. The data processing involved is schematically depicted in Paper I. The image is converted to a gray scale, saved in TIFF format and then visually inspected. The image is resampled to a size of 192 x 128 pixels in order to reduce the computational time. An image height of 128 pixels leads to effective sampling rates of 1600-16000 corresponding to suspension flow rates of 1-10 m/s. The TIFF image is converted to a data matrix and normalized by removing the mean and fixing the amplitude to unity. A power spectrum is estimated for each column (MD) and row (CD). The mathematical description of the power spectrum estimation (also called a power spectral density or PSD) is briefly presented in Paper I. The power spectrum is calculated separately in both MD and CD by averaging the individual column and row spectra, respectively, and "grand average" spectra in the frequency plane are transformed to wavelength spectra as in Norman and Wahren (1972). By multiplying the spectral density by the wavelength, the coefficient of variation of the signal in the particular wavelength range of interest is characterized. The characteristic wavelength (λλλλ char) in the 2-32 mm range is determined by solving the equation
( ) ( )E d E dchar
char mm
mmλ λ λ λ
λ
λ=
32
2 [3.2.1]
The solution is obtained by finding the wavelength where energies to the left and to the right of λ char are equal. The characteristic floc size, simplified as FSchar, is considered to be half of what we call the characteristic wavelength, or FSchar = λλλλ char/2. Considering the floc size φφφφ = λλλλ/2 and scaling Equation [3.2.1] to the 1-16 mm range, this equation may be re-expressed as
( ) ( )E d E dFS
mm
mm
FS
char
char
2 216
1φ φ φ φ= [3.2.2]
For further details about the method and data processing the reader is invited to consult Paper I. 3.3 Advantages and limitations of the method The advantages of using this method are related to the possibility of characterizing flocs in real time, both visually by real floc pictures, and statistically by processing a number of floc photographs in digital form with appropriate mathematical approaches. The method
The tendency of fibers to build flocs 25
gives a quick answer by treating and presenting the results in a suitable and perspicuous manner. The stability and reproducibility of the method are guaranteed by the standardized geometry of the measuring device and the controllability of the operating parameters such as flow velocity, operating temperature, etc. The operating flow velocity is likewise taken into account in the data processing of the method. This method has also inspired other researchers in different parts of the world. The limitations of this method are found, among other things, in the transmission properties of the light through the flowing suspensions. The method is based on the digital photography of reflected light from the flocs passing through a pipe that is equipped with a black background able to absorb the excess transmitted light. The weakness of the device is the critical dimension of the aperture of the observation pipe which does not allow floc sizes exceeding 10 mm. Larger flocs (over 10 mm in diameter) are rotated by the flowing suspension in the machine direction leading to rolled fiber formations that show floc sizes in the CD greater than in the MD. Spectra illustrating this have been published earlier (Beghello 1994). Although no attempt was made to find flocs with a diameter greater than 10 mm, interesting information concerning flocs up to 16 mm in size was also obtained. In fact, the spectra contain much more interesting information, but in this thesis the analysis is limited to the characteristic floc size FSchar determined in the MD. At higher consistencies than about 1.5 weight %, the opacity of the suspension is so high that the background is not longer seen. In practice, paper is made from a suspension having a concentration below 1%. The range of the procedures chosen for this method can be considered to be representative of the conditions prevailing in normal papermaking operations.

The tendency of fibers to build flocs 26
4. Floc size is dependent on fiber consistency (Paper II) The uniformity of paper, or its formation, is a significant quality which depends to a large extent on the state of flocculation of the fiber suspension in the forming zone. In this context, fiber consistency primarily, and fiber length secondly, have long been considered to exert a major influence on the formation of paper. Many explanations of these phenomena present in the flocculation process have been put forward: Woollwage (1939), Erspamer (1940), Robertson and Mason (1957), Mason (1950), already half a century ago, Forgacs et al. (1958), Wahren (1964) two or three decades ago, Jokinen and Ebeling (1985), Steen (1991), Kerekes (1983, 1992, 1995), and Swerin and Ödberg (1996) in more recent years. The investigations reported in this collection of papers have focused on different effects that the fiber properties exert on flocculation. By using fiber fractions as narrow and pure as possible, it is possible to follow the development of collateral effects by maintaining constant at least one or more properties of the examined fiber. Since the consistency is a main parameter in the flocculation process, any comparison has to be made at constant consistency. 4.1 Preparation of the fiber furnish Approximately 150 kg of commercial bleached sulfate softwood pulp (MoDo kraft) was disintegrated and further beaten to three different beating degrees, 24.5, 32.0 and 43.5
SR, in a 24'' DD Beloit at STFI in Stockholm (Sweden), at 750 revolutions/min. The three different pulp samples were fractionated separately by a pilot fractionating device (of almost industrial scale), the SPRAYDISC filter (SD-filter) at the research laboratory of Celleco-Hedemora AB, in Stockholm (Sweden). The aim of this operation was to obtain three different fiber fractions in three length intervals with narrow fiber length distributions. In the SD-filter, an optimal flow split between coarse and fine fractions and the desired fractionating effect are achieved with a suitable choice of parameters such as spray nozzle pressure, disc speed, cloth mesh and filter configuration (See Appendix I).
The tendency of fibers to build flocs 27
4.2 Fiber characterization Samples of the fiber fractions obtained were analyzed with a Kajaani FS-200 in order to characterize the fiber length distributions (see Figure 4 of Paper II) and coarseness of the three different fractions. The fiber length and coarseness measurement results are shown in Table 4.1. Table 4.1 Average fiber lengths and coarsenesses for three fiber fractions beaten to three different SR, and measured by a Kajaani FS-200. .
24.5 SR 32.0 SR 43.5 SR Fiber fraction Fiber length
(mm) Coarseness
(mg/m) Fiber length
(mm) Coarseness
(mg/m) Fiber length
(mm) Coarseness
(mg/m) Fine fraction, FF 0.40 0.185 0.45 0.187 0.34 0.182
Middle fraction, MF 1.33 0.192 1.35 0.196 1.31 0.193 Long fraction, LF 2.64 0.218 2.55 0.215 2.34 0.212
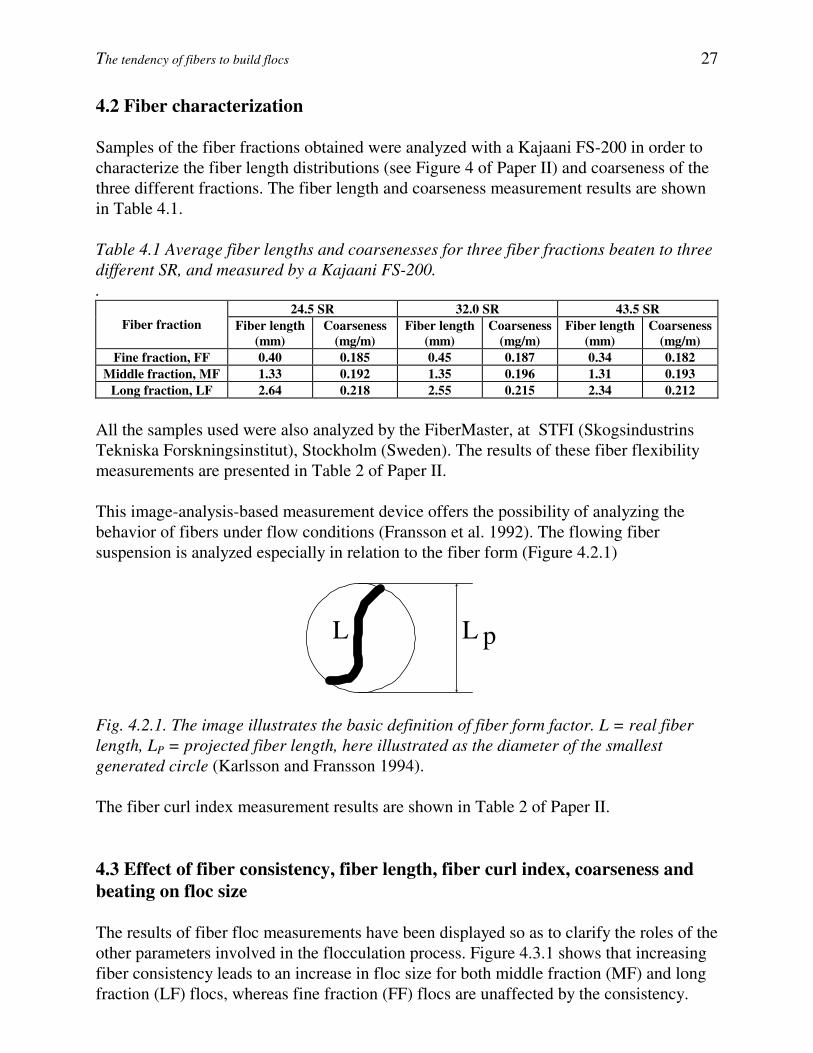
All the samples used were also analyzed by the FiberMaster, at STFI (Skogsindustrins Tekniska Forskningsinstitut), Stockholm (Sweden). The results of these fiber flexibility measurements are presented in Table 2 of Paper II. This image-analysis-based measurement device offers the possibility of analyzing the behavior of fibers under flow conditions (Fransson et al. 1992). The flowing fiber suspension is analyzed especially in relation to the fiber form (Figure 4.2.1)
L L p
Fig. 4.2.1. The image illustrates the basic definition of fiber form factor. L = real fiber length, LP = projected fiber length, here illustrated as the diameter of the smallest generated circle (Karlsson and Fransson 1994). The fiber curl index measurement results are shown in Table 2 of Paper II. 4.3 Effect of fiber consistency, fiber length, fiber curl index, coarseness and beating on floc size The results of fiber floc measurements have been displayed so as to clarify the roles of the other parameters involved in the flocculation process. Figure 4.3.1 shows that increasing fiber consistency leads to an increase in floc size for both middle fraction (MF) and long fraction (LF) flocs, whereas fine fraction (FF) flocs are unaffected by the consistency.
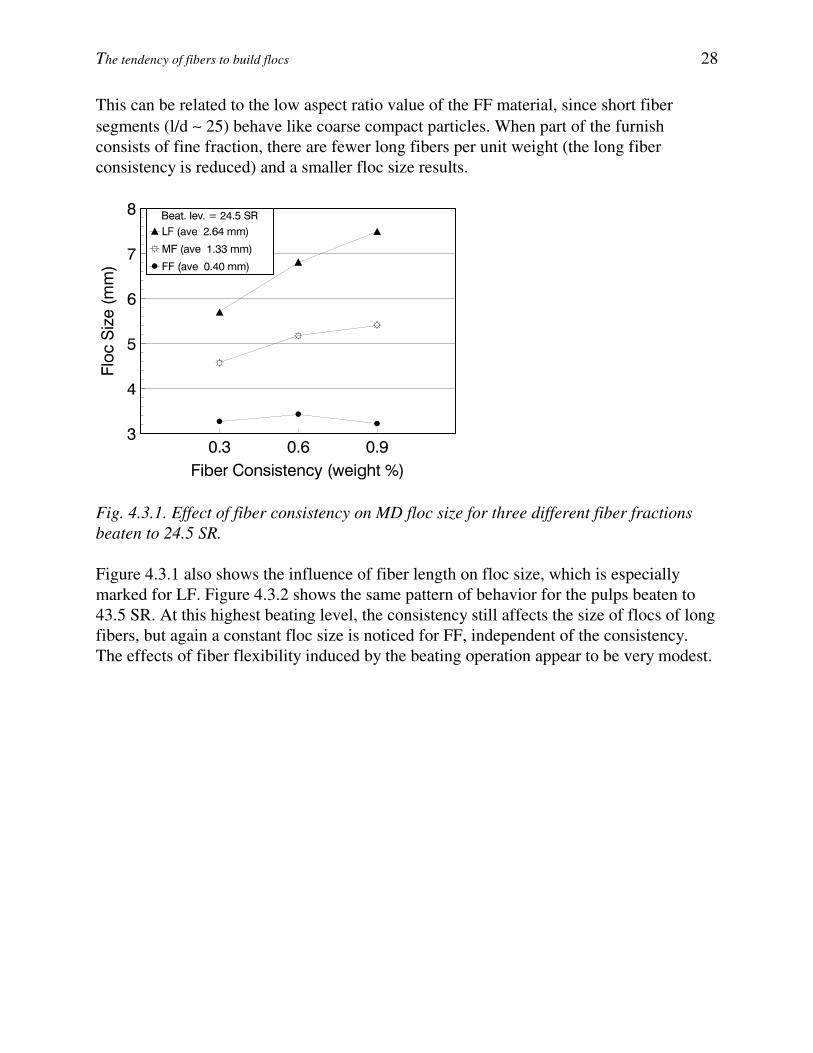
The tendency of fibers to build flocs 28
This can be related to the low aspect ratio value of the FF material, since short fiber segments (l/d ∼ 25) behave like coarse compact particles. When part of the furnish consists of fine fraction, there are fewer long fibers per unit weight (the long fiber consistency is reduced) and a smaller floc size results.
Fig. 4.3.1. Effect of fiber consistency on MD floc size for three different fiber fractions beaten to 24.5 SR. Figure 4.3.1 also shows the influence of fiber length on floc size, which is especially marked for LF. Figure 4.3.2 shows the same pattern of behavior for the pulps beaten to 43.5 SR. At this highest beating level, the consistency still affects the size of flocs of long fibers, but again a constant floc size is noticed for FF, independent of the consistency. The effects of fiber flexibility induced by the beating operation appear to be very modest.
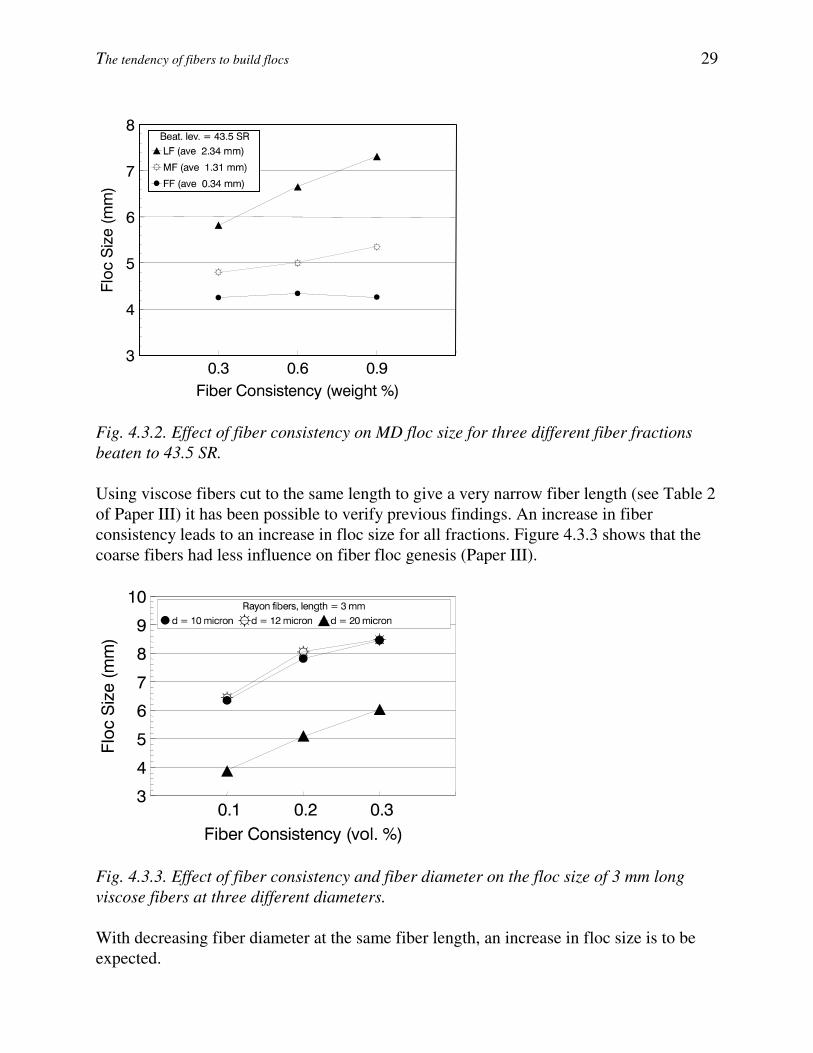
The tendency of fibers to build flocs 29
Fig. 4.3.2. Effect of fiber consistency on MD floc size for three different fiber fractions beaten to 43.5 SR. Using viscose fibers cut to the same length to give a very narrow fiber length (see Table 2 of Paper III) it has been possible to verify previous findings. An increase in fiber consistency leads to an increase in floc size for all fractions. Figure 4.3.3 shows that the coarse fibers had less influence on fiber floc genesis (Paper III).
Fig. 4.3.3. Effect of fiber consistency and fiber diameter on the floc size of 3 mm long viscose fibers at three different diameters. With decreasing fiber diameter at the same fiber length, an increase in floc size is to be expected.
The tendency of fibers to build flocs 30
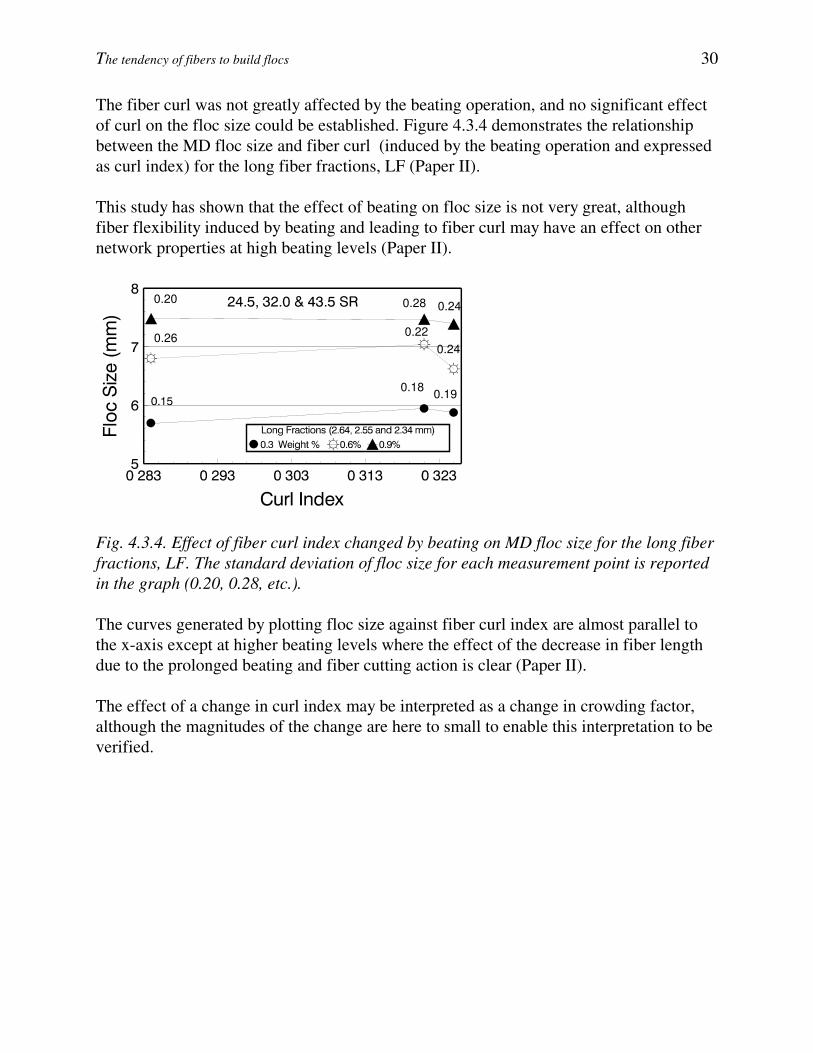
The fiber curl was not greatly affected by the beating operation, and no significant effect of curl on the floc size could be established. Figure 4.3.4 demonstrates the relationship between the MD floc size and fiber curl (induced by the beating operation and expressed as curl index) for the long fiber fractions, LF (Paper II). This study has shown that the effect of beating on floc size is not very great, although fiber flexibility induced by beating and leading to fiber curl may have an effect on other network properties at high beating levels (Paper II).
0.26
0.20
0.18
0.22
0.28
0.19
0.24
0.24
Fig. 4.3.4. Effect of fiber curl index changed by beating on MD floc size for the long fiber fractions, LF. The standard deviation of floc size for each measurement point is reported in the graph (0.20, 0.28, etc.). The curves generated by plotting floc size against fiber curl index are almost parallel to the x-axis except at higher beating levels where the effect of the decrease in fiber length due to the prolonged beating and fiber cutting action is clear (Paper II). The effect of a change in curl index may be interpreted as a change in crowding factor, although the magnitudes of the change are here to small to enable this interpretation to be verified.
The tendency of fibers to build flocs 31
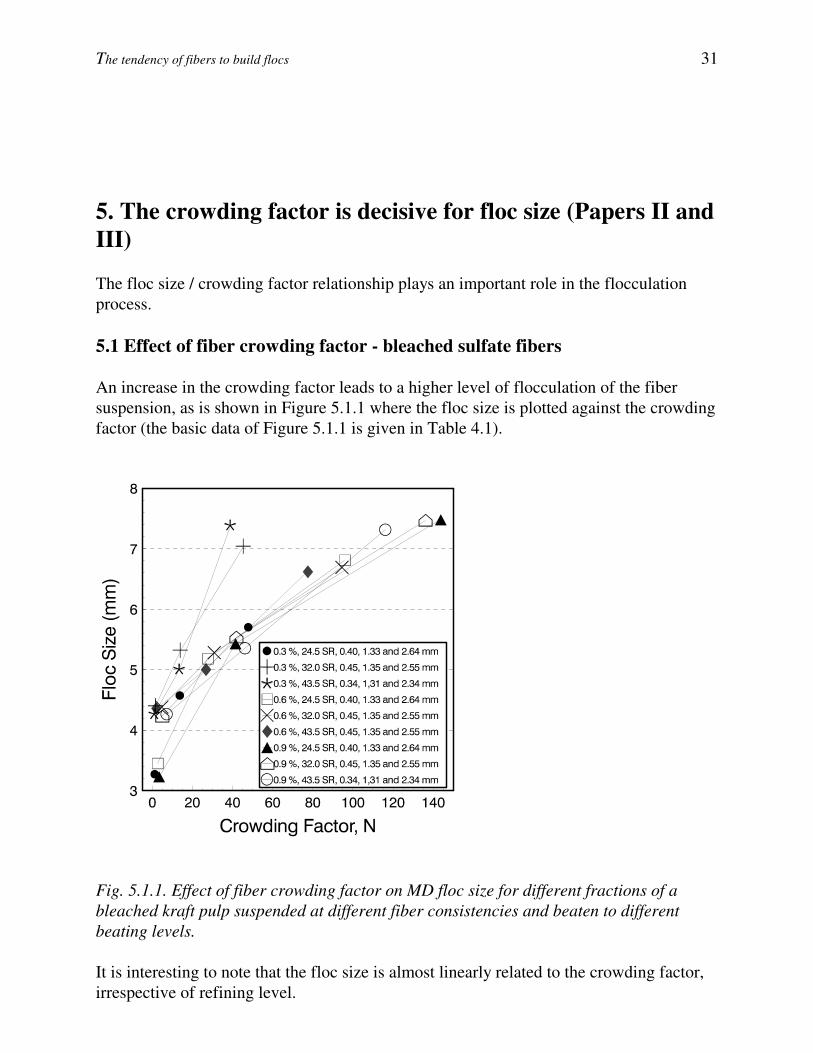
5. The crowding factor is decisive for floc size (Papers II and III) The floc size / crowding factor relationship plays an important role in the flocculation process. 5.1 Effect of fiber crowding factor - bleached sulfate fibers An increase in the crowding factor leads to a higher level of flocculation of the fiber suspension, as is shown in Figure 5.1.1 where the floc size is plotted against the crowding factor (the basic data of Figure 5.1.1 is given in Table 4.1).
Fig. 5.1.1. Effect of fiber crowding factor on MD floc size for different fractions of a bleached kraft pulp suspended at different fiber consistencies and beaten to different beating levels. It is interesting to note that the floc size is almost linearly related to the crowding factor, irrespective of refining level.
The tendency of fibers to build flocs 32
5.2 Effect of fiber crowding factor - viscose fibers As an extension of the work with papermaking fibers, a model system with viscose fibers was chosen in order to define and follow the development of flocs on the base of selected geometrical aspects of these fibers. Here it has been possible to separate the effects of fiber dimensions (length and width) from other environmental effects by using model fibers with very narrow length and width distributions. 5.2.1 Raw material The raw material was delivered by the manufacturer, Kemira Fibers Oy, Valkeakoski, Finland, as hanks of longitudinally arranged fibers. The fibers had an ellipsoidal cross-section. The ellipsoidal shape of the cross-section of about 100 viscose fibers of each group was examined and characterized by SEM (Scanning Electronic Microscope). The diameters of the fibers were determined by an image analysis technique, where the diameter was defined as the average of the lengths of the major axes of the ellipse circumscribing the cross-section. The geometric means were calculated with regard to the area of the ellipse, given by A = ππππ a b where a and b are the major and minor half axes respectively. The diameter of the circle having the same area is given by A = ππππ d2/4 so that d = 2 ab . The characteristic data of the fiber material are reported in Table 5.1. The investigated viscose fibers were of three different nominal sizes, 1.1, 1.7 and 4.2 dtex. Table 5.1. Average fiber widths (diameters) for viscose fibers.
Viscose Fiber (dtex) Diameter d Average (µµµµm)
Standard Deviation (µµµµm)
1.1 10.0 ±±±± 0.08 1.7 12.3 ±±±± 0.13 4.2 20.4 ±±±± 0. 17
5.2.2 Preparation and characterization of viscose fibers The hanks were washed for 30 min in warm water at 40 oC with regular textile detergent (powder) in order to remove any manufacturing fats and other residual materials. The washing was followed by a long rinse, 1 h with fresh running water and finally 15 min with deionized water, pH 7.0 ± 05. The three hanks of viscose fibers were cut while they were still wet using an industrial paper sheet cutting device into three different lengths: 2, 3 and 4 mm. The fiber length was investigated by an optical microscope since the analysis approach using the Kajaani FS-200 was not successful. The capillary channel of the Kajaani, where the fiber length measurements are carried out, became blocked during each measurement attempt. This was caused by the physical characteristic of the coarse and long viscose
The tendency of fibers to build flocs 33
fibers and by the geometrical aspect of the capillary channel of the measuring device as well. The microscopy investigation led to the results in Table 5.2. Table 5.2. Average fiber lengths for viscose fibers.
Viscose Fiber nominal length
(mm)
Measured length Average
(mm)
Standard Deviation
(mm) 2.0 2.12 ±±±± 0.14 3.0 2.95 ±±±± 0.15 4.0 4.05 ±±±± 0. 09
5.2.3 Preparation of viscose fibers suspensions After these cutting and measurement operations, a series of three different fiber samples was obtained and these were further weighed and prepared according to standard procedures and suspended at three different consistencies, 0.1, 0.2 and 0.3 vol. %. The suspending water used was deionized on two-bed ion-exchange equipment. The pH of the suspension was not adjusted and was roughly 7.0 ± 0.5 and the temperature was 21 ± 2
oC. The preparation of the samples led to 27 new samples that constituted the basis of the investigation with the floc measuring device. 5.2.4 Dependence of floc size on crowding factor A decrease in fiber crowding factor leads to a higher level of dispersion of the fiber suspension, and thus reduces the mechanical and geometrical effects of the fibers, as shown in Figure 5.2.1. The coarse fibers, even when they are sufficiently long (3 mm) to generate large flocs, do not entangle much with other fibers when the fiber crowding factor is low (cf. Kerekes 1992). Figure 5.2.1 shows that using different fiber widths for a 3 mm long fiber, a significant divergence in floc size values was observed. This is due to fiber length effects and to the “slenderness” of the fibers involved. Above a value of 150, the fiber crowding factor does not affect floc size in the same manner. Figure 5.2.1 shows data for Rayon fibers suspended at 0.3 % (vol.). Almost the same trends are obtained suspending the same fibers at 0.1 and 0.2 % (vol.) fiber consistencies. If the channel height had been greater, the floc size could probably have increased to more than 10 mm.
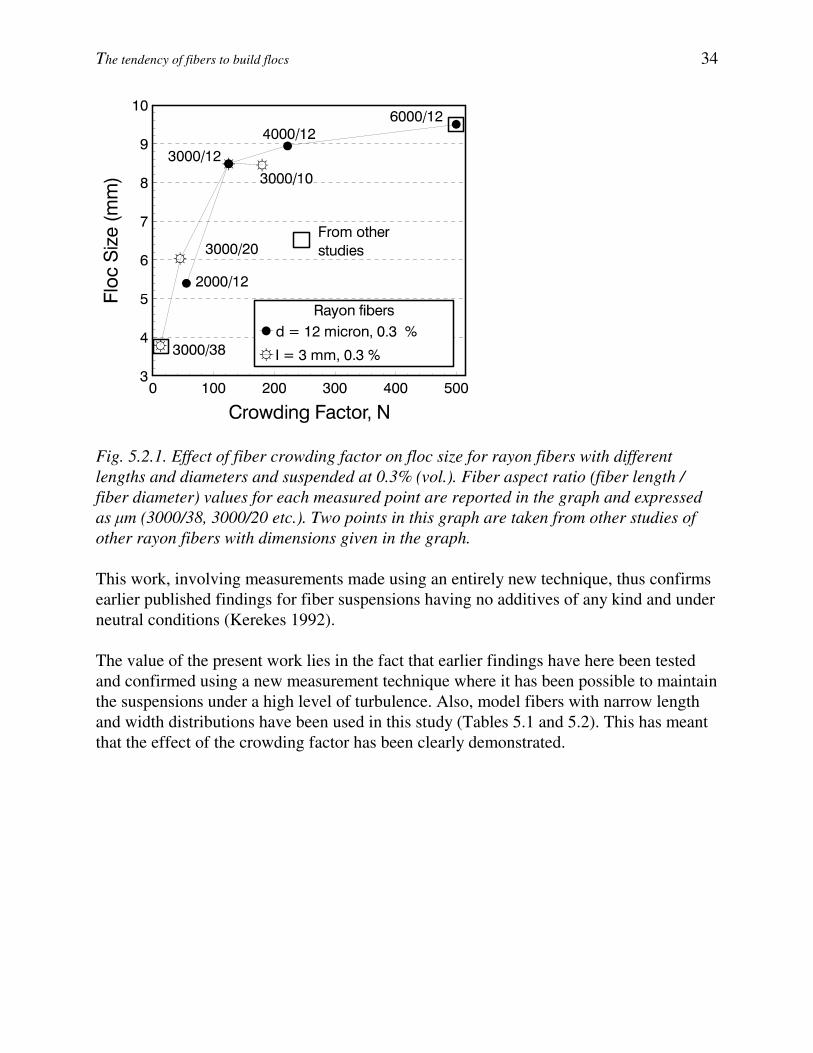
The tendency of fibers to build flocs 34
Fig. 5.2.1. Effect of fiber crowding factor on floc size for rayon fibers with different lengths and diameters and suspended at 0.3% (vol.). Fiber aspect ratio (fiber length / fiber diameter) values for each measured point are reported in the graph and expressed as �m (3000/38, 3000/20 etc.). Two points in this graph are taken from other studies of other rayon fibers with dimensions given in the graph. This work, involving measurements made using an entirely new technique, thus confirms earlier published findings for fiber suspensions having no additives of any kind and under neutral conditions (Kerekes 1992). The value of the present work lies in the fact that earlier findings have here been tested and confirmed using a new measurement technique where it has been possible to maintain the suspensions under a high level of turbulence. Also, model fibers with narrow length and width distributions have been used in this study (Tables 5.1 and 5.2). This has meant that the effect of the crowding factor has been clearly demonstrated.
The tendency of fibers to build flocs 35
6. The effects of the chemical environment on floc size (Papers III and V) As indicated in the introduction, it is obvious that it is not clear under which conditions the chemical environment is important for the state of flocculation or what the relative roles of chemical and mechanical effects are. The literature shows that retention and formation aids can exert a strong effect on the state of flocculation and/or the state of dispersion of cellulosic suspensions. Such studies are of no concern in this dissertation. It is, however, less clear to what extent pH and electrolytes affect the state of flocculation by influencing the swelling properties of fibers, i.e. an influence on fiber flexibility or by changes in the thickness of the electrostatic double layer. Different fibers contain different amounts of charged groups (i.e. Lindström 1991) and their topological distributions may also affect their behaviors although the topochemical location of charged groups in papermaking fibers is largely an unknown factor. Some fibers may be more affected than others by pH and the electrolyte concentration. The approach taken in this work was to choose two extreme fiber populations, bleached kraft pulp and viscose fibers, with a low surface charge density and carboxymethylated fibers with a high surface charge density in order to investigate the effect over a wide charge-density span. 6.1 The chemical environment has no effect on floc size for bleached kraft pulps and viscose fibers The aim of this study was to show the contribution of the chemical environment to the typical fiber flocculation process by analyzing the behavior of a model fiber made of viscose (rayon), i.e. a fiber with low surface charge density. This model fiber was chosen in order to simplify the physical and geometrical aspects in terms of fiber lengths and widths. These parameters, in concomitance with fiber consistency, are crucial in the fiber flocculation context, according to Kerekes (1995 b). An attempt has also been made to study the tendency of native cellulose fibers to build flocs considering the effects of the suspension pH and of the impact of the chemical environment through the addition of electrolytes. In this study, the same model fiber as in Chapter 5.2 has been used to investigate the development of flocs on the basis of selected geometrical parameters of the viscose fibers. 6.1.1 Raw material and preparation of viscose fiber suspensions The reader is invited to consult Chapter 5.2 for more information and details about the preparation and treatment of the viscose fibers.

The tendency of fibers to build flocs 36
6.1.2 pH adjustment and preparation of electrolytes The pH was adjusted downwards by addition of dilute HCl and upwards by addition of a saturated solution of NaOH to the examined suspensions. The floc measurements were carried out after equilibrium had been reached. The electrolytes used in this study were NaCl, CaCl2 and FeCl3. The electrolyte quantities added to the fiber suspensions were selected with regard to regular mill operations. The suspensions were allowed to flow through the pipe for a few minutes in order to ensure that equilibrium had been reached before the flocs were measured. The hydrolysis products of Fe3+ lead to a decrease in the pH of the suspending medium. Since no significant influence of the pH of the suspending medium on floc sizes has been observed, the pH of the suspensions, where FeCl3 was involved, was not measured. 6.1.3 The impact of the suspending pH and electrolyte content on floc size Figure 6.1.1 shows that for fibers having a length of 3 mm and a width of 12 µm and suspended at 0.3% (vol.) the pH had no effect on floc size. These fibers gave large flocs, and it is reasonable to suppose that these fibers are the most sensitive to pH, i.e. that the fibers giving smaller flocs will not create large flocs due to a reasonable change in pH. A minor decrease in the crowding factor gives, according Figure 5.2.1, a sensible decrease in floc size. Higher crowding factor as well gives larger flocs.
Fig. 6.1.1. Influence of pH variations on floc size for rayon fibers suspended at 0.3% (vol.). This study included the effects of the electrolytes NaCl, CaCl2 and FeCl3 on floc size. Figures 6.1.2 and 6.1.3 show the impact of the electrolytes on floc size for rayon fibers suspended at 0.3% (vol.). The electrolytes used do not appear to significantly influence the flocculation process.
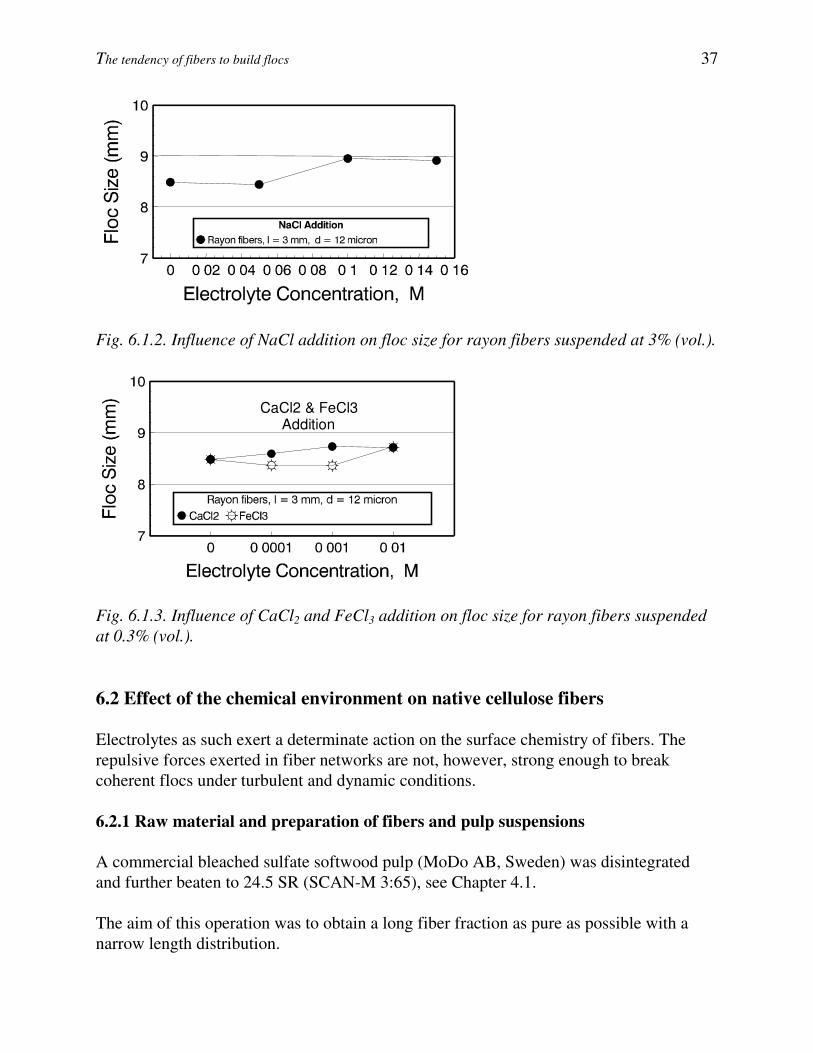
The tendency of fibers to build flocs 37
Fig. 6.1.2. Influence of NaCl addition on floc size for rayon fibers suspended at 3% (vol.).
CaCl2 & FeCl3 Addition
CaCl2 & FeCl3Addition
Fig. 6.1.3. Influence of CaCl2 and FeCl3 addition on floc size for rayon fibers suspended at 0.3% (vol.). 6.2 Effect of the chemical environment on native cellulose fibers Electrolytes as such exert a determinate action on the surface chemistry of fibers. The repulsive forces exerted in fiber networks are not, however, strong enough to break coherent flocs under turbulent and dynamic conditions. 6.2.1 Raw material and preparation of fibers and pulp suspensions A commercial bleached sulfate softwood pulp (MoDo AB, Sweden) was disintegrated and further beaten to 24.5 SR (SCAN-M 3:65), see Chapter 4.1. The aim of this operation was to obtain a long fiber fraction as pure as possible with a narrow length distribution.
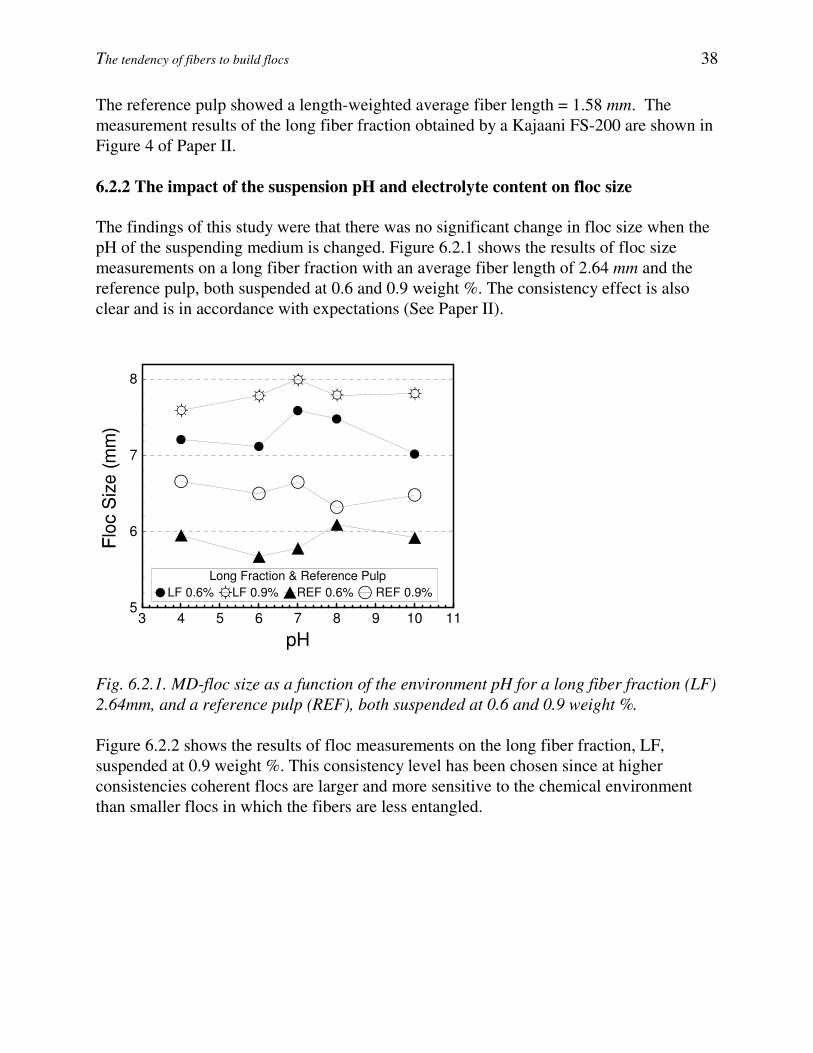
The tendency of fibers to build flocs 38
The reference pulp showed a length-weighted average fiber length = 1.58 mm. The measurement results of the long fiber fraction obtained by a Kajaani FS-200 are shown in Figure 4 of Paper II. 6.2.2 The impact of the suspension pH and electrolyte content on floc size The findings of this study were that there was no significant change in floc size when the pH of the suspending medium is changed. Figure 6.2.1 shows the results of floc size measurements on a long fiber fraction with an average fiber length of 2.64 mm and the reference pulp, both suspended at 0.6 and 0.9 weight %. The consistency effect is also clear and is in accordance with expectations (See Paper II).
3 4 5 6 7 8 9 10 11
pH
5
6
7
8
Long Fraction & Reference PulpLF 0.6% LF 0.9% REF 0.6% REF 0.9%
Fig. 6.2.1. MD-floc size as a function of the environment pH for a long fiber fraction (LF) 2.64mm, and a reference pulp (REF), both suspended at 0.6 and 0.9 weight %. Figure 6.2.2 shows the results of floc measurements on the long fiber fraction, LF, suspended at 0.9 weight %. This consistency level has been chosen since at higher consistencies coherent flocs are larger and more sensitive to the chemical environment than smaller flocs in which the fibers are less entangled.
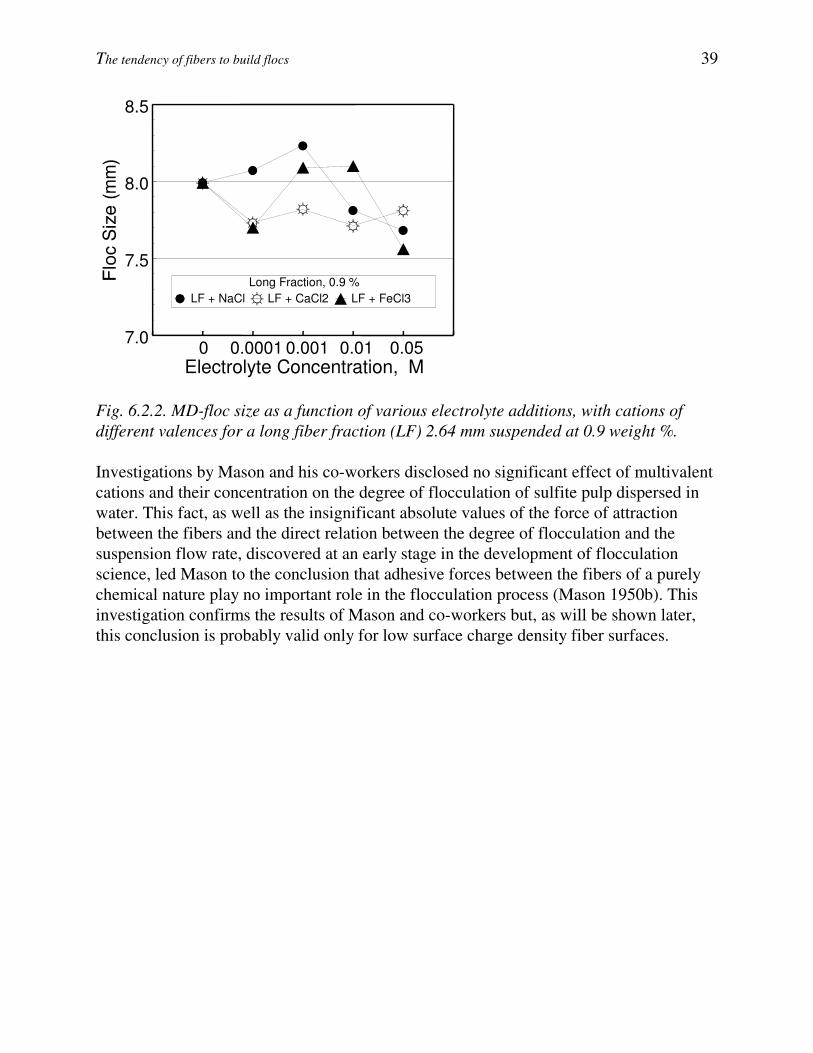
The tendency of fibers to build flocs 39
0 0.0001 0.001 0.01 0.05Electrolyte Concentration, M
7.0
7.5
8.0
8.5
Long Fraction, 0.9 % LF + NaCl LF + CaCl2 LF + FeCl3
Fig. 6.2.2. MD-floc size as a function of various electrolyte additions, with cations of different valences for a long fiber fraction (LF) 2.64 mm suspended at 0.9 weight %. Investigations by Mason and his co-workers disclosed no significant effect of multivalent cations and their concentration on the degree of flocculation of sulfite pulp dispersed in water. This fact, as well as the insignificant absolute values of the force of attraction between the fibers and the direct relation between the degree of flocculation and the suspension flow rate, discovered at an early stage in the development of flocculation science, led Mason to the conclusion that adhesive forces between the fibers of a purely chemical nature play no important role in the flocculation process (Mason 1950b). This investigation confirms the results of Mason and co-workers but, as will be shown later, this conclusion is probably valid only for low surface charge density fiber surfaces.
The tendency of fibers to build flocs 40
7. The carboxymethylation of pulp fibers influences floc size (Paper IV) In the previous chapter the effect of chemical environment on the state of flocculation of low charge density fibers was investigated. During the course of this study it was indeed found that the charge density, here changed by means of carboxymethylation of the fibers changed the state of dispersion. This study therefore focuses on the effect of carboxymethylation on the state of dispersion with the softwood fibers in deionized water in their Na-form, i.e. under a specified set of chemical conditions. The rheology of the fiber network was studied using a jar with a rotor equipped with a force gauge so that the yield stress of the fiber network could be determined. These results are interpreted in terms of a lower fiber-fiber friction due to the creation of gelatinous surface layers when the solubility of the surface molecules at the fiber-water interface is increased through the introduction of charged carboxymethyl groups. 7.1 Effect of the carboxymethylation on fiber suspensions Several types of additives are known to affect fiber dispersion: additives increasing the dispersion medium viscosity, formation aids, class I, believed to decrease the coefficient of friction between fibers and formation aids, class II, polymers affecting the rheological properties of the suspending medium. The extent of fiber dispersion is generally believed to be related to surface friction and to the rheological properties of the suspending media. Nelson and Kalkipsakis (1964) noticed that the extent of agglomeration of carboxy-methylated fibers was affected by their chemistry (ionic form of the carboxyl groups), and this was the impetus for the present study of the effect of carboxymethylation on the state of dispersion of fibers. In this study, a commercial softwood kraft pulp was chosen as a suitable material on which to change the surface chemistry of the fibers by the introduction of fresh carboxymethyl groups.
The tendency of fibers to build flocs 41
7.1.1 Outline and experimental design The flocculation studies were here extended with rheological studies of the fiber suspensions. The measuring device used was a standard rheometer, a Physica MC1, with a modified measuring system, Bennington (1990). The rotor body was designed as a Rushton type turbine and the cylinder was modified to a baffled jar. The basic theory of the yield stress measurement is a simple momentum balance determining force needed to break the network. By rotating the rotor in the fiber network, the fibers become aligned and the network is restrained and eventually breaks. Some translation/movement of the fiber flocs is made to achieve a stable and steady network. The measuring device is described in detail by Wikström and Rasmusson (1997). 7.1.2 Materials and preparation of the suspensions A commercial bleached sulfate softwood kraft pulp was used in the carboxymethylation experiments. A laboratory-scale reactor was utilized for carboxymethylation operations (Metsä Serla, 1989). Before use, the pulps were disintegrated in deionized water. The pH of the suspension was not adjusted and was roughly 7.0 ± 0.5 and the temperature was 20 ± 2 oC. All measurements were conducted with the carboxyl groups of the fibers in their Na-form. The degree of substitution of the different pulps was determined according to a Metsä-Serla procedure (1989). The four different pulps were characterized with respect to fiber length. A Kajaani FS-200 was used for fiber length measurements. The results obtained are given in Table 7.1. Table 7.1. Average weighted fiber length values and coarseness measured by a Kajaani FS-200.
Degree of substitution
Average weighted fiber length (mm)
Coarseness (mg/m)
Untreated pulp 1.58 0.228 DS 0.02 1.51 0.225 DS 0.03 1.55 0.229 DS 0.06 1.53 0.231 DS 0.08 1.53 0.232
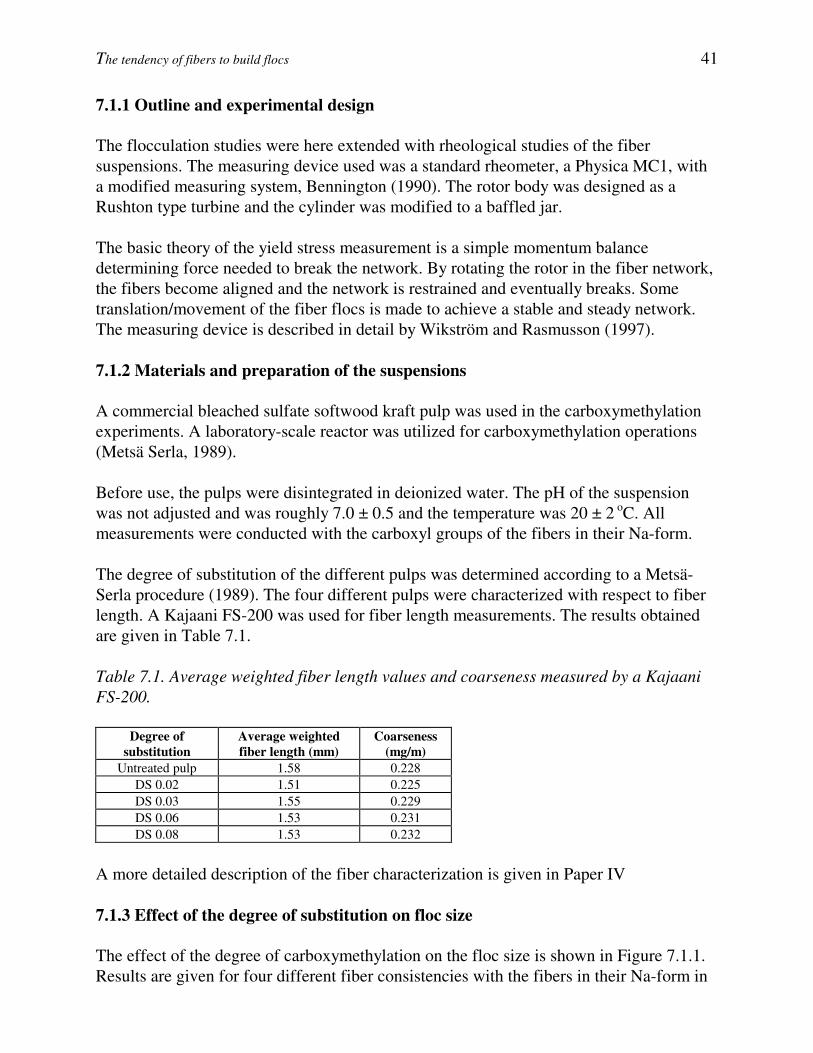
A more detailed description of the fiber characterization is given in Paper IV 7.1.3 Effect of the degree of substitution on floc size The effect of the degree of carboxymethylation on the floc size is shown in Figure 7.1.1. Results are given for four different fiber consistencies with the fibers in their Na-form in
The tendency of fibers to build flocs 42
deionized water. From this figure it can be concluded that increasing the degree of carboxymethylation (provided the fibers are in their Na-form) leads to a decrease in the size of the flocs.
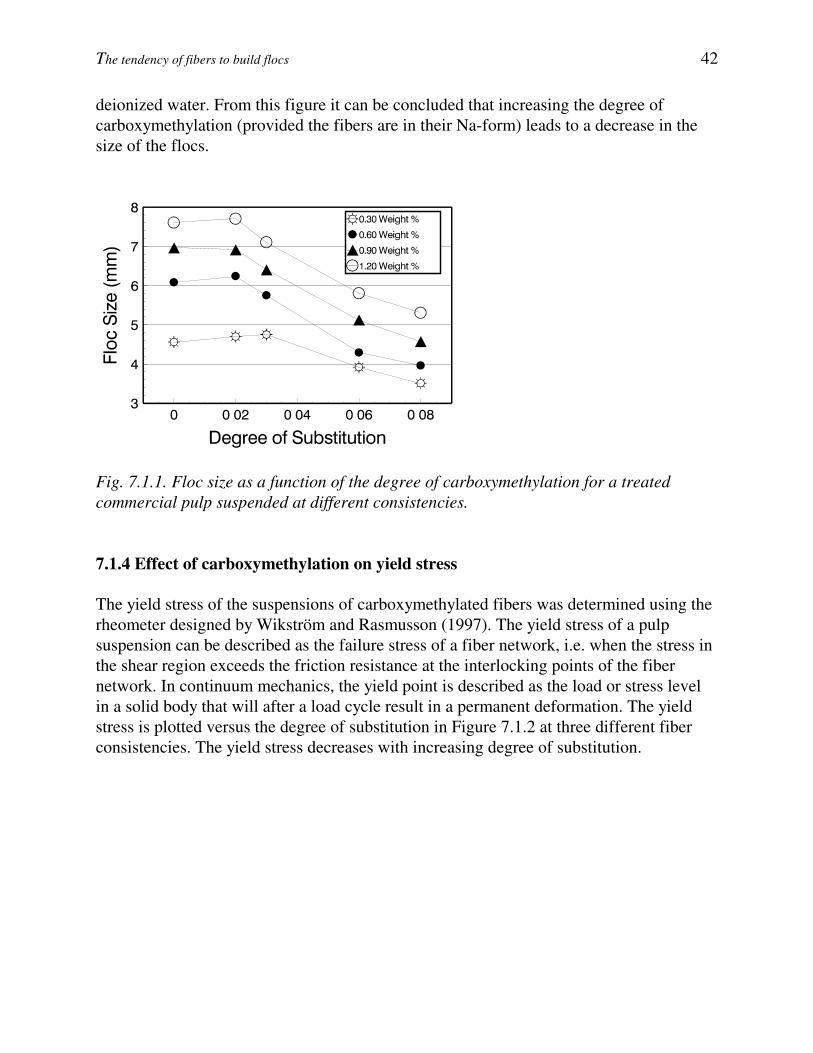
Fig. 7.1.1. Floc size as a function of the degree of carboxymethylation for a treated commercial pulp suspended at different consistencies. 7.1.4 Effect of carboxymethylation on yield stress The yield stress of the suspensions of carboxymethylated fibers was determined using the rheometer designed by Wikström and Rasmusson (1997). The yield stress of a pulp suspension can be described as the failure stress of a fiber network, i.e. when the stress in the shear region exceeds the friction resistance at the interlocking points of the fiber network. In continuum mechanics, the yield point is described as the load or stress level in a solid body that will after a load cycle result in a permanent deformation. The yield stress is plotted versus the degree of substitution in Figure 7.1.2 at three different fiber consistencies. The yield stress decreases with increasing degree of substitution.
The tendency of fibers to build flocs 43
Fig. 7.1.2. Yield stress as a function of the degree of substitution for a commercial pulp suspended at three different fiber consistencies, 0.6, 0.9 and 1.2 weight %.
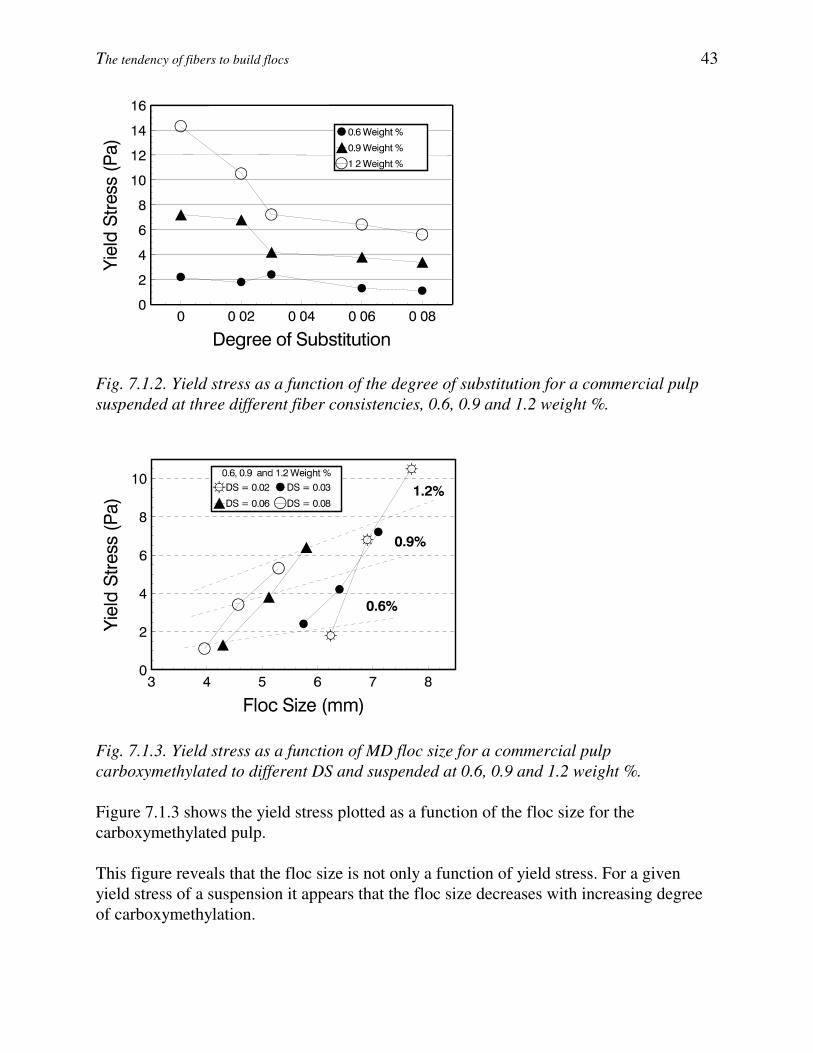
Fig. 7.1.3. Yield stress as a function of MD floc size for a commercial pulp carboxymethylated to different DS and suspended at 0.6, 0.9 and 1.2 weight %. Figure 7.1.3 shows the yield stress plotted as a function of the floc size for the carboxymethylated pulp. This figure reveals that the floc size is not only a function of yield stress. For a given yield stress of a suspension it appears that the floc size decreases with increasing degree of carboxymethylation.
The tendency of fibers to build flocs 44
7.1.5 Effect of carboxymethylation on fiber flexibility Carboxymethylated fibers in their Na-form are more swollen than the starting fiber material, as shown in Table 7.2. The degree of swelling, here expressed as WRV (SCAN-C 102XS), increases with increasing degree of carboxymethylation. It may be anticipated that more swollen fibers would exhibit a higher fiber flexibility because the Young’s modulus of the cell wall is expected to decrease. On the other hand, a swollen fiber wall has a larger moment of inertia which reduces the flexibility. Table 7.2. Water Retention Values (WRV) obtained for carboxymethylated pulps (Na-form) with different DS. (SCAN-C 102XS).
Degree of substitution mv WRV % Untreated pulp 76
DS 0.02 81 DS 0.03 94 DS 0.06 103 DS 0.08 112
The effect of carboxymethylation on fiber flexibility was therefore investigated using the STFI Fiber Master unit. This apparatus measures the form factor of fibers in rest and under shear, the relative difference being expressed as fiber flexibility. The results of these measurements are given in Table 7.3. These experiments reveal no significant effect of carboxymethylation on fiber flexibility, at least not when using this particular flexibility tester. Table 7.3. The effect of carboxymethylation on fiber form factor and flexibility (STFI Fiber Master unit).
Degree of Substitution
Form factor, % (0.5-1.0 mm)
Flexibility, % (0.5-1.0 mm)
Form factor, % (1.5-3.0 mm)
Flexibility, % (1.5-3.0 mm)
Untreated pulp 93.3 0.61 88.7 3.60 DS 0.02 90.1 1.55 86.7 5.67 DS 0.03 92.8 0.79 89.1 4.69 DS 0.06 91.9 1.41 87.9 5.54 DS 0.08 91.5 1.38 88.3 4.87
7.2 Discussion of and conclusions from this experiment This work has shown that the yield stress of pulp suspensions and the floc size in a flowing suspension of fibers decrease with increasing degree of carboxymethylation (Na-form). Formation aids like gums and mucilages are believed to decrease the coefficient of friction between fibers. A similar mechanism may be envisaged in these experiments.

The tendency of fibers to build flocs 45
Yield stress phenomena may be reduced to a tensile stress problem, and fiber interlocking mechanisms have been investigated by various authors (Meyer and Wahren 1964, Bennington et al. 1990, Wahren 1980). Employing classical beam theory, the yield stress may be expressed as: τy = k⋅µ⋅E⋅A 2⋅Cv
3 [7.2.1] where τy is the yield stress, µ the coefficient of friction, E the Young’s modulus of the fiber cell wall, A the fiber aspect ratio (L/d), Cv the fiber volumetric concentration, and k a constant. It is obvious that a decrease in the coefficient of friction will lead to a decrease in the yield stress of a fiber network. The introduction of charged groups into the cell wall, carboxyl groups in their Na-form will cause swelling of the cell wall (Lindström 1986) (Table 7.2). This would lead to a decrease in the Young’s modulus of the cell wall. Because of the swelling restrictions imposed by the primary cell wall, the swelling tends to occur inwards towards the lumen (Lindström and Carlsson 1981). Damage to the primary wall will lead to outer cell wall swelling, which is expected to increase the yield stress of a suspension. Since the fiber flexibility was not significantly affected by carboxymethylation, the Young’s modulus does not seem to be affected (the equation assumes a solid rod without lumen). In reality, the higher moment of inertia due to inward swelling apparently compensates for a moderate decrease in the modulus. Thus, assuming the qualitative validity of Eq. 7.2.1, the decrease in yield stress is here attributed to a decrease in the friction force between fibers. Considering the effect of carboxymethylation on floc size, it is clear that the effect cannot be reduced directly to a fiber network strength problem because the hydrodynamic flow conditions must also be taken into consideration. Secondly, it must be emphasized that, in the yield stress measurements, the shear stress region will be in the region where the network is weakest, i.e. between the fiber flocs (inter-network scale), whereas in a flowing pulp suspension, floc rupture reflects the strength of the floc itself, i.e. on the intra-network scale. Figure 7.1.3 indicates that it is not only the network strength as determined by the yield strength measurements which determines the floc size. This graph should, however, be interpreted with some caution considering the aforementioned difference between intra-network and inter-network strength and the influence of other factors affecting floc size, e.g. the effect of surface friction forces on the propensity of fibers to flocculate. In spite of these and other difficulties, it is conceived that the decrease in floc size is primarily related to the decrease in yield stress of the flocs in the flowing pulp suspension. The decrease in yield stress is again attributed to a decrease in the fiber-fiber friction.
The tendency of fibers to build flocs 46
A carboxymethylated fiber is expected to have a layer of partly soluble carboxymethyl-cellulose chains protruding out in the solution from the fiber surface. It is therefore anticipated that, when two fibers collide, the electrostatic and steric repulsion between such chains leads to a lower coefficient of friction. Macroscopically, this is reflected in the slimy feeling of such suspensions when they are kneaded by hand.
The tendency of fibers to build flocs 47
8. The viscosity of the suspension influences floc size (Paper V) The tendency of native cellulosic fibers in fiber suspensions to build flocs has been investigated considering the effect of the liquid viscosity, influenced by the addition of CMC, (carboxymethylcellulose) and, in a second investigation, by the addition of saccharose (crystalline sugar). The influence of the suspension temperature on the flocculation process was also studied in order to clarify how the temperature/viscosity relationship influences fiber-based systems with regard to real papermaking conditions. These studies were conducted prior to the addition of typical wet-end chemicals. Recent work by Soszynski and Kerekes (1988), and by Zhao and Kerekes (1993) shows that an increase in the suspending liquid viscosity leads to an improvement in fiber suspension uniformity, i.e., levels close to perfect uniformity are reached at consistencies where water alone would yield gross flocculation. 8.1 The impact of the liquid viscosity on floc size The objective was to determine the extent to which an increase in the viscosity of the suspending medium improves the uniformity of the suspension and decreases the characteristic floc size. 8.1.1 Choice of materials for increasing the viscosity Suitable materials for increasing the viscosity of fiber suspensions with regard to typical papermaking operations are often represented by the typical wet-end chemicals used as retention aids or, with a wider spectrum of employment, as wet/dry strength agents. Starch, CMC (carboxymethylcellulose), and many other wet-end chemicals find a specific role in the papermaking process. The aim of this experiment was to find a good representative material able to impart viscosity to the suspension without causing any other collateral effect, such as bridging or deposits on the fiber surface. A low-substituted CMC (a sodium salt of carboxymethylcellulose) with a low molecular weight (about 12000), FinnFix-10, delivered by Metsä-Serla, Äänekoski, Finland, was therefore used. The most important and useful property of the CMC used was its ability to increase the viscosity of the suspending medium without generating any bridging between suspended fibers (Metsä-Serla 1989). This was possible because the CMC had a low degree of substitution. This grade is often used for coating color preparation since FinnFix-10 is a
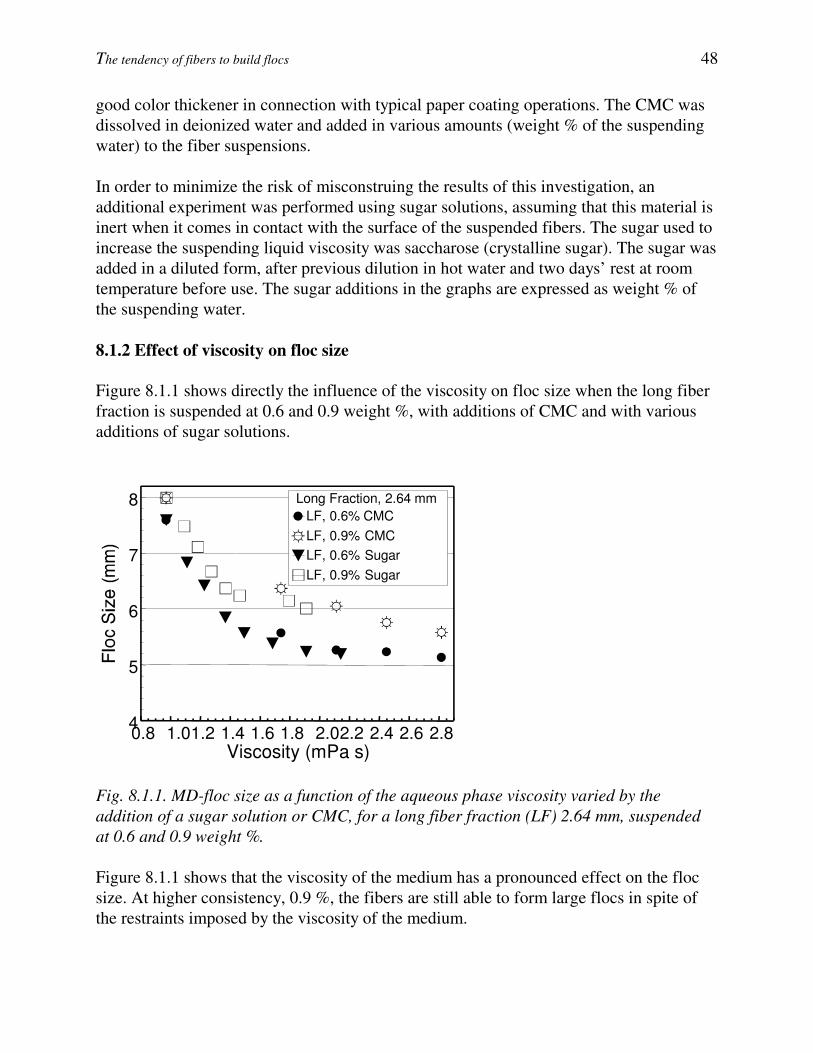
The tendency of fibers to build flocs 48
good color thickener in connection with typical paper coating operations. The CMC was dissolved in deionized water and added in various amounts (weight % of the suspending water) to the fiber suspensions. In order to minimize the risk of misconstruing the results of this investigation, an additional experiment was performed using sugar solutions, assuming that this material is inert when it comes in contact with the surface of the suspended fibers. The sugar used to increase the suspending liquid viscosity was saccharose (crystalline sugar). The sugar was added in a diluted form, after previous dilution in hot water and two days’ rest at room temperature before use. The sugar additions in the graphs are expressed as weight % of the suspending water. 8.1.2 Effect of viscosity on floc size Figure 8.1.1 shows directly the influence of the viscosity on floc size when the long fiber fraction is suspended at 0.6 and 0.9 weight %, with additions of CMC and with various additions of sugar solutions.
0.8 1.01.2 1.4 1.6 1.8 2.02.2 2.4 2.6 2.8Viscosity (mPa s)
4
5
6
7
8 Long Fraction, 2.64 mmLF, 0.6% CMCLF, 0.9% CMCLF, 0.6% SugarLF, 0.9% Sugar
Fig. 8.1.1. MD-floc size as a function of the aqueous phase viscosity varied by the addition of a sugar solution or CMC, for a long fiber fraction (LF) 2.64 mm, suspended at 0.6 and 0.9 weight %. Figure 8.1.1 shows that the viscosity of the medium has a pronounced effect on the floc size. At higher consistency, 0.9 %, the fibers are still able to form large flocs in spite of the restraints imposed by the viscosity of the medium.
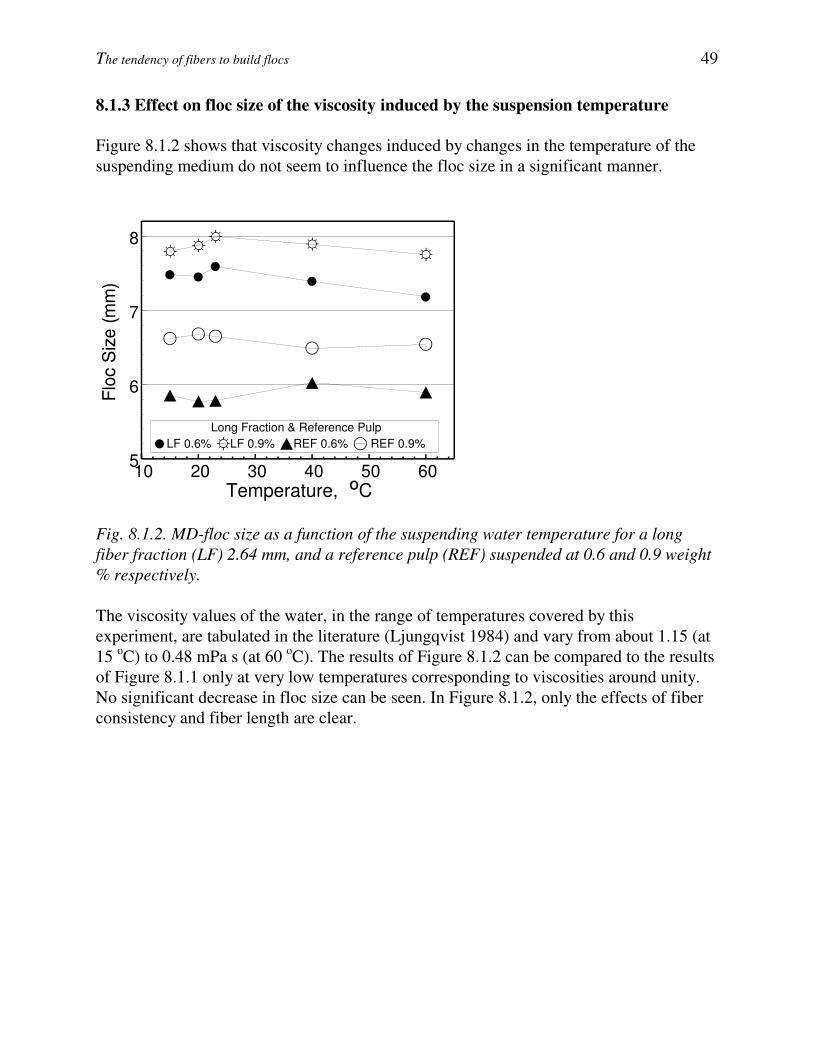
The tendency of fibers to build flocs 49
8.1.3 Effect on floc size of the viscosity induced by the suspension temperature Figure 8.1.2 shows that viscosity changes induced by changes in the temperature of the suspending medium do not seem to influence the floc size in a significant manner.
10 20 30 40 50 60Temperature, C
5
6
7
8
Long Fraction & Reference PulpLF 0.6% LF 0.9% REF 0.6% REF 0.9%
O
Fig. 8.1.2. MD-floc size as a function of the suspending water temperature for a long fiber fraction (LF) 2.64 mm, and a reference pulp (REF) suspended at 0.6 and 0.9 weight % respectively. The viscosity values of the water, in the range of temperatures covered by this experiment, are tabulated in the literature (Ljungqvist 1984) and vary from about 1.15 (at 15 oC) to 0.48 mPa s (at 60 oC). The results of Figure 8.1.2 can be compared to the results of Figure 8.1.1 only at very low temperatures corresponding to viscosities around unity. No significant decrease in floc size can be seen. In Figure 8.1.2, only the effects of fiber consistency and fiber length are clear.
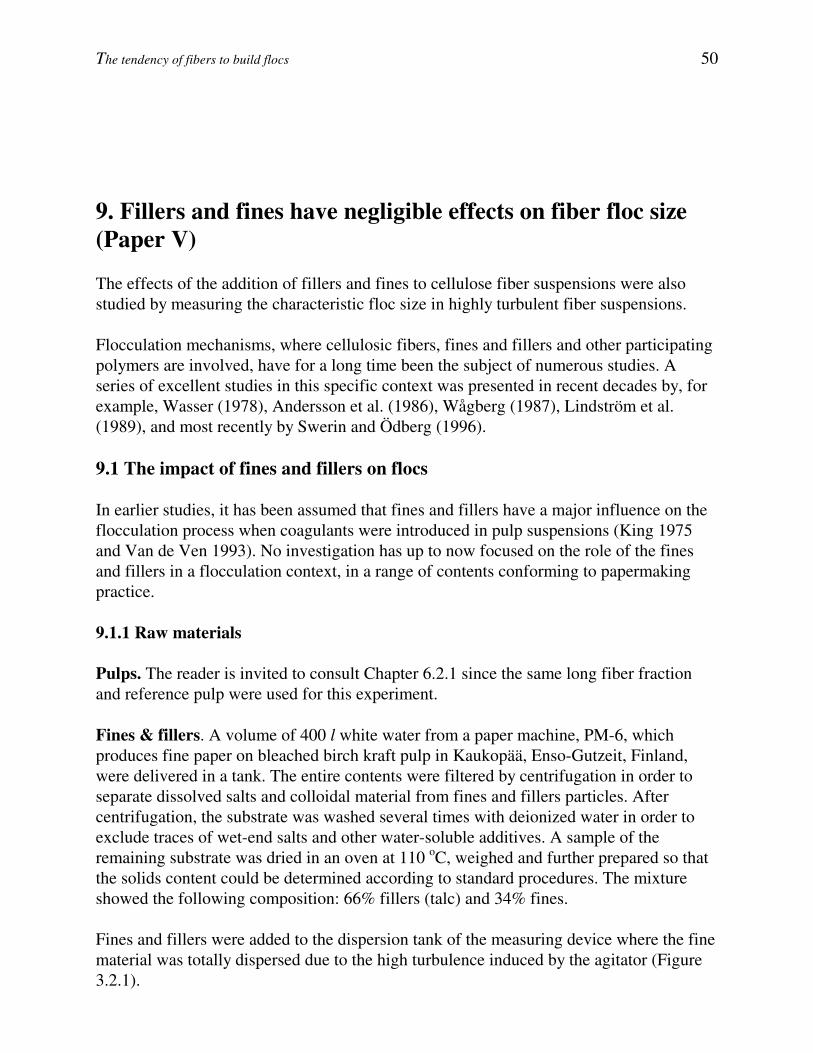
The tendency of fibers to build flocs 50
9. Fillers and fines have negligible effects on fiber floc size (Paper V) The effects of the addition of fillers and fines to cellulose fiber suspensions were also studied by measuring the characteristic floc size in highly turbulent fiber suspensions. Flocculation mechanisms, where cellulosic fibers, fines and fillers and other participating polymers are involved, have for a long time been the subject of numerous studies. A series of excellent studies in this specific context was presented in recent decades by, for example, Wasser (1978), Andersson et al. (1986), Wågberg (1987), Lindström et al. (1989), and most recently by Swerin and Ödberg (1996). 9.1 The impact of fines and fillers on flocs In earlier studies, it has been assumed that fines and fillers have a major influence on the flocculation process when coagulants were introduced in pulp suspensions (King 1975 and Van de Ven 1993). No investigation has up to now focused on the role of the fines and fillers in a flocculation context, in a range of contents conforming to papermaking practice. 9.1.1 Raw materials Pulps. The reader is invited to consult Chapter 6.2.1 since the same long fiber fraction and reference pulp were used for this experiment. Fines & fillers. A volume of 400 l white water from a paper machine, PM-6, which produces fine paper on bleached birch kraft pulp in Kaukopää, Enso-Gutzeit, Finland, were delivered in a tank. The entire contents were filtered by centrifugation in order to separate dissolved salts and colloidal material from fines and fillers particles. After centrifugation, the substrate was washed several times with deionized water in order to exclude traces of wet-end salts and other water-soluble additives. A sample of the remaining substrate was dried in an oven at 110 oC, weighed and further prepared so that the solids content could be determined according to standard procedures. The mixture showed the following composition: 66% fillers (talc) and 34% fines. Fines and fillers were added to the dispersion tank of the measuring device where the fine material was totally dispersed due to the high turbulence induced by the agitator (Figure 3.2.1).
The tendency of fibers to build flocs 51
0 5 10 15 20Fines & Fillers Addition, weight %
5
6
7
8
9 Long Fraction & Reference PulpLF, 0.6% LF, 0.9% REF, 0.6% REF, 0.9%
Fig. 9.1.1. MD-floc size as a function of various additions of a mixture containing 2/3 fines and 1/3 fillers for a long fiber fraction (LF) 2.64 mm, and a reference pulp (REF) suspended at 0.6 and 0.9 weight %. Fines and fillers additions are expressed as weight % of the fiber content. Figure 9.1.1 shows that the addition of a mixture of two thirds fines and one third fillers to both a long fiber fraction and a reference pulp has only a small effect on the floc size with a possible “lubricating” effect in the fiber-fiber contact areas, thereby giving a small reduction in floc size. Fines are fiber fragments of varying dimensions but, in any case, often in a scale of 1:1000 compared to the coarse fibers. Filler particles have even smaller sizes than the fines. In a dynamic situation both fines and fillers float around the coarse fibers without interfering with the fiber-to-fiber relation of the floc.
The tendency of fibers to build flocs 52
10. Concluding remarks A new type of floc measuring device is here presented. High flow velocity and high turbulence level, simplicity of performance and measurement, flexibility of use and immediate response in terms of output are some of the characteristics which are offered by this device. The measurement method is an image-analysis-based method which, in fact, renders a visualization of the pictures taken by a digital camera. The automated data processing system ensures very short processing times and delivers results of high accuracy. A primary aim of this work was to demonstrate the effects of fiber consistency, fiber dimensions and beating on the floc size of papermaking fibers prior to the addition of typical papermaking chemicals, during highly turbulent flows reminiscent of flow conditions under practical papermaking conditions. It is shown that fiber consistency and length has a profound influence whereas beating has less effect on fiber flocculation. Indeed, it was found that the floc size under the chosen hydrodynamic conditions was reasonably well correlated with the crowding factor of the fiber suspensions. A secondary aim was to find simple scaling laws, whereby the effects of fiber geometry, fiber treatment and of the physical environment on fiber flocculation could be connected. A high viscosity impedes the formation of large flocs. Viscosity changes induced by changes in the temperature of the suspending medium seem to have no significant influence on the floc size. Fine material such as fines and fillers plays no significant role in floc dispersion, considering the range and the amounts used in normal papermaking practice. This topic is nevertheless recommended to be the subject of further investigations. A third aim was to shed some light on the effect of surface chemistry on fiber flocculation. For fibers with a low surface charge density (bleached softwood kraft pulp) the influence of the chemical environment (pH, electrolyte concentration) was negligible whereas the flocculation of high surface charge density fibers was affected by the chemistry. Carboxymethylation had a profound dispersing effect on fiber suspensions, provided that the carboxymethylated fibers were in the sodium form. It is hypothesized that the effect of
The tendency of fibers to build flocs 53
carboxymethylation is to decrease the fiber-fiber frictional forces and it was also shown that the yield stress of fiber suspensions decreases with the extent of carboxymethylation. It is anticipated that this finding may be an inroad to new chemical approaches in papermaking. The approach taken in the work described in this thesis was to examine some of the behavior of the fundamental element of papermaking, “the fiber floc” and especially, the fiber-to-fiber relation in the first steps of the papermaking process, in order to enlarge the understanding of the mechanisms involved in these phenomena. Papermaking is a dynamic process, where hydrodynamic factors dominate over the chemical factors and this considerably complicates the approach. Papermakers have to consider this.

The tendency of fibers to build flocs 54
Appendix I Operative flow chart for the SPRAYDISC fractionation.
The tendency of fibers to build flocs 55
References Andersson, K., Sandström, A., Ström, K. and Barla, P., The use of cationic starch and colloidal silica to improve the drainage characteristics of kraft pulps, Nordic Pulp and Paper Research Journal, 1:2, 26-30, (1986) Beghello, L., Mechanisms That Govern Fiber Flocculation, Licentiate Thesis, Åbo Akademi University, (1994) Bennington, C. P. J., Kerekes R. J. and Grace J. R., The Yield Stress of Fiber Suspensions. The Canadian Journal of Chemical Engineering, Vol.68, 748-757, October (1990) De Roos, A.J., Stabilization of fiber suspensions, Tappi Journal, 41:7, 354-358, (1958) Erspamer, A., The Flocculation and Dispersion of Papermaking Fibers, Paper Trade Journal, 110, No. 24, 321-326, (1940) Fransson, P.I., Karlsson, H. and Kastre L., Method and apparatus for measuring fiber flexibility, Patent, US 5331405, (1992) Forgacs, O.L., The Hydrodynamic Behavior of Papermaking Fibers, Pulp and Paper Magazine of Canada, 59:5, 117-128, (1958) Jokinen O. and Ebeling K., Flocculation tendency of papermaking fibers, Paperi ja Puu, 67:5, 317-325, (1985) Kaji H. et al., Fractal analysis of flocculation in pulp suspension, Proceedings of the Tappi International Paper Physics Conference, Kona, Hawaii 22-26, 291-297, (1991) Karlsson, H. and Fransson P. I., STFI FiberMaster ger pappersmakarna nya muskler, Svensk Papperstidning/Nordisk Cellulosa, No. 10, 26-29, (1994) Kerekes, R.J., Pulp floc behavior in entry flow to constrictions, Tappi Journal, 66:1, 88-91 (1983)
The tendency of fibers to build flocs 56
Kerekes, R.J., Pulp flocculation in decaying turbulence: a literature review, Journal Pulp and Paper Science, 9:3, TR 86-91, (1983 b) Kerekes, R. J. and Schell C., Characterization of fiber flocculation regimes by a crowding factor, Journal Pulp and Paper Science, 18:1, J32-J38, (1992) Kerekes, R. J. and Schell C., Effects of fiber length and coarseness on pulp flocculation, Tappi Journal, 78:2, 133-139, (1995) Kerekes, R.J., Perspectives on Fiber Flocculation in Papermaking, Tappi/CPPA Proceedings, International Paper Physics Conference, Niagara on the Lake, 23-31, (1995 b) Lee, P.F.W., and Lindström, T., Effects of high molecular mass anionic polymers on paper sheet formation, Nordic Pulp and Paper Research Journal, 4:2, 61-70, (1989) Lindström, T., Hallgren, H. and Hedborg, F., Aluminium based microparticulate retention aid systems, Nordic Pulp and Paper Research Journal, 4:2, 99-103 (1989) Ljungqvist, M., Värmetekniska Tabeller, Tables, Institutionen för värmeteknik, Åbo Akademi University, Table 2, 2nd edition, (1984) Mardon, J. and Van Der Meer, Flocculation, Formation and Headbox Design from the Aspect of Turbulent Motion, Pulp and Paper Magazine of Canada, 55:11, 107-127, (1954) Mason, S.G., The motion of fibers in flowing fluids. Pulp and Paper Magazine of Canada, 51:5, 93-100, (1950) Mason, S.G., Some factors involved in the flocculation of pulp suspensions and the formation of paper, Pulp and Paper Magazine of Canada, 51:10, 94-98, (1950 b) Mason, S.G., Fiber motion and flocculation, Tappi Journal, 37:11, 494-501, (1954) Mason, S.G., Fiber motion and flocculation, Pulp and Paper Magazine of Canada, 55:13, 96-102 (1954 b) Meyer, R., Wahren, D., On the Elastic Properties of Three-Dimensional Fiber Networks, Svensk Papperstidning, 67:10, (1964) Metsä-Serla, An Introduction to the Technical Properties of CMC, brochure, (1989) Nelson, P.F., and Kalkipsakis, C.G., The Behavior of Salts of a Carboxymethylated Eucalypt Kraft Pulp, Tappi Journal, 47:3, 170-176, (1964)

The tendency of fibers to build flocs 57
Norman B. and Wahren D., A comprehensive method for the description of mass distribution in sheet and flocculation and turbulence in suspensions, Svensk Papperstidning, No. 75, 807-818, (1972) Persinger W.H. and Meyer H., Scale of Flocculation for fully developed turbulent tube flow of dilute fiber suspension. Paperi ja Puu, 57:9, 563-577, (1975) Press W. H., Flannery, B.P. and Vetterling W.T., Numerical Recipes: The Art of Scientific Computing, Text book, Cambridge University Press, 426, (1986) Robertson, A.A. and Mason S.G., The Flow Characteristics of Dilute Fiber Suspensions, Pulp and Paper Magazine of Canada, 40:5, 326-334, (1957) Sanders H.T. and Meyer H., Consistency distribution in turbulent tube flow of fiber suspensions. Tappi Journal, 54:5, 722-730, (1971) Soszynski R. M., Kerekes R. J., Elastic interlocking of nylon fibers suspended in liquid”. Part 1. ”Nature of cohesion among fibers. Nordic Pulp and Paper Research Journal, 3:4, 172-179, (1988) Steen, M., Modeling fiber flocculation in turbulent flow: A numerical study, Tappi Journal, 74:9, 175-182 (1991) Swerin, A. and Ödberg, L., Flocculation of cellulosic fiber suspensions by a microparticulate retention aid system consisting of cationic polyacrylamide and anionic montmorillonite, Nordic Pulp and Paper Research Journal, 11:1, 22-29, (1996) Wågberg, L., A device for measuring the kinetics of flocculation following polymer addition in turbulent fiber suspensions, Svensk Papperstidning, No. 6, R48-R56, (1985) Wågberg, L., Adsorption of Polyelectrolytes and Polymer-induced Flocculation of Cellulosic Fibers. Dissertation, Royal Institute of Technology, 27 may (1987) Wahren, D., On Three-Dimensional Fiber Networks, Svensk Papperstidning, 67:13, 536-539, (1964) Wahren, D., Proposed Definitions of Some Basic Papermaking Terms, Svensk Papperstidning, 70:21, 725-729, (1967) Wahren, D., Flocculation Phenomena in Wet Processing, Proceedings, Symposium on Man-Made Polymers in Papermaking, 241-255, June 5-8, Helsinki, Finland, (1972)

The tendency of fibers to build flocs 58
Van de Ven, T.G.M. and Mason, S.G., Particle Deposition on Pulp Fibers, Nordic Pulp and Paper Research Journal, 8:1, 130-134, (1993). Wasser, R.B., Formation aids for paper. An evaluation of chemicals additives for dispersing long fibered suspensions, Tappi Journal, 61:11, 115-118, (1978) Wikström, T. and Rasmusson, A., Yield stress of pulp suspensions - influence of fiber properties and processing conditions , to be published, personal communications (1997) Woollwage, J., The Flocculation of Papermaking Fibers, Paper Trade Journal, 108, 149-156, (1939) Zhao, R.H. and Kerekes, R.J., The Effects of suspending Liquid Viscosity on Fiber Flocculation, Tappi Journal, 76 :2, 183-188, (1993)