Embed Size (px)
Citation preview
1
The Structure of the Global Reinsurance Market:
An Analysis of Efficiency, Scale, and Scope
Christian Biener, Martin Eling, Ruo Jia1
Abstract
We conduct a multidimensional DEA frontier efficiency analysis to study economies of scale,
economies of scope, and cost efficiency in an industry where global risk diversification is the core of
the business model. Reinsurers with total assets less than USD 2.9 billion exhibit scale economies,
while those with assets greater than USD 15.5 billion do not. Large reinsurers are characterized by
high cost efficiency. Small reinsurers exhibit superior efficiency when they are specialized. This
research is original in terms of empirically explaining the structure of the global reinsurance market,
in which large reinsurers dominate, but both diversified and specialized reinsurers can be successful.
Keywords: DEA, Efficiency, Service Operations, Market Structure, Economies of Scale and Scope,
Diversification Strategies
1 Christian Biener ([email protected]), Martin Eling ([email protected]) and Ruo Jia
([email protected]) are affiliated with the Institute of Insurance Economics, University of St. Gallen, Rosenbergstrasse 22, 9000 St. Gallen, Switzerland. We are grateful to Gene Lai, Jan Hendrik Wirfs, Judith C. Schneider, Philipp Schaper, Tyler Leverty, Wei Zheng, and the anonymous reviewer of the 2015 Annual Conference of the Swiss Society for Financial Market Research (18th SGF conference) for their helpful inputs and comments to the paper.
2
1. INTRODUCTION
Reinsurers function as shock absorbers and risk bearers of last resort for the insurance industry and
the global economy. They also provide real services to their clients, including underwriting, pricing,
claim management, and consultancy, enabling them to protect individuals and institutions against
risks such as natural catastrophes, terrorism, and longevity. Moreover, reinsurers, with large and long-
term investment portfolios, are a reliable source of alternative capital to primary insurers and to the
global economy.
The reinsurance industry has undergone significant change in the 21st century, preceded by a number
of large-scale catastrophes, the 2008 financial crises, new competition from alternative risk transfer
schemes, and new sources of capital, especially from hedge funds and pension funds (Butt, 2007;
Cummins & Weiss, 2009). All of these factors have resulted in consolidation (Cole & McCullough,
2006; Cummins & Weiss, 2000) and structural change in the global reinsurance market.
Economies of scale and scope, as sources of diversification, are particularly relevant to the structure
of the reinsurance market. The advantages offered by scale economies motivate market consolidation
because large firms tend to be more scale efficient than small firms. Scope economies come into play
when more diversified firms exhibit cost efficiency (or other performance) advantages relative to
specialized firms (Clark, 1988; Elango, Ma, & Pope, 2008; Panzar & Willig, 1977, 1981). Borch
(1960, 1962) takes a different perspective and argues that the global reinsurance market is structured
around optimal risk allocation. He concludes that, in equilibrium, all reinsurers hold a proportional
share of the “market portfolio” that pools all risks in the market. Borch’s equilibrium implies
complete diversification of risks with the market portfolio. The theories involving economies of scale
and scope, as well as Borch’s equilibrium, focus on two key features of the reinsurance business—
size (scale) and diversification 2 (scope)—and thus provide a basis for analyzing their empirical
validity.3
This paper makes four contributions. (1) We estimate reinsurer cost efficiency and total factor
productivity using data envelopment analysis (DEA) with multiple inputs and outputs (Cook, Tone, &
Zhu, 2014; Cummins, Weiss, & Zi, 1999). (2) We analyze economies of scale and scope for the
global reinsurance market based on DEA frontier efficiency benchmarks (Cummins, Weiss, Xie, & Zi,
2 This paper focuses on product diversification, an aspect not to date studied in the context of the global
reinsurance market. Regarding geographic or international diversification in the reinsurance market, see, e.g., Cole, Lee, and McCullough (2007) and Outreville (2012a).
3 Reinsurance is a persuasive context to analyze market structure, not only because of the variety of recent corporate strategic changes (Klarner & Raisch, 2013), but also because the industry-specific risk allocation problem (Borch, 1960, 1962). Other industry-specific elements, such as its intangible and regulated nature, make reinsurance a particular interesting context to analyze market structure. The regulated nature of reinsurance market may serve as entry barrier and limit the options for diversification.

3
2010; Cummins & Xie, 2013), thus explaining the real-world structure of the global reinsurance
market. (3) We derive an optimal size range for reinsurers by uncovering thresholds at which scale
economies are exhausted (Katrishen & Scordis, 1998). (4) We test the efficient structure (ES)
hypothesis (Choi & Weiss, 2005) in the global reinsurance market, under which efficient firms are
expected to be more competitive because they charge lower prices without sacrificing profitability. To
our knowledge, none of these analyses have been conducted previously.4
Our empirical results suggest that reinsurance industry productivity improved significantly from 2002
to 2012, due to both technical progress and best-practice adoption by initially less efficient reinsurers.
The consideration of scale efficiency yields an optimal size range for reinsurers of between USD 2.9
and 15.5 billion in total assets (inflation adjusted at 2012). Scale diseconomies of the largest
reinsurers are offset by their strong positions in X-efficiency (i.e., cost efficiency excluding scale
efficiency); hence, the largest reinsurers are, in general, most cost efficient. Some small reinsurers are
also able to employ the best available technology and exhibit high pure technical efficiency in their
specialized fields, thus partially offsetting their scale inefficiencies. Product diversification (scope)
decreases X-efficiency and cost efficiency for small reinsurers, but has no significant impact on
medium and large reinsurers. The evidence supports the ES hypothesis, in the sense that cost-efficient
reinsurers can charge lower prices without sacrificing profitability. Our results explain the current
structure of the global reinsurance market, which is dominated by a few large reinsurers, but in which
both diversified and specialized reinsurers play important roles.
We contribute to international business research by showing how the global market for risk transfer is
organized. The results illustrate the tradeoff between scale diseconomies and potential gains in X-
efficiency, which is relevant for merger and acquisition decisions not only in this industry, but also in
other industries which are becoming more global. Hence, our work contributes to the ongoing
discussion on the operating efficiency of insurers (Lu, Wang, & Kweh, 2014), operating unit growth
(LaPlante & Paradi, 2015), and the systemic relevance of the reinsurance sector (Cummins & Weiss,
2014; Park & Xie, 2014).
4 To date, academic research on reinsurance has focused on product demand, contract design, and pricing (see
Bernard, 2013 for a review). However, the reinsurance market itself, especially the performance and productivity of reinsurers, are not well researched. Most literature on reinsurance performance applies traditional accounting indicators, such as ROE, ROA, and underwriting ratios (see, e.g., Chen & Hamwi, 2000; Cole & McCullough, 2008; Cole et al., 2010; Outreville, 2012a, 2012b). Cummins and Weiss (2000) provide the first piece of evidence on reinsurers’ efficiencies regarding the tradeoff between mean and standard deviation of ROE. Their approach sits in between the traditional accounting performance measurement and the frontier efficiency performance measurement approaches, because they only include one input and one output. In our view, the research gap in reinsurance can partially be attributed to the difficulty to consistently identify reinsurers and the need to combine different datasets in order to get a complete picture of the global reinsurance market. Moreover, the study of efficiency in service businesses is in general difficult and has attracted less attention than industries in which output is more easily quantified.
4
The paper is organized as follows. In Section 2, we discuss the theoretical background and derive our
hypotheses. Section 3 describes our methodology and data. In Section 4, we present the empirical
models and results, together with robustness tests. We conclude in Section 5.
2. HYPOTHESIS DEVELOPMENT
2.1 Economies of Scale and the Scale Impact on Efficiency
The theory of economies of scale implies a possible optimal firm size and an optimal market structure.
Scale economies (diseconomies) occur when a marginal proportional increase in the scale of all inputs
leads to a more (less) than proportional increase in the outputs produced (Clark, 1988; Mansfield,
1970). Hence, competition is Pareto efficient if scale economies become exhausted at a level of output
that is a small portion of the market. However, when scale economies are significant and unexhausted
at the full extent of the market, a monopoly firm may be able to minimize industry costs and prevent
market entry (Panzar & Willig, 1977).
Economies of scale may exist in the reinsurance industry due to expensive IT systems, operating
offices, claim settlement operations, and risk management (Cummins & Xie, 2013), thus providing
motivation for market consolidation (Cummins, Tennyson, & Weiss, 1999; Lonkevich, 1995).
However, size can also lead to inefficiencies, due to agency conflicts, communication costs, and
duplication efforts (Cummins & Weiss, 2013). Therefore, scale diseconomies may be present when
the disadvantages of scale exceed its advantages. This tradeoff leads to our first hypothesis.
• Hypothesis 1A. There is an inverse-U shaped relationship between reinsurer size and scale
efficiency.
An inverse-U shaped relationship between scale efficiency and firm size is found in many industries
(see, e.g., Bikker & Gorter, 2011; Cummins & Xie, 2013; Katrishen & Scordis, 1998 for primary
insurance; Berger & Humphrey, 1991; Noulas, Ray, & Miller, 1990 for banking). We expect to find
that small reinsurers are more likely to operate under increasing returns to scale (IRS),5 that the
largest reinsurers are more likely to operate under decreasing returns to scale (DRS), and that
medium-sized reinsurers are more likely to operate under constant returns to scale (CRS).
Furthermore, we will look for evidence on the optimal size range, considering the inverse-U shaped
relationship between scale efficiency and reinsurer size.
In addition to economies of scale (i.e., scale efficiency), cost efficiency involves other aspects, namely,
pure technical efficiency and allocative efficiency. X-efficiency is a combination of pure technical
and allocative efficiency. The impact of scale on X-efficiency is important to the reinsurance industry
because (1) larger scale enables reinsurers to attract qualified managers and hire experts to develop 5 In a competitive market, scale economies (diseconomies) and increasing (decreasing) returns to scale are
equivalent (Frisch, 1964).
5
and maintain state-of-the-art technologies for assessing and pricing risk, which enhances X-efficiency
and cost efficiency, and (2) large reinsurers are closer to the conditions to apply the law of large
numbers, which reduces loss volatility and, thus, enables the use of less capital to manage more risks.
Large reinsurers potentially have superior resources for developing and using state-of-the-art
technology and thus for being more X-efficient (Cummins & Weiss, 2000). Therefore, we expect that
large reinsurers’ strong X-efficiency offsets their scale diseconomies and results in an overall positive
correlation between size and cost efficiency.
• Hypothesis 1B. There is a positive relationship between reinsurer size and cost efficiency.
2.2 Economies of Scope and Interactions Between Economies of Scale and Scope
Panzar and Willig (1977, 1981) extend the concept of economies of scale to economies of scope,
suggesting that firms become more cost efficient by extending their output from only one to two or
more products. Economies of scope explain the existence of multi-product firms in a competitive
environment. Therefore, in addition to economies of scale and the scale impact on efficiency, any
examination of market structure must also consider the economies of scope.
Economies of scope are particularly important to the reinsurance industry because not only can certain
inputs—such as IT systems, policy services, and underwriting know-how—be used recurrently for
multiple product lines, as in other industries (Teece, 1980), but also a more diversified product
portfolio reduces underwriting volatility (Cummins & Weiss, 2013), allowing for higher leverage and
less equity capital (Lewellen, 1971). However, product diversification may also negatively influence
efficiency. For example, to look at it from the opposite side, more specialized firms will develop core
competencies in their core business, leading to decreasing managerial and agency costs (Berger,
Cummins, Weiss, & Zi, 2000). Moreover, life and nonlife insurance require different underwriting
and pricing techniques, meaning that any benefits from sharing underwriting may be negligible.
Furthermore, reinsurers engaged in both primary and reinsurance business may be subject to conflicts
of interest with themselves because its primary insurance line will be competing for this sort of
business with customers of its reinsurance line.
Berger et al. (2000) and Cummins et al. (2010) develop an empirical framework for economies of
scope in the insurance industry by testing the conglomeration hypothesis against the strategic focus
hypothesis. Berger et al. (2000) suggest that conglomeration is the dominant strategy for some types
of insurers, i.e., larger insurers focusing on personal lines and having a vertically integrated
distribution system, whereas a strategic focus is preferred by small insurers focusing on commercial
lines and having a nonintegrated distribution system. Elango et al. (2008) suggest that the scope
impact on performance depends on an insurer’s geographic diversification.
Therefore, it is important to examine whether the impact of product diversification (scope) varies by
type of reinsurer. Given that reinsurance is a pure commercial business and that, typically, reinsurers’
6
distribution systems are not integrated (i.e., brokers play an important role), we expect that strategic
focus strategies prevail in the reinsurance industry, particularly for small reinsurers. We therefore
expect that specialization (diversification) improves (reduces) the X-efficiency and cost efficiency of
small reinsurers.
• Hypothesis 2A. Small reinsurers have additional X-efficiency and cost efficiency advantages
when they are specialized.
Moreover, product diversification generates additional fixed costs for the new lines of business. Thus,
larger size is expected to leverage such costs, which leads us to expect that product diversification
increases the size necessary to achieve scale efficiency (Cummins & Xie, 2013); in other words, to
achieve the same level of scale efficiency, diversified reinsurer needs to be larger than specialized one.
• Hypothesis 2B. Product diversification increases the size necessary to achieve scale efficiency.
2.3 Efficient Structure
The efficient structure (ES) hypothesis (Choi & Weiss, 2005; Weiss & Choi, 2008) explains market
structure from an efficiency perspective. It suggests that the structure of the market in which firms
operate is determined by these firms’ efficiencies (Demsetz, 1973; Peltzman, 1977). More efficient
firms can charge lower prices without sacrificing profitability; hence, they are more competitive.
Market consolidation is an expected by-product of efficiency differences, with more efficient
reinsurers gaining higher market shares through consolidation (Choi & Weiss, 2005; Weiss & Choi,
2008). From a policymaker’s perspective, this consolidation is beneficial for both firms (which
operate more efficiently) and consumers (who pay lower prices).
• Hypothesis 3. Cost-efficient reinsurers can charge lower prices without sacrificing profitability.
Choi and Weiss (2005) and Weiss and Choi (2008) develop an empirical framework for the ES
hypothesis in the context of the U.S. nonlife insurance market. They find that efficient insurers have
higher market shares and argue that this is due to their ability to charge lower prices while generating
high profits. Berry-Stoelzle, Weiss, and Wende (2011) find support for the ES hypothesis in the
European nonlife insurance market.
In summary, the three hypotheses set out above have important implications for the structure of the
global reinsurance market. If an industry’s technology allows for economies of scale (scope), the
industry will tend to be made up of large (diversified) firms; alternatively, if technology does not
allow such economies, small (specialized) firms will tend to dominate (Clark, 1988). Extant scale and
scope economies indicate potential for market consolidation from the production perspective, and the
competitive pricing advantages enjoyed by cost-efficient firms also lead to that expectation.
7
3. METHODOLOGY AND DATA
3.1 Data Envelopment Analysis
We use data envelopment analysis (DEA), assuming constant (CRS), variable (VRS), and non-
increasing returns to scale (NIRS) to estimate efficient production frontiers separately for each year
between 2002 and 2012 (Cook & Zhu, 2014), an empirical approach frequently employed in
management research (Atici & Podinovski, 2015; Cook, Liang, & Zhu, 2010). The model
specification allows computing the Shephard (1970) input-oriented distance functions, which are
reported as the reciprocal of Farrell’s (1957) input efficiency measures. The resulting measures of cost
(CE), allocative (AE), pure technical (PTE), and scale (SE) efficiency represent the firm’s distance
from the respective best-practice efficient frontier and are bounded between 0 and 1. Moreover, we
estimate X-efficiency (XE) as CE divided by SE or, alternatively, the product of PTE and AE
(Cummins et al., 2010; Weiss & Choi, 2008). The reinsurance business model involves globally
diversifying risks and, typically, firms have risk exposures worldwide; we thus calculate a one-world
frontier for every year.
We exploit the variation of efficiency estimates for the different production frontiers of a reinsurance
firm to make inferences about scale economies (Aly, Grabowski, Pasurka, & Rangan, 1990), that is, to
discover whether a firm operates under constant returns to scale (CRS), or whether there are scale
inefficiencies, represented by increasing (IRS) or decreasing (DRS) returns to scale. Simar and
Wilson (2000) suggest a bootstrapping bias-correction procedure for DEA analysis. This approach,
however, leads to bootstrapping bias for different frontiers (i.e., CRS, VRS, NIRS) and the results
cannot easily be used to make inferences about scale economies This is why we present original
efficiency estimates throughout the paper and show results subject to the bootstrapping bias-
correction procedure as a robustness test, which also support our conclusions.
To make inferences about the development of productivity and efficiency over time, we employ the
input-oriented version of the Malmquist Index of Total Factor Productivity (TFP) (Caves, Christensen,
& Diewert, 1982; Färe, Grosskopf, Lindgren, & Roos, 1992) with the consistent bootstrap estimation
procedure (Simar & Wilson, 1999). We decompose the TFP into its principal sources of technical and
efficiency change. Technical change indicates changes in the production technology from one period
to another and, thus, shifts the production frontiers. Efficiency change detects changes in a firm’s
distance from the best-practice frontier from one period to another. Efficiency change can be further
decomposed into PTE change, indicating changes in the VRS frontier, and SE change, implying
changes in the distance between the VRS and the CRS frontiers.
Compared to accounting performance measures (e.g., ROE, ROA), the frontier efficiency method has
two main advantages: (1) it decomposes efficiency into different components, shedding light on the
process through which scale and scope affect efficiency, and (2) it reduces the impact of loss volatility
8
on performance measurement. This is particularly relevant to the reinsurance industry, since the
random nature of reinsurance losses can have a large impact on the financial results of a particular
year. The ROE (or the mean ROE over a few years) is highly volatile and thus cannot accurately
capture a reinsurer’s operational performance. The DEA frontier efficiency approach can account for
volatility with multiple inputs and outputs. Moreover, extensions of the standard DEA model, such as
the loss-smoothing procedure (Cummins & Xie, 2008), are capable of dealing with extreme cases.
After deriving the DEA efficiency scores, we perform DEA second stage regressions as shown in
Equation (1) (Cook & Zhu, 2014). Hypotheses predict potential nonlinear relationship between firm
size and efficiency. Therefore, we use the natural logarithm of real total assets and its squared term to
capture the nonlinear size effects. Each lnAsset is centered at the mean of all firm-year lnAsset values
to avoid multicollinearity between size and its square, l𝑛𝑛𝑛𝑛𝑛𝑡𝑐𝑐𝑐𝑐𝑐𝑐𝑐𝑐𝑖,𝑐 = lnAsseti,t − lnAsset���������� ,
where lnAsset���������� is the average of all firm-years, and all asset values are inflation adjusted at 2012. The
dummy variable composite measures a reinsurer’s product diversification across life and nonlife
business. The dummy variable conglomerate measures the reinsurer’s product diversification across
reinsurance and primary insurance. X is a series of control variables, including leverage ratio (total
liabilities divided by total equity and surplus), affiliation status (1 if the reinsurer is an unaffiliated
single firm), headquarter location dummies (market fixed effects), and year dummies (time fixed
effects) 6 . After controlling for the market and year fixed effects, we use random effects panel
regressions legitimated by Hausman and log-likelihood ratio tests.7 We conduct firm fixed effects
regressions as a robustness test, the results of which are consistent.
𝐸𝐸𝐸𝐸𝐸𝐸𝑛𝑛𝐸𝑦𝑖,𝑐 = 𝛽0 + 𝛽1𝑆𝐸𝑆𝑛𝑖,𝑐 + 𝛽2𝑆𝐸𝑆𝑛𝑖,𝑐2 + 𝛽3𝐶𝐶𝐶𝐶𝐶𝑛𝐸𝑡𝑛𝑖 + 𝛽4𝐶𝐶𝑛𝐶𝐶𝐶𝐶𝑛𝐶𝐶𝑡𝑛𝑖 + 𝛽𝑗𝑋𝑖,𝑐 + 𝜀𝑖,𝑐 (1)
3.2 Inputs, Outputs, and Prices
For input quantities we use labor (number of employees), materials and business services, and total
equity capital (in real values at 2012). The number of employees is from annual reports of the
respective reinsurers. We use the annual average wages for the insurance sector (banking, if insurance
is not available) in respective country-years as the price of labor. The wage information is obtained
from the ILO Main Statistics and October Inquiry databases.8 The quantity of materials and business
6 Supplementary Material D presents the distribution of our sample over years and by geographical regions. We
group the domiciled locations of reinsurers into four reinsurance hubs and six additional regional markets. The reinsurance hubs are Western Continental Europe, North America, Bermuda, and London (Holzheu & Lechner, 2007). The additional regional markets include Asia Developed, Asia Emerging, Africa, Eastern Europe, Latin America, and Middle East.
7 The Hausman test discriminates fixed from random effects models and gives the Chi-square statistic of 11.71 (p-value of 0.63). The log-likelihood ratio test discriminates random effects models from pooled OLS regressions and gives Chi-bar-square statistic of 94.52 (p-value of 0.00).
8 Wage is not available for all country-years, so we proxy the price of labor by adjusting the nearest available data point to the previous or later year using CPIs.

9
services is calculated as operating expenses minus employee costs, following the procedure in
Cummins and Weiss (2013). We proxy the price of materials and business services by the consumer
price indices (CPI) of respective country-years. Production price indices (PPI) are used as a
robustness test. We approximate total equity capital by capital and surplus in Best’s Insurance Reports
(A.M. Best, 2002–2012). We use the average realized ROE of respective years as the price of equity
capital. The yearly rates of total return from Morgan Stanley Capital International (MSCI) Indices in
respective countries are used as a robustness test.9
For output quantities we use total invested assets and losses (both in real values at 2012). These
represent a reinsurer’s two major functions: risk pooling (risk bearing) and financial intermediation.
Reinsurers also act as think tanks and serve as consultants to primary insurers; however, they do not
usually charge for such services, but offer them as a door into acquiring new business. Therefore, the
consulting function is integrated into, and reflected by, the output of loss. We approximate the total
invested assets by the total investments in Best’s Insurance Reports (A.M. Best, 2002–2012). We
calculate the losses with the loss-smoothing procedure in Cummins and Xie (2008); also documented
in Supplementary Material A (all supplementary materials are available from the authors upon
request). This procedure is particularly well-suited for losses of P&C and reinsurance, which are
highly volatile. Premiums are sometimes used as an alternative output to loss, since premiums
represent the business volume produced. However, Yuengert (1993) points out that premiums
represent price times quantity, instead of just quantity. We include a model relying on premiums,
instead of smoothed losses, as a robustness test (Cummins & Weiss, 2013), the results of which are
consistent with our core models.
3.3 Data and Summary Statistics
The global reinsurance market is dominated by professional reinsurers10 (Holzheu & Lechner, 2007).
Like Cummins and Weiss (2000), we found it difficult to discover a single coherent data source that
contains all the information necessary to conducting a reinsurance efficiency study. We thus use four
sources: (1) Best’s Insurance Reports (A.M. Best, 2002–2012) database, which includes general and
financial information on all non-U.S. reinsurers; (2) Standard & Poor’s Global Reinsurance
Highlights (Standard & Poor’s Rating Services, 2003–2013), which includes a global reinsurance
survey for each year and containing the most complete list of active reinsurers worldwide, which we
use to identify U.S. reinsurers and fill in information missing from Best’s Insurance Reports; (3)
annual reports of reinsurers (2002–2012), which is our major source for number of employees and
9 A rolling window of 10-year averages is used. The remaining negative values are censored at 0. The MSCI
Indices are obtained from the Thomson DataStream database. 10 A professional reinsurer is a firm for which reinsurance is the major business, as opposed to a primary insurer,
which may also engage in reinsurance as a sideline.

10
financial information of U.S. reinsurers; and (4) the Best’s Special Report on Global Reinsurance
(A.M. Best, 2013), from which we use the list of top 50 reinsurers to fill in missing values.
Different approaches are taken in differentiating professional reinsurers from primary insurers
(Beaver, McNichols, & Nelson, 2003; Cole & McCullough, 2006; Cummins & Weiss, 2000). Cole
and McCullough (2008) find that the criteria used to identify reinsurers significantly influences
empirical outcomes–a standard empirical selection bias problem–and that efforts to unify the
definition of reinsurer are inconclusive. Whether a company is a reinsurer or a primary insurer is
much less clear-cut than whether a company is a life or a nonlife insurer. This is because some
insurers sell both primary and reinsurance, and because the reinsurance transactions often covers a
significant share of transactions between affiliated firms (e.g., subsidiaries reinsure their portfolios
with their headquarters). Because we are studying the global reinsurance market, we are interested in
professional reinsurers, that is, insurers that engage in reinsurance on the open market as their major
business. This paper does not aim to solve the reinsurance definition problem, but instead controls for
the influence that the selection criteria could have on the empirical results.
Therefore, we follow a four-step algorithm to generate our sample of professional reinsurers. First, an
insurer’s reinsurance premiums written must account for more than 50% of its total premiums
written11 (Beaver, McNichols, & Nelson, 2003). Second, we eliminate multiple reinsurers within one
reinsurance group and identify one unique entity that reflects the reinsurance business of the group.
We focus on the reinsurance business share,12 setting the cut-off threshold at 50%. Only those entities
above the threshold are considered as representative of the reinsurance group. Third, if multiple
entities meet the representation criterion within a group, we select the one that is used as the A.M.
Best Rating Unit, which separates out the entity best representing the way the insurance group
operates and manages the business and eliminates reinsurance transactions within a group or among
affiliates. Fourth, we exclude Lloyd’s syndicates, captives, reinsurance pools, and “bridge reinsurers”
that retain less than 20% of their gross premiums written.13 We employ year 2012 data for our
identification procedure, and due to data limitations, assume consistency back to earlier years.
Reinsurers that existed before 2012, but were not active in 2012, were usually bought by one of the
11 In most cases, gross premiums are considered; if these are not available, we take net premiums. 12 Gross reinsurance premiums written by the identified entity divided by gross reinsurance premiums written by
the group. If gross premiums are not available, we take net reinsurance premiums. 13 Lloyd’s syndicates usually operate only core functions (e.g., underwriting) by themselves and outsource
supporting functions (e.g., HR, IT) to Lloyd’s market services. This practice leads to these firms having a very small number of employees. Thus, we cannot consider Lloyd’s syndicates as stand-alone firms. Only one-third of the business done by Lloyd’s market as a whole, however, is reinsurance and thus they do not meet the criteria of professional reinsurer. Captives, reinsurance pools, and “bridge reinsurers” have operating models different from those of traditional reinsurers, and their financial results are not fully comparable to those of a traditional reinsurer. Thus, we do not include them in our DEA analysis.

11
other reinsurers in our sample, instead of going bankrupt.14 Thus, the poor performance of acquired
reinsurers becomes an integral part of the acquiring reinsurers. Therefore, we consider the
survivorship bias to be minimal.
Our final sample contains 116 professional reinsurers and 841 firm-years.15 The total net reinsurance
premiums written by our sample in 2012 is USD 164 billion, representing 91% of the professional
reinsurance market16 and 71% of the total global reinsurance market.17 The business of reinsurers in
our sample varies from treaty to facultative reinsurance and from proportional to non-proportional
reinsurance; however, detailed information regarding product mix is not available. The dataset covers
the period from 2002 to 2012. We exclude observations with extreme values (i.e., outside the 1 and 99
percentiles) in operating expense ratio and business services ratio.18 These reinsurers with extreme
values are usually startups that do not yet underwrite reinsurance or runoff reinsurers, which are not
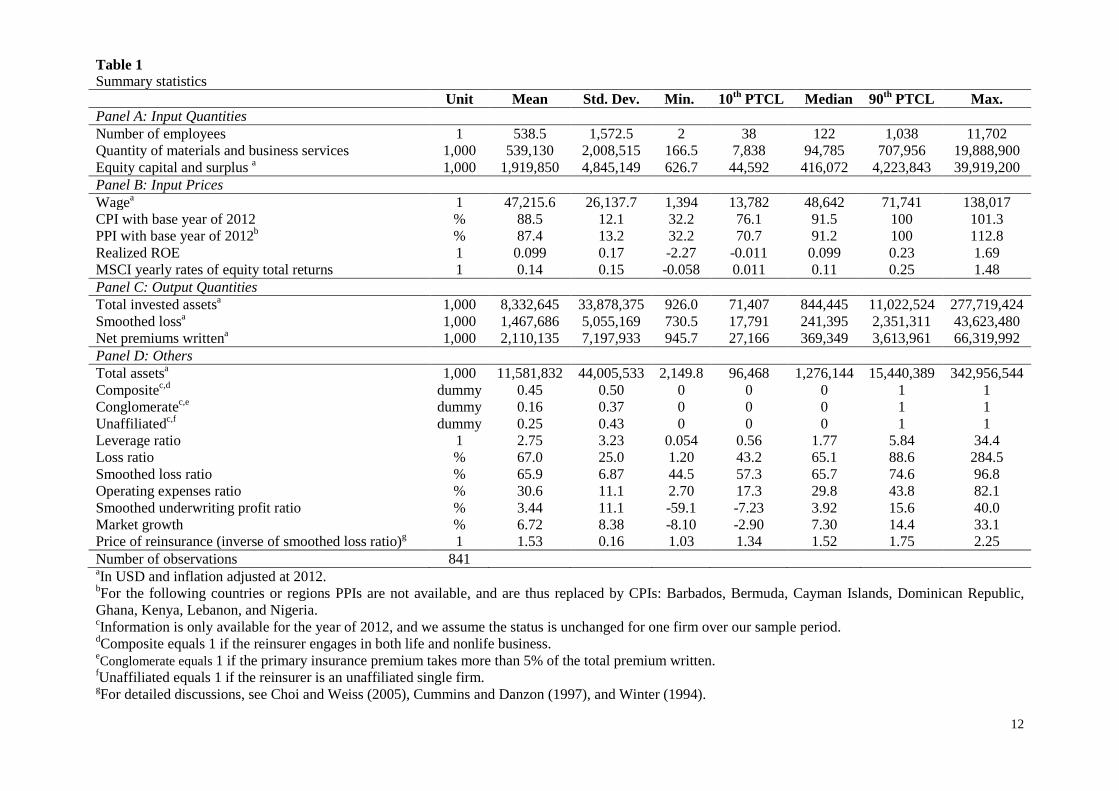
comparable to and not in competition with regular reinsurers. Table 1 shows summary statistics for
our sample. There is a great deal of variation in firm size and underwriting ratios (i.e., loss ratios and
expense ratios): 45% of reinsurers engage in both life and nonlife reinsurance; 16% of professional
reinsurers write significant amounts of primary insurance business, having a reinsurance premium
share between 50% and 95%; 25% of reinsurers operate as unaffiliated single firms, while the
remaining firms operate as groups or affiliates with others. The average leverage ratio is 2.75, which
is slightly higher than the leverage ratio of 2.13 found a decade ago by Cummins and Weiss (2000).
14 We identified 14 cases that the professional reinsurers existed before 2012, but were not active in 2012, by
reviewing the top 40 reinsurers each year in Global Reinsurance Highlights (2003–2012). All of them were bought by other reinsurers in our sample, e.g., GE insurance solutions was bought by Swiss Re. Cummins and Weiss (2000) also indicate that mergers and acquisitions of reinsurers usually happen within the reinsurance industry, with a purpose of risk diversification.
15 Some values are missing from our dataset due to the unavailability of some inputs and outputs from any of our four data sources. The most common missing values are number of employees. We filled in the missing information using predicted values that we extrapolated based on observed data and performed a robustness test by using only observed data, i.e., excluding observations with missing values, the results of which are consistent with the results of our main analysis.
16 We use the total net reinsurance premiums written (USD 179.22 billion) from S&P Global Reinsurance Survey 2012 as the size of the professional reinsurance market (Standard & Poor’s Rating Services, 2013).
17 We use Swiss Re’s estimation of USD 230 billion in global reinsurance premiums in 2012 as the size of the global reinsurance market, which includes reinsurance assumed by both professional reinsurers and primary insurers (Swiss Re, 2013).
18 The operating expense ratio is defined as operating expenses divided by net premiums written. The business services ratio is defined as cost of materials and business services divided by total operating expenses. This winsorizing excludes 4% of firm-year observations from our sample.
12
Table 1 Summary statistics Unit Mean Std. Dev. Min. 10th PTCL Median 90th PTCL Max. Panel A: Input Quantities Number of employees 1 538.5 1,572.5 2 38 122 1,038 11,702 Quantity of materials and business services 1,000 539,130 2,008,515 166.5 7,838 94,785 707,956 19,888,900 Equity capital and surplus a 1,000 1,919,850 4,845,149 626.7 44,592 416,072 4,223,843 39,919,200 Panel B: Input Prices Wagea 1 47,215.6 26,137.7 1,394 13,782 48,642 71,741 138,017 CPI with base year of 2012 % 88.5 12.1 32.2 76.1 91.5 100 101.3 PPI with base year of 2012b % 87.4 13.2 32.2 70.7 91.2 100 112.8 Realized ROE 1 0.099 0.17 -2.27 -0.011 0.099 0.23 1.69 MSCI yearly rates of equity total returns 1 0.14 0.15 -0.058 0.011 0.11 0.25 1.48 Panel C: Output Quantities Total invested assetsa 1,000 8,332,645 33,878,375 926.0 71,407 844,445 11,022,524 277,719,424 Smoothed lossa 1,000 1,467,686 5,055,169 730.5 17,791 241,395 2,351,311 43,623,480 Net premiums writtena 1,000 2,110,135 7,197,933 945.7 27,166 369,349 3,613,961 66,319,992 Panel D: Others Total assetsa 1,000 11,581,832 44,005,533 2,149.8 96,468 1,276,144 15,440,389 342,956,544 Compositec,d dummy 0.45 0.50 0 0 0 1 1 Conglomeratec,e dummy 0.16 0.37 0 0 0 1 1 Unaffiliatedc,f dummy 0.25 0.43 0 0 0 1 1 Leverage ratio 1 2.75 3.23 0.054 0.56 1.77 5.84 34.4 Loss ratio % 67.0 25.0 1.20 43.2 65.1 88.6 284.5 Smoothed loss ratio % 65.9 6.87 44.5 57.3 65.7 74.6 96.8 Operating expenses ratio % 30.6 11.1 2.70 17.3 29.8 43.8 82.1 Smoothed underwriting profit ratio % 3.44 11.1 -59.1 -7.23 3.92 15.6 40.0 Market growth % 6.72 8.38 -8.10 -2.90 7.30 14.4 33.1 Price of reinsurance (inverse of smoothed loss ratio)g 1 1.53 0.16 1.03 1.34 1.52 1.75 2.25 Number of observations 841 aIn USD and inflation adjusted at 2012. bFor the following countries or regions PPIs are not available, and are thus replaced by CPIs: Barbados, Bermuda, Cayman Islands, Dominican Republic, Ghana, Kenya, Lebanon, and Nigeria. cInformation is only available for the year of 2012, and we assume the status is unchanged for one firm over our sample period. dComposite equals 1 if the reinsurer engages in both life and nonlife business. eConglomerate equals 1 if the primary insurance premium takes more than 5% of the total premium written. fUnaffiliated equals 1 if the reinsurer is an unaffiliated single firm. gFor detailed discussions, see Choi and Weiss (2005), Cummins and Danzon (1997), and Winter (1994).
13
4. EMPIRICAL ANALYSIS AND RESULTS
4.1 Efficiency and Productivity Estimations
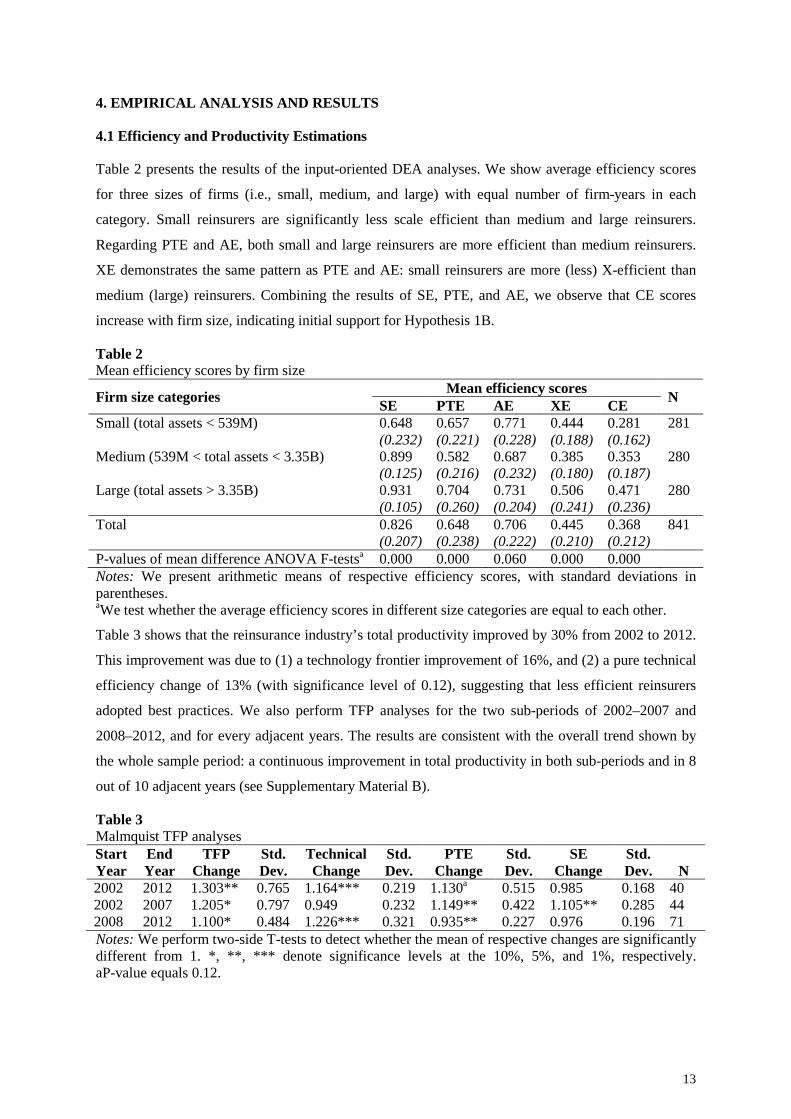
Table 2 presents the results of the input-oriented DEA analyses. We show average efficiency scores
for three sizes of firms (i.e., small, medium, and large) with equal number of firm-years in each
category. Small reinsurers are significantly less scale efficient than medium and large reinsurers.
Regarding PTE and AE, both small and large reinsurers are more efficient than medium reinsurers.
XE demonstrates the same pattern as PTE and AE: small reinsurers are more (less) X-efficient than
medium (large) reinsurers. Combining the results of SE, PTE, and AE, we observe that CE scores
increase with firm size, indicating initial support for Hypothesis 1B.
Table 2 Mean efficiency scores by firm size
Firm size categories Mean efficiency scores N SE PTE AE XE CE Small (total assets < 539M) 0.648 0.657 0.771 0.444 0.281 281 (0.232) (0.221) (0.228) (0.188) (0.162) Medium (539M < total assets < 3.35B) 0.899 0.582 0.687 0.385 0.353 280 (0.125) (0.216) (0.232) (0.180) (0.187) Large (total assets > 3.35B) 0.931 0.704 0.731 0.506 0.471 280 (0.105) (0.260) (0.204) (0.241) (0.236) Total 0.826 0.648 0.706 0.445 0.368 841 (0.207) (0.238) (0.222) (0.210) (0.212) P-values of mean difference ANOVA F-testsa 0.000 0.000 0.060 0.000 0.000 Notes: We present arithmetic means of respective efficiency scores, with standard deviations in parentheses. aWe test whether the average efficiency scores in different size categories are equal to each other.
Table 3 shows that the reinsurance industry’s total productivity improved by 30% from 2002 to 2012.
This improvement was due to (1) a technology frontier improvement of 16%, and (2) a pure technical
efficiency change of 13% (with significance level of 0.12), suggesting that less efficient reinsurers
adopted best practices. We also perform TFP analyses for the two sub-periods of 2002–2007 and
2008–2012, and for every adjacent years. The results are consistent with the overall trend shown by
the whole sample period: a continuous improvement in total productivity in both sub-periods and in 8
out of 10 adjacent years (see Supplementary Material B).
Table 3 Malmquist TFP analyses Start Year
End Year
TFP Change
Std. Dev.
Technical Change
Std. Dev.
PTE Change
Std. Dev.
SE Change
Std. Dev. N
2002 2012 1.303** 0.765 1.164*** 0.219 1.130a 0.515 0.985 0.168 40 2002 2007 1.205* 0.797 0.949 0.232 1.149** 0.422 1.105** 0.285 44 2008 2012 1.100* 0.484 1.226*** 0.321 0.935** 0.227 0.976 0.196 71 Notes: We perform two-side T-tests to detect whether the mean of respective changes are significantly different from 1. *, **, *** denote significance levels at the 10%, 5%, and 1%, respectively. aP-value equals 0.12.
14
4.2 Economies of Scale
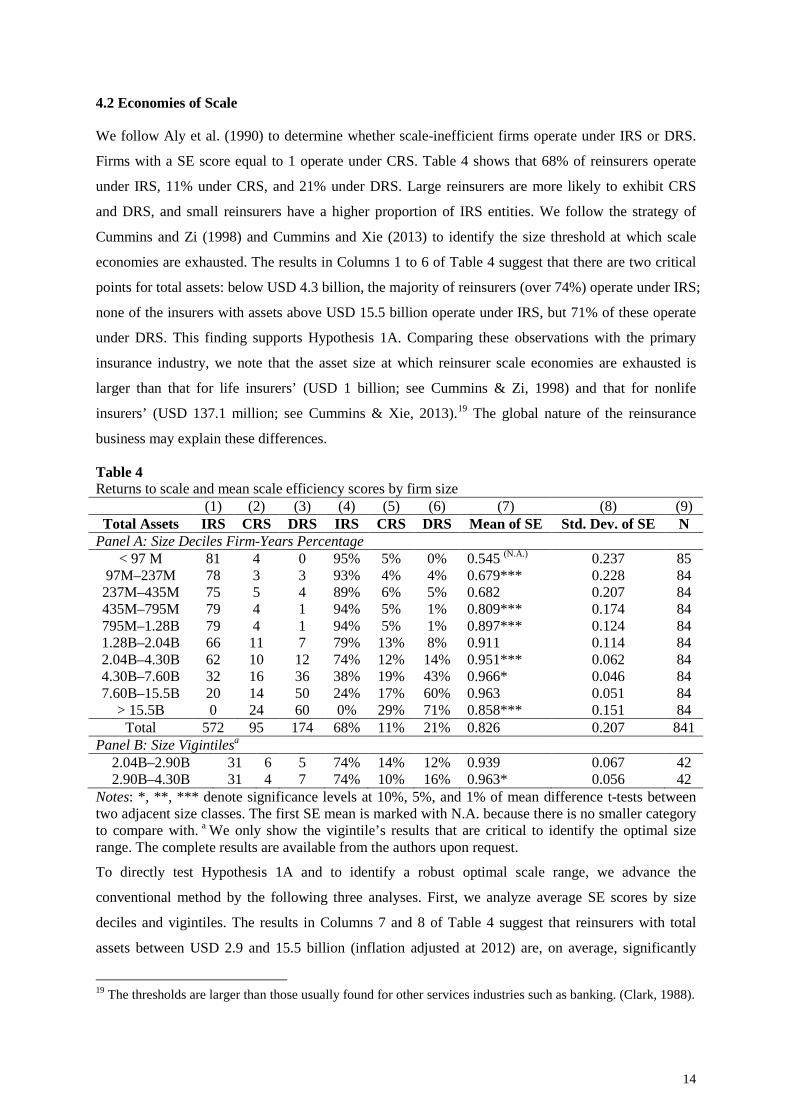
We follow Aly et al. (1990) to determine whether scale-inefficient firms operate under IRS or DRS.
Firms with a SE score equal to 1 operate under CRS. Table 4 shows that 68% of reinsurers operate
under IRS, 11% under CRS, and 21% under DRS. Large reinsurers are more likely to exhibit CRS
and DRS, and small reinsurers have a higher proportion of IRS entities. We follow the strategy of
Cummins and Zi (1998) and Cummins and Xie (2013) to identify the size threshold at which scale
economies are exhausted. The results in Columns 1 to 6 of Table 4 suggest that there are two critical
points for total assets: below USD 4.3 billion, the majority of reinsurers (over 74%) operate under IRS;
none of the insurers with assets above USD 15.5 billion operate under IRS, but 71% of these operate
under DRS. This finding supports Hypothesis 1A. Comparing these observations with the primary
insurance industry, we note that the asset size at which reinsurer scale economies are exhausted is
larger than that for life insurers’ (USD 1 billion; see Cummins & Zi, 1998) and that for nonlife
insurers’ (USD 137.1 million; see Cummins & Xie, 2013).19 The global nature of the reinsurance
business may explain these differences.
Table 4 Returns to scale and mean scale efficiency scores by firm size
(1) (2) (3) (4) (5) (6) (7) (8) (9) Total Assets IRS CRS DRS IRS CRS DRS Mean of SE Std. Dev. of SE N
Panel A: Size Deciles Firm-Years Percentage < 97 M 81 4 0 95% 5% 0% 0.545 (N.A.) 0.237 85
97M–237M 78 3 3 93% 4% 4% 0.679*** 0.228 84 237M–435M 75 5 4 89% 6% 5% 0.682 0.207 84 435M–795M 79 4 1 94% 5% 1% 0.809*** 0.174 84 795M–1.28B 79 4 1 94% 5% 1% 0.897*** 0.124 84 1.28B–2.04B 66 11 7 79% 13% 8% 0.911 0.114 84 2.04B–4.30B 62 10 12 74% 12% 14% 0.951*** 0.062 84 4.30B–7.60B 32 16 36 38% 19% 43% 0.966* 0.046 84 7.60B–15.5B 20 14 50 24% 17% 60% 0.963 0.051 84
> 15.5B 0 24 60 0% 29% 71% 0.858*** 0.151 84 Total 572 95 174 68% 11% 21% 0.826 0.207 841
Panel B: Size Vigintilesa 2.04B–2.90B 31 6 5 74% 14% 12% 0.939 0.067 42 2.90B–4.30B 31 4 7 74% 10% 16% 0.963* 0.056 42
Notes: *, **, *** denote significance levels at 10%, 5%, and 1% of mean difference t-tests between two adjacent size classes. The first SE mean is marked with N.A. because there is no smaller category to compare with. a We only show the vigintile’s results that are critical to identify the optimal size range. The complete results are available from the authors upon request.
To directly test Hypothesis 1A and to identify a robust optimal scale range, we advance the
conventional method by the following three analyses. First, we analyze average SE scores by size
deciles and vigintiles. The results in Columns 7 and 8 of Table 4 suggest that reinsurers with total
assets between USD 2.9 and 15.5 billion (inflation adjusted at 2012) are, on average, significantly
19 The thresholds are larger than those usually found for other services industries such as banking. (Clark, 1988).

15
more scale efficient than larger or smaller reinsurers. The existence of an optimal size range supports
Hypothesis 1A. The range of USD 12.6 billion is a wide one in terms of absolute value; however, it is
only 28.6% of one standard deviation of our sample reinsurers’ total assets (USD 44.0 billion). It is
thus a relatively accurate range considering the whole size spectrum of reinsurers.
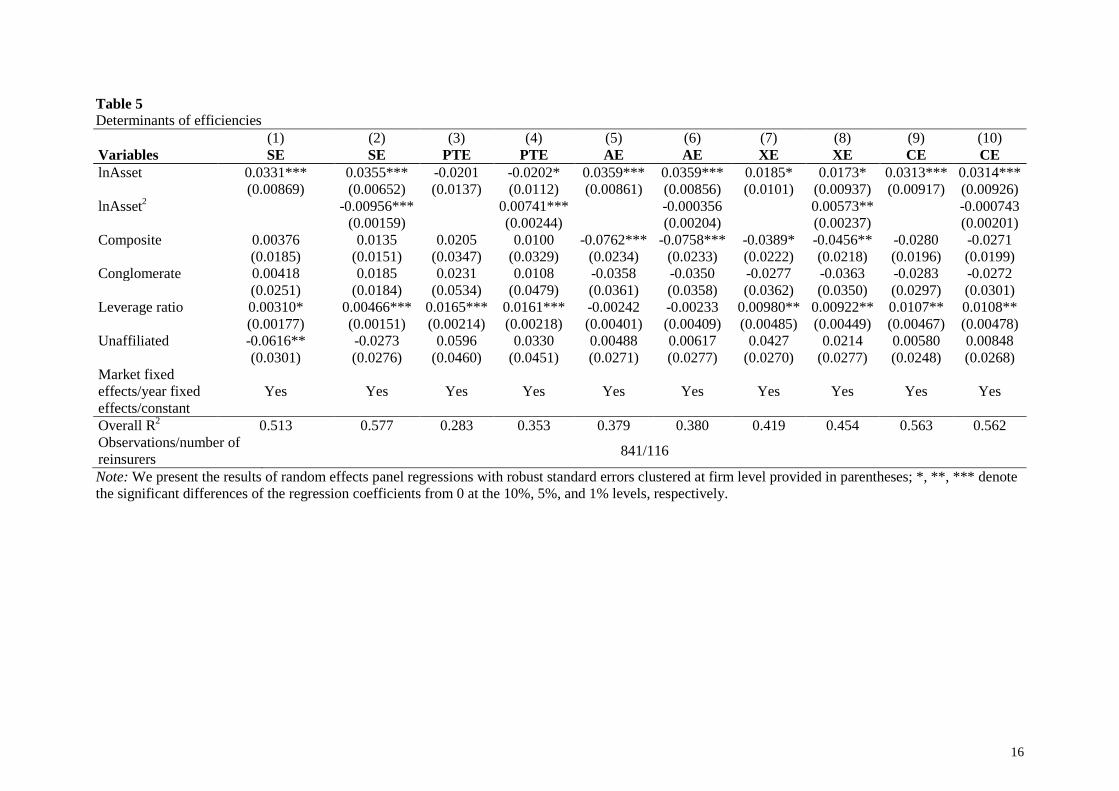
Second, we apply the DEA second-stage regression to SE scores, as defined in Equation (1). The
results in Column 2 of Table 5 show that SE increases with firm size at a decreasing rate, then reaches
optimal size, and subsequently decreases with firm size. The pattern confirms H1A. Third, we obtain
the predicted SE scores from the above regression and extract the top 10% scale-efficient firm-year
observations to identify a corresponding optimal asset range (see Figure 1). A similar approach is
found in Berger and Humphrey (1991) and McAllister and McManus (1993). The two vertical lines
with USD 2.9 billion and 15.5 billion mark the asset range identified by the decile and vigintile
analyses. The box plots show that for the top 10% scale-efficient observations, total asset values
within the 25th and 75th percentiles fall into the identified optimal size range. The histogram suggests
that around 60% of the top 10% scale-efficient observations have total assets within the identified
optimal size range. The inspection of the visualized kernel density distribution serves as a further
indicator of the existence and robustness of the identified optimal size range.
Based on the three additional analyses, we adjust the size range obtained from the conventional
approach (Cummins & Zi, 1998; Cummins & Xie, 2013) and conclude that an optimal size range for
reinsurers is between USD 2.9 billion and 15.5 billion in total assets. The estimated optimal size range
is based on scale efficiency and does not account for the impact of scale on other components of cost
efficiency. In general, our evidence supports the theoretical predictions of economies of scale in the
global reinsurance market. The data suggest that firms in the optimal size range have a higher
probability of being scale efficient than firms outside this range.
Figure 1 Optimal size range
Notes: The left figure shows box plots of lnAsset for the top 10% scale-efficient firm-years compared with the 90% non-scale-efficient firm-years. The right figure shows the histogram and estimated kernel density of lnAssets for the same top 10% scale-efficient observations. The two vertical lines in both figures show the optimal size range obtained from the decile and vigintile analyses. The asset values used are in thousand US dollars.
16
Table 5 Determinants of efficiencies (1) (2) (3) (4) (5) (6) (7) (8) (9) (10) Variables SE SE PTE PTE AE AE XE XE CE CE lnAsset 0.0331*** 0.0355*** -0.0201 -0.0202* 0.0359*** 0.0359*** 0.0185* 0.0173* 0.0313*** 0.0314*** (0.00869) (0.00652) (0.0137) (0.0112) (0.00861) (0.00856) (0.0101) (0.00937) (0.00917) (0.00926) lnAsset2 -0.00956*** 0.00741*** -0.000356 0.00573** -0.000743 (0.00159) (0.00244) (0.00204) (0.00237) (0.00201) Composite 0.00376 0.0135 0.0205 0.0100 -0.0762*** -0.0758*** -0.0389* -0.0456** -0.0280 -0.0271 (0.0185) (0.0151) (0.0347) (0.0329) (0.0234) (0.0233) (0.0222) (0.0218) (0.0196) (0.0199) Conglomerate 0.00418 0.0185 0.0231 0.0108 -0.0358 -0.0350 -0.0277 -0.0363 -0.0283 -0.0272 (0.0251) (0.0184) (0.0534) (0.0479) (0.0361) (0.0358) (0.0362) (0.0350) (0.0297) (0.0301) Leverage ratio 0.00310* 0.00466*** 0.0165*** 0.0161*** -0.00242 -0.00233 0.00980** 0.00922** 0.0107** 0.0108** (0.00177) (0.00151) (0.00214) (0.00218) (0.00401) (0.00409) (0.00485) (0.00449) (0.00467) (0.00478) Unaffiliated -0.0616** -0.0273 0.0596 0.0330 0.00488 0.00617 0.0427 0.0214 0.00580 0.00848 (0.0301) (0.0276) (0.0460) (0.0451) (0.0271) (0.0277) (0.0270) (0.0277) (0.0248) (0.0268) Market fixed effects/year fixed effects/constant
Yes Yes Yes Yes Yes Yes Yes Yes Yes Yes
Overall R2 0.513 0.577 0.283 0.353 0.379 0.380 0.419 0.454 0.563 0.562 Observations/number of reinsurers 841/116
Note: We present the results of random effects panel regressions with robust standard errors clustered at firm level provided in parentheses; *, **, *** denote the significant differences of the regression coefficients from 0 at the 10%, 5%, and 1% levels, respectively.

17
4.3 Scale Impact on Efficiency
To assess the impact of scale on other efficiency measures, we estimate Equation (1) with PTE, AE,
XE, and CE scores, as shown in Columns 3 to 10 of Table 5. The results in Column 10 confirm
Hypothesis 1B by showing that reinsurers’ cost efficiency scores increase along with firm size. The
PTE results in Column 4 suggest a U-shaped relationship between firm size and PTE. Both small and
large reinsurers are more likely to employ the best technologies than are medium-sized reinsurers. The
results in Columns 5 and 6 suggest a positive linear relationship between firm size and AE. The X-
efficiency results in Columns 7 and 8 show the combined effects of PTE and AE.
Large reinsurers are indeed the most cost efficient because they define the best-practice technology
frontier and best allocate their costs among different inputs. Their advantages in XE offset the extant
scale inefficiencies (scale diseconomies). Small reinsurers are also able to exploit the best-practice
technologies (Sui & Baum, 2014); albeit not to an extent sufficient to offset the inefficiencies in terms
of scale and cost allocation. The superior PTE of some small reinsurers may result from their
expertise in special segments (a focused strategy), which we will test in a later section of this paper.
With respect to the control variables, there is a positive correlation between leverage and efficiency,
and no significant correlation between firm affiliation type and efficiency. Reinsurers based in
Western Continental Europe, the world reinsurance center, are more cost efficient than reinsurers in
most of the other regions.
In addition to the standard DEA second-stage regressions, we employ the Granger causality test to
show whether a reinsurer’s scale drives cost efficiency (Berger & DeYoung, 1997; Casu & Girardone,
2009) or vice versa. The use of Granger causality tests is an innovative approach in insurance frontier
efficiency analyses. Based on Equation (2), we test the null hypothesis (H.A0) that size does not
Granger cause higher efficiency, i.e., β1,1 = β1,2 = ⋯ = β1,n = 0. Based on Equation (3), we test for
reverse causality (H.B0), i.e., efficiency does not Granger cause greater size, i.e., β3,1 = β3,2 = ⋯ =
β3,n = 0 . We perform nested F-tests for each regression with n=1,2,…8 and show the resulting p-
values in Table 6, where n represents the number of lagged Size and CE variables included in the
equations, respectively. The results reject H.A0 for all n except n=8 at the 95% confidence level and
accept H.B0 for all n.20 Therefore, we conclude that size Granger causes greater cost efficiency.
𝐶𝐸𝑖,𝑐 = 𝛽0 + ∑𝛽1,𝑐𝑆𝐸𝑆𝑛𝑖,𝑐−𝑐 + 𝛽2𝐶𝐶𝐶𝐶𝐶𝑛𝐸𝑡𝑛𝑖 + 𝛽3𝐶𝐶𝑛𝐶𝐶𝐶𝐶𝑛𝐶𝐶𝑡𝑛𝑖 + ∑𝛽3,𝑐𝐶𝐸𝑖,𝑐−𝑐 + 𝛽𝑗𝑋𝑖,𝑐 + 𝜀𝑖,𝑐 (2)
𝑆𝐸𝑆𝑛𝑖,𝑐 = 𝛽0 + ∑𝛽1,𝑐𝑆𝐸𝑆𝑛𝑖,𝑐−𝑐 + 𝛽2𝐶𝐶𝐶𝐶𝐶𝑛𝐸𝑡𝑛𝑖 + 𝛽3𝐶𝐶𝑛𝐶𝐶𝐶𝐶𝑛𝐶𝐶𝑡𝑛𝑖 + ∑𝛽3,𝑐𝐶𝐸𝑖,𝑐−𝑐 + 𝛽𝑗𝑋𝑖,𝑐 + 𝜀𝑖,𝑐 (3)
20 We consider the optimal lag length for both equations by using the AIC/BIC criteria. The results
suggest that AIC/BIC is minimized at n=1 for Equation 2 and at n=2 for Equation 3.

18
Table 6 Granger causality test for size-CE relationship n=1 n=2 n=3 n=4 n=5 n=6 n=7 n=8 P-Values of Nested F-Tests H.A0 in Equation (2) 0.000 0.002 0.050 0.003 0.003 0.101 0.050 0.204 H.B0 in Equation (3) 0.678 0.355 0.322 0.343 0.234 0.549 0.753 0.231 Number of observations 706 586 474 373 289 214 149 108
4.4 Economies of Scope
We follow an approach similar to that of Cummins et al. (2010) in assessing the scope impact on
efficiencies so as to make inferences about economies of scope.21 The results in Columns 9 and 10 of
Table 5 show that product diversification, both composite (life/nonlife) and conglomerate (primary-
/reinsurance), does not have a significant impact on reinsurer cost efficiency. However, the results in
Columns 5 to 8 suggest that composite strategies (i.e., underwriting both life and nonlife business)
increase the difficulty of cost allocation of multiple inputs, and thus decrease AE as well as XE.
We further examine economies of scope for different sizes of reinsurers (Berger et al., 2000) by
sorting our sample into small, medium, and large reinsurers as in Table 2. We focus on X-efficiency,
which excludes economies of scale and thus allows assessing the pure economies of scope (Cummins
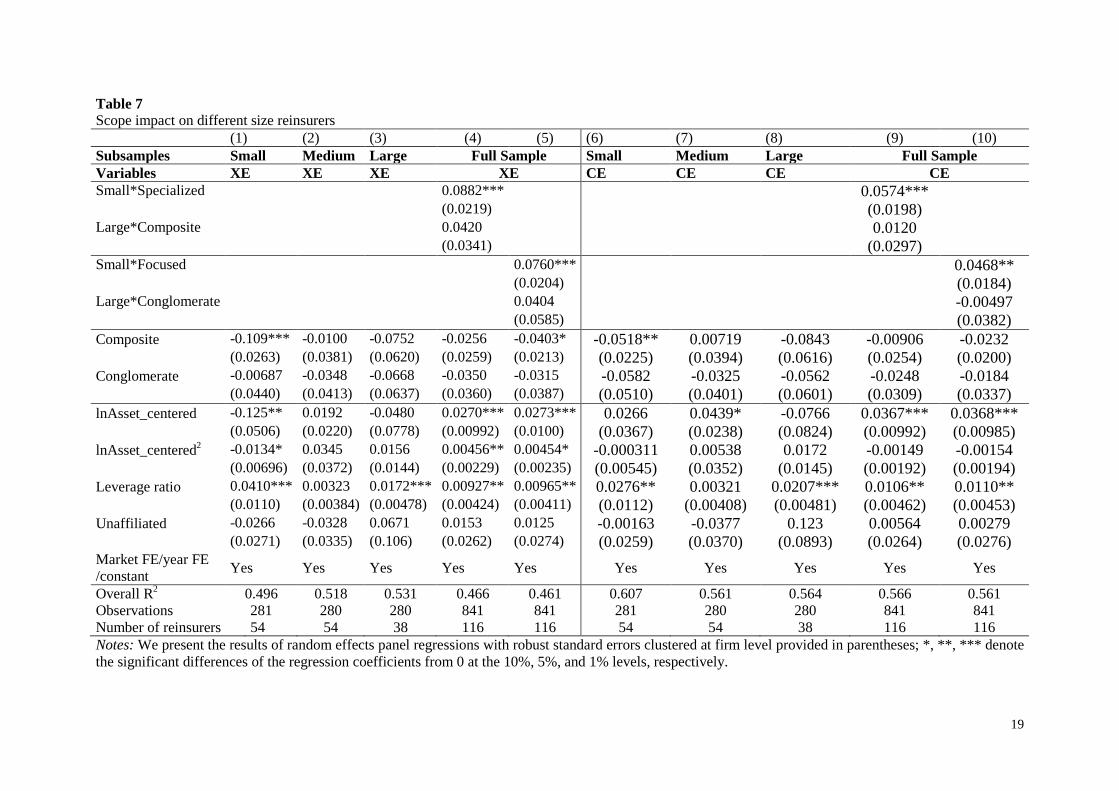
et al., 2010). The results in Column 1 (Column 6) of Table 7 suggest that the negative impact of
product diversification on XE (CE) only holds for small reinsurers, for which specialized strategies
are more X-efficient (cost-efficient) than composite strategies. The observation supports Hypothesis
2A in the sense that small reinsurers are better off when specialized (Sui & Baum, 2014). The results
in Columns 2, 3, 7, and 8 show that for medium and large reinsurers, the impact of product
diversification is insignificant. Alternatively, we test Hypothesis 2A by adding dummy indicators for
small-specialized and large-diversified reinsurers, as shown in Columns 4 and 5 (Column 9 and 10) of
Table 7. The results confirm that small specialized reinsurers are more X-efficient (cost-efficient);
neither analysis finds any particular X-efficiency (cost-efficiency) advantage for large diversified
reinsurers. These observations explain why both specialized and diversified reinsurers can co-exist in
the global reinsurance market.
21 An alternative way of analyzing economies of scope is to show that the cost of jointly producing multiple
outputs is smaller than the cost of separately producing these outputs (Berger et al., 2000). We cannot adopt this approach because our data do not allow separating the separation of losses from life insurance from those of nonlife business, nor the losses from primary insurance from those of reinsurance. This approach furthermore requires specifying a cost function, providing significant room for model misspecification risk.
19
Table 7 Scope impact on different size reinsurers (1) (2) (3) (4) (5) (6) (7) (8) (9) (10) Subsamples Small Medium Large Full Sample Small Medium Large Full Sample Variables XE XE XE XE CE CE CE CE Small*Specialized 0.0882*** 0.0574*** (0.0219) (0.0198) Large*Composite 0.0420 0.0120 (0.0341) (0.0297) Small*Focused 0.0760*** 0.0468** (0.0204) (0.0184) Large*Conglomerate 0.0404 -0.00497 (0.0585) (0.0382) Composite -0.109*** -0.0100 -0.0752 -0.0256 -0.0403* -0.0518** 0.00719 -0.0843 -0.00906 -0.0232 (0.0263) (0.0381) (0.0620) (0.0259) (0.0213) (0.0225) (0.0394) (0.0616) (0.0254) (0.0200) Conglomerate -0.00687 -0.0348 -0.0668 -0.0350 -0.0315 -0.0582 -0.0325 -0.0562 -0.0248 -0.0184 (0.0440) (0.0413) (0.0637) (0.0360) (0.0387) (0.0510) (0.0401) (0.0601) (0.0309) (0.0337) lnAsset_centered -0.125** 0.0192 -0.0480 0.0270*** 0.0273*** 0.0266 0.0439* -0.0766 0.0367*** 0.0368*** (0.0506) (0.0220) (0.0778) (0.00992) (0.0100) (0.0367) (0.0238) (0.0824) (0.00992) (0.00985) lnAsset_centered2 -0.0134* 0.0345 0.0156 0.00456** 0.00454* -0.000311 0.00538 0.0172 -0.00149 -0.00154 (0.00696) (0.0372) (0.0144) (0.00229) (0.00235) (0.00545) (0.0352) (0.0145) (0.00192) (0.00194) Leverage ratio 0.0410*** 0.00323 0.0172*** 0.00927** 0.00965** 0.0276** 0.00321 0.0207*** 0.0106** 0.0110** (0.0110) (0.00384) (0.00478) (0.00424) (0.00411) (0.0112) (0.00408) (0.00481) (0.00462) (0.00453) Unaffiliated -0.0266 -0.0328 0.0671 0.0153 0.0125 -0.00163 -0.0377 0.123 0.00564 0.00279 (0.0271) (0.0335) (0.106) (0.0262) (0.0274) (0.0259) (0.0370) (0.0893) (0.0264) (0.0276) Market FE/year FE /constant Yes Yes Yes Yes Yes Yes Yes Yes Yes Yes
Overall R2 0.496 0.518 0.531 0.466 0.461 0.607 0.561 0.564 0.566 0.561 Observations 281 280 280 841 841 281 280 280 841 841 Number of reinsurers 54 54 38 116 116 54 54 38 116 116 Notes: We present the results of random effects panel regressions with robust standard errors clustered at firm level provided in parentheses; *, **, *** denote the significant differences of the regression coefficients from 0 at the 10%, 5%, and 1% levels, respectively.
20
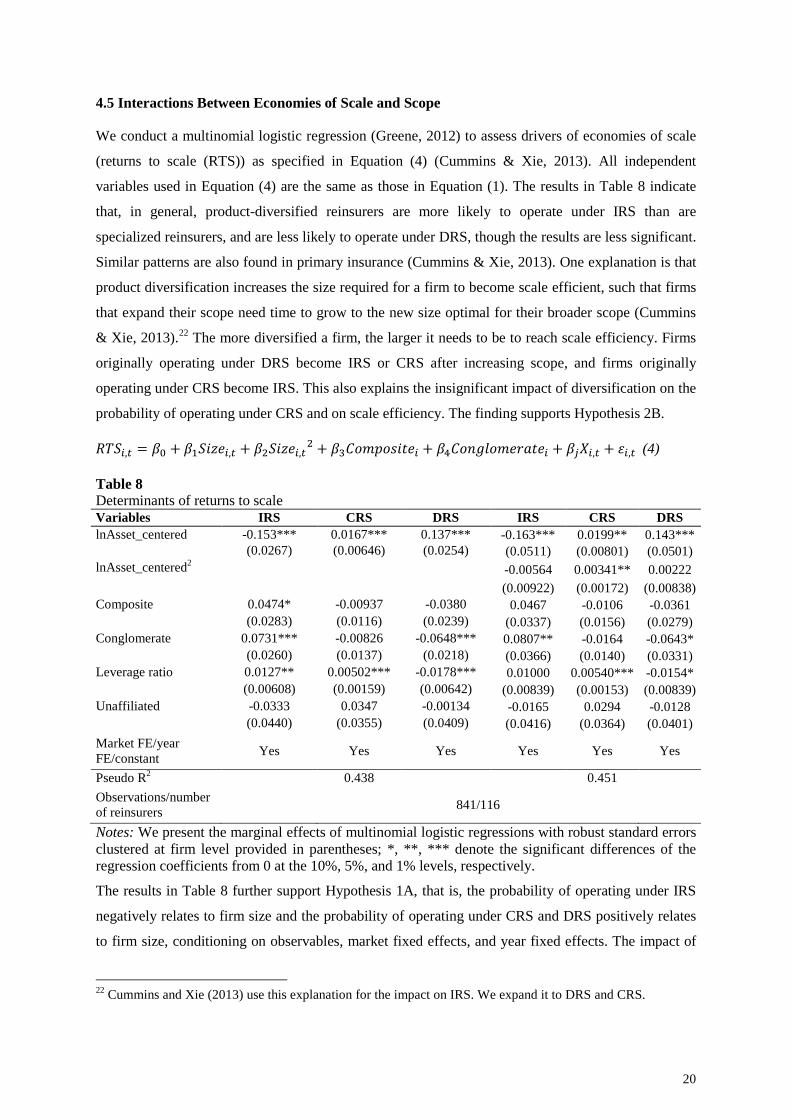
4.5 Interactions Between Economies of Scale and Scope
We conduct a multinomial logistic regression (Greene, 2012) to assess drivers of economies of scale
(returns to scale (RTS)) as specified in Equation (4) (Cummins & Xie, 2013). All independent
variables used in Equation (4) are the same as those in Equation (1). The results in Table 8 indicate
that, in general, product-diversified reinsurers are more likely to operate under IRS than are
specialized reinsurers, and are less likely to operate under DRS, though the results are less significant.
Similar patterns are also found in primary insurance (Cummins & Xie, 2013). One explanation is that
product diversification increases the size required for a firm to become scale efficient, such that firms
that expand their scope need time to grow to the new size optimal for their broader scope (Cummins
& Xie, 2013).22 The more diversified a firm, the larger it needs to be to reach scale efficiency. Firms
originally operating under DRS become IRS or CRS after increasing scope, and firms originally
operating under CRS become IRS. This also explains the insignificant impact of diversification on the
probability of operating under CRS and on scale efficiency. The finding supports Hypothesis 2B.
𝑅𝑅𝑆𝑖,𝑐 = 𝛽0 + 𝛽1𝑆𝐸𝑆𝑛𝑖,𝑐 + 𝛽2𝑆𝐸𝑆𝑛𝑖,𝑐2 + 𝛽3𝐶𝐶𝐶𝐶𝐶𝑛𝐸𝑡𝑛𝑖 + 𝛽4𝐶𝐶𝑛𝐶𝐶𝐶𝐶𝑛𝐶𝐶𝑡𝑛𝑖 + 𝛽𝑗𝑋𝑖,𝑐 + 𝜀𝑖,𝑐 (4)
Table 8 Determinants of returns to scale Variables IRS CRS DRS IRS CRS DRS lnAsset_centered -0.153*** 0.0167*** 0.137*** -0.163*** 0.0199** 0.143*** (0.0267) (0.00646) (0.0254) (0.0511) (0.00801) (0.0501) lnAsset_centered2 -0.00564 0.00341** 0.00222 (0.00922) (0.00172) (0.00838) Composite 0.0474* -0.00937 -0.0380 0.0467 -0.0106 -0.0361 (0.0283) (0.0116) (0.0239) (0.0337) (0.0156) (0.0279) Conglomerate 0.0731*** -0.00826 -0.0648*** 0.0807** -0.0164 -0.0643* (0.0260) (0.0137) (0.0218) (0.0366) (0.0140) (0.0331) Leverage ratio 0.0127** 0.00502*** -0.0178*** 0.01000 0.00540*** -0.0154* (0.00608) (0.00159) (0.00642) (0.00839) (0.00153) (0.00839) Unaffiliated -0.0333 0.0347 -0.00134 -0.0165 0.0294 -0.0128 (0.0440) (0.0355) (0.0409) (0.0416) (0.0364) (0.0401) Market FE/year FE/constant Yes Yes Yes Yes Yes Yes
Pseudo R2 0.438 0.451 Observations/number of reinsurers 841/116
Notes: We present the marginal effects of multinomial logistic regressions with robust standard errors clustered at firm level provided in parentheses; *, **, *** denote the significant differences of the regression coefficients from 0 at the 10%, 5%, and 1% levels, respectively.
The results in Table 8 further support Hypothesis 1A, that is, the probability of operating under IRS
negatively relates to firm size and the probability of operating under CRS and DRS positively relates
to firm size, conditioning on observables, market fixed effects, and year fixed effects. The impact of
22 Cummins and Xie (2013) use this explanation for the impact on IRS. We expand it to DRS and CRS.

21
size on the probability of operating under DRS is significantly larger than its impact on CRS, subject
to a T-test.
Based on the above findings, we argue that the scope and scale of a reinsurer’s operation need to be
compatible with each other in order for the firm to be efficient. Our findings do not support Borch’s
(1962) prediction that full diversification is optimal for all types of reinsurers. We show, however,
that significant cost scope diseconomies prevent small reinsurers from reaching full diversification.
4.4 Efficient Structure
Following Berry-Stoelzle et al. (2011), Choi and Weiss (2005), and Weiss and Choi (2008), we
estimate reinsurers’ price and underwriting profit based on the model in Equations (5a) and (5b). We
measure the reinsurance unit price as the inverse of the smoothed loss ratio (for detailed discussions
on defining insurance price, see Cummins & Danzon, 1997; Winter, 1994). The underwriting profit is
defined as one minus the smoothed loss ratio minus the expense ratio (Choi & Weiss, 2005; Weiss &
Choi, 2008). We use ROE to measure the overall profitability of a reinsurer. CE, SE, and XE
approximate firm efficiency. Other independent variables include the market share of each firm in a
given year, the reinsurance market growth rate per year, and the market concentration, measured by
the market shares of the 10 largest reinsurers in respective years. X is a series of control variables,
including leverage ratio, affiliation status, headquarter location dummies (market fixed effects).
Different from Equation (1) and (4), year dummies are not included in Equation (5) due to the
multicollinearity with market growth and market concentration.23
𝑃𝐶𝐸𝐸𝑛𝑖,𝑐 = 𝛽0 + 𝛽1𝐸𝐸𝐸𝐸𝐸𝐸𝑛𝑛𝐸𝑦𝑖,𝑐 + 𝛽2𝑀𝐶𝐶𝑀𝑛𝑡𝑆ℎ𝐶𝐶𝑛𝑖,𝑐 + 𝛽3𝑀𝐶𝐶𝑀𝑛𝑡𝐶𝐶𝑛𝐸𝑛𝑛𝑡𝐶𝐶𝑡𝐸𝐶𝑛𝑐 +
𝛽4𝑀𝐶𝐶𝑀𝑛𝑡𝑀𝐶𝐶𝑀𝑡ℎ𝑐 + 𝛽𝑗𝑋𝑖,𝑐 + 𝜀𝑖,𝑐 (5a)
𝑃𝐶𝐶𝐸𝐸𝑡𝑖,𝑐 = 𝛽0 + 𝛽1𝐸𝐸𝐸𝐸𝐸𝐸𝑛𝑛𝐸𝑦𝑖,𝑐 + 𝛽2𝑀𝐶𝐶𝑀𝑛𝑡𝑆ℎ𝐶𝐶𝑛𝑖,𝑐 + 𝛽3𝑀𝐶𝐶𝑀𝑛𝑡𝐶𝐶𝑛𝐸𝑛𝑛𝑡𝐶𝐶𝑡𝐸𝐶𝑛𝑐 +
𝛽4𝑀𝐶𝐶𝑀𝑛𝑡𝑀𝐶𝐶𝑀𝑡ℎ𝑐 + 𝛽𝑗𝑋𝑖,𝑐 + 𝜀𝑖,𝑐 (5b)
Three alternative theories offer explanations for the market structure. A negative price efficiency
correlation and a positive profit efficiency correlation support the ES hypothesis. Positive correlations
between market share, price, and profit support the relative market power (RMP) hypothesis. 24
Positive correlations between market concentration, price, and profit support the structure-conduct-
performance (SCP) hypothesis25 (Choi & Weiss, 2005; Weiss & Choi, 2008).
23 We examine multicollinearity by estimating VIFs of each independent variable in Equations (1) to (5). All
values are below 5, suggesting that multicollinearity is not much of a problem. 24 The RMP assumes that consumers rely on a firm’s position in the market as an indicator of quality, thus
predicting that larger firms have market power simply by virtue of their position in the market, which allows them to earn rents (Rhoades, 1985).
25 The SCP suggests that market concentration may foster collusion among firms in the market. Higher concentration lowers the cost of collusion, resulting in monopoly rents (Weiss, 1974).
22
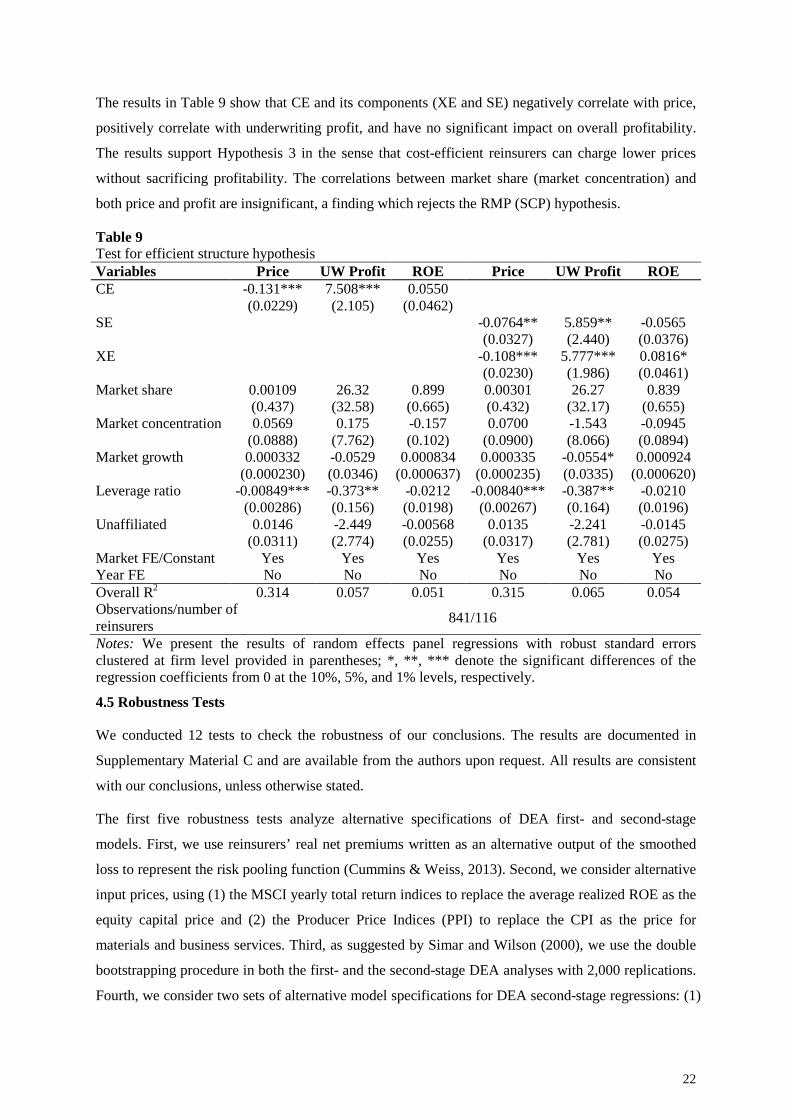
The results in Table 9 show that CE and its components (XE and SE) negatively correlate with price,
positively correlate with underwriting profit, and have no significant impact on overall profitability.
The results support Hypothesis 3 in the sense that cost-efficient reinsurers can charge lower prices
without sacrificing profitability. The correlations between market share (market concentration) and
both price and profit are insignificant, a finding which rejects the RMP (SCP) hypothesis.
Table 9 Test for efficient structure hypothesis Variables Price UW Profit ROE Price UW Profit ROE CE -0.131*** 7.508*** 0.0550 (0.0229) (2.105) (0.0462) SE -0.0764** 5.859** -0.0565 (0.0327) (2.440) (0.0376) XE -0.108*** 5.777*** 0.0816* (0.0230) (1.986) (0.0461) Market share 0.00109 26.32 0.899 0.00301 26.27 0.839 (0.437) (32.58) (0.665) (0.432) (32.17) (0.655) Market concentration 0.0569 0.175 -0.157 0.0700 -1.543 -0.0945 (0.0888) (7.762) (0.102) (0.0900) (8.066) (0.0894) Market growth 0.000332 -0.0529 0.000834 0.000335 -0.0554* 0.000924 (0.000230) (0.0346) (0.000637) (0.000235) (0.0335) (0.000620) Leverage ratio -0.00849*** -0.373** -0.0212 -0.00840*** -0.387** -0.0210 (0.00286) (0.156) (0.0198) (0.00267) (0.164) (0.0196) Unaffiliated 0.0146 -2.449 -0.00568 0.0135 -2.241 -0.0145
(0.0311) (2.774) (0.0255) (0.0317) (2.781) (0.0275) Market FE/Constant Yes Yes Yes Yes Yes Yes Year FE No No No No No No Overall R2 0.314 0.057 0.051 0.315 0.065 0.054 Observations/number of reinsurers 841/116
Notes: We present the results of random effects panel regressions with robust standard errors clustered at firm level provided in parentheses; *, **, *** denote the significant differences of the regression coefficients from 0 at the 10%, 5%, and 1% levels, respectively.
4.5 Robustness Tests
We conducted 12 tests to check the robustness of our conclusions. The results are documented in
Supplementary Material C and are available from the authors upon request. All results are consistent
with our conclusions, unless otherwise stated.
The first five robustness tests analyze alternative specifications of DEA first- and second-stage
models. First, we use reinsurers’ real net premiums written as an alternative output of the smoothed
loss to represent the risk pooling function (Cummins & Weiss, 2013). Second, we consider alternative
input prices, using (1) the MSCI yearly total return indices to replace the average realized ROE as the
equity capital price and (2) the Producer Price Indices (PPI) to replace the CPI as the price for
materials and business services. Third, as suggested by Simar and Wilson (2000), we use the double
bootstrapping procedure in both the first- and the second-stage DEA analyses with 2,000 replications.
Fourth, we consider two sets of alternative model specifications for DEA second-stage regressions: (1)
23
the truncated regression, proposed by Simar and Wilson (2007), and (2) the Tobit regression. Fifth,
we use firm and year fixed effects models to replace the random effects models (with market and year
dummies) for DEA second-stage regressions. Thus we omit time-invariant variables, for example,
firm affiliation status and market fixed effects.
Robustness tests 6 to 9 are alternative analyses of Hypothesis 1. First, we take the top 10% scale-
efficient firms in each year and then obtain the 25th and 75th percentiles of total assets in each year in
robustness test 6. Similar to the firm-year pooled analyses in Table 4, we obtain an optimal asset
range of USD 5.8 to 14.5 billion (inflation adjusted at 2012), which is slightly narrower than the
optimal range obtained previously. Second, we separate our sample into two time periods, i.e., before
the financial crisis (2002–2007) and after (2008–2012). The decile and vigintile analyses, similar to
those in Table 4, suggest that there is no structural change regarding optimal size range before and
after the financial crisis. Third, we separate our sample by region into mature markets (West
Continental Europe, London, Bermuda, North America, and Asia Developed) and emerging markets
(Africa, Asia Emerging, Eastern Europe, Latin America, and Middle East). The decile and vigintile
analyses suggest that in emerging markets, the most cost-efficient reinsurers are concentrated in a
smaller total asset range (between USD 4.3 and 7.6 billion) and that all reinsurers with total assets
above USD 7.6 billion operate under DRS. Mature markets demonstrate a pattern similar to that of the
global market (see Table 4). The superior management expertise and underwriting experience of
reinsurers based in mature markets may enable them to manage large and globalized firms more
efficiently, thus explaining the difference between emerging and mature markets. These analyses
confirm the robustness of our optimal asset range of between USD 2.9 and 15.5 billion. Fourth, we
use reinsurers’ net premiums written to replace total assets as the size measure and test Hypothesis 1.
The results suggest that there is an optimal size range between USD 0.91 to 3.65 billion in net
premiums written (inflation adjusted at 2012). Our results are comparable to the optimal premium
income range USD 2.3 to 4.9 billion found for multinational primary insurers (Katrishen & Scordis,
1998). 26 The analyses of efficiency determinants again confirm the inverse-U shaped size-SE
relationship and the positive and linear size-CE relationship.
Regarding Hypothesis 3, we use the actual loss ratio to replace the smoothed loss ratio when
calculating the reinsurance price and the underwriting profit ratio (robustness test 10). Since the actual
loss ratio is very volatile in reinsurance, we only use values within the 5th and 95th percentiles in
conducting the test. The results support the efficient structure hypothesis but not the alternative RMP
and SCP hypotheses. In robustness test 11, a firm and year fixed effects model is employed to test
26 Katrishen and Scordis (1998) focus on multinational primary insurers, apply a different empirical approach to
identify economies of scale, and investigate a different sample period. The results thus are not fully comparable.
24
Hypothesis 3, in which we would have to omit all time invariant independent variables. Last, in
robustness test 12, we use a subsample that includes only the observations without missing values. We
do this because missing values for the number of employees were imputed for some data points in our
core models. We generate a new set of DEA efficiency scores and re-perform all DEA second-stage
regressions.
5. CONCLUSIONS
Our paper contributes to the international business and insurance literature by making four original
conclusions. (1) Scale-efficient reinsurers exhibit an optimal size range between USD 2.9 and 15.5
billion in total assets, beyond which the scale economies are exhausted. These thresholds are larger
than those found for the primary insurance market or other service industries. (2) The high cost-
efficiency levels of large reinsurers are driven by their size. (3) A strategic focus strategy is
appropriate for small reinsurers, whereas product diversification requires larger firm size. (4) Cost-
efficient reinsurers can charge lower prices, while still achieve high underwriting profits. Our results
provide new insights into the effects of economies of scale and scope on the global reinsurance
market structure. The overall cost efficiency of large reinsurers explains their dominating position in
the global market (Outreville, 2012b). The efficiency of small and specialized reinsurers and the
absence of an impact of scope on medium and large reinsurers explain why both product-diversified
and specialized firms appear to be competitively viable in the long run (Berger et al., 2000). These
results are important not only for the reinsurance industry, but also for other financial services firms
where complex interactions between scale, scope, and cost efficiency are present (for similar
interactions in the banking market, see, e.g., Berger, Hanweck, & Humphrey, 1987).
Our findings have both macro policy and micro practice implications. Further consolidation is
expected in the global reinsurance market, not only because it potentially improves cost efficiency,
but also because it has the potential to lower reinsurance prices for consumers. Therefore,
policymakers should be cautious about adopting anti-concentration measures in the global reinsurance
market, as doing so may have the unintended consequence of raising the price of reinsurance and
reducing industry cost efficiency. However, from the micro firm-level point of view, consolidation is
not without its drawbacks, especially when considering limitations in economies of scale. Although
scale diseconomies are offset by advantages in X-efficiency for the largest reinsurers, they become
more problematic with further growth of those largest reinsurers. At this point, we cannot guarantee
that technology and management progresses will adapt sufficiently fast enough to offset greater scale
diseconomies in future consolidation. Thus, we do not argue for a natural monopoly in the global
reinsurance market; rather, we suggest careful evaluation of the tradeoffs between scale diseconomies
and potential gains in X-efficiency, especially for reinsurers already bigger than the optimal size range,
when considering further merger and acquisition opportunities. Reinsurers should also be careful
when evaluating conglomerate versus focused strategies. Specifically, small reinsurers need to be

25
cautious about product diversification (i.e., adding life to nonlife business or vice versa) as doing so
could significantly reduce cost efficiency.
The empirical research on global reinsurance markets is far from conclusive. Future research may
provide more detailed guidance to reinsurers and policymakers as to, for example, which inputs
(outputs) reinsurers can reduce (increase) to be more cost efficient. The impact of geographic and
international diversification is also under-researched, due to data limitations. The inefficiencies of
certain firms are not fully explained by firm-specific characteristics. The literature suggests that tax
and/or other regulatory differences may play an important role in the presence of inefficiencies
(Garven & Louberge, 1996), providing yet another fruitful direction for empirical investigation.
REFERENCES
A.M. Best. 2002–2012. Best’s Insurance Reports, databases version 2007, 2010, and 2013.
A.M. Best. 2013. Global Reinsurance Segment Review: The Capital Challenge.
http://www.bestweek.com/europe/promo/GlobalReinsurance.pdf.
Aly, H. Y., Grabowski, R., Pasurka, C., & Rangan, N. 1990. Technical, scale, and allocative
efficiencies in US banking: An empirical investigation. Review of Economics and Statistics, 72(2):
211–218.
Atici, K. B., & Podinovski, V. V. 2015. Using data envelopment analysis for the assessment of
technical efficiency of units with different specialisations: An application to
agriculture. Omega, 54: 72–83.
Beaver, W. H., McNichols, M. F., & Nelson, K. K. 2003. Management of the loss reserve accrual and
the distribution of earnings in the property-casualty insurance industry. Journal of Accounting and
Economics, 35(3): 347–376.
Berger, A. N., & DeYoung, R. 1997. Problem loans and cost efficiency in commercial banks. Journal
of Banking & Finance, 21(6): 849–870.
Berger, A. N., & Humphrey, D. B. 1991. The dominance of inefficiencies over scale and product mix
economies in banking. Journal of Monetary Economics, 28(1): 117–148.
Berger, A. N., Cummins, J. D., Weiss, M. A., & Zi, H. 2000. Conglomeration versus strategic focus:
Evidence from the insurance industry. Journal of Financial Intermediation, 9(4): 323–362.
Berger, A. N., Hanweck, G. A., & Humphrey, D. B. 1987. Competitive viability in banking: Scale,
scope, and product mix economies. Journal of Monetary Economics, 20(3): 501–520.
Bernard, C. 2013. Risk sharing and pricing in the reinsurance market. Handbook of Insurance, pp.
603-626. New York, NY: Springer.
Berry-Stölzle, T. R., Weiss, M. A., & Wende, S. 2011. Market structure, efficiency, and performance
in the European property-liability insurance industry. Working paper, Temple University.
Bikker, J. A., & Gorter, J. 2011. Restructuring of the Dutch nonlife insurance industry: Consolidation,
organizational form, and focus. Journal of Risk and Insurance, 78(1): 163–184.

26
Borch, K. 1960. The safety loading of reinsurance premiums. Scandinavian Actuarial Journal, 3–4:
163–184.
Borch, K. 1962. Equilibrium in a reinsurance market. Econometrica, 30(3): 424–444.
Butt, M. 2007. Insurance, finance, Solvency II and financial market interaction. Geneva Papers on
Risk and Insurance: Issues and Practice, 32(1): 42–45.
Casu, B., & Girardone, C. 2009. Testing the relationship between competition and efficiency in
banking: A panel data analysis. Economics Letters, 105(1): 134–137.
Caves, D. W., Christensen, L. R., & Diewert, W. E. 1982. The economic theory of index numbers and
the measurement of input, output, and productivity. Econometrica, 50(6): 1393–1414.
Chen, Y., & Hamwi, I. S. 2000. Performance analyses of US property-liability reinsurance
companies. Journal of Insurance Issues, 23(2): 140–152.
Choi, B. P., & Weiss, M. A. 2005. An empirical investigation of market structure, efficiency, and
performance in property‐liability insurance. Journal of Risk and Insurance, 72(4): 635–673.
Clark, J. A. 1988. Economies of scale and scope at depository financial institutions: A review of the
literature. Economic Review, 73(8): 17–33.
Cole, C. R., & McCullough, K. A. 2006. A reexamination of the corporate demand for reinsurance.
Journal of Risk and Insurance, 73(1): 169–192.
Cole, C. R., & McCullough, K. A. 2008. A comparative analysis of US property and casualty
reinsurers and insurers. Risk Management and Insurance Review, 11(1): 179–207.
Cole, C. R., Lee, R. B., & McCullough, K. A. 2007. A test of the eclectic paradigm: Evidence from
the US reinsurance market. Journal of Risk and Insurance, 74(2): 493–522.
Cole, C., Ferguson, W., Lee, R., & McCullough, K. 2010. Internationalization of the reinsurance
industry: An analysis of the net exposure of reinsurers. Working paper, available at SSRN
1121136.
Cook, W. D., Liang, L., & Zhu, J. 2010. Measuring performance of two-stage network structures by
DEA: A review and future perspective. Omega, 38(6): 423–430.
Cook, W. D., Tone, K., & Zhu, J. 2014. Data envelopment analysis: Prior to choosing a model.
Omega, 44: 1–4.
Cook, W. D., & Zhu, J. 2014. Data Envelopment Analysis: A Handbook on the Modeling of Internal
Structures and Networks. Springer US.
Cummins, J. D., & Danzon, P. M. 1997. Price, financial quality, and capital flows in insurance
markets. Journal of Financial Intermediation, 6(1), 3–38.
Cummins, J. D., & Weiss, M. A. 2000. The global market for reinsurance: Consolidation, capacity,
and efficiency. Brookings-Wharton Papers on Financial Services, 3(2000): 159–209.
Cummins, J. D., & Weiss, M. A. 2009. Convergence of insurance and financial markets: Hybrid and
securitized risk‐transfer solutions. Journal of Risk and Insurance, 76(3): 493–545.
27
Cummins, J. D., & Weiss, M. A. 2013. Analyzing firm performance in the insurance industry using
frontier productivity and efficiency methods. Handbook of Insurance, pp. 795–861. New York,
NY: Springer.
Cummins, J. D., & Xie, X. 2008. Mergers and acquisitions in the US property-liability insurance
industry: Productivity and efficiency effects. Journal of Banking and Finance, 32(1): 30–55.
Cummins, J. D., & Xie, X. 2013. Efficiency, productivity, and scale economies in the US property-
liability insurance industry. Journal of Productivity Analysis, 39(2): 141–164.
Cummins, J. D., & Zi, H. 1998. Comparison of frontier efficiency methods: An application to the US
life insurance industry. Journal of Productivity Analysis, 10(2): 131–152.
Cummins, J. D., and Weiss, M. A. 2014. Systemic risk and the US insurance sector. Journal of Risk
and Insurance, 81(3): 489–528.
Cummins, J. D., Tennyson, S., & Weiss, M. A. 1999. Consolidation and efficiency in the US life
insurance industry. Journal of Banking and Finance, 23(2): 325–357.
Cummins, J. D., Weiss, M. A., & Zi, H. 1999. Organizational form and efficiency: The coexistence of
stock and mutual property-liability insurers. Management Science, 45(9): 1254–1269.
Cummins, J. D., Weiss, M. A., Xie, X., & Zi, H. 2010. Economies of scope in financial services: A
DEA efficiency analysis of the US insurance industry. Journal of Banking and Finance, 34(7):
1525–1539.
Demsetz, H. 1973. Industry structure, market rivalry, and public policy. Journal of Law and
Economics, 16(1): 1–9.
Elango, B., Ma, Y. L., & Pope, N. 2008. An investigation into the diversification-performance
relationship in the US property-liability insurance industry. Journal of Risk and Insurance, 75(3):
567–591.
Färe, R., Grosskopf, S., Lindgren, B., & Roos, P. 1992. Productivity changes in Swedish pharmacies
1980–1989: A non-parametric Malmquist approach. Journal of Productivity Analysis, 3(1–2): 85–
101.
Farrell, M. J. 1957. The measurement of productive efficiency. Journal of the Royal Statistical Society,
Series A (General): 253–290.
Frisch, R. 1964. Theory of Production. Amsterdam: Springer.
Garven, J. R., & Louberge, H. 1996. Reinsurance, taxes, and efficiency: A contingent claims model of
insurance market equilibrium. Journal of Financial Intermediation, 5(1): 74–93.
Greene, W. H. 2012. Econometric Analysis, 7th ed. Upper Saddle River, NJ: Prentice Hall.
Holzheu, T., & Lechner, R. 2007. The global reinsurance market. Handbook of international
insurance, pp. 877–902. New York, NY: Springer.
Katrishen, F. A., & Scordis, N. A. 1998. Economies of scale in services: A study of multinational
insurers. Journal of International Business Studies, 29(2): 305–323.

28
Klarner, P., & Raisch, S. 2013. Move to the beat–Rhythms of change and firm performance. Academy
of Management Journal, 56 (1), 160–184.
LaPlante, A. E., & Paradi, J. C. 2015. Evaluation of bank branch growth potential using data
envelopment analysis. Omega, 52: 33–41.
Lewellen, W. G. 1971. A pure financial rationale for the conglomerate merger. Journal of
Finance, 26(2): 521–537.
Lonkevich, D. 1995. Pricing and consolidation: Farewell to the P/C cycle? Best’s Review (Property-
casualty insurance edition), 96(5): 24–24.
Lu, W. M., Wang, W. K., & Kweh, Q. L. 2014. Intellectual capital and performance in the Chinese
life insurance industry. Omega, 42(1): 65–74.
Mansfield, E. 1970. Micro-Economics. New York, NY: Norton.
McAllister, P. H., & McManus, D. 1993. Resolving the scale efficiency puzzle in banking. Journal of
Banking and Finance, 17(2): 389–405.
Noulas, A. G., Ray, S. C., & Miller, S. M. 1990. Returns to scale and input substitution for large US
banks. Journal of Money, Credit and Banking, 22(1): 94–108.
Outreville, J. F. 2012a. A note on geographical diversification and performance of the world’s largest
reinsurance groups. Multinational Business Review, 20(4): 376–391.
Outreville, J. F. 2012b. The world’s largest reinsurance groups: A look at names, numbers and
countries from 1980 to 2010. Insurance and Risk Management, 80(1): 137–156.
Panzar, J. C., & Willig, R. D. 1977. Economies of scale in multi-output production. Quarterly Journal
of Economics, 91(3): 481–493.
Panzar, J. C., & Willig, R. D. 1981. Economies of scope. American Economic Review, 71(2): 268–272.
Park, S. C., & Xie, X., 2014. Reinsurance and systemic risk: The impact of reinsurer downgrading on
property-casualty insurers. Journal of Risk and Insurance, 81(3): 587–622.
Peltzman, S. 1977. The gains and losses from industrial concentration. Journal of Law and Economics,
20(2): 229–263.
Rhoades, S. A. 1985. Market share as a source of market power: Implications and some evidence.
Journal of Economics and Business, 37(4): 343–363.
Shephard, R. W. 1970. Theory of Cost and Production Functions, 4th ed. Princeton, NJ: Princeton
University Press.
Simar, L., & Wilson, P. W. 1999. Estimating and bootstrapping Malmquist indices. European Journal
of Operational Research, 115(3): 459–471.
Simar, L., & Wilson, P. W. 2000. A general methodology for bootstrapping in non-parametric frontier
models. Journal of Applied Statistics, 27(6): 779–802.
Simar, L., & Wilson, P. W. 2007. Estimation and inference in two-stage, semi-parametric models of
production processes. Journal of Econometrics, 136(1): 31–64.

29
Standard & Poor’s Rating Services. 2003–2013. Global Reinsurance Highlights. New York, NY:
McGraw Hill Financial.
Sui, S., & Baum, M. 2014. Internationalization strategy, firm resources and the survival of SMEs in
the export market. Journal of International Business Studies, 45(7):821-841.
Swiss Re. 2013. The Essential Guide to Reinsurance.
http://www.swissre.com/rethinking/The_essential_guide_to_reinsurance.html.
Teece, D. J. 1980. Economies of scope and the scope of the enterprise. Journal of Economic Behavior
and Organization, 1(3): 223–247.
Weiss, L. W. 1974. The concentration-profits relationship and antitrust. Industrial Concentration: The
New Learning, pp. 184–233. Boston, MA: Little, Brown.
Weiss, M. A., & Choi, B. P. 2008. State regulation and the structure, conduct, efficiency and
performance of US auto insurers. Journal of Banking and Finance, 32(1): 134–156.
Winter, R. A. 1994. The dynamics of competitive insurance markets. Journal of Financial
Intermediation, 3(4), 378–415.
Yuengert, A. M. 1993. The measurement of efficiency in life insurance: estimates of a mixed normal-
gamma error model. Journal of Banking and Finance, 17(2): 483–496.