Embed Size (px)
Citation preview
Karsten Müller
University of Warwick
THE STRUCTURE OF
CREDIT MARKETS
BoE, BHC, CEPR and CFM Workshop on Finance, Investment,
and Productivity, 15/16 December 2016
2
Ka
rste
n M
ülle
r (U
niv
ers
ity
of
Wa
rwic
k)
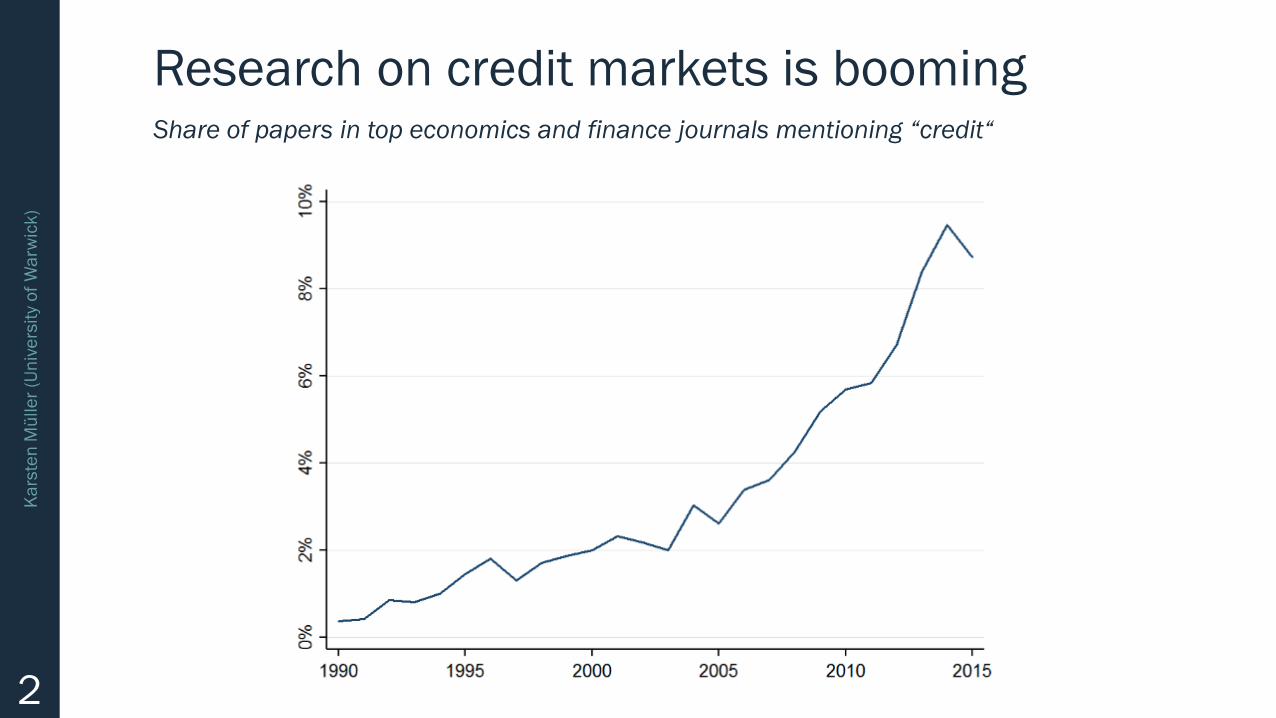
Research on credit markets is boomingShare of papers in top economics and finance journals mentioning “credit“
3
Ka
rste
n M
ülle
r (U
niv
ers
ity
of
Wa
rwic
k)
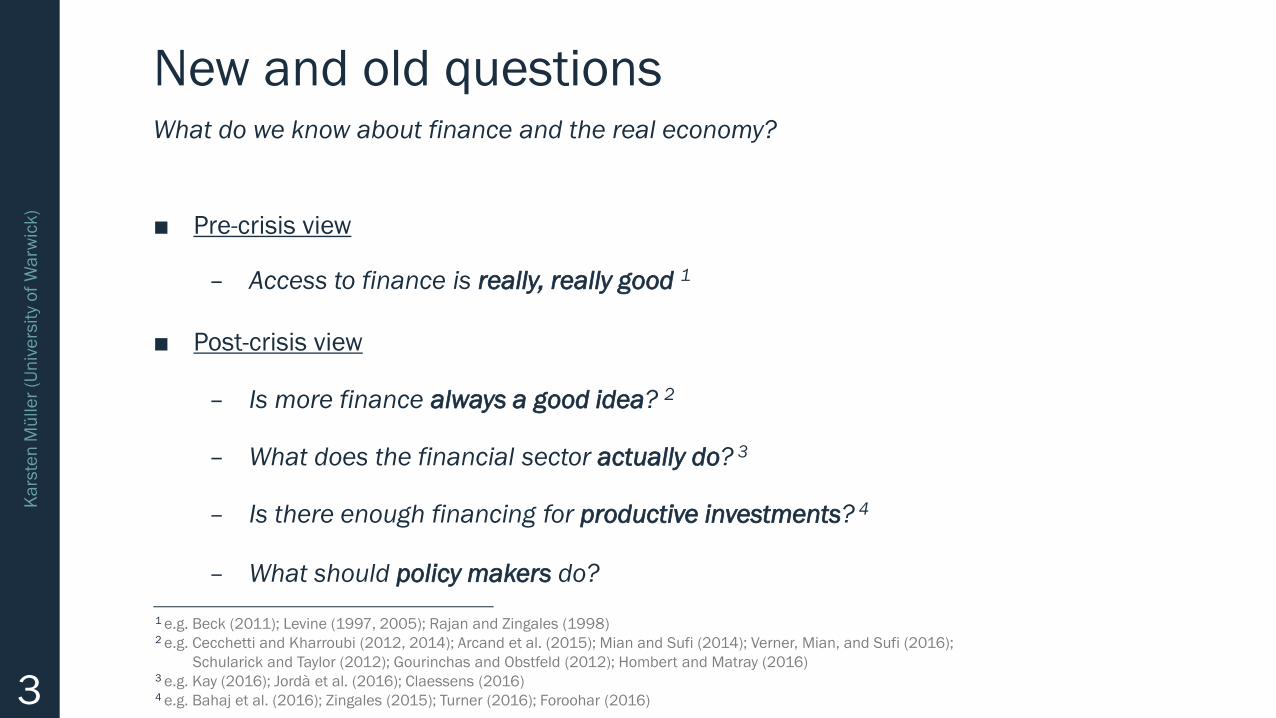
New and old questions
■ Pre-crisis view
– Access to finance is really, really good 1
■ Post-crisis view
– Is more finance always a good idea? 2
– What does the financial sector actually do? 3
– Is there enough financing for productive investments? 4
– What should policy makers do?
What do we know about finance and the real economy?
1 e.g. Beck (2011); Levine (1997, 2005); Rajan and Zingales (1998)2 e.g. Cecchetti and Kharroubi (2012, 2014); Arcand et al. (2015); Mian and Sufi (2014); Verner, Mian, and Sufi (2016);
Schularick and Taylor (2012); Gourinchas and Obstfeld (2012); Hombert and Matray (2016)3 e.g. Kay (2016); Jordà et al. (2016); Claessens (2016)4 e.g. Bahaj et al. (2016); Zingales (2015); Turner (2016); Foroohar (2016)
4
Ka
rste
n M
ülle
r (U
niv
ers
ity
of
Wa
rwic
k)
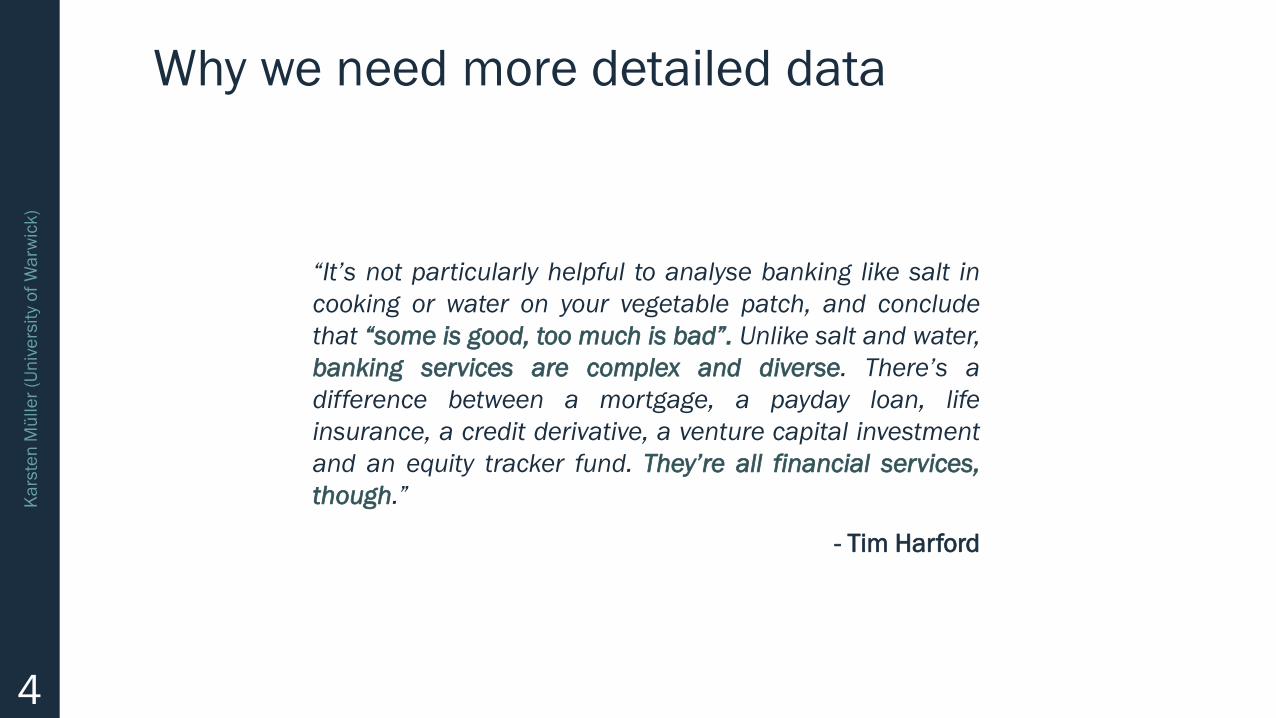
Why we need more detailed data
“It’s not particularly helpful to analyse banking like salt in
cooking or water on your vegetable patch, and conclude
that “some is good, too much is bad”. Unlike salt and water,
banking services are complex and diverse. There’s a
difference between a mortgage, a payday loan, life
insurance, a credit derivative, a venture capital investment
and an equity tracker fund. They’re all financial services,
though.”
- Tim Harford
5
Ka
rste
n M
ülle
r (U
niv
ers
ity
of
Wa
rwic
k)
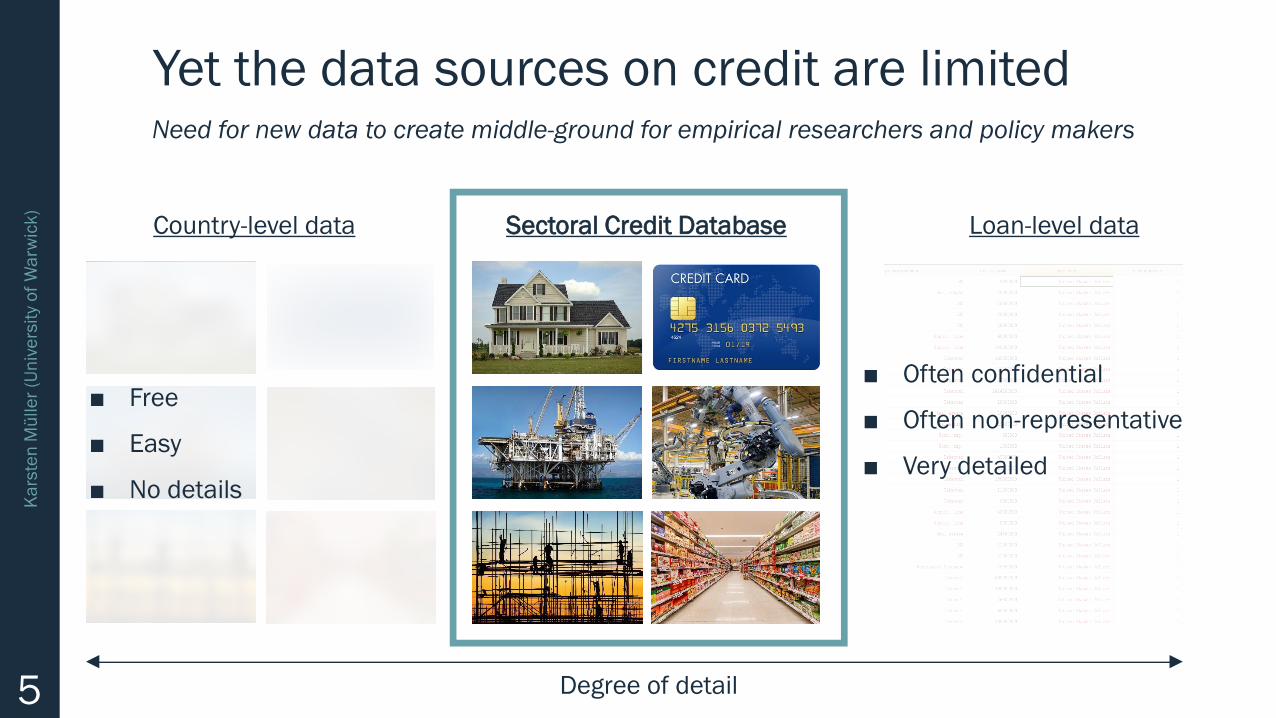
Yet the data sources on credit are limitedNeed for new data to create middle-ground for empirical researchers and policy makers
Country-level data Loan-level dataSectoral Credit Database
■ Often confidential
■ Often non-representative
■ Very detailed
Degree of detail
■ Free
■ Easy
■ No details
6
Ka
rste
n M
ülle
r (U
niv
ers
ity
of
Wa
rwic
k)
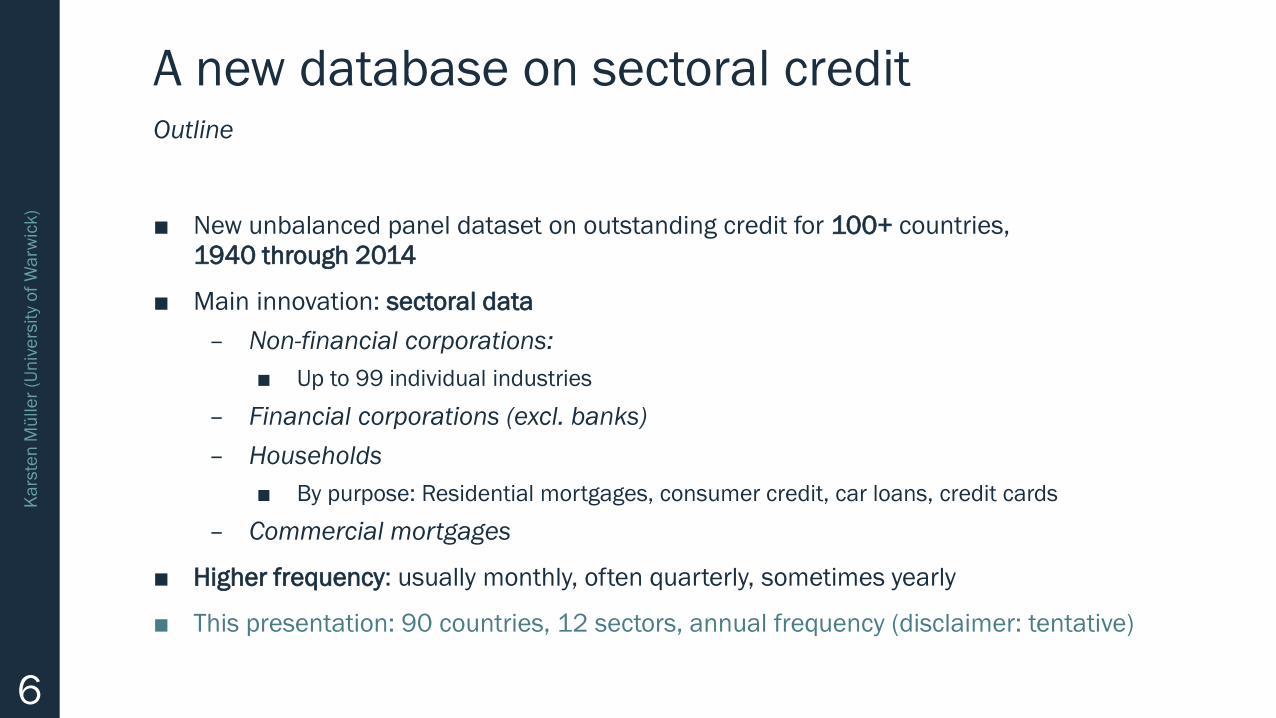
A new database on sectoral credit
■ New unbalanced panel dataset on outstanding credit for 100+ countries,
1940 through 2014
■ Main innovation: sectoral data
– Non-financial corporations:
■ Up to 99 individual industries
– Financial corporations (excl. banks)
– Households
■ By purpose: Residential mortgages, consumer credit, car loans, credit cards
– Commercial mortgages
■ Higher frequency: usually monthly, often quarterly, sometimes yearly
■ This presentation: 90 countries, 12 sectors, annual frequency (disclaimer: tentative)
Outline
7
Ka
rste
n M
ülle
r (U
niv
ers
ity
of
Wa
rwic
k)
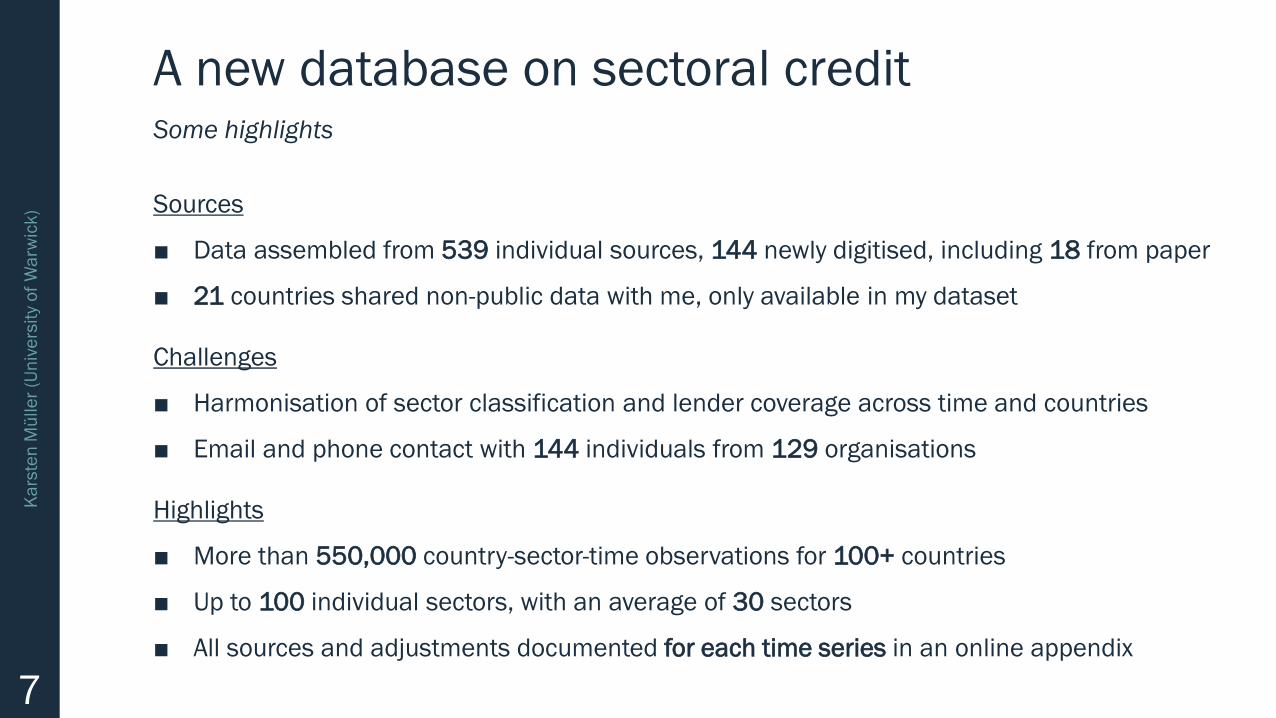
A new database on sectoral credit
Sources
■ Data assembled from 539 individual sources, 144 newly digitised, including 18 from paper
■ 21 countries shared non-public data with me, only available in my dataset
Challenges
■ Harmonisation of sector classification and lender coverage across time and countries
■ Email and phone contact with 144 individuals from 129 organisations
Highlights
■ More than 550,000 country-sector-time observations for 100+ countries
■ Up to 100 individual sectors, with an average of 30 sectors
■ All sources and adjustments documented for each time series in an online appendix
Some highlights
8
Ka
rste
n M
ülle
r (U
niv
ers
ity
of
Wa
rwic
k)
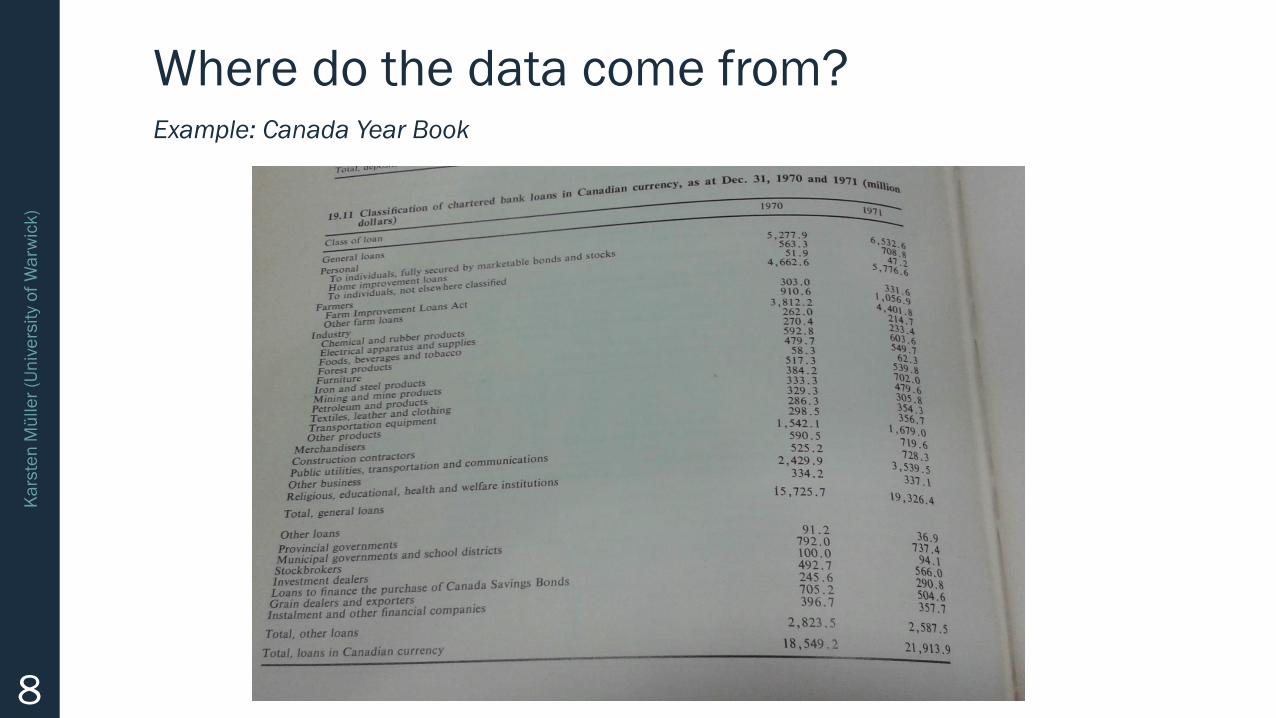
Where do the data come from?Example: Canada Year Book
9
Ka
rste
n M
ülle
r (U
niv
ers
ity
of
Wa
rwic
k)
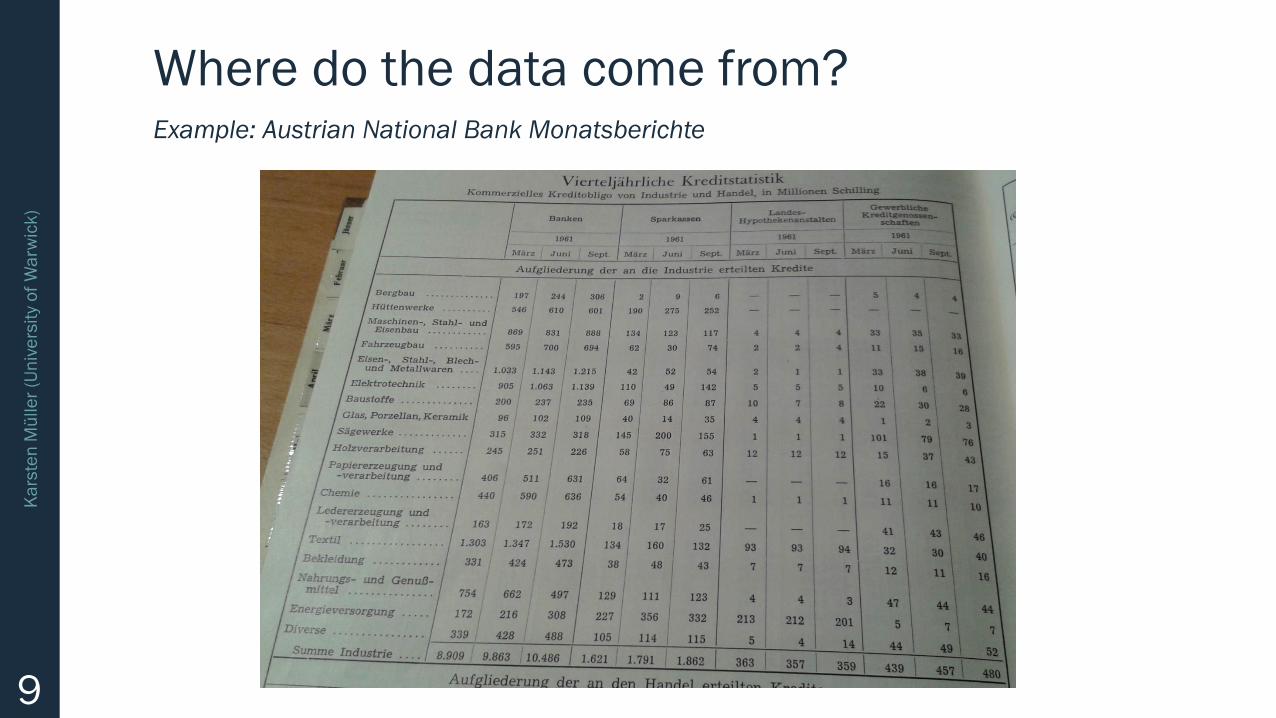
Where do the data come from?Example: Austrian National Bank Monatsberichte
10
Ka
rste
n M
ülle
r (U
niv
ers
ity
of
Wa
rwic
k)
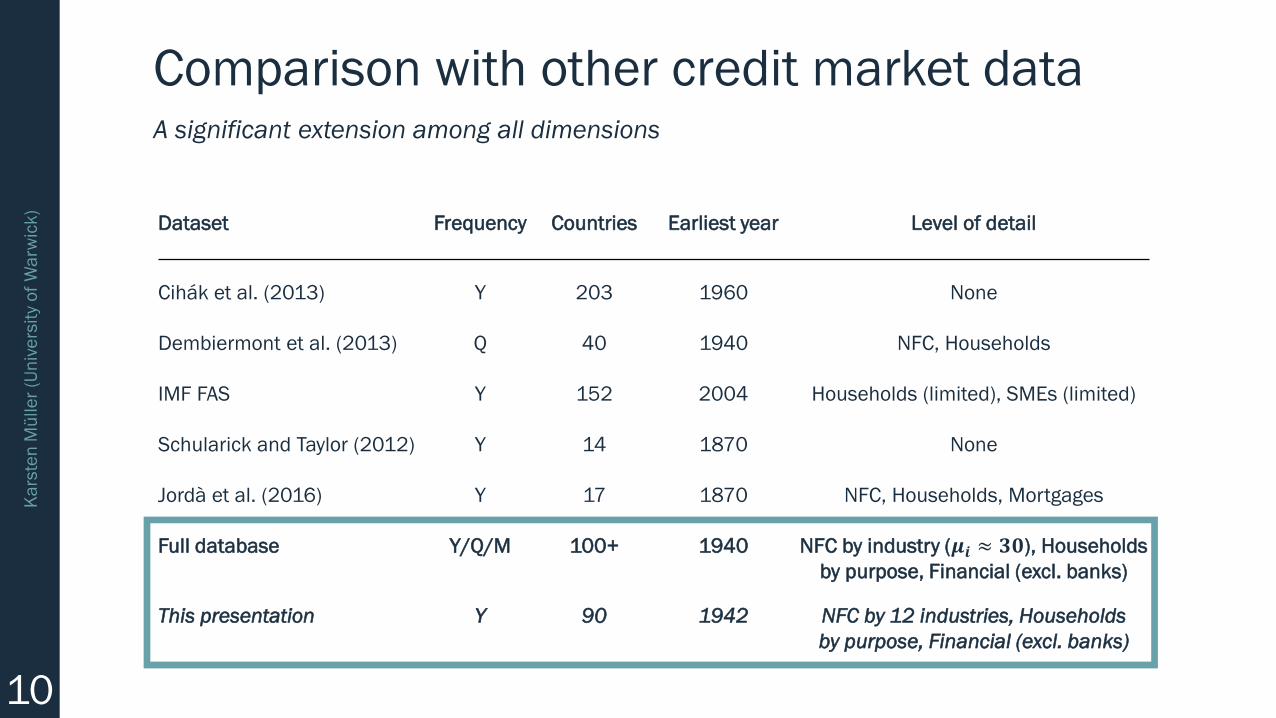
Comparison with other credit market dataA significant extension among all dimensions
Dataset Frequency Countries Earliest year Level of detail
Cihák et al. (2013) Y 203 1960 None
Dembiermont et al. (2013) Q 40 1940 NFC, Households
IMF FAS Y 152 2004 Households (limited), SMEs (limited)
Schularick and Taylor (2012) Y 14 1870 None
Jordà et al. (2016) Y 17 1870 NFC, Households, Mortgages
Full database Y/Q/M 100+ 1940 NFC by industry (𝝁𝒊 ≈ 𝟑𝟎), Households
by purpose, Financial (excl. banks)
This presentation Y 90 1942 NFC by 12 industries, Households
by purpose, Financial (excl. banks)
11
Ka
rste
n M
ülle
r (U
niv
ers
ity
of
Wa
rwic
k)
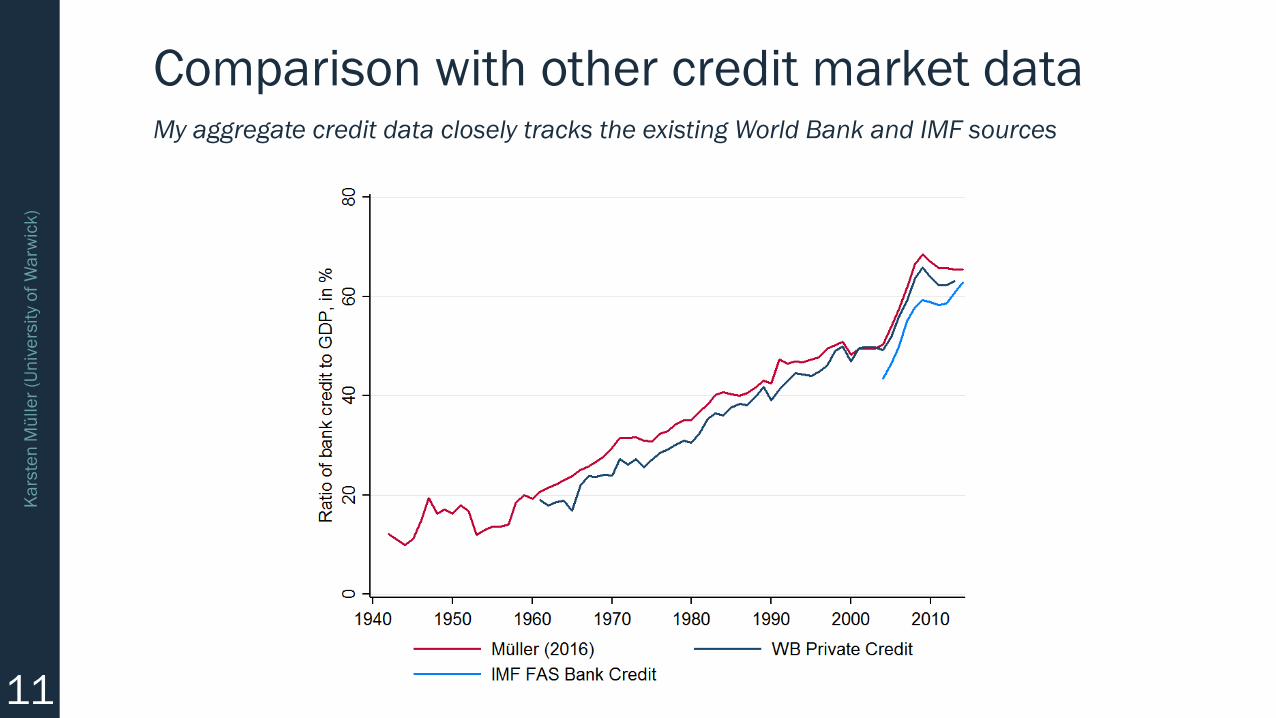
Comparison with other credit market dataMy aggregate credit data closely tracks the existing World Bank and IMF sources
12
Ka
rste
n M
ülle
r (U
niv
ers
ity
of
Wa
rwic
k)
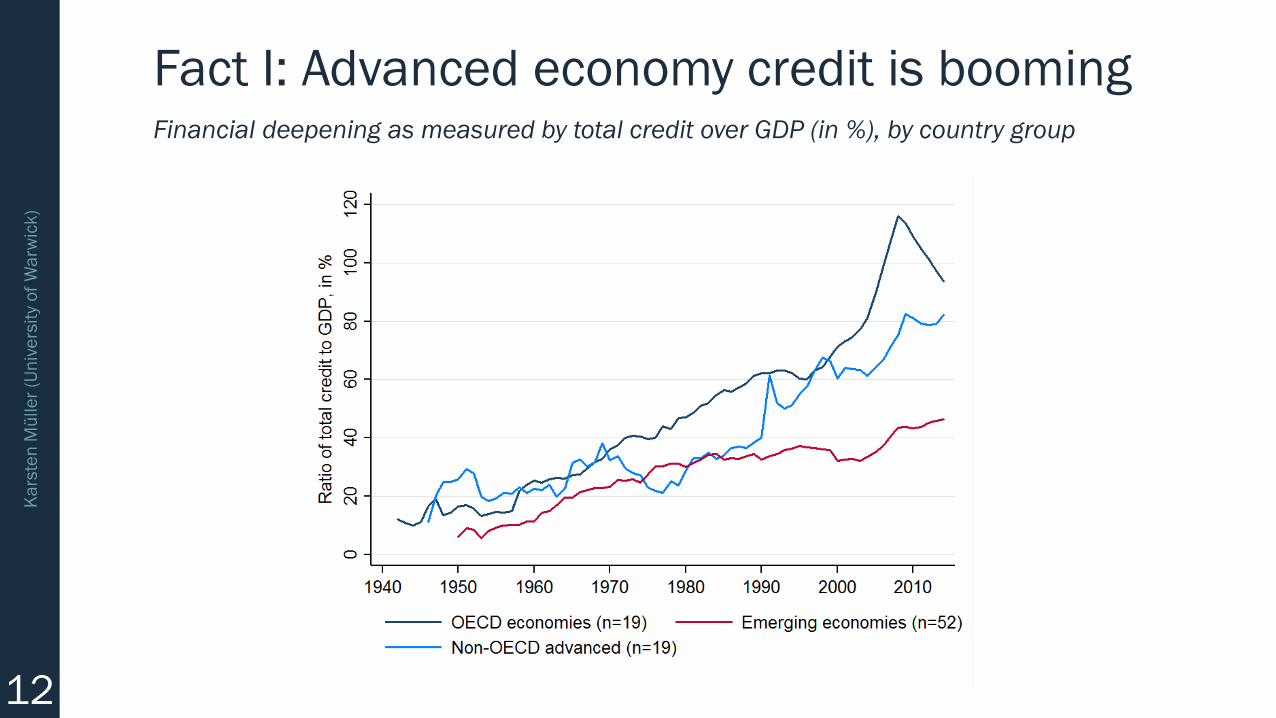
Fact I: Advanced economy credit is boomingFinancial deepening as measured by total credit over GDP (in %), by country group
13
Ka
rste
n M
ülle
r (U
niv
ers
ity
of
Wa
rwic
k)
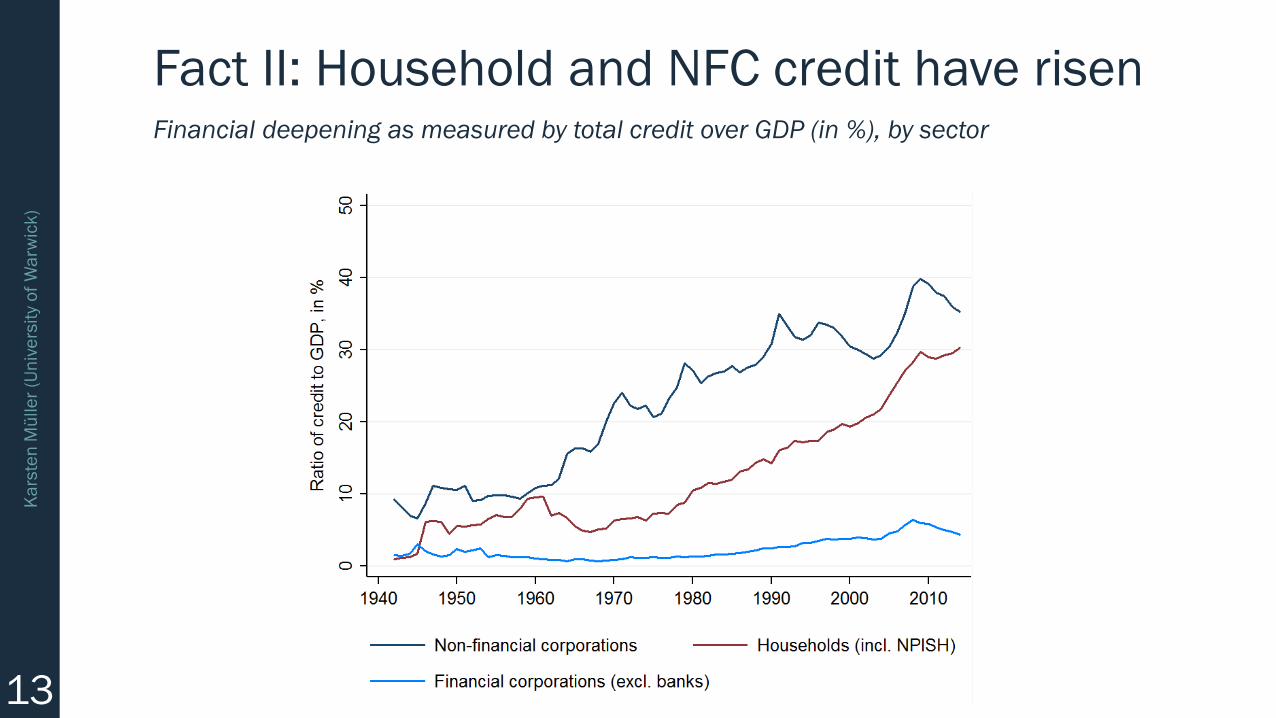
Fact II: Household and NFC credit have risenFinancial deepening as measured by total credit over GDP (in %), by sector
14
Ka
rste
n M
ülle
r (U
niv
ers
ity
of
Wa
rwic
k)
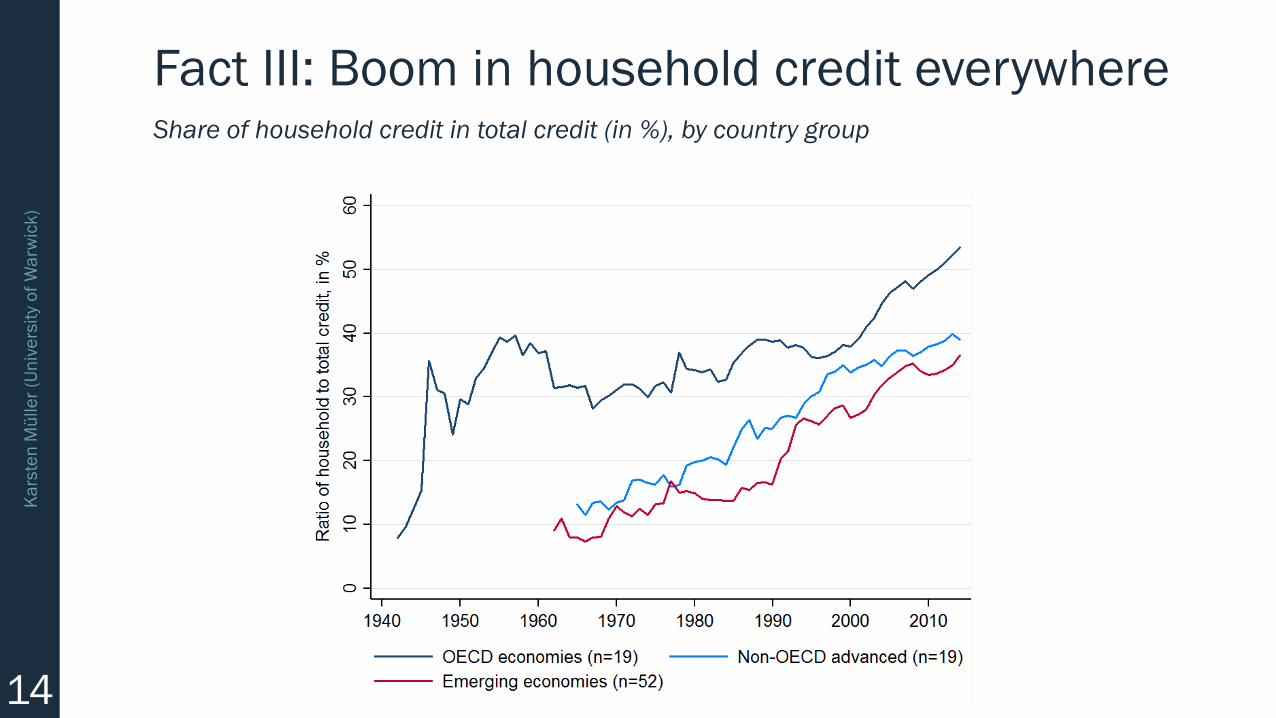
Fact III: Boom in household credit everywhereShare of household credit in total credit (in %), by country group
15
Ka
rste
n M
ülle
r (U
niv
ers
ity
of
Wa
rwic
k)
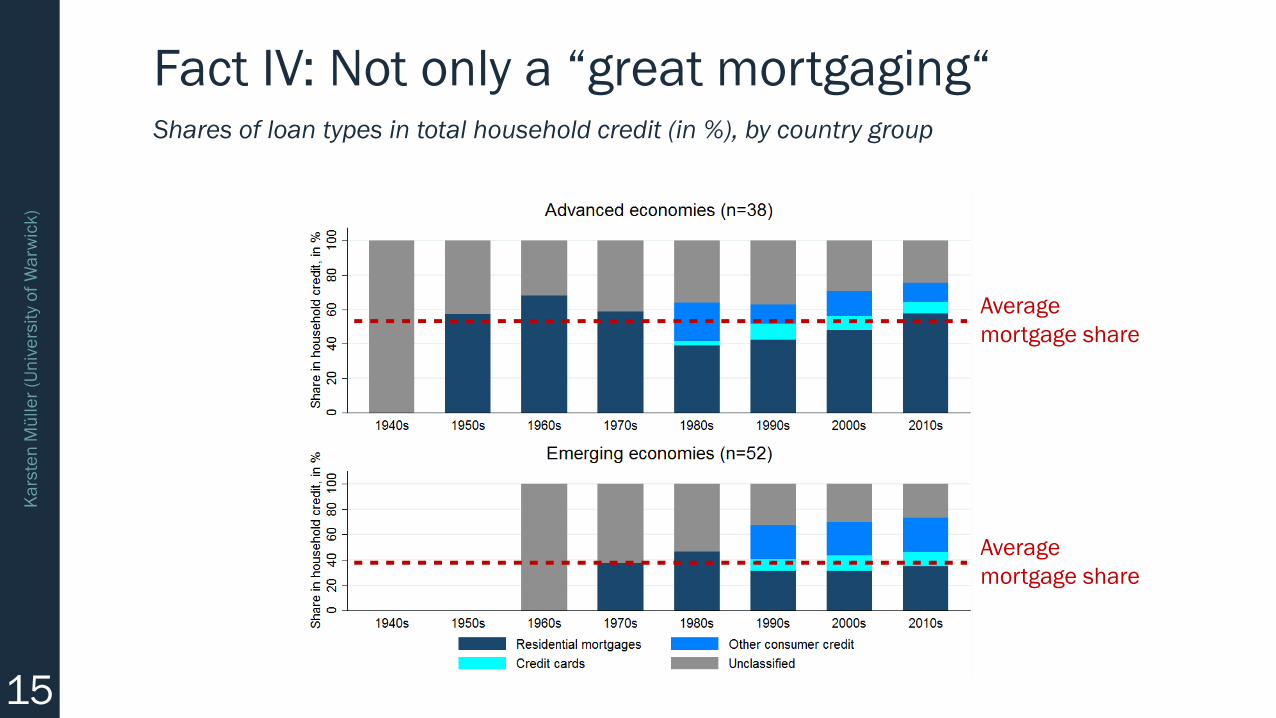
Fact IV: Not only a “great mortgaging“Shares of loan types in total household credit (in %), by country group
Average
mortgage share
Average
mortgage share
16
Ka
rste
n M
ülle
r (U
niv
ers
ity
of
Wa
rwic
k)
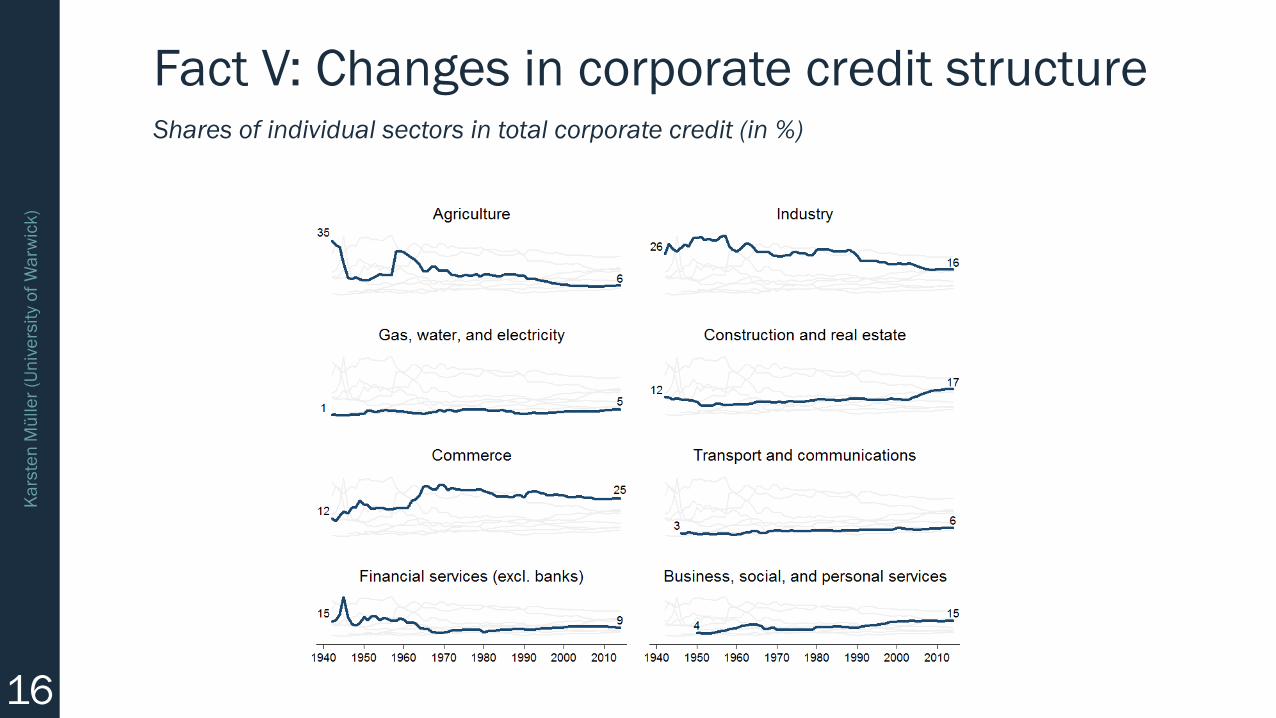
Fact V: Changes in corporate credit structureShares of individual sectors in total corporate credit (in %)
17
Ka
rste
n M
ülle
r (U
niv
ers
ity
of
Wa
rwic
k)
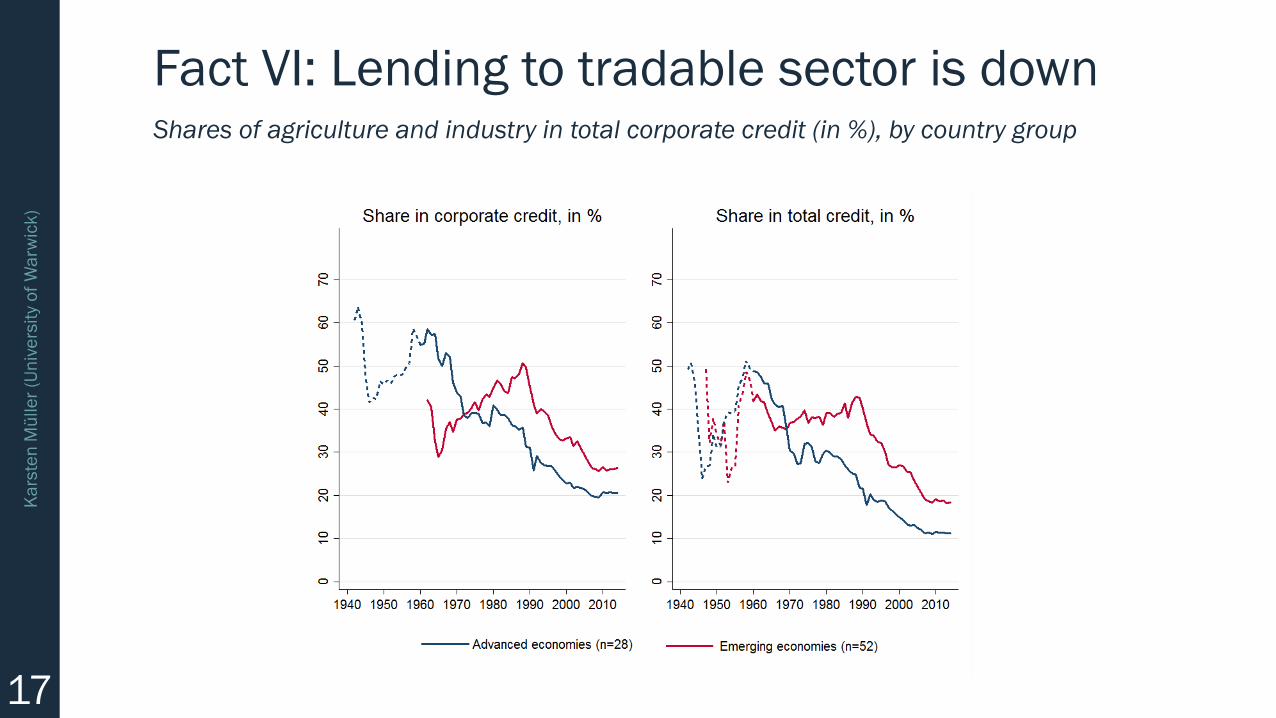
Fact VI: Lending to tradable sector is downShares of agriculture and industry in total corporate credit (in %), by country group
18
Ka
rste
n M
ülle
r (U
niv
ers
ity
of
Wa
rwic
k)
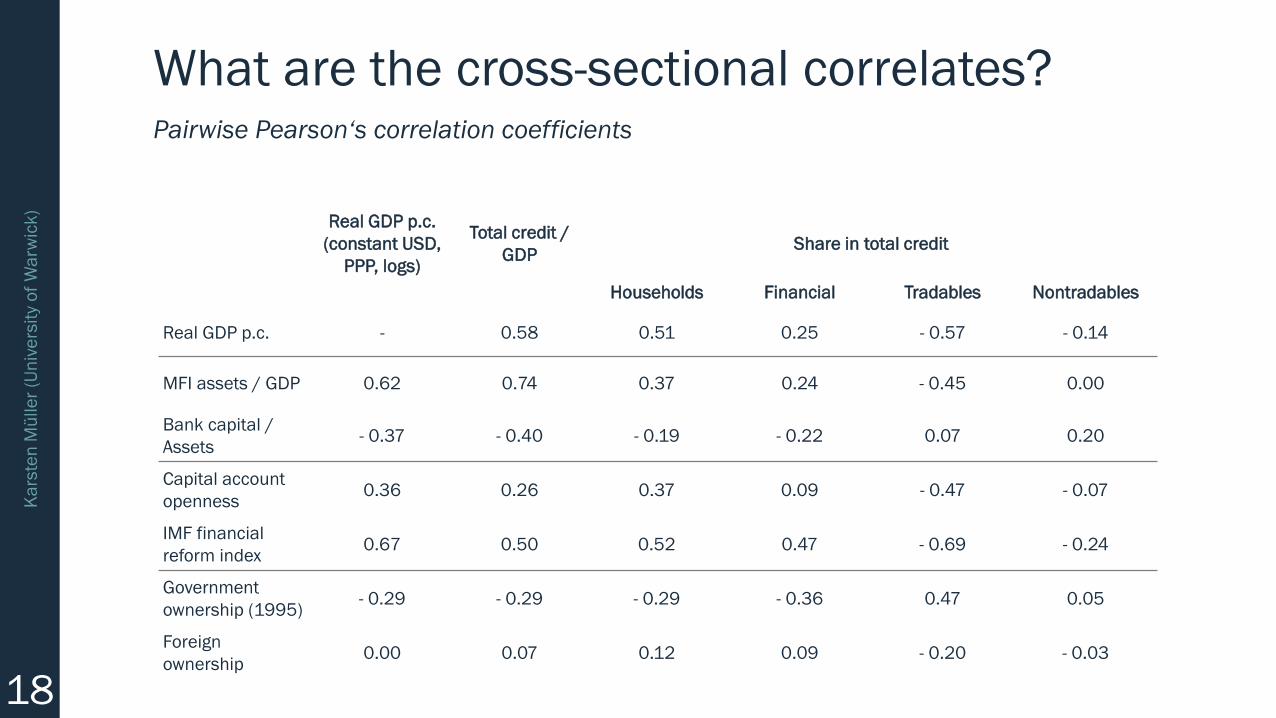
What are the cross-sectional correlates?Pairwise Pearson‘s correlation coefficients
Real GDP p.c.
(constant USD,
PPP, logs)
Total credit /
GDPShare in total credit
Households Financial Tradables Nontradables
Real GDP p.c. - 0.58 0.51 0.25 - 0.57 - 0.14
MFI assets / GDP 0.62 0.74 0.37 0.24 - 0.45 0.00
Bank capital /
Assets- 0.37 - 0.40 - 0.19 - 0.22 0.07 0.20
Capital account
openness0.36 0.26 0.37 0.09 - 0.47 - 0.07
IMF financial
reform index0.67 0.50 0.52 0.47 - 0.69 - 0.24
Government
ownership (1995)- 0.29 - 0.29 - 0.29 - 0.36 0.47 0.05
Foreign
ownership0.00 0.07 0.12 0.09 - 0.20 - 0.03
19
Ka
rste
n M
ülle
r (U
niv
ers
ity
of
Wa
rwic
k)
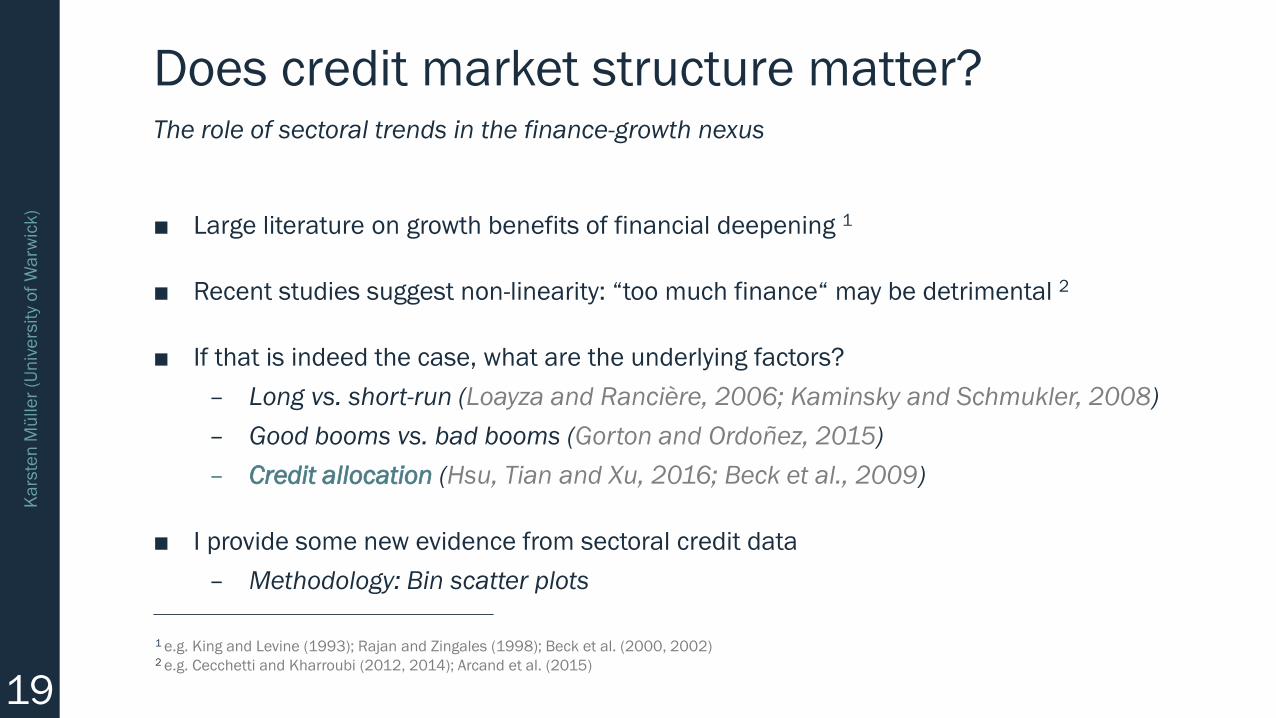
Does credit market structure matter?
■ Large literature on growth benefits of financial deepening 1
■ Recent studies suggest non-linearity: “too much finance“ may be detrimental 2
■ If that is indeed the case, what are the underlying factors?
– Long vs. short-run (Loayza and Rancière, 2006; Kaminsky and Schmukler, 2008)
– Good booms vs. bad booms (Gorton and Ordoñez, 2015)
– Credit allocation (Hsu, Tian and Xu, 2016; Beck et al., 2009)
■ I provide some new evidence from sectoral credit data
– Methodology: Bin scatter plots
The role of sectoral trends in the finance-growth nexus
1 e.g. King and Levine (1993); Rajan and Zingales (1998); Beck et al. (2000, 2002)2 e.g. Cecchetti and Kharroubi (2012, 2014); Arcand et al. (2015)
20
Ka
rste
n M
ülle
r (U
niv
ers
ity
of
Wa
rwic
k)
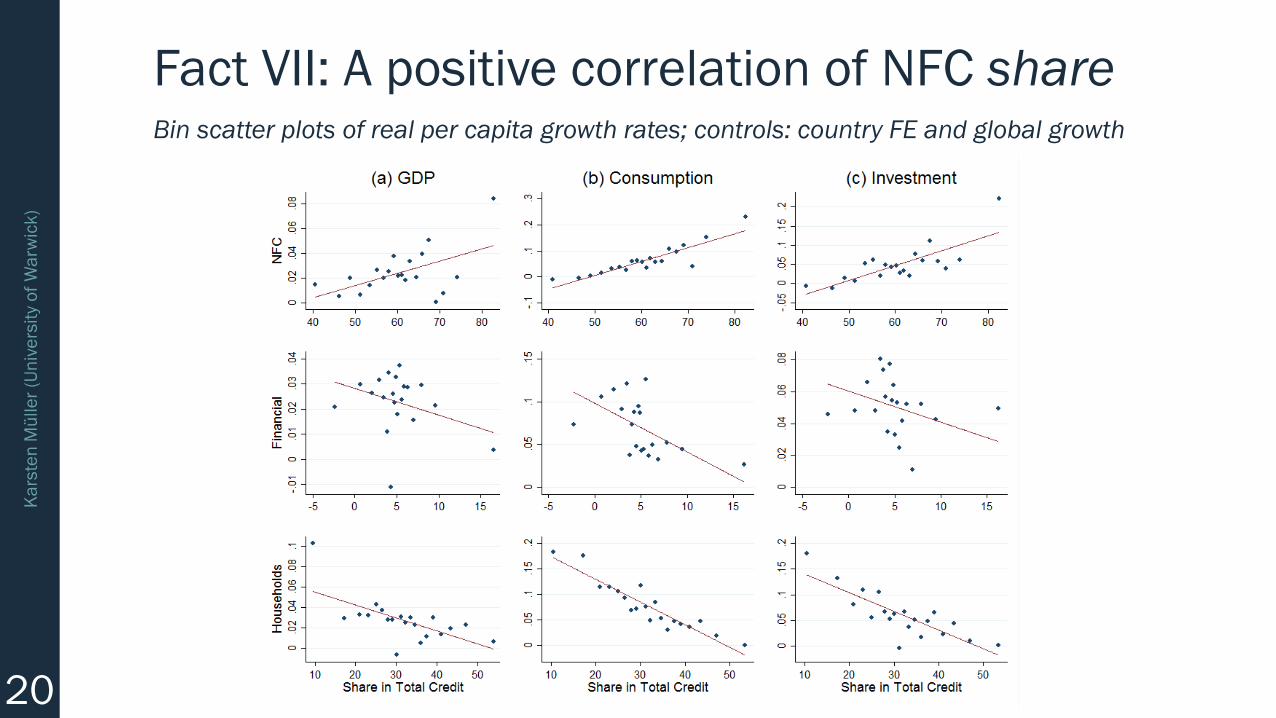
Fact VII: A positive correlation of NFC shareBin scatter plots of real per capita growth rates; controls: country FE and global growth
21
Ka
rste
n M
ülle
r (U
niv
ers
ity
of
Wa
rwic
k)
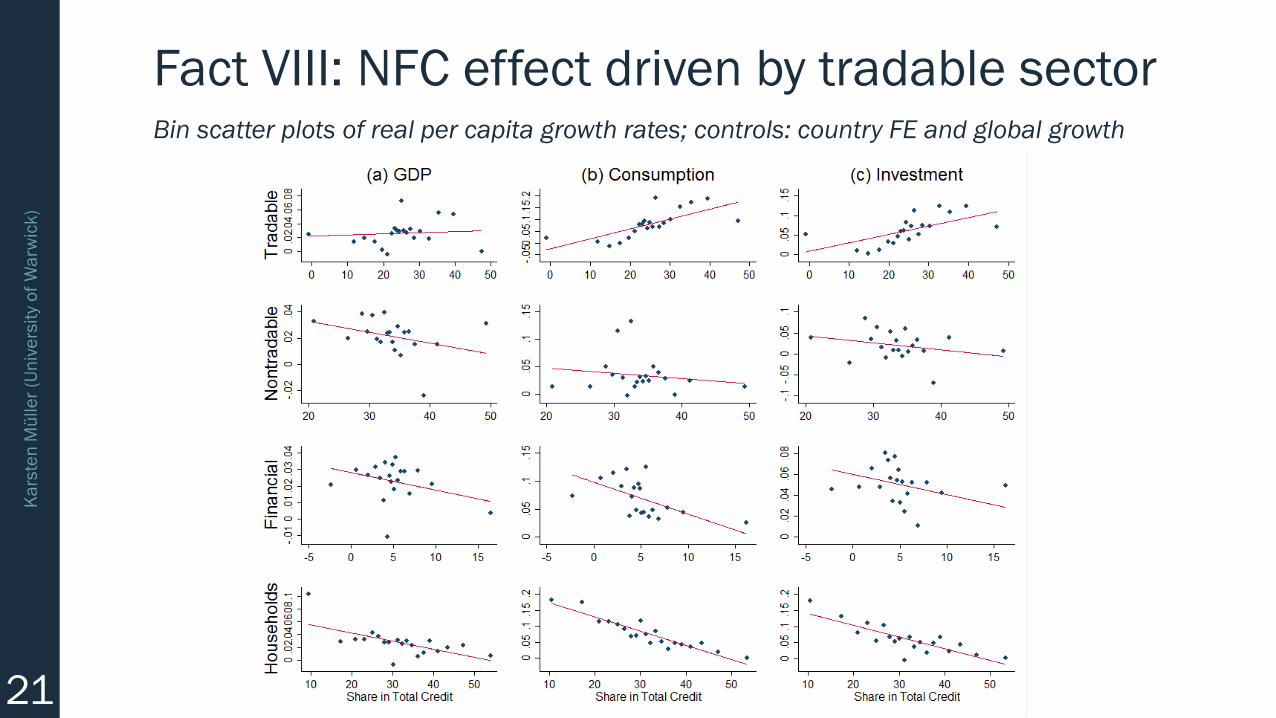
Fact VIII: NFC effect driven by tradable sectorBin scatter plots of real per capita growth rates; controls: country FE and global growth
22
Ka
rste
n M
ülle
r (U
niv
ers
ity
of
Wa
rwic
k)
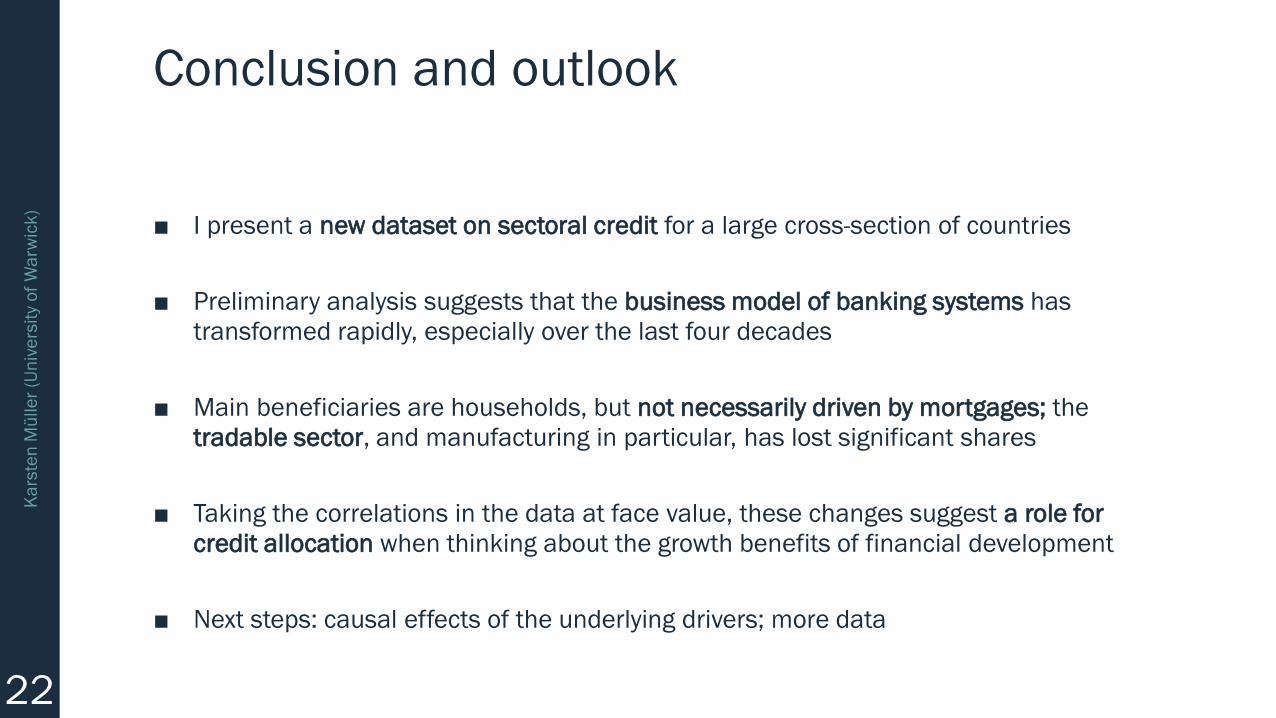
Conclusion and outlook
■ I present a new dataset on sectoral credit for a large cross-section of countries
■ Preliminary analysis suggests that the business model of banking systems has
transformed rapidly, especially over the last four decades
■ Main beneficiaries are households, but not necessarily driven by mortgages; the
tradable sector, and manufacturing in particular, has lost significant shares
■ Taking the correlations in the data at face value, these changes suggest a role for
credit allocation when thinking about the growth benefits of financial development
■ Next steps: causal effects of the underlying drivers; more data

THANK YOU FOR YOUR ATTENTION! Any questions?

BACK UP SLIDES
25
Ka
rste
n M
ülle
r (U
niv
ers
ity
of
Wa
rwic
k)
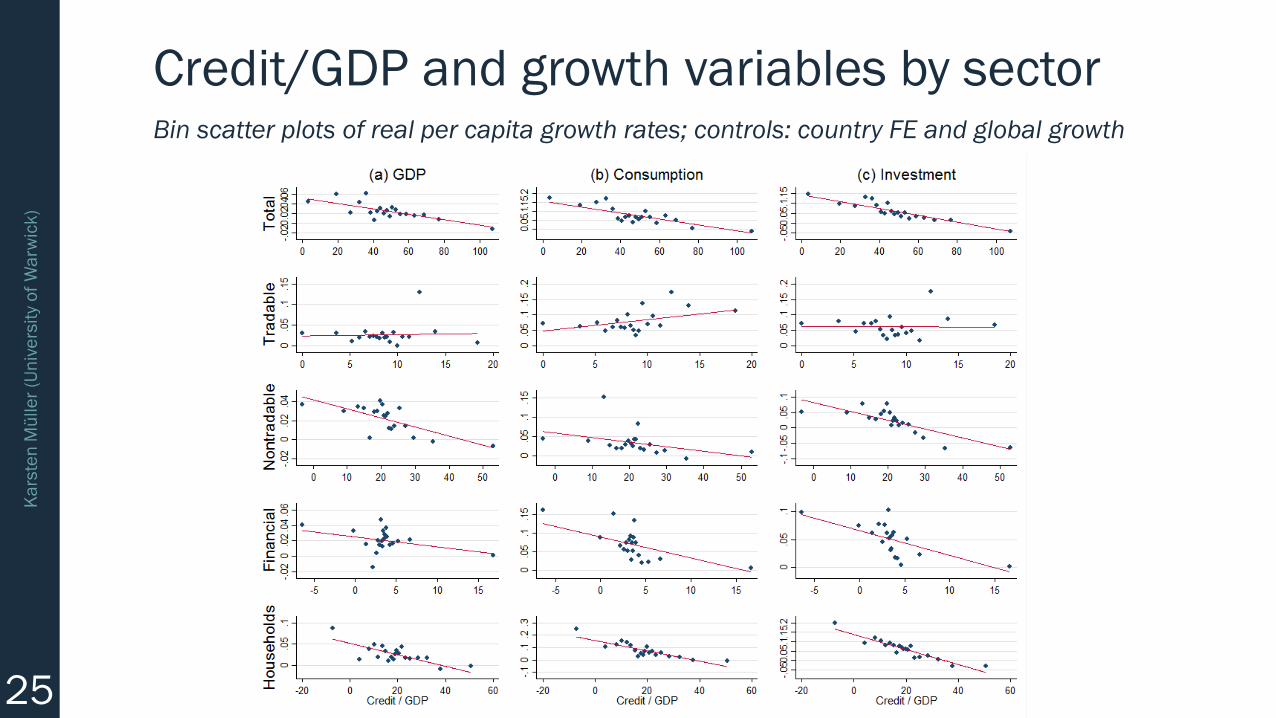
Credit/GDP and growth variables by sectorBin scatter plots of real per capita growth rates; controls: country FE and global growth
26
Ka
rste
n M
ülle
r (U
niv
ers
ity
of
Wa
rwic
k)
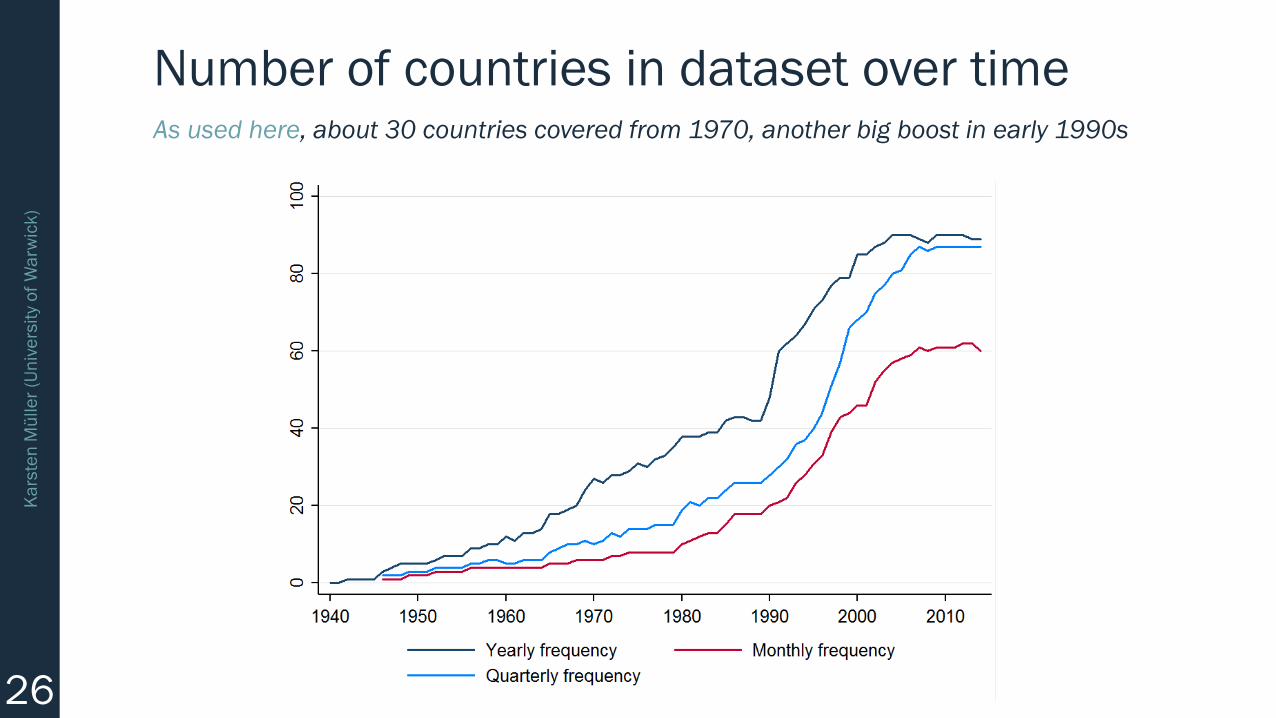
Number of countries in dataset over timeAs used here, about 30 countries covered from 1970, another big boost in early 1990s
27
Ka
rste
n M
ülle
r (U
niv
ers
ity
of
Wa
rwic
k)
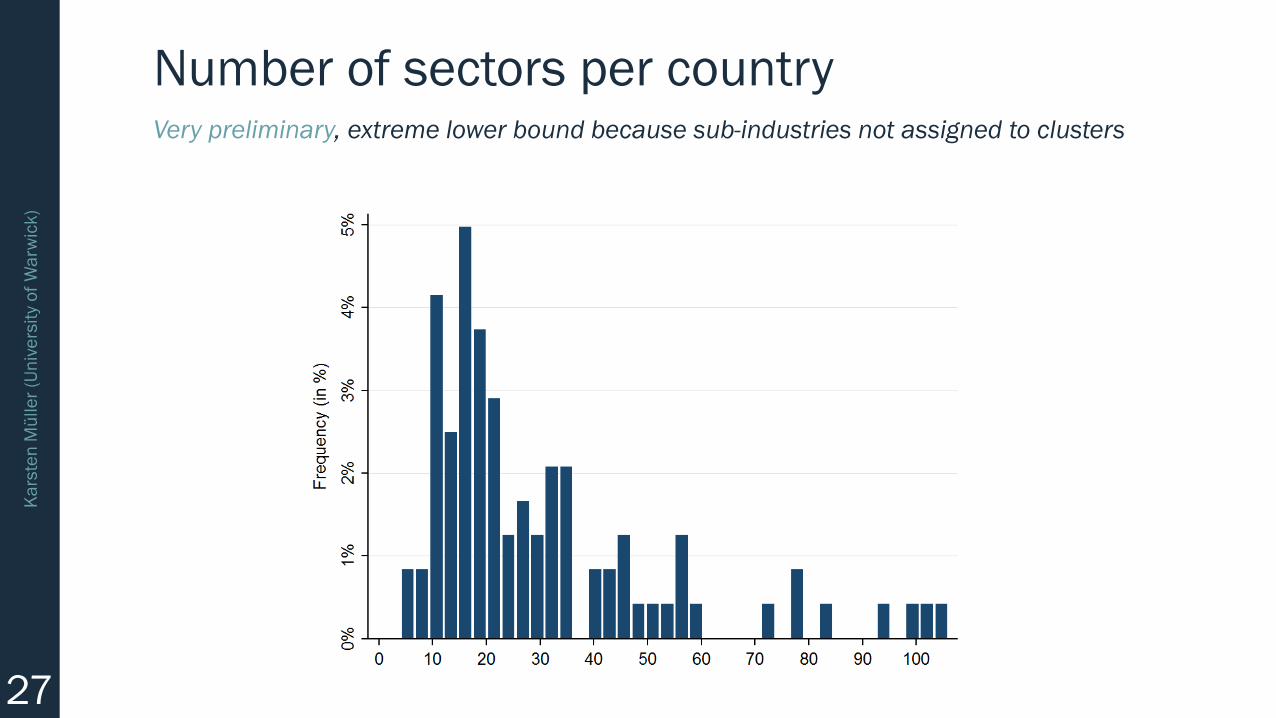
Number of sectors per countryVery preliminary, extreme lower bound because sub-industries not assigned to clusters
28
Ka
rste
n M
ülle
r (U
niv
ers
ity
of
Wa
rwic
k)
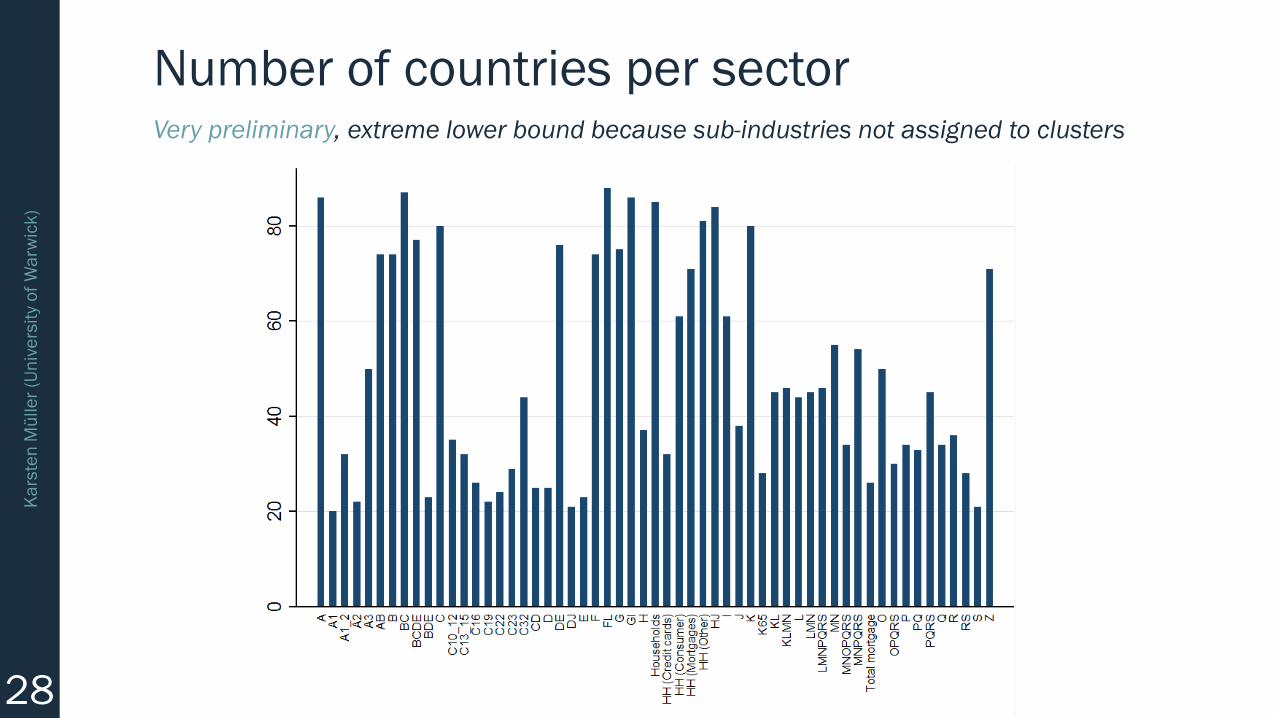
Number of countries per sectorVery preliminary, extreme lower bound because sub-industries not assigned to clusters