Embed Size (px)
Citation preview
http://jab.sagepub.com/Behavioral Science
The Journal of Applied
http://jab.sagepub.com/content/49/2/179The online version of this article can be found at:
DOI: 10.1177/0021886312464520
December 2012 2013 49: 179 originally published online 10Journal of Applied Behavioral Science
Dorthe Døjbak Håkonsson, Peter Klaas and Timothy N. CarrollReliability Through Flexibility
The Structural Properties of Sustainable, Continuous Change: Achieving
Published by:
http://www.sagepublications.com
On behalf of:
NTL Institute
can be found at:The Journal of Applied Behavioral ScienceAdditional services and information for
http://jab.sagepub.com/cgi/alertsEmail Alerts:
http://jab.sagepub.com/subscriptionsSubscriptions:
http://www.sagepub.com/journalsReprints.navReprints:
http://www.sagepub.com/journalsPermissions.navPermissions:
http://jab.sagepub.com/content/49/2/179.refs.htmlCitations:
at Scientific library of Moscow State University on November 9, 2013jab.sagepub.comDownloaded from at Scientific library of Moscow State University on November 9, 2013jab.sagepub.comDownloaded from

What is This?
- Dec 10, 2012OnlineFirst Version of Record
- May 8, 2013Version of Record >>
at Scientific library of Moscow State University on November 9, 2013jab.sagepub.comDownloaded from at Scientific library of Moscow State University on November 9, 2013jab.sagepub.comDownloaded from
The Journal of Applied Behavioral Science49(2) 179 –205
© 2012 NTL InstituteReprints and permissions:
sagepub.com/journalsPermissions.navDOI: 10.1177/0021886312464520
jab.sagepub.com
464520 JAB49210.1177/0021886312464520The Journal of Applied Behavioral ScienceHåkonsson et al.
1Interdisciplinary Center for Organizational Architecture, Aarhus University, Aarhus, Denmark2Aarhus University, AU Herning, Denmark 3University of South Carolina, Columbia, SC, USA
Corresponding Author:Dorthe Døjbak Håkonsson, Interdisciplinary Center for Organizational Architecture (ICOA), Aarhus School of Business and Social Sciences, Aarhus University, Fuglesangs Alé 20, 8210 Aarhus V, Denmark. Email: [email protected]
The Structural Properties of Sustainable, Continuous Change: Achieving Reliability Through Flexibility
Dorthe Døjbak Håkonsson1, Peter Klaas2, and Timothy N. Carroll3
Abstract
Recent studies show that the relationship between structure and inertia in changing environments may be more complex than previously held and that the theoretical logics tying inertia with flexibility and efficiency remain incomplete. Using a computational model, this article aims to clarify this relationship by exploring what structural properties enable continuous change in inertia-generating organizations and what their performance consequences are in dynamic environments. The article has three main findings: First, employing managers who anticipate change is not enough to generate continuous change; it is also necessary to raise both the rate of responsiveness and desired performance. Second, continuous change increases average organizational performance and reduces its variation. Third, organizations’ capacity for continuous change is counterintuitively limited by the organizations’ capacity to build inertia. These are important insights, because they suggest that with the right design, organizations may be both more flexible and reliable than commonly believed.
Keywords
organization design, sustainable change, inertia, flexibility, reliability, efficiency
Article
at Scientific library of Moscow State University on November 9, 2013jab.sagepub.comDownloaded from
180 The Journal of Applied Behavioral Science 49(2)
Introduction
The organizational challenge of balancing flexibility and efficiency has been widely explored (Davis, Eisenhardt, & Bingham, 2009; March, 1991; Senge, 1990; Siggelkow, 2002; Tushman & Romanelli, 1985). Flexibility is essential as it allows continuous adaptation to changing environments, whereas efficiency results from consistency of organizational rules and structures. Yet, although the classic under-standing is that rules, structures, and system interdependencies create inertia, making change difficult, recent studies find that rules and structures may actually help orga-nizations change to meet the needs of their environments.
For instance, Davis et al. (2009) found that simple rules helped increase perfor-mance in dynamic environments because they enable organizations to respond flexibly to a turbulent flow of heterogeneous opportunities. In a similar vein, Siggelkow (2002) showed how structures that were fit to match external environments allowed organiza-tions’ managers to seize otherwise fleeting opportunities rapidly and efficiently. Finally, Brown and Eisenhardt (1997) described how having too few rules led one of their case companies to make too many mistakes and to spread their attention too thin.
Thus, some degree of structure seems to promote inertia (defined as resistance to change) while also helping organizations sustain continuous change. However, what exact structural properties will assure this balance is unclear, suggesting that the theo-retical logics tying structure to flexibility and efficiency remain incomplete.
The performance consequences of continuous change versus inertia are also not sufficiently clear. Inertia promotes competency, making convergence (i.e., periods of no, or very little, change) beneficial. At the same time, a lack of change incurs costs resulting from a lack of external alignment (what Barnett & Carroll, 1995, term con-tent costs). Similarly, continuous change incurs costs related to the actions needed to move the organization to a new state (what Barnett & Carroll, 1995, term process costs). To explore these issues, we develop a system dynamics model (Forrester, 1961; Senge, 1990), built on Sastry’s (1997) modeling of Tushman and Romanelli’s (1985) punctuated equilibrium model of organizational change.
Using systems dynamics has several advantages to our study: First, it enables us to measure our variables of interest more precisely (i.e., the structural properties facilitat-ing change), while at the same time holding all other variables constant. This makes it possible to specify the impact of these structural properties on continuous change indi-vidually and together—and without confounding factors to influence the results.
Second, it enables us to study the long-term performance consequences of continu-ous change, which leads us to find that continuous change both increases average performance and reduces long-term performance variation.
Third, using a computer-simulation method allows us to explore the boundaries of change, that is, the amount of change that an organization can sustain without result-ing performance decline. Indeed, this exploration underlies a surprising discovery, namely, that the real limiting factor of continuous change is not, as normally held, the level of inertia, but instead the rate of inertia. Thus, conceiving inertia as a dynamic
at Scientific library of Moscow State University on November 9, 2013jab.sagepub.comDownloaded from
Håkonsson et al. 181
measure (of flows or rates of change) rather than a stock (accumulations or state vari-ables) explains how organizations may increase their rates of change and their levels of inertia at the same time.
Our use of a system dynamics model to explore the dynamics between inertia and change holds three major insights for change managers: (a) structure does not prevent change—rather, the right design actually facilitates it; (b) continuous change should be maintained, as it is beneficial in the long run; (c) change managers should not think of change versus stability, but instead should focus on building the capabilities that allow their organizations to sustain continuous change.
We begin by reviewing recent work demonstrating the role of structures in creating continuous change. Next, we introduce our computational model of an inertia-building organization. Third, we formalize and extend the model to allow for sustainable, con-tinuous change. Fourth, we focus on the performance consequences of inertia and change in dynamic environments. Fifth, we discuss the dynamics of inertia in creating and sustaining change. Finally, we end with a discussion of how our work improves the prevalent understanding of organizational change and the managerial implications of our findings.
BackgroundOrganizations are often conceptualized as systems of highly interdependent elements. Consistency, or internal fit, among these organizational elements is positively corre-lated with performance. At the same time, organizations must pursue strategies and structures that fit their environment (Burke & Litwin, 1992; Tushman & Nadler, 1978). This type of external fit is also positively correlated with performance.
In a changing world, internal and external fit represent a paradox. Changes in the environment create a misfit with the organization, deteriorating its performance. To close the gap and restore performance, the organization must be flexible and adapt to the new environment. However, this destroys internal fit, causing a decrease in orga-nizational efficiency and, consequently, performance. Understanding and manage-ment of the structure-action paradox is one of the most important and persistent questions in organizational research and practice (Poole & Van de Ven, 1989; Smith & Lewis, 2011; Van de Ven & Sun, 2011).
Underlying this paradox is the role of inertia. Inertia, or resistance to change, arises because organizational structures have to be reproducible (Hannan & Freeman, 1984). Reproducibility is necessary because of pressures for high accountability and high reliability, which are accomplished when organizational goals and purposes are insti-tutionalized and when activities are made routine. At the same time, institutionaliza-tion and standardization produce strong pressures against change. As argued by Hannan and Freeman (1984, p. 153), “Reliability depends on the variance of perfor-mance (including its timeliness) rather than its average level.” In other words, to gain reliability, organizations need consistent performance. This in turn makes change risky and implies that inertia is necessary for firm survival.
at Scientific library of Moscow State University on November 9, 2013jab.sagepub.comDownloaded from
182 The Journal of Applied Behavioral Science 49(2)
Tushman and Romanelli (1985), in their model of organizational change, described how inertial forces lead firms to pursue periods of convergence (beneficial in stable environments) punctuated by short periods of transformation in response to funda-mental environmental changes. In another seminal article, Brown and Eisenhardt (1997) introduced the notion of continuous change, emphasizing the mechanisms and benefits of frequent adjustment to the environment. Continuous change models (Brown & Eisenhardt, 1997; Orlikowski, 1996; Weick & Quinn, 1999) focus on dynamic change and how the tension between stability and change is managed via structures and processes. Change in these models is seen as “frequent, relentless, and even endemic to the firm” (Brown & Eisenhardt, 1997, p. 1). It is this notion of continuous adaptation that has led to the understanding that change and inertia may not in fact be two contradictory processes.
Indeed, Davis et al. (2009) demonstrate how structures (“simple rules”) may facili-tate organizational adaptation by enabling organizations to respond flexibly to a turbu-lent, varied flow of opportunities. Similarly, Feldman and Pentland (2003) argued that routines could create endogenous change and do not necessarily serve to create inertia. Becker and Knudsen (2005) found that firm responsiveness increases with routiniza-tion. In a case study, Espedal (2006) found that routines promoted both stability and change, depending on whether interactions were “heedful” (i.e., whether actors in the system acted with an understanding that the system consists of connected actions by themselves and others and that their actions were not independent of the system), or “heedless,” where this “collective mind” was not present (see Espedal, 2006; Weick & Roberts, 1993). Hence, Espedal’s case study demonstrated how heedless behavior, resulting from the development of a social context that did not encourage active listen-ing and plausible judgment, led to inertia. Finally, Larsen and Lomi (2002) argued that although structural inertia defines organizations’ resistance to change, it also deter-mines organizations’ ability to turn routines into capabilities.
Despite the insights of these studies, further understanding of the dialectics of change and inertia, particularly what exact structural properties sustain continuous change in inertia-generating systems, is needed.
To gain this understanding, we build on a model with system dynamic properties that will enable us to represent the complexity of the relationship between flexibility and efficiency. More precisely, we build on Sastry’s (1997) modeling of Tushman and Romanelli’s (1985) punctuated change model.
An Explorative Computational Study ApproachAn explorative computational study approach suits our purpose of testing the underly-ing theoretical logic of the relationship between change and inertia, or flexibility and efficiency, because it allows us to very rigorously test the internal validity of this relationship. Simulation studies are also appropriate since exploring the boundary conditions between change and inertia would be difficult, if not impossible, to study with empirical data. Here, simulation studies allow us to study tipping points and
at Scientific library of Moscow State University on November 9, 2013jab.sagepub.comDownloaded from
Håkonsson et al. 183
nonlinearities (Carroll & Burton, 2000). Tipping points appear when the feedback loops that normally keep complex systems stable become stressed (e.g., too much change is initiated, resulting in low performance and exhausted employees). In such cases, the system’s mathematical representations become jagged, and nonlinear, rather than smooth. Usually, statistical studies can not quite capture such issues.
We used a system dynamics approach for a number of reasons. First, it is consistent with prior work in our focal literature (Sastry, 1997; Senge, 1990). Second, to study the dialectics between change and inertia, we need to be able to model both of these forces as well as their interdependencies in one system. System dynamics models allow just that; they focus on the system level and model the behaviors of systems as a whole (Harrison, Lin, Carroll, & Carley, 2007). Furthermore, they allow us to model exact parameter values of different structural properties that support change, and to study their impact precisely. Finally, system dynamics models are particularly well suited to complex situations (Tucker, Cullen, Sinclair, & Wakeland, 2005), enabling us to represent the process view underlying the original punctuated change and continu-ous change models.
In contrast to other simulation models, system dynamics models distinguish between state variables and those representing rates of change (Sastry, 1997). The state, or structure, of an organization is interpreted by means of the processes that lead to it. Therefore, a theory’s potential may be assessed in its ability to turn process descriptions into state descriptions, and vice versa (Larsen & Lomi, 2002). The dis-tinction between state and process and the translations between them is fundamental to one of the most important insights of this study.
While there are different interpretations of the role of computational modeling in the social sciences, we use it here as a tool for theory development (Davis, Bingham, & Eisenhardt, 2009). It enables us to explicitly examine which assumptions are neces-sary for certain behaviors (such as adaptation), or which behaviors result from a cer-tain set of assumptions. We need the computational model because the social science theories underlying our understanding of change and inertia as deeply interconnected are so complex that we cannot derive their resulting behavior by intuition or formal techniques.
A common critique of computational modeling studies is that they are redundant, in the sense that their results are coded into the model a priori by the researcher. In theory development, however, the focus is not as much on the results from simulation but rather on the relationship between results and assumptions. Our use of the system dynamic approach revealed a number of insights about the balance of change and inertia that have great potential relevance to change management.
Basic Model of an Inertia-Generating SystemTo understand how attempts at change may struggle against or be facilitated by issues embedded in a prevailing system, we needed to build a model of an organizational system and its underlying interdependencies. In our model, consistent with Sastry’s
at Scientific library of Moscow State University on November 9, 2013jab.sagepub.comDownloaded from
184 The Journal of Applied Behavioral Science 49(2)
(1997) modeling of Tushman and Romanelli’s (1985) punctuated equilibrium model, firm-level change is influenced by four variables: strategic orientation, inertia, per-ceived performance, and pressure to change.
Strategic orientation defines the firm “in terms of what business it is in and how it competes” (Tushman & Romanelli, 1985, p. 176, in Sastry, 1997, p. 243). Inertia is described as “resistance to all but incremental change” (Tushman & Romanelli, 1985 p. 177). Perceived performance relates to the notion that performance “is perceived and interpreted by the executive leadership (Tushman & Romanelli, 1985, p. 180), and pressure for change result of “sustained low performance due to lack of consistency among activities . . . or change that render a prior strategic orientation no longer effec-tive (Tushman & Romanelli, 1985, pp. 197-202, in Sastry, 1997, p. 243).
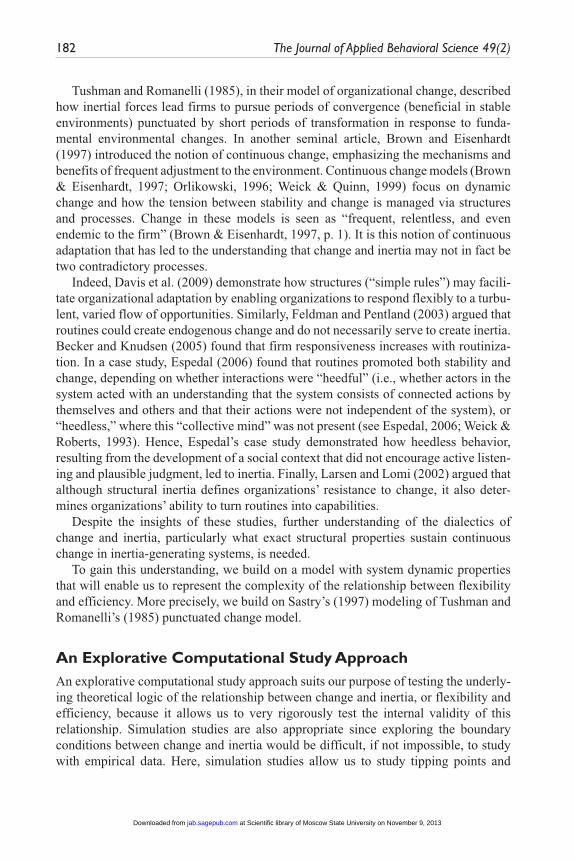
Strategic orientation is influenced (Sastry, 1997, p. 258) by pressure to change, ability to change, the organization’s degree of responsiveness, and a perception of misfit between organization and environment. This is illustrated in Figure 1.
Inertia is represented by a single variable that captures both socially anchored and structural inertia. It determines the firm’s competence and measures the level of orga-nizational relationships and networks. According to Sastry (1997), a key element of inertia is the strength of relationships with customers, suppliers, and financial sources; it is the extent to which internal processes become institutionalized norms. Representing the effects of institutionalization, inertia arises from socially derived processes such as the homogenization of the employee base as well as from elaboration of structural relationships such as the solidification of supplier relations.
Inertia is reduced by changes in strategic orientation, but it is reinforced by and reinforces learning and socialization processes. Sastry (1997, p. 247) argues, “As long as the organization does not change its strategic orientation, inertia builds up over time through ongoing social and structural processes.” Thus, as inertia and competence increase, change will only happen in response to major performance gaps.
Responsiveness Ability tochange
Misfit Pressure tochange
Inertia Desired - actualperformance
- +
Change in strategic orientation+ + + +
Figure 1. Simplified causal diagram of the parameters involved with change in strategic orientation.
at Scientific library of Moscow State University on November 9, 2013jab.sagepub.comDownloaded from
Håkonsson et al. 185
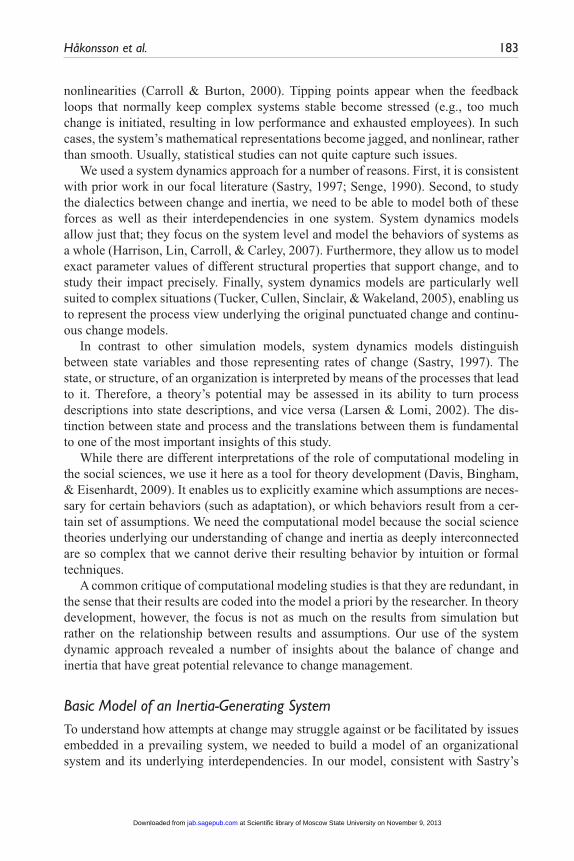
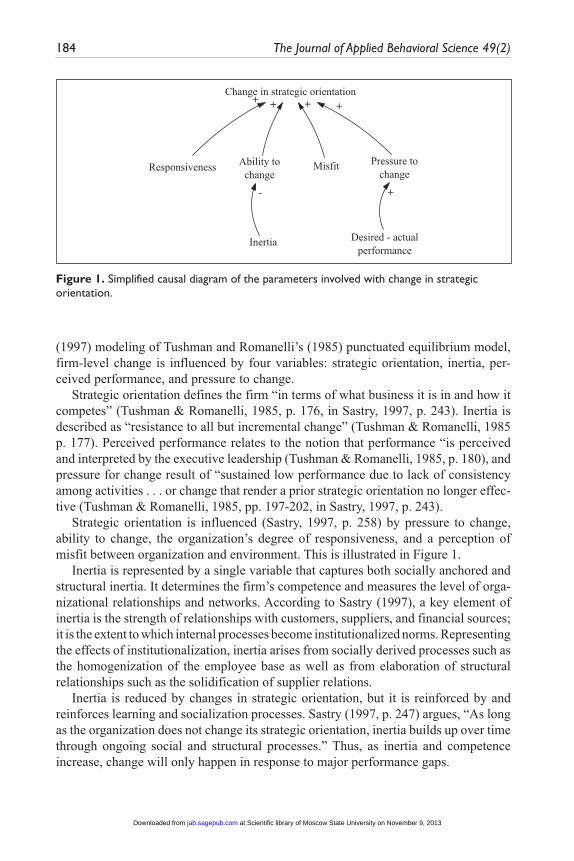
In Figure 2, we reproduce a simplified causal diagram of the punctuated change theory to summarize the basic model. In the figure, “B1” refers to balancing loop number one and “R2” to reinforcing loop number two, and so on. In a balancing loop, an action attempts to bring things to agreement (e.g., a reduction in appropriateness will cause a drop in performance, which is eventually addressed by a change in strat-egy). In a reinforcing loop, each action adds to the other (e.g., once inertia starts to build it becomes easier to increase, because more developed relationships provide a basis for their own extension). Hence, balancing loops serve to retain the status quo, while reinforcing loops change the system. The model is governed by the dominating loops, that is, either B1/R3 (in which case the organization will change as necessary, destroying inertia and competency) or R1/R2 (in which case the organization will build inertia and competency but not change as the environment requires).
Performance depends on appropriateness (a result of external fit) and competencies (reflecting internal fit) that build over time. For performance to be high both must be high. In a young organization, inertia is low and the organization is sensitive to its environment, ready to change as the environment requires. If the environment’s requirements do not change, however, the organization will not change its strategic orientation and inertia will build, increasing competence and performance in the short
Change in strategicorientation
Pressure tochange
Perceivedperformance
Performance
Strategicorientation
Appropriateness
Strategic orientationrequired
CompetenceInertia
Learning,socialization, etc.
Ability tochange
+
+
-
+
+
-+
-
+
+
+
+
-
+
B 1
R 1
R 2
R 3
Figure 2. Simplified causal diagram of the punctuated change theory (after Sastry, 1997).
at Scientific library of Moscow State University on November 9, 2013jab.sagepub.comDownloaded from
186 The Journal of Applied Behavioral Science 49(2)
run. This will result in a decrease in pressure for both change and the ability to change. Over time, the organization will build inertia to a level where it has significantly lost its ability to change; the organization will only change, and then dramatically, when there is very high pressure to do so. This will only be the case when performance is low because of a large gap between the environment and the organization. Eventually, a revolutionary change will occur, destroying competencies and decreasing performance.
Given our interest in examining what structural properties may generate continu-ous, sustainable change in an inertia-building system, we next turn to an exploration of what structural properties are required.
Adding Flexibility to an Inertia-Generating SystemPrevious studies have found that adding a dynamic fit routine will help organizations find equilibrium and adapt in anticipation of change (e.g., Teece, 2009; Zajac, Kraatz, & Bresser, 2000). In contrast to a static fit routine, which measures fit at a single point in time, a dynamic fit (or time-paced) routine predicts whether an organization’s strat-egy will fit with changing environmental circumstances. For example, a company could implement regular strategy seminars, taking into consideration the expected degree of required change based on factors such as customer or regulatory changes. Thereby dynamic fit routines can serve to add internal continuous change.
In a dynamic fit routine, management paces the rate of change in the organization to that of the environment by tracking the past rate of change in the environment. Rather than changing in reaction to external change, the organization incorporates the previous year’s rates of change proactively through regular deadlines—for example, by deciding that 20% of revenues should come from new products, or that one new product should be introduced every 6 months. This is similar to Zajac et al. (2000) and consistent with Gersick (1994) and Brown and Eisenhardt (1997), and it should help the organization move from being static and reactive to being dynamic (i.e., involve time as a unit) regarding the need to change.
We can easily modify the routine in our model to obtain a dynamic fit routine. Although the existing fit measurement routine is a static misfit measure that assesses the gap between the environment and the organization’s current strategic orientation, we add a measure of the historic rate of change in the environment. Below, we formal-ize these arguments and explore their implications.
Formalizing the ModelAdding a dynamic change management routine for continuous change. As mentioned,
the strategic orientation of the organization is a state variable whose change requires the combination of four effects: sufficient ability to change, high enough pressure to change, high enough responsiveness, and a perception of a mismatch between organi-zation and environment (cf. Figure 1 and Sastry, 1997, p. 258):
at Scientific library of Moscow State University on November 9, 2013jab.sagepub.comDownloaded from
Håkonsson et al. 187
S R B ms f= ∗α ∗ , (1)
where R is the ability to change as a function of level of inertia, B is the pressure for change as a function of perceived performance, and α
s is a parameter representing the
organization’s responsiveness to change pressures. The perceived mismatch itself is formalized as
m S Sf = ∗− , (2)
where S* is the strategic orientation required by the environment and S is the organi-zation’s actual strategic orientation. This measure is static, or event-based, because it measures the difference between two state variables and is expressed without time as a unit.
Besides the gap between the organization’s current strategic orientation and that required by the environment, the rate of change in the strategic orientation required by the environment is also considered:
m S S Sf = − +∗ ∆ ∗, (3)
that is, future change in the environment is anticipated, based on information about historic rates of change in the environment. When ΔS = ΔS* the organization will obtain quasi-equilibrium (Donaldson, 2001).
Simulating the ModelModel behavior in static environments with dynamic fit measurement routines. To test
and validate the new dynamic fit routine, we simulated the new routine with the same model parameter values as the replication simulations.1 Results showed that the rou-tine worked in a manner similar to the event-based fit routine. In stable, unchanging environments, the organization stabilized in an equilibrium with high performance. When there was a one-time revolutionary change in the environment, the organization adjusted accordingly. This model behavior was predictable from Expressions (2) and (3) as inherent in Expression (1). With stable environments as well as with one-time change, the rate of change of strategic orientation (i.e., ΔS) remains 0, indicating no difference in the two routines, that is, (2) = (3).
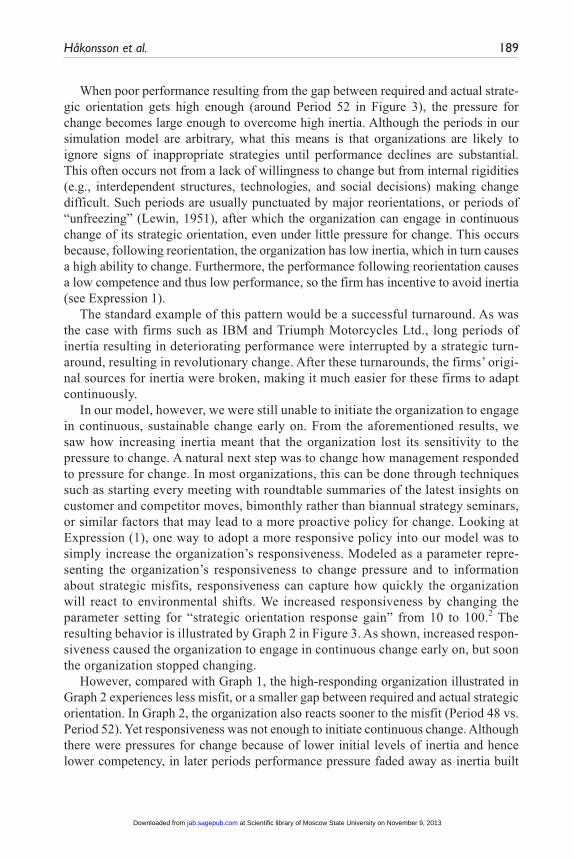
Model behavior in continuously changing environments. Continuous, ongoing envi-ronmental change was modeled as a linear increase in required strategic orientation (a “ramp” function, Sastry, 1997, p. 272). This situation is illustrated by Graph 3 in Figure 3.
Essentially, this represents environmental change as ongoing and steady. For orga-nizations to stay aligned with continuously changing environments requires ongoing organizational change. When the dynamic routine is used in such environments, we see behavior of the type illustrated by Graph 1 in Figure 3. As shown, the organization
at Scientific library of Moscow State University on November 9, 2013jab.sagepub.comDownloaded from

188 The Journal of Applied Behavioral Science 49(2)
initially attempts to track the required strategic orientation, but it very quickly stabi-lizes at a lower level. This pattern remains until Period 52, where it makes revolution-ary changes and then tracks the required strategic orientation for the remainder of the simulation period. This behavior can also be explained by referring to the causal dia-gram in Figure 1.
Initially, because the organization has a correct strategic orientation and the change in required strategic orientation in the short term is insignificant (i.e., the organization has a good fit with the environment), the organization’s performance is good and there is no pressure for change. This causes inertia to build up, diminishing the organiza-tion’s ability to change and with it the sensitivity necessary for reacting to small changes in the environment. The organization therefore does not react until the gap between the environment’s requirements and the organization’s strategic orientation increases and pressure to change builds up. To understand this dynamic, we refer again to Expression (1): Changing the strategic orientation requires a combination of all of the effects of ability to change, pressure to change, and a perception of misfit. As long as both ability to change and perception of misfit are low, the organization will not change.
0.4
0.3
0.2
0.1
03
3
3
3
3
3
3
3
3
3
3
22 2 2 2 2 2 2
2
2
2
1 1 1 1 1 1 1 1 1
1
1
1
Time (Quarter)
S.O. with time paced fit routine SO Units1 1 1 1 1 1S.O. with time paced fit and high responsiveness SO Units2 2 2 2Required strategic orientation SO Units3 3 3 3 3 3
706050403020100
Figure 3. Initial results from adding a dynamic fit (time-paced) routine.
at Scientific library of Moscow State University on November 9, 2013jab.sagepub.comDownloaded from
Håkonsson et al. 189
When poor performance resulting from the gap between required and actual strate-gic orientation gets high enough (around Period 52 in Figure 3), the pressure for change becomes large enough to overcome high inertia. Although the periods in our simulation model are arbitrary, what this means is that organizations are likely to ignore signs of inappropriate strategies until performance declines are substantial. This often occurs not from a lack of willingness to change but from internal rigidities (e.g., interdependent structures, technologies, and social decisions) making change difficult. Such periods are usually punctuated by major reorientations, or periods of “unfreezing” (Lewin, 1951), after which the organization can engage in continuous change of its strategic orientation, even under little pressure for change. This occurs because, following reorientation, the organization has low inertia, which in turn causes a high ability to change. Furthermore, the performance following reorientation causes a low competence and thus low performance, so the firm has incentive to avoid inertia (see Expression 1).
The standard example of this pattern would be a successful turnaround. As was the case with firms such as IBM and Triumph Motorcycles Ltd., long periods of inertia resulting in deteriorating performance were interrupted by a strategic turn-around, resulting in revolutionary change. After these turnarounds, the firms’ origi-nal sources for inertia were broken, making it much easier for these firms to adapt continuously.
In our model, however, we were still unable to initiate the organization to engage in continuous, sustainable change early on. From the aforementioned results, we saw how increasing inertia meant that the organization lost its sensitivity to the pressure to change. A natural next step was to change how management responded to pressure for change. In most organizations, this can be done through techniques such as starting every meeting with roundtable summaries of the latest insights on customer and competitor moves, bimonthly rather than biannual strategy seminars, or similar factors that may lead to a more proactive policy for change. Looking at Expression (1), one way to adopt a more responsive policy into our model was to simply increase the organization’s responsiveness. Modeled as a parameter repre-senting the organization’s responsiveness to change pressure and to information about strategic misfits, responsiveness can capture how quickly the organization will react to environmental shifts. We increased responsiveness by changing the parameter setting for “strategic orientation response gain” from 10 to 100.2 The resulting behavior is illustrated by Graph 2 in Figure 3. As shown, increased respon-siveness caused the organization to engage in continuous change early on, but soon the organization stopped changing.
However, compared with Graph 1, the high-responding organization illustrated in Graph 2 experiences less misfit, or a smaller gap between required and actual strategic orientation. In Graph 2, the organization also reacts sooner to the misfit (Period 48 vs. Period 52). Yet responsiveness was not enough to initiate continuous change. Although there were pressures for change because of lower initial levels of inertia and hence lower competency, in later periods performance pressure faded away as inertia built
at Scientific library of Moscow State University on November 9, 2013jab.sagepub.comDownloaded from
190 The Journal of Applied Behavioral Science 49(2)
up. Once the pressure for change went away, the organization stopped changing. Thus responsiveness, even though it increases sensitivity to changes, was also not enough to overcome inertia once it set in.
Perhaps this should not come as a surprise. In the model, management’s policy is that change should only be initiated in response to low performance. This change policy reflects the behavioral, reactive view (Cyert & March, 1963) and is fully consistent with Tushman and Romanelli’s (1978) assumption that performance is the main trigger for change. For continuous change to occur, prior work suggests that proactive management is needed—they must not wait and see what happens, but must continuously explore the future. They might make low-cost probes and/or link products together over time through rhythmic transition processes from present to future projects, thereby creating a relentless pace of change (Brown & Eisenhardt, 1997; Eisenhardt & Brown, 1998; Eisenhardt & Sull, 2001). Thus, although we capture the endogenous change capability through installing a dynamic measure-ment routine, we have not yet created the proactiveness required, since we still have a management team that will only initiate change in response to low performance.
What is needed then is to increase the pressure to change (cf. Figure 2). As also appears from Figure 1, this should be done through changing management’s assump-tions of desired performance. Sastry (1997) notes that “desired performance represents a goal against which the firm compares perceived performance” (p. 273). In our model, the difference between desired and perceived performance determines the perfor-mance shortfall.
To model a proactive management team, we increased the level of “desired perfor-mance” from 1 to 1.2 (see the appendix). This results in a continuous, ongoing pres-sure for change, since management is less easily satisfied and continuously pushes for change that will increase performance further.
While assuming that a management team can maintain high performance expecta-tions for an extended period of time does not fit with the traditional theory of aspira-tions (Cyert & March, 1963), it is in accordance with social updating rules in the formation of aspiration levels. As noted by Greve (2003), such expectations can be introduced by comparing the organization’s performance with that of its competitors, such as in benchmarking. In benchmarking, the organizational processes (e.g., R&D, production, or service) that are critical to achieving its strategy are first identified. If the strategy is broken down into a set of critical performance indicators, then the stra-tegic processes would have these as their major outcomes. Next the company searches across industries for similar processes at world-class performance levels, and such processes then become the external performance benchmark akin to the social com-parison targets discussed by Greve (2003).
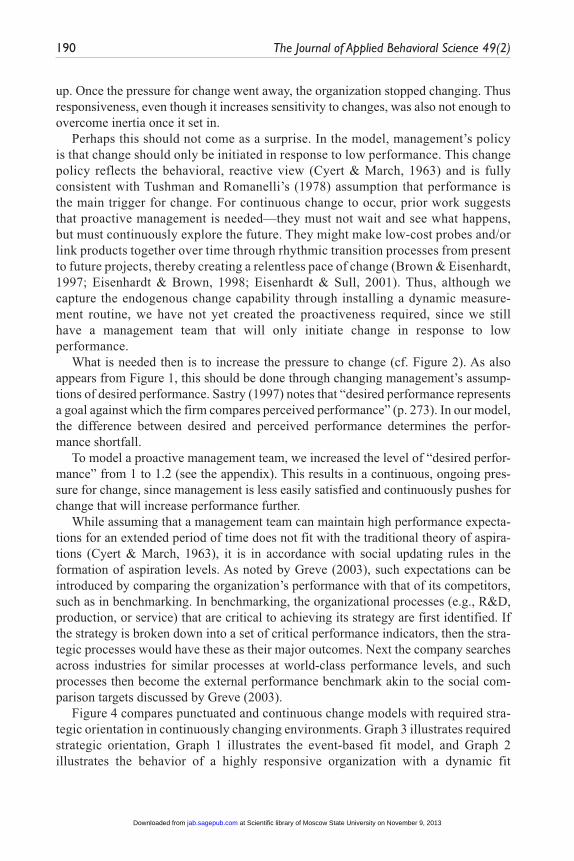
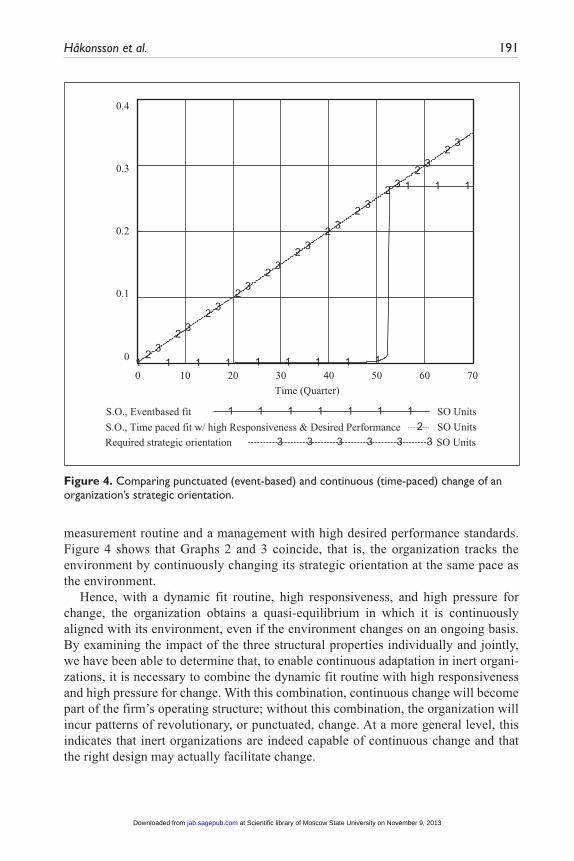
Figure 4 compares punctuated and continuous change models with required stra-tegic orientation in continuously changing environments. Graph 3 illustrates required strategic orientation, Graph 1 illustrates the event-based fit model, and Graph 2 illustrates the behavior of a highly responsive organization with a dynamic fit
at Scientific library of Moscow State University on November 9, 2013jab.sagepub.comDownloaded from
Håkonsson et al. 191
measurement routine and a management with high desired performance standards. Figure 4 shows that Graphs 2 and 3 coincide, that is, the organization tracks the environment by continuously changing its strategic orientation at the same pace as the environment.
Hence, with a dynamic fit routine, high responsiveness, and high pressure for change, the organization obtains a quasi-equilibrium in which it is continuously aligned with its environment, even if the environment changes on an ongoing basis. By examining the impact of the three structural properties individually and jointly, we have been able to determine that, to enable continuous adaptation in inert organi-zations, it is necessary to combine the dynamic fit routine with high responsiveness and high pressure for change. With this combination, continuous change will become part of the firm’s operating structure; without this combination, the organization will incur patterns of revolutionary, or punctuated, change. At a more general level, this indicates that inert organizations are indeed capable of continuous change and that the right design may actually facilitate change.
0.4
0.3
0.2
0.1
03
3
3
3
3
3
3
3
3
3
3
2
2
2
2
2
2
2
2
2
2
2
1 1 1 1 1 1 1 1 1
1 1 1
Time (Quarter)
S.O., Eventbased fit SO Units1 1 1 1 1 1 1S.O., Time paced fit w/ high Responsiveness & Desired Performance 2Required strategic orientation SO Units3 3 3 3 3 3
706050403020100
SO Units
Figure 4. Comparing punctuated (event-based) and continuous (time-paced) change of an organization’s strategic orientation.
at Scientific library of Moscow State University on November 9, 2013jab.sagepub.comDownloaded from
192 The Journal of Applied Behavioral Science 49(2)
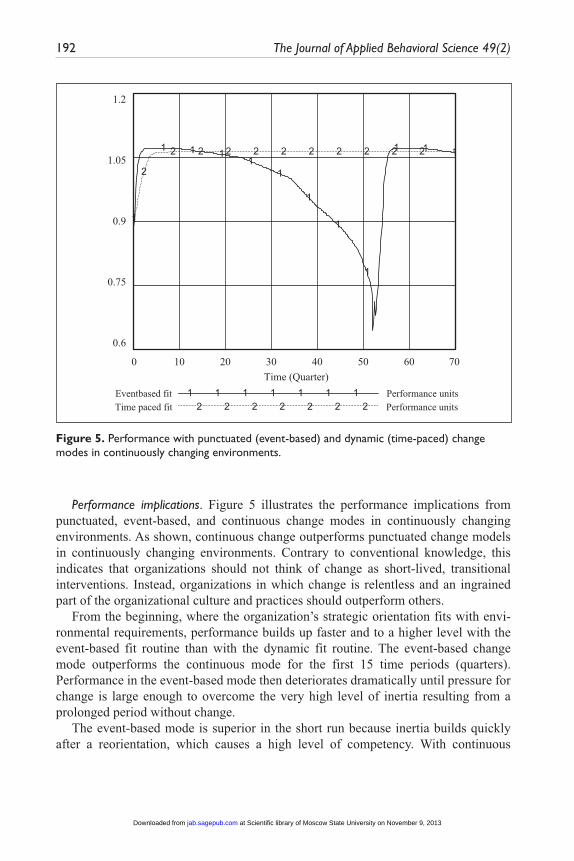
Performance implications. Figure 5 illustrates the performance implications from punctuated, event-based, and continuous change modes in continuously changing environments. As shown, continuous change outperforms punctuated change models in continuously changing environments. Contrary to conventional knowledge, this indicates that organizations should not think of change as short-lived, transitional interventions. Instead, organizations in which change is relentless and an ingrained part of the organizational culture and practices should outperform others.
From the beginning, where the organization’s strategic orientation fits with envi-ronmental requirements, performance builds up faster and to a higher level with the event-based fit routine than with the dynamic fit routine. The event-based change mode outperforms the continuous mode for the first 15 time periods (quarters). Performance in the event-based mode then deteriorates dramatically until pressure for change is large enough to overcome the very high level of inertia resulting from a prolonged period without change.
The event-based mode is superior in the short run because inertia builds quickly after a reorientation, which causes a high level of competency. With continuous
1.2
1.05
0.9
0.75
0.6
2
2 2 2 2 2 2 2 2 2 2
1
1 1 11
1
1
1
1
1 1 1
Time (Quarter)
Eventbased fit Performance units1 1 1 1 1 1 1Time paced fit Performance units2 2 2 2 2 2 2
706050403020100
Figure 5. Performance with punctuated (event-based) and dynamic (time-paced) change modes in continuously changing environments.
at Scientific library of Moscow State University on November 9, 2013jab.sagepub.comDownloaded from
Håkonsson et al. 193
change, inertia builds slower and is constantly lower than in the event-based model. This lower level of inertia causes a performance penalty, but the organization will change with less effort and lower costs. Thus, following Barnett and Carroll (1995), the process costs of the continuous model are higher, due to constant change, but the content costs are lower, due to quasi-equilibrium. With the punctuated change and static fit model, process costs are high following a reorientation, but soon disappear, whereas the content costs are high in periods of convergence.
This means that the short- and long-term implications of the continuous change mode are different. For continuous change to be successful, management must have a long-term perspective on performance. To change, they must pay a short-term per-formance penalty. Management therefore has to sustain a pressure for change, even if short-term performance feedback is negative. In terms of the model, the desired per-formance must continuously be above that achieved by the organization.
In the long term, continuous change outperforms revolutionary change in two important ways, as illustrated in Figure 5. First, average performance with continu-ous change is better (Graph 2) than with revolutionary change (Graph 1). Second, reliability—measured as the variance in mean performance—is higher with continu-ous change. By adapting on an ongoing basis, the organization avoids the perfor-mance disruptions that follow from event based, or revolutionary change. Variance is lower (see Figure 5) with continuous change (measured at 0.00052; 0.0000 if the first 15 periods are omitted) than punctuated or revolutionary change (0.0085). Although change may be costly in the short run, managers should not refrain and stall their change efforts, as the long performance benefits may actually be substantial.
The suggestion that continuously changing organizations may be more reliable than inert organizations is both counterintuitive and important. It is counterintuitive because it is traditionally assumed that stability, convergence, and reliability go together; it is important as this assumption is key for organizational theories and models.
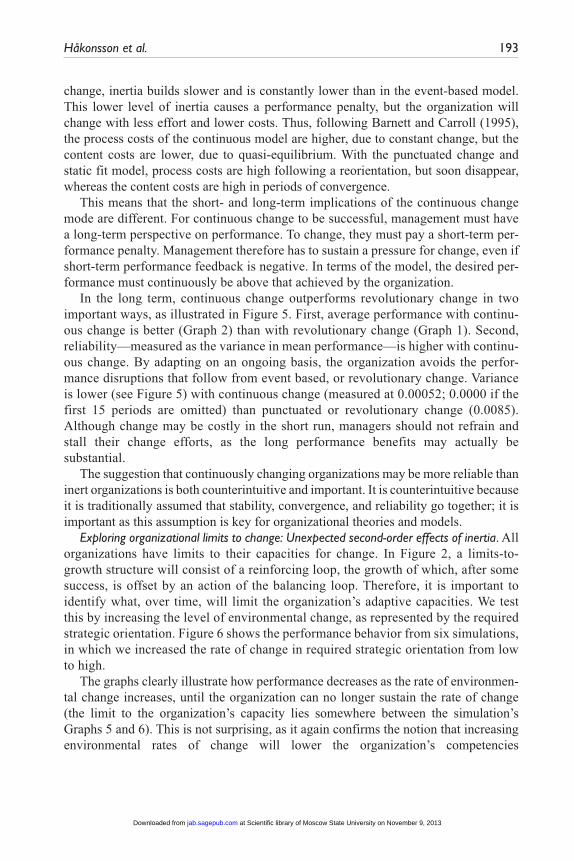
Exploring organizational limits to change: Unexpected second-order effects of inertia. All organizations have limits to their capacities for change. In Figure 2, a limits-to-growth structure will consist of a reinforcing loop, the growth of which, after some success, is offset by an action of the balancing loop. Therefore, it is important to identify what, over time, will limit the organization’s adaptive capacities. We test this by increasing the level of environmental change, as represented by the required strategic orientation. Figure 6 shows the performance behavior from six simulations, in which we increased the rate of change in required strategic orientation from low to high.
The graphs clearly illustrate how performance decreases as the rate of environmen-tal change increases, until the organization can no longer sustain the rate of change (the limit to the organization’s capacity lies somewhere between the simulation’s Graphs 5 and 6). This is not surprising, as it again confirms the notion that increasing environmental rates of change will lower the organization’s competencies
at Scientific library of Moscow State University on November 9, 2013jab.sagepub.comDownloaded from
194 The Journal of Applied Behavioral Science 49(2)
and performance. Therefore, the continuous change model works well as long as envi-ronmental change remains at a certain level. But how can organizations pursue con-tinuous change in extremely dynamic environments?
A closer analysis of the model and its behavior revealed a surprising insight. Following prevalent theory, the variables associated with driving change should limit change ability. In our model, these variables are responsiveness, ability to change, misfit, and pressure to change. Yet, as shown in above, there were certain limits to the ability to maintain high levels of change from adjusting these variables only. Instead, we found that the inertia growth scaling factor limited change capability in the model. This factor allows the size of the inertia increase to be varied.
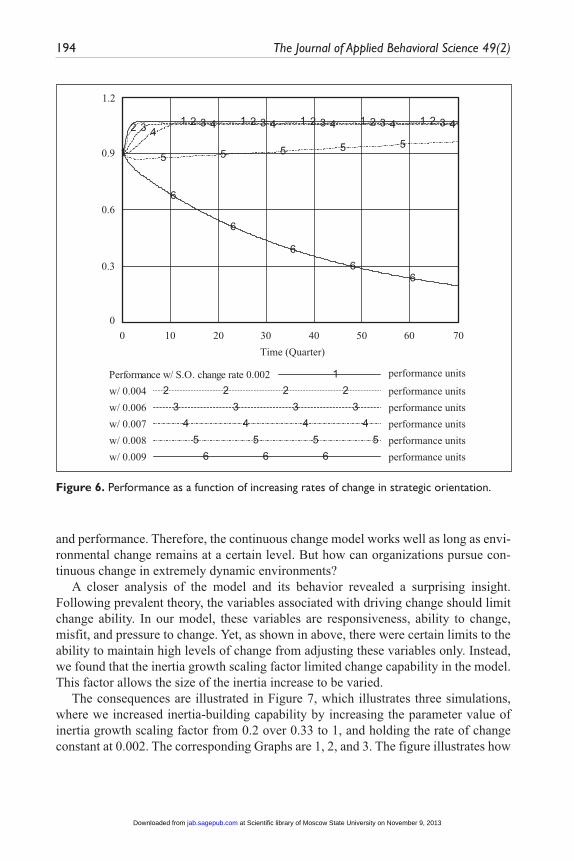
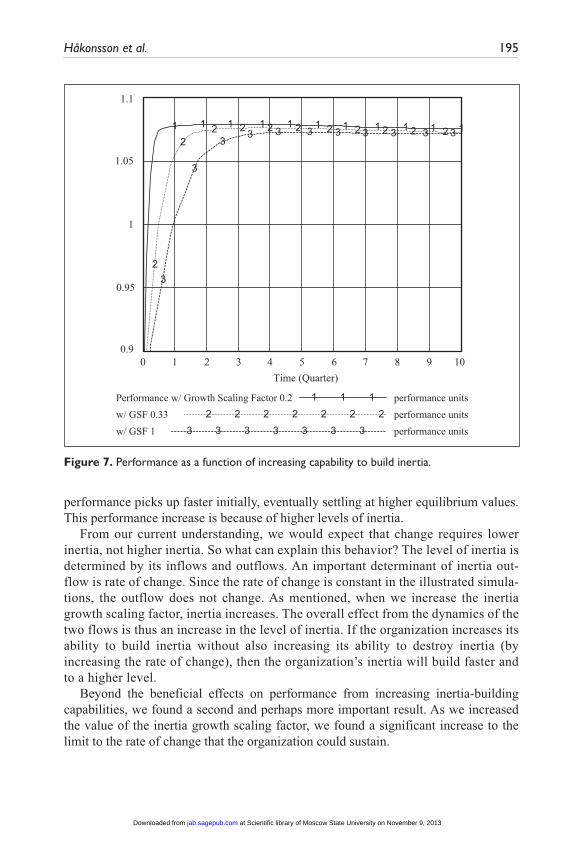
The consequences are illustrated in Figure 7, which illustrates three simulations, where we increased inertia-building capability by increasing the parameter value of inertia growth scaling factor from 0.2 over 0.33 to 1, and holding the rate of change constant at 0.002. The corresponding Graphs are 1, 2, and 3. The figure illustrates how
1.2
0.9
0.6
0.3
0
6
6
66
6
5 5 5 5 54
4 4 4 4 43 3 3 3 3 32 2 2 2 2 2
1
1 1 1 1 1
Time (Quarter)
200.0etaregnahc.O.S/wecnamrofreP 1w/ 0.004 performance units2 2 2 2w/ 0.006 performance units3 3 3 3w/ 0.007 performance units4 4 4 4w/ 0.008 performance units5 5 5 5w/ 0.009 performance units6 6 6
performance units
706050403020100
Figure 6. Performance as a function of increasing rates of change in strategic orientation.
at Scientific library of Moscow State University on November 9, 2013jab.sagepub.comDownloaded from
Håkonsson et al. 195
performance picks up faster initially, eventually settling at higher equilibrium values. This performance increase is because of higher levels of inertia.
From our current understanding, we would expect that change requires lower inertia, not higher inertia. So what can explain this behavior? The level of inertia is determined by its inflows and outflows. An important determinant of inertia out-flow is rate of change. Since the rate of change is constant in the illustrated simula-tions, the outflow does not change. As mentioned, when we increase the inertia growth scaling factor, inertia increases. The overall effect from the dynamics of the two flows is thus an increase in the level of inertia. If the organization increases its ability to build inertia without also increasing its ability to destroy inertia (by increasing the rate of change), then the organization’s inertia will build faster and to a higher level.
Beyond the beneficial effects on performance from increasing inertia-building capabilities, we found a second and perhaps more important result. As we increased the value of the inertia growth scaling factor, we found a significant increase to the limit to the rate of change that the organization could sustain.
1.1
1.05
1
0.95
0.9
3
3
33 3 3 3 3 3 3 3
2
22 2 2 2 2 2 2 2 21 1 1 1 1 1 1 1 1 1 1
Time (Quarter)
Performance w/ Growth Scaling Factor 0.2 performance units1 1 1
w/ GSF 0.33 performance units2 2 2 2 2 2 2
w/ GSF 1 performance units3 3 3 3 3 3 3
109876543210
Figure 7. Performance as a function of increasing capability to build inertia.
at Scientific library of Moscow State University on November 9, 2013jab.sagepub.comDownloaded from
196 The Journal of Applied Behavioral Science 49(2)
This is important because it demonstrates that organizations are indeed able to change despite building inertia. In that sense, it explains why continuous change can be sustained in inertia-building organizations. The key here is that it is not the state of inertia but the rate of inertia that is influential. This is no trivial insight. Theories have so far focused on the relationship between the level of inertia and the level of change or, in the context of this particular model, between competence and appropriateness (Sastry, 1997). Our simulations indicate that this emphasis is wrong; instead, the relevant analytical focus is between the rates and levels of inertia, and our results suggest that processes can be changed significantly without necessarily disrupting them.
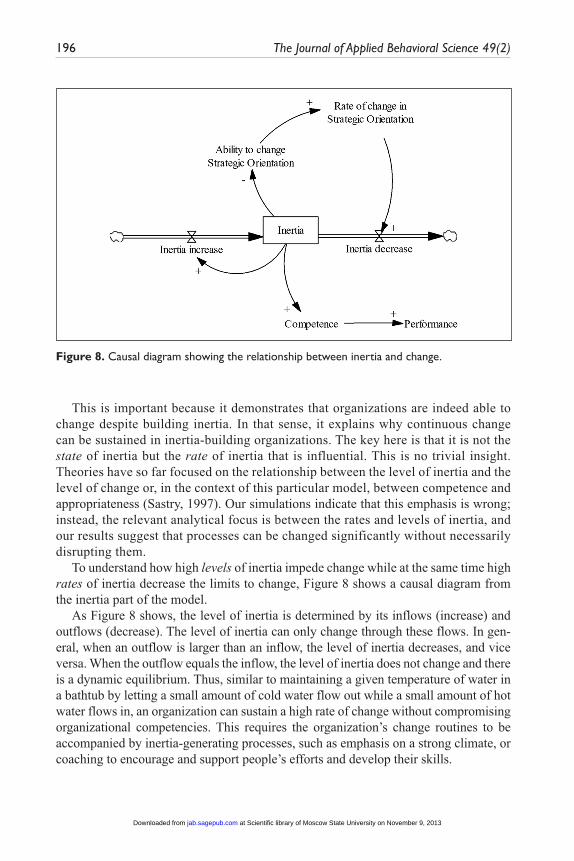
To understand how high levels of inertia impede change while at the same time high rates of inertia decrease the limits to change, Figure 8 shows a causal diagram from the inertia part of the model.
As Figure 8 shows, the level of inertia is determined by its inflows (increase) and outflows (decrease). The level of inertia can only change through these flows. In gen-eral, when an outflow is larger than an inflow, the level of inertia decreases, and vice versa. When the outflow equals the inflow, the level of inertia does not change and there is a dynamic equilibrium. Thus, similar to maintaining a given temperature of water in a bathtub by letting a small amount of cold water flow out while a small amount of hot water flows in, an organization can sustain a high rate of change without compromising organizational competencies. This requires the organization’s change routines to be accompanied by inertia-generating processes, such as emphasis on a strong climate, or coaching to encourage and support people’s efforts and develop their skills.
Figure 8. Causal diagram showing the relationship between inertia and change.
at Scientific library of Moscow State University on November 9, 2013jab.sagepub.comDownloaded from
Håkonsson et al. 197
The exact limit to the organization’s capacity for change is when the rate of inertia increase equals that of inertia decrease. Beyond this point, even marginal increases in the rate of change in strategic orientation, and with it inertia decrease, will cause a steady decrease in inertia, and with it competence. This “tipping point” is a critical transition, where the organization moves from a stable, sustainable situation to an unstable, unsustainable situation. This is because there is a reinforcing relationship between the level of and the inflow of inertia.
When inflow is larger than outflow, the resulting increase in inertia will lead to further inertia increase. This creates a positive reinforcing relationship, stabilizing the organization in a sustainable situation, that is, in a situation where its competencies, workflows, and so on, remain complete and operating for good performance. But when the tipping point is reached, the resulting decrease in level of inertia will trigger a further decrease the inflow of inertia. This makes the reinforcing relationship between level and inflow of inertia negative, bringing the organization into a destabi-lizing, unsustainable development. In this mode, performance and competencies decrease to a point where revolutionary change is necessary, with the performance implications discussed above.
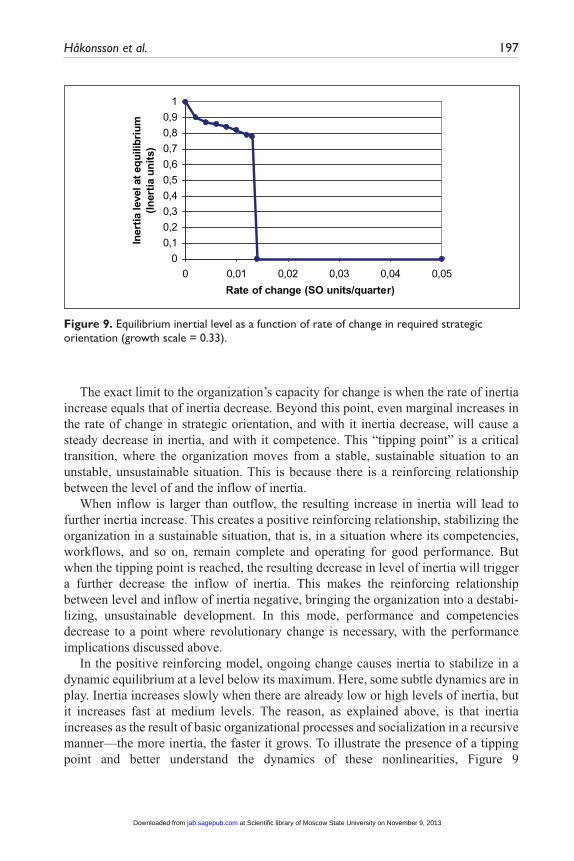
In the positive reinforcing model, ongoing change causes inertia to stabilize in a dynamic equilibrium at a level below its maximum. Here, some subtle dynamics are in play. Inertia increases slowly when there are already low or high levels of inertia, but it increases fast at medium levels. The reason, as explained above, is that inertia increases as the result of basic organizational processes and socialization in a recursive manner—the more inertia, the faster it grows. To illustrate the presence of a tipping point and better understand the dynamics of these nonlinearities, Figure 9
00,10,20,30,40,50,60,70,80,91
0 0,01 0,02 0,03 0,04 0,05Rate of change (SO units/quarter)
Iner
tia le
vel a
t equ
ilibr
ium
(Iner
tia u
nits
)
Figure 9. Equilibrium inertial level as a function of rate of change in required strategic orientation (growth scale = 0.33).
at Scientific library of Moscow State University on November 9, 2013jab.sagepub.comDownloaded from
198 The Journal of Applied Behavioral Science 49(2)
shows equilibrium values of inertia level as a function of rate of change, with the growth scaling factor held constant at 0.33; that is, inertia increase is held constant whereas inertia decrease is moved from low to high by increasing rate of change.
Figure 9 demonstrates how small rates of change above zero cause a relatively large drop in inertia, from 1 to approximately 0.9; beyond this initial drop, inertia levels off even as rates of change continue to increase. The tipping point represent-ing the limit to change is clearly visible as a vertical drop to zero inertia. From a managerial point of view, these dynamics mean that management can keep the organization agile on an ongoing basis with small change efforts and performance penalties. Furthermore, with larger rates of continuous change, inertia levels off at medium levels. This seems to stabilize the relationship between change and inertia, allowing management to increase change without the collapse of organization cul-ture, stakeholder relationships, workflows, and other reflections of organizational competence.
Discussion and ConclusionThe paradox of how to achieve continuous change while remaining efficient is a long-standing and important debate. Even if our intuitive understanding of it is well devel-oped, our theoretical and empirical understandings of it are less developed. This is problematic, especially for practice, because ambiguous guidelines are not sufficient to conduct successful change processes.
We used a simulation approach that enabled us to explore the dialectics of flexibil-ity and efficiency by examining what structural properties allow an organization to achieve continuous change while remaining efficient. Two questions guided the simulations.
First, what would it take to make an inertia-building organization flexible? This question addressed traditional views holding that organizations in dynamic environ-ments must decrease the amount of structure, thus sacrificing efficiency, in order to obtain flexibility. This linear view on the trade-off between flexibility and efficiency has received widespread acceptance across disciplines ever since Burns and Stalker (1961) first introduced the idea of a continuum between the mechanistic and the organic organization. However, more recent literature (Davis et al., 2009; Espedal, 2006; Siggelkow, 2002) has argued that increasing the level of structure may, at least under certain conditions, allow organizations to behave more flexibly. Our simulations showed that the combination of increased organizational responsiveness, a dynamic fit routine, and a management team with a long-term perspective enabled an organization to adapt continuously. Thus, our study not only supports recent findings that structure may increase flexibility but further adds to these studies by also specifying what struc-tural properties enable continuous change.
Second, how would this affect organizational performance in a continuously chang-ing environment? This question looked into the performance consequences of continu-ous change. Where previous studies have argued that structural change causes a loss of
at Scientific library of Moscow State University on November 9, 2013jab.sagepub.comDownloaded from
Håkonsson et al. 199
competency and thereby reliability, our findings indicated that long-term organiza-tional performance and reliability (i.e., the variance in average performance) were both superior with continuous change. This result is not only surprising but also impor-tant. If organizations can increase flexibility and efficiency at the same time, this ques-tions whether the traditional efficiency-flexibility paradox is indeed an inherent attribute of organizations, or merely a matter of design.
Indeed, our results indicated that when designed for flexibility, organizational per-formance is an increasing function of the organization’s ability to build inertia (not the level of inertia). The key for sustainable organizational change, according to our model, is not dependent on low levels of inertia but instead on the ability to build new competencies at the same rate as they are destroyed.
Our results therefore question the idea of stability and change as being mutually exclusive, by separating the states of organizational inertia and competency from the processes that build and destroy them. This indicates that change should not be perceived as a particular mode or state of organizing but rather as a process, and our findings suggest that we may have overlooked this fundamental distinction until now.
Our article challenges much conventional wisdom that views organizations under-going change as being in a special state. Lewin’s (1951) concept of planned change epitomizes this assumption. Since Lewin’s (1951) work, many prominent models of change have reflected this view, including Tushman and Romanelli’s (1985) model, where periods of convergence are punctuated by periods of organizational transforma-tion; Cyert and March’s (1963) model, where change is initiated in response to a fail-ure to meet aspiration levels; or Greiner’s (Greiner, 1967, 1998) growth phases model, depicting organizational life as phases that are interrupted by crises. Even Kotter’s (1995) eight steps of organizational change are sometimes used as evidence that orga-nizational change can proceed through eight planned stages. These models all share the view that change is special, as in a “second order” (Argyris & Schon, 1978; Levinthal & March, 1981) routine, invoked only as a function of (perceived) perfor-mance. Hence, even research focusing on organizations as adaptive systems tends to assume that change is the exception rather than the rule.
In contrast, our research indicates that change should be seen as a constant, endemic to the organization. Moreover, our results also indicate that firms that manage this bal-ance between change and inertia experience superior performance outcomes in the long run.
Managerial ImplicationsIn terms of the managerial implications of these results, our study indicates that man-agers face two fundamental tasks. One concerns the implementation of the structural design elements identified as necessary and sufficient to achieve continuous, sustain-able change, and the other concerns the processes involved in destroying and building inertia.
at Scientific library of Moscow State University on November 9, 2013jab.sagepub.comDownloaded from
200 The Journal of Applied Behavioral Science 49(2)
Regarding the first fundamental task, three structural elements were identified of importance to managers pursuing sustainable change: a dynamic fit routine, respon-siveness, and long-term management.
Regarding the design of a dynamic fit routine, what characterizes the design of a dynamic fit routine as opposed to a static fit routine is the longitudinal aspect. Focus is on prediction of the fit between the firm’s strategic orientation and future environ-ments rather than on the diagnosis of an existing gap between these. Hence, to install a dynamic fit routine, the previous year’s rates of change should be incorporated proactively, for instance, in terms of regular deadlines, by determining that one new product should be introduced every six months, or by deciding that 20% of revenues should come from new products. Monitoring of environmental shifts and trends and foreseeing their likely implications to the expected degree of required change, relative to the current level of change, is essential.
In terms of designing for higher responsiveness, management may install a practice of, for example, starting every meeting with roundtable briefings on the latest insights on customer and competitor moves. They might also hold bimonthly rather than bian-nual strategy seminars, or implement similar initiatives that may lead to a more responsive policy for change.
In terms of designing a long-term and proactive managerial perspective, our find-ings demonstrated that aiming to achieve more than the previous year’s performance is needed. Management should not simply lean back when budget targets are in green, but instead should continuously strive for achieving more and better results. Here, management needs to change its assumptions of desired performance. Active bench-marking and comparison to competitors’ results may be one way of not settling for what one is used to achieving but rather continuously striving for better results. However, as has also been documented by research taking a cognitive approach to change research (e.g., Bartunek & Moch, 1987), second- and third-order change can-not be achieved unless cognitive schemata are also changed. Hence, designing such long-term, proactive perspectives is not easily done.
As our results indicate, even if it is difficult to implement these three structural properties, the long-term performance consequences were such that the efforts are worthwhile. Yet, to obtain these performance effects, managerial efforts needed to be ongoing and persistent, as the beneficial performance effects were only obtained in the long run, not in the short run.
Turning to the second fundamental task of managers, relating to the processes involved in destroying and building inertia, our study showed that the key for sustain-able organizational change was the ability to build new competencies at the same rate as they are destroyed. This suggests that fast scaling of inertia through building struc-tures, organizational culture, and relationships is of strategic importance for develop-ing dynamic capabilities. Inertia and competence emerge from two sources: the relationships that the organization builds with its environment (such as customers and
at Scientific library of Moscow State University on November 9, 2013jab.sagepub.comDownloaded from
Håkonsson et al. 201
suppliers) and internal consistency (such as socialization and operating rules; Sastry, 1997). Both are essential for sustainable change. How, then, can managers most effi-ciently speed up processes of socialization and building routines while at the same time destroying them as the competitive environment changes? A key element seems to be learning, or coaching, both based on a system’s understanding. However, such ongoing, continuous efforts denote a different role for change managers than that of “simply” creating periodic change interventions.
Broader ImplicationsA number of broad-reaching principles can be derived from our results. First, leaders should see themselves more as designers of structures that support continuous change than as initiators of change interventions. The system design, and more specifically the three identified structural properties, jointly—not separately—actually helped sustain change in our model. Of course, understanding the system and its interdependencies is essential for getting the right design, but the benefits of thinking of the system as a whole in the end can help managers create continuously changing organizations.
Second, leaders should prepare for continuous rather than episodic change. Our results indicate that managers should not think of change as episodic change projects with an end to them but rather should emphasize continuous, sustainable change for better performance. This implies a shift away from management having to initiate change interventions that interrupt a given status quo toward thinking of change efforts as ongoing and consolidating.
Third, when facing change, unless there is a dire crisis, move incrementally rather than transformationally so as to support higher levels of adaptation over time. Leaders should strive to make learning and coaching initiatives continuous and ongoing for superior, long-term performance.
Finally, managers should not give up! Our results indicated that change in the short run will lead to a performance decline. Yet, as organizations continue building their capabilities for change, our results also indicated that change in the long run became superior even to driven change. Thus, managers should not give up after initial lack of success; instead, they should persist and maintain a long-term focus.
Clearly, these principles are brought forth by looking at an organization as a com-plex system with many circular, interlocking, and sometimes delayed relationships among its components. Consequently, we could not easily have obtained these insights without the use of a computer simulation model, enabling us to study the dynamic relationships between the many components of an organization rather than studying these components individually. At the same time, a computer simulation is of course an abstract representation, wherefore the results of our study are mainly indicative and should be squared with further analysis from organizations. Overall, we recommend further research, as our study clearly holds exciting and relevant implications in the post-2008 global business environment.
at Scientific library of Moscow State University on November 9, 2013jab.sagepub.comDownloaded from
202
Ove
rvie
w o
f Rep
orte
d Si
mul
atio
ns a
nd T
heir
Para
met
er S
ettin
gs
Run
Nam
eFi
gure
Mod
ela
Req
uire
d S.
O./
Cha
nge
in
Req
uire
d S.
O.
Res
pons
iven
ess
Iner
tia, t
= 0
Des
ired
Pe
rfor
man
ceIn
ertia
Gro
wth
Sc
alin
g Fa
ctor
Sast
ry F
igur
e 2
App
. D, 2
10
Low
(2)
0.7
15
Sast
ry F
igur
e 3
App
. D, 3
10
0.68
15
Sast
ry F
igur
e 4
App
. D, 4
10,
the
n 1
0.5
15
Sast
ry F
igur
e 5
App
. D, 5
10,
the
n 1
Hig
h (7
)0.
51
5Sa
stry
Fig
ures
6 a
nd 7
App
. D, 6
10,
the
n 1
Low
(2)
0.5
15
Sast
ry F
igur
e 8
App
. D, 6
10,
the
n 1
0.6
15
Con
tinuo
us, d
ynam
ic fi
t, lo
w
DP
and
R2
20.
005/
quar
ter
Hig
h (7
)0.
61
5
Con
tinuo
us, d
ynam
ic fi
t an
d lo
w D
P2
20.
005/
quar
ter
Very
hig
h (7
0)0.
61
5
Con
tinuo
us, e
vent
-bas
ed fi
t3,
4, 5
, 61
0.00
5/qu
arte
rH
igh
(7)
0.6
15
Con
tinuo
us, t
ime-
pace
d fit
3, 4
, 5, 6
20.
005/
quar
ter
Very
hig
h (7
0)0.
61.
25
Iner
tia G
SF 5
, cha
nge
002/
004/
006/
007/
008/
009
72
0.00
2, 0
.004
, 0.0
06,
0.00
7, 0
.008
, 0.
009/
quar
ter
Very
hig
h (7
0)0.
61.
25
Iner
tia G
SF 5
/3/1
, cha
nge
0.00
28,
92
0.00
2/qu
arte
rVe
ry h
igh
(70)
0.6
1.2
5/3/
1,
resp
ectiv
ely
a. 1
= S
astr
y ba
selin
e (o
ur r
eplic
atio
n of
Sas
try’s
, 199
7, m
odel
). 2
= s
econ
d-or
der
fit m
odel
(ou
r re
plic
atio
n of
Sas
try’s
mod
el w
ith o
ur m
odifi
catio
n of
the
fit
mea
sure
men
t ro
utin
e).
App
endi
x
at Scientific library of Moscow State University on November 9, 2013jab.sagepub.comDownloaded from
Håkonsson et al. 203
Declaration of Conflicting Interests
The authors declared no potential conflicts of interest with respect to the research, authorship, and/or publication of this article.
Funding
The authors received no financial support for the research, authorship, and/or publication of this article.
Notes
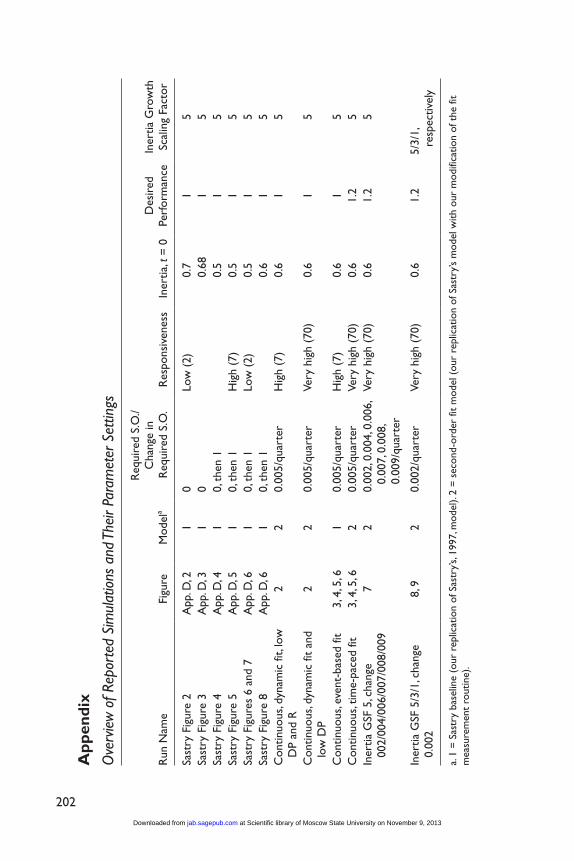
1. Naturally, our first step was to replicate all the simulations reported in Sastry (1997). The parameter settings of our replication results, as well as the parameter settings of the results, are reported in the appendix. The full, specified model is identical to Sastry’s (1997) and is available from the first author of the article.
2. All parameter settings are parallel to Sastry (1997). As mentioned in Note 1, an appendix with all parameter settings is available from the first author of the article.
References
Argyris, C., & Schon, D. (1978). Organizational Learning: A theory of action approach. Read-ing, MA: Addison Wesley.
Barnett, W. P., & Carroll, G. R. (1995). Modeling internal organizational change. Annual Review of Sociology, 21, 217-236.
Bartunek, J. M., & Moch, M. K. (1987). First-order, second-order, and third-order change and organization development interventions: A cognitive approach. Journal of Applied Behav-ioral Science, 23, 483-500.
Becker, M. C., & Knudsen, T. (2005). The role of routines in reducing pervasive uncertainty. Journal of Business Research, 58, 746-757.
Brown, S. L., & Eisenhardt, K. M. (1997). The art of continuous change: Linking complexity theory and time-paced evolution in relentlessly shifting organizations. Administrative Sci-ence Quarterly, 42, 1-34.
Burke, W. W., & Litwin, G. H. (1992). A causal model of organizational performance and change. Journal of Management, 18, 523-545.
Burns, T., & Stalker, G. (1961). The management of innovation. London, England: Tavistock.Carroll, T., & Burton, R. M. (2000). Organizations and complexity: Searching for the edge of
chaos. Computational & Mathematical Organization Theory, 6, 319-337.Cyert, R. M., & March, J. G. (1963). A behavioral theory of the firm. Englewood Cliffs, NJ:
Prentice-Hall.Davis, J. P., Eisenhardt, K. M., & Bingham, C. B. (2009). Optimal structure, market dynamism,
and the strategy of simple rules. Administrative Science Quarterly, 54, 413-452.Donaldson, L. (2001). The contingency theory of organizations: Thousand Oaks, CA: Sage.Eisenhardt, K. M., & Brown, S. L. (1998). Time pacing: Competing in markets that won’t stand
still. Harvard Business Review, 76(2), 59-70.
at Scientific library of Moscow State University on November 9, 2013jab.sagepub.comDownloaded from
204 The Journal of Applied Behavioral Science 49(2)
Eisenhardt, K. M., & Sull, D. N. (2001). Strategy as simple rules. Harvard Business Review, 79, 106-119.
Espedal, B. (2006). Do organizational routines change as experience changes? Journal of Applied Behavioral Science, 42, 468-490.
Feldman, M. S., & Pentland, B. T. (2003). Reconceptualizing organizational routines as a source of flexibility and change. Administrative Science Quarterly, 48, 94-118.
Forrester, J. W. (1961). Industrial dynamics (Vol. 5). Cambridge: MIT press.Gersick, C. J. G. (1994). Pacing strategic change: The case of a new venture. Academy of Man-
agement Journal, 37(1), 9-45.Greiner, L. E. (1967). Antecedents of planned organization change. Journal of Applied Behav-
ioral Science, 3, 51-85.Greiner, L. E. (1998, May). Evolution and revolution as organizations grow. Harvard Business
Review, 76(3), 55.Greve, H. R. (2003). Organizational learning from performance feedback: A behavioral per-
spective on innovation and change: Cambridge, England: Cambridge University Press.Hannan, M. T., & Freeman, J. (1984). Structural inertia and organizational change. American
Sociological Review, 49, 149-164.Harrison, J. R., Lin, Z., Carroll, G. R., & Carley, K. M. (2007). Simulation modeling in
organizational and management research. Academy of Management Review Archive, 32, 1229-1245.
Kotter, J. P. (1995). Leading change: Why transformation efforts fail. Harvard Business Review, 73(2), 59-67.
Larsen, E., & Lomi, A. (2002). Representing change: a system model of organizational inertia and capabilities as dynamic accumulation processes. Simulation Modelling Practice and Theory, 10, 271-296.
Levinthal, D., & March, J. G. (1981). A model of adaptive organizational search. Journal of Economic Behavior & Organization, 2, 307-333.
Lewin, K. (1951). Field theory in social science: Selected theoretical papers. New York, NY: Harper.
March, J. G. (1991). Exploration and exploitation in organizational learning. Organization Sci-ence 2(1), 71-87.
Orlikowski, W. J. (1996). Improvising organizational transformation over time: A situated change perspective. Information systems research, 7(1), 63-92.
Poole, M. S., & Van de Ven, A. H. (1989). Using paradox to build management and organization theories. Academy of Management Review, 14, 562-578.
Sastry, M. A. (1997). Problems and paradoxes in a model of punctuated organizational change. Administrative Science Quarterly, 42, 237-275.
Senge, P. (1990). The fifth discipline: The art and practice of the learning organization. London, England: Century Business.
Siggelkow, N. (2002). Evolution toward fit. Administrative Science Quarterly, 47, 125-159.Smith, W. K., & Lewis, M. W. (2011). Toward a theory of paradox: A dynamic equilibrium
model of organizing. Academy of Management Review, 36, 381-403.
at Scientific library of Moscow State University on November 9, 2013jab.sagepub.comDownloaded from
Håkonsson et al. 205
Teece, D. J. (2009). Dynamic capabilities and strategic management: Organizing for innovation and growth. Oxford, England: Oxford University Press.
Tucker, J. S., Cullen, J. C., Sinclair, R. R., & Wakeland, W. W. (2005). Dynamic systems and organizational decision-making processes in nonprofits. Journal of Applied Behavioral Sci-ence, 41, 482-502.
Tushman, M. L., & Nadler, D. A. (1978). Information processing as an integrating concept in organizational design. Academy of Management Review, 3, 613-624.
Tushman, M. L., & Romanelli, E. (1985). Organizational evolution: A metamorphosis model of convergence and reorientation. Research in Organizational Behavior, 7, 171-222.
Van de Ven, A. H., & Sun, K. (2011). Breakdowns in models of organization change and devel-opment. Academy of Management Perspectives, 25(3), 58-74.
Weick, K. E., & Quinn, R. E. (1999). Organizational change and development. Annual Review of Psychology, 50, 361-386.
Weick, K. E., & Roberts, K. H. (1993). Collective mind in organizations: Heedful interrelating on flight decks. Administrative Science Quarterly, 38, 357-381.
Zajac, E. J., Kraatz, M. S., & Bresser, R. K. F. (2000). Modeling the dynamics of strategic fit: A normative approach to strategic change. Strategic Management Journal, 21, 429-453.
Author Biographies
Dorthe Døjbak Håkonsson is Mindlab Associate Professor at ICOA, Aarhus University, Denmark. Her research interests resolve around organizational design, organizational change and the impact of group emotions on decision making and information processing. Dorthe Døjbak Håkonsson is employed as a consultant at EcoMerc.
Peter Klaas is associate professor at Aarhus University, Denmark. His research interests are organization design and adaptation, with a special focus on dynamic fit and non-linear growth models. Peter has held senior management positions in industry since 1995 and is associate editor of Journal of Organization Design.
Timothy N. Carroll is on faculty at the Darla Moore School of Business at the University of South Carolina. His research centers on organizational adaptation, organization design, and strategy.