Embed Size (px)
Citation preview
broadbandcommission.orgPublished in Switzerland
Geneva, 2018
International Telecommunication
UnionPlace des Nations
CH-1211 Geneva 20Switzerland
Pho
to C
red
it: S
hutt
erst
ock
The State of Broadband: Broadband catalyzing
sustainable developmentSeptember 2018
9 7 8 9 2 6 1 2 6 4 2 1 5
ISBN 978-92-61-26421-5

THE STATE OF BROADBAND 2018: BROADBAND CATALYZING SUSTAINABLE DEVELOPMENT
September 2018
ACKNOWLEDGEMENTS
This Report has been written collaboratively, drawing on insights and contributions from a range of Commissioners and their organizations. It has been compiled and edited by the chief editor and co-author, Phillippa Biggs of ITU. Ivan Vallejo-Vall provided statistical support and data. Design concepts were developed by Ahone Njume-Ebong, Lili Gao, Laurent Ducrettet and Maynard Adea of ITU, with support from Simon de Nicola. Pierre Antoine, Dominika Ornatowska and Anna Polomska kindly assisted with research for Annex 1. We should especially like to thank Colin Mitchell and Bastiaan Quast for their review and comments. Contributions are listed in order, and under their contribution. We wish to thank the following people for their kind review (by alphabetical order of institution, followed by alphabetical order of surname):
• Bharti Airtel;• Patrik Cerwall, Matilda Gennvi Gustafsson and Heather Johnson from Ericsson;• Lars-Erik Forsberg and Hanna Henrikus from the European Commission and Luukas
Ilves, Katarzyna Jakimowicz and Stephanie Lepczynski from the Lisbon Council;• Chris Hemmerlein of Facebook;• Robert Kirkpatrick, Miguel Luengo-Oroz, Mila Romanoff, Josiane
Toundzi Dzouankeu and Felicia Vacarelu of UN Global Pulse;• Lauren Dawes, Belinda Exelby, Joss Gillet, Natalia Pshenichnaya,
Kyla Reid, Edele Sheehan & Claire Sibthorpe of GSMA;• Ivan Huang of Huawei;• Leong Keng Thai and Angela Wibawa of Infocomm Media Development Authority (IMDA);• Jennifer Esposito from Intel;• Stephen Spengler of Intelsat;• Piotr Dmochowski-Lipski and and Estelle Schnitzler of EUTELSAT IGO;• Renata Brazil-David and Patrick Masambu of ITSO;• Phillippa Biggs, Youlia Lozanova and Ahone Njume-Ebong of ITU;• Dr. Speranza Ndege of Kenyatta University; • Yina Ha, Byungki Oh and Ilbum of KT Corp.;• Paul Mitchell of Microsoft;• Barry French, Brahim Ghribi, Elizabeth Rojas-Levi and Marc Vancoppenolle of Nokia;• Dr. Ann Aerts of the Novartis Foundation;• Anne Carblanc, Sam Paltridge and Lorrayne Porciuncula of the OECD;• Philipp Metzger, Nicolas Rollier and Raphael Scherrer of the Swiss regulator OFCOM;• Fatima Sultan Al-Kuwari and Ali Hamad Hassan Al Sulaiti of Ooredoo;• Patrick Nyirishema and Janet Umutesi of the Rwanda Utilities Regulatory Authority (RURA);• Minah Ali Rahore, Sohaib Arshad, Melle Groenestege and Tomas Lamanauskas of VEON;• Andrew Arowojolu and Jennifer Suleiman of Zain Group.
ISBN: 978-92-61-26421-5 (paper version) 978-92-61-26431-4 (electronic version) 978-92-61-26441-3 (eBook version) 978-92-61-26451-2 (mobile version)
2 The State of Broadband 2018
Executive Summary .................................................................................................................................6
1 Connecting the Unconnected ..........................................................................................................8
2 Rapidly Evolving Technologies .......................................................................................................102.1 Mobile Broadband................................................................................................................152.2 Fixed Broadband ...................................................................................................................202.3 Internet of Things .................................................................................................................252.4 Towards the Next Generation of Satellite Broadband .........................................................28
3 Evaluating Growth in Broadband Using the Commission’s Targets ...............................................343.1 Advocacy Target 1: Making broadband policy universal .....................................................353.2 Advocacy Target 2: Making broadband affordable ..............................................................393.3 Advocacy Target 3: Getting People Online ...........................................................................413.4 Advocacy Target 4: Digital Skills & Literacy ..........................................................................433.5 Advocacy Target 5: Digital Financial Services ......................................................................463.6 Advocacy Target 6: Getting businesses online ....................................................................483.7 Advocacy Target 7: Achieving gender equality in access to broadband by 2025 ...............51
4 Advanced Technologies for Sustainable Development .................................................................564.1 Digital Technologies for Education .......................................................................................604.2 Digital Technologies for Health ............................................................................................634.3 Digital Technologies for the Environment ............................................................................67
5 Recommendations for Boosting Broadband ..................................................................................705.1 Build National Leadership for Broadband ............................................................................705.2 Promote Training and Measures to Stimulate Demand ......................................................705.3 Benchmark and Monitor ICT Developments .......................................................................715.4 Review Universal Service Measures, including RoW regulations ........................................715.5 Strengthen Digital Skills & Literacy ......................................................................................735.6 Support Local e-Businesses and Local Entrepreneurship ....................................................735.7 Review and adapt legal frameworks to take into account digitalization .............................735.8 Reduce taxes and Import Duties on Telecom/ICT Equipment and Services .......................73
List of Acronyms and Abbreviations .....................................................................................................89
3The State of Broadband 2018
CONTENTS
4 The State of Broadband 2018
CONTENTSTables
Table 1: Estimates of the Global Market: 2015, 2016, 2017, 2020 and 2021 .................................... 11Table 2: The Main xDSL Technologies .................................................................................................. 24Table 3: Different Technologies Used for IoT....................................................................................... 28Table 4: Different Types of Data........................................................................................................... 57Annex 1: Target 1 – List of National Broadband Policies, 2018 ........................................................... 74Annex 2: Fixed-Broadband Subscriptions per 100 inhabitants, 2017 ................................................. 80Annex 3: Mobile-Broadband Subscriptions per 100 inhabitants, 2017 .............................................. 82Annex 4: Percentage of Individuals using the Internet, 2017 ............................................................. 84Annex 5: Percentage of Individuals using the Internet, Developing Countries, 2017 ........................ 86Annex 6: Percentage of Individuals using the Internet, LDCs, 2017 ................................................... 88
Figures
Figure 1: The Structure of this Report ................................................................................................... 9Figure 2: Average Connection Speeds Globally, by Country, 2018 ..................................................... 10Figure 3: Growth in Number of Users of Messaging and Hybrid Networks, 2011-2017 ................... 13Figure 4: Changing Mobile Coverage, by Type of Network, 2007-2016 ............................................. 15Figure 5: The Total Cost of Ownership for Mobile Access Networks will Increase ............................. 19Figure 6: Data Mobile-Only Population for Urban and Rural Areas, Selected Countries, 2017 ......... 20Figure 7: Technology Market Share by Region, Q4 2017 .................................................................... 21Figure 8: Bandwidth and Traffic Speeds for PON ................................................................................ 23Figure 9: How IoT is Driving Change .................................................................................................... 27Figure 10: Policy Leadership in National Broadband Plans, 2008-2018 ............................................. 36Figure 11: Policies on Net Neutrality, 2017 ......................................................................................... 38Figure 12: Who Regulates What in ICT? .............................................................................................. 39Figure 13: Affordability & Broadband Prices, 2016 ............................................................................. 40Figure 14: Internet User Penetration, 2017 ........................................................................................ 42Figure 15: Digital Skills Worldwide, 2017 ............................................................................................ 44Figure 16: Digital Financial Services, 2018 .......................................................................................... 47Figure 17: Business use of Internet and level of technology intensity in developing countries, by industry ................................................................................................................................................ 48Figure 18: Measuring the Gender Gap in Internet Usage .................................................................. 52
Viewpoints
Viewpoint 1: Expanding Access to Broadband Infrastructure with the 4 Is ....................................... 10Viewpoint 2: The Move from Traditional Connectivity to Intelligent Connectivity & Growing Inequality ............................................................................................................................................. 13Viewpoint 3: The Importance of 5G .................................................................................................... 16Viewpoint 4: The Kingdom of Saudi Arabia plans to test and roll out 5G services ............................ 16Viewpoint 5: The GiGA Story Smart Village Project for Regional Economic Growth .......................... 17Viewpoint 6: The Development of Broadband in Switzerland ........................................................... 21Viewpoint 7: Underwater Datacentres in the Sea – Project Natick .................................................... 24Viewpoint 8: The IoT as a Cornerstone for Digitization ...................................................................... 25

5The State of Broadband 2018
Viewpoint 9: Banding Together to Go Farther, Faster ..........................................................................28Viewpoint 10: The Role of Satellite in National Broadband Plans (NBPs) ............................................30Viewpoint 11: The Importance of Policy Analysis for Shaping Policy Priorities in Africa – Government of Rwanda .......................................................................................................................34Viewpoint 12: Evolving National Broadband Availability Targets .........................................................36Viewpoint 13: Helping realize affordable connectivity for people from all walks of life in Singapore 40Viewpoint 14: Broadband for Development in four LDCs: Cambodia, Rwanda, Senegal and Vanuatu ................................................................................................................................................41Viewpoint 15: The Cambodia Public Wi-Fi & Digital Schools Project ..................................................44Viewpoint 16: New Employment Dynamics & Skills of the Future ......................................................45Viewpoint 17: The Importance of Thriving Digital Entrepreneurship ..................................................49Viewpoint 18: The Importance of Connectivity for SMEs ....................................................................50Viewpoint 19: Singapore’s SMEs Go Digital ..........................................................................................50Viewpoint 20: Closing the digital and financial inclusion gender gap .................................................52Viewpoint 21: Collaborating to Achieve Digital Financial Inclusion – An Example from Pakistan.......53Viewpoint 22: Better Data for Doing Good – Using Big Data & AI for Sustainable Development ......57Viewpoint 23: The Opportunities Provided by Digital Technologies for Learning & Education ..........60Viewpoint 24: Digital Technologies for Education in Africa .................................................................62Viewpoint 25: Promoting Digital Financial Inclusion ............................................................................63Viewpoint 26: Mobile’s role in driving behavioural change for underserved communities ...............65Viewpoint 27: Accelerating the Implementation of Digital Health as a Public Policy in Mexico ........66Viewpoint 28: Demand Programmes for Broadband Adoption ...........................................................70Viewpoint 29: Addressing the Digital Divide in Already Connected Areas ..........................................71

6 The State of Broadband 2018
Since its inception in 2010, the UN Broadband Commission has united global leaders from industry, policy circles and academia in a mission to connect the world. Today, almost half of the world’s population uses the Internet for many purposes, including education, entertainment, civic engagement and e-commerce, while nearly a third use social media. According to recent statistics, the milestone of half the world’s population online will soon be reached, representing a momentous achievement.
The importance of broadband Internet for sustainable development is clear, as our societies continue to grow and develop. Broadband infrastructure is now vital infrastructure, as essential as water and electricity networks, but it is also becoming more invisible and integrated in utility networks in ‘smart’ infrastructure. According to ITU, nearly 4.4 billion active mobile broadband subscriptions are expected by end 2018, strengthening the power of the mobile digital economy.
Advances in mobile broadband (such as 4G and 5G) and next-generation satellite technologies will mean the delivery of digital services more quickly and reliably, with implications for the future of e-health, transportation, education, and disaster relief. Fixed broadband still remains important, with falling costs of installation and use. The growing Internet of Things (IoT) presents opportunities for digitization and driving change in businesses and sector-specific manufacturing. The transformative potential of technology and the Fourth Industrial Revolution (illustrated in the rise of diverse digital players) are shifting the focus of our modern economy from physical assets to the ability to harvest and utilize information and insight. The global digital market and global data assets are growing rapidly.
However, there are indications of growing inequality in access to ICTs, both within
and between countries, while there are growing concentrations of data and value in huge, global online platforms. Discussions of ‘first-mover advantage’ need to include discussions of ‘last-mover disadvantage’ and the need to invest in digital infrastructure, in case certain developing countries and Least Developed Countries (LDCs) find themselves left behind in the race to digitalize. This report emphasizes the importance of investing in broadband to ensure the digital divide does not widen further.
The report finds steady progress towards the Broadband Commission’s targets. Targets can play a significant role in informing, shaping and influencing policy priorities at the national and regional levels, and a growing number of governments now benchmark the status of broadband in their national broadband plans. The number of national broadband plans around the world has stabilized, while broadband is becoming less expensive, although achieving 2% of GNI per capita may prove challenging in many LDCs. Hitherto strong Internet growth rates have begun to level out, as networks reach near-ubiquity in densely populated areas.
Other questions arise with regards to the online services popular among Internet users. Are Internet users really acquiring useful information and gaining digital literacy, or does web surfing for entertainment count as a socially useful activity? What do digital skills look like for the new online economy? Are legacy education systems able to adapt to generate the digital skills needed in the digital economy? The report reviews the implications of big data and Artificial Intelligence (AI) for development in education, health and our natural environment. Big data promises to improve our understanding of which policies work, and which don’t, and their impact for different stakeholders. Finally, the report concludes with a number of recommendations in different areas designed to advance
Executive Summary

7The State of Broadband 2018
progress in broadband at the national and international level in a coherent approach:
• 5.1 Build National Leadership for broadband
• 5.2 Promote training and measures to stimulate demand
• 5.3 Benchmark and monitor ICT developments
• 5.4 Review universal service measures, including Rights of Way (RoW) regulations
• 5.5 Strengthen digital skills and digital literacy
• 5.6 Support Local e-Businesses and Local Entrepreneurship
• 5.7 Review and adapt legal frameworks to take into account digitalization
• 5.8 Reduce taxes and import duties on telecom/ICT equipment & services
The State of Broadband 20188
Recent years have witnessed the transformation of the telecom sector, with digital technologies now permeating nearly every aspect of our lives, society and the economy. The digital economy is generally understood as an economy driven by digital technologies. Historically, it has also been equated with the Internet economy, web economy, new or sharing economy. Deloitte defines the digital economy as “the economic activity that results from billions of everyday online transactions among people, businesses, devices, data and processes”.
According to Huawei, the digital economy was worth USD 11.5 trillion globally in 2016, and may in fact account for up to 25% of global GDP, while transforming nearly every industry. In fact, the digital economy comprises different aspects of:
– Clearly identifiable new digital businesses (e.g. the dot.com boom);
– Conducting old processes and/or business via new online or digital intermediaries (e.g. Uber or Blabla car for taxis; booking.com or lastminute.com taking travel agencies online; and PayPal for payments).
– New digital innovations (e.g. blockchain, artificial intelligence, FinTech).
– New enabling technologies (e.g. 5G).
The transformative potential of the digital economy is remarkable – for example, as one popular Internet meme states (probably originating with Tim Havers in TechCrunch): “Uber, the world’s largest taxi company, owns no vehicles. Facebook, the world’s most popular media owner, creates no content; Alibaba, the most valuable retailer, has no inventory. Airbnb, the world’s largest accommodation provider, owns no real estate… Something interesting is happening”. This quote from Havers underscores the challenge of applying 20th century perspectives and definitions to the 21st century digital economy. The modern economy places less emphasis on the control of physical assets and more on the ability to organize resources and harvest and process information and insight.
The benefits of today’s information-based economy depend on ubiquitous broadband connectivity. Although the majority of the world’s population (52% or 3.7 billion) currently remain unconnected (ITU, 2018), the number of total Internet users continues to grow strongly, with annual Internet growth rates above 5%, although these growth rates are starting to level out. According to the latest ITU estimates, 3.8 billion people or 49.2% of the global population will be online by the end of this year.
Globally, the total number of active mobile-broadband subscriptions is expected to reach 4.4 billion by end 2018 (up from 3.3 billion just three years ago, at the end 2015).
1 Connecting the Unconnected
Strong growth in broadband markets is accompanied by rapid innovation in next-generation mobile broadband (5G), fixed broadband and next-generation satellite systems, and this report overviews some of the exciting developments in these fields.
Despite these strong gains in access and sophistication of technologies, concerns continue to emerge about new and growing digital inequalities, between countries, sexes, ages and regions. According to McKinsey, African countries on average spend about 1.1% of GDP on investment in ‘going digital’
(including Internet infrastructure and networks), while developed countries spend 3.2% of GDP. This means that, not only have some countries and regions already accelerated ahead, but also the gaps in Internet availability between developed and developing countries may effectively grow larger every year. Telecom operators still face considerable technical and financial challenges in expanding networks into more remote regions, making it difficult to deliver truly universal and affordable broadband service to communities.
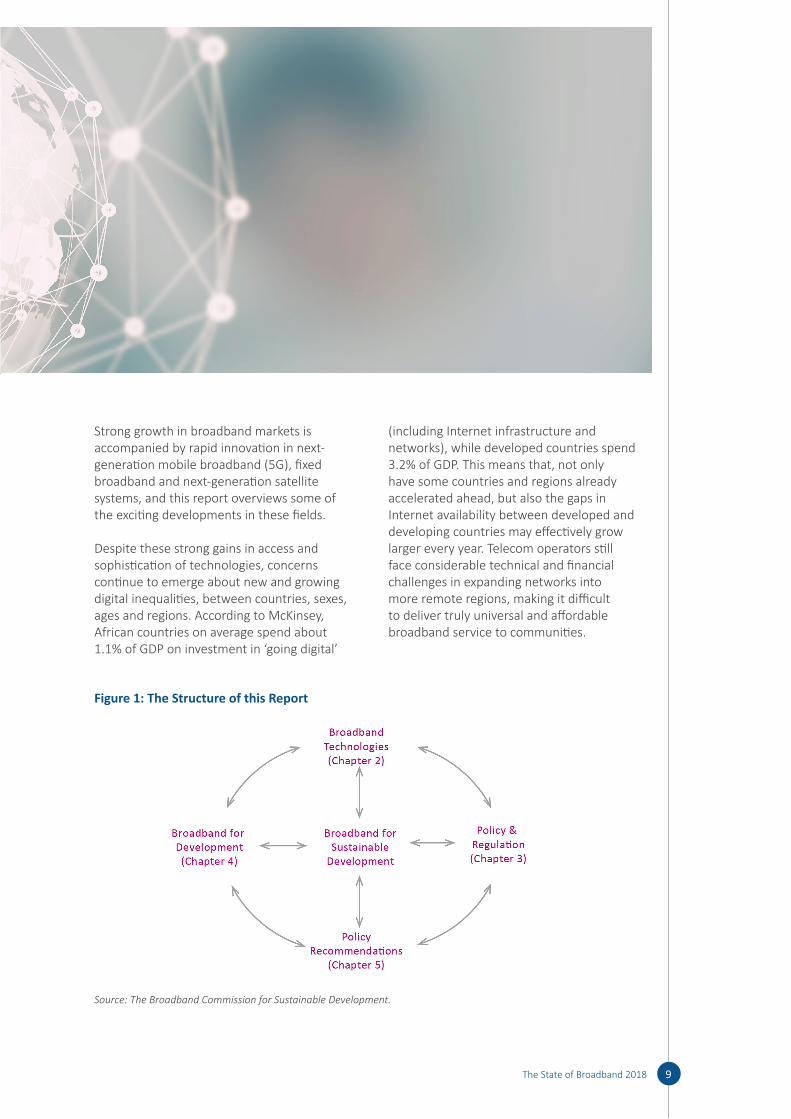
Figure 1: The Structure of this Report
Source: The Broadband Commission for Sustainable Development.
The State of Broadband 2018 9
The State of Broadband 201810
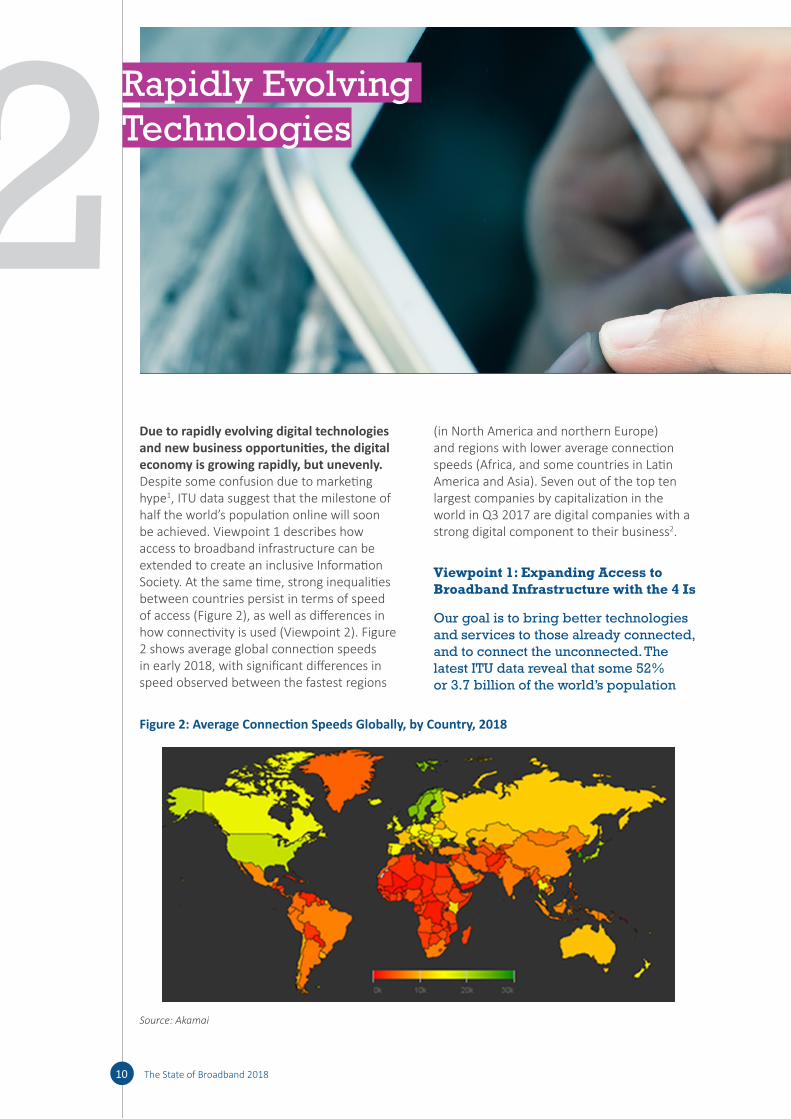
Due to rapidly evolving digital technologies and new business opportunities, the digital economy is growing rapidly, but unevenly. Despite some confusion due to marketing hype1, ITU data suggest that the milestone of half the world’s population online will soon be achieved. Viewpoint 1 describes how access to broadband infrastructure can be extended to create an inclusive Information Society. At the same time, strong inequalities between countries persist in terms of speed of access (Figure 2), as well as differences in how connectivity is used (Viewpoint 2). Figure 2 shows average global connection speeds in early 2018, with significant differences in speed observed between the fastest regions
(in North America and northern Europe) and regions with lower average connection speeds (Africa, and some countries in Latin America and Asia). Seven out of the top ten largest companies by capitalization in the world in Q3 2017 are digital companies with a strong digital component to their business2.
Viewpoint 1: Expanding Access to Broadband Infrastructure with the 4 Is
Our goal is to bring better technologies and services to those already connected, and to connect the unconnected. The latest ITU data reveal that some 52% or 3.7 billion of the world’s population
2 Rapidly Evolving Technologies
Figure 2: Average Connection Speeds Globally, by Country, 2018
Source: Akamai

The State of Broadband 2018 11
Table 1: Estimates of the Global Market: 2015, 2016, 2017, 2020 and 2021
2015 2016 2017 2020 2021
Mobile cellular subscriptions
7.2 bn (ITU) 7.2 bn (GSMA) 7.2 bn (E)
7.4 bn (ITU) 7.5 bn (GSMA) 7.5 bn (E)
7.74 bn (ITU) 7.8 bn (E)
8.3 bn (GSMA) 8.4 bn (E)
8.4 bn (GSMA) 8.6 bn (E)
Unique mobile phone users
4.6 bn (GSMA) 5.0 bn (E)
4.8 bn (GSMA) 5.1 bn (E)
5 bn (GSMA) 5.3 bn (E)
5.4 bn (GSMA) 5.7 bn (E) 5.4 bn (Cisco)3
5.5 bn (GSMA) 5.8 bn (E)
LTE subscriptions 1.1 bn (GSMA) 1.1 bn (E) 1.37 bn (ABI Research)4 1.068 bn (GSA)
1.8 bn (GSMA) 1.9 bn (E*) 2 bn (Strategy Analytics5)
2.6 billion (GSMA) 2.8 bn (E*)
4.1 bn (GSMA) 3.5 bn (ABI) 4.8 bn (E) 3.6 bn (4G Am)
4.5 bn (GSMA) 5.3 bn (E)
5G subscriptions -/- -/- -/- 70 m (GSMA) 55 million (E)
220 m (GSMA) 190 million (E)
Mobile broadband subscriptions
3.2 bn (ITU) 3.4 bn (GSMA) 3.6 bn (E)
3.65 bn (ITU); 4.1 bn (GSMA) 4.5 bn (E)
4.2 bn (ITU) 4.8 bn (GSMA) 5.3 bn (E*)
6.5 bn (GSMA) 7.0 bn (E)
6.9 bn (GSMA) 7.5 bn (E)
Smartphone subscriptions
3.3 bn (GSMA) 3.3 bn (E)
3.9 bn (GSMA) 3.8 bn (E)
4.5 bn (GSMA) 4.4 bn (E*)
5.9 bn (GSMA) 5.8 bn (E)
6.2 bn (GSMA) 6.3 bn (E*)
Fixed broadband (ITU)
820m (ITU) 884m (ITU) 979m (ITU) 1bn (E*)
1.1 bn (E*) 1.2 bn (E*)
Internet users (ITU) 3.21 bn (ITU) 3.49 bn (ITU) 3.58 bn (ITU) 4.16 bn (ITU) -/-Facebook users 1.59 bn MAU
1.04 bn DAU6 (Dec 2015)
1.71 bn MAU 1.13 bn DAU
2.13 bn MAU 1.4 bn DAU
-/- -/-
LINE users 215 million 217 million 207 million 203 million -/-Sina Weibo users 222 million 313 million 392 million 411 million -/-Vkontakte users 66.5 million 77.8 million 81.1 million 97 million -/-WeChat users 600 million* 806 million 963 million 1 billion -/-Smartphone stock 2.2 bn (Del) -/- -/- 2.1 bn (BI)7 -/
Source: Various. EST = Estimate. BI= Business Intelligence; Del = Deloitte; Facebook, E = Ericsson Mobility Report June 2018 at: https: / / www .ericsson .com/ assets/ local/ mobility -report/ documents/ 2018/ ericsson -mobility -report -june -2018 .pdf GSMA = GSMA database. MAU = monthly active users; DAU = daily active users. * Mid-year figures. https: / / investor .fb .com/ investor -news/ press -release -details/ 2018/ Facebook -Reports -Fourth -Quarter -and -Full -Year -2017 -Results/ default .aspx and https: / / zephoria .com/ top -15 -valuable -facebook -statistics/

The State of Broadband 201812
currently remain unconnected (ITU, 2018). We need to redouble our efforts to bring the power of ICTs to all nations, all people and all segments of society. Investment in ICT infrastructure is an absolute priority; we can never take investments in infrastructure for granted, and need to do more to create environments conducive to investment in ICTs. “4 I’s” – Infrastructure, Investment, Innovation and Inclusivity – are central to ITU’s strategy to leverage the power of ICTs to expand access to broadband services, and help accelerate the achievement of all the SDGs:
• Infrastructure: Today, broadband networks are critical infrastructure, as important as roads, railways, water and power networks. In LDCs, by end 2017, the number of mobile-cellular subscriptions reached about 700 million, with a penetration of 70%. Next-generation ICT infrastructure will power many digital solutions, from smart cities to public & financial services.
• Investment: Innovative financing mechanisms and PPPs are needed to create a better environment for investment (especially for hard-to-reach areas), which cut across industries and sectors. And policy-makers need assistance in strengthening digital development strategies and adopting an enabling environment. An ITU/UNCTAD survey found that less than 25% national broadband strategies include details on infrastructure investments8.
• Innovation: In emerging markets, ICTs are helping farmers to monitor prices, health workers to respond to emergencies, and borrowers to connect with lenders. In developed and developing markets alike, entrepreneurs and tech MSMEs are at the forefront of industry disruption. Every year, at ITU Telecom World, ITU focuses on supporting the success of these innovators, who drive socio-
economic growth and job creation in countries around the world.
• Inclusivity: The digital divide takes many forms. More than two billion adults still don’t have a formal bank account, but 1.6 billion of these do have access to a mobile phone. Digital financial inclusion can help boost poverty eradication, job creation, gender equality and women’s empowerment. ITU has teamed up with several partners to launch a new programme to accelerate digital financial inclusion. Digital inclusion also needs locally relevant content, and interfaces that feature text-to-speech and voice-recognition capabilities to enhance accessibility for people with specific needs, indigenous peoples and those with disabilities. Ensuring equal access to the information society is a moral imperative.
The scale of the infrastructure that must be built or upgraded to bridge the digital divide and deploy emerging technologies is huge and expensive – ITU estimates that connecting the next 1.5 billion people will cost USD 450 billion. ITU’s World Radiocommunication Conference 2019 will determine the foundations for 5G and use of spectrum to meet the ever-growing demand for broadband services and applications. I’m happy to report that good progress was achieved in the set of technical requirements and criteria agreed for 5G by ITU-R Study Group 5 in November 2017. ITU has developed a set of 5G performance targets, preparing the ground for new applications such as automated driving, remote medical diagnosis and surgery, and advanced virtual reality (VR). In this way, we can close the gaps between the digital haves and have-nots, and help create an inclusive information society for all.
Source: Mr. Houlin Zhao, Secretary-General of ITU and co-Vice Chair of the UN Broadband Commission.
The State of Broadband 2018 13
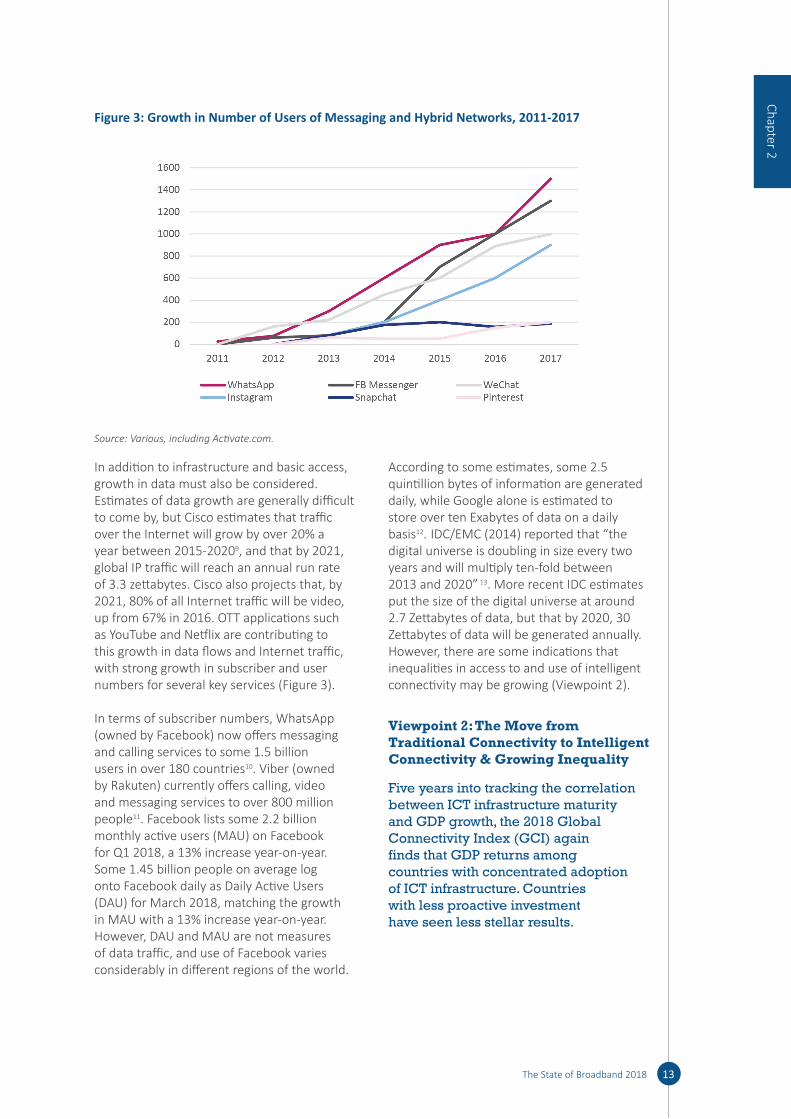
In addition to infrastructure and basic access, growth in data must also be considered. Estimates of data growth are generally difficult to come by, but Cisco estimates that traffic over the Internet will grow by over 20% a year between 2015-20209, and that by 2021, global IP traffic will reach an annual run rate of 3.3 zettabytes. Cisco also projects that, by 2021, 80% of all Internet traffic will be video, up from 67% in 2016. OTT applications such as YouTube and Netflix are contributing to this growth in data flows and Internet traffic, with strong growth in subscriber and user numbers for several key services (Figure 3).
In terms of subscriber numbers, WhatsApp (owned by Facebook) now offers messaging and calling services to some 1.5 billion users in over 180 countries10. Viber (owned by Rakuten) currently offers calling, video and messaging services to over 800 million people11. Facebook lists some 2.2 billion monthly active users (MAU) on Facebook for Q1 2018, a 13% increase year-on-year. Some 1.45 billion people on average log onto Facebook daily as Daily Active Users (DAU) for March 2018, matching the growth in MAU with a 13% increase year-on-year. However, DAU and MAU are not measures of data traffic, and use of Facebook varies considerably in different regions of the world.
According to some estimates, some 2.5 quintillion bytes of information are generated daily, while Google alone is estimated to store over ten Exabytes of data on a daily basis12. IDC/EMC (2014) reported that “the digital universe is doubling in size every two years and will multiply ten-fold between 2013 and 2020” 13. More recent IDC estimates put the size of the digital universe at around 2.7 Zettabytes of data, but that by 2020, 30 Zettabytes of data will be generated annually. However, there are some indications that inequalities in access to and use of intelligent connectivity may be growing (Viewpoint 2).
Viewpoint 2: The Move from Traditional Connectivity to Intelligent Connectivity & Growing Inequality
Five years into tracking the correlation between ICT infrastructure maturity and GDP growth, the 2018 Global Connectivity Index (GCI) again finds that GDP returns among countries with concentrated adoption of ICT infrastructure. Countries with less proactive investment have seen less stellar results.
Chapter 2
Figure 3: Growth in Number of Users of Messaging and Hybrid Networks, 2011-2017
Source: Various, including Activate.com.

The State of Broadband 201814
This year, the scope of the GCI was broadened from 50 to 79 economies and AI was added as a new element in the GCI equation, in addition to the five enabling technologies (broadband, data centres, cloud, big data and IoT). AI is the next major general-purpose technology driving paradigm shifts in economic and industrial activity. The influence of AI is trickling into all aspects of life.
Industries are embedding AI in all five enabling technologies, transforming traditional connectivity into Intelligent Connectivity to unleash new innovation and economic opportunities. New business models, products, processes and services are emerging every day, accelerating growth towards a digital economy worth some US$23 trillion by 2025 and opening up a new economic growth cycle. Further, this digital economy has grown 2.5 times faster than global GDP over the past 15 years.
This year’s GCI saw scores rise incrementally across all countries. ‘Frontrunners’ or advanced economies on the GCI S-curve are using Intelligent Connectivity to accelerate digital economy growth and unearth new opportunities. Advanced economies
are generally in better fiscal positions to make progress in ICT infrastructure development – and now AI – to climb the GCI S-curve and drive greater GDP returns.
Growth, however, has been uneven. The distance between countries at the top and bottom of the GCI S-curve continues to increase, indicating an amplification of existing inequality. Against this backdrop, it is vital that less developed economies in the GCI Adopter and Starter clusters prioritize ICT investment to stay competitive.
There is, however, good reason for optimism. In 2018, advanced economies find themselves on the cusp of new opportunities, while ‘Adopters’ and ‘Starters’ are laying foundations for leapfrog growth through well-planned and focused ICT investments. As GCI Frontrunners reach the limits of growth from current ICT investments, AI and Intelligent Connectivity are opening up a new economic growth cycle. While no one can be sure where AI will ultimately lead us, all can agree that its potential is enormous, and will impact every aspect of how we live, play, work and, potentially, even think.
Box Figure: Intelligent Connectivity – The USD 23 Trillion Opportunity by 2025
Source: Huawei.

The State of Broadband 2018 15
2.1 Mobile Broadband
Strong growth in mobile broadband subscriber numbers continues, driven in part by consumer demand for applications. Point Topic reports that fixed wireless technologies are increasingly giving way to 4G LTE-based mobile broadband access, with 4G LTE now a major means of getting broadband at home in several regions – for example, Scandinavia and Eastern Europe14. The Inclusive Internet Index (3i)15, commissioned by Facebook and the Economist Intelligence Unit, shows that access to 4G networking services improved over the last year, particularly in low-income countries where coverage almost doubled, from 9.1% to 17.3%. ITU’s Global ICT Development Index shows generally broad growth in ICT readiness, use and impact. Figure 4 shows the number of subscribers globally, by generation of mobile technology. LTE and higher generation 4G technologies now account for over half of all global mobile subscribers.
Speeds and coverage levels are increasing. For example, Vodafone Italy has announced the launch of 1Gbps mobile service in Rome, Naples and Palermo, and has begun 5G trials in Milan16. In Singapore, the operators Singtel and StarHub have boosted mobile services to 1Gbps, following successful trials in 2017. Ooredoo Oman had covered 90% of the population with LTE network by mid-201817. MTS Belarus has launched LTE services
in 80 towns over the first half of 2018 to push out 4G to 70% of the population, including 95% of people in urban areas18.
Barely a decade on from the first launch of 4G, the first 5G trials have already started. As the industry heads towards the commercial introduction of 5G technology, investments in 5G-enabling and candidate technologies are growing. Several MENA operators have commenced trials of 5G and are beginning to map out spectrum strategies in conjunction with national regulatory authorities – for example, Zain and Etisalat have conducted 5G trials in Saudi Arabia, Kuwait and UAE.
The first commercial deployments are likely in 2019, following approval of the international standards for 5G at WRC-2019. 5G deployments will ramp up significantly after 2020, and most developed economies should enjoy the benefits of 5G by 2023 – for example, China is predicted to have anywhere between 200 million (GSMA) or one billion19 5G users by 2023. Most other markets will still benefit from 4G networks, already available in 208 territories, according to the GSMA.
Verizon Communications is already trialling fixed-wireless ‘5G’ residential broadband services in several markets in the US in 2018. Verizon had already trialled 5G residential applications in eleven markets in 201720.
Chapter 2
Figure 4: Changing Mobile Coverage, by Type of Network, 2007-2016
Source: ITU.
The State of Broadband 201816
Verizon plans a 5G trial for Sacramento, California, in late 2018, supported by millimetre wave (mmWave) spectrum.
Ooredoo and Nokia are collaborating on 5G early trials starting in 2018 in Qatar, aiming to accelerate roll-out. Ooredoo considers that 5G innovation will help “deliver superior mobile data experiences for our customers. 5G will catalyze mobility, industrial networking, remote healthcare, virtual reality, and ultra-high-definition video, and enhance our customers’ digital experience and help them enjoy the Internet in new and exciting ways”21. Viewpoint 3 emphasizes the importance of 5G, while Viewpoint 4 describes development of 5G in Saudi Arabia. Viewpoint 5 describes KT Corp’s GiGA Story Smart Village Project to boost regional economic growth in a province of the Rep. of Korea.
Viewpoint 3: The Importance of 5G
First- and second-generation wireless networks were focused on voice services and the focus of 3G and 4G shifted toward data and mobile broadband. While the focus on mobile broadband will continue with 5G, support for a much wider set of diverse usage scenarios is expected. 5G is positioned as an intelligent network that supports data and analytics use cases, helping it reach out to drive new industries in ways not previously possible. 5G enables developing countries to make full use of new technologies such as AI, cloud computing, M2M and data analytics22.
Over 90% of broadband subscribers in developing countries use mobile broadband and it is vital to migrate to 5G successfully to obtain the full benefits of mobile broadband. According to ITU-R Rec. M.2083, 3 major 5G/IMT-2020 use scenarios include: (1) enhanced mobile broadband; (2) ultra-reliable and low-latency communications; (3) massive machine-type communications.
5G/IMT-2020 will provide new applications and services for both developed and developed countries. Some of the 5G/IMT-2020 applications
will be much more important for the developing countries, such as smart transport systems, e-health, education, smart grid, agriculture and disaster relief. Developing and emerging economies are leapfrogging older technologies and becoming more mobile-oriented.
5G will have significant economic impact on these economies. According to IHS, 5G/IMT-2020 will enable USD 12.3 trillion of global economic output when its full impact is realized and developing countries can benefit from this opportunity without delay23. Many countries have established 5G Taskforces to accelerate 5G, including India, UAE, Brazil, China, Turkey, Rep. of Korea, Japan, Indonesia, South Africa and Saudi Arabia. The EU has also developed a 5G Action Plan.
Source: Intel.
Viewpoint 4: The Kingdom of Saudi Arabia plans to test and roll out 5G services
Saudi Arabia is leading the way in the Middle East with the development of next-generation mobile broadband. Over 2017-2018, CITC, Saudi Arabia’s ICT regulator, awarded 160 MHz of additional IMT spectrum in 700 MHz, 800 MHz and 1800 MHz bands to mobile operators STC, Mobily and Zain. Saudi Arabia is a regional leader in terms of awarded IMT spectrum in sub-GHz IMT bands, which should help support the growth of mobile broadband network capacity, from 3G and 4G to 5G.
To aid evolution of mobile broadband towards the 5G and prepare the necessary foundations, the National 5G Task Force was established in early 2018. The Task Force unites all stakeholders with an interest in 5G, such as government, operators, equipment vendors and user groups. Specialized work is carried out in 3 subcommittees dealing with "5G Spectrum", "5G Development" and "5G verticals". All the necessary 5G policies and
The State of Broadband 2018 17
supporting administrative provisions should be in place by end 2019.
The Saudi Government is taking an active role to create the best conditions for the private sector to invest in developing and deploying 5G, including measures for greater regulatory certainty vis-à-vis operators' business cases and technological flexibility through Unified Licences, implemented since 2017. These will be backed by timely availability of 5G spectrum and the promotion of a 5G services ecosystem in 5G verticals, such as eHealth, Industry 4.0 and Smart Cities, among others.
As one of the first steps towards achieving 5G, CITC issued Test & Trial licenses to all three mobile operators in early May 2018. These licenses allow the operators to pilot 5G technologies until end 2019 by utilizing 100 MHz channels in 3.6-3.8 GHz band, with individual test sites authorized in a speedy administrative procedure. STC was the first operator to start deploying 5G sites from early May 2018, starting in the Eastern Region and spreading to the rest of the country. These pilot deployments were implemented with 5G NR equipment utilizing 100 MHz TDD channel in Band 42 configuration. All three Saudi mobile operators are planning to gradually expand their 5G equipped sites in 2018 and 2019 in anticipation of full nationwide commercial launch, when fully 5G capable consumer devices hit the market by mid-2019.
The CITC is set to convert the test and trial licenses to full and exclusive 5G spectrum awards in 3.4-3.8 GHz by mid-2019. The awards of mm-wave spectrum may follow by beginning of 2020 taking into account the decisions of ITU’s WRC-19 on the subject and availability of 5G equipment on the market.
Source: CITC, Saudi Arabia http: / / news .itu .int/ how -saudi -arabia -is -paving -the -way -to -be -a -regional -leader -in -5g/ .
Viewpoint 5: The GiGA Story Smart Village Project for Regional Economic Growth
Korea Telecom (KT) launched the GiGA Story project to help improve residential living environments and solve social problems by providing Internet and ICT solutions to address digital divides. The Rep. of Korea faces a serious population decline in rural areas, due to urbanization and demographic ageing. The GiGA Story Project started in 2014 in various locations in Rep. of Korea and Bangladesh, and Uiyaji Village project was launched in PyeongChang Province, Rep. of Korea, in 2017.
KT cooperated with the Government and local authorities in an early trial of 5G to stimulate the rural economy. Uiyaji Village is located near a local tourist spot with 600,000 visitors annually, but it did not have sufficient tourist attractions to attract visitors. KT developed tourist content using ICTs. An AR technology and Media Wall with motion recognition functionality can help visitors to obtain information on major attractions near Uiyaji Village. The AR service displays a 360-degree VR image of the town market and offers information on local products. It is hoped that this platform will change shopping habits and increase incomes through the sale of local specialties.
Since its launch in December 2017, Uiyaji Village has received over 1,000 visitors monthly and the profits of the local café have quintupled. In addition, the resident population has increased by 9.6%. KT and the local government will continue to cooperate to develop local products and improve living conditions using ICT solutions. In future, KT is planning to further develop the AR market and tourist content using its 5G early trial for community development and economic growth using ICTs.
Source: KT Corp.
Chapter 2
The State of Broadband 201818
In Singapore, Singtel collaborated with Ericsson in 2016 in a demonstration of live video streaming over 5G, which achieved a peak throughput of 27.5Gbps and latency as low as 2 milliseconds. Early 5G trials by StarHub and M1 have achieved transmission speeds of 35Gbps. To encourage greater innovation and facilitate 5G trials, Infocomm Media Development Authority (IMDA) waived frequency fees for 5G trials from May 2017 to end 2019. Commercial deployments should happen from 2020 onwards, and IMDA has engaged the public in shaping 5G spectrum requirements and regulatory provisions.
In Europe, the EU 5G Action Plan targets an early market introduction for 5G in 2020 and a comprehensive roll-out up to 2025. Major opportunities for 5G in Europe lie in the digital transformation of major EU sectors (including automotive, manufacturing, energy, media and health sectors and other ‘verticals’). EU operators are ready for the launch of 5G around 2020, but in mid-2018, the operator Elisa launched an early 5G trial in Finland using Nokia network equipment and Huawei devices, including a “narrowband” IoT service.
The difficulty is that the investment needs for 5G are enormous, at a time of thinning, if not declining, ARPUs for many operators in a number of countries, where operators are seeing shifts in capitalization (as well as revenues, in some cases) to Over-The-Top (OTT) players. According to the World Bank’s forthcoming “Data-Driven Development” report, “telecom operators have developed several responses to OTT. They have argued for regulating OTTs that provide voice and text services in the same way they are. Some are developing their own OTT products. Others are including large bundles of their own offerings such as free calls or text in packages. Many are diversifying into opportunities in areas such as cloud computing, IoT and mobile money. Some are trying to do all of the above”24.
However, the World Bank acknowledges that OTT players “not only compete with telecom operators that provide video services, but are also responsible for [generating] a substantial portion of traffic going over the networks”. For example, a study of African
mobile network operators by Research ICT Solutions showed that most operators have experienced strong revenue growth due to an OTT-induced increase in data demand, which generally outpaced declines in voice and SMS revenues25. The German research institute WIK notes, “consumers do not use Rich Interactive Applications and communication services as like-for-like substitutes; more often than not, consumers use them complementarily”26. In this scenario, operators’ broadband access infrastructure enables consumers to access online applications’ innovative content, which in turn drives consumer demand for operators’ broadband services.
For 5G, analysis by McKinsey (2018) suggests that operators have two options for investing in 5G27:
– A ‘lean-in strategy’ in which operators prioritize 5G investments with the hope of accelerating commercial prospects.
– A more conservative approach, in which operators delay 5G investments as long as possible, while existing networks are upgraded.
When network upgrades are no longer sufficient to support the increased traffic, operators will need to build new macro-sites or small cells to satisfy urban demand for capacity28. McKinsey’s analysis suggests that many operators will embark on significant new build-out between 2020-2025. Some operators in the US are already in the process of decommissioning 2G, while a number of European operators are planning to shut down their 3G networks around 2020.
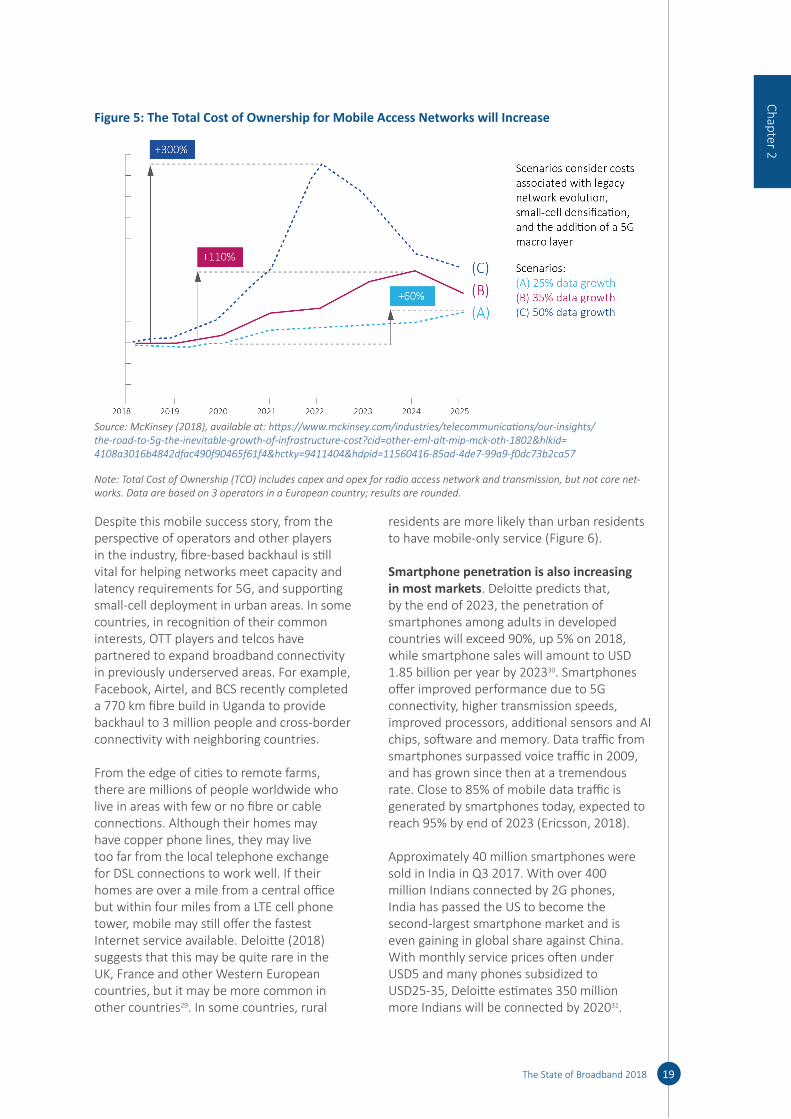
McKinsey foresees that Total Cost of Ownership (TCO) for mobile access networks will increase (Figure 5), although the increase will depend on data growth and industry circumstances. Others argue that 5G technology may prove less expensive per bit than previous generations. A range of players are investing in network infrastructure, including data centers, submarine cables, fibre networks, servers and routers to help deliver content to end-users, including operators, content and application providers.
The State of Broadband 2018 19
Despite this mobile success story, from the perspective of operators and other players in the industry, fibre-based backhaul is still vital for helping networks meet capacity and latency requirements for 5G, and supporting small-cell deployment in urban areas. In some countries, in recognition of their common interests, OTT players and telcos have partnered to expand broadband connectivity in previously underserved areas. For example, Facebook, Airtel, and BCS recently completed a 770 km fibre build in Uganda to provide backhaul to 3 million people and cross-border connectivity with neighboring countries.
From the edge of cities to remote farms, there are millions of people worldwide who live in areas with few or no fibre or cable connections. Although their homes may have copper phone lines, they may live too far from the local telephone exchange for DSL connections to work well. If their homes are over a mile from a central office but within four miles from a LTE cell phone tower, mobile may still offer the fastest Internet service available. Deloitte (2018) suggests that this may be quite rare in the UK, France and other Western European countries, but it may be more common in other countries29. In some countries, rural
residents are more likely than urban residents to have mobile-only service (Figure 6).
Smartphone penetration is also increasing in most markets. Deloitte predicts that, by the end of 2023, the penetration of smartphones among adults in developed countries will exceed 90%, up 5% on 2018, while smartphone sales will amount to USD 1.85 billion per year by 202330. Smartphones offer improved performance due to 5G connectivity, higher transmission speeds, improved processors, additional sensors and AI chips, software and memory. Data traffic from smartphones surpassed voice traffic in 2009, and has grown since then at a tremendous rate. Close to 85% of mobile data traffic is generated by smartphones today, expected to reach 95% by end of 2023 (Ericsson, 2018).
Approximately 40 million smartphones were sold in India in Q3 2017. With over 400 million Indians connected by 2G phones, India has passed the US to become the second-largest smartphone market and is even gaining in global share against China. With monthly service prices often under USD5 and many phones subsidized to USD25-35, Deloitte estimates 350 million more Indians will be connected by 202031.
Chapter 2
Figure 5: The Total Cost of Ownership for Mobile Access Networks will Increase
Source: McKinsey (2018), available at: https: / / www .mckinsey .com/ industries/ telecommunications/ our -insights/ the -road -to -5g -the -inevitable -growth -of -infrastructure -cost ?cid = other -eml -alt -mip -mck -oth -1802 & hlkid = 4108a3016b4842dfac490f90465f61f4 & hctky = 9411404 & hdpid = 11560416 -85ad -4de7 -99a9 -f0dc73b2ca57
Note: Total Cost of Ownership (TCO) includes capex and opex for radio access network and transmission, but not core net-works. Data are based on 3 operators in a European country; results are rounded.

The State of Broadband 201820
2.2 Fixed Broadband
ITU records that there were 979 million fixed-broadband connections by end 2017. Point Topic (2018) estimates the global number of fixed broadband connections slightly lower, at 931.6 million by end 2017. The highest growth quarterly was recorded in Africa, Asia, and Oceania, as these regions with high growth potential continue to embrace new broadband technologies. Nearly three-quarters of net additions in fixed broadband subscribers came from East Asia, driven mainly by growth in China, which is adding some 15m broadband subscribers per quarter. China had already passed a quarter of a billion fixed broadband subscriber milestone in Q1 2016, and continues to grow at impressive speed, adding nearly 70 million FTTH connections over 2017.
Point Topic reports that, in the year between Q4 2016 and Q4 2017, the number of copper lines fell by 6% globally, while FTTH connections increased by 28%. The share of fibre connections in total fixed broadband subscriptions continued to increase in all regions, with highest growth recorded in Asia and Americas32. Figure 7 shows the technology market share by region for the global regions for end 2017. Surprisingly, a drop in FTTx lines has been observed since 2016, due to this technology being
replaced with FTTH on a large scale in China, and to some extent in other countries.
For example, in early 2018, Algérie Telecom announced the commercial launch of FTTH broadband services in several provinces, with the Gigabit-capable direct fibre access network being deployed to the rest of the country through further regional launches expected through the year33. In the UK, BT’s Openreach’s fibre connections reached a record high of 600,000 at end 2017, with plans to deliver FTTP to 3 million premises by the end of 2020, and 10 million homes and businesses by mid-2020s34. In Brazil, TIM Brasil launched a 2Gbps FTTH service in October 2017 in Sao Paulo and Rio de Janeiro, passing some 200,000 households at a cost of USD 455 per month35. In the US, Verizon has stated that their costs to pass a home with fibre have dropped significantly by 2017, down a large amount from USD 700 in 200736. Viewpoint 6 describes the development of broadband in Switzerland.
Meanwhile, one of the largest rural fibre connectivity projects in history is underway in India37. Over 100 million Indians are ready to be connected with fibre, Wi-Fi and LTE. Phase 1 is finished of India's BharatNet. All 250,000 regional councils and 625,000 villages are expected to be reached by GPON fibre by March 2019. Most villages will have
Figure 6: Data Mobile-Only Population for Urban and Rural Areas, Selected Countries, 2017
Source: Deloitte Global Survey of Mobile-Only Adults, August-October 2017. Deloitte TMT Predictions (2018), at: https: / / www2 .deloitte .com/ global/ en/ pages/ technology -media -and -telecommunications/ articles/ tmt -predictions .html

The State of Broadband 2018 21
local Wi-Fi from the local Post Office and/or a program of local businesses. Backhaul for telcos is included; Indian operators may use BharatNet backhaul as they extend mobile broadband coverage to rural populations. The USD 15 billion project is primarily funded by the Indian Universal Service Fund (USF). Viewpoint 6 describes the development of broadband in Switzerland and the changes in the policy and regulatory environment needed to help stimulate its development.
Viewpoint 6: The Development of Broadband in Switzerland
Since liberalizing its telecom market in 1998, Switzerland has enjoyed a dynamic market conducive to promoting competition and the more extensive deployment of infrastructure. Over recent years, significant investment has been made in the expansion of both fixed and mobile networks. According to Akamai´s “State of the Internet” report, Switzerland is one of the leading countries in the world in Internet connectivity with a next-generation access (NGA) population coverage rate of 94% and LTE population coverage rate of almost 99%. LTE advancements have been widely deployed and now offer bandwidths of up to 1 Gbit/s. Mobile operators have announced they will begin introducing
5G from end 2018. The fixed broadband subscription rate in Switzerland is nearly 46%, at the top of international comparisons, according to the OECD.
The Swiss Telecommunications Act of 1998 seeks to ensure that a range of cost-effective, high-quality and nationally and internationally competitive telecommunication services are available to individuals and the business community. It should also promote effective competition in the provision of telecom services and ensure a reliable universal service at affordable prices, for all sections of the population throughout the country. The fixed broadband market in Switzerland is characterized by a strong incumbent, high DOCSIS 3.0 cable population coverage and considerable FTTH investments by the incumbent and major local utilities. The incumbent is rolling out FTTH, FTTS and FTTC in connection with vectoring or G.fast, ensuring almost the entire population will soon have coverage with a modern fixed network. Some 200 cable operators cover 85% of the population with DOCSIS 3.0, and several have announced plans to deploy DOCSIS 3.1.
The entire population can access the universal broadband service, which currently offers 3 Mbit/s. Some 94% of
Chapter 2
Figure 7: Technology Market Share by Region, Q4 2017
Source: Point Topic, available at: http: / / point -topic .com/ free -analysis/ world -broadband -statistics -q4 -2017/ .
The State of Broadband 201822
all dwellings and businesses can obtain fixed broadband services with at least 30 Mbit/s and 85% can access 100 Mbit/s or more. FTTH is currently deployed in more than 31% of households. However, the take-up of FTTH is still rather limited.
Initiatives by local utility companies to invest in FTTH in several major cities in 2008 seemed to act as a trigger for the incumbent operator to start investing in FTTH. To avoid duplication and to create a framework for FTTH roll-out, the telecom regulator OFCOM launched ‘FTTH Round Table’ discussions for market players. Following these round tables, the incumbent operator and major local utility companies agreed on infrastructure-sharing and co-investment schemes based on a multi-fibre model. Uniform technical standards (e.g. for the installation of fibre in individual dwellings) have been drawn up in various industry working groups. An intervention by the competition authority (COMCO) ensured that agreements between the incumbent operator and utilities would not impede competition.
Cooperation activities agreed to date between the incumbent and some 70 local utilities cover some 30% of all buildings in Switzerland. The implementation of a four-fibre-per-household network could increase roll-out costs by 10-20%, compared to a single-fibre point-to-point network architecture. In return, it creates two competing fibre networks, each with one spare fibre. The incumbent and all utilities offer wholesale access to their FTTH network on commercial terms.
In April 2016, the Swiss Federal Council adopted the "Digital Switzerland" strategy, whereby the Swiss Government seeks to support the digitization which affects all areas of life, for Switzerland to exploit opportunities and address associated challenges.
The “Digital Switzerland” strategy provides guidelines for government action and indicates where and how authorities, academia, the private sector and civil society must work together in order to shape the transformation process for the benefit of everyone. The government has set the goal of ensuring that ultra-high-speed broadband will be market-driven and available in all Swiss municipalities by 2020. The expansion of mobile networks (5G) and the frequency resources required for 5G, which are awarded by the State, will play an important role.
Maintaining an up-do-date regulatory framework, which promotes competition and investment in NGA technologies, is crucial in order to prepare for future challenges and to give Switzerland excellent foundations for developing a smart society. That is why in September 2017, the Swiss Federal Council adopted a revision of the Swiss Telecommunications Act (revised in 2007). The present revision seeks to adapt the law for new technological developments and market evolution, while improving transparency and consumer protection. The ultimate ambition remains unchanged – to adopt a market-driven approach, which fosters competition and thereby promotes investment and innovation.
Source: OFCOM, Switzerland.
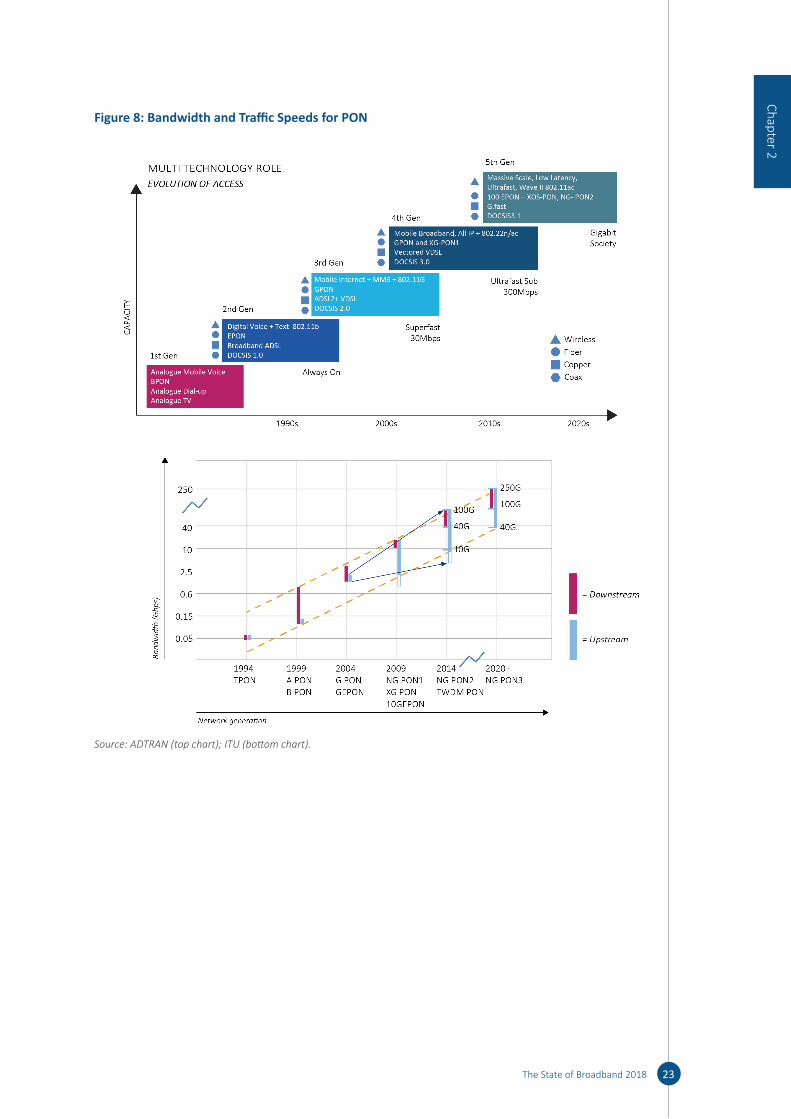
Figure 8 shows the increases in bandwidth and traffic speeds made possible through advances in access networks (top chart) and PON (bottom chart), while Table 2 summarizes the key characteristics of the main xDSL technologies. The development and deployment of ultra-reliable, low-latency and high-capacity networks are essential for future developments in IoT applications (such as autonomous vehicles, which could require huge amounts of data38). Viewpoint 7 describes Microsoft’s innovative Project Natick to introduce an underwater data centre.
The State of Broadband 2018 23
Figure 8: Bandwidth and Traffic Speeds for PON
Source: ADTRAN (top chart); ITU (bottom chart).
Chapter 2
The State of Broadband 201824
Table 2: The Main xDSL Technologies
VDSL2 ADSL2+ SHDSL HDSLTransmission mode Asymmetric &
symmetricAsymmetric Symmetric Symmetric
Pairs of Copper 1 1 1 & 2 1, 2 & 3Frequency band 12MHz to 30 MHz
(down & up data)0.14MHz-2.2.MHz (down data)
196KHz
Modulation DTM QAM TCPAM CAP/2B1QBitrate (down/up) Up to 200 Mbit/s
bidirectional12 Mbit/s up to 24 Mbit/s & 1 Mbit/s up to 1.4 Mbit/s
Up to 5.7 Mbit/s (single pair)
2 Mbs bidirectional
Reach <2.5km <1.5km <3km <3.6kmITU standard ITU-T G.993.2 (Nov
2015)ITU-T G.992.5 (Jan 2009)
ITU-T G.991.2 (Dec 2003)
ITU-T G.991.1 (Oct 1998)
Source: “Future of Cable TV”: https: / / www .itu .int/ en/ ITU -D/ Regional -Presence/ Europe/ Documents/ Events/ 2018/ Future %20of %20Cable %20TV/ The %20future %20of %20cable %20TV _preevent .pdf
Viewpoint 7: Underwater Datacentres in the Sea – Project Natick
We are firmly in the era of the fourth industrial revolution (4IR) marked by dramatic advances in computer science, data science, AI, cloud computing, and broadband that herald the transformation of societies. In less than forty years, the Internet is used by half the world’s population. With these advances, we are increasingly reliant on data centres to process, store, and secure the huge volumes of data created every day.
Data centres are key to today’s cloud services. To optimize performance, they need to be located where access to high-capacity fibre and ready power (ideally renewable) are available, with minimum transit distance to users. In 2014, Microsoft researchers began to explore the idea of underwater datacentres. Seawater could offer abundant cooling potential and reduce the need for power. Half the global population lives within 200 km of the ocean, so these data centres could also have low latency, as signals travel over the Internet at about 200km/millisecond.
Between August and December 2015, Microsoft launched Phase 1 of Project Natick, which demonstrated the feasibility of subsea datacentres, including the ability to operate a ‘Lights-Out’ datacentre (with reduced energy needs and human access), with efficient Power Usage Effectiveness (PUE) of 1.07, and a perfect Water Usage Effectiveness (WUE) of zero versus land datacentres (which consume up to 4.8 liters of water per kilowatt-hour).
Phase 2 of Project Natick is the creation and testing of a full-scale datacentre module powered by renewable energy off the coast of Scotland. Microsoft sought to demonstrate that full-scale undersea data centre modules can be manufactured and deployed in 90 days from ‘power on’. The Phase 2 vessel was deployed from the Orkney Islands on 1 June 2018. It contained 864 standard Microsoft datacentre servers in 12 racks in a vessel the size

The State of Broadband 2018 25
of a standard shipping container. It is as powerful as several thousand high-end consumer PCs with storage for the equivalent of 5 million movies. It is powered by renewable on-shore wind and solar energy, and off-shore tide and wave power. Phase 2 aims to:
• Develop a full-scale prototype subsea datacentre;
• Gain an understanding of the economics of undersea datacentre and TCO over its lifetime;
• Efficiently deploy the prototype within 12 nautical miles of the coast at a depth of 100 meters;
• Demonstrate ‘Lights Out’ operation over a deployment cycle of 5 years;
• Power the prototype from a nearby marine renewable energy sources; and
• Explore cloud datacentre solutions offering less resource-intensive options.
Ultimately, data from this project may lead to more efficient datacentres that can be operated at lower cost and less environmental impact than land datacentres. Land datacentres need clean tap water for cooling, and the evaporative cooling process leaves waste. Water is a precious resource. Undersea datacentres can have their own renewable power and no impact on water supply or electricity, or land itself, and have the potential to contribute to digital transformation and help realize the SDGs.
Source: Microsoft.
2.3 Internet of Things
The OECD has defined the IoT as “encompassing all devices and objects whose state can be read or altered via
the Internet, with or without the active involvement of individuals. This includes laptops, routers, servers, tablets and smartphones (often considered to form part of the “traditional Internet”), as these devices are integral to operating, reading and analyzing the state of IoT devices”39.
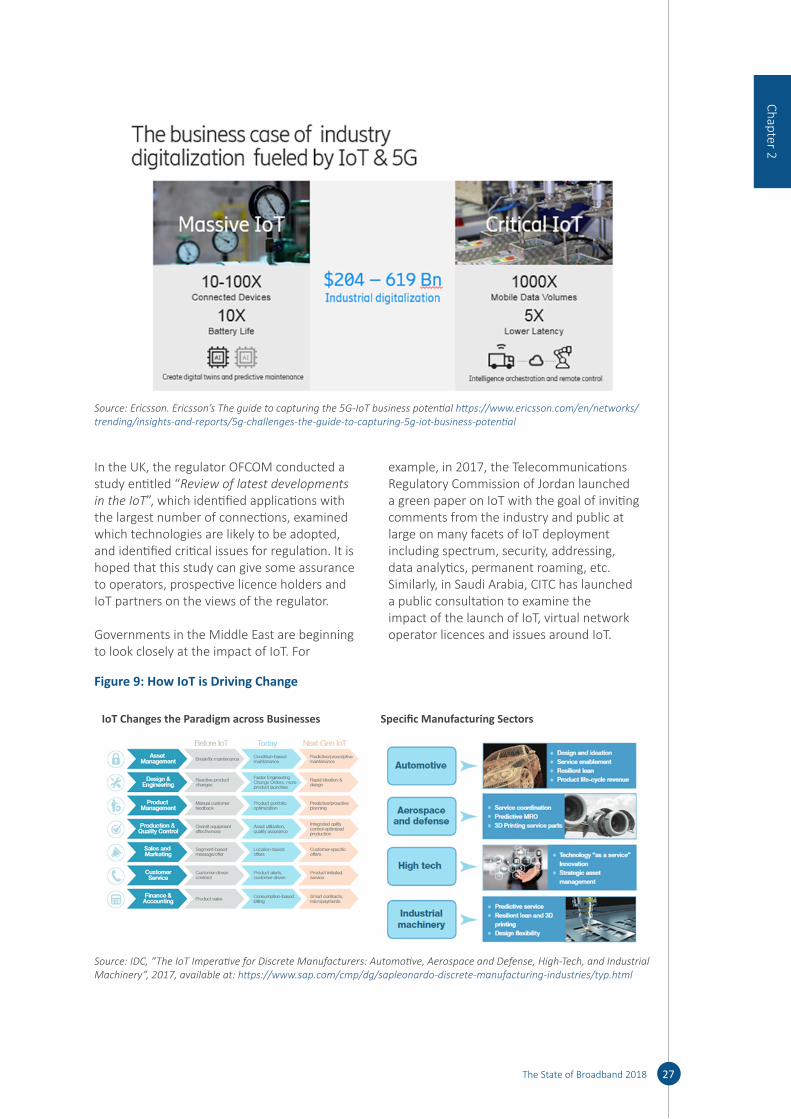
Gartner forecasts that 8.4 billion connected things were in use in 2017, up 31% from 2016, and growing to 20.4 billion by 2020. GSMA predictions are more conservative, forecasting that the number of IoT connected devices will increase from 8 billion in 2017 to 13 billion in 2020 to exceed 25 billion in 2025. IDC forecasts are considerably higher, forecasting that some 80 billion IoT devices will be online by 2025, creating 180 Zetabytes of data. According to Ericsson, the number of cellular IoT connections is expected to reach 3.5 billion in 2023, with an annual growth rate of 30%. Of the 3.5 billion cellular IoT connections forecast for 2023, North East Asia is anticipated to account for 2.2 billion40.
Viewpoint 8: The IoT as a Cornerstone for Digitization
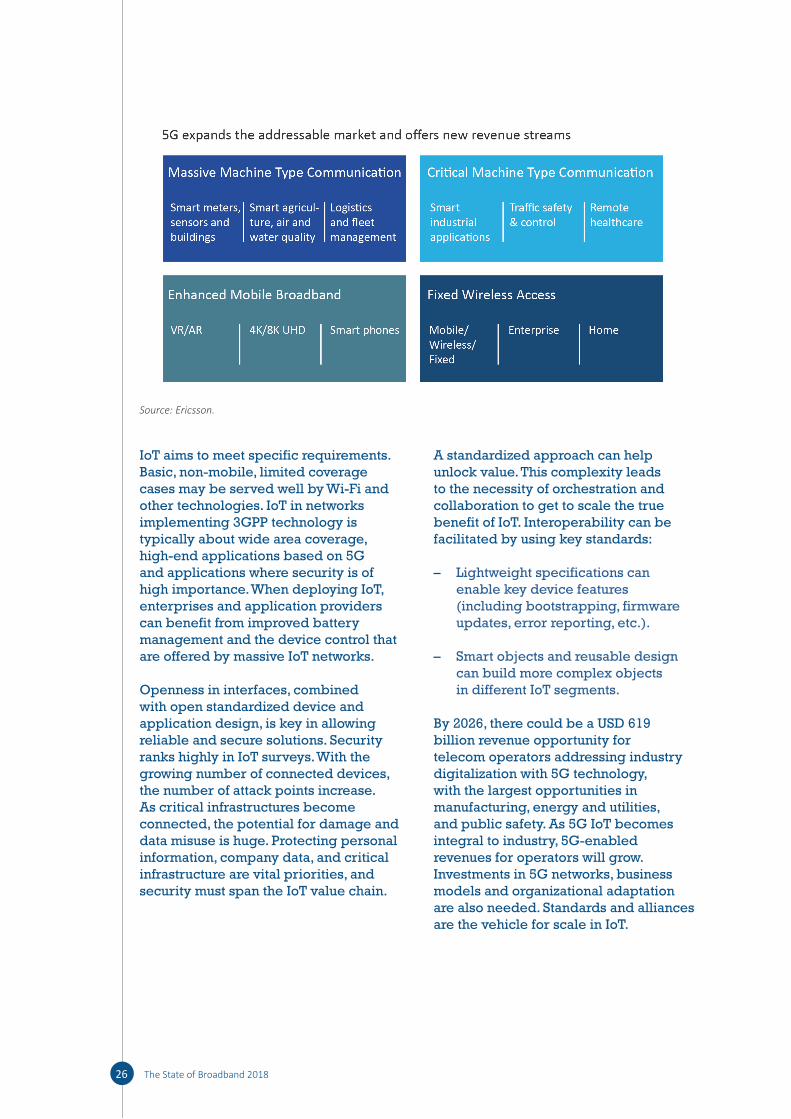
IoT is a cornerstone in the ongoing digitization of industries and society. The convergence of several technologies of the Fourth Industrial Revolution such as AI, cloud computing, drones, self-driving vehicles or robotics. The IoT market can be divided into two main types:
• Massive IoT – large number of devices, platform transmitting low bit-rates of data, long battery life in devices. Typical use cases are found in smart city solutions such as logistics, smart meters, sensors and buildings, as well as in agriculture, air and water quality management.
• Critical IoT – higher bit-rates of data, low-latency, and improved reliability, ultra-low latency and 5G technologies will support these requirements. Typical use cases are found in advanced industrial applications, traffic safety and control, remote healthcare.
Chapter 2
The State of Broadband 201826
Source: Ericsson.
IoT aims to meet specific requirements. Basic, non-mobile, limited coverage cases may be served well by Wi-Fi and other technologies. IoT in networks implementing 3GPP technology is typically about wide area coverage, high-end applications based on 5G and applications where security is of high importance. When deploying IoT, enterprises and application providers can benefit from improved battery management and the device control that are offered by massive IoT networks.
Openness in interfaces, combined with open standardized device and application design, is key in allowing reliable and secure solutions. Security ranks highly in IoT surveys. With the growing number of connected devices, the number of attack points increase. As critical infrastructures become connected, the potential for damage and data misuse is huge. Protecting personal information, company data, and critical infrastructure are vital priorities, and security must span the IoT value chain.
A standardized approach can help unlock value. This complexity leads to the necessity of orchestration and collaboration to get to scale the true benefit of IoT. Interoperability can be facilitated by using key standards:
– Lightweight specifications can enable key device features (including bootstrapping, firmware updates, error reporting, etc.).
– Smart objects and reusable design can build more complex objects in different IoT segments.
By 2026, there could be a USD 619 billion revenue opportunity for telecom operators addressing industry digitalization with 5G technology, with the largest opportunities in manufacturing, energy and utilities, and public safety. As 5G IoT becomes integral to industry, 5G-enabled revenues for operators will grow. Investments in 5G networks, business models and organizational adaptation are also needed. Standards and alliances are the vehicle for scale in IoT.
The State of Broadband 2018 27
Source: Ericsson. Ericsson’s The guide to capturing the 5G-IoT business potential https: / / www .ericsson .com/ en/ networks/ trending/ insights -and -reports/ 5g -challenges -the -guide -to -capturing -5g -iot -business -potential
In the UK, the regulator OFCOM conducted a study entitled “Review of latest developments in the IoT”, which identified applications with the largest number of connections, examined which technologies are likely to be adopted, and identified critical issues for regulation. It is hoped that this study can give some assurance to operators, prospective licence holders and IoT partners on the views of the regulator.
Governments in the Middle East are beginning to look closely at the impact of IoT. For
example, in 2017, the Telecommunications Regulatory Commission of Jordan launched a green paper on IoT with the goal of inviting comments from the industry and public at large on many facets of IoT deployment including spectrum, security, addressing, data analytics, permanent roaming, etc. Similarly, in Saudi Arabia, CITC has launched a public consultation to examine the impact of the launch of IoT, virtual network operator licences and issues around IoT.
Figure 9: How IoT is Driving Change
IoT Changes the Paradigm across Businesses Specific Manufacturing Sectors
Source: IDC, “The IoT Imperative for Discrete Manufacturers: Automotive, Aerospace and Defense, High-Tech, and Industrial Machinery”, 2017, available at: https: / / www .sap .com/ cmp/ dg/ sapleonardo -discrete -manufacturing -industries/ typ .html
Chapter 2
The State of Broadband 201828
Table 3: Different Technologies Used for IoT
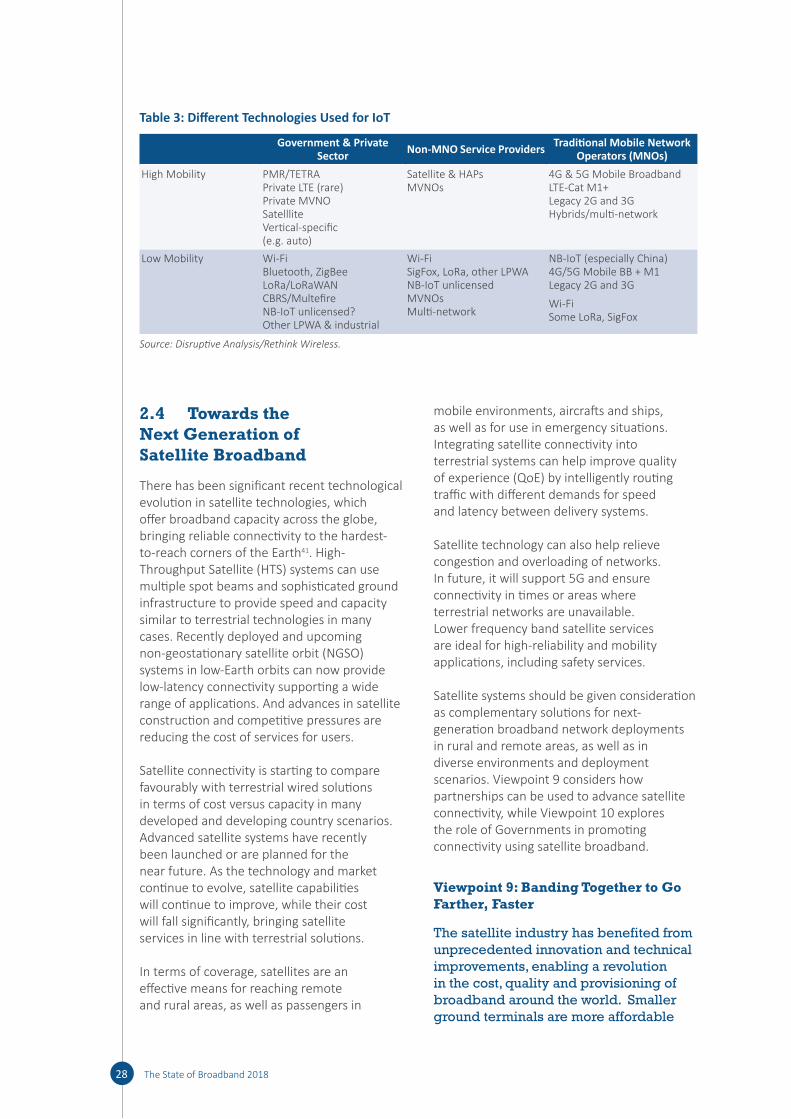
Government & Private Sector Non-MNO Service Providers Traditional Mobile Network
Operators (MNOs)High Mobility PMR/TETRA
Private LTE (rare) Private MVNO Satelllite Vertical-specific (e.g. auto)
Satellite & HAPs MVNOs
4G & 5G Mobile Broadband LTE-Cat M1+ Legacy 2G and 3G Hybrids/multi-network
Low Mobility Wi-Fi Bluetooth, ZigBee LoRa/LoRaWAN CBRS/Multefire NB-IoT unlicensed? Other LPWA & industrial
Wi-Fi SigFox, LoRa, other LPWA NB-IoT unlicensed MVNOs Multi-network
NB-IoT (especially China) 4G/5G Mobile BB + M1 Legacy 2G and 3G
Wi-Fi Some LoRa, SigFox
Source: Disruptive Analysis/Rethink Wireless.
2.4 Towards the Next Generation of Satellite Broadband
There has been significant recent technological evolution in satellite technologies, which offer broadband capacity across the globe, bringing reliable connectivity to the hardest-to-reach corners of the Earth41. High-Throughput Satellite (HTS) systems can use multiple spot beams and sophisticated ground infrastructure to provide speed and capacity similar to terrestrial technologies in many cases. Recently deployed and upcoming non-geostationary satellite orbit (NGSO) systems in low-Earth orbits can now provide low-latency connectivity supporting a wide range of applications. And advances in satellite construction and competitive pressures are reducing the cost of services for users.
Satellite connectivity is starting to compare favourably with terrestrial wired solutions in terms of cost versus capacity in many developed and developing country scenarios. Advanced satellite systems have recently been launched or are planned for the near future. As the technology and market continue to evolve, satellite capabilities will continue to improve, while their cost will fall significantly, bringing satellite services in line with terrestrial solutions.
In terms of coverage, satellites are an effective means for reaching remote and rural areas, as well as passengers in
mobile environments, aircrafts and ships, as well as for use in emergency situations. Integrating satellite connectivity into terrestrial systems can help improve quality of experience (QoE) by intelligently routing traffic with different demands for speed and latency between delivery systems.
Satellite technology can also help relieve congestion and overloading of networks. In future, it will support 5G and ensure connectivity in times or areas where terrestrial networks are unavailable. Lower frequency band satellite services are ideal for high-reliability and mobility applications, including safety services.
Satellite systems should be given consideration as complementary solutions for next-generation broadband network deployments in rural and remote areas, as well as in diverse environments and deployment scenarios. Viewpoint 9 considers how partnerships can be used to advance satellite connectivity, while Viewpoint 10 explores the role of Governments in promoting connectivity using satellite broadband.
Viewpoint 9: Banding Together to Go Farther, Faster
The satellite industry has benefited from unprecedented innovation and technical improvements, enabling a revolution in the cost, quality and provisioning of broadband around the world. Smaller ground terminals are more affordable

The State of Broadband 2018 29
and easier to install than ever before, often allowing for self-installation in several hours and without trained technicians. Electronically steerable antennas are better suited to enable mobility services, allowing for satellites to communicate with terminals on vehicles, trains, vessels and airplanes. Smaller satellites in new orbits closer to Earth minimize latency issues. High-throughput satellites (HTS) with steerable spot beams can provide up to ten times the throughput of traditional satellites, and be configured to cover zones of high or imminent demand.
Software-defined payloads now allow for the purchase of “off-the-shelf” satellites which, once in space, can be modified to maximize their efficiency and output by altering frequencies, beams and throughput based on demand. There are now ways to “refuel” satellites in space, thus extending the in-orbit life span of a spacecraft by several years. Further, the current race to introduce reliable, affordable and reusable launch vehicles helps to make satellite services more economical.
Technological advances are improving the speed and quality of today’s satellite solutions, as well as decreasing costs and making satellite services more accessible for everyone. Satellite communications can be tailored according to user requirements and in many cases provide the best and most economical solution (see figure).
Satellite is an integral part of the universe of broadband solutions, even in relatively mature markets, as illustrated by the fact that the U.S. and Europe are amongst the largest global markets for satellite broadband connectivity.
Satellite provides many advantages for the deployment of broadband solutions:
Instant Infrastructure – Antennas can be installed in hours, enabling remote villages to be connected in a couple of days. Thanks to recent innovations, small and portable antennas can easily be transported (or even hand-carried) to even the most remote place and over rugged terrain.
Flexible/Re-usable – Satellites are ideal for terrestrial operators to extend their networks. Once the terrestrial network has reached a remote location, a satellite terminal can be re-installed at a different location, further away.
Scalable – Satellite solutions can be easily scaled up to demand, separately for upload and download speeds, to grow with the requirement of usage on an ‘as needed’ basis.
Solar-Powered – Today’s small antennas require less power and can use solar panels to compensate for the lack of reliable power in many locations and eliminate the need for diesel generators and fuel.
Chapter 2
Box Figure: Cost Comparison of Different Technologies for Connecting the Final 10% of Customers
Capital Cost AUSD per Premises Activated (includes capitalised opex and the discounted value of replacement capex) Source: State of Broadband 2013 report
The State of Broadband 201830
Mobility Capabilities – Steerable antennas can ‘lock’ onto the satellite and enable excellent mobility solutions to airplanes, trains, vessels and vehicles. For example, medical vehicles connected via satellite can serve as ‘mobile hospitals’, transferring test results and medical data to hospitals.
Resilient – Satellite solutions are resilient during natural disasters such as earthquakes or floods.
Source: Stephen Spengler, Intelsat.
Viewpoint 10: The Role of Satellite in National Broadband Plans (NBPs)
Governments should strive to foster markets that are accessible to all and allow the innovative use of technologies. For satellite operators to be able to enter the market, it is important that there is a legal and regulatory structure that is unboxed by legacy rules, or otherwise limit the number of independent service providers that are permitted to provide satellite services to consumers. Competition between a large number of market players encourages investment in infrastructure, the provision of new services, improvements in quality and availability of lower prices42.
Furthermore, governments should take satellite technologies into consideration in their NBPs. As such, it is essential to add a strategy or specific goal on satellite solutions for hard to reach areas. NBPs need to recognize satellite technology as an essential element to provide broadband access to rural, remote or geographically challenged areas of the country. Governments need to leverage the use of satellite technology in those areas where terrestrial broadband technologies are not feasible.
In the United States, the Federal Communication Commission (FCC) reformed and modernized their USF into the Connect America Fund (CAF) to maintain voice services
and extend broadband-capable infrastructure. Through the CAF, the FCC will use alternative approaches, such as satellite broadband, to address the costliest areas, minimizing the burden on consumers, and is also considering means-tested consumer subsidies for satellite service43. In the Philippines, the Broadband Plan sets out future projects for broadband connectivity using satellite.
In conclusion, national governments can truly make a difference in bridging the broadband gap by taking advantage of technologies such as satellite to bring reliable connectivity to unconnected areas and create an effective solution to expand Internet reach. To support satellite connectivity initiatives, governments should ensure that they have an effective regulatory environment, are bolstering demand and lowering the cost of infrastructure. Governments are not alone in this endeavor, and can count on support and advice from international organizations and donor institutions to help broker partnerships with private sector actors and through combined efforts to enable the implementation of projects.
Checklist for Utilizing Broadband to Bridge the Digital Divide
The following checklist comprises the ten top policy elements as a starting point for countries willing to utilize satellite broadband to help bridge the digital divide:
• Acknowledge the urgent need to serve rural populations in government policies and regulations.
• Identify rural, remote, and low-population density communities needing broadband coverage, which cannot be served by terrestrial media.
• Include satellite broadband as an available alternative and integral part of any NBP.

The State of Broadband 2018 31
• Identify region-wide needs and develop projects to cover countries on the same satellite coverage footprint so as to share capacity.
• Acquire unbiased, professional, technical, financial, and management expertise to develop optimal network design on a case-by-case basis, inclusive of rural customer requirements.
• Consider new technologies available for the future broadband markets, such as HTS and/or medium earth orbit (MEO) systems.
• Consider, define, and implement financing policies for broadband services in remote areas, including broadband, USFs, tax incentives and/or government funding for pilot projects.
• Identify potential partnerships with international organizations, multilateral development banks, and satellite operators for specific projects.
• Stimulate demand for broadband services by making services affordable, increasing digital literacy, and ensuring that there is relevant local content available.
• Conduct capacity-building workshops with stakeholders on technical and policy issues.
Source: Excerpt from ITSO-IADB (2016), “The Provision of Satellite Broadband Services in Latin America and the Caribbean”, page 104, available at: https: / / publications .iadb .org/ bitstream/ handle/ 11319/ 7843/ The -Provision -of -Satellite -Broadband -Services -in -Latin -America -and -the -Caribbean .pdf ?sequence = 1 & isAllowed = y. Source: Patrick Masambu and Piotr Dmochowski-Lipski, ITSO/EUTELSAT IGO.
Chapter 2

32 The State of Broadband 2018
1 “We Are Social Internet report”, January 2018, available at https: / / wearesocial .com/ blog/ 2018/ 01/ global -digital -report -2018 based on data from Global Web Index.
2 “ICT4D Report 2018: Data-Driven Development”, World Bank, Washington, forthcoming.3 www .digitaltvnews .net/ ?p = 27026 4 “LTE Subscriber Base to Grow to 1.4 Billion Globally by Year-end 2015”, ABI Research, 12 June 2015, available
from: https: / / www .abiresearch .com/ press/ lte -subscriber -base -to -grow -to -14 -billion -globally/ 5 www .totaltele .com/ view .aspx ?ID = 493950 6 Figures for December 2015 and March 2016 available from: http: / / newsroom .fb .com/ company -info/ 7 “The Global Smartphone Report: The forces behind the global deceleration in smartphone sales”, Business
Intelligence, 29 March 2016.8 World Investment Report 2017, UNCTAD, Geneva.9 Cisco Virtual Networking Index 2017.10 https: / / www .whatsapp .com/ about/ 11 https: / / www .viber .com/ en/ about 12 “Artificial Intelligence: Re-Imagining Big Data's Applicability”, available at: www .cxotoday .com/ story/ artificial
-intelligence -re -imagining -big -datas -applicability/ 13 “Digital Universe Invaded By Sensors”, available at: https: / / www .emc .com/ about/ news/ press/ 2014/ 20140409
-01 .htm14 Point Topic, available at: http: / / point -topic .com/ free -analysis/ world -broadband -statistics -q3 -2017/ 15 https: / / theinclusiveinternet .eiu .com/ 16 https: / / www .telegeography .com/ products/ commsupdate/ articles/ 2018/ 03/ 02/ vodafone -launches -1gbps -4g
-in -italy/ ?utm _source = CommsUpdate & utm _campaign = 801ea811df -CommsUpdate+02+March+2018 & utm _medium = email & utm _term = 0 _0688983330 -801ea811df -11619241
17 https: / / www .telegeography .com/ products/ commsupdate/ articles/ 2018/ 03/ 02/ ooredoo -lte -coverage -reaches -90 -of -oman/ ?utm _source = CommsUpdate & utm _campaign = 801ea811df -CommsUpdate+02+March+2018 & utm _medium = email & utm _term = 0 _0688983330 -801ea811df -11619241
18 https: / / www .telegeography .com/ products/ commsupdate/ articles/ 2018/ 04/ 24/ mts -expands -4g -lte -coverage -to -new -cities -in -minsk -region/ ?utm _source = CommsUpdate & utm _campaign = fc59a2c57e -CommsUpdate+24+April+2018 & utm _medium = email & utm _term = 0 _0688983330 -fc59a2c57e -11619241
19 “China to blaze Connectivity Trail with a Billion 5G users by 2023”, TechRadar, 18 October 2017, available at: www .techradar .com/ news/ china -to -blaze -connectivity -trail -with -a -billion -5g -users -by -2023
20 https: / / www .telegeography .com/ products/ commsupdate/ articles/ 2017/ 11/ 30/ verizon -launching -5g -fixed -wireless -residential -broadband -in -2h18/ ?utm _source = CommsUpdate & utm _campaign = e0d374e528 -CommsUpdate+30+November+2017 & utm _medium = email & utm _term = 0 _0688983330 -e0d374e528 -11619241
21 https: / / www .telegeography .com/ products/ commsupdate/ articles/ 2018/ 02/ 27/ ooredoo -strengthens -nokia -partnership -for -5g -rollout/ ?utm _source = CommsUpdate & utm _campaign = 95977c6891 -CommsUpdate+27+February+2018 & utm _medium = email & utm _term = 0 _0688983330 -95977c6891 -11619241
22 https: / / gsacom .com/ building -5g -data -analytics -artificial -intelligence 23 https: / / www .ihs .com/ Info/ 0117/ 5g -technology -global -economy .html 24 Chapter 2, “Data-Driven Development”, Global ICT4D report, World Bank, forthcoming.25 Research ICT Solutions, OTTs: Impact on Operator Revenues, 1 May 2018. See presentation of research findings
at: https: / / researchictsolutions .com/ otts -threat -or -opportunity -for -african -telcos/ 26 Wissenschaftliches Institut für Infrastruktur und Kommunikationsdienste, The Economic and Societal Value of
Rich Interaction Applications (RIAs). http: / / www .wik .org/ fileadmin/ Studien/ 2017/ CCIA _RIA _Report .pdf 27 https: / / www .mckinsey .com/ industries/ telecommunications/ our -insights/ the -road -to -5g -the -inevitable -growth
-of -infrastructure -cost ?cid = other -eml -alt -mip -mck -oth -1802 & hlkid = 4108a3016b4842dfac490f90465f61f4 & hctky = 9411404 & hdpid = 11560416 -85ad -4de7 -99a9 -f0dc73b2ca57
Endnotes

33The State of Broadband 2018
28 Due to the higher concentration of traffic (measured in traffic load per square kilometer) and the use of higher spectrum bands above 3 Gigahertz.
29 Source: Deloitte Global Survey of Mobile-Only Adults, August-October 2017. Sample sizes: Turkey (290), France (103), Spain (168) and Russia (171). As reported in Deloitte TMT Predictions 2018, available from: https: / / www2 .deloitte .com/ global/ en/ pages/ technology -media -and -telecommunications/ articles/ tmt -predictions .html
30 Deloitte TMT Predictions 2018, available from: https: / / www2 .deloitte .com/ global/ en/ pages/ technology -media -and -telecommunications/ articles/ tmt -predictions .html
31 Deloitte TMT Predictions 2018, available from: https: / / www2 .deloitte .com/ global/ en/ pages/ technology -media -and -telecommunications/ articles/ tmt -predictions .html
32 Point Topic, available at: http: / / point -topic .com/ free -analysis/ world -broadband -statistics -q4 -2017/ 33 “Algérie Telecom announces major FTTH deployment”, available at: https: / / www .telegeography .com/ products/
commsupdate/ articles/ 2018/ 01/ 31/ algerie -telecom -announces -major -ftth -deployment/ ?utm _source = CommsUpdate & utm _campaign = 742b676a11 -CommsUpdate+31+January+2018 & utm _medium = email & utm _term = 0 _0688983330 -742b676a11 -11619241
34 https: / / www .btplc .com/ News/ #/ pressreleases/ results -for -the -third -quarter -to -31 -december -2017 -2401079 35 https: / / www .telegeography .com/ products/ commsupdate/ articles/ 2018/ 04/ 17/ tim -brasil -launches
-2gbps -ftth -in -sao -paulo -rio -de -janeiro/ ?utm _source = CommsUpdate & utm _campaign = 454a2f71ca -CommsUpdate+17+April+2018 & utm _medium = email & utm _term = 0 _0688983330 -454a2f71ca -11619241
36 Verizon, NTT, AT&T: ?$200-$400 5G Costs Much Lower Than Expected http: / / bit .ly/ Hans20040037 “300,000 Indian Villages Fibered; 325,000 More To Come”, available at: http: / / bit .ly/ 600KIndia38 According to Intel, a self-driving car could generate up to 4’000 Gigabytes of data per hour of driving, see: www
.networkworld .com/ article/ 3147892/ internet/ one -autonomous -car -will -use -4000 -gb -of -dataday .html39 Page 61, “Digital Economy Outlook 2015”, OECD, available at: http: / / ec .europa .eu/ eurostat/ documents/ 42577/
3222224/ Digital+economy+outlook+2015/ dbdec3c6 -ca38 -432c -82f2 -1e330d9d6a24 40 https: / / www .ericsson .com/ en/ press -releases/ 2018/ 6/ 5g -on -a -roll -cellular -iot -deployments -ramping -up -
-ericsson -mobility -report41 “Report of the Broadband Commission. Working Group on Technologies in Space and the Upper Atmosphere.
2017”, available at: www .broadbandcommission .org/ workinggroups/ Pages/ spacetechnology .aspx42 Report of an Expert Group presented to the Broadband Commission, “A New Deal: Investing in Our Common
Future”, 2018.43 US Government “National Broadband Plan” 2010, p. 150, at: https: / / transition .fcc .gov/ national -broadband
-plan/ national -broadband -plan .pdf

The State of Broadband 201834
In January 2018, at its Special Session at the Annual General Meeting of the World Economic Forum, the Broadband Commission extended and updated its existing five broadband targets to a total of seven targets. This report consider progress across all seven targets. Policy analysis and targets can play a significant role in informing, shaping and influencing policy priorities at the national and regional levels – for example, Viewpoint 11 describes how policy analysis has helped concretize policy thinking and priorities, from the perspective of the Government of Rwanda.
Viewpoint 11: The Importance of Policy Analysis for Shaping Policy Priorities in Africa – Government of Rwanda
Rwanda has made significant progress towards affordable broadband for all. In 2008, the Government of Rwanda (GoR) embarked on a nationwide roll-out of fibre optic as a backbone infrastructure for broadband. This optic fibre connected different parts of the country and provided high-capacity cross-border links with onward connectivity to submarine cables. In 2013, GoR published a new broadband policy aimed at restructuring the broadband market under an infrastructure-sharing regime, by putting in place a 4G LTE wholesale open-access network, as a means to accelerate roll-out of
broadband network services, and reduce overall infrastructure investment costs. The network is currently over 90% population coverage.
Policy analysis has helped guide the Government’s planning and decision-making process, right from the start of the ICT4D journey in 2000. The GoR has developed the National 5-year ICT Plans since 2001, revised every five years. The fourth 5-year rolling plan, the Smart Rwanda Masterplan, was adopted in 2015 and includes, among others, a target for gender digital equality by 2020. The Broadband Commission targets and policy analysis were key inputs to the formulation of this and other targets for the Smart Rwanda Masterplan.
The Government’s vision, policy and plans recognize broadband and ICTs in general, as a driver of economic growth, access to information and social cohesion, productivity and innovation across all sectors of the economy. Steps have been taken to promote innovation and entrepreneurship, reduce the cost of end-user devices, stimulate the development and uptake of relevant content and diffusion of technologies into various sectors of the economy. Broadband connectivity provides access to information and enables economic activities that create jobs,
3 Evaluating Growth in Broadband Using the Commission’s Targets
reduce the cost of communications and improve government service delivery.
At the continental level, the leadership by H.E. President Paul Kagame and the work of the Broadband Commission have been a factor in numerous developments, including the Smart Africa Initiative. In October 2013, the first Transform Africa Summit was co-hosted by the GoR and ITU, and culminated in the Smart Africa Manifesto as a continental agenda to leverage ICTs for Africa’s transformation. This manifesto was adopted at the African Union Summit in January 2014, effectively endorsing Smart Africa as a continental agenda.
The overall objective of Smart Africa is to foster integration across the continent, towards a single African digital market, spurring innovation, economic growth and job creation. Great progress has been made, with 25 Heads of State and Government across Africa committing to and embracing the Smart Africa Agenda, which includes the following pillars:
• Establishing an enabling policy environment;
• Promoting and expanding broadband access;
• Enabling efficient Government service delivery through e-Government;
• Putting the private sector first; and
• Sustainable Development.
In conclusion, policy analysis by the UN Broadband Commission has been a useful input for ICT policy formulation in Rwanda and, more generally, in Africa.
Source: Patrick Nyirishema, Director-General of RURA (Rwanda Utilities Regulatory Authority).
3.1 Advocacy Target 1: Making broadband policy universal
By 2025, all countries should have a National Broadband Plan or strategy or include broadband in their UAS definitions
Growth in the number of countries with NBPs has shown good progress, but has effectively stabilized over recent years (Figure 10, left). According to ITU data, 81% of all countries now have a NBP, at 159 countries in 2018, up from 156 in 2016 and 151 in 2015. 35 countries do not have a Plan (Appendix 1). For example, in Lebanon, the state-owned fixed-line telco, Ogero, has developed a network and Internet strategy. This plan for a national
The State of Broadband 2018 35

The State of Broadband 201836
fibre-optic upgrade aims for 85% of Lebanon’s population to access the Internet at speeds over 50 Mbps (ten times faster than many current connections) by end 2020. Investments of USD 99 million are planned in the fibre project investment in 2018. Ogero’s fixed voice network equipment upgrade is scheduled for the end of 2018, and wireless Internet coverage for rural areas for mid-2018, with the public Wi-Fi programme due to end in 20181.
Viewpoint 12 from the OECD discusses how national broadband availability targets are evolving. One obvious way in which NBPs are evolving is to include new technologies, such as IoT. For example, China has a national strategy for IoT. Following efforts by government and industries, China has built a huge narrow-band cellular IoT network, with over 700,000 active sites. In 2018, applications will exceed one million connections (including smart fire, smart gas, smart water and smart home), and a large number of innovative applications are emerging (including connected cattle and electric vehicle monitoring).
Another way in which NBPs should evolve is to take into account AI and data. According to Tim Dutton (2018), at least 15 countries have concrete national strategies for AI,
while another six countries are working to develop their strategy. In its “Data-Driven Development” report, the World Bank (2018) notes that “there is growing recognition within many governments that, in the digital economy, data is on par as an infrastructure asset with more traditional infrastructure like transport and public utilities. There is now interest in crafting policy that recognizes data as an infrastructure asset2. Policies that discuss data infrastructure in the government typically focus on management of data assets (collection, access, reuse, sharing, preservation, security) and data governance (ownership, funding)”3. This implies data is an asset, similar to other infrastructure assets.
Viewpoint 12: Evolving National Broadband Availability Targets
In order to close broadband divides, it is necessary to measure the different availability and adoption gaps. Given the capabilities within each broadband speed threshold, a technology-neutral approach or a speed-based approach disaggregated to the smallest regional level possible is desirable, as it allows measuring
Figure 10: Policy Leadership in National Broadband Plans, 2008-2018
Number of countries that have adopted a Plan or Strategy, planning to adopt or without (left chart); Growth in National Broadband Plans, 2006-2018 (right chart).
Source: ITU. Note: Charts based on data for 196 countries. National Broadband Plan or strategy includes: a plan, strategy or policy specific to broadband; digital plan, agenda, strategy or policy; ICT plan, strategy, or policy; or a communication plan, strategy, or policy.

The State of Broadband 2018 37
the accessibility gaps in terms of QoS for each area and type of user.
Baseline definitions of broadband remain important for measurement of high-speed network availability. When the 256 kbps threshold was established in 2001, it served the purpose of excluding ISDN and was, at that time, the lowest commonly offered commercially offered speed in OECD countries. Periodically, it has been suggested that the threshold speed for data collection be raised, but without consensus on a new baseline, it was instead decided to introduce speed tiers for reporting broadband subscriptions (e.g. 256 Kbps to 1.5/2 Mbps; 1.5/2 Mbps to 10 Mbps and so forth with increasing tiers of service to above 1 Gbps). While speed tiers are useful for comparisons, the current 256 kbps definition for broadband seems increasingly removed from the expectations of all stakeholders, including those in rural areas.
All OECD countries (apart from Japan4) have specific national goals for broadband availability. In the majority of countries, goals for broadband deployment are set in terms of speed of service offered and percentage of coverage, penetration and specific groups. Luxembourg has the highest access target with a goal of offering 1 Gbps to 100% of households by 2020, followed by Sweden with the goal of connecting 98% of both households and businesses with 1 Gbps broadband. Korea has the goal of connecting 90% of urban areas with 1 Gbps by 2017. Belgium aims for 50% of its households to have 1 Gbps by 2020 and Sweden 98% by 2025. Australia, Israel and several European countries have set national goals in the range from 25-30 Mbps, while Chile has a target of 10 Mbps (see Figure below).
Box Figure: Matrix of OECD national broadband targets per coverage and quality
Source: OECD.
While broadband plans understandably focus on business and residences or aim at extending mobile broadband coverage in areas with little or no coverage, the mention of railways, highways and roads in Canada, the UK and EU goals is significant. Many
people in rural areas live close to highways and roads, even if their businesses and residences are distant to towns or cellular towers.
Policy frameworks that promote the maximum expansion of telecom and
Chapter 3
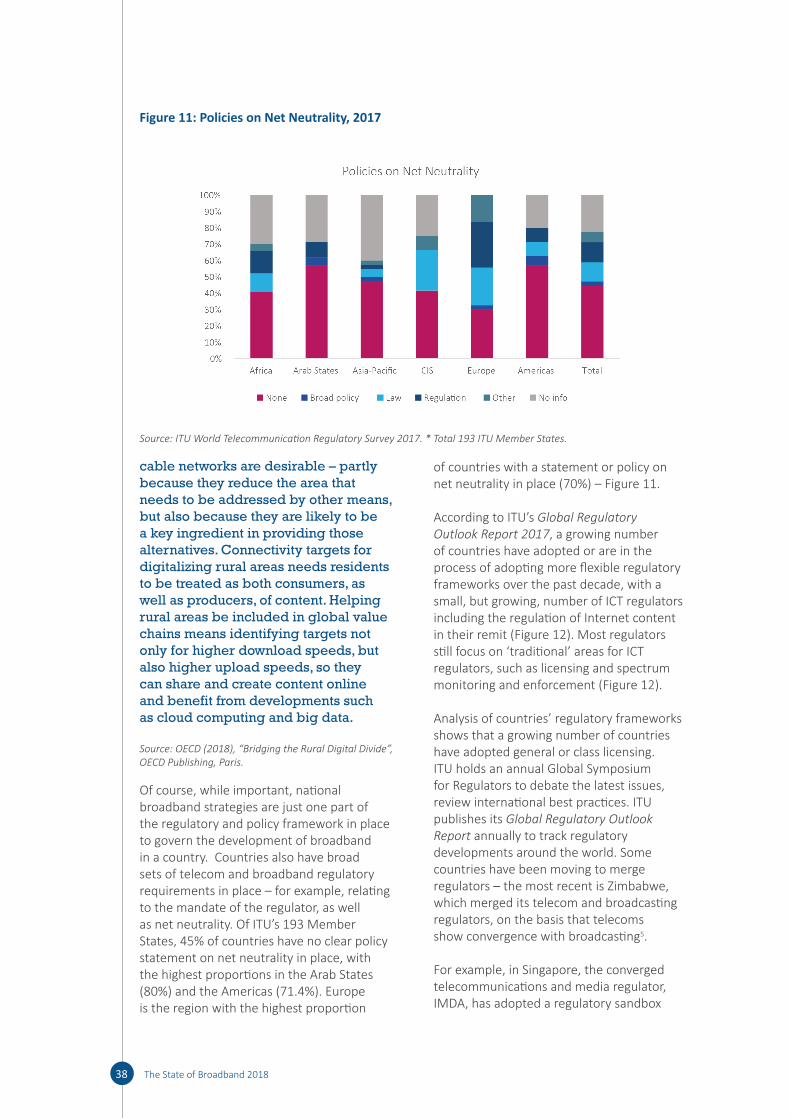
The State of Broadband 201838
cable networks are desirable – partly because they reduce the area that needs to be addressed by other means, but also because they are likely to be a key ingredient in providing those alternatives. Connectivity targets for digitalizing rural areas needs residents to be treated as both consumers, as well as producers, of content. Helping rural areas be included in global value chains means identifying targets not only for higher download speeds, but also higher upload speeds, so they can share and create content online and benefit from developments such as cloud computing and big data.
Source: OECD (2018), “Bridging the Rural Digital Divide”, OECD Publishing, Paris.
Of course, while important, national broadband strategies are just one part of the regulatory and policy framework in place to govern the development of broadband in a country. Countries also have broad sets of telecom and broadband regulatory requirements in place – for example, relating to the mandate of the regulator, as well as net neutrality. Of ITU’s 193 Member States, 45% of countries have no clear policy statement on net neutrality in place, with the highest proportions in the Arab States (80%) and the Americas (71.4%). Europe is the region with the highest proportion
of countries with a statement or policy on net neutrality in place (70%) – Figure 11.
According to ITU’s Global Regulatory Outlook Report 2017, a growing number of countries have adopted or are in the process of adopting more flexible regulatory frameworks over the past decade, with a small, but growing, number of ICT regulators including the regulation of Internet content in their remit (Figure 12). Most regulators still focus on ‘traditional’ areas for ICT regulators, such as licensing and spectrum monitoring and enforcement (Figure 12).
Analysis of countries’ regulatory frameworks shows that a growing number of countries have adopted general or class licensing. ITU holds an annual Global Symposium for Regulators to debate the latest issues, review international best practices. ITU publishes its Global Regulatory Outlook Report annually to track regulatory developments around the world. Some countries have been moving to merge regulators – the most recent is Zimbabwe, which merged its telecom and broadcasting regulators, on the basis that telecoms show convergence with broadcasting5.
For example, in Singapore, the converged telecommunications and media regulator, IMDA, has adopted a regulatory sandbox
Figure 11: Policies on Net Neutrality, 2017
Source: ITU World Telecommunication Regulatory Survey 2017. * Total 193 ITU Member States.
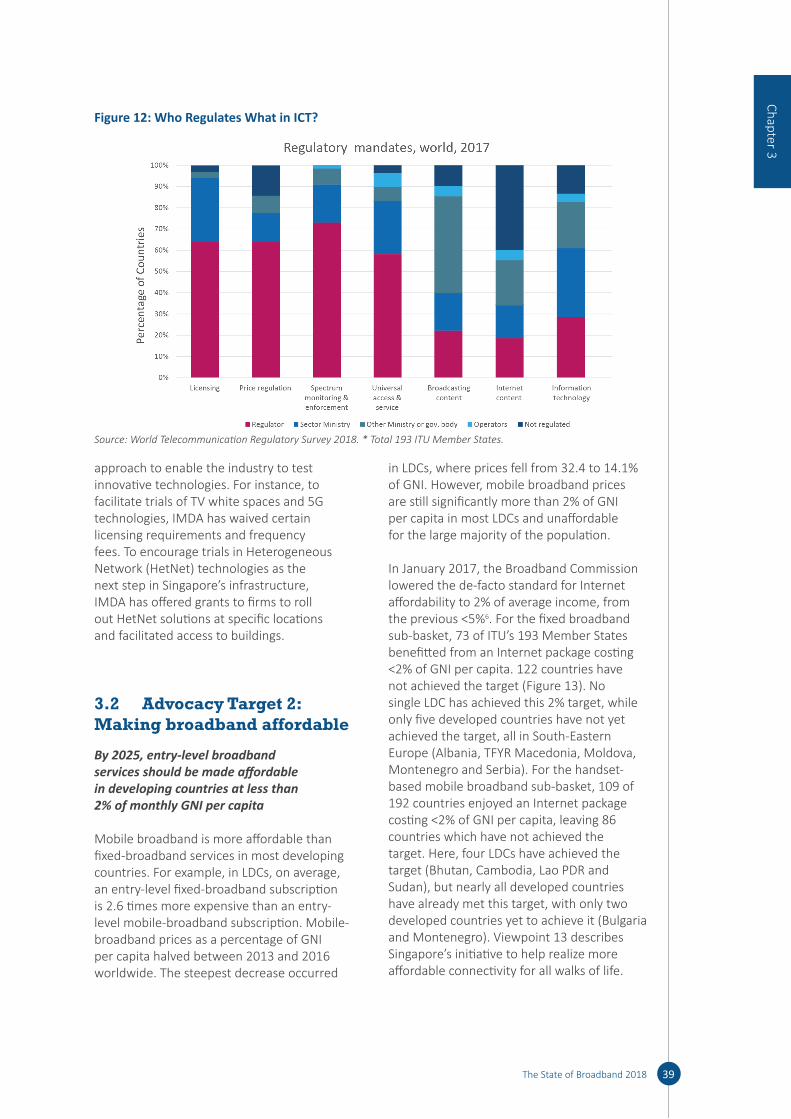
The State of Broadband 2018 39
approach to enable the industry to test innovative technologies. For instance, to facilitate trials of TV white spaces and 5G technologies, IMDA has waived certain licensing requirements and frequency fees. To encourage trials in Heterogeneous Network (HetNet) technologies as the next step in Singapore’s infrastructure, IMDA has offered grants to firms to roll out HetNet solutions at specific locations and facilitated access to buildings.
3.2 Advocacy Target 2: Making broadband affordable
By 2025, entry-level broadband services should be made affordable in developing countries at less than 2% of monthly GNI per capita
Mobile broadband is more affordable than fixed-broadband services in most developing countries. For example, in LDCs, on average, an entry-level fixed-broadband subscription is 2.6 times more expensive than an entry-level mobile-broadband subscription. Mobile-broadband prices as a percentage of GNI per capita halved between 2013 and 2016 worldwide. The steepest decrease occurred
in LDCs, where prices fell from 32.4 to 14.1% of GNI. However, mobile broadband prices are still significantly more than 2% of GNI per capita in most LDCs and unaffordable for the large majority of the population.
In January 2017, the Broadband Commission lowered the de-facto standard for Internet affordability to 2% of average income, from the previous <5%6. For the fixed broadband sub-basket, 73 of ITU’s 193 Member States benefitted from an Internet package costing <2% of GNI per capita. 122 countries have not achieved the target (Figure 13). No single LDC has achieved this 2% target, while only five developed countries have not yet achieved the target, all in South-Eastern Europe (Albania, TFYR Macedonia, Moldova, Montenegro and Serbia). For the handset-based mobile broadband sub-basket, 109 of 192 countries enjoyed an Internet package costing <2% of GNI per capita, leaving 86 countries which have not achieved the target. Here, four LDCs have achieved the target (Bhutan, Cambodia, Lao PDR and Sudan), but nearly all developed countries have already met this target, with only two developed countries yet to achieve it (Bulgaria and Montenegro). Viewpoint 13 describes Singapore’s initiative to help realize more affordable connectivity for all walks of life.
Chapter 3
Figure 12: Who Regulates What in ICT?
Source: World Telecommunication Regulatory Survey 2018. * Total 193 ITU Member States.

The State of Broadband 201840
Viewpoint 13: Helping realize affordable connectivity for people from all walks of life in Singapore
Cognisant of the need to make connectivity as inclusive as possible, in Singapore, IMDA has enhanced the Digital Inclusion Programme aimed at building a digitally inclusive society that brings infocomm to people from all walks of life. The Digital Inclusion programme consists of four key areas – the Silver Infocomm Initiative, NEU PC Plus Programme, Home Access Programme and Enable IT Programme. These programmes target four key groups of citizens: senior citizens, low-income students, low-income households and people with disabilities (PWDs), respectively.
• The Silver Infocomm Initiative aims to bridge the digital divide among seniors aged 50+ by addressing differences in educational background, language and IT competencies. Launched in 2007, the Silver Infocomm Initiative adopts a multi-pronged strategy to drive IT awareness and literacy among seniors so that they can be digitally ready and be actively engaged in the digital age. To date, over 200,000 seniors have benefitted from activities such as the Silver IT Fest, Mass IT Training, Silver Infocomm Junctions, Intergen IT Bootcamps and Digital Clinics.
• The NEU PC Plus Programme aims to provide affordable access students
from low-income households by defraying costs of computer ownership and Internet access. Since launching in 2006, over 34,000 low-income households with school-going children have benefited from: the PC-Bundle Scheme providing students from low-income households with new computers and 3 years of free broadband access at affordable prices; and the iNSPIRE Fund, which helps students to earn their PC-Bundle by doing community service. To date, over 3,000 students have benefited.
• The Home Access Programme was established in 2014 and aims to make Internet connectivity more accessible and affordable to low-income groups. Under Home Access 2.0, eligible households without school-children are provided with 2 years subsidized Internet access, with an option for basic equipment. Over 9,000 low-income households have benefited so far.
• The Enable IT Programme aims to enable and enhance the abilities of PWDs in their daily activities and employment through IT and assistive technology. Initiatives include educating PWDs, helping them make informed decisions on the appropriate IT to adopt, providing hands-on experience & training and using IT to improve employability. The Programme
Figure 13: Affordability & Broadband Prices, 2016
Source: ITU.

The State of Broadband 2018 41
is implemented through collaboration with IMDA, disability organizations and private firms.
Source: Infocomm Media Development Authority of Singa-pore (IMDA).
3.3 Advocacy Target 3: Getting People Online
By 2025, broadband-Internet user penetration should reach: 75% worldwide, 65% in developing countries, and 35% in LDCs
Three years is an eternity in telecom, so targets for 2025 are clearly optimistic at best. Estimates of Internet usage are based on a number of assumptions, each of which can be challenged. For example, it uses median population projections from the UN (extrapolated between 1 July estimates for each year), subject to various caveats (e.g. no major epidemics, conflicts, famines, and constant fertility rates).
Internet user growth rates are gradually reducing, at around 5.5% Internet user growth for 2018, as easy-to-reach areas get connected. Having said this, there are significant Internet mass connectivity projects underway in some regions, and mass area coverage by next-generation satellite. The total number of Internet users can in fact go down, as well as up – for example, as Governments and regulators revise their figures for inactive SIM cards or the latest consumer surveys. Each national figure is an estimate, based on operator subscriber data and/or consumer surveys, which may be more or less representative of each market, and the quality of the estimate depends on the quality of surveys.
Arguably, it is not just access and how many people use the Internet which is of interest; it is how the Internet is used and the quality of usage that matter. For example, in 2017, an estimated 1.66 billion people (under half the global population online) purchased goods online. Even in developed countries, large gaps persisted across OECD countries for some Internet uses as recently as 2016, with less than half of all online Internet
consumers using the Internet for telephony, content creation, travel, software download, cloud services, online job searches and sales7. Viewpoint 14 explores the case of broadband in four developing countries – Cambodia, Rwanda, Senegal and Vanuatu.
Viewpoint 14: Broadband for Development in four LDCs: Cambodia, Rwanda, Senegal and Vanuatu
So many of us take using our cell-phones and tablets for granted – instantly, we can be connected. Connectedness means participation, it means inclusion, and it means opportunities. Connection bridges space, connection is access to knowledge and innovation. However, connectivity is not an opportunity afforded to all, and many are still left behind. The group of LDCs – some 47 countries – experience severe structural obstacles to their sustainable and inclusive development. The LDCs truly risk being left most behind in the world’s economic and social development scorecard.
On some fronts, remarkable progress has taken place over recent years, but these countries still display some of the lowest Internet access rates in the world. By end 2017, only 172 million people of the nearly 1 billion people living in LDCs used the Internet, equivalent to a usage rate of 17.5%. At slightly over 20 per 100 inhabitants in LDCs, the mobile broadband subscription rates remain equally low. This is almost four times less than in developed countries.
Being connected means enhancing development potential. Thus, greater access to and enhanced literacy in and use of broadband services are critically important to the sustainable development of the LDCs and their full participation in achieving the goals of Agenda 2030. There is no time to waste. For this reason, a Working Group on Vulnerable Countries (LDCs, LLDCs and SIDS) was established under the auspices of the Broadband Commission
Chapter 3

The State of Broadband 201842
to fill the knowledge gap on how LDCs are leveraging investments in broadband for national development.
The synthesized report on ‘Broadband for National Development in four LDCs: Cambodia, Rwanda, Senegal and Vanuatu’ aims to contribute to filling that gap. This report is based on extensive case studies conducted in four LDCs in three regions: Asian LDC (Cambodia), African LDC (Senegal) with access to the sea, a landlocked LDC in Africa (Rwanda), and a small island developing state in the South Pacific (Vanuatu). It is very impressive and highly encouraging to note that, in just a few years, all the four countries were able to significantly increase broadband coverage and affordability.
Rwanda is close to achieving universal coverage of mobile broadband – in 2016, over 90% of the Rwandan population could access a 3G signal.
The market conditions leading to these remarkable achievements differed considerably, and ranged from a mix of local access competition and wholesale PPP interventions in Rwanda, to an unregulated and fiercely competitive market in Cambodia, a regulated market dominated by the incumbent operator in Senegal and the mobile “duopoly” in Vanuatu.
However, a gap persists between deploying the necessary infrastructure and then the utilization rates of the infrastructure to enhance development.
Figure 14: Internet User Penetration, 2017
Source: ITU.
The State of Broadband 2018 43
The report reveals that, while broadband impacts have so far had modest measurable impact, anecdotal evidence suggests that narrowband services and text messages have achieved traction in sectors such as health, agricultural and finance (m-money). The report makes various insightful recommendations for leveraging broadband more rapidly in LDCs.
I sincerely hope this report and its recommendations will contribute to furthering the ongoing conversation on how we can best support LDCs to connect to the emerging, and ever more rapidly evolving, digital world and to reap its developmental benefits.
Source: Ms. Fekitamoeloa Katoa 'Utoikamanu, Under-Sec-retary-General and High Representative for the Least Developed Countries, Landlocked Developing Countries and Small Island Developing States (UN-OHRLLS).
3.4 Advocacy Target 4: Digital Skills & Literacy
New Employment Dynamics & Skills of the Future: By 2025, 60% of youth and adults should have achieved at least a minimum level of proficiency in sustainable digital skills
Demand is vitally important in creating a sustainable Internet ecosystem. It is necessary to address consumers’ ability to use the Internet, as well as fostering innovation. ICT infrastructure may often remain under-utilized, due to factors such as lack of affordability, interest or knowledge, which are obstacles to the productive use of ICTs and Internet. When challenges around affordability, awareness and ability are addressed, the value of ICT and broadband can be realized and people can benefit greatly8.
A recent UNESCO/UNICEF report notes that ICTs have immense potential to facilitate dramatic changes in learning and education systems, while placing new demands on the
knowledge and skills that people need to acquire throughout their lives. There are, however, significant challenges in ensuring that everyone can benefit from this potential, and can use these technologies effectively in their lives. It is vital to ensure that the poorest, most marginalized and vulnerable people are not left behind and that tech investments contribute to improved learning and skills9.
Effective education systems are essential for meeting future challenges and delivering on the SDGs. Although rapid technological change has taken place over the last thirty years, education systems in many countries have remained largely unchanged over the last century. Education is about much more than merely providing people with the skills and knowledge to work, and must create a framework through which people can lead diverse and fulfilling lives. People of all ages should have opportunities to learn about their own cultures, in their own languages.
There is broad agreement that education needs to ensure that people gain four main skills: creativity, communication, collaboration, and critical thinking. Alongside skills such as literacy and numeracy, people should now also gain basic digital skills. They need to have a comprehensive understanding of the rapidly changing world in which they live, as well as their roles and responsibilities within it. ITU’s Global ICT Development Index (IDI) includes a measure of digital skills and capabilities.
There is considerable debate as to what proficiency in digital skills and an ‘adequate’ level really mean. Digital skills have been broken down into three categories: (1) the basic digital literacy needed for all workers, consumers and citizens in a digital society; (2) the advanced ICT skills (coding, computer science and engineering) which are needed to develop innovative ICT products and services; and (3) e-business skills or the specific know-how needed for digital entrepreneurship10. Figure 15 shows how global averages for digital skills vary from 5.2% (using a programming language) to 43.7% (transferring files).
Chapter 3

The State of Broadband 201844
Figure 15: Digital Skills Worldwide, 2017
Source: UNESCO. Note: Based on average skills available for the different numbers of countries available * = 50 countries.
It is likely that only some of these necessary digital skills can be taught in schools. Many of the digital skills needed in the new economy may be self-acquired – or at least self-perfected – through personal curiosity and interest. Viewpoint 15 describes how KT is working with the Cambodian Government and Cambodia Telecom to promote digital skills through a digital schools programme and public WiFi in parks near the capital, Phnom Penh.
Viewpoint 15: The Cambodia Public Wi-Fi & Digital Schools Project
To help bridge the digital divide in Cambodia, Korea Telecom has worked in close partnership with the Ministry of Post and Telecommunications in Cambodia and Telecom Cambodia on a public Wi-Fi and digital schools project providing free Wi-Fi in public places. It has also launched a distance learning programme for underprivileged schools under the e-Education objective of the Cambodian ICT Masterplan 2020.
In the “Samdach Hunsen” and “Royal Palace” national parks near Phnom Penh, visitors can take advantage of public Wi-Fi. KT delivered ‘Giga Wi-Fi’ technology connected to Telecom Cambodia’s
national backbone network, enabling Internet connectivity of up to 600 Mbps. From the Independence Monument in Hunsen Park, 24 Wi-Fi access points have been installed to cover the entire park. Along the Tonle Sap River in the Royal Palace Park, local residents and many tourists benefit from free Wi-Fi.
Public Wi-Fi in Hunsen Park, Phnom

The State of Broadband 2018 45
Distance Learning Class in Tuol Kpos School
Cambodia’s mobile penetration rate has risen rapidly over the last decade, but low-income families and unemployed still suffer under expensive data plans and Wi-Fi services offered by private network operators. To address information gaps between ordinary citizens and the underprivileged, national network infrastructure is in high demand for the digitally deprived.
Cambodia’s rural schools 200-300 km away from Phnom Penh have been transformed into digital schools through remote education opportunities. KT has developed a smart education application, ‘K-box’, whereby teachers implement distance classes online and communicate with over 2,000 students via video-conferencing. For enrichment of e-learning services, multimedia classrooms were established and Telecom Cambodia operates wireless networks to remote schools in cooperation with KT.
The Government of Cambodia has defined an objective for enhancing public education using ICTs to improve educational infrastructure in schools. As a pilot, the project aims to improve digital literacy, develop video content and foster e-learning programmes. On 9 May 2018, the public Wi-Fi at Samdach Hunsen Park opened, attended by 1,000 citizens of Phnom Penh. KT and MPT Cambodia showed how PPPs can help address and resolve social issues by promoting ICTs. This project addresses the SDGs, including SDG 4
(Quality Education) and SDG 9 (Industry, Innovation and Infrastructure).
Source: KT Corp.
In Singapore, IMDA works in partnership with the industry, community and other government agencies in the Media Literacy Council (MLC) to champion and develop public education and awareness on media literacy and cyber-wellness issues. The MLC’s outreach initiative, the Better Internet Campaign, encourages safe and responsible online behaviour. The campaign messaging – “Be Safe, Be Smart, Be Kind online” – addresses issues such as cyber-safety and security, critical thinking and discernment of online falsehoods, online civility and cyber-bullying. The MLC has also launched programmes with schools and tertiary institutions to develop curated resources in collaboration with private sector and people-based organizations such as Google, Facebook, DQ Institute, TOUCH Cyber Wellness and the Centre for Fathering to provide the community with tools and tips to navigate the online space. Viewpoint 16 explores how new employment dynamics will impact future skills.
Viewpoint 16: New Employment Dynamics & Skills of the Future
The combination of 5G and AI will change our world in ways we have only just begun to imagine. Improvements in healthcare, transport, energy distribution, education and other areas will benefit the lives of billions of people. At their best, the technologies behind the Fourth Industrial Revolution (4IR) will help us to create a safer, smarter and more efficient world for everyone.
The extent to which 4IR will impact the socio-economic structures underpinning our societies is still uncertain, however. How will the nature of work change? Which sectors will see increased or decreased employment? And how should we educate or re-train people in the face of these changes? We still don’t know the answers to all these questions, but we can prepare for different eventualities, so our societies are ready for the changes, as and when they happen.
Chapter 3
The State of Broadband 201846
Technological progress has broadly two competing effects on employment11. On one hand, there is an ‘attrition’ effect as automation substitutes for labor. On the other hand, capitalization describes how an increase in demand for new goods and services leads to the creation of new occupations. Some types of jobs are more at risk of attrition than others – repetitive manual labor tasks have mostly already been automated, but now, higher-level routine or predictable jobs are also at risk. The radiology profession serves as a good example, as new technology allows medical images to be interpreted more accurately and faster than previously possible.
Sophisticated algorithms may also make knowledge-based jobs – such as those in finance or law – more prone to replacement. Jobs that are less prone to substitution may include jobs requiring entrepreneurial approaches and creativity; jobs where people need to collaborate with machines; and jobs needing trust, empathy, compassion and human interaction (such as childcare or nursing). There is an urgent need to develop new skills and approaches to address the disruption created by the 4IR:
• The importance of education: There needs to be focus on entrepreneurial and social skills, as well as on the development of educational models for learning to work alongside intelligent machines. Education systems need to incentivize the use of AI-powered tools in traditional fields of activity, so future workers can learn to use new tools such as AR, VR and social learning.
• New employer-employee relationships: It is important to develop new types of employment contracts to fit the evolving nature of work. Traditional employer-employee relationships are becoming a series of transactions between employer and employee. Transitions between jobs should
also be facilitated, through measures such as portable health insurance.
• Investments in ICT infrastructure: In addition to investing in people, we can embrace the future by accelerating investments in ICT infrastructure and by ensuring adoption of new technologies by societies. The availability of appropriate ICT infrastructure is a pre-condition for enabling the 4IR. Accelerated investments in 5G infrastructure and ensuring 5G-ready policy frameworks are critical priorities, if we are to reap the benefits of digitalization.
Governments, regulators, industry players, NGOs, academics and decision-making bodies have a critical role to play in shaping our response to the effects of the 4IR. Policy-makers need to develop an environment for using 4IR technologies that fuels the positive outcomes and mitigates the concerns.
Source: Nokia.
3.5 Advocacy Target 5: Digital Financial Services
By 2025, 40% of the world’s adult population should be using digital financial services (DFS)
Digital finance provides an effective way to swiftly connect large populations in many countries, especially where traditional infrastructure is lacking. With DFS technologies, it will be possible to connect the unconnected and bring the excluded into the global financial system. The World Bank has identified various benefits to enhancing DFS around the world12, including:
– Enhanced access to formal financial services;
– Lower costs of digital transaction platforms, as well as cash transactions;
– Additional financial services tailored to individual customer financial needs;
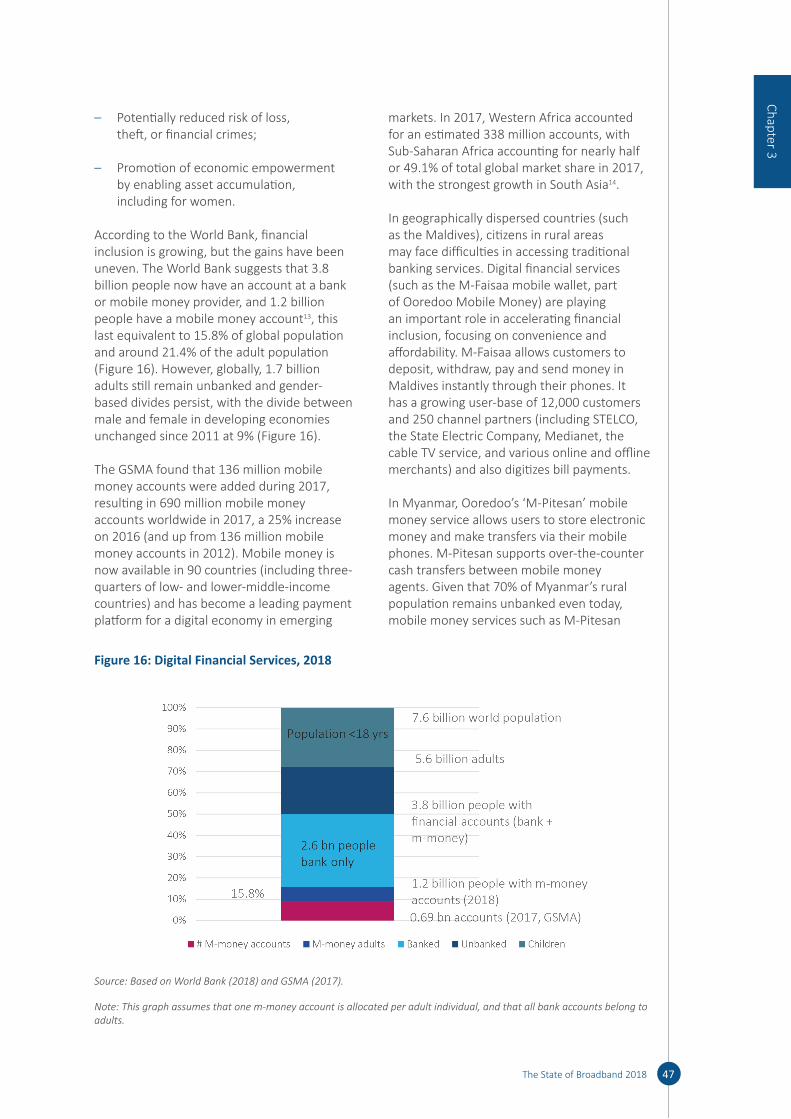
The State of Broadband 2018 47
– Potentially reduced risk of loss, theft, or financial crimes;
– Promotion of economic empowerment by enabling asset accumulation, including for women.
According to the World Bank, financial inclusion is growing, but the gains have been uneven. The World Bank suggests that 3.8 billion people now have an account at a bank or mobile money provider, and 1.2 billion people have a mobile money account13, this last equivalent to 15.8% of global population and around 21.4% of the adult population (Figure 16). However, globally, 1.7 billion adults still remain unbanked and gender-based divides persist, with the divide between male and female in developing economies unchanged since 2011 at 9% (Figure 16).
The GSMA found that 136 million mobile money accounts were added during 2017, resulting in 690 million mobile money accounts worldwide in 2017, a 25% increase on 2016 (and up from 136 million mobile money accounts in 2012). Mobile money is now available in 90 countries (including three-quarters of low- and lower-middle-income countries) and has become a leading payment platform for a digital economy in emerging
markets. In 2017, Western Africa accounted for an estimated 338 million accounts, with Sub-Saharan Africa accounting for nearly half or 49.1% of total global market share in 2017, with the strongest growth in South Asia14.
In geographically dispersed countries (such as the Maldives), citizens in rural areas may face difficulties in accessing traditional banking services. Digital financial services (such as the M-Faisaa mobile wallet, part of Ooredoo Mobile Money) are playing an important role in accelerating financial inclusion, focusing on convenience and affordability. M-Faisaa allows customers to deposit, withdraw, pay and send money in Maldives instantly through their phones. It has a growing user-base of 12,000 customers and 250 channel partners (including STELCO, the State Electric Company, Medianet, the cable TV service, and various online and offline merchants) and also digitizes bill payments.
In Myanmar, Ooredoo’s ‘M-Pitesan’ mobile money service allows users to store electronic money and make transfers via their mobile phones. M-Pitesan supports over-the-counter cash transfers between mobile money agents. Given that 70% of Myanmar’s rural population remains unbanked even today, mobile money services such as M-Pitesan
Chapter 3
Figure 16: Digital Financial Services, 2018
Source: Based on World Bank (2018) and GSMA (2017).
Note: This graph assumes that one m-money account is allocated per adult individual, and that all bank accounts belong to adults.
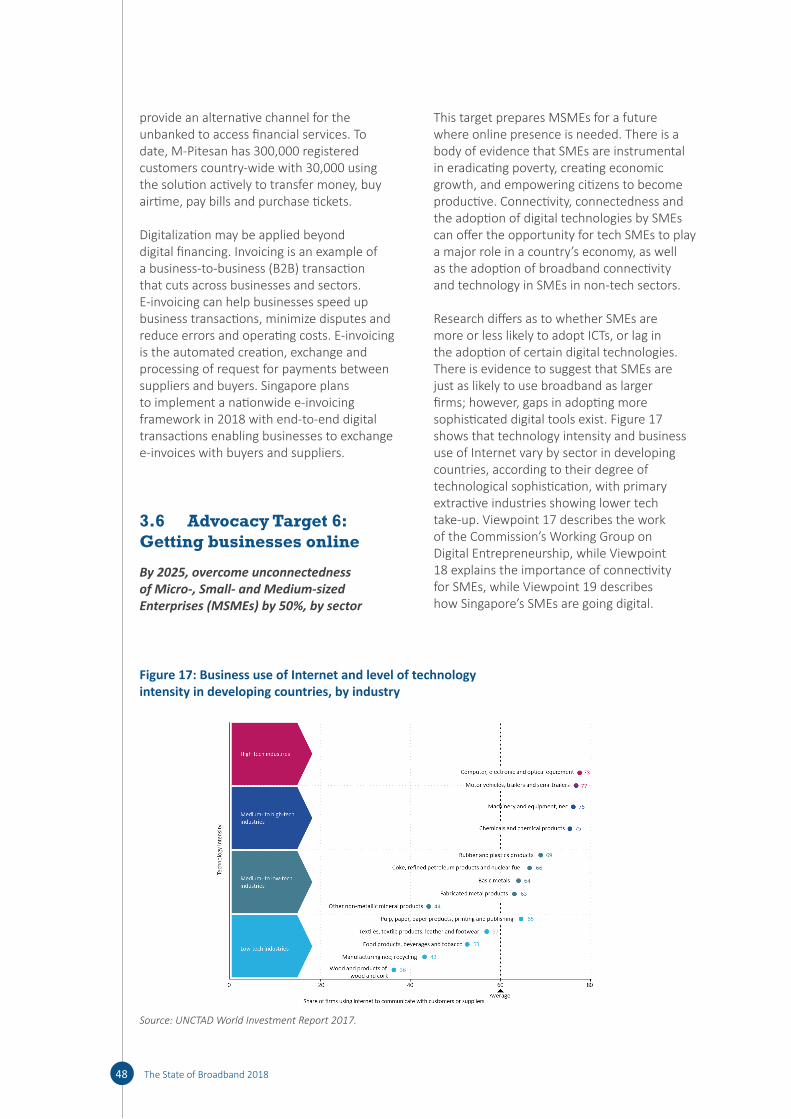
The State of Broadband 201848
provide an alternative channel for the unbanked to access financial services. To date, M-Pitesan has 300,000 registered customers country-wide with 30,000 using the solution actively to transfer money, buy airtime, pay bills and purchase tickets.
Digitalization may be applied beyond digital financing. Invoicing is an example of a business-to-business (B2B) transaction that cuts across businesses and sectors. E-invoicing can help businesses speed up business transactions, minimize disputes and reduce errors and operating costs. E-invoicing is the automated creation, exchange and processing of request for payments between suppliers and buyers. Singapore plans to implement a nationwide e-invoicing framework in 2018 with end-to-end digital transactions enabling businesses to exchange e-invoices with buyers and suppliers.
3.6 Advocacy Target 6: Getting businesses online
By 2025, overcome unconnectedness of Micro-, Small- and Medium-sized Enterprises (MSMEs) by 50%, by sector
This target prepares MSMEs for a future where online presence is needed. There is a body of evidence that SMEs are instrumental in eradicating poverty, creating economic growth, and empowering citizens to become productive. Connectivity, connectedness and the adoption of digital technologies by SMEs can offer the opportunity for tech SMEs to play a major role in a country’s economy, as well as the adoption of broadband connectivity and technology in SMEs in non-tech sectors.
Research differs as to whether SMEs are more or less likely to adopt ICTs, or lag in the adoption of certain digital technologies. There is evidence to suggest that SMEs are just as likely to use broadband as larger firms; however, gaps in adopting more sophisticated digital tools exist. Figure 17 shows that technology intensity and business use of Internet vary by sector in developing countries, according to their degree of technological sophistication, with primary extractive industries showing lower tech take-up. Viewpoint 17 describes the work of the Commission’s Working Group on Digital Entrepreneurship, while Viewpoint 18 explains the importance of connectivity for SMEs, while Viewpoint 19 describes how Singapore’s SMEs are going digital.
Figure 17: Business use of Internet and level of technology intensity in developing countries, by industry
Source: UNCTAD World Investment Report 2017.
The State of Broadband 2018 49
Viewpoint 17: The Importance of Thriving Digital Entrepreneurship
Digital development is not just about technology; it is also about overturning and recreating business models. Start-ups are known for accelerating creative disruption, breaking new ground with new approaches and products. But digitization has given traditional SMEs new ways of doing business – at a distance, with more customers, as well as with lower barriers to entry and lower costs in many sectors.
A thriving landscape of digital entrepreneurship is essential for meeting the 2025 Connectivity Targets:
• Connectivity: new business models and services are needed to drive demand for faster connections, including 5G.
• On skills and gender equality, digital technology allows female entrepreneurs to manage and own a higher proportion of online-only businesses in developing countries.
• MSMEs that use e-commerce and digital tools for their business will help to achieve the connectivity targets, expanding the market for business services aimed at MSMEs.
• Start-ups and MSMEs are among the major users of digital financial services, which encourages their customers towards higher rates of take-up.
Digital entrepreneurship is also needed for making progress on the SDGs. The success of mobile payments in Africa has contributed to financial inclusion across the continent, while the delivery of medicines by drones, pioneered in Africa, makes urgent medical care available to isolated and rural communities. Digital entrepreneurship can stimulate regional integration, with many start-ups looking to grow by developing markets in
neighbouring countries and drawing from international talent pools.
For developing countries in particular, it is essential – and urgent – to promote digital entrepreneurship, to build and scale new businesses based on the technologies of 4IR. To achieve this, however, is a formidable challenge. Despite progress elsewhere, the most active innovation ecosystems and investments are concentrated in Silicon Valley and a few developed countries in East Asia and Europe.
In addition, automatization threatens to remove several rungs of development that would otherwise support the transition to middle- and high-income economies. Automated and additive manufacturing are reducing labour costs and driving some manufacturing tasks back to developed countries. AI may make many outsourced business services obsolete, including call centres and medical services.
The issues of infrastructure and business environment relate to digital entrepreneurship as well. Along with the various obstacles mentioned, digital entrepreneurship faces particular difficulties in developing countries, where:
• investment and access to financing remain low, compared with developed countries;
• small domestic consumer markets limit the growth potential of start-ups and SMEs;
• innovation ecosystems remain underdeveloped, with poor infrastructure and insufficient cooperation between new companies, academia and existing enterprises;
• the talent base remains small. As well as the lack of skilled engineers, entrepreneurs also
Chapter 3
The State of Broadband 201850
lack the business skills to succeed at building digital companies.
In view of these factors, I initiated a Working Group on Digital Entrepreneurship at the UN Broadband Commission. It has produced policy recommendations for all parties involved – governments, businesses, civil society and donor organisations – for digital entrepreneurship to be a priority for developing countries, in the Digital4Entrepreneurship Report with recommendations in 4 main areas:
1) Digital economy success factors (connectivity, skills, regulatory openness, women, ICT);
2) Digital entrepreneurship policy support (e-government, funding, innovation ecosystems);
3) Strengthening e-commerce (online payments, regulatory measures, cross-border parcel delivery);
4) Governance of regional and global digital markets (including development aid assistance).
Source: Andrus Ansip, EC Commissioner and Chair of the Working Group on Digital Entrepreneurship.
Viewpoint 18: The Importance of Connectivity for SMEs
Connectivity to the Internet is a prerequisite for enterprises to conduct e-commerce, but given the penetration of mobile broadband coverage in many urban areas, small enterprises in developing countries often face other priorities to successfully develop their business online. Two key concerns are the suitability of e-commerce as a sales channel and the level of understanding and relevant skills needed for e-commerce. The majority of enterprises in developing countries do not have products which can be sold easily through e-commerce; their products are adapted to the low price of the local market and cannot support additional channel and distribution costs.
Enterprises in developed countries engaged in e-commerce and online competition are principally concerned with generating sufficient online visibility; SMEs in developing countries have more basic concerns relating to setting up operations (such as warehousing and delivery services).
Small enterprises in developing countries raise concerns about cross-border e-commerce, including complying with export requirements, consumer protection regulations, accessing and paying for e-payment solutions and the availability of cost-effective transport options. Four common misconceptions persist among SMEs in developing countries: e-commerce is only for goods, not services; e-commerce is for consumer products (B2C) and not professional or industrial goods (B2B); e-commerce requires mass production; and there are more counterfeits online.
Connectivity alone cannot overcome the hurdles that SMEs in developing countries face. Increased attention needs to be paid to building the capacities of local business managers and policies that promote a vibrant and competitive local service ecosystem.
Source: “New Pathways to E-Commerce: A Global MSME Competitiveness Survey”, ITC, Geneva, 2017.
Viewpoint 19: Singapore’s SMEs Go Digital
SMEs are an important foundation of the economy as they make up 99% of all businesses and 70% of the workforce in Singapore. In helping Singapore’s SMEs thrive in the digital economy, the SMEs Go Digital programme, launched in April 2017, was designed to make going digital simple for SMEs. This programme includes the Industry Digital Plans for SMEs (IDPs), which SMEs can refer to for guidance on the use of digital technologies at different stages of their growth. IDPs will be developed for six sectors – food services, logistics, retail, wholesale trade, environmental services and security.

The State of Broadband 2018 51
Box Figure: Use of Digital Technologies by SMEs
Source: IMDA.
Through the IDPs, SMEs can:
• Use a digital roadmap to understand the digital readiness of their business and the trainings required to raise their employees’ digital skills.
• Identify pre-approved digital solutions relevant to their business. Examples of solutions include digital ordering and payment, fleet management and supply chain optimization.
• Reach out to SME Centres for basic advisory services with regard to the digital roadmap, or be referred to the SME Digital Tech Hub for more specialized advice.
• Participate in digital sector projects led by their industry leaders to pilot emerging solutions with the potential to scale and uplift whole sectors.
• Engage digital project management services to help implement digital solutions to yield maximum sustainable outcomes through business processes re-engineering and job redesign.
Source: Infocomm Media Development Authority of Singa-pore (IMDA).
3.7 Advocacy Target 7: Achieving gender equality in access to broadband by 2025
Historically, the digital gender divide was originally evaluated at 11% between men and women (ITU, 2013), which then actually increased to 11.6% in 2017 (ITU, 201715 and Figure 18). Despite this adverse trend, it is hoped that gender equality in Internet access can be achieved by 2025. The proportion of men using the Internet is higher than the proportion of women using the Internet in around two-thirds of countries worldwide.
According to GSMA, over 1.2 billion women in LMICs do not use mobile Internet. Women are, on average, 26% less likely to use mobile Internet than men. Even among mobile owners, women are 18% less likely than men to use mobile Internet. Beyond cost, barriers to mobile ownership may relate to the local context, including low digital literacy and literacy, and safety and security concerns in Latin America, all of which tend to affect women disproportionately. Women may be generally less aware of mobile Internet compared
Chapter 3

The State of Broadband 201852
with men, which can significantly limit their uptake, particularly in Africa and Asia.
A strong link is observed between gender parity in the enrolment ratio in tertiary education and gender parity in Internet use, as the digital gender divide reflects broader social inequalities16. The only region where a higher percentage of women than men are using the Internet is the Americas, where countries also score highly on gender parity in tertiary education. While the gender gap has narrowed in most regions since 2013, it has widened in Africa. In Africa, the proportion of women using the Internet is 25% lower than the proportion of men using the Internet17. In LDCs, only one
out of seven women is using the Internet compared with one out of five men.
In conjunction with a number of other partners, ITU has launched the EQUALS partnership, a growing global network to bring women and girls to tech, and to bring tech to women and girls (https: / / www .equals .org). Viewpoint 20 describes how mobile can help close the digital and financial inclusion gender gap, while Viewpoint 21 describes the Jazz-Unilever partnership addresses the lack of access by women to DFS in Pakistan by building on Unilever’s network of female retail entrepreneurs, which enables women to act as mobile money agents.
Figure 18: Measuring the Gender Gap in Internet Usage
Source: ITU.
Viewpoint 20: Closing the digital and financial inclusion gender gap
Mobile has the power to transform lives. In my role as Director General of the GSMA, I have seen this first-hand. I have seen how mobile can empower women by making them feel safer, more connected, and more able to access information and take advantage of life’s opportunities. During my recent visit to a health centre in Tanzania, I spoke with expectant mothers, who told me how a mobile service called Wazazi Nipendeni gave them vital health information
during their pregnancies. I also met new mothers, who were registering the birth of their newborn babies using a mobile service from Tigo, giving their children an identity and a future.
It is a disappointment to me that while mobile connectivity is spreading rapidly, it is not spreading equally. Mobile is now the primary way to access the Internet across the developing world. A recent GSMA study revealed the extent of the gender gap in mobile Internet use across low- and middle-income
The State of Broadband 2018 53
countries (LMICs) and highlighted the persistent gender gap in mobile ownership. Over 1.2 billion women in these countries do not use mobile Internet, while women are, on average, 10% less likely than men to own mobile phones and 26% less likely to use mobile Internet. According to the latest findings from the World Bank’s Global Findex database, women in these markets are also, on average, 33% less likely to use a mobile money service. This is important because services such as mobile money can increase women’s financial independence and strengthen their role as financial decision-makers. With 276 live deployments in 90 countries, mobile money can help households to lift themselves out of poverty and drives economic growth.
The mobile gender gap is driven by social, economic and cultural factors, which result in women experiencing barriers to mobile ownership and use. To close the mobile gender gap, we need to address these issues and focus on accessibility, affordability, usability and skills, safety and security, and relevance. In India, Telenor aimed to address many of these barriers with a ‘combo-SIM’ product in an area where 76% of men but only 29% of women used a mobile phone. Telenor launched two paired-SIMs sold together, one to be used by a woman and the other by her husband, and recruited trusted female community members to explain the benefits to women and their families. This product challenged the social norms preventing women from using mobile phones in Uttar Pradesh, showed men the value of women having a SIM of their own, and helped promote digital literacy among women.
It is my vision that the mobile industry should do even more to drive digital and financial inclusion for women. I am a champion of the GSMA Connected Women programme, designed to help the mobile industry reduce the gender gap, and unlock significant commercial and socio-economic
opportunities. Through the Connected Women Commitment Initiative, 36 mobile operators have made 51 formal commitments to reduce gender gaps in their mobile money and/or mobile Internet customer base across Africa, Asia and Latin America. To date, the Connected Women programme and its mobile operator partners have delivered life-enhancing services to over 22 million women.
As mobile and digital technologies proliferate, it is important that the mobile industry, policy-makers and development community continue to take action to address the gender gap through targeted interventions. I see being part of the digital economy as a human right. Addressing the mobile gender gap will ensure we do not leave anyone behind, while contributing to achieving SDG 5, Gender Equality.
Source: Mats Granryd, Director-General of the GSMA.
Viewpoint 21: Collaborating to Achieve Digital Financial Inclusion – An Example from Pakistan
To empower women with low incomes and those living in rural areas, VEON’s subsidiary in Pakistan, Jazz, announced its collaboration with Unilever Pakistan, the non-profit Women’s World Banking, and Karandaaz, a development finance company, to improve the availability and access to financial services. Achieving universal financial access remains a challenge. By going it alone, traditional banks may not cater to the needs of lower income groups or the residents of remote areas, despite the spread of smartphones. According to the World Bank, some 1.7 billion people are still financially excluded, with 30% of adults lacking access in South Asia. In Pakistan, financial exclusion is higher and only 21% of adults have access to financial services.
Operators can build out infrastructure and distribution networks and capabilities (handling high-volume, low-value cash-to-airtime transactions)
Chapter 3

The State of Broadband 201854
to provide low-cost access to digital financial services. Innovative fintech companies are focusing on specific use cases that address specific user needs in various ways – for example, identification solutions to open an account. Pakistan is leading the way in DFS in South Asia, with almost 7% of people having mobile bank accounts, compared to 4% in South Asia. In 2017, Jazz processed 300 million transactions, executed by a total user base of over 14 million (an increase of 8
million users on 2016) and a network of 75,000 agents across Pakistan. Despite this rapid growth, only 7% of women stated that they utilized financial services in Pakistan, compared to an average of 64% in South Asia (World Bank, 2018). Women face a number of barriers with regards to access to DFS, including limited financial autonomy, the lack of phone shops run by females, and the fear of the ‘negative side’ of the Internet that might damage family reputation.
Box Figure: Adults with access to financial services across South Asia (% over 15+)
Source: World Bank.
The Jazz-Unilever partnership aims to address the lack of access for women by building on Unilever’s network of ‘Guddi Baajis’ or female retail entrepreneurs, who sell Unilever products in rural and low-income communities across Pakistan. These women can now act as mobile money agents and make deposits/withdrawals, so all partners benefit: Unilever benefits from increased supply chain digitization and access to credit; women gain access to additional revenue streams and new services; and Jazz increases its footprint in rural areas. The pilot started in Kasur and Sialkot in
2017 and trained 32 female m-banking agents, and ended in June 2018, with training for 500 women per year in the retail agent network. This project aims to help Pakistan make progress in the Commission’s targets 5 and 7 – increased use of DFS and gender equality. By developing a shared vision between Governments, partners and stakeholders, and building on each other’s strengths while respecting each other’s limitations, we can work to ensure a sustainable and prosperous digital future for everyone.
Source: VEON.
55The State of Broadband 2018
1 https: / / www .telegeography .com/ products/ commsupdate/ articles/ 2018/ 02/ 08/ ogero -updates -internet -strategy -targets/ ?utm _source = CommsUpdate & utm _campaign = e3766b06cd -CommsUpdate+08+February+2018 & utm _medium = email & utm _term = 0 _0688983330 -e3766b06cd -11619241
2 https: / / theodi .org/ what -is -data -infrastructure 3 “Data-Driven Development”, ICT4 Development Report 2018, World Bank (forthcoming).4 In Japan, 50% of households already have 100 Mbps and the other remaining 50% at least 30 Mbps, has chosen
not to set additional connectivity goals. Instead, in their broadband strategy, they target the establishment of commercial 5G by 2020.
5 https: / / www .telegeography .com/ products/ commsupdate/ articles/ 2018/ 04/ 30/ zimbabwe -to -merge -regulators/ ?utm _source = CommsUpdate & utm _campaign = 5b088ee7f1 -CommsUpdate+30+April+2018 & utm _medium = email & utm _term = 0 _0688983330 -5b088ee7f1 -11619241
6 https: / / internethealthreport .org/ 2018/ the -internet -is -more -affordable -but -not -enough/ 7 Graph, “large gaps remain across countries for some Internet usages”; % of Internet users performing selected
online activities” (2016), at: www .oecd .org/ sti/ oecd -digital -economy -outlook -2017 -9789264276284 -en .htm 8 “Enabling the Use of ICTs and Broadband: Understanding What Works to Stimulate ICT Adoption”, Working
Group on Demand at: www .broadbandcommission .org/ Documents/ publications/ WorkingGrouponDemand -2016 .pdf
9 UNESCO and UNICEF report “Technologies & the Future of Learning & Education for All”, with support from other UN agencies.
10 The European Centre for the Development of Vocational Training (Cedefop) in “Skills, Qualifications and Jobs in the EU: The Making of a Perfect Match?”, Cedefop, Thessaloniki, 2015.
11 Aghion, Philippe & Howitt, Peter, “Growth & Unemployment”, Review of Economic Studies, 1994, vol.61, issue 3, 477-494.
12 www .worldbank .org/ en/ topic/ financialinclusion/ publication/ digital -financial -inclusion 13 “Financial Inclusion on the Rise, But Gaps Remain, Global Findex Database Shows”, Press Release 2018/130/
DEC, 19 April 2018, www .worldbank .org/ en/ news/ press -release/ 2018/ 04/ 19/ financial -inclusion -on -the -rise -but -gaps -remain -global -findex -database -shows
14 GSMA Industry Report on Mobile Money 2017, available from https: / / www .gsma .com/ mobilefordevelopment/ sotir/
15 ICT Facts and Figures 2017, available at: https: / / www .itu .int/ en/ ITU -D/ Statistics/ Documents/ facts/ ICTFactsFigures2017 .pdf
16 Report of the Broadband Commission Working Group on Gender, available at: www .broadbandcommission .org/ Documents/ publications/ WorkingGroupDigitalGenderDivide -report2017 .pdf
17 ICT Facts and Figures 2017, https: / / www .itu .int/ en/ ITU -D/ Statistics/ Documents/ facts/ ICTFactsFigures2017 .pdf
Endnotes

The State of Broadband 201856
It is clear that mere access to infrastructure is not enough, no matter how high-speed or sophisticated. How broadband applications and services and data are used – and for which purposes – is becoming vitally important for development, and for achieving the SDGs and the promise to “leave no one behind”.
Technologies themselves are usually amoral – technology can be used for good or bad and is given moral purpose, depending on the uses and goals to which it is put. Undoubtedly, there are ethical issues and social dilemmas that can arise with poorly considered uses of these technologies. As Professor Yuval Noah Harari notes in his book, “Homo Deus: A Brief History of Tomorrow”1, technologies and medicine almost always begin by “helping people and saving them from falling below the norm, but the same tools and know-how can then be used to surpass the norm” (Harari, 2017). “Once you achieve a momentous breakthrough, you cannot restrict its use to healing and completely forbid using it for upgrading” (Harari, 2017) and purposes other than those originally foreseen.
It is paramount to capitalize on the positive potential of broadband, ICTs and new technologies, to achieve the most extensive and far-reaching beneficial impact for as many people as possible. Indeed, the moral purpose of technologies is becoming ever more important, given the far-reaching scale and predictive power now made
possible through new and emerging technologies, such as big data and AI.
There is no universally agreed definition of artificial intelligence. “AI” is a term of art that has been used for at least forty years, to apply to any number of processes. Historically, this term has been applied where machines imitate thinking or behavior that people associate with human intelligence (such as learning, speech and problem solving). AI refers to the theory and development of computer systems able to perform tasks that normally require human intelligence (such as visual perception or decision-making), and comprises a rich set of sub-disciplines and methods with different functions, including visual recognition, perception, speech recognition and dialogue, decisions, planning and robotics, among others.
New families of AI algorithms now make it possible to obtain actionable insights automatically and at scale. Accompanying these developments in AI is big data. According to Maaroof (2015), “big data is not just [about] data—no matter how big or different it is considered to be; big data is first and foremost ‘about’ the analytics, the tools and methods that are used to yield insights, the frameworks, standards, stakeholders involved and then, knowledge”2. Big data opens up opportunities towards a potential shift towards information-rich and more informed policy-making.
4 Advanced Technologies for Sustainable Development

As discussed in Section 3.1 on NBPs, the Open Data Institute has suggested that public data should be recognized as an infrastructure asset3. Policies that discuss data infrastructure in the government typically focus on management of data assets (collection, access, reuse, sharing, preservation, security) and data governance (ownership, funding)4 (World Bank, 2018). This implies that data is an asset, much like any other infrastructure asset. Table 4 from the World Bank depicts some of the different types of data collected by different players in the newly emerging data
ecosystem, while Viewpoint 22 by UN Global Pulse explores how big – and better – data and AI can be used for sustainable development.
Viewpoint 22: Better Data for Doing Good – Using Big Data & AI for Sustainable Development
Advances in ICTs are driving global changes in our society – from the way we communicate with each other to the forces that shape our economy and
The State of Broadband 2018 57
Table 4: Different Types of Data
Health
• Medical history
• Prescriptions & Vaccinations
• Fitness tracking
Government
• Identification numbers and identity
• Address
• Civil information (birth, marriage, etc.)
• Legal recordsWeb
• Browsing & searches
• Content (social profiles, posts, photos, etc.)
• Contacts, followers, friends
Mobile phone
• Number and contact network
• Call records
• Location data (GPS)
• Activity and motion dataFinancial
• Accounts
• Transactions
• Debts
• Investments
• Insurance
Other
• Home information
• Travel
• Vehicle information
Source: World Bank.

The State of Broadband 201858
industrial processes. Big data sources and the rapidly-evolving capabilities of AI hold tremendous promise for social impact and are driving transformation across many domains. Location data from mobile phone networks reveal the extent of displacement after a disaster and predict the spread of infectious diseases, while mobile airtime purchases help track food consumption. Roofing materials visible from space serve as a proxy for poverty, changes in debit card usage indicate the impact of a crisis, and postal records have been used to estimate trade flows.
New families of AI algorithms are now making it possible to obtain such insights automatically, and at scale. Beyond Internet business or commercial applications, there are many examples of how big data and AI can be used to advance progress in each SDG. Every project represents a small, but significant innovation in learning about the world around us; taken together, they represent a new approach in our capacity to detect and respond to crises.
Key to achieving sustainable development is the responsible use of data, which presents both genuine opportunities and daunting challenges. Think of the digital ocean of big data as a new natural resource with the potential to accelerate the transformation of societies in ways that create a healthier, more equitable and more sustainable future for everyone. This isn’t just about measuring progress – it’s also about designing development programmes in ways that take advantage of access to real-time, empirical information. Even more exciting is the promise of predictive analytics, making it possible to spot emerging risks to outcomes and take corrective action.
However, this new resource has arguably fallen into the hands of
a largely unregulated extractive industry, creating another digital divide. Too few organizations have the AI tools and expertise needed to turn big data into useful insights for good, and the potential benefits of the data currently do not reach everyone. To date, big data and AI – in domains such as targeted advertising and automation – have resulted in concentrations of wealth. They also have profound implications for privacy.
Many young people now grow up in a big data world in which their information has been collected, sold, and used without their knowledge by thousands of companies. It has become common to hear remarks such as “I have nothing to hide, why should I care about privacy” or “privacy is dead”. We sometimes forget perhaps that big data isn’t just being collected to let companies understand us better. Often, it is to make us desire things we didn’t want before, and to buy them. As it has become evident that these capabilities may even be repurposed to affect political choices within democratic processes, there is renewed public interest in privacy protection, particularly online.
While it is clearly possible to misuse big data and AI, there is also growing recognition of their massive – and largely untapped – potential to do good. More companies recognize in the promise and peril of big data an ethical obligation to act, and are partnering with governments, researchers and communities to advance the field. The mobile industry is undoubtedly leading the way, with other industries catching up. Efforts such as the EU’s General Data Protection Regulation, the UN Guidance Note on Big Data for SDGs: Data Privacy, Data Protection and Ethics, and the IEEE guide for ethical considerations in AI, are paving the way to using new technologies while mitigating potential risks.
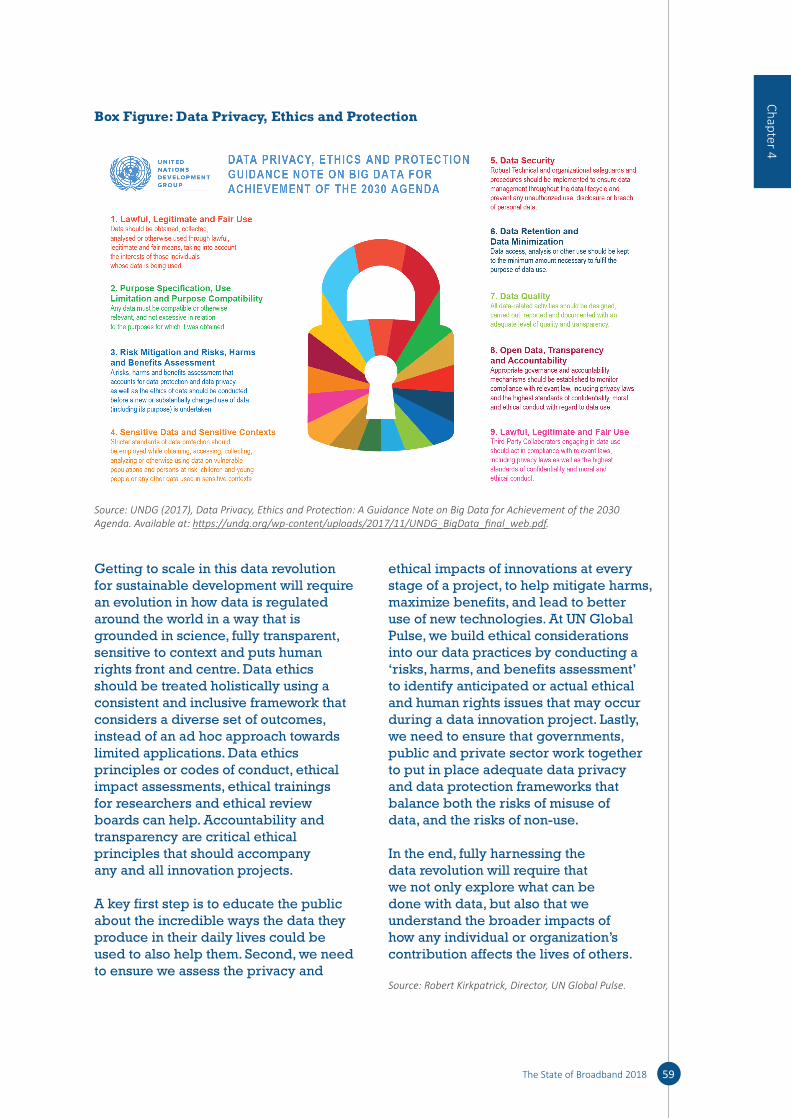
The State of Broadband 2018 59
Box Figure: Data Privacy, Ethics and Protection
Source: UNDG (2017), Data Privacy, Ethics and Protection: A Guidance Note on Big Data for Achievement of the 2030 Agenda. Available at: https: / / undg .org/ wp -content/ uploads/ 2017/ 11/ UNDG _BigData _final _web .pdf.
Getting to scale in this data revolution for sustainable development will require an evolution in how data is regulated around the world in a way that is grounded in science, fully transparent, sensitive to context and puts human rights front and centre. Data ethics should be treated holistically using a consistent and inclusive framework that considers a diverse set of outcomes, instead of an ad hoc approach towards limited applications. Data ethics principles or codes of conduct, ethical impact assessments, ethical trainings for researchers and ethical review boards can help. Accountability and transparency are critical ethical principles that should accompany any and all innovation projects.
A key first step is to educate the public about the incredible ways the data they produce in their daily lives could be used to also help them. Second, we need to ensure we assess the privacy and
ethical impacts of innovations at every stage of a project, to help mitigate harms, maximize benefits, and lead to better use of new technologies. At UN Global Pulse, we build ethical considerations into our data practices by conducting a ‘risks, harms, and benefits assessment’ to identify anticipated or actual ethical and human rights issues that may occur during a data innovation project. Lastly, we need to ensure that governments, public and private sector work together to put in place adequate data privacy and data protection frameworks that balance both the risks of misuse of data, and the risks of non-use.
In the end, fully harnessing the data revolution will require that we not only explore what can be done with data, but also that we understand the broader impacts of how any individual or organization’s contribution affects the lives of others.
Source: Robert Kirkpatrick, Director, UN Global Pulse.
Chapter 4
The State of Broadband 201860
4.1 Digital Technologies for Education
Globalization, new technologies, migration, and environmental and political challenges are transforming labour markets and creating demand for new skills and knowledge for work, citizenship and managing personal lives. Digital skills are fast becoming vital, in addition to basic literacy and numeracy. Digital skills can themselves be further broken down into three categories – the basic digital literacy needed for all workers, consumers and citizens in a digital society; the advanced ICT skills (coding, computer science and engineering) which are needed to develop innovative ICT products and services; and e-business skills or the specific know-how needed for digital entrepreneurship5. According to GSMA, 29% of global mobile users use their phones to access information to support their education, or that of the children or relatives.
The report, “Technologies & the future of learning and Education for All” (UNICEF & UNESCO, 20186) identifies various core functions enabled by new digital technologies, including: enhancing the role of teachers as facilitators; delivering engaging quality content; enabling learners to acquire new skills; assessment and certification; efficient delivery; improved administration; and effective learning. Viewpoint 23 describes the opportunities provided by digital technologies for enhanced learning and education. Indeed, digital technologies are most effective when they support teachers and accompany students in their learning processes. Online learning resources (such as language and translation platforms, for example) can help supplement and reinforce learning, as well as digital tutors, learning and language academies, curricular playlists and intelligent virtual reality. Digital technologies can and are being used to support in different needs individual students, classes, teachers and learning establishments (primary, secondary and higher education), as well as students with specific learning difficulties.
Viewpoint 23: The Opportunities Provided by Digital Technologies for Learning & Education
New technologies such as cloud computing, blockchain, big data analytics, gaming, robotics, 3D printing, machine learning, VR, AR and AI, all have significant relevance to the future of education. Technology-enabled trends and new capabilities (including the increase of remote interactions, mobility and portability and the rise of the personal cloud) will require, and enable, different pedagogies, curriculum and institutional arrangements.
These technologies can be used across all aspects of education and learning, but at their heart is the potential to deliver anything, anywhere, to anyone, in any format, at any time. Seven dimensions of educational transformation through innovative technologies are particularly important:
• Enhancing the evolving role of teachers as facilitators: technology is effective only when it supplements and supports teachers, rather than replacing them. However, the style and role of teaching will clearly need to change to take advantage of new technologies.
• Delivery of content: Numerous platforms now deliver a wealth of interactive content relevant to users’ needs and the changing demands of curricula.
• Enabling learners to gain new and personalized skills: new technologies can be used to encourage learners to develop critical thinking, creative and collaborative skills.
• Assessment and certification: ICTs provide accurate, reliable, replicative and swift means of assessing and certifying pupils’ and learners’ work in many cases.

The State of Broadband 2018 61
• Efficiency of delivery: existing software can perform and collate repetitive grading and evaluation, releasing teachers to other duties that computers or machines cannot undertake.
• Administration, management and data: the collection, dissemination and analysis of data can potentially reduce the administrative burden within education systems and help monitoring.
• Inclusive learning: ICTs can benefit the learning potential of marginalized people or those with special learning needs, including disabilities and isolated communities.
The overall effect of new technologies on employment levels remains to be seen. While technologies are likely to lead to a reduction in routine jobs, digitalization can also lead to the creation of new jobs, with a positive effect on economies. Four main elements are often identified as essential for learners to participate in the workplace of the future: ensuring digital literacy for all; teaching computer programming & coding; facilitating the development of digital skills; fostering soft skills. People need to become more flexible and adaptive to fast-changing labour markets. Work-based and online learning can be harnessed to improve learning opportunities and reinforce learning achievements.
To ensure technologies are used effectively and appropriately in learning, five enablers are important:
• The main focus should be on learning outcomes, rather than assumed benefits of news ICTs.
• Teachers need to be empowered, rather than disenfranchised.
• Integrated cross-government approaches should be in place to deliver technology-
enhanced learning, involving all relevant Ministries.
• Such initiatives should be designed to be inclusive, so marginalized groups and communities, especially people with disabilities, refugees and/or those out of school or living in isolated communities, are able to access appropriate learning opportunities.
• Governments must be willing to ensure that sufficient funding is available for such initiatives to be delivered at scale and sustainably, and to ensure funding reaches desired target groups.
There are clearly challenges in using new technologies effectively and appropriately to enhance learning outcomes and equip the workforce for the changing needs of future labour markets, but education plays a fundamental role in empowering and inspiring individuals to take advantage of opportunities to enrich their lives, as well as the lives of others, in the world around them.
Source: UNESCO and UNICEF report, “Technologies & the Future of Learning & Education for All”, with support from other UN agencies.
For example, according to some estimates, some 10% of the population at any time may have dyslexia, a neurological learning disability that affects reading and writing but does not affect general intelligence. Children with dyslexia can learn coping strategies to deal with its negative effects. Unfortunately, in many cases, dyslexia may be detected too late for effective intervention. Change Dyslexia is a Spanish project that uses AI cutting-edge scientifically based computer games, such as Dytective Test and DytectiveU, to screen and support dyslexic children at largescale7.
“Indonesia Belajar” (Indonesia’s Learning) is a digital education programme focusing on increasing digital literacy in Indonesia. It uses technology to make education more accessible for children across the country. In 2017, five major Indonesia Belajar programs
Chapter 4
The State of Broadband 201862
were launched which have supported some 2,500 teachers and 50,000 students to date. These programs leverage VR and AR to educate communities about digital literacy and improve community learning, with long-term benefits for remote areas across Indonesia. Viewpoint 24 describes the use of digital technologies for education in Africa
Viewpoint 24: Digital Technologies for Education in Africa
African countries are embracing ICT, broadband and digital education in national development, and are building ICT infrastructure in educational institutions to enhance digital learning. Schools and tertiary institutions are connecting to the Internet, enabling teachers and students to access online educational materials and the latest publications, broaden their knowledge and learn what is happening globally, as well as enable them to use social media to connect with other students.
A study by UNESCO reveals that digital literacy is two-way – both instructors and learners need to be digitally literate. Digital education is rewarding to students as they increase their knowledge through ‘presentations, demonstrations, drilling, practice, interaction and collaboration’. The report further states that ‘over 87% of students learn best through visual and tactile modalities’8. Several initiatives are ongoing in Africa towards development of digital materials, such as the Open Educational Resources (OERs) project and Teacher Education for Sub-Saharan Africa (TESSA), which are popular with students.
Other challenges to digital education in Africa cited by the World Bank include:
• The absence of comprehensive policies to enable and support interventions, supported by clearly defined and resourced strategies for implementation at both the national level as level of educational institutions;
• Lack of financing and prioritization of ICT investments;
• Limited infrastructure of the kind required to support the use of ICT in education;
• Lack of capacity at all levels to integrate and support the use of ICT in education effectively;
• Lack of necessary ICT skills among teachers, and specific training;
• Lack of appropriate content;
• Lack of accurate, comprehensive, up-to-date data on education;
• The tendency of ICT to accentuate social, cultural and economic disparities.
It is believed that ICT can empower teachers and learners, promote change, and foster the development of 21st century skills, but data to support these perceived benefits from ICT are limited and evidence of effective impact remains elusive.
By creating enabling policy environments, countries are addressing ICT in the education sector as well as helping to promote and drive the national ICT agenda, including bandwidth and connectivity. In Kenya, the Government is integrating ICTs into education to enhance teaching and learning. There is a laptop project for primary school pupils, while higher education institutions are developing and implementing e-Learning policies9. Students are encouraged to own smartphones and/or tablets or laptops for easy access of educational materials. In Kenyatta University, for instance, there are several free computer laboratories with Internet access, as well as Internet hotspots. Distance learning students are issued with a tablet pre-loaded with learning materials for the semester. Over half of all students own a laptop, smartphone or another digital gadgets.
The State of Broadband 2018 63
In Ghana, teachers have been trained to change their attitudes towards digital education. The Ghana Reads Program aims to provide more ‘interactive teaching methods, breaking the traditional instructor/student hierarchy’10. Teaching coaches are assigned two schools each and work with teachers to help them in planning lessons and recording videos of teachers delivering lessons.
In South Africa, embracing digital technology is seen as a means to transforming the economy. Despite there being many e-Education initiatives, however, few have been able to pave the way for the larger-scale uptake of e-Education, which may be partly due to insufficient budgets, lack of human readiness, or inadequate technology deployment. Programmes must address the different pillars of infrastructure, technology, the human factor, and policy and funding.
African countries can focus on the rural and remote areas to build digital villages or establish Internet hotspots where students and other digital literate people can have easy access to the Internet, as well as developing inclusive policies for digital education.
Source: Dr. Speranza Ndege, Kenyatta University.
4.2 Digital Technologies for Health
Digital technologies can be used for a range of purposes to promote positive health outcomes and to support health systems to cope with their growing disease and cost burdens11. Mobile-based products in health insurance and remittances can help expand coverage while reducing waste and inefficiencies in health system financing. They can enable organizations and health managers to collect data on dashboards, providing real-time evidence for decision-making. New technologies such as 5G and AI can provide new applications for the e-health applications (remote surgery, remote diagnostics etc.).
According to GSMA, 26% of global mobile users access services that help them to improve or monitor their health and/or the health of their family on a mobile phone.
The sources and quantities of health data from mobile devices, Internet searches and wearables are growing. Growth in computing power and predictive analytics is enabling the study and use of vast amounts of information that reveal patterns, trends and associations, thanks in part to big data. For example, mobile data records and big data have been used to track the migration of people with Ebola in Sierra Leone, the spread of dengue fever in Pakistan12 and cholera in Haiti. With regards to AI, IBM has outfitted Watson, its “cognitive computing” platform, to tackle multiple challenges in healthcare13.
Governments, health authorities and other stakeholders are moving to capitalize on these advantages. For example, the number of mHealth products and services has doubled in the past five years in LMICs14, and there are now over 165,000 mobile applications for health services15. Fifty-nine percent of patients in the LMICs are using mHealth applications and services versus 35% in high-income countries16. Globally, 44% of mobile users have seen a medical professional using a mobile device during diagnosis or treatment17, and 86% of clinicians believe that health applications can facilitate diagnosis18. There is clearly a need to meet growing demand through digital health solutions. Viewpoint 25 explores the impact of digital health on Non-Communicable Diseases (NCDs) for Universal Health Coverage (UHC). Viewpoint 26 explores mobile’s role in driving behavioural change for underserved communities, while Viewpoint 27 explores the work of the Carlos Slim Foundation in Mexico.
Viewpoint 25: Promoting Digital Financial Inclusion
Tackling NCDs is essential to accelerating progress towards Universal Health Coverage (UHC) as more than 75% of Non-Communicable Disease (NCD) deaths (around 31 million) occur in LMICs. This situation is coupled to an ageing population worldwide and
Chapter 4
The State of Broadband 201864
shortages of health workers. Integrated primary health care is fundamental to address the needs of patients with NCDs but health systems in many LMICs are currently ill-equipped to face the rising burden of those chronic diseases. Digital health can become a game changer to revolutionize the way healthcare is delivered, strengthen primary health care and expand UHC, if (and only if) it helps to tackle the growing NCD epidemic. Although advocacy and attention has risen on NCDs, little awareness seems to prevail in many circles on the potential impact digital health could have on addressing this growing crisis.
Digital technologies can, for example:
• Increase quality of care by centralizing expertise to coach less skilled health workers with digital technologies;
• Optimize NCD screening and diagnosis opportunities by including and educating non-traditional health players and linking them to the health system through digital technologies;
• Accelerate health seeking behavior for (often asymptomatic) chronic conditions by raising awareness in the general population, on symptoms and signs, and the advantages of early diagnosis and treatment;
• Use real-time data for more efficient health planning, resource allocation, public health surveillance and research;
• Enable and accelerate the scale-up of prevention strategies;
• Improve supply chain management of critical health supplies and treatments;
• Offer digital continuous medical education to healthcare workers at different levels;
• Empower patients to take more responsibility in the management of their own health;
• Assure coordinated care pathways for chronic patients, across all levels of their healthcare including across multiple medical specialties;
• Provide opportunities for financing and reimbursement mechanisms to cover for chronic care.
In 2017, the Working Group published the report “Digital Health: A Call for Government Leadership and Cooperation between ICT and Health”, which mapped the status of digital health and advocated for governments to take action on national digital health strategies to enable realizing the full potential of digital health. The Broadband Commission Working Group on Digital Health, chaired by the Novartis Foundation and Intel, will publish a new report in September 2018 on leveraging digital technology to strengthen Primary Health Care capacity to address policy and the needs of NCD patients in order to accelerate the achievement of UHC.
The report examines the promise of digital health for NCDs and UHC in LMICs. It presents the findings of scientific studies with examples, where impact of digital health has been demonstrated on a patient, provider and system-level, with examples of digital health solutions. Digital health services must be fully integrated into the existing health system, and scaled for enhanced customer access and financial sustainability for long-term provision. Strategy, leadership and governance of coordinated actions are essential to ensure an aligned vision, goals and roadmap for digital health. Clear and consistent regulatory frameworks are needed to ensure safety and build trust for digital health solutions.
ICT infrastructure and common platforms must be accessible and interoperable
The State of Broadband 2018 65
to ensure connectivity of digital health stakeholders and prevent fragmentation. Partnerships with stakeholders from public, private and non-profit sectors can help ensure delivery of digital health solutions with maximum social impact. Financing and business models are needed which focus on revenue streams and cost containment measures for the infrastructure and provisioning of digital health services.
Source: Novartis Foundation.
Viewpoint 26: Mobile’s role in driving behavioural change for underserved communities
With 75% of global mobile subscribers located in LMICs and regional penetration rates forecasted to range from 50% in Sub-Saharan Africa by 202019, mobile is uniquely positioned to distribute educational information to underserved communities that otherwise lack access to essential information, enabling them to make better and informed decisions. At the same time, Mobile Network Operators (MNOs) can increase their relevance in the market by providing such services. In particular, MNOs derive value from offering mobile health (mHealth) information services through indirect benefits of improved customer loyalty and brand perception as well as a growing customer base. Additionally, providing an mHealth service that can be leveraged by governments and other organisations is an emerging opportunity for MNOs and health tech providers that could then lead to business-to-government or business-to-business revenues.
Since 2013, the GSMA mHealth programme, funded by DFID, has been working with MNOs and mobile and health stakeholders to support the launch and scale of mHealth services in GSMA mNutrition Initiative. As of May 2018, these mHealth services have delivered lifesaving maternal and newborn child health and nutrition information to almost two million families
across eight Sub-Saharan African countries: Malawi, Ghana, Tanzania, Kenya, Nigeria, Zambia, Uganda and Mozambique. The GSMA and its partners adopted a human-centred design and iterative product optimisation approach across all eight markets. The key findings from the implementation of the GSMA mNutrition Initiative were:
• Mobile is bridging the gap in access to life-saving information. For one in three mHealth service users, these services are the only source of nutrition information available.
• mHealth service users are improving their nutrition knowledge. Knowledge levels on the appropriate use of supplements were improved by 16 percentage points among users, in comparison to non-users. Similarly, knowledge on appropriate breastfeeding practices was improved by 11 percentage points among users compared to non-users.
• Mobile information services drive behaviour change. Across 8 implementing countries, 69% of users demonstrated appropriate nutrition behaviours in comparison to 56% of non-users.
• Mobile information services have a strong impact with new or poorly understood concepts. In Kenya, only 5% of non-users could correctly recall appropriate supplementation practices in comparison to 41% of mHealth service users.
• Mobile information services improve knowledge, even when existing knowledge around certain nutrition topics is already reasonably high. In Uganda, 90% of non-users correctly recalled breastfeeding should be initiated within one hour of birth. mHealth service users still demonstrated a seven percentage point improvement
Chapter 4

The State of Broadband 201866
on this, with an average of 97% of them correctly recalling this practice.
• Repetition and reminders of key health practices reinforces the behaviour. In Uganda, providing four messages on exclusive breastfeeding as opposed to just two, over a four-week period, increased adherence to this practice by eight percentage points. In Tanzania, 78% of users who recall receiving clinic appointment reminders declared that they went to the clinic in response to receiving the reminder.
• Positive user experience results in widespread sharing of information. 43% of users report sharing information from these services with at least four other people.
Although the proportion of the Sub-Saharan African population that is undernourished has decreased from 33% between 1990-1992 to 23% between 2014-2016, much progress still needs to be made to eradicate hunger. The findings from GSMA’s mHealth programme suggest that mobile technology accelerates progress towards SDG 2 (Zero Hunger) and SDG 3 (Good Health & Well-Being).
Source: GSMA.
Viewpoint 27: Accelerating the Implementation of Digital Health as a Public Policy in Mexico
With 111.7 million subscribers to mobile phones and 80.2% of them using a smartphone, 79.1 million users of Internet and 76.9 million of subscriptions to mobile bandwidths in a country with 119 million people, Mexico has rapidly adopted mobile technologies into their daily lives. Digital Health will play a catalytic role in modifying the current paradigm of healthcare by strengthening health interventions that target the basis of the pyramid, thus democratizing effective access to health services. In addition,
Digital Health will empower citizens to demand quality care services, and will transform the way health professionals, the health systems and patients interact.
Since 2007, the Fundación Carlos Slim (FCS) has devoted its work to structuring health models that strengthen primary care and support a reengineering process in prevention and disease management in two dimensions: enabling personalized public health with precision profiling, and its implementation throughout the care continuum. In particular, FCS has worked in the design, development and scale of models around non-communicable diseases (NCDs), maternal and child health and vaccination. By convening a strategic partnership with Mexico’s Ministry of Health, these models have become a public policy with a national scale, securing sustainability:
• CASALUD is an innovative model that strives to reengineer primary healthcare services, centering its model on proactive prevention and systematic risk assessment of NCDs through MIDOTM, a strategy that enables precision profiling through a series of algorithms. In addition, health professionals can perform systematic risk and disease management with SICTM. CASALUD currently operates in 12,000+ primary care clinics in the 32 states of Mexico, and is now seeking its expansion in other LMICs.
• AMANECE assures the continuum of care from the pre-conception at the community, to systematic risk assessment during prenatal care at the primary care clinic and the hospital, to obstetric care and monitoring of high-risk pregnancies, and is implemented in networks of care that connect the community with primary care clinics and the hospital. AMANECE today operates in 100+ municipalities with the greatest risk of maternal mortality, reaching 100,000+ pregnant women.
The State of Broadband 2018 67
• SIIVac strengthens the immunization program with the implementation of the Electronic Vaccination Schedule, enabling health professionals to register the application of vaccines in children and adults, creating a nominal registry, alongside the monitoring of cold chain and supply chain. It is implemented both at the clinic and at the community. SIIVac today operates in 20 states, and will reach 2.5 million children by December 2018.
These three models incorporate effective management strategies to discuss best practices, monitor the operation of these solutions and assess their performance. Finally, health professionals, stakeholders and citizens can analyze the performance of these clinics, and thus enable accountable care through online integrated dashboards.
Source: Fundación Carlos Slim, Mexico.
4.3 Digital Technologies for the Environment
The evidence is mounting to suggest that considerable challenges are emerging with respect to our natural environment. The most common environmental threats are loss and degradation of natural habitat, but unsustainable exploitation, invasive species and pollution are also proving major threats20. Digital and sensor technologies offer opportunities to monitor the environment and wildlife populations accurately.
Big data analysis can be used to help update old-fashioned reporting of animal populations. For example, WWF and the Zoological Society of London (ZSL) have developed the Living Planet Index (LPI) and Database as a measure of the state of global biological diversity based on population trends of vertebrate species from around the world, with time-series data for over 19,500 populations of more than 4,000 mammal, bird, fish, reptile and amphibian species.
ICTs and sensor technologies can play a big role and offer huge potential for game-changing solutions. With big data and technologies, the time for companies and governments underplaying deforestation, wildlife trade, poaching or illegal fishing is over. AI can be used to help boost protection and resilience of natural systems.
Remote sensing plays an important role in planning, monitoring, and evaluating WWF’s work on the ground and has enabled WWF to monitor the developments of extractive industries in socially and ecologically-sensitive areas, including World Heritage sites. The Natural Capital Project uses remote-sensing-based natural capital assessment to guide jurisdictional development planning, mapping supply risk for corporate sourcing decision, and helping conservation organizations target investments in forest restoration.
ICTs can be used extensively to observe, monitor, track and protect our terrestrial wildlife from poachers as well as other destructive activities. WWF is working with governments and enforcement agencies to explore, fund, and test a wide range of technologies becoming available for wildlife conservation – from drones and wildlife tracking to radar, thermal cameras and gunshot detectors. WWF has found that unmanned aerial vehicles or UAVs function best as ‘reactionary eyes’ in the sky. WWF is testing civilian-grade UAVs for conservation applications with plans to rigorously test the technology in protected areas in Malawi, Namibia and Zimbabwe.
Thermal imaging cameras have been used by anti-poaching teams in Lake Nakuru National Park and in the Maasai Mara Game Reserve to increase the chances of catching poachers hunting antelope and rhinos by over 60%. Anti-poaching teams have also been able to achieve all this with smaller numbers of patrol teams. Wildlife management using tracking collars can also help conservation efforts – for elephants and lions in Kenya.
However, the use of these new technologies is open to question – they can be used to protect the environment, as well as to enable humankind to exploit natural
Chapter 4

The State of Broadband 201868
resources more effectively. For example, the same tracking technologies can be used to monitor natural populations of tunafish in the oceans or lions on land, or they can be used to hunt the same animals or to stimulate and attract public interest21.
Big data can help generate and analyze a greater number of on-the-ground observations. For example, the University of Minnesota’s Lion Project has deployed 225 camera traps across 1,125 square kilometers in the Serengeti National Park in Tanzania to evaluate spatial and temporal dynamics since 2010 to produce 1.2 million sets of pictures by
2013. Members of the general public classified the images via a citizen-science website22. The project applies an algorithm to aggregate the classifications to investigate multi-species dynamics in an intact ecosystem23.
With regards to marine life, the Republic of Indonesia has partnered with Global Fishing Watch (a partnership between Google, Oceana and SkyTruth) to deliver Vessel Monitoring System (VMS) data for Indonesian flagged fishing vessels in a publicly-available platform. The project aims to promote transparency in the fishing industry24 as to which ocean areas are fished and for which species of fish.

69The State of Broadband 2018
1 Harari, Y.N., 2016. Homo Deus: A brief history of tomorrow. Random House.2 “Big Data and the 2030 Agenda for Sustainable Development”, Dr. A Maaroof (2015), available at: www
.unescap .org/ sites/ default/ files/ Final %20Draft _ %20stock -taking %20report _For %20Comment _301115 .pdf 3 https: / / theodi .org/ what -is -data -infrastructure 4 “Data-Driven Development”, ICT4 Development Report 2018, World Bank (forthcoming).5 The European Centre for the Development of Vocational Training (Cedefop) in “Skills, Qualifications and Jobs in
the EU: The Making of a Perfect Match?” (Cedefop, Thessaloniki, 2015).6 HLCP Discussion Paper, “Technologies and the Future of Learning & Education for All”, prepared under the
leadership of UNICEF and UNESCO, with support from other UN agencies.7 https: / / www .changedyslexia .org/ 8 https: / / learningportal .iiep .unesco .org/ en/ issue -briefs/ improve -learning/ curriculum -and -materials/ information
-and -communication -technology -ict 9 https: / / www .kenet .or .ke/ blog/ admin/ digital -learning -africa 10 https: / / educationinnovations .org/ program/ ghana -reads 11 “Digital Health: A Call for Government Leadership and Cooperation between ICT and Health”, Report of
the Working Group on Health, February 2017, available at: www .broadbandcommission .org/ Documents/ publications/ WorkingGroupHealthReport -2017 .pdf
12 Wesolowski, A., Qureshi, T., Boni, M.F., Sundsøy, P.R., Johansson, M.A., Rasheed, S.B., Engø-Monsen, K. and Buckee, C.O., 2015. Impact of human mobility on the emergence of dengue epidemics in Pakistan. Proceedings of the National Academy of Sciences, 112(38), pp.11887-11892.
13 https: / / www .ibm .com/ watson/ health/ 14 GSMA, “The Mobile Economy 2015”, available from www .gsma .com/ mobileeconomy/ archive/ GSMA _ME _2015
.pdf 15 IMS Institute for Healthcare Informatics, “Patient Adoption of mHealth: Use, Evidence and Remaining Barriers
to Mainstream Acceptance, 2015”, available at: www .imshealth .com/ files/ web/ IMSH %20Institute/ Reports/ Patient %20Adoption %20of %20mHealth/ IIHI _Patient _Adoption _of _mHealth .pdf
16 PriceWaterhouseCoopers, “Emerging mHealth: Paths for growth 2012”, available from https: / / www .pwc .com/ gx/ en/ healthcare/ mhealth/ assets/ pwc -emerging -mhealth -full .pdf
17 Mobile Ecosystem Forum, “Global mHealth & Wearables Report 2015”, available at: http: / / mobileecosystemforum .com/ initiatives/ analytics/ mef -global -mhealth -and -wearables -report -2015/
18 PriceWaterhouseCoopers, “Top Health Industry Issues of 2015”, available from http: / / www .pwc .com/ us/ en/ health -industries/ top -health -industry -issues/ assets/ pwc -hri -top -healthcare -issues -2015 .pdf
19 The Mobile Economy 2017, GSMAi20 WWF’s Living Planet Report 2016, available at: wwf .panda .org/ about _our _earth/ all _publications/ lpr _2016/ 21 Consider the international outcry surrounding the killing of Cecil the lion in Zimbabwe, the famous lion tagged
and tracked by an Oxford University study.22 www .snapshotserengeti .org23 Snapshot Serengeti, high-frequency annotated camera trap images of 40 mammalian species in an African
savanna, available at: https: / / www .nature .com/ articles/ sdata20152624 http: / / globalfishinwatch .org/
Endnotes

The State of Broadband 201870
Every year, the Commission makes a number of policy recommendations aimed at improving broadband networks and services. This year, based on the analysis in this report, the Commission presents eight recommendations:
5.1 Build National Leadership for Broadband
A strong commitment to broadband as a cross-cutting technology that can trigger development transformation is needed at the highest level. A high-level champion in the government can help ensure that broadband can receive the necessary political support and resources. It is essential to find the right combination of complementary technologies to bridge the digital divide. This implies technology-neutral digital strategies and national broadband plans covering the mix of technologies that can be used to bridge the digital divide.
5.2 Promote Training and Measures to Stimulate Demand
Broadband connectivity alone — without sufficient consumer and business demand — is not sufficient, and programmes and
measures are needed to address the demand. Successful broadband and ICT plans must include a variety of demand-side programmes, especially in the initial stages of deployment, to generate public interest and boost investment. Viewpoint 28 explores a range of demand programmes for improving broadband adoption.
Viewpoint 28: Demand Programmes for Broadband Adoption
An array of demand-side programs can be considered for inclusion in national plans, with the final choices dependent on local and regional needs, including demand side programs that facilitate:
• Low-interest financing and/or subsidies to support ICT and broadband purchases;
• Affordable computer and broadband programs for low income families, students etc.
• Tax reductions on ICT devices and broadband;
• Effective usage of Universal Service Funds (USFs) for broadband demand programs;
• Loans to build broadband networks in rural and remote areas;
5 Recommendations for Boosting Broadband
• ICT skill development and digital literacy programs;
• E-commerce to increase broadband adoption by businesses;
• E-learning programs targeting underserved groups (elderly, disabled, etc.); and
• ICT infrastructure and broadband access in all schools.
A combination of these and other demand-side programmes can be used to raise awareness of broadband, make broadband services more affordable, and expand networks and services to the widest population as quickly as possible. The Commission’s Working Group on Demand developed the report “Enabling the Use of ICTs and Broadband: Understanding What Works to Stimulate ICT Adoption”, describing successful demand creation programmes.
Source: Intel.
5.3 Benchmark and Monitor ICT Developments
Limited data on the ICT sector can restrict the scope for evidence-based policy-making. National accounts data on the ICT sector may
be published at an aggregate level, making it difficult to meaningfully gauge development of the broadband sector and identify weaknesses. National statistics systems, benchmarking and analysis generally need to be improved to understand and interpret the dynamics of broadband diffusion across the economy. Better understanding of network deployment and use can help inform policy and advance progress towards universal service.
5.4 Review Universal Service Measures, including RoW regulations
Benchmarking exercises of universal service measures can help define and identify rural, remote, and low-population density communities that need broadband coverage and that cannot be served by terrestrial media, in the national context. This urgent need to serve rural populations should be reflected in government policies and regulations. This can include reforms to Rights of Way (RoW) regulations. Viewpoint 29 considers some reforms to further improve connectivity in connected areas.
Viewpoint 29: Addressing the Digital Divide in Already Connected Areas
Eliminating the digital divide in developing and less developing
The State of Broadband 2018 71
The State of Broadband 201872
countries, landlocked nations, island nations, and for people in remote and rural areas attracts major attention and billions of dollars in public funding. However, the digital divide, including the gap of bandwidth demand and supply in connected areas, is more serious than expected, partly due to less competition in broadband services, high construction cost led by insufficient public infrastructure-sharing and ‘last-mile’ monopolization by the incumbent or property management agencies.
In some developing countries, public and private Rights of Way (ROW) acquisition is a key issue and major cost for operators which want to deploy or upgrade their broadband infrastructure, as it involves multiple authorities, complicated procedures and diverse fees (e.g. administration fees, usage fees, environmental restoration fees). Further, some provincial and/or municipal governments regard ROW acquisition expenditure as an important source of income, which can make ROW charge less transparent and inconsistent within a country.
Construction cost is another issue that makes infrastructure investment less attractive to telcos. It is estimated that up to 70% of broadband investment will be spent on RoW expenditure, site acquisition and civil engineering. Infrastructure-sharing of municipal underground ducts or electricity poles can enable telcos to accelerate broadband deployments. For example, in Thailand, aerial fibre deployed on the electricity poles has saved 80% of construction costs and 40% of deployment time over recent years. Regulatory policies to move transmission lines from electricity poles to underground ducts can slow down infrastructure deployments and increase deployment costs.
Further, some property management agencies either play as network retailers, subscribing lease lines from telcos and reselling them to residents,
or signing exclusive service contracts with telcos. Such behaviors may prevent residents from receiving better quality of broadband services or choosing among service providers. Government policies and regulatory measures are needed to remove last-mile monopolization, so operators can fairly and easily access or deploy fibre to each apartment.
Regulators have obligations to remove the obstacles to broadband development to ensure available, affordable and superior broadband services in served or unserved areas. Governments should aim to provide adequate regulatory policies to attract private sector investment in broadband infrastructure. Governments at all levels could simplify ROW application and streamline approval procedure to accelerate the delivery of broadband services, and coordinate with investors on property acquisition, ground clearance and compensation to facilitate the construction of broadband infrastructure. As a result, operators could be entitled to access public ROW at low or no cost.
Secondly, countries can consider infrastructure-sharing and joint construction policies. Cross-ministerial collaboration to specify the common use of public infrastructure should promote the sharing of existing poles and ducts. Existing public traffic facilities, electricity ducts, poles, water supply and drainage pipelines should have obligations to open up to all operators for fibre deployments. A visible infrastructure database should be set up, including timely updates on transportation, electricity and water pipeline position, capacity and occupation. The lease price of municipal and utility infrastructure can also be regulated with a view to minimizing broadband service delivery costs.
Finally, regulations on in-building infrastructure sharing and fibre pre-deployments from home can be enforced. New constructed and refurbished buildings can be laid

The State of Broadband 2018 73
with optical cables and open to all operators. Construction codes and technical standards and specifications for the design and deployment of in-building optical cables could be put in place. The exclusive access agreement between property management agencies and service providers should be prohibited to avoid the monopolization of in-building facilities.
It is widely said that broadband infrastructure is as critical to socio-economic prosperity as transport, water and power. If broadband networks really are a strategic infrastructure to promote the digital economy, government should provide an enabling regulatory environment to foster the development of broadband infrastructure, rather than regard network providers as cash-cows and seek to impose charges. We need to reexamine the issue of the digital divide, not only in terms of digital equality, but also by addressing gaps in bandwidth demand and supply in areas already served by Internet. An enabling regulatory environment is the most important measure to foster the development of broadband infrastructure, so smart cities can function well and the digital economy can accelerate.
Source: Huawei.
5.5 Strengthen Digital Skills & Literacy
Digital skills and digital literacy need to be strengthened to enhance beneficial and productive uses of broadband and broadband take-up. Learning opportunities need to be improved and reinforced to recognize learning achievements in different contexts. Teachers need to be empowered, rather than disenfranchised, through integrated cross-government approaches involving all relevant Ministries. Such initiatives should be designed to be inclusive, so marginalized groups and communities are able to access appropriate learning opportunities.
5.6 Support Local e-Businesses and Local Entrepreneurship
Local e-business needs to be supported to make productive use of broadband. This includes facilitating local entrepreneurship, access to capital and a supportive legal and regulatory environment. This includes bringing more MSMEs online by providing training and subsidized broadband packages where necessary.
5.7 Review and adapt legal frameworks to take into account digitalization
A number of laws may need to be reviewed and/or adapted to take into account the effects of digitalization. Many developing countries lack adequate digital frameworks, laws and safeguards such as recognizing electronic transactions, protecting consumers online, strengthening cybersecurity, ensuring privacy and safeguarding of personal data. The protection of personal data is becoming particularly important with vast amounts of personal data moving from LDCs to multinational companies, as broadband use for global platforms increases.
5.8 Reduce taxes and Import Duties on Telecom/ICT Equipment and Services
Tax reductions on telecommunication products and services can help make them more affordable to more people, and boost demand and take-up. As part of the measures to take to make broadband goods and services more affordable, Governments may wish to consider reducing taxes and import duties on telecommunication/ICT equipment and services.
Chapter 5

74 The State of Broadband 2018
Annex 1: Target 1 – List of National Broadband Policies, 2018
Economy Policy Available?
Year Policy Was Adopted Title/Details
Afghanistan yes 2015 ICT Policy for Afghanistan – A Digital Agenda for Development & Social Change 2015-2024; -"IT Industry Development Policy For Afghanistan 2015-2020.
Albania yes 2013 "National Broadband plan 2013-2020" "Digital Agenda of Albania 2015-2020"; Inter-sectoral Strategy of Digital Agenda
Algeria yes 2008 E-Algérie 2013; "Action Plan/Roadmap 2015-2019"; "Broadband & High speed Broadband strategy"
Andorra yes 2013 FTTH Full National Deployment Plan
Angola yes 2013 'Main objectives of the Ministry of Telecommunications & IT for the five-year period (2017-2022)"; White Book of Information and Communication Technologies, Livro branco das Tecnologias da Informação e Comunicação – LBTIC, Information Society National Plan 2013-2017
Antigua & Barbuda yes 2015 GATE 2012-2013; Telecommunication Bill (2015).
Argentina yes 2016 Plan Nacional de Telecomunicaciones -Argentina Conectada (2010); "Plan Federal de Internet" 2016
Armenia yes 2008 Governmental Decree on Approving the IT Sector Development Conception of the Republic of Armenia; Armenia Development Strategy for 2014-2025.
Australia yes 2009 The National Broadband Network (NBN) 2009-2020
Austria yes 2013 Broadband strategy 2020 -Breit Bandstrategie bbs2020
Azerbaijan yes 2015 "National Strategy on development of information society in Azerbaijan during 2014-2020", "Optic-to-each-home 2013-2018" and "NBN Project l - Azerbaijan’s 2020"
Bahamas yes 2014 Electronic Communications Sector Policy 2014
Bahrain yes 2016 National Broadband Network: the "Fourth National Telecommunications Plan" 2016
Bangladesh yes 2009 Broadband National Policy 2009, ‘Digital Bangladesh’ - Bangladesh’s ‘Vision 2021’
Barbados yes 2010 National Information and Communication Technologies Strategic Plan of Barbados 2010-2015
Belarus yes 2016 Strategy on the development of informatization in the Republic of Belarus for 2016-2022; State Program on Development of Digital Economy and Information Society in Belarus for 2016-2020
Belgium yes 2015 Digital Belgium – Plan for Ultrafast Internet in Belgium (2015-2020)
Belize yes 2011 ICT National Strategy
Benin yes 2016 Projet de Développement des Infrastructures et des TIC ; "Plan TIC Benin, eNNOV Benin 2021"
Bhutan yes 2014 "Bhutan Telecommunications and Broadband Policy 2014"
Bolivia (Plurinational State of)
yes 2017 2017: "Plan Nacional de Banda Ancha de Bolivia 2017"
Bosnia and Herzegovina yes 2017 Policy for Development of Information Society for 2017-2021 2017-2021 Electronic Communications Sector Policy and its Action 2017
Botswana yes 2014 Botswana’s National Broadband Strategy 2014
Brazil yes 2014 National Broadband Plan 2.0 “Broadband for All” (Plano Nacional de Banda Larga - PNBL)"
Brunei Darussalam yes 2014 National Broadband Policy 2014-2017
Bulgaria yes 2014 "National Broadband Infrastructure Plan for Next-Generation Access (2014)"; "Roadmap for the implementation of the National Infrastructure Plan for Next-Generation Access (2016):Digital Bulgaria"
Burkina Faso yes 2016 "National Plan for Economic and Social Development (PNDES) 2016-2020"; "Plan d’actions de la politique sectorielle de l’économie numérique et des postes (2017-2019)"
Burundi yes 2011 Burundi Broadband Project 2018-2025" ; "Politique Nationale de Développement des TIC du Burundi 2010-2025" ; "Vision Burundi 2025"
Cabo Verde yes 2016 Estratégia Nacional para a Banda Larga 2016
Cambodia yes 2014 Cambodia’s ICT Master Plan 2020
Cameroon yes 2016 "Strategic Plan for a Digital Cameroon 2016-2020", "Digital Economy Strategy Plan"
Canada Yes
*IoT
*AI
2014
2016
2017
Digital Canada; "Telecom Regulatory Policy CRTC 2016-496"
The Internet of Things: An introduction to privacy issues with a focus on the retail and home environments Research paper;
The Pan-Canadian Artificial Intelligence Strategy
Central African Rep. yes 2006 Politique, Stratégies et plan d'actions de l'édification de la Société de l'Information en République Centrafricaine

The State of Broadband 2018 75
Economy Policy Available?
Year Policy Was Adopted Title/Details
Chad yes 2007 Plan de développement des technologies de l’Information et de la Communication au Tchad or PLAN NICI
Chile yes 2017 Agenda Digital 2020; Plan Nacional de Infraestructura de Telecomunicaciones; 2015-2020 Fibre-Optic Project (2017-2020); Ley de velocidad mínima garantizada
China Yes
*IoT
*AI
2013
2016
2017
THE 13TH FIVE-YEAR PLAN FOR ECONOMIC AND SOCIAL DEVELOPMENT OF THE PEOPLE’S REPUBLIC OF CHINA (2016–2020)". Broadband China 2013"
EU-China Joint White Paper on The IoT;
A Next-Generation AI Development Plan ; Three-Year Action Plan to Promote the Development of New-Generation AI Industry
Colombia yes 2014 Plan Vive Digital 2014 -2018
Comoros yes 2014 Loi N°14-031/AU du 17 Mars 2014, "Décret N°08-019/PR" ; World Bank: " The Regional Communications Infrastructure Program Phase 4 (RCIP 4) : Comores"
Congo (Rep. of) yes 2011 Projet de Couverture Nationale (PCN), Projet West Africa Cable System (WACS), Projet Central Africa Backbone – Composante République du Congo (CAB-CIT CG)
Congo (Dem. Rep.) yes 2018 Arrêté ministériel n° CAB/MIN/PTNTIC/TKKM/PKM/sap/022/012 du 21 décembre 2012 fixant les conditions et modalités d’établissement et d’exploitation du réseau des télécommunications à fibre optique en République Démocratique du Congo" ; DRC's Telecommunications Act, May 2018
Costa Rica yes 2015 Estrategia Nacional de Banda Ancha 2012-2017; Costa Rica Digital 2015-2021; Plan Nacional de Desarrollo de las Telecomunicaciones 2015-2021
Côte d'Ivoire yes 2016 Le Réseau National Haut Débit (RNHD) 2016
Croatia yes 2016 National broadband development strategy in the Republic of Croatia 2016-2020
Cuba yes 2016 Política Integral para el Perfeccionamiento de la Informatización de la sociedad en Cuba (July 2017)
Cyprus yes 2012 Digital Strategy for Cyprus 2012-2020
Czech Republic yes 2013 State policy in electronic communication: Digital Czech Republic v.2.0
D.P.R. Korea no
Denmark Yes
*AI
2010
2018
Digital work programme by the Minister of Science, Technology and Innovation; Better Broadband & Mobile Coverage in Denmark (2013-2020);
Strategy for Denmark’s Digital Growth
Djibouti yes 2015 Strategy of Accelerated Growth and Promotion of Employment (SCAPE) 2015-2019, Strategies of the development of Telecommunications & Post Office 2011-2015", Vision Djibouti 2035
Dominica planning
Dominican Rep. yes 2016 Digital Agenda of Dominican Rep. 2016 -2020; Programa República Digital; Plan Bienal de Proyectos 2014-2015 INDOTEL and US/A Policy
Ecuador yes 2011 Ministerial Agreement 035-2014; Plan Nacional de Desarrollo de Banda Ancha 2011 -2016; Estrategía Ecuador Digital 2.0
Egypt yes 2014 eMisr National Broadband Plan
El Salvador no
Equatorial Guinea yes 2012 Nuevas Tecnologias: national project aimed at the popularization of technologies Information and communication (TICGE) 2012-2020
Eritrea no
Estonia yes 2013 Electronic Communication Act; Digital Agenda 2020 for Estonia
Ethiopia yes 2013 National ICT Policy and Strategy; National Broadband Master Plan- FDR Ethiopia ICT Policy (DRAFT) National Broadband Plan 2016
Fiji yes 2011 National Broadband Policy
Finland Yes *AI
2016 2018
Fast Broadband project; Broadband Implementation Plan (2016-2019) Finland’s Age of Artificial Intelligence
France Yes *AI
2013 2018
Plan France Très Haut Débit 2013-2022 AI for Humanity Summit
Gabon yes 2012 Plan sectoriel Gabon numérique
Gambia yes 2008 The Gambian ICT4D-2012 Plan
Georgia yes 2016 Georgian national innovation ecosystem Georgia National Innovation Ecosystem (GENIE) 2016-2020
Germany Yes
*IoT
2017
2014
Breitbandstrategie der Bundesregierung, The "Gigabit Initiative for Germany (2017)"
‘INDUSTRIE 4.0 Smart Manufacturing for the Future’; policy proposal
Ghana yes 2010 National Strategy for Digital Growth; Broadband Wireless Access 2011
Annex 1
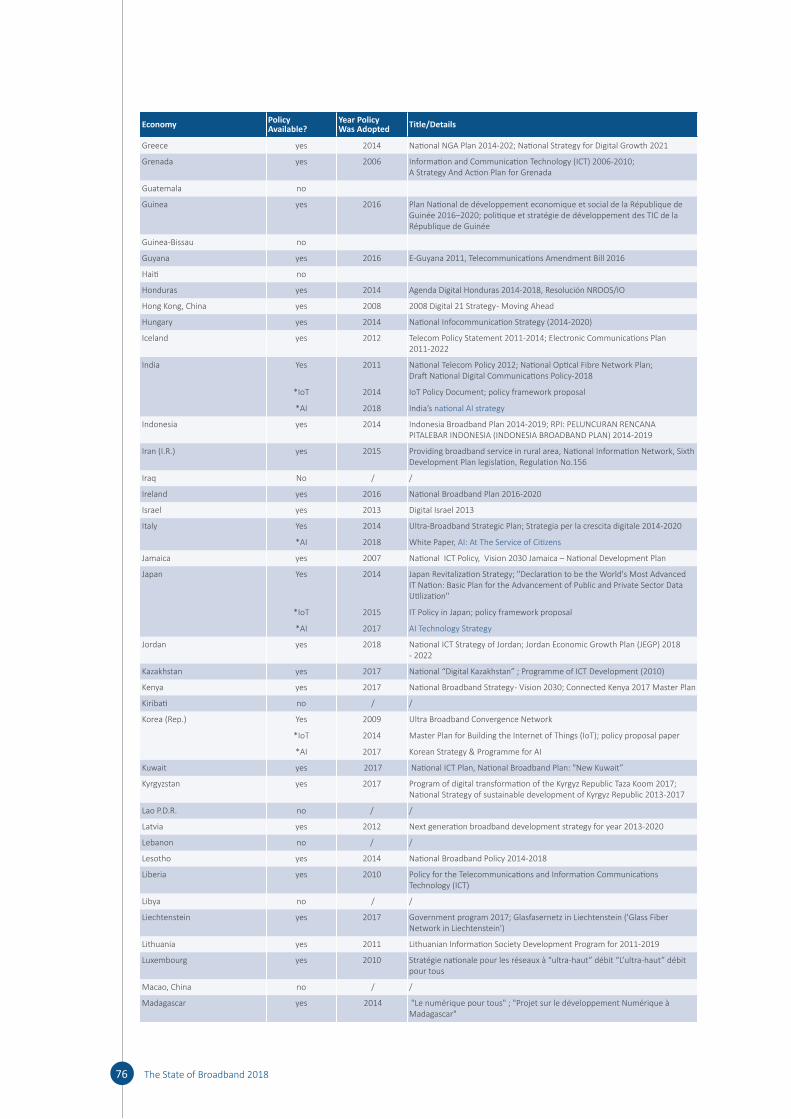
76 The State of Broadband 2018
Economy Policy Available?
Year Policy Was Adopted Title/Details
Greece yes 2014 National NGA Plan 2014-202; National Strategy for Digital Growth 2021
Grenada yes 2006 Information and Communication Technology (ICT) 2006-2010; A Strategy And Action Plan for Grenada
Guatemala no
Guinea yes 2016 Plan National de développement economique et social de la République de Guinée 2016–2020; politique et stratégie de développement des TIC de la République de Guinée
Guinea-Bissau no
Guyana yes 2016 E-Guyana 2011, Telecommunications Amendment Bill 2016
Haiti no
Honduras yes 2014 Agenda Digital Honduras 2014-2018, Resolución NROOS/IO
Hong Kong, China yes 2008 2008 Digital 21 Strategy - Moving Ahead
Hungary yes 2014 National Infocommunication Strategy (2014-2020)
Iceland yes 2012 Telecom Policy Statement 2011-2014; Electronic Communications Plan 2011-2022
India Yes
*IoT
*AI
2011
2014
2018
National Telecom Policy 2012; National Optical Fibre Network Plan; Draft National Digital Communications Policy-2018
IoT Policy Document; policy framework proposal
India’s national AI strategy
Indonesia yes 2014 Indonesia Broadband Plan 2014-2019; RPI: PELUNCURAN RENCANA PITALEBAR INDONESIA (INDONESIA BROADBAND PLAN) 2014-2019
Iran (I.R.) yes 2015 Providing broadband service in rural area, National Information Network, Sixth Development Plan legislation, Regulation No.156
Iraq No / /
Ireland yes 2016 National Broadband Plan 2016-2020
Israel yes 2013 Digital Israel 2013
Italy Yes
*AI
2014
2018
Ultra-Broadband Strategic Plan; Strategia per la crescita digitale 2014-2020
White Paper, AI: At The Service of Citizens
Jamaica yes 2007 National ICT Policy, Vision 2030 Jamaica – National Development Plan
Japan Yes
*IoT
*AI
2014
2015
2017
Japan Revitalization Strategy; "Declaration to be the World's Most Advanced IT Nation: Basic Plan for the Advancement of Public and Private Sector Data Utilization"
IT Policy in Japan; policy framework proposal
AI Technology Strategy
Jordan yes 2018 National ICT Strategy of Jordan; Jordan Economic Growth Plan (JEGP) 2018 - 2022
Kazakhstan yes 2017 National “Digital Kazakhstan” ; Programme of ICT Development (2010)
Kenya yes 2017 National Broadband Strategy - Vision 2030; Connected Kenya 2017 Master Plan
Kiribati no / /
Korea (Rep.) Yes
*IoT
*AI
2009
2014
2017
Ultra Broadband Convergence Network
Master Plan for Building the Internet of Things (IoT); policy proposal paper
Korean Strategy & Programme for AI
Kuwait yes 2017 National ICT Plan, National Broadband Plan: "New Kuwait”
Kyrgyzstan yes 2017 Program of digital transformation of the Kyrgyz Republic Taza Koom 2017; National Strategy of sustainable development of Kyrgyz Republic 2013-2017
Lao P.D.R. no / /
Latvia yes 2012 Next generation broadband development strategy for year 2013-2020
Lebanon no / /
Lesotho yes 2014 National Broadband Policy 2014-2018
Liberia yes 2010 Policy for the Telecommunications and Information Communications Technology (ICT)
Libya no / /
Liechtenstein yes 2017 Government program 2017; Glasfasernetz in Liechtenstein ('Glass Fiber Network in Liechtenstein')
Lithuania yes 2011 Lithuanian Information Society Development Program for 2011-2019
Luxembourg yes 2010 Stratégie nationale pour les réseaux à “ultra-haut” débit “L’ultra-haut” débit pour tous
Macao, China no / /
Madagascar yes 2014 "Le numérique pour tous" ; "Projet sur le développement Numérique à Madagascar"

The State of Broadband 2018 77
Economy Policy Available?
Year Policy Was Adopted Title/Details
Malawi yes 2013 National ICT Policy; National Wireless Broadband Plan
Malaysia Yes
*IoT
2010
2015
National Broadband Initiative
National Internet of Things (IoT) Strategic Roadmap; policy paper proposal
Maldives yes 2018 National Broadband Policy 2018
Mali yes 2018 Plan Mali Numerique 2020 ; Strategie large bande" (NB plan)
Malta yes 2014 Digital Malta - National Digital Stratrgy 2014-2020
Marshall Islands yes 2003 The Strategic development plan framework 2003-2018
Mauritania no / /
Mauritius yes 2012 National Broadband Policy 2012 - 2020 (NBP2012)
Mexico yes 2013 Red Publica Compartida de Telecomunicaciones, Estrategia Digital Nacional 2013-2018
Micronesia yes 2012 ICT and Telecommunications Policy 2012; FSM National Government ICT Network Roll-out Plan
Moldova yes 2013 Digital Moldova 2020
Monaco no / /
Mongolia yes 2011 The State Policy on the Development of ICT 2025; National program on Broadband Network
Montenegro yes 2012 Strategy for the Development of Information Society 2012-2016 - Montenegro - Digital Society
Morocco yes 2012 Plan national pour le développement du haut et très haut débit au Maroc
Mozambique yes 2006 National ICT Policy Implementation Strategy 2002and 2006 - Digital Inclusion in Mozambique
Myanmar no / /
Namibia yes 2009 Telecommunications Policy for the Republic of Namibia
Nauru yes N/A National Sustainable Development Strategy 2005 – 2025; Nauru ICT Policy
Nepal (Rep. of) yes 2015 National Telecommunication Policy 2017 (Draft)
Netherlands yes 2016 Digital Agenda for the Netherlands 2016-2021
New Zealand Yes
*AI
2015
2018
Ultra-fast broadband initiative, Five Point Government Action Plan for faster broadband
AI: Shaping a Future New Zealand
Nicaragua no / /
Niger yes 2005 Plan de développement des Technologies de l’Information et de la Communication au Niger / Plan NICI du Niger
Nigeria yes 2013 National Broadband Plan 2013-2018
Norway yes 2015 Digital Agenda for Norway
Oman yes 2014 The National Broadband Strategy (2014-2018)
Pakistan yes 2015 National Broadband Programme 2007; Telecommunication Policy 2015
Panama yes 2014 Plan Nacional de Banda Ancha (part of the National ICT Plan) 2014-2018
Papua New Guinea yes 2013 National ICT Policy and PNG National Broadband Policy
Paraguay yes 2016 Paraguay Conectado y Plan Nacional de Telecomunicaciones – PNT 2016-2020
Peru yes 2011 Plan Nacional para el desarrollo de la Banda Ancha en el Perú; Ley 29904 - Ley de Promoción de la Banda Ancha y Construccion de la Red Dorsal Nacional de Fibra Óptica
Philippines yes 2016 National Broadband Plan 2016
Poland yes 2014 Narodowy Plan Szeroko Pasmowy/National Broadband Plan 2014-2020
Portugal yes 2015 Agenda Portugal Digital
Qatar yes 2013 Qatar National Broadband Plan
Romania yes 2015 National Strategy on the Digital Agenda for Romania 2020; National Plan for Next-Generation Network Infrastructure Development
Russian Federation Yes
*AI
2012
2018
The Goals of the Ministry of Telecom and Mass Communications of the Russian Federation 2012–2018; Information Society Strategy & Programme 2011-2020
Russian Government released a list of 10 policies for AI.
Rwanda yes 2015 Regional Connectivity Infrastructure Program (RCIP); National Broadband Policy for Rwanda; SMART Rwanda Master Plan 2015-2020
Saint Kitts and Nevis yes 2006 National ICT Strategic Plan
Saint Lucia yes 2006 ICT Development Strategy for St. Lucia
Saint Vincent and the Grenadines yes 2015 National ICT Strategy and Action Plan
Samoa no / /
Annex 1
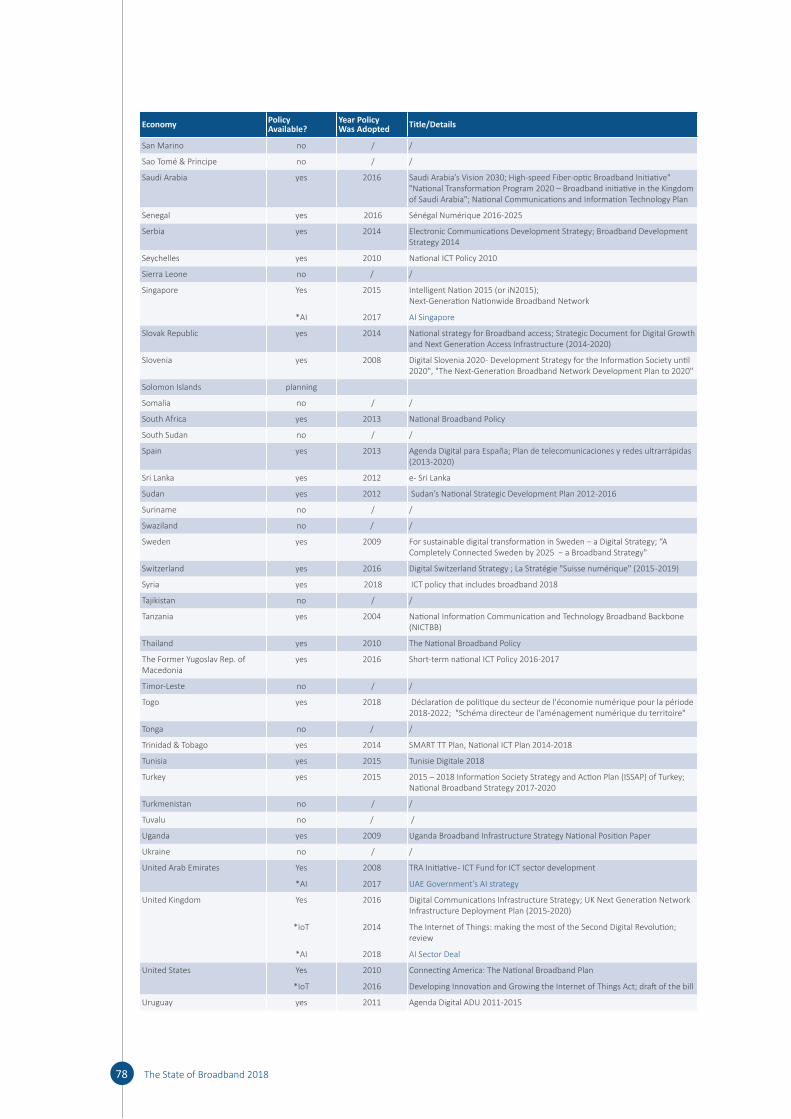
78 The State of Broadband 2018
Economy Policy Available?
Year Policy Was Adopted Title/Details
San Marino no / /
Sao Tomé & Principe no / /
Saudi Arabia yes 2016 Saudi Arabia’s Vision 2030; High-speed Fiber-optic Broadband Initiative" "National Transformation Program 2020 – Broadband initiative in the Kingdom of Saudi Arabia"; National Communications and Information Technology Plan
Senegal yes 2016 Sénégal Numérique 2016-2025
Serbia yes 2014 Electronic Communications Development Strategy; Broadband Development Strategy 2014
Seychelles yes 2010 National ICT Policy 2010
Sierra Leone no / /
Singapore Yes
*AI
2015
2017
Intelligent Nation 2015 (or iN2015); Next-Generation Nationwide Broadband Network
AI Singapore
Slovak Republic yes 2014 National strategy for Broadband access; Strategic Document for Digital Growth and Next Generation Access Infrastructure (2014-2020)
Slovenia yes 2008 Digital Slovenia 2020 - Development Strategy for the Information Society until 2020", "The Next-Generation Broadband Network Development Plan to 2020"
Solomon Islands planning
Somalia no / /
South Africa yes 2013 National Broadband Policy
South Sudan no / /
Spain yes 2013 Agenda Digital para España; Plan de telecomunicaciones y redes ultrarrápidas (2013-2020)
Sri Lanka yes 2012 e- Sri Lanka
Sudan yes 2012 Sudan’s National Strategic Development Plan 2012-2016
Suriname no / /
Swaziland no / /
Sweden yes 2009 For sustainable digital transformation in Sweden – a Digital Strategy; “A Completely Connected Sweden by 2025 − a Broadband Strategy"
Switzerland yes 2016 Digital Switzerland Strategy ; La Stratégie "Suisse numérique" (2015 -2019)
Syria yes 2018 ICT policy that includes broadband 2018
Tajikistan no / /
Tanzania yes 2004 National Information Communication and Technology Broadband Backbone (NICTBB)
Thailand yes 2010 The National Broadband Policy
The Former Yugoslav Rep. of Macedonia
yes 2016 Short-term national ICT Policy 2016-2017
Timor-Leste no / /
Togo yes 2018 Déclaration de politique du secteur de l'économie numérique pour la période 2018-2022; "Schéma directeur de l'aménagement numérique du territoire"
Tonga no / /
Trinidad & Tobago yes 2014 SMART TT Plan, National ICT Plan 2014-2018
Tunisia yes 2015 Tunisie Digitale 2018
Turkey yes 2015 2015 – 2018 Information Society Strategy and Action Plan (ISSAP) of Turkey; National Broadband Strategy 2017-2020
Turkmenistan no / /
Tuvalu no / /
Uganda yes 2009 Uganda Broadband Infrastructure Strategy National Position Paper
Ukraine no / /
United Arab Emirates Yes
*AI
2008
2017
TRA Initiative - ICT Fund for ICT sector development
UAE Government’s AI strategy
United Kingdom Yes
*IoT
*AI
2016
2014
2018
Digital Communications Infrastructure Strategy; UK Next Generation Network Infrastructure Deployment Plan (2015-2020)
The Internet of Things: making the most of the Second Digital Revolution; review
AI Sector Deal
United States Yes
*IoT
2010
2016
Connecting America: The National Broadband Plan
Developing Innovation and Growing the Internet of Things Act; draft of the bill
Uruguay yes 2011 Agenda Digital ADU 2011-2015

The State of Broadband 2018 79
Economy Policy Available?
Year Policy Was Adopted Title/Details
Uzbekistan no / /
Vanuatu yes 2013 National Information and Communications Policy
Vatican no / /
Venezuela no / /
Viet Nam yes 2016 Master Plan of Broadband Infrastructure Development up to 2020
Yemen no / /
Zambia yes 2006 National Information and Communication Technology Policy
Zimbabwe yes 2005 National ICT Policy
Source: ITU; economies with AI Plans adapted from Tim Dutton (2018). Number of economies with National Broadband Plans: 159 Number of economies planning on introducing a National Broadband Plan: 2 Number of economies without National Broadband Plans: 35
Annex 1

80 The State of Broadband 2018
Annex 2: Fixed-Broadband Subscriptions per 100 inhabitants, 2017
Economy Fixed-Broadband Subscriptions per 100 inhabitants
1 Afghanistan 0.05
2 Albania 10.0
3 Algeria 7.7
4 Andorra 44.5
5 Angola 0.3
6 Antigua and Barbuda 9.1
7 Argentina 17.8
8 Armenia 10.8
9 Australia 32.4
10 Austria 28.7
11 Azerbaijan 18.4
12 Bahamas 22.0
13 Bahrain 14.3
14 Bangladesh 4.4
15 Barbados 31.3
16 Belarus 33.4
17 Belgium 38.3
18 Belize 5.9
19 Benin 0.3
20 Bhutan 2.1
21 Bolivia (Plurinational State of) 3.2
22 Bosnia and Herzegovina 18.9
23 Botswana 2.1
24 Brazil 13.7
25 Brunei Darussalam 9.6
26 Bulgaria 24.9
27 Burkina Faso 0.1
28 Burundi 0.0
29 Cabo Verde 2.7
30 Cambodia 0.8
31 Cameroon 0.2
32 Canada 38.0
33 Central African Republic 0.0
34 Chad 0.1
35 Chile 16.9
36 China 26.9
37 Colombia 12.9
38 Comoros 0.2
39 Congo (Dem. Rep.) 0.0
40 Congo (Rep of.) n/a
41 Costa Rica 15.2
42 Côte d’Ivoire 0.6
43 Croatia 26.2
44 Cuba 0.3
45 Cyprus 34.8
46 Czech Republic 28.8
47 Dem. People’s Rep. of Korea n/a
48 Denmark 43.2
49 Djibouti 2.5
50 Dominica 20.9
51 Dominican Republic 7.3
52 Ecuador 10.1
53 Egypt 5.4
Economy Fixed-Broadband Subscriptions per 100 inhabitants
54 El Salvador 6.9
55 Equatorial Guinea 0.3
56 Eritrea 0.0
57 Estonia 30.9
58 Eswatini 0.5
59 Ethiopia 0.6
60 Fiji 1.3
61 Finland 30.9
62 France 43.8
63 Gabon 0.7
64 Gambia 0.2
65 Georgia 19.7
66 Germany 40.5
67 Ghana 0.2
68 Greece 33.9
69 Grenada 20.6
70 Guatemala 3.0
71 Guinea 0.01
72 Guinea-Bissau 0.03
73 Guyana 8.3
74 Haiti 0.3
75 Honduras 2.5
76 Hong Kong, China 35.9
77 Hungary 30.4
78 Iceland 39.9
79 India 1.3
80 Indonesia 2.3
81 Iran (Islamic Republic of) 12.4
82 Iraq n/a
83 Ireland 29.4
84 Israel 28.1
85 Italy 27.9
86 Jamaica 8.3
87 Japan 31.7
88 Jordan 4.7
89 Kazakhstan 14.1
90 Kenya 0.6
91 Kiribati 0.1
92 Korea (Rep. of) 41.6
93 Kuwait 2.7
94 Kyrgyzstan 4.3
95 Lao P.D.R. 0.4
96 Latvia 27.0
97 Lebanon 21.4
98 Lesotho 0.2
99 Liberia 0.2
100 Libya 2.6
101 Liechtenstein 42.0
102 Lithuania 27.6
103 Luxembourg 36.5
104 Macao, China 28.6
105 Madagascar 0.1
106 Malawi 0.0
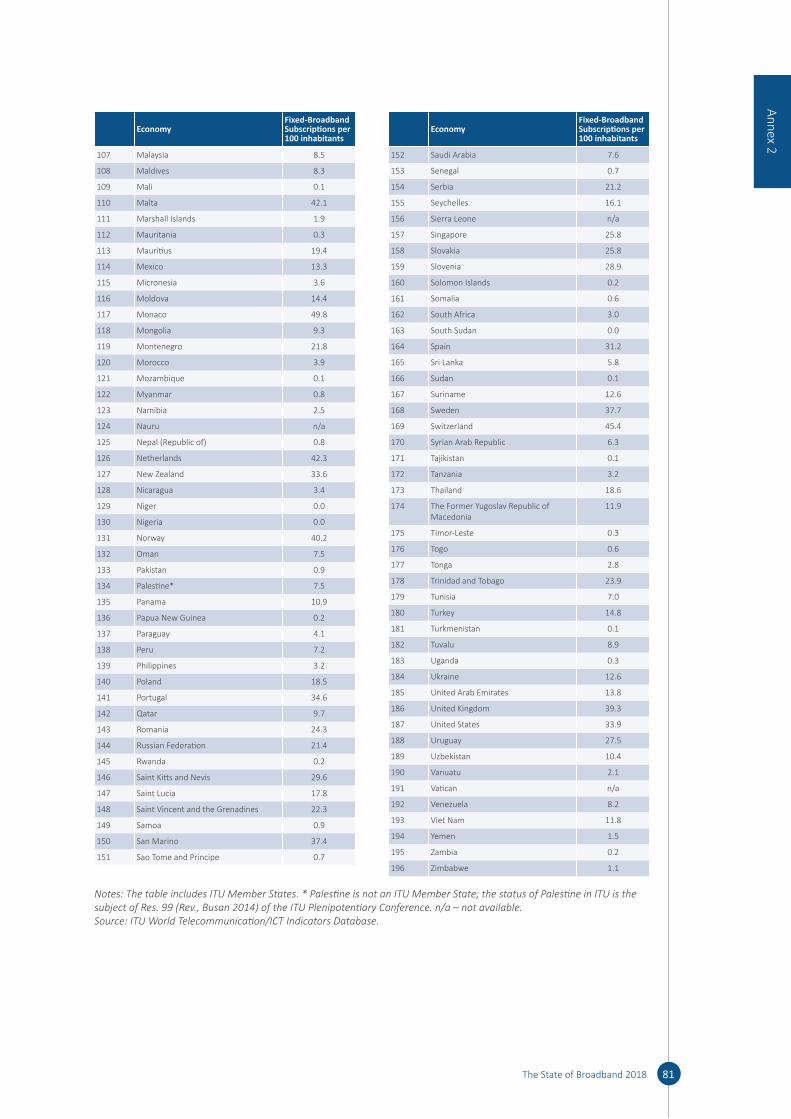
The State of Broadband 2018 81
Economy Fixed-Broadband Subscriptions per 100 inhabitants
107 Malaysia 8.5
108 Maldives 8.3
109 Mali 0.1
110 Malta 42.1
111 Marshall Islands 1.9
112 Mauritania 0.3
113 Mauritius 19.4
114 Mexico 13.3
115 Micronesia 3.6
116 Moldova 14.4
117 Monaco 49.8
118 Mongolia 9.3
119 Montenegro 21.8
120 Morocco 3.9
121 Mozambique 0.1
122 Myanmar 0.8
123 Namibia 2.5
124 Nauru n/a
125 Nepal (Republic of) 0.8
126 Netherlands 42.3
127 New Zealand 33.6
128 Nicaragua 3.4
129 Niger 0.0
130 Nigeria 0.0
131 Norway 40.2
132 Oman 7.5
133 Pakistan 0.9
134 Palestine* 7.5
135 Panama 10.9
136 Papua New Guinea 0.2
137 Paraguay 4.1
138 Peru 7.2
139 Philippines 3.2
140 Poland 18.5
141 Portugal 34.6
142 Qatar 9.7
143 Romania 24.3
144 Russian Federation 21.4
145 Rwanda 0.2
146 Saint Kitts and Nevis 29.6
147 Saint Lucia 17.8
148 Saint Vincent and the Grenadines 22.3
149 Samoa 0.9
150 San Marino 37.4
151 Sao Tome and Principe 0.7
Economy Fixed-Broadband Subscriptions per 100 inhabitants
152 Saudi Arabia 7.6
153 Senegal 0.7
154 Serbia 21.2
155 Seychelles 16.1
156 Sierra Leone n/a
157 Singapore 25.8
158 Slovakia 25.8
159 Slovenia 28.9
160 Solomon Islands 0.2
161 Somalia 0.6
162 South Africa 3.0
163 South Sudan 0.0
164 Spain 31.2
165 Sri Lanka 5.8
166 Sudan 0.1
167 Suriname 12.6
168 Sweden 37.7
169 Switzerland 45.4
170 Syrian Arab Republic 6.3
171 Tajikistan 0.1
172 Tanzania 3.2
173 Thailand 18.6
174 The Former Yugoslav Republic of Macedonia
11.9
175 Timor-Leste 0.3
176 Togo 0.6
177 Tonga 2.8
178 Trinidad and Tobago 23.9
179 Tunisia 7.0
180 Turkey 14.8
181 Turkmenistan 0.1
182 Tuvalu 8.9
183 Uganda 0.3
184 Ukraine 12.6
185 United Arab Emirates 13.8
186 United Kingdom 39.3
187 United States 33.9
188 Uruguay 27.5
189 Uzbekistan 10.4
190 Vanuatu 2.1
191 Vatican n/a
192 Venezuela 8.2
193 Viet Nam 11.8
194 Yemen 1.5
195 Zambia 0.2
196 Zimbabwe 1.1
Notes: The table includes ITU Member States. * Palestine is not an ITU Member State; the status of Palestine in ITU is the subject of Res. 99 (Rev., Busan 2014) of the ITU Plenipotentiary Conference. n/a – not available. Source: ITU World Telecommunication/ICT Indicators Database.
Annex 2

82 The State of Broadband 2018
Annex 3: Mobile-Broadband Subscriptions per 100 inhabitants, 2017
EconomyMobile-broadband Subscriptions per 100 inhabitants
1 Afghanistan 16.0
2 Albania 69.3
3 Algeria 83.9
4 Andorra 55.6
5 Angola 14.6
6 Antigua and Barbuda 40.6
7 Argentina 78.1
8 Armenia 66.8
9 Australia 134.9
10 Austria 86.2
11 Azerbaijan 56.8
12 Bahamas 81.6
13 Bahrain 147.3
14 Bangladesh 30.0
15 Barbados 50.6
16 Belarus 76.2
17 Belgium 75.1
18 Belize 13.4
19 Benin 12.0
20 Bhutan 87.4
21 Bolivia (Plurinational State of) 76.5
22 Bosnia and Herzegovina 43.4
23 Botswana 66.9
24 Brazil 90.2
25 Brunei Darussalam 126.6
26 Bulgaria 91.6
27 Burkina Faso 28.8
28 Burundi 17.2
29 Cabo Verde 69.9
30 Cambodia 66.9
31 Cameroon 10.5
32 Canada 72.5
33 Central African Republic 3.5
34 Chad 9.2
35 Chile 88.2
36 China 83.6
37 Colombia 48.8
38 Comoros 0.9
39 Congo (Dem. Rep. of) 16.2
40 Congo (Rep. of) 5.9
41 Costa Rica 116.6
42 Côte d’Ivoire 53.9
43 Croatia 79.7
44 Cuba -
45 Cyprus 106.4
46 Czech Republic 81.9
47 Dem. People’s Rep. of Korea 14.2
48 Denmark 129.0
49 Djibouti 11.7
50 Dominica 40.7
51 Dominican Republic 55.7
52 Ecuador 53.0
53 Egypt 50.1
EconomyMobile-broadband Subscriptions per 100 inhabitants
54 El Salvador 56.1
55 Equatorial Guinea 0.3
56 Eritrea -
57 Estonia 133.4
58 Eswatini 12.6
59 Ethiopia 7.1
60 Fiji 55.7
61 Finland 153.8
62 France 87.5
63 Gabon 84.1
64 Gambia 21.2
65 Georgia 73.1
66 Germany 79.8
67 Ghana 83.2
68 Greece 63.4
69 Grenada 89.2
70 Guatemala 13.9
71 Guinea 15.3
72 Guinea-Bissau 7.3
73 Guyana 26.3
74 Haiti 27.1
75 Honduras 24.5
76 Hong Kong, China 105.0
77 Hungary 49.1
78 Iceland 113.3
79 India 25.8
80 Indonesia 95.7
81 Iran (Islamic Republic of) 68.2
82 Iraq 25.1
83 Ireland 102.0
84 Israel 105.1
85 Italy 87.9
86 Jamaica 48.9
87 Japan 133.2
88 Jordan 103.8
89 Kazakhstan 75.1
90 Kenya 35.7
91 Kiribati 42.0
92 Korea (Rep. of) 112.8
93 Kuwait 227.9
94 Kyrgyzstan 73.7
95 Lao P.D.R. 40.0
96 Latvia 117.9
97 Lebanon 56.8
98 Lesotho 49.0
99 Liberia 5.2
100 Libya 35.4
101 Liechtenstein 122.6
102 Lithuania 79.8
103 Luxembourg 88.1
104 Macao, China 321.8
105 Madagascar 13.0
106 Malawi 25.5
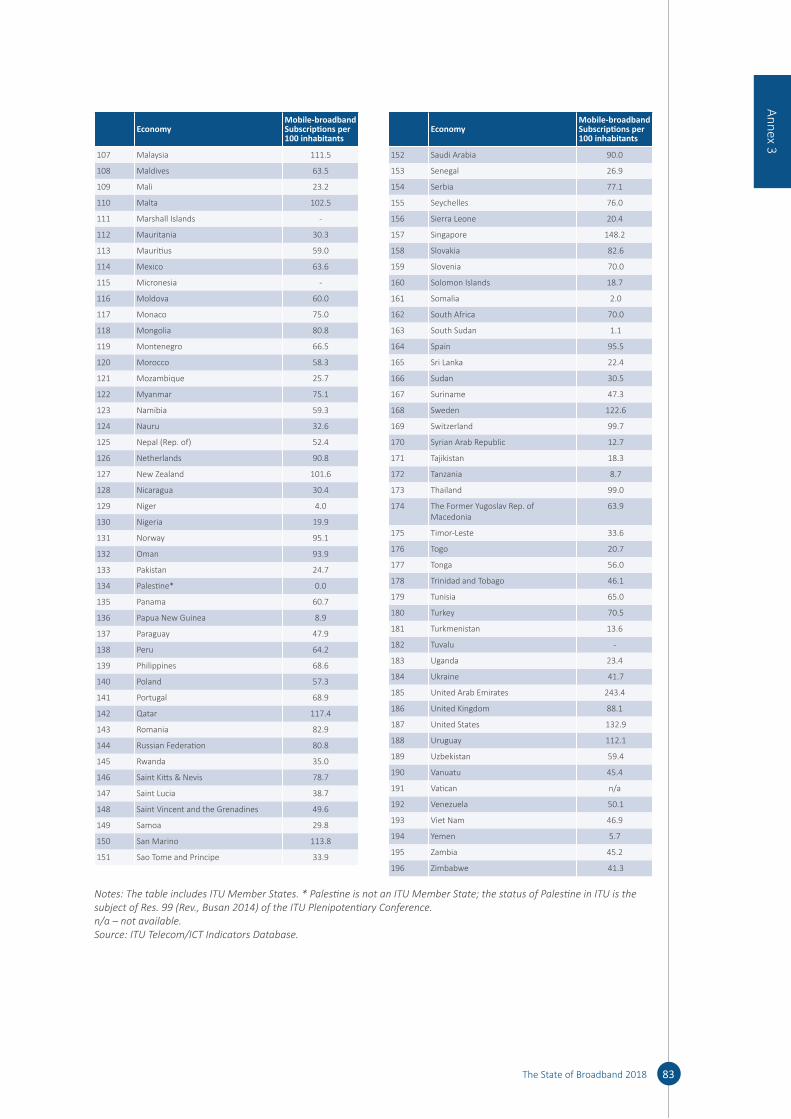
The State of Broadband 2018 83
EconomyMobile-broadband Subscriptions per 100 inhabitants
107 Malaysia 111.5
108 Maldives 63.5
109 Mali 23.2
110 Malta 102.5
111 Marshall Islands -
112 Mauritania 30.3
113 Mauritius 59.0
114 Mexico 63.6
115 Micronesia -
116 Moldova 60.0
117 Monaco 75.0
118 Mongolia 80.8
119 Montenegro 66.5
120 Morocco 58.3
121 Mozambique 25.7
122 Myanmar 75.1
123 Namibia 59.3
124 Nauru 32.6
125 Nepal (Rep. of) 52.4
126 Netherlands 90.8
127 New Zealand 101.6
128 Nicaragua 30.4
129 Niger 4.0
130 Nigeria 19.9
131 Norway 95.1
132 Oman 93.9
133 Pakistan 24.7
134 Palestine* 0.0
135 Panama 60.7
136 Papua New Guinea 8.9
137 Paraguay 47.9
138 Peru 64.2
139 Philippines 68.6
140 Poland 57.3
141 Portugal 68.9
142 Qatar 117.4
143 Romania 82.9
144 Russian Federation 80.8
145 Rwanda 35.0
146 Saint Kitts & Nevis 78.7
147 Saint Lucia 38.7
148 Saint Vincent and the Grenadines 49.6
149 Samoa 29.8
150 San Marino 113.8
151 Sao Tome and Principe 33.9
EconomyMobile-broadband Subscriptions per 100 inhabitants
152 Saudi Arabia 90.0
153 Senegal 26.9
154 Serbia 77.1
155 Seychelles 76.0
156 Sierra Leone 20.4
157 Singapore 148.2
158 Slovakia 82.6
159 Slovenia 70.0
160 Solomon Islands 18.7
161 Somalia 2.0
162 South Africa 70.0
163 South Sudan 1.1
164 Spain 95.5
165 Sri Lanka 22.4
166 Sudan 30.5
167 Suriname 47.3
168 Sweden 122.6
169 Switzerland 99.7
170 Syrian Arab Republic 12.7
171 Tajikistan 18.3
172 Tanzania 8.7
173 Thailand 99.0
174 The Former Yugoslav Rep. of Macedonia
63.9
175 Timor-Leste 33.6
176 Togo 20.7
177 Tonga 56.0
178 Trinidad and Tobago 46.1
179 Tunisia 65.0
180 Turkey 70.5
181 Turkmenistan 13.6
182 Tuvalu -
183 Uganda 23.4
184 Ukraine 41.7
185 United Arab Emirates 243.4
186 United Kingdom 88.1
187 United States 132.9
188 Uruguay 112.1
189 Uzbekistan 59.4
190 Vanuatu 45.4
191 Vatican n/a
192 Venezuela 50.1
193 Viet Nam 46.9
194 Yemen 5.7
195 Zambia 45.2
196 Zimbabwe 41.3
Notes: The table includes ITU Member States. * Palestine is not an ITU Member State; the status of Palestine in ITU is the subject of Res. 99 (Rev., Busan 2014) of the ITU Plenipotentiary Conference. n/a – not available. Source: ITU Telecom/ICT Indicators Database.
Annex 3

84 The State of Broadband 2018
Annex 4: Percentage of Individuals using the Internet, 2017
Economy % of Individuals Using the Internet
1 Afghanistan 10.6
2 Albania 66.4
3 Algeria 42.9
4 Andorra 97.9
5 Angola 13.0
6 Antigua and Barbuda 73.0
7 Argentina 71.0
8 Armenia 64.3
9 Australia 86.5
10 Austria 87.9
11 Azerbaijan 79.0
12 Bahamas 80.0
13 Bahrain 95.9
14 Bangladesh 18.2
15 Barbados 79.5
16 Belarus 74.4
17 Belgium 87.7
18 Belize 44.6
19 Benin 12.0
20 Bhutan 41.8
21 Bolivia (Plurinational State of) 39.7
22 Bosnia and Herzegovina 69.5
23 Botswana 39.4
24 Brazil 60.9
25 Brunei Darussalam 90.0
26 Bulgaria 63.4
27 Burkina Faso 14.0
28 Burundi 5.2
29 Cabo Verde 57.2
30 Cambodia 34.0
31 Cameroon 23.2
32 Canada 91.2
33 Central African Republic 4.0
34 Chad 5.0
35 Chile 82.3
36 China 54.3
37 Colombia 62.3
38 Comoros 7.9
39 Congo (Dem. Rep. of) 6.2
40 Congo (Rep. of) 8.1
41 Costa Rica 71.6
42 Côte d’Ivoire 43.8
43 Croatia 67.1
44 Cuba 43.0
45 Cyprus 80.7
46 Czech Republic 78.7
47 Dem. People’s Rep. of Korea n/a
48 Denmark 97.1
49 Djibouti 55.7
50 Dominica 67.0
51 Dominican Republic 63.9
52 Ecuador 57.3
53 Egypt 45.0
54 El Salvador 29.0
Economy % of Individuals Using the Internet
55 Equatorial Guinea 23.8
56 Eritrea 1.2
57 Estonia 88.1
58 Eswatini 28.6
59 Ethiopia 15.4
60 Fiji 46.5
61 Finland 87.5
62 France 80.5
63 Gabon 48.1
64 Gambia 18.5
65 Georgia 60.5
66 Germany 84.4
67 Ghana 34.7
68 Greece 69.1
69 Grenada 68.5
70 Guatemala 34.5
71 Guinea 9.8
72 Guinea-Bissau 3.8
73 Guyana 35.7
74 Haiti 12.2
75 Honduras 30.0
76 Hong Kong, China 89.4
77 Hungary 76.8
78 Iceland 98.2
79 India 29.5
80 Indonesia 32.3
81 Iran (Islamic Republic of) 60.4
82 Iraq 49.4
83 Ireland 84.5
84 Israel 81.6
85 Italy 61.3
86 Jamaica 44.4
87 Japan 90.9
88 Jordan 62.3
89 Kazakhstan 76.4
90 Kenya 16.6
91 Kiribati 13.7
92 Korea (Rep. of) 95.1
93 Kuwait 98.0
94 Kyrgyzstan 34.5
95 Lao P.D.R. 21.9
96 Latvia 81.3
97 Lebanon 76.1
98 Lesotho 27.4
99 Liberia 7.3
100 Libya 20.3
101 Liechtenstein 98.1
102 Lithuania 77.6
103 Luxembourg 97.8
104 Macao, China 83.2
105 Madagascar 9.8
106 Malawi 11.5
107 Malaysia 80.1
108 Maldives 59.1

The State of Broadband 2018 85
Economy % of Individuals Using the Internet
109 Mali 11.1
110 Malta 80.1
111 Marshall Islands 29.8
112 Mauritania 18.0
113 Mauritius 52.2
114 Mexico 63.9
115 Micronesia 33.4
116 Moldova 71.0
117 Monaco 95.2
118 Mongolia 22.3
119 Montenegro 71.3
120 Morocco 61.8
121 Mozambique 17.5
122 Myanmar 25.1
123 Namibia 31.0
124 Nauru n/a
125 Nepal (Rep. of) 19.7
126 Netherlands 93.2
127 New Zealand 88.5
128 Nicaragua 24.6
129 Niger 10.2
130 Nigeria 25.7
131 Norway 96.5
132 Oman 76.9
133 Pakistan 15.5
134 Palestine* 61.2
135 Panama 54.0
136 Papua New Guinea 9.6
137 Paraguay 61.1
138 Peru 48.7
139 Philippines 55.5
140 Poland 76.0
141 Portugal 73.8
142 Qatar 94.3
143 Romania 63.7
144 Russian Federation 76.0
145 Rwanda 20.0
146 Saint Kitts & Nevis 76.8
147 Saint Lucia 46.7
148 Saint Vincent and the Grenadines 65.6
149 Samoa 29.4
150 San Marino n/a
151 Sao Tome and Principe 28.0
152 Saudi Arabia 80.1
Economy % of Individuals Using the Internet
153 Senegal 25.7
154 Serbia 70.3
155 Seychelles 56.5
156 Sierra Leone 11.8
157 Singapore 84.4
158 Slovakia 81.6
159 Slovenia 78.9
160 Solomon Islands 11.0
161 Somalia 1.9
162 South Africa 54.0
163 South Sudan 6.7
164 Spain 84.6
165 Sri Lanka 32.1
166 Sudan 28.0
167 Suriname 45.4
168 Sweden 96.4
169 Switzerland 93.7
170 Syrian Arab Republic 31.9
171 Tajikistan 20.5
172 Tanzania 13.0
173 Thailand 52.9
174 The Former Yugoslav Rep. of Macedonia
72.2
175 Timor-Leste 25.2
176 Togo 12.4
177 Tonga 40.0
178 Trinidad and Tobago 73.3
179 Tunisia 55.5
180 Turkey 64.7
181 Turkmenistan 18.0
182 Tuvalu 46.0
183 Uganda 21.9
184 Ukraine 53.0
185 United Arab Emirates 94.8
186 United Kingdom 94.8
187 United States 76.2
188 Uruguay 66.4
189 Uzbekistan 46.8
190 Vanuatu 24.0
191 Vatican n/a
192 Venezuela 60.0
193 Viet Nam 46.5
194 Yemen 24.6
195 Zambia 25.5
196 Zimbabwe 23.1
Notes: The table includes ITU Member States. * Palestine is not an ITU Member State; the status of Palestine in ITU is the subject of Res. 99 (Rev., Busan 2014) of the ITU Plenipotentiary Conference. n/a – not available. Source: ITU World Telecommunication/ICT Indicators Database.
Annex 2
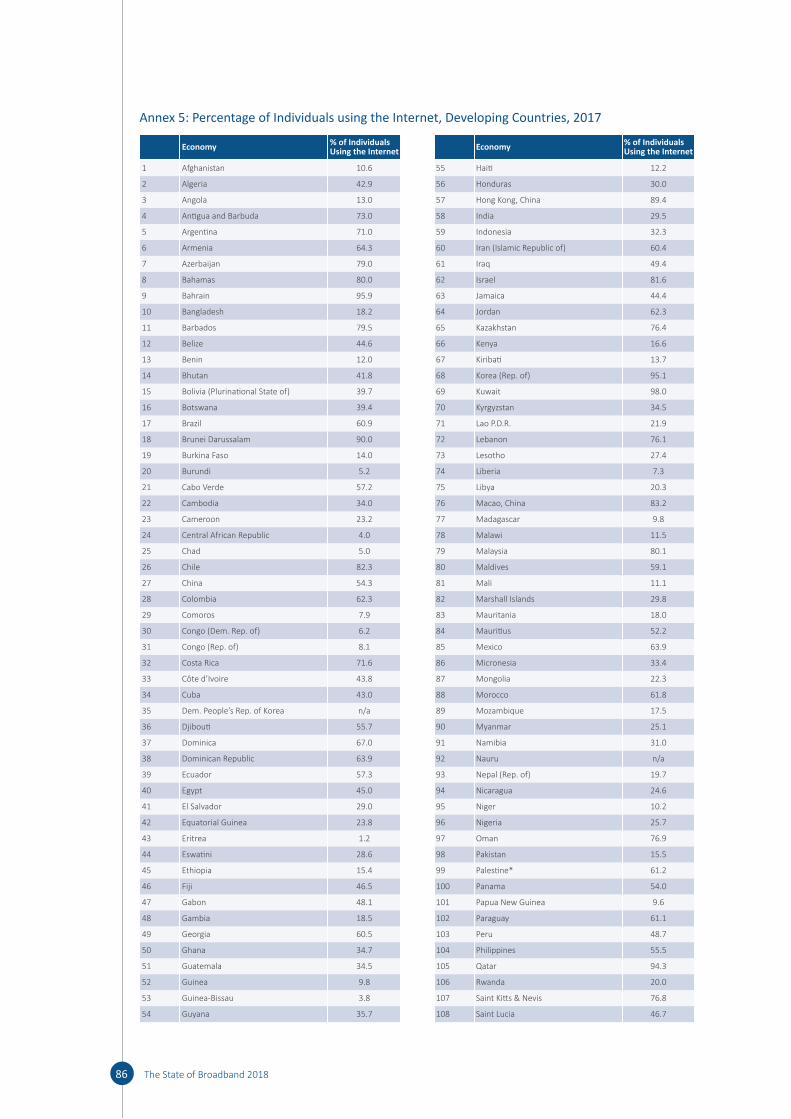
86 The State of Broadband 2018
Annex 5: Percentage of Individuals using the Internet, Developing Countries, 2017
Economy % of Individuals Using the Internet
1 Afghanistan 10.6
2 Algeria 42.9
3 Angola 13.0
4 Antigua and Barbuda 73.0
5 Argentina 71.0
6 Armenia 64.3
7 Azerbaijan 79.0
8 Bahamas 80.0
9 Bahrain 95.9
10 Bangladesh 18.2
11 Barbados 79.5
12 Belize 44.6
13 Benin 12.0
14 Bhutan 41.8
15 Bolivia (Plurinational State of) 39.7
16 Botswana 39.4
17 Brazil 60.9
18 Brunei Darussalam 90.0
19 Burkina Faso 14.0
20 Burundi 5.2
21 Cabo Verde 57.2
22 Cambodia 34.0
23 Cameroon 23.2
24 Central African Republic 4.0
25 Chad 5.0
26 Chile 82.3
27 China 54.3
28 Colombia 62.3
29 Comoros 7.9
30 Congo (Dem. Rep. of) 6.2
31 Congo (Rep. of) 8.1
32 Costa Rica 71.6
33 Côte d’Ivoire 43.8
34 Cuba 43.0
35 Dem. People’s Rep. of Korea n/a
36 Djibouti 55.7
37 Dominica 67.0
38 Dominican Republic 63.9
39 Ecuador 57.3
40 Egypt 45.0
41 El Salvador 29.0
42 Equatorial Guinea 23.8
43 Eritrea 1.2
44 Eswatini 28.6
45 Ethiopia 15.4
46 Fiji 46.5
47 Gabon 48.1
48 Gambia 18.5
49 Georgia 60.5
50 Ghana 34.7
51 Guatemala 34.5
52 Guinea 9.8
53 Guinea-Bissau 3.8
54 Guyana 35.7
Economy % of Individuals Using the Internet
55 Haiti 12.2
56 Honduras 30.0
57 Hong Kong, China 89.4
58 India 29.5
59 Indonesia 32.3
60 Iran (Islamic Republic of) 60.4
61 Iraq 49.4
62 Israel 81.6
63 Jamaica 44.4
64 Jordan 62.3
65 Kazakhstan 76.4
66 Kenya 16.6
67 Kiribati 13.7
68 Korea (Rep. of) 95.1
69 Kuwait 98.0
70 Kyrgyzstan 34.5
71 Lao P.D.R. 21.9
72 Lebanon 76.1
73 Lesotho 27.4
74 Liberia 7.3
75 Libya 20.3
76 Macao, China 83.2
77 Madagascar 9.8
78 Malawi 11.5
79 Malaysia 80.1
80 Maldives 59.1
81 Mali 11.1
82 Marshall Islands 29.8
83 Mauritania 18.0
84 Mauritius 52.2
85 Mexico 63.9
86 Micronesia 33.4
87 Mongolia 22.3
88 Morocco 61.8
89 Mozambique 17.5
90 Myanmar 25.1
91 Namibia 31.0
92 Nauru n/a
93 Nepal (Rep. of) 19.7
94 Nicaragua 24.6
95 Niger 10.2
96 Nigeria 25.7
97 Oman 76.9
98 Pakistan 15.5
99 Palestine* 61.2
100 Panama 54.0
101 Papua New Guinea 9.6
102 Paraguay 61.1
103 Peru 48.7
104 Philippines 55.5
105 Qatar 94.3
106 Rwanda 20.0
107 Saint Kitts & Nevis 76.8
108 Saint Lucia 46.7
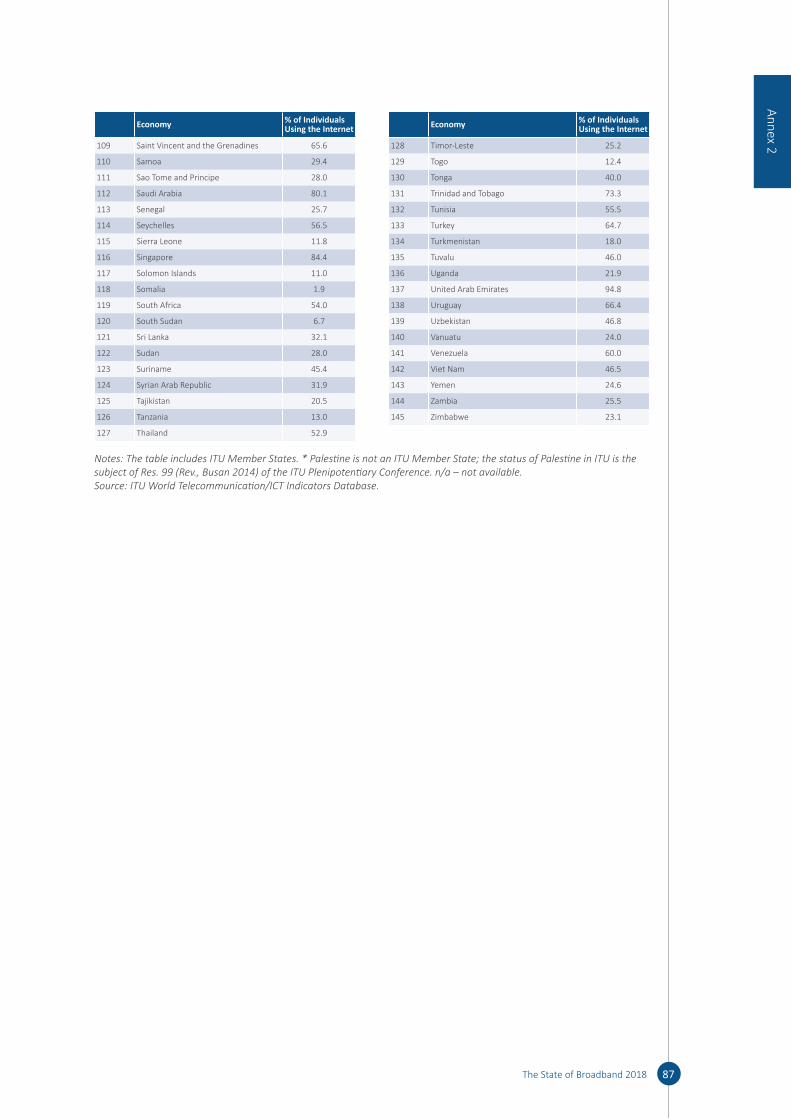
The State of Broadband 2018 87
Economy % of Individuals Using the Internet
109 Saint Vincent and the Grenadines 65.6
110 Samoa 29.4
111 Sao Tome and Principe 28.0
112 Saudi Arabia 80.1
113 Senegal 25.7
114 Seychelles 56.5
115 Sierra Leone 11.8
116 Singapore 84.4
117 Solomon Islands 11.0
118 Somalia 1.9
119 South Africa 54.0
120 South Sudan 6.7
121 Sri Lanka 32.1
122 Sudan 28.0
123 Suriname 45.4
124 Syrian Arab Republic 31.9
125 Tajikistan 20.5
126 Tanzania 13.0
127 Thailand 52.9
Economy % of Individuals Using the Internet
128 Timor-Leste 25.2
129 Togo 12.4
130 Tonga 40.0
131 Trinidad and Tobago 73.3
132 Tunisia 55.5
133 Turkey 64.7
134 Turkmenistan 18.0
135 Tuvalu 46.0
136 Uganda 21.9
137 United Arab Emirates 94.8
138 Uruguay 66.4
139 Uzbekistan 46.8
140 Vanuatu 24.0
141 Venezuela 60.0
142 Viet Nam 46.5
143 Yemen 24.6
144 Zambia 25.5
145 Zimbabwe 23.1
Notes: The table includes ITU Member States. * Palestine is not an ITU Member State; the status of Palestine in ITU is the subject of Res. 99 (Rev., Busan 2014) of the ITU Plenipotentiary Conference. n/a – not available. Source: ITU World Telecommunication/ICT Indicators Database.
Annex 2
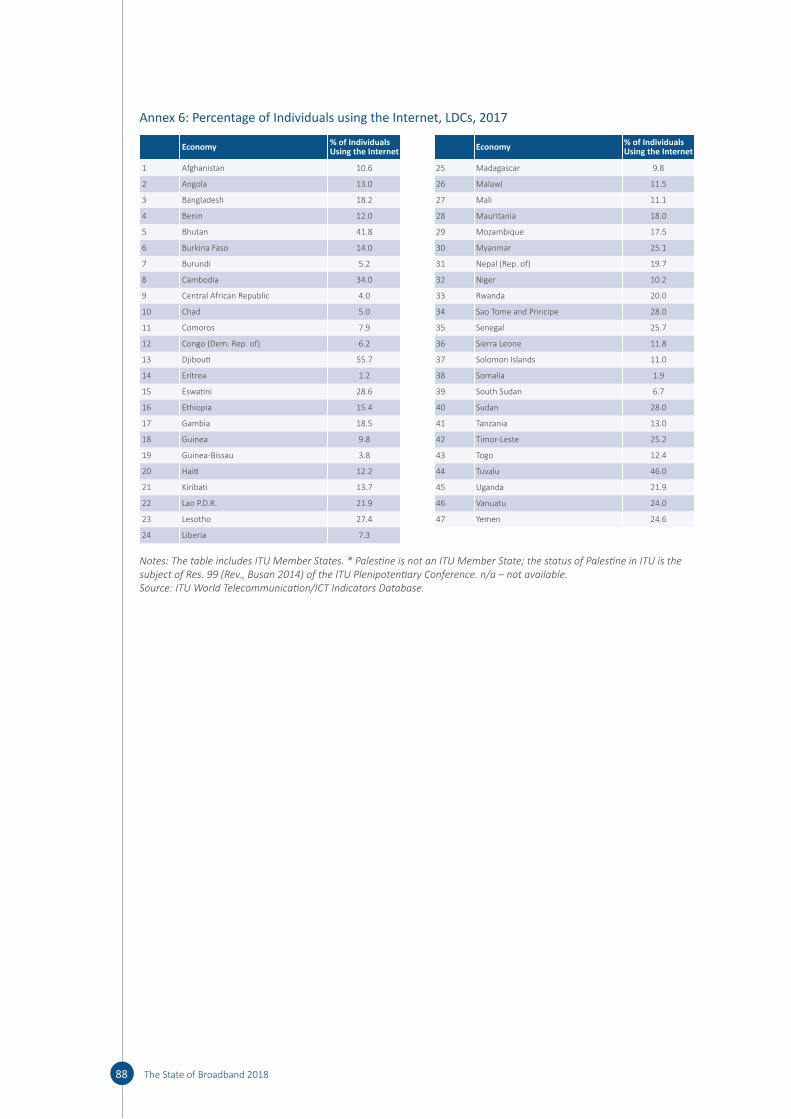
88 The State of Broadband 2018
Annex 6: Percentage of Individuals using the Internet, LDCs, 2017
Economy % of Individuals Using the Internet
1 Afghanistan 10.6
2 Angola 13.0
3 Bangladesh 18.2
4 Benin 12.0
5 Bhutan 41.8
6 Burkina Faso 14.0
7 Burundi 5.2
8 Cambodia 34.0
9 Central African Republic 4.0
10 Chad 5.0
11 Comoros 7.9
12 Congo (Dem. Rep. of) 6.2
13 Djibouti 55.7
14 Eritrea 1.2
15 Eswatini 28.6
16 Ethiopia 15.4
17 Gambia 18.5
18 Guinea 9.8
19 Guinea-Bissau 3.8
20 Haiti 12.2
21 Kiribati 13.7
22 Lao P.D.R. 21.9
23 Lesotho 27.4
24 Liberia 7.3
Economy % of Individuals Using the Internet
25 Madagascar 9.8
26 Malawi 11.5
27 Mali 11.1
28 Mauritania 18.0
29 Mozambique 17.5
30 Myanmar 25.1
31 Nepal (Rep. of) 19.7
32 Niger 10.2
33 Rwanda 20.0
34 Sao Tome and Principe 28.0
35 Senegal 25.7
36 Sierra Leone 11.8
37 Solomon Islands 11.0
38 Somalia 1.9
39 South Sudan 6.7
40 Sudan 28.0
41 Tanzania 13.0
42 Timor-Leste 25.2
43 Togo 12.4
44 Tuvalu 46.0
45 Uganda 21.9
46 Vanuatu 24.0
47 Yemen 24.6
Notes: The table includes ITU Member States. * Palestine is not an ITU Member State; the status of Palestine in ITU is the subject of Res. 99 (Rev., Busan 2014) of the ITU Plenipotentiary Conference. n/a – not available. Source: ITU World Telecommunication/ICT Indicators Database.
The State of Broadband 2018 89
List of Acronyms and Abbreviations
AR Augmented Reality
ARPU Average Revenue Per User
CITC Communications and IT Commission of Saudi Arabia
DAU Daily Active Users
DFID UK Department for International Development
FCS Fundación Carlos Slim/Carlos Slim Foundation
FTTC Fibre-To-The-Cabinet
FTTH Fibre-To-The-Home
FTTS Fibre-To-The-Street
GSMA GSM Association
HTS High-Throughput Satellite (satellite system)
ICT Information and Communication Technology
IMDA Infocomm Media Development Authority of Singapore
IoT Internet of Things
ITSO International Telecommunication Satellite Organization
ITU International Telecommunication Union
LDCs Least Developed Countries
LMICs Low- and Middle-Income Countries
M2M Machine To Machine
MAU Monthly Active Users
MLC Media Literacy Council (of Singapore)
MNOs Mobile Network Operators
MSMEs Micro-, Small- and Medium-Sized Enterprises
NBP National Broadband Plan
NCDs Non-Communicable Diseases
NGSO Non-Geostationary Satellite Orbit
OECD Organisation for Economic Cooperation and Development
OERs Open Educational Resources
PUE Power Usage Effectiveness
QoE Quality of Experience
QoS Quality of Service
RoW Right of Way
SMEs Small- and Medium-Sized Enterprises
TCO Total Cost of Ownership
TESSA Teacher Education for Sub-Saharan Africa
UHC Universal Health Coverage

90 The State of Broadband 2018
USF Universal Service Fund
VR Virtual Reality
WUE Water Usage Effectiveness
WWF World Wildlife Fund
2G Second-generation mobile
3G Third-generation mobile
4G Fourth-generation mobile
5G Fifth-generation mobile

broadbandcommission.orgPublished in Switzerland
Geneva, 2018
International Telecommunication
UnionPlace des Nations
CH-1211 Geneva 20Switzerland
Pho
to C
red
it: S
hutt
erst
ock
The State of Broadband: Broadband catalyzing
sustainable developmentSeptember 2018
9 7 8 9 2 6 1 2 6 4 3 1 4
ISBN 978-92-61-26431-4


![[PPT]CAD Introduction - Faculty Server Contact | UMass Lowellfaculty.uml.edu/bkim/22.201/CAD Introduction.ppt · Web viewCAD Introduction Author Kim, Byungki Last modified by Kim,](https://img.pdfslide.us/doc/110x75/5b50fe257f8b9ad8118b7511/pptcad-introduction-faculty-server-contact-umass-introductionppt-web.jpg)