Embed Size (px)
Citation preview
1
Tourism Geographies 2018
https://doi.org/10.1080/14616688.2018.1457076
From Central Place to Central Flow Theory
-----An Exploration at the City Scale of Urban Catering Industry, Nanjing, China
Feifei Xua, Feng Zhenb, Xiao Qingb, Xia Wangc , Fang Wangd
aSchool of Humanities, Southeast University, Nanjing, China; bSchool of Architecture and Urban Planning,
5 Nanjing University, Nanjing, China; cSchool of Geographic and Oceanographic Sciences, Nanjing University,
Nanjing, China; dCollege of Architecture and Landscape Architecture, Peking University, Beijing, China
Abstract
The research shift from Central Place Theory to Central Flow Theory has demonstrated the influence
of information technology on cities. The study explores this shift at the city scale of urban catering
industry in Nanjing, China. A comprehensive set of indicators of E-WoM for the catering industry
has been established. Based on this, the spatial distribution patterns of catering industry in Nanjing,
China have been discussed to examine the relationship of restaurants distribution and the Central
Place Theory or the Central Flow Theory using a data analytical approach. The results revealed that
the spatial distribution of restaurants’ density in Nanjing follows a traditional Central Place Theory,
but the spatial distribution of restaurants’ E-WoM in Nanjing rather follows the Central Flow Theory.
In addition, different characteristics could be found in different types of restaurants’ E-WoM
distribution. Mainstream cuisine follows Central Place Theory but is inconsistent in urban business
districts, which demonstrate some characteristics of Central Flow Theory. The distribution of E-
WoM of non-mainstream cuisine is similar to the E-WoM distribution of overall restaurants,
showing a central flow pattern. Finally, the implications of the study are drawn.
Key words: Central Place theory; Central Flow theory; catering industry; spatial distribution; data
analytical approach; Nanjing
1. Introduction
Central Place Theory indicates that residents tend to visit the nearest city to buy goods and services
when they are restricted by market, transportation, and administration (Christaller, 1933). Urban
development presents a strict hierarchal distribution. However, the development of regions and
cities has no longer been analyzed in a closed system because of globalization. Cities became closely
2
linked due to the development of a comprehensive transportation network, therefore leading to the
formation of a complicated urban network. In this process, the development and extensive use of
information communication technology (ICT) have accelerated the exchanges of information,
population, capital, goods, and other elements among cities (Zhen et al., 2012a). Castells (1989)
focused on the emergence of a new technology paradigm with the influence of ICT and proposed
the concept of “flow space”. He also distinguished flow space and place space, as well as expanded
the flow space from pure virtual technology space to geographical space and social network scale
(Castells, 1996). Taylor et al. (2001, 2008, 2010) further found that the level of spatial distribution
of “Central Place” theory has evidently been changed by “Central Flow” theory. They suggested
that the vibrant city is the center of the spatial flow, and the complexity of the flow is evident in
non-local characteristics of the city population, goods and ideas. The hinterland of the city may not
be adjacent to a certain range of space, but the distribution tends to be fragmented.
In order to adapt to this trend of fast change, scholars have gradually found the new breakthrough
in paradigm, content and method of research, which outstandingly uses network information data to
study flow space and place space (Zhen et al. 2015). They focused on the regional urban network
and their flow patterns by analyzing the Network infrastructure data (e.g., backbone network
bandwidth and network number, internet domain name or IP address) (Zook, 2001; Wang et al, 2003;
Wang et al, 2006; Zook and Graham, 2007), social network data (e.g., Twitter, Weibo) (Naaman et
al, 2012; Zhen et al, 2012), and mobile phone data (Krings et al., 2009; Kang et al., 2012). However,
these theories and methods were mainly used to explain interactions between the cities, and research
on the spatial distribution of production factors within the city is limited. Several questions remain
unexplored. Do the spatial patterns of production factors within a city follow the rules of central
place theory? Can the central flow theory be used to explain new phenomenon? Does the new
phenomenon demonstrate the features of central flow theory at regional scale? Can traditional data
on urban interior space support and explain the new phenomenon? Is there any new dataset to
explain these phenomenon? Therefore, these research questions need further exploration.
Due to the fast development of information technology, especially the ICT platforms such as
dianping.com (a Chinese website that allows users to buy coupons and post review comments on
food and dining experiences), consumers’ behavior of dinning in restaurants based on the Central
Place Theory has changed (Lien-Ti Bei, et al., 2004). On one hand, the information about restaurants
on the platform has given consumers more choices, providing more dining flexibility and expanded
the scope of their activities (Qin, et al., 2014). On the other hand, comments made by other
consumers on the review websites (positive or negative) also change the spatial and temporal
behavior of consumers’ dining activities. It is precisely these forces (Eckardt, 2008) that may lead
to the change of distribution of those restaurants that traditionally followed urban business districts,
creating more mobility for consumers. As can be seen, after the emergence of new internet platforms,
the spatial distribution of the traditional catering industry might change. Traditional central place
theory that reflect the rule of spatial distribution of urban catering industry might change the
decision making and consuming behavior, and the spatial distance between organizations might
increase. Therefore, this paper uses urban catering space which has significantly been influenced by
new technology as a study object, and explores Nanjing, China as the case area. The paper tries to
explore the application of central place theory and central flow theory in production elements within
3
the city with the influence of new technology. Current studies on catering industry mainly adopt
traditional methods, which include the use of spatial and statistical data such as catering location,
scale, price, spatial and statistical data and explore the spatial distribution pattern and its
determinants at urban macro level; or the use of consumer word of mouth information through
questionnaires to evaluate the service quality of catering providers with a relatively limited sample.
However, these types of data, which reflect the spatial information, lack information on catering
flow space, which is actually reflected by consumers’ and catering providers’ behavior with new
platforms. In recent years, E-WoM which refers to electronic word of mouth (King, Racherla and
Bush 2014) has gradually become an important factor influencing consumer behavior (Berger, 2014),
and can be used to reflect urban catering providers’ attractiveness to consumer behavior without the
constraint of spatial distance.
This paper uses Nanjing, China as a case study, using E-WoM from online reviews, to discuss the
spatial pattern of urban catering industry and to explore the application and new features of central
place theory and central flow theory at urban scale. To be specific, the research questions include:
1) what is the E-WoM of urban catering industry in Nanjing? 2) What is the spatial pattern of urban
catering providers and its relationship with central flow theory in Nanjing? 3) What is the spatial
pattern of E-WoM of urban providers and its relationship with central place theory, and whether it
fits with the features of regional urban network of central flow theory in Nanjing? 4) Do different
types of catering providers’ E-WoM reflect the providers distribution pattern?
2. Literature review
2.1 From Central Place Theory to Central Flow Theory
Since Christaller's Central Place Theory was proposed in 1933 (Christaller, 1933), location and
spatial distribution pattern of urban service industry have always been a research focus. The research
scope mainly involves Commercial Service Industry and Productive Service Industry. Christaller
(1933) suggests that customers will travel only to the nearest central place that provides goods and
services that they demand, and goods are purchased from the closest place. Yuan, Wei and Chen
(2010) conclude that classical location theory emphasizes on economic factors and suggest that
labor costs and market opportunities are critical. Ohlin (1933) suggests that the Neo-classical trade
theory introduces exogenous factors such as natural resources, labor and technology to the location
selection. New economic geography theory suggests that connections to other businesses and traffic
costs lead to a cluster of businesses (Krugman, 1991).
Globalization has made the cities no longer a closed local system separated from others, as a
comprehensive transportation network has made cities and facilities closely linked, forming a
dynamic regional urban network (Zhen et al, 2007). Researchers have now modified the ideal
hierarchical central place model. Through a study on Northeast America, Gottmann (1961) finds
‘horizontal and non-hierarchical, polycentric’ network pattern in urban areas, which contains two or
more than two separated cities, and is connected with fast and convenient traffic corridors,
emphasizing the node role of cities in the network rather than the central role(Batten, 1995).
Camagni and Salone(1993)suggest that different from critical factors in Central Place Theory,
4
such as economic scale, production scale, demand and market scale; the micro economy and local
enterprises network is the driving factor of urban regions (Camagni and Salone, 1993; Batten 1995;
Knaap 2002; Meijers 2006).
In recent decades, the rapid development and wide application of ICT has brought the speedy
exchange of factors at spatial and temporal levels, such as information, population, capital and goods
in the city (Schwanen et al., 2006), which has continuously expanded the scope of urban production
and residents’ activities, as a result the urban network model is continuously improved. Castells
(1989)was one of the first who focused on the emergence of new technology paradigm under the
influence of information technology, emphasizing the importance of information processing and
process innovation, and put forward the concept of ‘flow space’ based on information technology.
Castells(1996)further distinguishes flow space and place space, and expands the flow space from
pure virtual technology space to geographical space and social network scale. Therefore, based on
theories of Camagni and Salone (1993) and Castells (1996), Taylor et al. (2001, 2008, 2010) further
use the interlocking network model to evaluate the relationship between cities. They find that the
level of spatial distribution of ‘Central Place’ theory has obviously been changed by the ‘Central
Flow’ theory, such that the vibrant city is the center of the spatial flow, and stress the complexity of
the flow, which is non-local characteristics of the city population, goods and ideas. The hinterland
of the city may not be adjacent to a certain range of space, but the distribution tends to be fragmented.
However, urban network model or Central Flow Theory cannot replace Central Place Theory, as the
former represents the spatial characteristics of urban regions in the service economy while the latter
explains the relationship of cities in industrial economy (Camagni and Salone,1993; Batten,1995;
Knaap, 2002; Meijers, 2006). To be specific, with the background of globalization and
informatization, the following features appear in regional space: 1)The role of the central area has
not disappeared, and the urban or regional space still has a certain hierarchy;2) cities with large
population and commodities might not have a high grade in the region, while cities that act as the
hub or important node function of regional population and commodity flow network will become a
higher grade center; 3) the spatial gathering effect of the traditional geographical factors is weakened,
the dispersion effect is enhanced, the regional center develops independently, and the fragmentation
of the urban hinterland becomes obvious.
The urban network model and Central Flow Theory originate from Central Place Theory, and both
are expansions and improvements of Central Place Theory at different stages of urbanization and
technology development, and explore the relationship of urban production factors and spatial
distance in a certain region (Smith, 1985). However, these theories are mainly used to explain
interactions between the cities, and research on the spatial distribution of production factors within
a city is limited or in other words, there is need to study further these features of Central Flow theory
which can be found within cities.
2.2 The spatial distribution of the catering industry
First, a definition of the catering industry is provided before any further discussion. Catering refers
to “the provision of food and beverages away from home” (Davis et al.,1998). Smith and West (2003)
5
and Fusi (2016) divide catering sectors into profit and non-profit activities. Bourlakis and
Weightman, (2004) suggest that the profit catering sectors include restaurants, fast-food chain
outlets, cafes, takeaways, pubs, leisure and travel catering outlets, while the non-profit sectors refer
to catering outlets for business, education and health care (Fusi, 2016). In this research, only the
profit sectors have been considered, therefore the study objects in this research website include
restaurants, cafes, fast-food chain outlets, cafes and takeaways which are available from the online
platform of dianping.com.
With the guidance of traditional Central Place Theory, the spatial distribution of food and beverage
industry is a research topic that scholars pay close attention to. Similar to the spatial distribution of
other service industries (Zhou et al., 2010; Zhen et al., 2012), most scholars believe that the
distribution of urban restaurants follows the rule of falling from the city's Central Business Districts
(CBD) to the periphery areas. There are aggregated clusters and territorial distribution within each
area (Gwohshiung et al. 2002; Zhang and Xu, 2009), and generally speaking, these are closely
related to traffic routes (Hu and Zhang, 2002). Meanwhile, the level of restaurants and the
development level of business districts show high coupling (Zhang and Xu, 2009). Muller and
Inman (1994) believe that urban restaurants mainly scatter in the urban retail areas, and are customer
oriented. Restaurants that are located near each other form a broad central system, and are linked
with urban retail and residential areas. Many factors have been found critical to the spatial
distribution of restaurants at the city level, such as traffic accessibility (Melaniphy, 1992;Austin
et al., 2005), urban spatial pattern, economic development (Liang, 2007; Zhang and Xu, 2009;
Shu et al, 2012), population density (Liang, 2007; Shu et al, 2012), infrastructure (Hu and Zhang,
2002; Austin et al., 2005), market demand (Smith, 1995; Hu and Zhang, 2002), cultural factors
(Liang, 2007; Zhang and Xu, 2009), land availability (Shu et al, 2012), density of competitors (Litz
and Rajaguru, 2008), number of complementary stores (Schaefer et al., 1996),land price (Hu and
Zhang, 2002) and urban tourism activities (Liang, 2007). Other factors at the restaurant level include;
scale and cost (Smith, 1995; Timor and Sipahi, 2005; Shu et al., 2012), type of restaurant (Teller
and Reutterer, 2008; Zhang and Xu, 2009), parking facilities (Tzeng et al., 2002) and identity
(Schaefer et al., 1996; Melaniphy, 1992).
It can be seen that current research on restaurants’ spatial distribution pattern mainly focus on scales
and levels of restaurants, and the distribution patterns of ‘circular diminishing, closely related to
traffic arteries, coupling with retail trades’ can be explained by Central Place Theory. However,
there is very limited research on restaurants’ distribution and Central Flow Theories considering the
influence of ICT. Researchers mainly discuss the factors that influence restaurants’ location at the
city level, but hardly consider the restaurants quality. Indeed, except the factors such as scale, cost,
type, parking facilities and identity, other factors such as customer preference, type of food,
atmosphere, service, decoration, reputation, brand, value, may all influence the choice of restaurants
(Kivela, 1997; Yuksel and Yuksel, 2003; Baek et al., 2006; Kincaid et al., 2010). These are critical
factors influencing the spatial distribution of urban restaurants.
2.3 E-WoM
Hospitality is part of the service industry. Researchers suggest consumers often rely heavily on
6
friends and family when they try a new type of service, and therefore, word of mouth (WoM) as an
influential factor can influence consumer decision making (Anderson, 1998; Brown et al, 2007).
Traditionally, marketing communication is passed and benefited through family and friends (Brown
and Reingen, 1987). Nowadays, the internet is regarded as the most innovative technology over the
last few decades (Beldad et al 2010). With the fast development of internet, particularly the web 2.0
which allows customers to share their experiences and comments online, WoM has now shifted to
E-WoM, expanding networking from family and friends to people who are connected online. Hart
and Blackshaw (2006) suggest that compared with traditional word of mouth, “Word of Web” can
include a social network that spans globally. E-WoM provides browsers with wider information,
their views on the tangible products based on their memories of past time leisure experiences in
tourism cities, hotels, airlines and restaurants (Yoon, 2009). Senecal and Nantel (2004) suggest that
consumers show a tendency of making purchases following online recommendations. Zhu and
Zhang (2012) also suggest that online recommendations significantly influence sales. Gretzel and
Yoo’s (2008) research suggest that three-quarters of travelers have taken consideration of online
consumer reviews when planning their holiday journeys.
E-WoM has become popular and become a key source of information about specific products (Litz
and Rajaguru, 2008; Hollenstein & Purves, 2010). Beverly and Browning (2010) indicate that
consumers prefer easy-to-access and easy-to-process information online.
Catering is the sub-industry of commercial industry, its commercial tenant is a significant part of
urban entity space, and a necessary and fundamental link of urban space units. Although there are
many studies on spatial distribution features of urban catering tenants, research methods and data
collection used are straightforward, and not enough attention has been paid on flow space and its
spatial distribution pattern. With the popularization of network information technology, e-commerce
is gradually changing the way of traditional marketing. It has increasingly become a significant
factor that influence consumer decision-making, it may also influence catering provider’s spatial
distribution. E-commerce can be used to reflect the mobility (flow) of consumer dinning behavior
without the limitation of spatial distance. Therefore, understanding spatial distribution pattern of
urban catering industry and its E-WoM will be good explorations of Central Place Theory and
Central Flow Theory.
2.4 Study Area
Nanjing is one of the core cities of the Yangtze River Delta urban agglomeration, and its spatial
pattern shows a typical multi-center hierarchical structure. According to the Nanjing Statistical
Yearbook (2016), as at the end of 2015, Nanjing has a total population of 8.23 million people.
Nanjing has 27 business districts which include Xinjiekou, Hunan Road/Shanxi Road area,
Confucius temple area, the Zhujiang Road area, the Taiping road area, the Ruijin Road area, Nanjing
University/Nanjing Normal University area, Caochangmen/Longjiang area, Xuanwu Lake Park area
and the Sanpailou area. According to the Master Plan of Nanjing (2011-2020)①
, which provides the
overall evaluation of a trading area according to its population scale and density, economic output,
land price, infrastructure etc., Xinjiekou is regarded as the highest grade trading area in the city, the
7
second highest grade areas include Hunan Road/Shanxi Road area, Confucius temple area, and the
Zhujiang Road areas. Areas along the Taiping road, the Ruijin Road, Nanjing University/Nanjing
Normal University area, Caochangmen/Longjiang and Xuanwu Lake Park area are district business
centres.
Established in April, 2003, Dianping.com is the earliest established third-party review website in
China. The website establishes its pattern mainly with reference to Zagat Survey of the US.
Registered members are able to post their comments freely on the website after their consumption
in a restaurant, to provide objective and precise commentary information for potential customers.
Till the third quarter of 2015, active users of dianping.com were over 200 million every month, the
number of comments were over 100 million, the number of restaurants providers were over 20
million and it covered more than 250 cities in whole China, and had almost 20 billion monthly page
views1. The website mainly includes information of services in the city such as food, leisure and
recreation, and shopping, together with related activity sections such as coupons, groupons, and
check-in deals. The section on catering, has the most comment information, forming an enormous
database of E-WoM that can influence decision-making in dining.
3. Methodology
Big data method is a full sample method based on data mining, and the data processing of relevant
information recorded on the object, and the analysis of patterns is at a larger scale (Zhen et al. 2015).
Applied to the studies of catering industries’ spatial pattern; on one hand, big data can be used to
understand urban dining space and distribution pattern in real time through restaurants location,
reduce the limitation in slow data updating, and small sample restrictions of traditional research
methods such as questionnaires or interviews. On the other hand, consumers can also use the
evaluation score of each restaurant, to understand the overall development of the quality of the
catering industry, compensating the missing information of restaurants such as quality, reputation,
user preference in a traditional method.
3.1 Data collection
Firstly, based on the internal standard of dianping.com, namely, "overall evaluation star level", we
removed comment information of 10, 520 catering providers that haven't acquired evaluation star
level. This is because 1) the restaurants may have low reputation, invalid information, and repeated
registration; therefore, scored 0 on many indicators, making it hard to make calculations in the final
model; 2)these restaurants have less attention and comments from consumers mainly because they
are usually small in scale. As a result, 3, 645 valid catering providers remained. Both customer
reviewers and restaurant data were collected. Such as reviewer’s comments data include: Dish score
(1-30 points), Atmosphere score (1-30 points), Service score (1-30 points), Per capita consumption,
Star-levels of overall comments (1-5 stars). The score was given by customers and calculated by the
website itself. The restaurant data include: the Number of web page visitors, Number of comments,
Number of comments (credible), Number of comments by group buying, Number of interested
1 http://www.dianping.com/aboutus
8
people, Number of check-ins, Number of recommended dishes, Number of atmosphere comments,
Number of special service (e.g., WiFi, parking space) comments, Number of branches. These data
were collected from the website. Secondly, we quantized text data, such as ‘average spending 50
RMB’, “three star” in the overall score, and number of franchises. Information such as ‘average
spending 50 RMB’ ‘three star’ were calculated by the website itself (usually the average mean score)
based on review scores. Data was then entered into EXCEL 2007, SPSS 20 and ArcGIS. Then, on
the basis of catering providers' detailed address we built up a database of catering providers’ spatial
location combined with Google Maps. It is important to note that no star evaluation does not
represent poor service quality, but mainly indicates that lower attention was paid by customers on
such catering providers. There is no secondary comments that were excluded from the data analysis.
All data was collected from the website. The time range for the comments were collected from 2003
(since the website was created) to 30 Aug, 2016.
3.2 Establishment of E-WoM evaluation index system
Based on the availability of the data and the previous studies (Kivela, 1997; Yuksel and Yuksel,
2003;Baek et al., 2006; Kincaid et al., 2010; Tao et al., 2011), we establish an E-WoM evaluation
index system for classifying and screening data we obtained, from 6 aspects of comments on
restaurants, namely; popularity, dish quality, atmosphere, service quality, scale and grade, and level
(Table 1). There are 15 indicators at the second level: X1 is the total visit by customers, referring to
the total number of visits, customers have made to the website of a restaurant;;X2 is the total number
of comments, referring to the total number of comments made by customers;X3 is the default
number of comments, referring to the reliable comments through web screening; X4 is the number
of group comments, meaning the number of comments from those who bought group coupons from
the website;X5 is customer favorite rate, referring to the number of customers who rate the
restaurant as their favorite; X6 is check-ins, referring to the number of customers who visit the
restaurants through the website of dianping.com;X7 is the overall rating of dishes by customers
(scored 1-30);X8 is the total number of recommended dishes, referring to the total number of
recommended dishes in a restaurant by customers(the website provides rating buttons for all dishes
in the restaurant, and customers click on a particular dish to recommend it);X9 is the general
atmosphere, referring to the score of general atmosphere in the restaurants by customers(1-30);
X10 is the total number of atmosphere type rating,( the website provides voting buttons of
atmosphere type such as business gathering, friends gathering, family gathering, etc., each time a
customer clicks on a certain atmosphere and is supposed to be evaluated once);X11 is the total
score of services, referring to customer rating of restaurant service(1-30);X12 is the total number
of comments on special services,thus the total number of comments by customers (the website
provides rating buttons for special services such as WIFI, parking etc., each time a customer clicks
on a certain atmosphere and is supposed to be evaluated once);X13 is the average consumption
per person;X14 is the number of branches, referring to the number of branches of this restaurant in
Nanjing;X15 is the general star rating of customers,thus the total rating of the restaurants by
customers. We believe that E-WoM should not only include the direct comments (scores or star
rating on the web by users) on food, service, environment etc., but also include the attention from
consumers. Generally speaking, restaurants with good E-WoM would attract more attention from
consumers (such as, websites browsed, comments made, dishes recommended, service
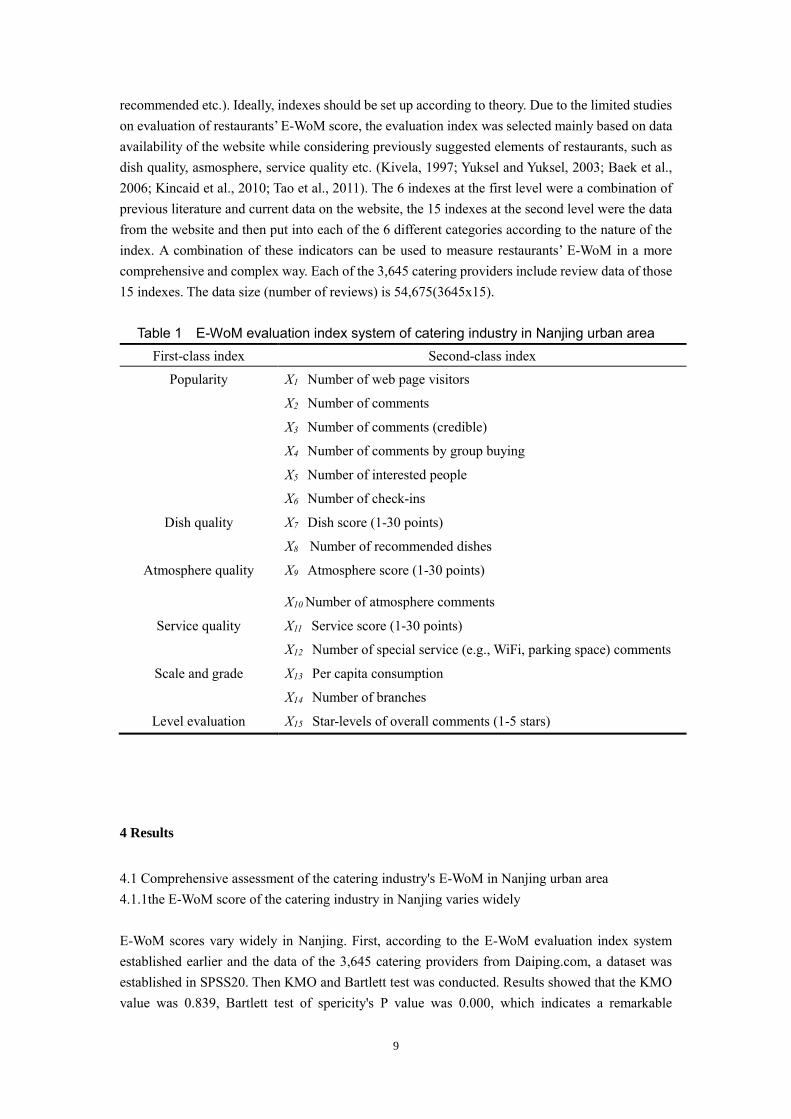
9
recommended etc.). Ideally, indexes should be set up according to theory. Due to the limited studies
on evaluation of restaurants’ E-WoM score, the evaluation index was selected mainly based on data
availability of the website while considering previously suggested elements of restaurants, such as
dish quality, asmosphere, service quality etc. (Kivela, 1997; Yuksel and Yuksel, 2003; Baek et al.,
2006; Kincaid et al., 2010; Tao et al., 2011). The 6 indexes at the first level were a combination of
previous literature and current data on the website, the 15 indexes at the second level were the data
from the website and then put into each of the 6 different categories according to the nature of the
index. A combination of these indicators can be used to measure restaurants’ E-WoM in a more
comprehensive and complex way. Each of the 3,645 catering providers include review data of those
15 indexes. The data size (number of reviews) is 54,675(3645x15).
Table 1 E-WoM evaluation index system of catering industry in Nanjing urban area
First-class index Second-class index
Popularity
X1 Number of web page visitors
X2 Number of comments
X3 Number of comments (credible)
X4 Number of comments by group buying
X5 Number of interested people
X6 Number of check-ins
Dish quality X7 Dish score (1-30 points)
X8 Number of recommended dishes
Atmosphere quality X9 Atmosphere score (1-30 points)
X10 Number of atmosphere comments
Service quality X11 Service score (1-30 points)
X12 Number of special service (e.g., WiFi, parking space) comments
Scale and grade X13 Per capita consumption
X14 Number of branches
Level evaluation X15 Star-levels of overall comments (1-5 stars)
4 Results
4.1 Comprehensive assessment of the catering industry's E-WoM in Nanjing urban area
4.1.1the E-WoM score of the catering industry in Nanjing varies widely
E-WoM scores vary widely in Nanjing. First, according to the E-WoM evaluation index system
established earlier and the data of the 3,645 catering providers from Daiping.com, a dataset was
established in SPSS20. Then KMO and Bartlett test was conducted. Results showed that the KMO
value was 0.839, Bartlett test of spericity's P value was 0.000, which indicates a remarkable
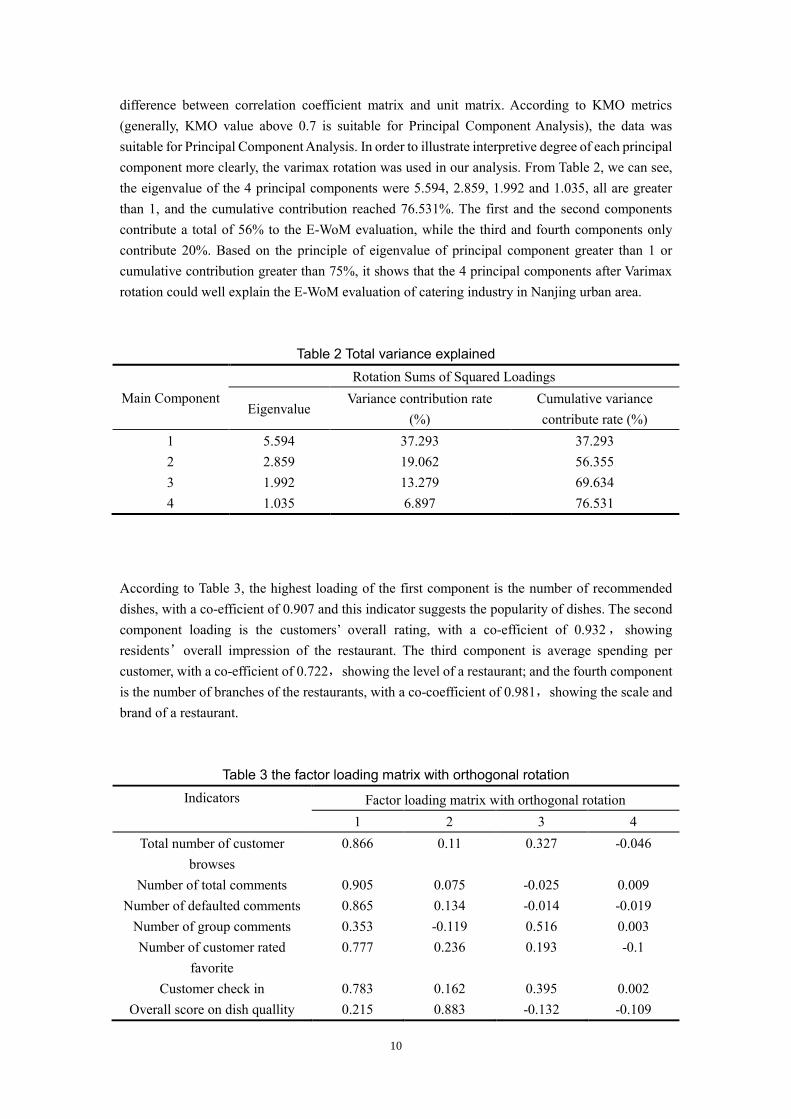
10
difference between correlation coefficient matrix and unit matrix. According to KMO metrics
(generally, KMO value above 0.7 is suitable for Principal Component Analysis), the data was
suitable for Principal Component Analysis. In order to illustrate interpretive degree of each principal
component more clearly, the varimax rotation was used in our analysis. From Table 2, we can see,
the eigenvalue of the 4 principal components were 5.594, 2.859, 1.992 and 1.035, all are greater
than 1, and the cumulative contribution reached 76.531%. The first and the second components
contribute a total of 56% to the E-WoM evaluation, while the third and fourth components only
contribute 20%. Based on the principle of eigenvalue of principal component greater than 1 or
cumulative contribution greater than 75%, it shows that the 4 principal components after Varimax
rotation could well explain the E-WoM evaluation of catering industry in Nanjing urban area.
Table 2 Total variance explained
Main Component
Rotation Sums of Squared Loadings
Eigenvalue Variance contribution rate
(%)
Cumulative variance
contribute rate (%)
1 5.594 37.293 37.293
2 2.859 19.062 56.355
3 1.992 13.279 69.634
4 1.035 6.897 76.531
According to Table 3, the highest loading of the first component is the number of recommended
dishes, with a co-efficient of 0.907 and this indicator suggests the popularity of dishes. The second
component loading is the customers’ overall rating, with a co-efficient of 0.932, showing
residents’overall impression of the restaurant. The third component is average spending per
customer, with a co-efficient of 0.722,showing the level of a restaurant; and the fourth component
is the number of branches of the restaurants, with a co-coefficient of 0.981,showing the scale and
brand of a restaurant.
Table 3 the factor loading matrix with orthogonal rotation
Indicators Factor loading matrix with orthogonal rotation
1 2 3 4
Total number of customer
browses
0.866 0.11 0.327 -0.046
Number of total comments 0.905 0.075 -0.025 0.009
Number of defaulted comments 0.865 0.134 -0.014 -0.019
Number of group comments 0.353 -0.119 0.516 0.003
Number of customer rated
favorite
0.777 0.236 0.193 -0.1
Customer check in 0.783 0.162 0.395 0.002
Overall score on dish quallity 0.215 0.883 -0.132 -0.109
11
Number of recommended dishes 0.907 0.063 0.004 0.005
Overall score on environment 0.09 0.613 0.659 0.119
Number of comments on
atmosphere
0.807 0.063 0.053 0.017
Overall score on services 0.082 0.793 0.462 0.049
Number of comments on special
services
0.614 0.063 0.458 -0.019
Average spending per person 0.002 0.247 0.722 -0.174
number of branches -0.039 -0.032 -0.089 0.981
Overall star rating of customers 0.144 0.932 0.134 -0.018
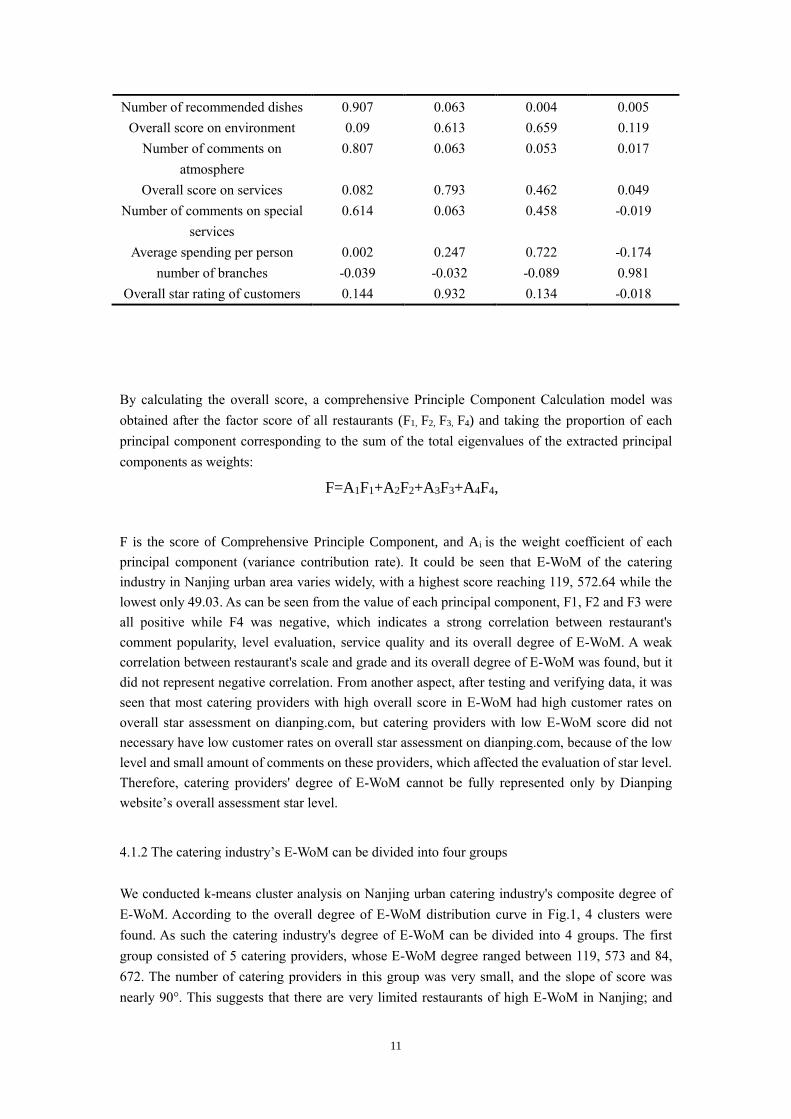
By calculating the overall score, a comprehensive Principle Component Calculation model was
obtained after the factor score of all restaurants (F1, F2, F3, F4) and taking the proportion of each
principal component corresponding to the sum of the total eigenvalues of the extracted principal
components as weights:
F=A1F1+A2F2+A3F3+A4F4,
F is the score of Comprehensive Principle Component, and Ai is the weight coefficient of each
principal component (variance contribution rate). It could be seen that E-WoM of the catering
industry in Nanjing urban area varies widely, with a highest score reaching 119, 572.64 while the
lowest only 49.03. As can be seen from the value of each principal component, F1, F2 and F3 were
all positive while F4 was negative, which indicates a strong correlation between restaurant's
comment popularity, level evaluation, service quality and its overall degree of E-WoM. A weak
correlation between restaurant's scale and grade and its overall degree of E-WoM was found, but it
did not represent negative correlation. From another aspect, after testing and verifying data, it was
seen that most catering providers with high overall score in E-WoM had high customer rates on
overall star assessment on dianping.com, but catering providers with low E-WoM score did not
necessary have low customer rates on overall star assessment on dianping.com, because of the low
level and small amount of comments on these providers, which affected the evaluation of star level.
Therefore, catering providers' degree of E-WoM cannot be fully represented only by Dianping
website’s overall assessment star level.
4.1.2 The catering industry’s E-WoM can be divided into four groups
We conducted k-means cluster analysis on Nanjing urban catering industry's composite degree of
E-WoM. According to the overall degree of E-WoM distribution curve in Fig.1, 4 clusters were
found. As such the catering industry's degree of E-WoM can be divided into 4 groups. The first
group consisted of 5 catering providers, whose E-WoM degree ranged between 119, 573 and 84,
672. The number of catering providers in this group was very small, and the slope of score was
nearly 90°. This suggests that there are very limited restaurants of high E-WoM in Nanjing; and
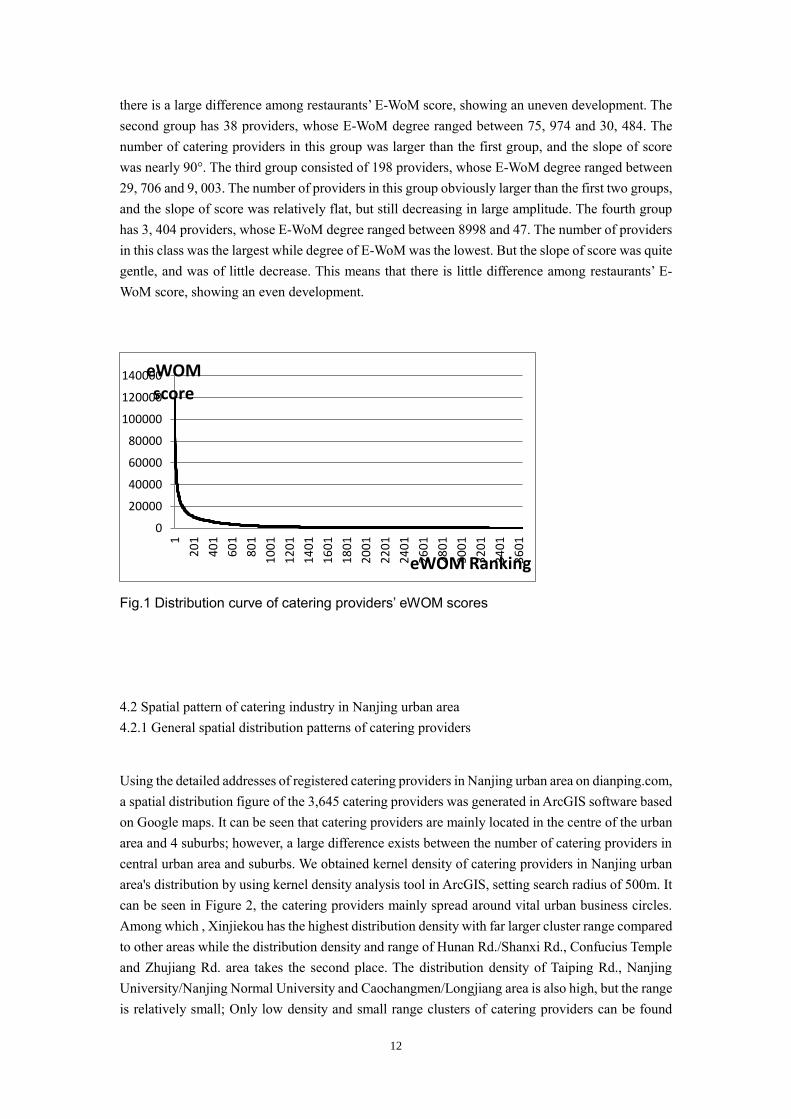
12
there is a large difference among restaurants’ E-WoM score, showing an uneven development. The
second group has 38 providers, whose E-WoM degree ranged between 75, 974 and 30, 484. The
number of catering providers in this group was larger than the first group, and the slope of score
was nearly 90°. The third group consisted of 198 providers, whose E-WoM degree ranged between
29, 706 and 9, 003. The number of providers in this group obviously larger than the first two groups,
and the slope of score was relatively flat, but still decreasing in large amplitude. The fourth group
has 3, 404 providers, whose E-WoM degree ranged between 8998 and 47. The number of providers
in this class was the largest while degree of E-WoM was the lowest. But the slope of score was quite
gentle, and was of little decrease. This means that there is little difference among restaurants’ E-
WoM score, showing an even development.
Fig.1 Distribution curve of catering providers’ eWOM scores
4.2 Spatial pattern of catering industry in Nanjing urban area
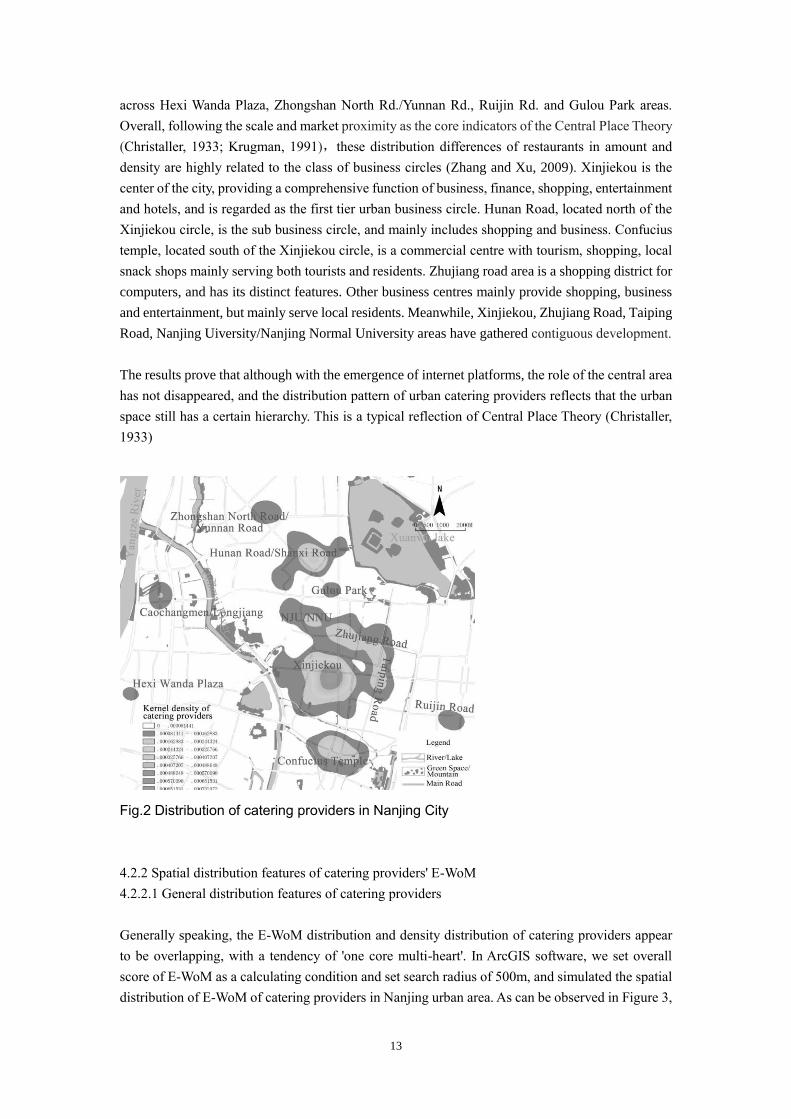
4.2.1 General spatial distribution patterns of catering providers
Using the detailed addresses of registered catering providers in Nanjing urban area on dianping.com,
a spatial distribution figure of the 3,645 catering providers was generated in ArcGIS software based
on Google maps. It can be seen that catering providers are mainly located in the centre of the urban
area and 4 suburbs; however, a large difference exists between the number of catering providers in
central urban area and suburbs. We obtained kernel density of catering providers in Nanjing urban
area's distribution by using kernel density analysis tool in ArcGIS, setting search radius of 500m. It
can be seen in Figure 2, the catering providers mainly spread around vital urban business circles.
Among which , Xinjiekou has the highest distribution density with far larger cluster range compared
to other areas while the distribution density and range of Hunan Rd./Shanxi Rd., Confucius Temple
and Zhujiang Rd. area takes the second place. The distribution density of Taiping Rd., Nanjing
University/Nanjing Normal University and Caochangmen/Longjiang area is also high, but the range
is relatively small; Only low density and small range clusters of catering providers can be found
0
20000
40000
60000
80000
100000
120000
140000
1
20
1
40
1
60
1
80
1
10
01
12
01
14
01
16
01
18
01
20
01
22
01
24
01
26
01
28
01
30
01
32
01
34
01
36
01
eWOM score
eWOM Ranking
13
across Hexi Wanda Plaza, Zhongshan North Rd./Yunnan Rd., Ruijin Rd. and Gulou Park areas.
Overall, following the scale and market proximity as the core indicators of the Central Place Theory
(Christaller, 1933; Krugman, 1991),these distribution differences of restaurants in amount and
density are highly related to the class of business circles (Zhang and Xu, 2009). Xinjiekou is the
center of the city, providing a comprehensive function of business, finance, shopping, entertainment
and hotels, and is regarded as the first tier urban business circle. Hunan Road, located north of the
Xinjiekou circle, is the sub business circle, and mainly includes shopping and business. Confucius
temple, located south of the Xinjiekou circle, is a commercial centre with tourism, shopping, local
snack shops mainly serving both tourists and residents. Zhujiang road area is a shopping district for
computers, and has its distinct features. Other business centres mainly provide shopping, business
and entertainment, but mainly serve local residents. Meanwhile, Xinjiekou, Zhujiang Road, Taiping
Road, Nanjing Uiversity/Nanjing Normal University areas have gathered contiguous development.
The results prove that although with the emergence of internet platforms, the role of the central area
has not disappeared, and the distribution pattern of urban catering providers reflects that the urban
space still has a certain hierarchy. This is a typical reflection of Central Place Theory (Christaller,
1933)
Fig.2 Distribution of catering providers in Nanjing City
4.2.2 Spatial distribution features of catering providers' E-WoM
4.2.2.1 General distribution features of catering providers
Generally speaking, the E-WoM distribution and density distribution of catering providers appear
to be overlapping, with a tendency of 'one core multi-heart'. In ArcGIS software, we set overall
score of E-WoM as a calculating condition and set search radius of 500m, and simulated the spatial
distribution of E-WoM of catering providers in Nanjing urban area. As can be observed in Figure 3,
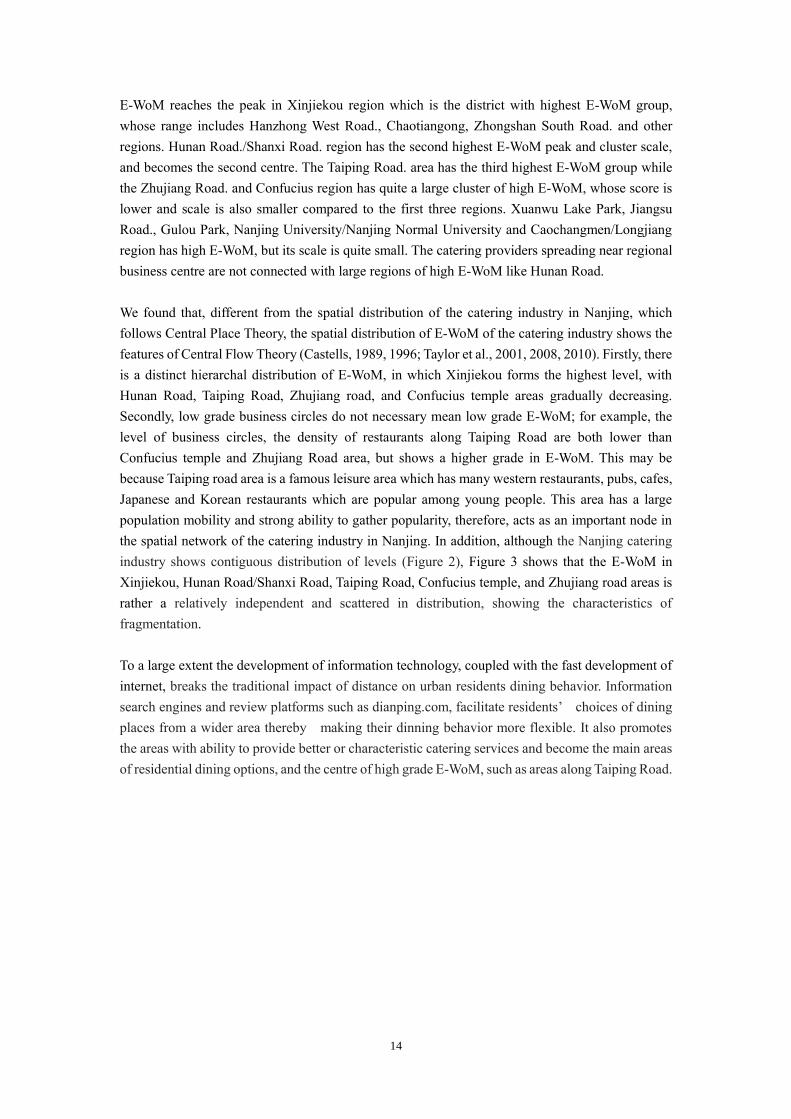
14
E-WoM reaches the peak in Xinjiekou region which is the district with highest E-WoM group,
whose range includes Hanzhong West Road., Chaotiangong, Zhongshan South Road. and other
regions. Hunan Road./Shanxi Road. region has the second highest E-WoM peak and cluster scale,
and becomes the second centre. The Taiping Road. area has the third highest E-WoM group while
the Zhujiang Road. and Confucius region has quite a large cluster of high E-WoM, whose score is
lower and scale is also smaller compared to the first three regions. Xuanwu Lake Park, Jiangsu
Road., Gulou Park, Nanjing University/Nanjing Normal University and Caochangmen/Longjiang
region has high E-WoM, but its scale is quite small. The catering providers spreading near regional
business centre are not connected with large regions of high E-WoM like Hunan Road.
We found that, different from the spatial distribution of the catering industry in Nanjing, which
follows Central Place Theory, the spatial distribution of E-WoM of the catering industry shows the
features of Central Flow Theory (Castells, 1989, 1996; Taylor et al., 2001, 2008, 2010). Firstly, there
is a distinct hierarchal distribution of E-WoM, in which Xinjiekou forms the highest level, with
Hunan Road, Taiping Road, Zhujiang road, and Confucius temple areas gradually decreasing.
Secondly, low grade business circles do not necessary mean low grade E-WoM; for example, the
level of business circles, the density of restaurants along Taiping Road are both lower than
Confucius temple and Zhujiang Road area, but shows a higher grade in E-WoM. This may be
because Taiping road area is a famous leisure area which has many western restaurants, pubs, cafes,
Japanese and Korean restaurants which are popular among young people. This area has a large
population mobility and strong ability to gather popularity, therefore, acts as an important node in
the spatial network of the catering industry in Nanjing. In addition, although the Nanjing catering
industry shows contiguous distribution of levels (Figure 2), Figure 3 shows that the E-WoM in
Xinjiekou, Hunan Road/Shanxi Road, Taiping Road, Confucius temple, and Zhujiang road areas is
rather a relatively independent and scattered in distribution, showing the characteristics of
fragmentation.
To a large extent the development of information technology, coupled with the fast development of
internet, breaks the traditional impact of distance on urban residents dining behavior. Information
search engines and review platforms such as dianping.com, facilitate residents’ choices of dining
places from a wider area thereby making their dinning behavior more flexible. It also promotes
the areas with ability to provide better or characteristic catering services and become the main areas
of residential dining options, and the centre of high grade E-WoM, such as areas along Taiping Road.
15
Fig.3 Distribution of catering providers’ E-WoM in Nanjing City
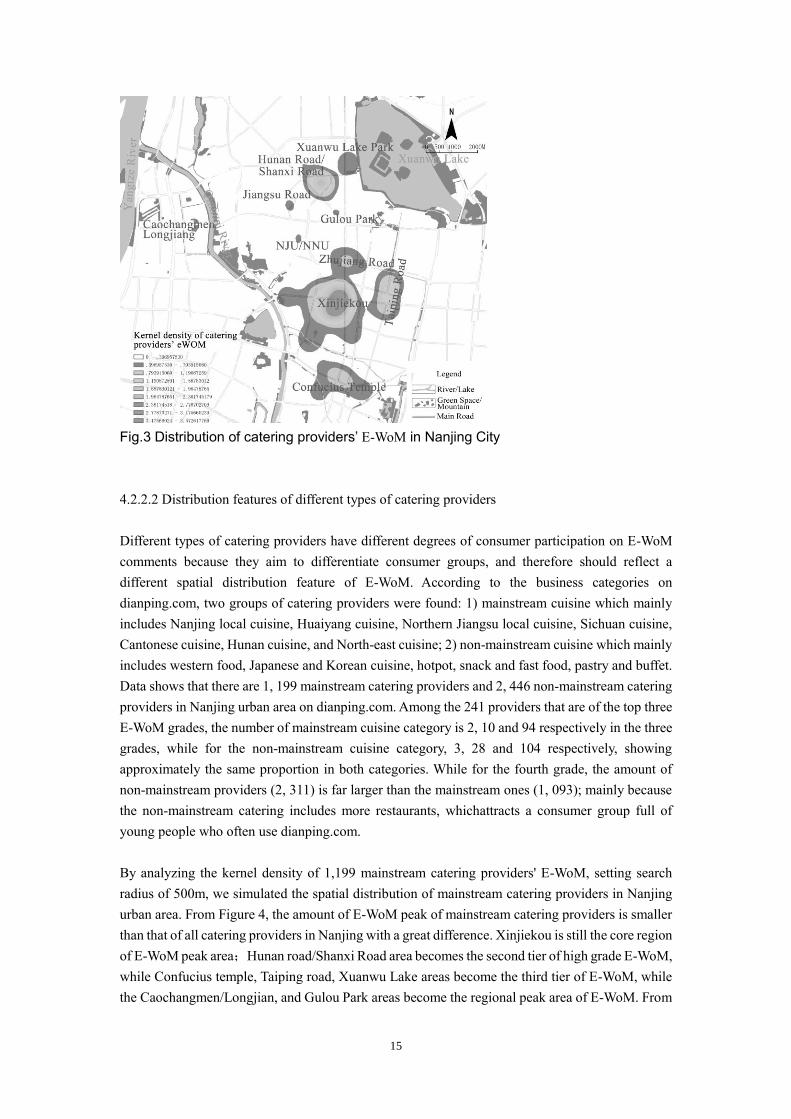
4.2.2.2 Distribution features of different types of catering providers
Different types of catering providers have different degrees of consumer participation on E-WoM
comments because they aim to differentiate consumer groups, and therefore should reflect a
different spatial distribution feature of E-WoM. According to the business categories on
dianping.com, two groups of catering providers were found: 1) mainstream cuisine which mainly
includes Nanjing local cuisine, Huaiyang cuisine, Northern Jiangsu local cuisine, Sichuan cuisine,
Cantonese cuisine, Hunan cuisine, and North-east cuisine; 2) non-mainstream cuisine which mainly
includes western food, Japanese and Korean cuisine, hotpot, snack and fast food, pastry and buffet.
Data shows that there are 1, 199 mainstream catering providers and 2, 446 non-mainstream catering
providers in Nanjing urban area on dianping.com. Among the 241 providers that are of the top three
E-WoM grades, the number of mainstream cuisine category is 2, 10 and 94 respectively in the three
grades, while for the non-mainstream cuisine category, 3, 28 and 104 respectively, showing
approximately the same proportion in both categories. While for the fourth grade, the amount of
non-mainstream providers (2, 311) is far larger than the mainstream ones (1, 093); mainly because
the non-mainstream catering includes more restaurants, whichattracts a consumer group full of
young people who often use dianping.com.
By analyzing the kernel density of 1,199 mainstream catering providers' E-WoM, setting search
radius of 500m, we simulated the spatial distribution of mainstream catering providers in Nanjing
urban area. From Figure 4, the amount of E-WoM peak of mainstream catering providers is smaller
than that of all catering providers in Nanjing with a great difference. Xinjiekou is still the core region
of E-WoM peak area;Hunan road/Shanxi Road area becomes the second tier of high grade E-WoM,
while Confucius temple, Taiping road, Xuanwu Lake areas become the third tier of E-WoM, while
the Caochangmen/Longjian, and Gulou Park areas become the regional peak area of E-WoM. From
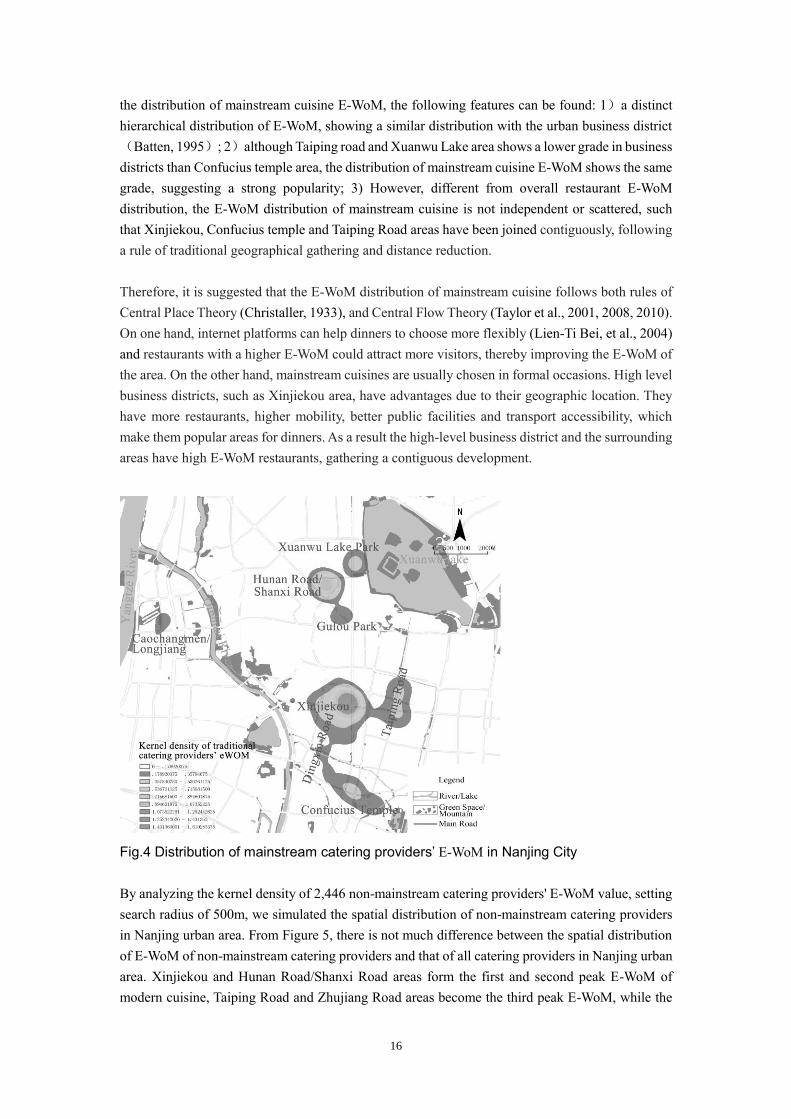
16
the distribution of mainstream cuisine E-WoM, the following features can be found: 1)a distinct
hierarchical distribution of E-WoM, showing a similar distribution with the urban business district
(Batten, 1995); 2)although Taiping road and Xuanwu Lake area shows a lower grade in business
districts than Confucius temple area, the distribution of mainstream cuisine E-WoM shows the same
grade, suggesting a strong popularity; 3) However, different from overall restaurant E-WoM
distribution, the E-WoM distribution of mainstream cuisine is not independent or scattered, such
that Xinjiekou, Confucius temple and Taiping Road areas have been joined contiguously, following
a rule of traditional geographical gathering and distance reduction.
Therefore, it is suggested that the E-WoM distribution of mainstream cuisine follows both rules of
Central Place Theory (Christaller, 1933), and Central Flow Theory (Taylor et al., 2001, 2008, 2010).
On one hand, internet platforms can help dinners to choose more flexibly (Lien-Ti Bei, et al., 2004)
and restaurants with a higher E-WoM could attract more visitors, thereby improving the E-WoM of
the area. On the other hand, mainstream cuisines are usually chosen in formal occasions. High level
business districts, such as Xinjiekou area, have advantages due to their geographic location. They
have more restaurants, higher mobility, better public facilities and transport accessibility, which
make them popular areas for dinners. As a result the high-level business district and the surrounding
areas have high E-WoM restaurants, gathering a contiguous development.
Fig.4 Distribution of mainstream catering providers’ E-WoM in Nanjing City
By analyzing the kernel density of 2,446 non-mainstream catering providers' E-WoM value, setting
search radius of 500m, we simulated the spatial distribution of non-mainstream catering providers
in Nanjing urban area. From Figure 5, there is not much difference between the spatial distribution
of E-WoM of non-mainstream catering providers and that of all catering providers in Nanjing urban
area. Xinjiekou and Hunan Road/Shanxi Road areas form the first and second peak E-WoM of
modern cuisine, Taiping Road and Zhujiang Road areas become the third peak E-WoM, while the
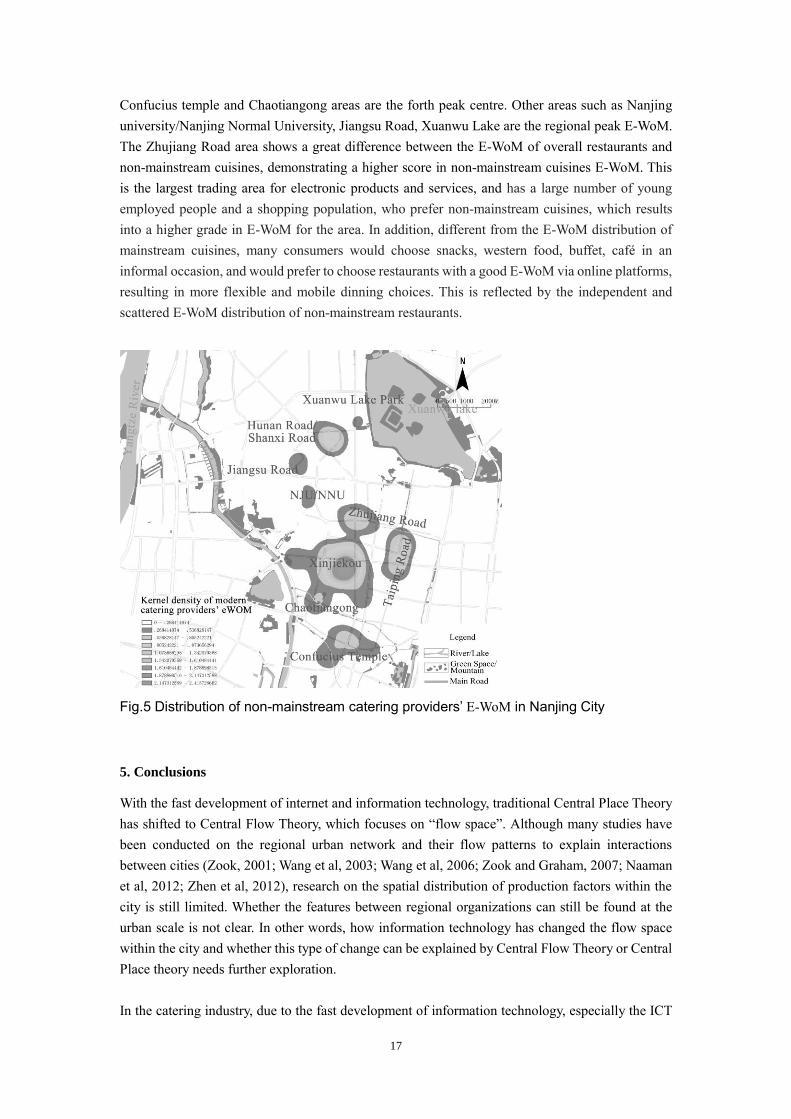
17
Confucius temple and Chaotiangong areas are the forth peak centre. Other areas such as Nanjing
university/Nanjing Normal University, Jiangsu Road, Xuanwu Lake are the regional peak E-WoM.
The Zhujiang Road area shows a great difference between the E-WoM of overall restaurants and
non-mainstream cuisines, demonstrating a higher score in non-mainstream cuisines E-WoM. This
is the largest trading area for electronic products and services, and has a large number of young
employed people and a shopping population, who prefer non-mainstream cuisines, which results
into a higher grade in E-WoM for the area. In addition, different from the E-WoM distribution of
mainstream cuisines, many consumers would choose snacks, western food, buffet, café in an
informal occasion, and would prefer to choose restaurants with a good E-WoM via online platforms,
resulting in more flexible and mobile dinning choices. This is reflected by the independent and
scattered E-WoM distribution of non-mainstream restaurants.
Fig.5 Distribution of non-mainstream catering providers’ E-WoM in Nanjing City
5. Conclusions
With the fast development of internet and information technology, traditional Central Place Theory
has shifted to Central Flow Theory, which focuses on “flow space”. Although many studies have
been conducted on the regional urban network and their flow patterns to explain interactions
between cities (Zook, 2001; Wang et al, 2003; Wang et al, 2006; Zook and Graham, 2007; Naaman
et al, 2012; Zhen et al, 2012), research on the spatial distribution of production factors within the
city is still limited. Whether the features between regional organizations can still be found at the
urban scale is not clear. In other words, how information technology has changed the flow space
within the city and whether this type of change can be explained by Central Flow Theory or Central
Place theory needs further exploration.
In the catering industry, due to the fast development of information technology, especially the ICT
18
platforms such as dianping.com, consumers’ dinning behavior has become more flexible and mobile
rather than being limited by distance (Lien-Ti Bei, et al., 2004; Qin, et al., 2014). This trend of
change has also brought new trends of research for urban geography, and the integration of internet
data and urban geographic spatial information has provided a new research content, method or
research direction of urban geography (Graham & Shelton, 2013).
This research uses urban catering space in Nanjing, China as a study object, which has significantly
been influenced by new technology, and explores the application of central place theory and central
flow theory in production elements within the city. After establishing a set of index of restaurants’
E-WoM from dianping.com (Nanjing), we calculated the complex score and ranking of catering
providers' E-WoM, and conducted kernel density analysis and a comprehensive evaluation on spatial
distribution of the E-WoM of the urban catering industry and compared this “flow space” with the
general distribution patterns of catering providers (place space). The main conclusions are as follows:
1) The spatial distribution of restaurants’ density in Nanjing follows a traditional Central Place
Theory (Christaller, 1933; Krugman, 1991; Zhang and Xu, 2009), showing a high overlapping of
business districts. Xinjiekou is the centre of the highest grade, Hunan Road/Shanxi Road, Confucius
Temple, and Zhujiang Road areas are the second highest grade while Taiping Road, Nanjing
University/Nanjing Normal University, Xuanwu Lake areas are the regional centres. Furthermore,
the high grade centers show the development trend of contiguous gathering. The results suggest the
role of the central area has not disappeared, and the urban or regional space still has a certain
hierarchy.
2) The spatial distribution of restaurants’ E-WoM in Nanjing follows the Central Flow Theory
(Castells, 1989, 1996; Taylor et al., 2001, 2008, 2010). On one hand, a clear hierarchy can be found
in E-WoM distribution, but is not fully consistent with the level of urban business districts. For
example, low-level business districts such as Taiping Road area are high grade in restaurant’s E-
WoM due to their high popularity. On the other hand, due to the rapid development and usage of the
urban network information platforms, the influence of distance on residents' consumption has
weakened, and the dinning choice and activity space has been expanded, which makes the
distribution of the restaurants’ E-WoM relatively scattered and independent.
3) Different characteristics can be found in different types of restaurants’ E-WoM distribution.
Mainstream cuisine follows Central Place Theory (clear hierarchy, contiguous development) but is
inconsistent with urban business districts (such as, Taiping Road and Xuanwu Lake areas),
demonstrating some characteristics of Central Flow Theory. The distribution of E-WoM of non-
mainstream cuisine is similar to the E-WoM distribution of overall restaurants, showing a central
flow system pattern. Therefore, our study finds that Central Place Theory and Central Flow Theory
are still useful in explaining the spatial distribution of the catering industry and its E-WoM at the
city scale.
The findings contribute to the following areas:
19
Firstly, it explores the application of Central Place Theory and Central Flow Theory at the city scale,
an aspect which was previously ignored by many researchers. It discusses the spatial distribution
patterns of the catering industry considering network space, and examines whether the E-WoM
reflects Central Flow Theory with the influence of ICT. Previous research on Central Flow Theory
mainly considers the relationship of cities at the regional level. However, our research applied it to
the urban level, and found that with the influence of information technology, urban internal dining
shows a feature of Central Flow Theory (clear hierarchy, grading is influenced by mobility and
popularity, scattered and independent). However, a feature of traditional Central Place Theory can
still be found in the results such as ‘clear hierarchy and contiguous development’, mainly in the E-
WoM of mainstream cuisine. It is obvious that information technology has provided more dinning
flexibility and expanded the scope of dinning activity, and accelerated the dispersion of urban space
elements. However, high level urban business districts can still attract a variety of quality restaurants
aggregation due to their advantages in scale, population mobility, facilities, and transport
accessibility, such that the aggregational development of spatial elements is still evident. As such, a
mixture of features of Central Flow Theory and Central Place Theory can be found at the city scale.
Secondly, the paper is a welcome addition of data analytical approach exploration into the
hospitality industry, providing a more holistic understanding of catering industry in Nanjing. The
integration of E-WoM scores from data mining and urban geographic spatial information (GIS
method) has made it possible to examine the quality of restaurants at a larger scale.
The results have some practical implications as well. Studying urban service facility's quality and
spatial distribution patterns is useful in decision making for government's service facility planning.
City governments should adopt various measures to optimize the space layout and minimize the
unbalanced distribution of popular catering providers. For example, in order to balance the spatial
distribution of different types of catering, priority can be given to non-mainstream cuisine in
traditional business areas(such as Xinjiekou area) while mainstream cuisine can be encouraged in
new business areas(Such as Zhujiang Road) when planning catering facilities. In particular, the
number and popularity of catering providers in the low-grade business centers may be increased,
and the quality of catering needs to be improved.
Our research also has some limitations. Usage of massive data on websites to some extent reduces
the influence of fake information cast on total sample, improving the accuracy of research data, and
can generally reflect the spatial patterns of urban catering providers. But internet users are mostly
young people who tend to consume and comment on non-mainstream catering, which restrains the
age range of the sample in this research. On the other hand, traditional Central Place Theory lacks
explanation on spatial distribution of urban catering industry. Establishing spatial structure pattern
of urban catering industry based on E-WoM also needs comparison with other cities. Further
research is still needed on the influencing factors, details and mechanism of information technology
to the spatial distribution of urban catering industry.
Note
① “Master Plan of Nanjing (2011-2020)” is the latest master plan of Nanjing prepared by the
Nanjing Municipal Planning Bureau, and is used to determine the hierarchy of business
20
centers in Nanjing.
References
Anderson, E. (1998). Customer satisfaction and word of mouth. Journal of Service Research,
1(1), 5-17.
Austin, S. B., Melly, S. J., Sanchez, B. N., Patel, A., Buka, S., & Gortmaker, S. L. (2005).
Clustering of fast-food restaurants around schools: a novel application of spatial statistics to the
study of food environments. American Journal of Public Health, 95(9), 1575-1581.
Baek, S. H., Ham, S., & Yang, I. S. (2006). A cross-cultural comparison of fast food restaurant
selection criteria between Korean and Filipino college students. International Journal of Hospitality
Management, 25(4), 683-698.
Batten, D. (1995). Network cities: creative urban agglomerations for the 21st century. Urban
Studies, 32(2), 313-327.
Beldad, A., Jong, M. D., & Steehouder, M. (2010). How shall I trust the faceless and the
intangible? a literature review on the antecedents of online trust. Computers in Human Behavior,
26(5), 857-869.
Berger, J. (2014) Word of mouth and interpersonal communication: a review and directions for
future research. Journal of Consumer Psychology. 24(4): 586-607.
Bourlakis, M.A., & Weightman, P.W.H. (2004). Food Supply Chain Management. Blackwell
Publishing.
Brown, J., Broderick, A. J., & Lee, N. (2007). Word of mouth communication within online
communities: conceptualizing the online social network. Journal of Interactive Marketing, 21(3), 2-
20.
Brown, J. J., & Reingen, P. H. (1987). Social ties and word-of-mouth referral behavior. Journal
of Consumer Research, 14(3), 350-362.
Camagni, R., & Salone, C. (1993). Network urban structures in northern Italy: elements for a
theoretical framework. Urban Studies, 30(30), 1053-1064.
Castells, M. (1989). The informational city: Information technology, economic restructuring,
and the urban-regional process. Oxford: Blackwell.
Castells, M. (1996). Rise of the network society: The information age: economy, society and
culture. Blackwell Publishers, Inc.
Davis, B. Lockwood, A., & Stone, S. (1998) Food and Beverage Management (third ed.),
Butterworth-Heinemann, Oxford
Eckardt, F. (2008). Media and urban space. in Frank Eckardt (eds) Media and Urban Space:
Understanding, Investigating and Approaching Mediacity. pp7-9. Frank & Timmer Gmbh. Berlin.
Fusi, A., Guidetti, R., Azapagic, A. (2016) Evaluation of environmental impacts in the catering
sector: the case of pasta. Journal of Cleaner Production. 132(20): 146-160.
Gottmann, J. (1961). Megalopolis, the urbanized northeastern seaboard of the United States.
New York: The Twentieth Century Fund.
Graham M, Shelton T. (2013). Geography and the future of big data, big data and the future of
geography. Dialogues in Human Geography, (3): 255-261.
Gretzel, U., & Yoo, K. H. (2008). Use and Impact of Online Travel Reviews. Information and
Communication Technologies in Tourism, Enter 2008, Proceedings of the International Conference
21
in Innsbruck, Austria (Vol.26, pp.35-46). DBLP.
Gwohshiung, T., Teng, M. H., Chen, J. J., & Opricovic, S. (2002). Multicriteria selection for a
restaurant location in Taipei. International Journal of Hospitality Management, 21(2), 171-187.
Hart, C. &Blackshaw, P., (2006). Internet INFERNO. Marketing Management, 15 (1), 18-25.
Available from http://www.ehis.ebscohost.com [Accessed 26 January 2012].
Hollenstein, L., & Purves, R. (2010). Exploring place through user-generated content: using
flickr to describe city cores. Journal of Spatial Information Science, 1(1), 21-48.
Hu, Z. Y., Zhang, Z. G. (2002). An analysis about the spatial distribution of hotels in urban
area: take Nanjing city as a case. Economic Geography, 22(1): 106-110. [In Chinese]
Kang C, Zhang Y, Ma X, et al. (2012). Inferring properties and revealing geographical impacts
of intercity mobile communication network of China using a subnet data set. International Journal
of Geographical Information Science, (ahead-of-print): 1-18.
Kincaid, C., Baloglu, S., Mao, Z., & Busser, J. (2010). What really brings them back?: the
impact of tangible quality on affect and intention for casual dining restaurant patrons. International
Journal of Contemporary Hospitality Management, 22(2), 209-220(12).
King, R. A., Racherla, P.,Bush, V. D. (2014). What we know and don’t know about online
word-of-mouth: a review and synthesis of the literature. Journal of Interactive Marketing.
28(3):167-183.
Kivela, J. J. (1997). Restaurant marketing: selection and segmentation in Hong Kong.
International Journal of Contemporary Hospitality Management, 9(3), 116-123.
Knaap, G.A. van der. (2002). Stedelijke Bewegingsruimte, over Veranderingen in Stad en Land.
The Hague: Sdu Uitgevers.
Krings G, Calabrese F, Ratti C, et al. (2009). Urban gravity: a model for inter-city
telecommunication flows. Journal of Statistical Mechanics: Theory and Experiment, (7): 1-8.
Krugman, P. R. (1991). Geography and trade. Southern Economic Journal, 1.
Liang, L. (2007). The distribution in space of urban catering and its factors: Xi’an as an
example. Journal of Northwest University (Natural Science Edition), 37(6): 925-930. [In Chinese]
Lien-Ti Bei, Etta Y. I. Chen, Jong-Youn Rha, & Richard Widdows. (2004). Consumers' online
information search for a new restaurant for dining-out. Journal of Foodservice Business Research,
6(3), 15-36.
Litz, R. A. & Rajaguru, G. (2008). Does small store location matter? a test of three classic
theories of retail location. Journal of Small Business & Entrepreneurship, 21(4), 477-492.
Muller, C. C., & Inman, C. (1994). The geodemographics of restaurant development. Cornell
Hospitality Quarterly, 35(3), 88-95.
Melaniphy, J.C. (1992). Restaurant and Fast-Food Site Selection, John Wiley & Sons, New
York, NY.
Meijers, E. (2005). Polycentric urban regions and the quest for synergy: is a network of cities
more than the sum of the parts?. Urban Studies, 42(42), 765-781.
Naaman M, Zhang A X, Brody S, (2012). On the study of diurnal urban routines on Twitter
[C]// Sixth International AAAI Conference on Weblogs and Social Media.
Nanjing Statistics Bureau. (2016). Nanjing Statistical Year Book-2016. Beijing:
China Science and Technology Press.
Ohlin, B. (1993). 1933 and 1977--some expansion policy problems in cases of unbalanced
domestic and international economic relations. American Economic Review, 83(6), 10-17.
22
Oxford Dictionary. (2017) Retried from https://en.oxforddictionaries.com/definition/restaurant
accessed 25 July, 2017.
Qin, X., Zhen, F., Zhu, S. J., & Guang-Liang, X. I. (2014). Spatial pattern of catering industry
in nanjing urban area based on the degree of public praise from internet: a case study of
dianping.com. Scientia Geographica Sinica, 34(7), 810-817. [In Chinese]
Schaefer, A. D., Luke, R. H., & Green, J. (1996). Attitudes of restaurant site selection
executives toward various people magnets. Journal of Restaurant & Foodservice Marketing, 1(3),
1-14.
Schwanen, T., Dijst, M., Kwan, M. P. (2006). Introduction-the internet, changing mobilities,
and urban dynamics. Urban Geography, 27 (7):585-589.
Senecal, S. & Nantel, J. (2004). The influence of online product recommendations on
consumers online choices. Journal of Retailing, 80,159-169.
Shu, S., Wang, R., Sun, Y., Liu, J., & Xiao, L. (2012). Spatial distribution of urban catering
industry and its influenced factors:a case study of xiamen city. Tropical Geography, 32(2): 134-140.
Smith, S. L. J. (1985). Location patterns of urban restaurants. Annals of Tourism Research,
12(4), 581-602.
Sparks, B.A. & Browning, V. (2010). Complaining in cyberspace: the motives and forms of
hotel guests' complaints online. Journal of Hospitality Marketing & Management, 19(7), 797-818.
Tao, H., Zhao, Y., Yuan, X. Y., & Tao, P. (2011). The geographical position change and influence
factors of Nanjing time-honored catering firms. World Regional Studies, 20(3): 145-154. [In
Chinese]
Taylor, P. J. (2001). Specification of the world city network. Geographical Analysis, 33(2),
181-194.
Taylor, P. J., Evans, D. M., & Pain, K. (2008). Application of the interlocking network model
to mega-city-regions: measuring polycentricity within and beyond city-regions. Regional Studies,
42(8), 1079-1093.
Taylor, P. J., Hoyler, M., & Verbruggen, R. (2010). External urban relational process:
introducing central flow theory to complement central place theory. Urban Studies, 47(13), 2803-
2818.
Teller, C., & Reutterer, T. (2008). The evolving concept of retail attractiveness: what makes
retail agglomerations attractive when customers shop at them?. Journal of Retailing & Consumer
Services, 15(3), 127-143.
Timor, M., Sipahi, S. (2005). Fast-food restaurant site selection factor evaluation by the
Analytical Hierarchy Process. The Business Review Cambridge, 4(1): 161-7.
Wang M F, Ning Y M. 2004. The internet and the rise of information network cities in China.
Acta Geographica Sinica, 59(3): 446-454.
Westbrook, R. A. (1987), Product/Consumption-based Affective Responses and Postpurchase
Process, Journal of Marketing Research,24 (August): 258-270.
Yoon, S. (2009). 'The effects of electronic word-of-mouth systems (EWOMS) on the
acceptance of recommendation. Dissertation Abstracts International Section A, 69, 7-A, PsycINFO,
EBSCOhost, viewed 2 February 2012.
Yüksel, A., & Yüksel, F. (2003). Measurement of tourist satisfaction with restaurant services:
a segment-based approach. Journal of Vacation Marketing, 9(1), 52-68.
Zhang, X., Xu, Y. L. (2009). Study on the distribution in space of urban caterings and its
23
influencing factors: A case study of Nanjing. Tropical Geography, 29(4): 134-140. [In Chinese]
Zhen, F., Liu, X. X., & Liu, H. (2007). Regional urban network influenced by information
technology: new directions of urban studies. Human Geography, 22(2): 76-80. [In Chinese]
Zhen, F., Wang, B., & Wei, Z. (2015). The rise of the internet city in china: production and
consumption of internet information. Urban Studies, 52(13): 2313-2329.
Zhen, F., Yu, Y., Wang, X., & Zhao, L. (2012). The Spatial Agglomeration Characteristics of
Automotive Service Industry: A Case Study of Nanjing. Scientia Geographica Sinica, 32(10): 1200-
1208. [In Chinese]
Zhou, K. H., Zhen, F., Yu, Y., & Jiang, Y. H. (2010). A research on the processes and patterns
of spatial agglomeration of financial services in urban central area: a case study of Kuiwen district,
Weifang city. Human Geography, 25(6): 62-67. [In Chinese]
Zhu, F., & Zhang, X. (2012). Impact of online consumer reviews on sales: the moderating role
of product and consumer characteristics. Journal of Marketing, 74(2):133-148.
Zook M A. (2001). Old hierarchies or new networks of centrality: The global geography of the
Internet content market. American Behavioral Scientist, 44(10): 1679-1696.
Zook, M. A., & Graham, M. (2007). Mapping digiplace: geocoded internet data and the
representation of place. Environment and Planning B: Planning and Design, 34(3), 466-482.