Embed Size (px)
Citation preview
Spatial patterns of biphasic ectoenzymatic kinetics related to
biogeochemical properties in the Mediterranean Sea.
France Van Wambeke1, Elvira Pulido
1, Julie Dinasquet
2,3, Kahina Djaoudi
1,4, Anja Engel
5, Marc
Garel1, Sophie Guasco
1, Sandra Nunige
1, Vincent Taillandier
6, Birthe Zäncker
6,7, Christian
Tamburini1. 5
1Aix-Marseille Université, CNRS/INSU, Université de Toulon, IRD, Mediterranean Institute of Oceanography (MIO)
UM 110, 13288, Marseille, France 2Marine Biology Research Division, Scripps Institution of Oceanography, UCSD, La Jolla, USA 3Sorbonne Universités, UPMC University Paris 6, Laboratoire d'Océanographie Microbienne (LOMIC), Observatoire 10 Océanologique, 66650, Banyuls/mer 4Molecular and Cellular Biology, The University of Arizona, Tucson, USA
5GEOMAR – Helmholtz-Centre for Ocean Research, Kiel, Germany 6CNRS, Sorbonne Universités, Laboratoire d’Océanographie de Villefranche (LOV), UMR7093, 06230 Villefranche-
sur-Mer, France 15 7The Marine Biological Association of the UK, Plymouth, United Kingdom
Correspondence to: F. Van Wambeke ([email protected])
Abstract. Prokaryotic ectoenzymatic activity, abundance and heterotrophic production were
determined in the Mediterranean Sea, within the epipelagic and the upper part of the mesopelagic 20
layers. The Michaelis-Menten kinetics were assessed, using a range of low (0.025 to 1 µM) and
high (0.025 to 50 µM) concentrations of fluorogenic substrates. Thus, Km and Vm parameters were
determined for both low and high affinity systems for alkaline phosphatase (AP), aminopeptidase
(LAP) and glucosidase (GLU). Based on the constant derived from the high AP affinity system,
in-situ hydrolysis rates of N-protein contributed of 48% ± 30% for the heterotrophic prokaryotic 25
nitrogen demand within epipelagic waters and of 180% ± 154% within deeper layers. LAP
hydrolysis rate was higher than bacterial N demand only within the deeper layer, and only based on
the high affinity system. Although ectoenzymatic hydrolysis contribution to heterotrophic
prokaryotic need was high in terms of N, but low in terms of C. Based on a 10% bacterial growth
efficiency, the cumulative hydrolysis rates of C-proteins and C-polysaccharides contributed to a 30
small part of the heterotrophic prokaryotic carbon demand, on average 2.5% ± 1.3% in the
epipelagic layers. This study notably points out the biases in current and past interpretation of the
relative activities differences among the 3 tested enzymes, in regard to the choice of added
concentrations of fluorogenic substrates. In particular, enzymatic ratios LAP/GLU, as well as
some trends with depth, were different considering activities resulting from the high or the low 35
affinity system.
1. Introduction
Most of the organic matter being in the state of high molecular weight material, its hydrolysis by
ectoenzymes plays an important role in the degradation, utilization and mineralization processes in
aquatic environments, but also in nutrient’s regeneration (Hoppe, 1983; Chróst, 1991). Whether or 40
not the ectoenzymatic activity must be considered as a limiting rate in organic matter
remineralization is subject of debate as hydrolysis and consumption of hydrolysis products are not
always coupled (e.g. for instance Smith et al., 1992). Bacterial ectoenzymatic hydrolysis is usually
determined using fluorogenic substrates (Hoppe, 1983) which, upon cleavage by ectoenzymes,
trigger the release of a fluorescent by-product. The increase of the latter is monitored by fluorimetry 45
over time, allowing quantification of ectoenzymatic hydrolysis rates. Kinetic experiments are time-
1
consuming and most studies reporting ectoenzymatic activity seldomly examine enzyme kinetic
patterns, but only assess activity based on one substrate concentration assumed to be saturating.
Baltar et al. (2009b) report that among 17 published studies, 12 used a single range of substrate
concentrations, varying from 0.02 to 1000 µM (with a median of 50 µM), and only 5 considered 50
variable ranges. Within these 5 studies, for the concentration kinetic, the minimum concentration
used was 50 nM at the lowest, and was more generally between 1 and 5 µM, and the highest
concentration used ranged between 5 µM and 1200 µM, median 200 µM. In the Mediterranean Sea,
a compilation of data by Zaccone and Caruso (2019) shows that among 22 studies, 6 used a single
concentration (that they assumed to be saturating) with a median of 125 µM for MCA-leu and 50 55
µM for MUF-P. While the other studies assessed kinetics systematically, the range of
concentrations was again highly variable (min 0.025 - 200 median 0.1 µM, max 1 - 4000 median 20
µM). However, the combination of: i) non-specific target of the enzymes, ii) the heterogeneity of
enzymatic systems among a single species, iii) the diversity of present species and iv) the
concentration of surrounding substrates, will result in multiphasic kinetics (Chróst, 1991; Arnosti, 60
2011; Sinsabaugh and Shah, 2012 and ref therein). It is well known that ectoenzymes can be
produced by a diversity of microorganisms. Their activity depends on a patchy distribution of
natural substrates, and a variety of natural (potentially unknown) molecules hydrolyzed by the same
enzymes that hydrolyze the added fluorochrome, all probably having different affinities for the
enzyme. Indeed, cell-specific activities and types of activities were shown to be extremely variable 65
among 44 isolated strains, cultivated in batch cultures and sampled during exponential phase
(Martinez et al., 1996). Arrieta and Herndl (2001) assessed the diversity of marine bacterial -
glucosidases from a natural community separated using capillary electrophoresis zymography and
showed that they had different Km and Vm. Biphasic kinetic systems have been described in areas
where increasing gradients of polymeric material are expected due to the high concentration of 70
particles; e.g. near bottom water and sediment for aminopeptidase (Tholosan et al., 1999), in a
shallow bay for phosphatases (Bogé et al., 2013). Moreover, in the water column different kinetic
systems were also observed and are generally attributed to attached or free-living bacteria having
different affinities for substrates, k-strategists-oligotrophic bacteria (with low Km and low Vm) or
r-strategists/copiotroph bacteria (with high Km and Vm, Koch, 2001). At depth, the simultaneous 75
presence of more refractory DOM with recent and freshly sedimenting particles, suggests also
possible multiphase kinetics for ectoenzymatic activity. Varying kinetic parameters were also
attributed to ‘free’ (i.e. related to free-living bacteria) versus ‘attached” heterotrophic bacteria, the
latters highlighting higher both Vmax and Km, i.e. adapted to cope with high substrate
concentrations (Unanue et al., 1998). Due to the soluble nature of the fluorochrome released, these 80
estimates are based on size fractionation prior the incubations, which biases ectoenzymatic
activities in each size fraction, due to filtration artifacts and disruption of trophic relationships
between primary producers, heterotrophic bacteria, regenerative protozoans and osmotrophs.
Nevertheless, most studies have shown that cell-specific ecotoenzymatic activities on aggregates are
~10 fold higher than those of the surrounding assemblages (decaying bloom, Martinez et al., 1996). 85
Furthermore, carbon budgets have shown that the prokaryotes attached to aggregates are likely a
source of by-products for free-living prokaryotes, thanks to their ectoenzymatic hydrolysis (Smith
et al., 1992). The use of bulk water concentration kinetics allows the determination of different
enzymatic kinetics without disturbing relationships between free/attached prokaryotes and
DOM/POM interactions during the incubations. 90
In the Mediterranean Sea, elemental C/N/P ratios of nutrients and organic matter are the object of
particular attention and debates, especially when it comes to the origin of P-deficiency and DOC
2
accumulation (Thingstad and Rassoulzadegan, 1995; Krom et al., 2004). The export of organic
carbon in dissolved vs. particular forms is related to the P-limitation status within surface layers
(Guyennon et al., 2015). Therefore, models used to compute C, N and P budgets in the 95
Mediterranean Sea must consider non-Redfield C/N/P stoichiometry (Baklouti et al., 2006). The
interaction between different enzymes has been largely studied in the Mediterranean Sea (Zaccone
and Caruso, 2019) due to the particular role of this elemental stoichiometry. Indeed, the epipelagic
layers are P or N-P limited during most periods of water mass stratification, and ectoenzymes
providing P and N sources from organic matter, such as aminopeptidase and phosphatase have been 100
intensively studied as indicators of these limitations (Sala et al., 2001; Van Wambeke et al., 2002).
However, the potential bias introduced by multiple kinetics, when comparing different types of
ectoenzymes, is still poorly understood.
In this study, we investigated in the Mediterranean Sea, the kinetics of three series of enzymes targeting
proteins, phospho-mono esters and carbohydrates (aminopeptidase, alkaline phosphatase and -D –105
glucosidase, respectively) in relation to the elemental stoichiometry of particulate and dissolved organic
matter. We have paid particular attention to the use of a wide range of substrates concentrations to
evaluate potential multiphasic kinetics. Our aim was to study the effects of the respective activities of
the ectoenzymes in relation to the quality of the available organic matter, below the productive layer
and above the deep Mediterranean waters. We were especially interested in the Levantine Intermediate 110
Waters (LIW), a typical Mediterranean water mass that spreads from ~200 to 700 m, characterized by a
local maximum of salinity and a local minimum of dissolved oxygen concentration (e.g. Kress et al.,
2003; Malanotte-Rizzoli et al., 2003). This study focuses on the open waters of the western
Mediterranean Sea and Ionian Sea, considering four water layers: surface (generally P or N limited
during the stratification period), the deep chlorophyll maximum layer (coinciding with nutricline 115
depths), the LIW and below the LIW. Finally, we discuss the biases in interpretation of past and current
enzymatic kinetic, potentially induced by the reduced range of used substrate concentrations. The data
used in this ms are also developed in another article (Van Wambeke et al, in prep) of the special issue in
which all biogeochemical fluxes (phytoplankton and heterotrophic bacterial P and N demand, N2
fixation rates, aminopeptidase, phosphatase activities) within the mixed layers will be compared with 120
wet and dry N and P atmospheric fluxes thanks to an exceptional simultaneous measurements of all
these fluxes during the same cruise.
2. Materials and Methods
2.1 Sampling strategy
The PEACETIME cruise (doi.org/10.17600/15000900) was conducted in the Mediterranean Sea, 125
from May to June 2017, along a transect extending from the Western Basin to the center of the
Ionian Sea (25°S 115 E – 15°S, 149°W, Fig. 1). For details on the cruise strategy, see Guieu et al.
(2020). Stations of short duration (< 8 h, 15 stations named SD1 to SD10, Fig. 1) and long duration
(5 days, 3 stations named TYR, ION and FAST) were sampled. Generally, at least 3 casts were
conducted at each short station. One focused on the epipelagic layer (0 - 250 m), and the second one 130
focused on the whole water column. Both were sampled with a standard, classical-CTD rosette
equipped with a sampling system of 24 Niskin bottles (12 L), and a Sea-Bird SBE9 underwater unit
equipped with pressure, temperature (SBE3), conductivity (SBE4), fluorescence (Chelsea
Acquatracka) and oxygen (SBE43) sensors. The third cast, from surface to bottom was performed
under ‘trace metal clean conditions’ using a second instrumental package (called TMC-rosette) 135
mounted on a Kevlar cable and equipped with Go-Flo bottles that were sampled in a dedicated trace
3
metal free-container. The long stations were abbreviated as TYR (situated in the center of the
Tyrrhenian Basin), ION (in the center of the Ionian Basin), FAST (in the western Algerian Basin).
Long stations were selected using satellite imagery, altimetry and Lagrangian diagnostics and
expected events of rain (Guieu et al., 2020). At these stations, repeated casts were performed during 140
at least 5 days, alternating CTD- and TMC- rosettes.
The water sampled with the conventional CTD-rosette, was used for measuring heterotrophic
prokaryotic production (BP), heterotrophic prokaryotic abundances (BA), ectoenzymatic activity
(EEA), chlorophyll stocks, particulate organic carbon (POC), nitrogen (PON) and phosphorus
(POP) and dissolved organic carbon (DOC). The TMC-rosette was used for dissolved inorganic 145
nitrogen (DIN) and phosphorus (DIP), dissolved organic nitrogen (DON) and phosphorus (DOP).
Besides measurements of the biogeochemical variables, BP and ectoenzymatic activities described
below, other data presented in this paper include hydrographic properties (T, S, O2), total
chlorophyll a (Tchla) concentrations for which detailed protocols of analysis and considerations for
methodology are available in Taillandier et al. (2020), Guieu et al. (2020), and Maranon et al. 150
(2020)
We focused on 4 layers of the water column: two were in the epipelagic waters: surface (5 m,
named ‘surf’), and the deep chlorophyll maximum layer, localized by the in vivo fluorescence
continuously measured by the instrumental package during downcasts (named ‘dcm’); and two
deeper layers: one in the LIW (localized by maximum salinity and minimum oxygen properties 155
during downcasts, named ‘liw’), and second sampled at 1000 m (the limit between meso and
bathypelagic waters), except at 2 stations (FAST, 2500 m; ION, 3000 m) named ‘mdw’. Table 1
resumes the sampled stations with their localization, characteristics and depths of ‘dcm’, ‘liw’ and
‘mdw’ layers sampled.
2.2 Biochemistry 160
Nitrate (NO3), nitrite (NO2), and orthophosphate (DIP) concentrations were determined on a
segmented flow auto-analyzer (AAIII HR Seal Analytical) according to Aminot and Kérouel
(2007). The quantification limits were 0.05 µM for NO3, 0.01 µM for NO2 and 0.02 µM for DIP.
The dissolved organic pools, DON and DOP, were determined after high-temperature (120 °C)
persulfate wet oxidation mineralization (Raimbault et al., 1999). Twenty ml of water sample were 165
filtered on a 0.2 µm PES membrane and collected into 25 ml glass flasks. Samples were
immediately poisoned with 100 µl H2SO4 5N and stored in the dark until analysis in the laboratory.
For DON and DOP, filtered samples were then collected in Teflon vials adjusted at 20 ml for wet
oxidation. Nitrate and phosphate formed after the wet persulfate oxidation, corresponding to total
dissolved pool (TDN and TDP), were then determined as previously described for the dissolved 170
inorganic pools. DON and DOP were obtained by the difference between TDN and DIN, and TDP
and DIP, respectively. The limits of quantification were 0.5 and 0.02 μM for DON and DOP,
respectively.
The particulate pools (PON, POP) were determined using the same wet oxidation method
(Raimbault et al., 1999). A volume of 1.2 L was collected from Niskin bottles in polycarbonate 175
bottles and directly filtered through a pre-combusted (450 °C, 4 h) glass fiber filter (Whatman
47mm GF/F) and kept frozen at -20°C until return to the laboratory. For the analysis, filters were
placed in Teflon vials with 20 mL of ultrapure water (Milli-Q grade) and 2.5 mL of the wet
oxidation reagent for mineralization. Nitrate and orthophosphate produced were analyzed as
4
described previously. The limits of quantification were 0.02 and 0.001 μM for PON and POP, 180
respectively.
Within epipelagic, nutrient depleted layers DIP and NO3 were also determined using the LWCC
method (Zhang and Chi, 2002) in which the sensitivity of the spectrophotometric measurement is
improved by increasing the optical path length of the measurement cell to 2.5 m. For DIP,
quantification limits were decreased down to 0.8 nM and the response is linear up to about 150 nM, 185
for NO3, quantification limits decreased to 9 nM.
Samples for dissolved organic carbon (DOC) were filtered through two pre-combusted (24 h,
450°C) glass fiber filters (Whatman GF/F, 25 mm) using a custom-made all-glass/Teflon filtration
syringe system. Samples were collected into pre-combusted glass ampoules and acidified to pH 2
with phosphoric acid (H3PO4). Ampoules were immediately sealed until analyses by high 190
temperature catalytic oxidation (HTCO) on a Shimadzu TOC-L analyzer (Cauwet, 1999). Typical
analytical precision is ± 0.1-0.5 (SD) or 0.2-0.5% (CV). Consensus reference materials
(http://www.rsmas.miami.edu/groups/biogeochem/CRM.html) was injected every 12 to 17 samples
to insure stable operating conditions. Particulate organic carbon (POC) was measured using a CHN
analyzer and the improved analysis proposed by Sharp (1974). 195
Samples (20 ml) for total hydrolysable carbohydrates (TCHO) > 1 kDa were filled into
precombusted glass vials (8 h, 500°C) and stored at -20°C until analysis. Samples were desalinated
with membrane dialysis (1 kDa MWCO, Spectra Por) at 1°C for 5 h. Samples were hydrolyzed for
20 h at 100°C with 0.8 M HCl final concentration with subsequent neutralization using acid
evaporation (N2, for 5 h at 50°C). TCHO were analysed using high performance anion exchange 200
chromatography with pulsed amperometric detection (HPAEC-PAD) which was applied on a
Dionex ICS 3000 ion chromatography system (Engel and Händel, 2011). Two replicates per TCHO
sample were analyzed.
Total hydrolysable amino acids (TAA) were determined from 5 mL of sample which was filled into
precombusted glass vials (8 h, 500°C) and stored at -20°C. Samples were measured in duplicates. 205
The samples were hydrolyzed at 100°C for 20 h with 1 mL 30% HCl (Suprapur®
, Merck) to 1 ml of
sample added and neutralized by acid evaporation under vacuum at 60°C in a microwave.
Remaining acid was removed with water. Samples were analyzed by high performance liquid
chromatography (HPLC) using an Agilent 1260 HPLC system following a modified version of
established methods (Lindroth and Mopper, 1979; Dittmar et al., 2009). Prior to the separation of 13 210
amino acids with a C18
column (Phenomenex Kinetex, 2.6 µm, 150 x 4.6 mm), in-line derivatization
with o-phthaldialdehyde and mercaptoethanol was performed. A gradient with solvent A containing
5% acetonitrile (LiChrosolv, Merck, HPLC gradient grade) in sodium dihydrogen phosphate
(Suprapur®
, Merck) buffer (pH 7.0) and solvent B being acetonitrile was used for analysis. A
gradient from 100% solvent A to 78% solvent A was produced in 50 min. 215
2.3 Bacterial production
Bacterial production (BP, sensus stricto referring to prokaryotic heterotrophic production) was
determined onboard using the microcentrifuge method with the 3H- leucine (
3H-Leu) incorporation
technique (Smith and Azam, 1992) within epipelagic waters, and the filtration technique for deep
waters, as the centrifuge technique is limited to incubation volumes of 1.5 mL and was not 220
sufficiently sensitive in deep waters. In epipelagic waters, triplicate of 1.5 mL samples and a killed
control with trichloracetic acid (TCA, 5% final concentration) were incubated with a mixture of
5
4,5-3H-leucine (Amersham, specific activity 112 Ci mmol
-1) and non-radioactive leucine at final
concentrations of 7 and 13 nM, respectively. Samples were incubated in the dark at the respective in
situ temperatures for 1- 4 h. On 9 occasions, we checked that the incorporation of leucine was linear 225
with time. Incubations were ended by the addition of TCA to a final concentration of 5%, followed
by three runs of centrifugation at 16000 g for 10 minutes. Bovine serum albumin (BSA, Sigma, 100
mg L-1
final concentration) was added before the first centrifugation. After discarding the
supernatant, 1.5 mL of 5% TCA was added before the second centrifugation, and for the last run,
after discarding the supernatant, 1.5 mL of 80% ethanol was added. The ethanol supernatant was 230
discarded and 1.5 mL of liquid scintillation cocktail (Packard Ultimagold MV) was added. For ‘liw’
and ‘mdw’ layers, 40 mL samples were incubated in the dark for up to 12 hours at the in situ
temperature (triplicate live samples and one formalin-fixed control), fixed with formalin (2% final
concentration, using 10 nM 4,5-3H-leucine. After filtration of the sample through 0.2 µm
polycarbonate filters, 5% TCA were added for 10 minutes, and then the filter was rinsed with an 235
additional 10 mL rinse with 5% TCA and a final 80% ethanol rinse.
For both types of samples (centrifuge tubes and filters) the radioactivity incorporated into
macromolecules was counted in a Packard LS 1600 Liquid Scintillation Counter on board the ship.
A factor of 1.5 kg C mol leucine-1
was used to convert the incorporation of leucine to carbon
equivalents, assuming no isotopic dilution (Kirchman, 1993), as checked from occasional 240
concentration kinetics. Standard deviations associated with the variability between triplicate
measurements averaged 8% and 25% for BP values estimated with the centrifugation (higher
activities surface layers) or the filtration technique (lower activities, deep layers), respectively.
2.4 Ectoenzymatic activities
Ectoenzymatic activities were measured fluorometrically, using fluorogenic model substrates that 245
were L-leucine-7-amido-4-methyl-coumarin (Leu-MCA), 4 methylumbelliferyl – phosphate (MUF-
P), 4 methylumbelliferyl – D-glucopyranoside (MUF-glu) to track aminopeptidase activity
(LAP), alkaline phosphatase activity (AP), and glucosidase activity (GLU), respectively
(Hoppe, 1983). Stocks solutions (5 mM) were prepared in methycellosolve and stored at −20°C.
Release of the products of LAP, AP and GLU activities, MCA and MUF, were followed by 250
measuring increase of fluorescence (exc/em 380/440 nm for MCA and 365/450 nm for MUF,
wavelength width 5 nm) in a VARIOSCAN LUX microplate reader. The instrument was calibrated
with standards of MCA and MUF solutions diluted in < 0.2 μm filtered and boiled seawater. For
measurements, 2 mL of unfiltered seawater samples were supplemented with 100 µL of a
fluorogenic substrate solution diluted so that different concentrations were dispatched in a black 24-255
well polystyrene plate in duplicate (0.025 to 50 µM). Three plates were filled per layer analyzed
with the different substrates MUF-P, MCA-leu and MUF-glu. Incubations were carried out in the
dark in thermostatically controlled incubators reproducing in situ temperature ranges. Incubations
lasted up to 24 h long with a reading of fluorescence every 1 to 3 h, depending on the intended
activities. The rate was calculated from the linear part of the fluorescence versus time relationship. 260
Boiled-water blanks were run to check for abiotic activity. From varying velocities obtained, we
determined the parameters Vmax (maximum hydrolysis velocity) and Km (Michaelis-Menten
constant which reflects enzyme affinity for the substrate) by fitting the data using a non-linear
regression on the following equation: V = Vmax × S/(Km + S),where V is the hydrolysis rate and S
the fluorogenic substrate concentration added. We determined Vm and Km using 2 series of 265
substrate concentrations: Vm50 and Km50 were calculated using a range of 11 concentrations
6
(0.025, 0.05, 0.1, 0.25, 0.5, 1, 2.5, 5, 10, 25 and 50 µM) in duplicate and Vm1 and Km1 were
calculated using a restricted range of substrate concentrations up to 1 µM (0.025, 0.05, 0.1, 0.25,
0.5, 1 µM) in duplicate. We used the term ‘ectoenzyme’ and considered that it included all types of
enzymes found outside the cell, including enzymes fixed on cells (on external membranes, or within 270
the periplasmic space), and free-dissolved enzymes, to broadly encompass all enzymes located
outside intact cells regardless of the process by which such enzymes entered the environment.
We used an approach similar to Hoppe et al. (1993) to compute in situ hydrolysis rates for LAP and
GLU (we did not make this calculation for AP as this is developed in a companion paper from this
special issue in Pulido-Villena et al., in prep). We used total carbohydrates (TCHO) and total 275
aminoacids (TAA) data and assuming they could be representative of dissolved combined
carbohydrates and dissolved proteins, respectively. In situ hydrolysis rates of LAP and GLU were
determined using molar concentrations of TAA and TCHO used as substrate concentration in the
Michaelis-Menten kinetics, respectively. These rates were calculated based on Vm1 Km1, in one
hand and on Vm50 and Km50, on the other hand. The transformation of in situ hydrolysis rates 280
expressed in nmol L-1
h-1
were then transformed in carbon units using C per mole TCHO, C per
mole TAA, and in nitrogen units using N per mole TAA, as the molar distributions of TAA and
TCHO were available.
2.5 Statistics
Trends with depth were estimated using a depth variation factor (DVF) calculated as the mean of 285
pooled ‘surf’and ‘dcm’ data divided by the mean of pooled ‘liw’ and ‘mdw’ data. This decrease (or
increase), was considered as significant after a t-test comparing both series of data. The type of t
test used depended on the result of a preliminary F-test checking for variance. The prism 4 (Graph
Pad software, San Diego, USA) was used to perform nonlinear regressions on Michaelis-Menten
kinetics. Means are cited ± standard errors. Correlations between variables were examined after log 290
transformation of the data.
3.Results
3.1 Hydrological situations.
The sampled stations have basins and latitude characteristics that were superimposed on a changing
the seasonal pattern. Lower surface temperatures (14 - 17°C) were thus measured at ST1 to ST3, 295
sampled in the beginning of the cruise at higher latitudes, and higher temperatures at ST10 (21.6°C)
were sampled at the end of the cruise. T/S diagrams presented profiles characteristic of the different
basins and water masses (Fig. 2). Modified Atlantic Waters (MAW) are characterized by low
salinity below the seasonal thermocline; this property is stretched in the westernmost stations, then
progressively relaxes on eastern station, revealing an eastward circulation in the Algerian Basin and 300
a dispersion in the connected basins (northwestern Mediterranean, Tyrrhenian, and Ionian Seas).
Levantine intermediate waters (LIW) lying at depths of 200 to700 m are characterized by local
salinity maximum in the T/S diagram. This property is pronounced in the eastern stations and
progressively lowered on the western stations, revealing an opposite circulation pattern to the
MAW. The western and eastern Mediterranean Deep waters (WMDW and EMDW, respectively) 305
are formed respectively in the northwestern Mediterranean and in the Adriatic-Aegean Seas; they
occupy depth ranges below the LIW and are clearly separated by the bathymetric shallow sill at the
Sicily strait. The WMDW T/S characteristics (potential temperature 12.91°C, salinity 38.48) were
less salty and colder than in the EMDW water mass observed in the Ionian Sea (potential
7
temperature13.43°C, salinity 38.73). The core of LIW is characterized by lower oxygen content 310
than its surrounding water masses, shallower (MAW) and deeper (WMDW and EMDW). The core
of LIW becomes colder, less salty and deepened along its main trajectory toward the West. We thus
presented all the figures/tables in the order ST10, FAST, ST1, ST2, ST3, ST4, ST5, TYR, ST6 and
ION, according to the expected circulation of the LIW (from the right to the left). The ‘liw’ samples
were situated in a range of 100 m above - 150 m below the core of LIW but were still in its water 315
mass at all stations. The deeper layer sampled ‘mdw’ corresponded to the top of WMDW water
mass in the Western Basin, was inside the modified WMDW in the Tyrrhenian Basin, and was
inside the EMDW in the Ionian Basin. Note however that ST10 is within an anticyclonic eddy, and
ST3 is influenced by the water dynamics along the continental slope of Sardinia.
3.2 Biogeochemical situation 320
Nitrate and phosphate were depleted in the surface layers, exhibiting concentrations below the
detection limits of the classical methods (0.01 µM, table S1). Using the LWCC technique, however,
DIP was detectable (Table S1) and ranged between 4 to 17 nM at 5 m depth. The depth of nitracline
(roughly estimated from the depth where NO3 reaches 50 nM) ranged from 30 to 85 m (Table 1).
Phosphaclines were deeper in the Eastern basin, with greater differences between the depths of 325
phosphacline and nitracline, particularly at ST 6 and ION. Chlorophyll content ranged from 18.7 to
35 mg Tchla m-2
at ST 6 and ST1, respectively (Table 1). The depth of the deep chlorophyll
maximum ranged from 49 to 83 m in the Western basin, with no particular trend in the Tyrrhenian
Sea and its deepest location was in the Ionian Sea (105 m at ION).
The highest DOC values were generally observed within surface layers, and decreased by 330
approximatively 10 µM between layers, the depth variation factor (DVF) ranged from x1.2 to x1.6.
For DON, the DVF was close to that of DOC, ranging from x1.2 to x1.8. Including the 4 layers,
means of DOC/DON and DOC/DOP molar ratios were 14 ± 2 and 2112 ± 1644, respectively with
no significant trend with depth due to the variability within stations. Means of TAA were stable
between ‘surf’ and ‘dcm’ layers, around 210 nM, as the maximum values were either observed 335
within the surface, or within the ‘dcm’ layers (Table S1, Fig. S1a). At all stations TAA rapidly
decreased between the epipelagic and deeper waters (p < 0.001). The mean DVF of TAA (x3.4) was
twice higher than that of DON (x1.5) and this trend was confirmed by contribution of TAA-N to
DON which ranged from between 3 and 9% within the ‘surf’ and the ‘dcm’ layers to between 1.6
and 4.6% at the ‘liw’ and ‘mdw’ layers (Fig. S1a) and this contribution decreased significantly with 340
depth (p < 0.001). TCHO ranged from 111 to 950 nM. The contribution of TCHO-C to DOC ranged
from 1.3 to 9.7% according stations and depths. If epipelagic TCHO values were relatively constant
among the different stations (means 595 ± 43 nM in ‘surf’, 351 ± 73 nM in ‘dcm’, Table S1) the
deeper TCHO distributions varied between station as noted for ‘mdw’ layer in ST5, TYR and ST6
in the Tyrrhenian Sea where the highest values were obtained (Fig. S1b). At some other stations, 345
‘mdw’ layers did not display the highest TCHO values but increased compared to’ liw’ layers. So
that, at 6 stations out of 10, a minimum TCHO value was obtained within ‘liw’ layer (Fig. S1b).
TCHO-C to TAA-C ratio were 4.3 ± 1, 2.5 ± 0.3, 5.5 ± 3.5 and 15 ± 14 within ‘surf’, ‘dcm’, ‘liw’
and ‘mdw’ layers, respectively, increasing significantly with depth (p < 0.02) and exhibiting
particularly high ratios within the Tyrrhenian sea ‘mdw’ layer (ST5 48 TYR 24 , ST6 27). 350
3.3 Ectoenzymatic activities – kinetic trends
The ectoenzymatic activities were determined using large trophic conditions and over a wide range
of substrate concentrations ranging from 0.025 to 50 µM. Different types of kinetics were obtained
8
(see examples in Fig. 3). In general, the LAP increased continuously with the concentrations of
MCA-leu, the AP stabilized around 1 µM MUF-P, whereas the GLU showed intermediary 355
situations. The lowest activities were determined for GLU (Table 2) and for this enzyme,
measurements were unfortunately below detection limits for most ‘liw’ and ‘mdw’ layers.
Occasionally, only few time series showed linear increases of fluorescence with time, coinciding
with the higher range of used concentrations. Consequently, fitting the Michaelis-Menten kinetic
was unfortunately impossible. The means of few GLU rates measurable at depth were 0.010 ± 360
0.006 nmol L-1
h-1
in the ‘liw’ layer and 0.008 ± 0.006 nmol L-1
h-1
in the ‘mdw’ layer and could be
considered as a minimal value of Vm50.
Figures 4 to 6 show the distribution of Vm and Km for each station and in each layer sampled for
leucine aminopeptidase (LAP), glucosidase (GLU) and alkaline phosphatase (AP). Activities
exhibited a large longitudinal variability, particularly AP, even at depth (CV ranged from 101 to 365
163% according layers, Fig. 4). The lowest longitudinal variability was obtained for GLU within
surface layers (34% for Vm50, 45% for Vm1).
In all layers, the highest mean Vm of the 10 stations were obtained for AP, followed by LAP and
then GLU, whatever the range of tested concentrations (Vm50 or Vm1, Table 2). Within ‘surf’ AP
Vm50 and AP Vm1 means were 4 and 6 times higher than their corresponding LAP means, 370
respectively. Within ‘dcm’ layers, these values were 6 and 10 times higher, respectively. Vm50 AP
average was 7 times higher than its corresponding GLU average within ‘surf” (and 5 times at
‘dcm’) and this factor increased considering Vm1 (16 and 20 times, respectively at ‘surf’ and ‘dcm’
layers). For each enzyme, the order of magnitude reached for Vmax was the same at the ‘surf’ and
‘dcm’ layers. 375
For LAP (Fig. 4), Vm50 was on average 3 times higher than Vm1 in ‘surf’ and ‘dcm’ layers, but the
differences between these two rates increased with depth (x9 in ‘liw’, x12 in ‘mdw’). Vm50
decreased from epipelagic to mesopelagic waters by a factor of 8 on average, (ratio ‘depth variation
factor’ – DVF), but by a factor x19 for Vm1 (Fig. 4a). However, if this decrease was particularly
obvious both for Vm1 and Vm50 for stations ST10 to ST5 in the Western Basin, it was not the case 380
for Tyrrhenian waters (ST5, TYR and ST6) where Vm1 decreased but not Vm50. Within ION, Vm1
decreased faster than Vm50. Km50 of LAP showed inconsistent patterns with depth. Some stations
showed a decrease at ‘dcm’ compared to ‘surf’ layers (SD10, SD2, TYR, SD6, ION). Km50 within
‘liw’ layers were on the same order of magnitude than at the surface, sometimes even higher
(FAST, ST 3, ST5, ST6, ION) as well as in the ‘mdw’ layers particularly in Tyrrhenian and Ionian 385
seas (Fig. 4b). For Km1, the trend was a decrease with depth in the western stations (ST10 to ST3)
whereas from stations 4 to ION the order of magnitude of Km1 at all depths were the same, with
sometimes a decrease within ‘liw’ layers (in Tyrrhenian stations).
For GLU (Fig. 5), Vm50 was on average 7 and 5 times higher than Vm1 in ‘surf’ and ‘dcm’
layers, respectively. Their differences in Vm were greater than those observed for LAP or AP (Fig. 390
5a). Km50 was of the same order of magnitude at ‘surf’ and ‘dcm’ layers or slightly lower (ST1,
ST2, ST3, ST6), but the opposite trend was observed for Km1, which tended to be equal or higher
within ‘dcm’ layer (Fig. 5b), in particular in the western stations (ST10, FAST, ST2, ST3).
AP was the enzyme for which Vm1 and Vm50 were the closest (Fig. 6a), with saturation rates
occurring already around 1 µM of added MUF-P (Fig. 3). Vmax50 to Vmax1 ratios were 1.6, 1.3, 395
2.4 and 3.0 on average for ‘surf’, ‘dcm’, ‘liw’ and ‘mdw’ layers, respectively. AP within ‘surf’ layer
9
showed a larger range of longitudinal variability than the remaining studied ectoenzymes. For
instance, Vm50 ranged from 0.3 to 8.3 nmol L-1
h-1
for AP, compared to 0.08 - 0.23 nmol L-1
h-1
for
GLU and 0.36 - 2.85 nmol L-1
h-1
for LAP (Table 2). The trend within ‘surf’ was an increase of AP
towards the east, from a range of 0.8 - 0.9 nmol L-1
h-1
for Vm50 at ST10 and FAST and up to 8 400
nmol L-1
h-1
at ION. Both AP Vm1 and Vm50 decreased with depth (Fig. 6a), although sometimes
both AP Vm50 and AP Vm1 at the ‘dcm’ layer were higher than the surface (ST1, 2, 5 TYR, ION).
At all stations Vm in ‘mdw’ were equal or lower than those within ‘liw’ layers. About the decline
trend with depths, and in opposition with what was described for LAP, we could not see any
difference between the eastern and the western stations. DVF was large, varying from x2.8 to x71 405
for Vm50, with lower decreases with depths at ST10 (x2.8) FAST (x3.2) and ST3 (x2.4), and
highest DVF at ST1 (x34), ST2 (x71) and ION (x54). Vm1 and Vm50 were almost equal (averages
of Vm50/Vm1 ratio for the whole data set was 1.6 ± 0.5), and although for AP Km50 was on
average 7 times higher than Km1, their differences were the lowest compared to the two other
enzymes. Average Km50/Km1 ratio for GLU was 320 and average Km1/Km50 ratio for LAP was 410
118. Km1 and Km50 increased mostly with depth (Fig. 6b) except at ST10. For the other stations,
the trend was that Km50 increased more with depth (DVF ranged from x2 to x29, seven stations)
than Km1 (DVF ranged from x1.9 to x3.8, nine stations).
The turnover time of ectoenzymes was determined as the Km/Vm ratio, which drives the activity at
low concentrations of substrates. The incidence of the tested set of substrate concentration is very 415
important on this parameter, as turnover times are systematically lower for the 25-1000 nM
substrate range of concentrations (Table 4). The turnover times were the lowest for AP and the
highest for GLU. We estimated the degree of difference between the two-kinetics using the
‘biphasic indicator’ as developed in Tholosan et al. (1999). This index tracks the difference between
the initial slopes (Vm/Km) of Michaelis-Menten kinetics as (Vm1/Km1) / (Vm50/Km50). The 420
biphasic indicator was particularly marked for GLU (68 in surface and 29 at the dcm), for LAP it
increased from about ~4 in ‘surf ‘and ‘dcm’ to 10 within ‘liw’ and 20 within ‘mdw’. For AP it
stayed more or less constant at the four layers sampled (range 1.9-3.4).
3.4 Specific activities
Both BP and BA were used to compute specific activities (Table 2, Fig S2). Bulk heterotrophic 425
prokaryotic production (BP) was of the same order of magnitude within ‘surf’ and ‘dcm’ layers and
decreased by a factor of 59 ± 23 on average within ‘liw’ and ‘mdw’ layers. Per layer, BA was less
variable than ectoenzymatic activity or BP. The mean value at epipelagic layers decreased by a
factor of 5 in ‘liw’ and by a factor of 10 in ‘mdw’ layer.
For LAP, specific activities per bacterial cell ranged from 0.1 - 2.1 x 10⁻¹⁸
to 0.7 - 13 x 10-18
mol leu 430
cell-1
h-1
, based on Vm1 and Vm50 rates, respectively (Fig. 7 a, b; Table 3 for Vm1). A significant
decrease with depth between epipelagic waters and deep waters was obtained only for cell-specific
Vm1 LAP, but not for cell-specific Vm50 LAP (p < 0.001). For AP, per cell-specific activities
ranged from 0.11 to 32 x 10-18
mol P cell-1
h-1
and from 0.14 to 39 x 10-18
mol P cell-1
h-1
based on
Vm1 and Vm50 rates, respectively, not differing significantly due to the low differences between 435
APVm1 and APVm50 (Fig. 7 a, b). Cell-specific AP exhibited either an increase or a decrease with
depth (Fig. 8). The depth variation factor (DVF) ranged from x0.1 to x28 (Table 3). Although the t-
test gave no significant differences between epipelagic and deep layers for both specific activities,
the medians of Vm1AP per cell for ‘liw’ and ‘mdw’ layers were lower than those of ‘surf’ and
‘dcm’ (Fig.7 c, d). Specific prokaryotic production ranged from 1 to 136 x 10-18
g C bact-1
h-1
440
10
(Table 3) and always decreased with depth (DVF ranged x4-x23). If only LAP Vm1 rates are
considered, while the specific activities per unit cell decreased with depth, the activity per unit BP
increased with depth at all stations (Table 3). APVm1 per unit BP tended less to increase with depth
than that per unit cell, although a large range of DVF was obtained in both cases according stations
for these parameters (Table 3). For all variables (the three enzymes and BP), the trend of specific 445
activities with depth was highly variable among the different stations (Fig. 9). The highest DVF was
obtained for BP per cell or AP per cell. Only cell-specific Vm 50 LAP, cell-specific Vm1 AP and
cell-specific Vm50 AP sometimes increased with depth.
3.5 In situ hydrolysis rates
The in situ hydrolysis rates of TAA by LAP are higher using Vm1 and Km1 constants than using 450
Km50 and Vm50, by ~3 times in epipelagic but ~7 times in deep waters (Fig. 9). Km50 were much
higher than TAA concentrations (30 to 400 fold according layers). This difference was still visible
but highly lowered considering Km1, as values between TAA and Km1differed by factor 2 to 5.
Consequently, in situ TAA hydrolysis rates by LAP based on Km50 and Vm50 represented few
percent of Vm50 (means of 13% at ‘dcm’ to 0.6% at ‘mdw’). However, based on Km1 and Vm1, in 455
situ rates were relatively higher but in constant proportion relative to Vm1 (30 to 39% according
layers).
The in situ hydrolysis rate of TCHO by GLU are higher using Vm1 and Km1 constants than using
Km50 and Vm50, by ~2.5 times in epipelagic (Fig. 10). Km50 were higher than TCHO
concentrations (Table 2, Table S1), by a mean factor of 18 ± 12 within ‘surf’ and 24 ± 18 at ‘dcm’ 460
layers. Consequently, in situ GLU hydrolysis rates based on Km50 and Vm50 were quasi
proportional to the turnover rate Vm1/Km1and represented a mean of 7% of the Vm50 in epipelagic
layers. At the opposite, Km1 were much lower than TCHO concentrations (by a factor 31 ±19 in
‘surf’, 8 ± 7 at the dcm) and thus most in situ rates based on Km1 and Vm1 were close to Vm1
(93% in ‘surf’, 79% at the ‘dcm’). 465
4. Discussion
4.1 The use of a broader set of substrate concentrations will change our interpretation of
ectoenzyme kinetics
The idea that ectoenzyme kinetics are not monophasic is nor new nor surprising (Sinsabaugh and 470
Shah, 2012 and references therein). But despite the ‘sea of gradients’ encountered by marine
bacteria (Stocker, 2012), multiphasic kinetic is seldom considered. In this work, we compare the
low and high concentration ranges of fluorogenic substrates in order to evaluate the possibility of
considering the different kinetic parameters in relation to the in situ natural concentrations of the
substrates. Unanue et al. (1999), in the coastal, epipelagic Mediterranean Sea in winter, used a set of 475
concentration from 1 nM to 500 µM, revealing biphasic kinetics with a switch between the two
phases around 10 µM for LAP and 1 - 25 µM for GLU. They referred to ‘low affinity systems' and
‘high affinity systems. They also observed that the differences between the Vm of the two types of
enzymes varied according to the range of substrates analyzed. Bogé et al. (2012) used a MUF-P
range from 0.03 to 30 µM and described biphasic AP kinetics in the Toulon Bay, with a switch 480
between the 2 enzymatic systems around 0.4 µM. The biphastic factor as defined in Tholosan et al
(1999) helps to determine the degree of difference between the two Michaelis-Menten kinetics. In
our data set, it was 4.5, 3.7, 11 and 20 for LAP in ‘surf’, ‘dcm’, ‘liw’ and ‘mdw’ layers,
11
respectively, showing enhanced differences in mesopelagic compared to epipelagic waters. Thus,
the differences between these two LAP enzymatic systems could reach differences in the water 485
column as much as in sediments (Tholosan et al., 1999), in which large gradients of organic matter
lability take place. However, it was not the case for all enzymes, as the differences were the lowest
for AP (biphasic factor 3.3, 1.9, 2.4 and 1.7 in ‘surf’, ‘dcm’, ‘liw’ and ‘mdw’ layers, respectively)
and relatively consistent with depth. Finally, the difference between the 2 types of enzymes was
greater for GLU (biphasic factor 68 for ‘surf’ and 29 for ‘dcm’ layers). 490
In this study, the use of MUF-P concentrations ranging between 0.025 and 1 µM highlighted that
AP rates fit well with the Michalis-Menten Kinetic model, with saturations reached at 1 µM. This
AP activity, responding to a low concentration range, should belong to free-living bacteria and/or
dissolved enzymes (< 0.2 µm fraction) with affinities adapted to low concentrations of substrates.
These results are in agreement with average DOP concentration measured, ranging between 12 and 495
122 nM in epipelagic waters (Pulido-Villena et al., this issue in prep) and, when detectable,~ 40 nM
in deep layers. Using fractionation-filtration procedures, much recent works have shown that more
than 50% of the AP activity could be measured in the < 0.2 µm size fraction (Baltar, 2018 and
references therein),whereas the dissolved fraction of other enzymes is generally lower. Hoppe and
Ulrich (1999) found a contribution of the < 0.2 µm fraction of 41% for AP, 22% for LAP and only 500
10% for GLU. We tried during the PEACETIME cruise few size fractionation experiments on
some occasions in ‘surf’ and ‘dcm’ layers (results not shown). Although the size-fraction < 0.6 µm
was filtered only by gravity and a gentle vacuum was applied for the < 0.2 one, AP in the < 0.2 µm
fraction exceeded the total in 3 cases out of 12. Setting these cases to 100%, we obtained a mean
contribution of 60 ± 34% (n = 12) for this size-fraction. However, contributions were on average 25 505
± 16% (n = 12) for GLU and 41 ± 16% (n = 12) for LAP for this same size-fraction (< 0.2 µm),
confirming these trends in the Mediterranean Sea. At the opposite, the higher differences in LAP
Vm and Km, in response to the range of tested concentrations, suggest development of activities
facing large gradients of substrate concentrations.
The use of a large range of concentrations impacted also the Km values. Indeed, excluding low 510
concentrations has consequences on the Km estimation, because if only a high concentration range
is used, the kinetic contribution of any system with high affinity is hidden. Baltar et al. (2009b),
using a concentration of substrates ranging from 0.6 to 1200 µM, reported an increase in the LAP
Km (~400 to 1200 µM) and AP Km (~2 to 23 µM) with depth down to 4500 m in the sub-tropical
Atlantic. In contrast, Tamburini et al. (2002), using a concentration of substrates ranging from 0.05 515
to 50 µM, obtained lower Km values (ranging between 0.4 and 1.1 µM) for LAP in the
Mediterranean deep waters (down to 2000 m depth). It is however difficult to conclude about the
effect of the substrate concentration on Km variability with depth by comparing 2 studies from
different environments. In our study where both kinetics were determined in the same waters, we
came to different conclusions considering Km50 or Km1: if LAP Km1is on average x 24 (surf) to x 520
8 (dcm) higher than GLU Km1, Km50 were in the same order of magnitude: 7 vs 10 µM in ‘surf’
and 5 vs 8 µM in ‘dcm’ layers for LAP and GLU, respectively. On the other hand, ratios of
enzymatic properties are also relevant information for the interpretation of the ectoenzymatic
hydrolysis of the substrate in terms of quality and quantity. For instance, using high concentration
ranges, the LAP Km is largely higher than GLU Km probably because LAP is not adapted to face 525
low concentration ranges, in contrast to GLU (Christian and Karl, 1995). However, when the
fluorogenic substrates have the same range of concentration as the natural substrates used by the
enzyme targeted with the fluorogenic substrate, competition for the active sites could be possible.
12
This increases the risk of overestimating Km1. We thus assumed that Km1, although lower than in
published values, are still potentially overestimated. Another difference in response to the tested 530
range of concentrations for each substrate was the turnover time (Km/Vm ratio): the lower the
Km/Vm, the better the adaptation is to hydrolyze substrates at low concentrations. This should be
considered carefully when comparing reported values.
4.2 Trends with depth
We have shown that, depending on the range of concentrations tested, different conclusions can be 535
drawn regarding the debate about the increase or at least maintenance of specific levels of activity
within deep layers (Koike and Nagata, 1997; Hoppe and Ulrich, 1999; Baltar et al., 2009b).The
trend in vertical depth of activities and cell-specific activities will be discussed below in the context
of the use of different concentration sets for kinetics.
In order to compare enzymatic activities between different water masses, from epi- to meso- and 540
bathypelagic layers, alongside to the decrease with depth of bulk activities, the use of a normalized
activity is required. As most enzymes are produced by heterotrophic prokaryotes, normalization
over total heterotrophic prokaryotic cells is common. However, it is recognized that heterogeneous
distribution of single-cell activities among heterotrophic prokaryotes is a recurrent bias in
interpretation of this parameter (Martinez et al., 1996; Hoppe and Ulrich, 1999; Baltar et al., 545
2009b). In addition, within epipelagic waters some phytoplankton species also express
ectoenzymatic activity such as AP (Dyhrman and Palenik, 1999, Sebastian and Ammermann 2009,
Lin et al., 2012) and LAP (Martinez and Azam, 1993). At depth, gravitational sinking particles
could retain phytoplankton flocs still showing physiological capacities (Lochte and Turley, 1988;
Agusti et al., 2015). 550
Increasing AP activities per cell with depth has been reported in the Indian Ocean (down to 3000 m-
depth; Hoppe and Ullrich, 1999), in the subtropical Atlantic Ocean (down to 4500 m-depth; Baltar
et al.; 2009b) in the central Pacific Ocean (down to 4000 m-depth; Koike and Nagata,1997). These
authors used high concentrations of MUF-P (250 µM, concentration kinetics from 0.6 to 1200 µM
and 150 µM, for these authors, respectively) that could stimulate ectoenzymes of cells attached on 555
suspended or sinking particles, and thus adapted to face higher concentration ranges. However,
these trends were also obtained using low concentrations (max 5 µM MUF-P), at depths down to
3500 m in the Tyrrhenian Sea (Tamburini et al., 2009). In the bathypelagic layers of the central
Pacific, AP rates accounted for as much as half of that observed in the epipelagic layer but the < 0.2
µm dissolved AP was removed to estimate bathypelagic activities (Koike and Nagata, 1997). They 560
suggested that the deep-sea AP is due to fragmentation and dissolution of rapidly sinking particles.
Indeed, it has been shown that AP determined on concentrated particles had the highest
concentration factor compared to AP of bulk seawater among different tested enzymes (Smith et al.,
1992). Note, however, that our data generally stops in mesopelagic layers (1000 m). Tamburini et
al. (2002) obtained a different relative contribution of deep-sea samples when used MUF-P 565
concentrations were 25 nM or 5 µM at the DYFAMED station in the NW Mediterranean Sea (down
to 2000 m-depth), further showing the artifact of the concentration used. Furthermore, as shown by
these authors, the deep activities could be x1.4 to x2.6 times higher due to the effect of hydrostatic
pressure out of convective periods. With concentration kinetics ending at 50 µM of MUF-P, the
specific activities of AP reached using per cell Vm50 or per cell Vm1 were not so different and 570
their trend with depth were similar (Fig. 8). The particulate matter C/P ratio did not change with
13
depth whereas DOC/DOP ratio decreased (from 2200-2400 to 1500-1200), suggesting a preference
for heterotrophic prokaryotes to use dissolved organic phosphorus as substrate of AP.
For LAP activity, however, Vm50 decreased with depth more intensively than Vm1, but cell-
specific LAP showed contradictory results: at all stations cell-specific Vm1 decreased with depth 575
(according to the DVF criterion, Fig. 8) whereas Vm50 remained stable (2 stations over 10) or
increased with depth (5 stations over 10).Using a high concentration of MCA-leu other authors have
systematically found an increase in LAP activity per cell with depth in bathypelagic layers (Zaccone
et al., 2012; Caruso et al., 2013). From our data set, among the two parameters LAP Vm and LAP
Km, it is LAP Km which showed the largest differences between the 2 types of kinetics. Km 50 580
particularly increased with depth more than Km1, and the ratio Km50/Km1 switched from ~16 in
epipelagic waters to 121 and 316 in ‘liw’ and ‘mdw’ layers, respectively. At many stations (TYR,
ION, FAST and ST10), LAP Km1 was stable or decreased with depth whereas LAP Km50
increased, suggesting that within deep layers the LAP activity was more linked to the availability of
suspended particles or fresh organic matter associated to sinking material, than to DON. Thus, the 585
difference between Km1 and Km50 might reflect a strategy to adapt to a potential spatial and/or
temporal patchiness in the distribution of suspended particles. Freshly sinking material is
statistically not included in the bulk, because of the small volume of water incubated, but could
contribute to the release of free bacteria, small suspended particles and DOM within its associated
plume (Azam and Long, 2001; Tamburini et al., 2003; Grossart et al., 2007; Fang et al., 2014). 590
Baltar et al. (2009a) also suggested that hot spots of activity at depth were associated with particles.
The fact that the C/N ratio of particulate material increased (from 11-12 to 22-25) but not that much
for DOC/DON (13-12 to 14-15 from ‘surf’ and ‘dcm’ to ‘liw’ and ‘mdw’, respectively) confirms a
preferential utilization of proteins substrates from particles. Recently, Zhao et al. (2020), based on
the increasing contribution of genes encoding secretory enzymes, suggested that deep-sea 595
prokaryotes and their metabolism are likely associated with particles rather than on the utilization of
ambient-water DOC.
Variation in the relative activities of different enzymes is suggested as a possible indicator of
changes of bacterioplankton nutrition patterns along the water column. The LAP/GLU ratio
decrease with depth follows the decrease of protein to carbohydrate ratio of particulate material 600
(Misic et al., 2002), nitrogen being remineralized faster than carbon. However, here, the TCHO-
C/TAA-C ratio was consistently higher within the ‘dcm’ layer (~90 m) than at the surface and the/
LAP/GLU ratio generally increased also as a consequence. Below the ‘dcm’ layer, we estimated
Vm50 LAP/GLU ratios from few of the single rates measured at high concentration (above LOD),
and observed an increase with depth. Despite the particulate C/N ratio increasing with depth and 605
TCHO-C/TAA-C increasing in the ‘mdw’ layer, LAP increased faster than GLU with depth.
Others have also shown an increase of LAP/GLU ratio with depth (Hoppe and Ullrich, 1999 in
Indian Ocean, Placenti et al., 2018 in the Ionian Sea). Many factors, such as the freshness of the
suspended particles, a recent event of convection, a lateral advection from margins, as well as the
seasonality and taxonomic composition of phytoplankton could influence dynamics at depth, 610
particularly in the mesopelagic layer (Severin et al. 2016, Caruso et al 2013).
4.3 Regional variability
In epipelagic waters, both AP maximum rates (Vm1, Vm50) significantly increased from the
Algerian/Ligurian Basins to the Tyrrhenian Basin (t test, p = 0.002 and p = 0.02, respectively), and
reached maximum values at ION. This longitudinal increase in AP activity was also confirmed by 615
14
calculating specific activities which also increased towards ION. This increase of cell-specific AP
appears to follow a decrease in DIP availability. While DIP can be assimilated directly through a
high affinity absorption pathway, the assimilation of DOP requires that the molecule is first
remineralized to separate the DIP from the carbon fraction, using AP enzymes. POP is an indicator
of living biomass and enzyme producers, but the correlation between VmAP and POP were 620
negative in the surface layers (log-log relationship, r = - 0.86, -0.88 for Vm50 and Vm1,
respectively), suggesting that POP reflected more the progressive eastward decline of living
biomass and its increased capacity to derepress AP genes. VmAP rates in the surface did not
correlate with DIP, however the relative DIP deficiency increased eastward, suggested by the
deepening of the phosphacline (Table 1), the decrease of average DIP concentration within the 625
phosphate-depleted layer and the decrease in P diffusive fluxes reaching the surface layer (Pulido-
Villena et al. 2020, in prep, this issue). Along a trans-Mediterranean transect, Zaccone et al. (2012),
did not get any trend between DIP and AP as well, although they found also increased values of AP
specific activities in the Eastern Mediterranean Sea. Bogé et al. (2012), using a concentration set
close to ours (0.03-30 µM MUF-P) obtained differences in Vm for the 2 types of kinetics (contrary 630
to our results) and described different relationships with DOP and DIP according to the low and
high affinity systems. Such differences could be due to the large gradient of trophic conditions in
their study, involving a eutrophic bay where DOP and DIP concentration ranged from 0 to 185 nM,
and from 0 to 329 nM, respectively. In order to circumvent the effect of depth, correlations are
described in our study only for 10 surface data where DIP concentration range is narrow (4-17 nM). 635
The AP/LAP ratio can be used as an indicator of N - P imbalance as demonstrated in enrichment
experiments (Sala et al. 2001). In this study, large concentrations of substrates were used (200 µM)
and they described a decrease of the AP/LAP ratio after DIP addition and conversely, a large
increase of it (10 fold) after addition of 1 µM nitrate. In their initial experimental conditions, the
ratio ranged from 0.2 to 1.9. We observed a similar low ratio in the western Mediterranean Sea, but 640
in the Ionian Sea the AP/LAP reached 17 (Vm50) and 43 (Vm1) suggesting that nutrient stress and
imbalance can be as important and variable in different regions of the Mediterranean Sea as
observed after manipulation of nutrients.
LAP/GLU ratio is used as an index of the ability of marine bacteria to preferentially metabolize
proteins rather than polysaccharides. The prevalence of LAP over GLU is a recurrent observation 645
in temperate areas (Christian and Karl, 1995; Rath et al., 1993) and in high latitudes (Misic et al.,
2002, Piontek et al., 2014). For example, LAP/GLU ratio varied widely from the Equator to the
Southern Ocean, with values from 0.28-to 593 (Sinsabaugh and Shah, 2012). In the Ross Sea, this
ratio exhibited a relationship with primary production (Misic et al., 2002). In the Caribbean Sea,
along an eutrophic to oligotrophic gradient, the LAP/GLU ratio increased toward oligotrophy 650
(Rath and Herndl, 1993). In epipelagic zone, during our study, the degree of trophic conditions
exhibited a small gradient of productivity (18 to 35 mg Chla m-2
) along the western to the eastern
Mediterranean Sea. Following this gradient, LAP /GLU ratio ranged from 3 to 17 for Vm50, and
from 8 to 34 for Vm1 and thus varied according to the concentration range tested. However we
found no statistical significant difference between Tyrrhenian Sea and the western area, due to a 655
high intra-regional variability. Unanue et al. (1999) established biphasic kinetics and obtained a
ratio VmLAP / VmGLU around 20 for their low concentration range and around 10 for their high
concentration range, confirming our results. Finally, the LAP/GLU ratios reported in this study
and other works using low substrates ranges are still lower than when using higher concentrations:
20-200 in the subarctic Pacific (Fukuda et al., 1995, using 200 µM concentration), 213 at station 660
15
ALOHA in the equatorial Pacific (Christian and Karl, 1995, using LLBN instead of MCA-leu at
1000 µM and MUF-GLU at 1.6 µM), suggesting that the ratio LAP/GLU highly changes
according to the fluorogenic substrate concentration and not in a regular way.
Within deeper layers, cell-specific LAP and cell-specific AP tended to be higher within Tyrrhenian
Sea and ION stations than on the westernmost stations, although comparisons between both areas 665
were insignificant due to the high intra-regional variability. Azzaro et al. (2012) showed high
seasonal variability in heterotrophic metabolism in the Southern Adriatic Pit, down to 1200 m
depth, and they relied this variability to deep convection events. Tamburini et al. (2002, 2009)
noticed also a seasonal variability on deep samples depending on seasonal variability of surface
productivity and particle fluxes. During an intense water column mixing (0-1500 m) in the NW 670
Mediterranean Sea, Severin et al. (2016) showed that deep-sea convection enhanced bacterial
abundance and bacterial heterotrophic production at depth, resulting in a drastic decline of cell-
specific extracellular enzymatic activities (up to 67%).
4.4 Potential contribution of macromolecules hydrolysis to bacterial production
Computation of in situ hydrolysis rates demonstrated the direct influence of the determination of 675
Km and Vm using an appropriate set of fluorogenic concentration to compute rates. TAA
concentrations were lower than Km1 and Km50. The two Michaelis–Menten plots cross each other,
at a substrate value of about 1.8 ± 1.3 µM with LAP and 1.7 ± 0.6 µM with GLU. Considering the
TAA range, the high affinity system (Km1 Vm1) with its low Km and higher turnover rates gave
consequently better in situ rates than the low affinity system (Km50 Vm50). Although TCHO 680
ranges were lower than Km1 but higher than Km50, TCHO was always lower than the crossing
concentration point of the two types of kinetics, and consequently, again, the high affinity system
gave higher in situ hydrolysis rates than the low affinity system. If the experimentally added
substrate concentration is clearly above the possible range of concentrations found in the natural
environment, in situ rates could be largely overestimated. To obtain a significant determination of 685
the in situ rates, the added substrate concentrations should be close to the range of variation
expected in the studied environment (Tamburini et al., 2002).
We compared the in situ LAP hydrolysis rates to the N demand of heterotrophic prokaryotes (which
was based on bacterial production data assuming C/N ratio of 5 and no active excretion of
nitrogen), and the in situ rates of TAA plus TCHO to the bacterial carbon demand (based on a 690
bacterial growth efficiency of 10% (Gazeau et al, this issue, in prep, Céa et al., 2014, Lemée et al.,
2012). Using the low affinity constants (Vm50 and Km50), hydrolysis of TAA by LAP contributed
only to 25% ± 22% of the bacterial N demand in epipelagic layers and 26% ± 24% in deep layers.
This contribution increased using the high affinity system (48% ± 29% and 180% ± 154% in
epipelagic layers and deep layers, respectively). In the North Atlantic, LAP hydrolysis rates of 695
particles (0.3 µM MCA-leucine added) to bacterial nitrogen demand varied between 63 and 87%,
increasing at 200 m. Crottereau and Delmas (1998) combined kinetics of LAP with combined
amino acid concentrations and found a range of 6 – 121% contribution to bacterial N demand in
aquatic eutrophic ponds. A large variability of LAP hydrolysis to bacterial N demand has been also
detected in coastal-estuarine environments using a radiolabeled natural protein as a substrate (2 – 700
44%, Keil and Kirchman, 1993). Pointek et al. (2014), along a 79°N transect in North Atlantic, used
the turnover of GLU and LAP determined with 1 µM analog substrate concentrations to compute
in situ TCAA and TCHO hydrolysis rates and showed that 134% and 52% of BP could be
supported by substrates issued from peptide and polysaccharides activities, respectively. Based on a
16
BGE of 10%, these fluxes will represent 10 times less, i.e. 13 and 5% of bacterial carbon demand, 705
which is in the same order of magnitude as we obtained. In our study, the contribution of TAA
hydrolysis to bacterial N demand is increasing within the ‘dcm’ compared to the ‘surf’ layer (from
means of 10 to 40% based on the high affinity system). This is consistent, however, as some
cyanobacteria can express also LAP (Martinez and Azam, 1993) and Synechococcus and
Prochlorococcus are dominant phytoplankton groups in the Mediterranean Sea (Siokou-Frangou et 710
al., 2010). In our study, the ‘dcm’ was an active biomass layer where primary production (PP)
peaked (Maranon et al., 2020). Size fractionation of primary production showed the importance of
the phytoplankton excretion, contributing from 20 to 55% to total PP according the stations
(Maranon et al., 2020.). Within the surface mixed layer, other sources of N like atmospheric
deposition could sustain a significant part of bacterial N demand. The dry atmospheric deposition 715
(inorganic+ organic) of N at all the stations within the PEACETIME cruise corresponded to 25 ±
17% of bacterial N demand (Van Wambeke et al, in prep).
Likewise, the in situ cumulative hydrolysis rates of TCHO by GLU, estimated only in epipelagic
layers were also ~3 times higher using the high affinity system. We summed C sources coming
from the hydrolysis by LAP and by GLU in epipelagic layers (Fig. 10) and compared them to the 720
bacterial carbon demand. Dissolved proteins and combined carbohydrates contributed only to a
small fraction of the bacterial carbon demand: 1.5% based on the low affinity system constants and
3% based on the high affinity system.
It is only within deeper layers that the hydrolysis rates of TAA were at some stations more
important than bacterial N demand, suggesting that proteolysis is one of the major sources of N for 725
heterotrophic bacteria in aphotic layers. However, it was only based on Vm1 and Km1 kinetic
parameters (i.e. the high affinity system) that we found cases of over-hydrolysis of organic nitrogen
(Fig. 9). This over-hydrolysis was particularly marked in the LIW water mass of the Tyrrhenian
Basin, in which over-hydrolysis up to 220% was obtained as well as higher TAA concentrations in
comparison to “older’ LIW waters in the Algerian Basin. TAA decreased faster than DON along 730
LIW trajectory so the labile DON fraction (combined aminoacids) was degraded first. The role of
sedimenting particles or large aggregates associated with attached bacteria are considered as major
providers of labile organic matter for free bacteria (Smith et al., 1992). We could consider that with
the 5 mL volume of water hydrolyzed for TAA analysis, and in the 2 mL water volume used to
determine ectoenzymatic kinetics, most of this particulate detrital pool of large size or high density 735
(i.e. fast sinking particles) is underrepresented, thus the contribution of TAA hydrolysis to bacterial
nitrogen demand is underestimated. However, there is an increasing evidence of secretion not only
of monomers issued from hydrolysis, but also of ectoenzymes produced by particles-attached deep-
sea prokaryotes themselves (Zhao et al., 2020). This could explain why, in a small volume of bulk
sea water sample, not representative of large or fast sedimenting particles, we still found biphasic 740
kinetics. Studying alkaline phosphatase activity in the Toulon Bay, Bogé et al. (2013) observed
biphasic kinetics only in the dissolved phase, which also suggests that AP low affinity system
originates from enzyme secretion from particles. Afterwards, this team focused their research by
size fractionation of particulate material, and they found that the origin of the low affinity system
was mostly due to the > 90 µm fraction, i.e. large particles (Bogé et al., 2017). 745
5 Conclusions
The use of microplate titration technique improved greatly the simultaneous study of different
ectoenzymatic activities. Vertical and regional variability of activities were shown in the
17
Mediterranean Sea, where heterotrophic prokaryotes face not only carbon, but also N, P limitations.
Although biased by the use of artificial fluorogenic substrates, ectozenzymatic activity is an 750
appropriate tool to study the adaptation of prokaryotes to the large gradients in stoichiometry,
chemical characteristics and quantities of organic matter they face, especially when using a large
panel of concentrations. Further combination of such techniques with the chemical identification of
DOC and DON pools, and meta-omics, as well as the use of marine snow catchers, would help our
understanding of the biodegradation of organic matter in a ‘sea of gradients’. 755
Acknowledgements: This study is a contribution of the PEACETIME project (http://peacetime-
project.org), a joint initiative of the MERMEX and ChArMEx components supported by CNRS-
INSU, IFREMER, CEA, and Météo-France as part of the program MISTRALS coordinated by
INSU (doi: 10.17600/17000300). The authors thank also many scientists & engineers for their
assistance with sampling/analyses: J Ras for TCHO, R Flerus for TAA, J Guittoneau for nutrients, T 760
Blasco for POC, J Uitz and C Dimier for TChla (analysed at the SAPIGH HPLC analytical service
at the IMEV, Villefranche), I Obernosterer, P Catala and B Marie for DOC and bacterial
abundances. We warmly thank C Guieu and K Deboeufs, as coordinators of the program
PEACETIME.
765
References
Agusti, S., Gonzalez-Gordillo, J. I., Vaque, D., Estrada, M., Cerezo, M. I., Salazar, G., Gasol, J. M.,
and Duarte, C. M.: Ubiquitous healthy diatoms in the deep sea confirm deep carbon injection
by the biological pump, Nat. Commun., 6, doi: 10.1038/ncomms8608, 2015.
Aminot, A. and Kérouel, R.: Dosage automatique des nutriments dans les eaux marines, in: 770
Méthodes d'analyses en milieu marin, edited by: IFREMER, 188 pp, 2007.
Arnosti, C.: Microbial Extracellular enzymes and the marine carbon cycle, Ann. Rev. Mar. Sci., 3,
401-425, 2011.
Arrieta, J. M. and Herndl, G. J.: Assessing the diversity of marine bacterial -glucosidases by
capillary Electrophoresis Zymography, Appl. Environ. Microb., 67, 4896-4900, 2001. 775
Azam, F., and Long, R. A.: Sea snow microcosms, Nature, 414, 495-498, 2001.
Azzaro, M., La Ferla, R., Maimone, G., Monticelli, L. S., Zaccone, R., and Civitarese, G.:
Prokaryotic dynamics and heterotrophic metabolism in a deep convection site of Eastern
Mediterranean Sea (the Southern Adriatic Pit), Cont.Shelf Res., 44, 06-118, doi:
10.1016/j.csr.2011.07.011, 2012. 780
Baklouti, M., Diaz, F., Pinazo, C., Faure, V., and Quéguiner, B.: Investigation of mechanistic
formulations depicting phytoplancton dynamics for models of marine pelagic ecosystems and
description of a new model, Prog. Oceanogr., 71, 1–33, doi :1016/j.pocean.2006.05.002,
2006.
Baltar, F., Arístegui, J., Gasol, J. M., Sintes, E., and Herndl, G. J.: Evidence of prokaryotic 785
metabolism on suspended particulate organic matter in the dark waters of the subtropical
North Atlantic, Limnol. Oceanogr., 54, 182-193, doi:10.4319/lo.2009.54.1.0182, 2009a.
Baltar, F., Aristegui, J., Sintes, E., van Aken, H. M., Gasol, J. M., and Herndl, G. J.: Prokaryotic
extracellular enzymatic activity in relation to biomass production and respiration in the meso-
and bathypelagic waters of the (sub)tropical Atlantic, Env. Microbiol., 11, 1998–2014, 2009b. 790
Baltar, F.: Watch Out for the “Living Dead”: Cell-Free Enzymes and Their Fate, Front. Microbiol.,
8, article 2438, doi: 10.3389/fmicb.2017.02438,2018.
Bogé G., Lespilette, M., Jamet, D., and Jamet, J-L.: Role of sea water DIP and DOP in controlling
bulk alkaline phosphatase activityin N.W. Mediterranean Sea (Toulon, France), Marine
Pollution Bulletin, 64, 1989-1996, doi: 10.1016/j.marpolbul.2012.07.028, 2012. 795
Bogé, G., Lespilette, M., Jamet, D. and Jamet, J.-L.: The relationships between particulate and
soluble alkaline phosphatase activities and the concentration of phosphorus dissolved in the
18
seawater of Toulon Bay (NW Mediterranean). Mar. Pollut. Bull., 74, 413-419, doi:
10.1016/j.marpolbul.2013.06.003, 2013.
Bogé, G., Lespilette, M., Jamet, D., and Jamet, J.-L.: Role of DOP on the alkaline phosphatase 800
activity of size fractionated plankton in coastal waters in the NW Mediterranean Sea (Toulon
Bay, France), Mar. Pollut. Bull., 117, 264-273, doi:10.1016/j.marpolbul.2016.11.037, 2017.
Caruso, G., Monticelli, L., La Ferla, R., Maimone, G., Azzaro, M., Azzaro, F., Decembrini, F., De
Pasquale, F., Leonardi, M., Raffa, F., Zappal, G., and De Domenico, E.: Patterns of
Prokaryotic Activities and Abundance among the Epi-Meso and Bathypelagic Zones of the 805
Southern-Central Tyrrhenian Sea, Oceanography, 1, 1, doi: 10.4172/ocn.1000105, 2013.
Cauwet, G.: Determination of dissolved organic carbon (DOC) and nitrogen (DON) by high
temperature combustion, in: Methods of Seawater analysis, edited by: Grashoff, K.,
Kremling, K. and Ehrhard, M., 3rd Ed., Wiley-VCH, Weinheim, 407-420, 1999.
Céa, B., Lefèvre, D., Chirurgien, L., Raimbault, P., Garcia, N., Charrière, B., Grégori, G., 810
Ghiglione, J.-F., Barani, A., Lafont, M., and Van Wambeke, F.: An annual survey of bacterial
production, respiration and ectoenzyme activity in coastal NW Mediterranean waters:
temperature and resource controls, Environ Sci Pollut Res, doi: 10.1007/s11356-014-3500-9,
2014.
Christian, J. R. and Karl, D. M.: Bacterial ectoenzymes in marine waters: Activity ratio and 815
temperature responses in three oceanographic provinces, Limnol. Oceanogr., 40, 1046-1053,
1995.
Chróst, R.J. Microbial enzymes in aquatic environments, Springer-Verlag, New York, 1991.
Dittmar, T.H., Cherrier, J. and Ludwichowski, K.-U: The analysis of amino acids in seawater. In:
Practical Guidelines for the Analysis of Seawater, edited by: Wurl, O., Boca Raton, FL: 820
CRC-Press, 67–78, 2009.
Dyhrman, S. and Palenik, B.: Phosphate stress in cultures and field populations of the dinoflagellate
Prorocentrum minimum detected by a single-cell alkaline phosphatase assay, Appl. Environ.
Microb., 65, 3205-3212, doi: 10.1128/aem.65.7.3205-3212.1999, 1999.
Engel, A., and Händel, N.: A novel protocol for determining the concentration and composition of 825
sugars in particulate and in high molecular weight dissolved organic matter (HMW-DOM) in
seawater. Mar. Chem. 127, 180–191, 2011
Fang, J., Zhang, L., Li, J., Kato, C., Tamburini, C., Zhang, Y., Dang, H., Wang, G., & Wang, F.:
The POM-DOM piezophilic microorganism continuum (PDPMC)—The role of piezophilic
microorganisms in the global ocean carbon cycle, Science China (Earth Sciences), 1–10, 830
doi:10.1007/s11430-014-4985-2, 2014.
Gazeau, F., Ridame, C., Van Wambeke,F., Alliouane, S., Irisson, J-O., Marro, S., Grisoni, J-M., De
Liège, G., Nunige, S., Djaoudi, K., Pulido-Villena, E., Dinasquet, J., Obernosterer, I., Catala,
P., Guieu,C.: Impact of dust enrichment on Mediterranean plankton communities under
present and future conditions of pH and temperature: an experimental overview. 835
Biogeosciences Discuss., submitted, this issue.
Gazeau, F., Van Wambeke, F., Marañón, E., Pérez-Lorenzo, M., Alliouane, S., Stolpe, C., Blasco,
T., Zäncker, B., Engel, A., Marie, B., Guieu, C.: Impact of dust enrichment on carbon budget
and metabolism of Mediterranean plankton communities under present and future conditions
of pH and temperature, Biogeosciences Discuss., in prep., this issue. 840
Grossart, H.-P., Tang, K. W., Kiørboe, T., and Ploug, H.: Comparison of cell-specific activity
between free-living and attached bacteria using isolates and natural assemblages, FEMS
Microb. Lett., 266, 194–200, doi:10.1111/j.1574-6968.2006.00520.x, 2007.
Guieu, C., D'Ortenzio, F., Dulac, F., Taillandier, V., Doglioli, A., Petrenko, A., Barrillon, S.,
Mallet, M., Nabat, P., and Desboeufs, K.: Process studies at the air-sea interface after 845
atmospheric deposition in the Mediterranean Sea: objectives and strategy of the PEACETIME
oceanographic campaign (May–June 2017), Biogeosciences Discuss.,
https://doi.org/10.5194/bg-2020-44, in review, 2020.
Guyennon, A., Baklouti, M., Diaz, Palmiéri, J., Beuvier, J., Lebeaupin-Brossier, C., Arsouze, T.,
Beranger, K., Dutay, J.-C., and Moutin, T.: New insights into the organic carbon export in the 850
19
Mediterranean Sea from 3-D modeling, Biogeosciences, 12, 25-7046, doi: 10.5194/bg-12-
7025-2015, 2015.
Hoppe, H.-G.: Significance of exoenzymatic activities in the ecology of brackish water:
measurements by means of methylumbelliferyl-substrates, Mar. Ecol. Prog. Ser., 11, 299-308,
1983. 855
Hoppe, H.-G. and Ullrich, S.: Profiles of ectoenzymes in the Indian Ocean: phenomena of
phosphatase activity in the mesopelagic zone, Aquat. Microb. Ecol., 19, 139-148, 1999.
Hoppe, H.-G., Ducklow, H., and Karrasch, B.: Evidence for dependency of bacterial growth on
enzymatic hydrolysis of particulate organic matter in the mesopelagic ocean, Mar. Ecol. Prog.
Ser,, 93, 277-283, 1993. 860
Keil, R.G, and Kirchman, D.: Dissolved combined amino acids: Chemical form and utilization by
marine bacteria, Limnol. Oceanogr., 38: 1256-1270, 1993
Kirchman, D. L.: Leucine incorporation as a measure of biomass production by heterotrophic
bacteria. In: Handbook of methods in aquatic microbial ecology, edited by: Kemp, P.F., Sherr,
B.F., Sherr, E.B. and Cole, J.J., Lewis, Boca Raton, 509-512, 1993. 865
Koch, A.L.: Oligotrophs versus copiotrophs, BioEssays, 23, 657–661, 2001.
Koike, I. and Nagata, T.: High potential activity of extracellular alkaline phosphatase in deep waters
of the central Pacific, Deep-Sea Res. PT II, 44, 2283-2294, 1997.
Kress, N., Manca, B., Klein, B. and Deponte, D.: Continuing influence of the changed thermohaline
circulation in the eastern Mediterranean on the distribution of dissolved oxygen and nutrients: 870
Physical and chemical characterization of the water masses, J. Geophys. Res. Oceans, 108,
8109, doi:10.1029/2002JC001397, 2003.
Krom, M. D., Herut, B. andMantoura, R. F. C.: Nutrient budget for the eastern Mediterranean:
Implication for phosphorus limitation, Limnol. Oceanogr, 49, 1582-1592,
doi:10.4319/lo.2004.49.5.1582, 2004. 875
Lemée, R., Rochelle-Newall, E., Van Wambeke, F., Pizay, M.-D., Rinaldi, P., and Gattuso, J.-P.:
Seasonal variation of bacterial production, respiration and growth efficiency in the open NW
Mediterranean Sea., Aquat. Microb. Ecol., 29, 227-237, 2002
Lindroth, P., and Mopper, K.: High performance liquid chromatographic determination of
subpicomole amounts of amino acids by precolumn fluorescence derivatization with o-880
phthaldialdehyde, Anal. Chem. 51, 1667–1674, 1979
Lin, X., Zhang, H., Cui, Y., and Lin, S.: High sequence variability, diverse subcellular localizations,
and ecological implications of alkaline phosphatase in dinoflagellates and other eukaryotic
phytoplankton, Front. Microbiol., 3, article 235, doi: 10.3389/fmicb.2012.002352012, 2012.
Lochte, K. and Turley, C. M.: Bacteria and cyanobacteria asociated with phytodetritus in the deep 885
sea, Nature, 333, 67-69, 1988.
Malanotte-Rizzoli P., Manca, B.B., Marullo,S., Ribera d'Alcalà,M., Roether, W., Theocharis, A.
and Conversano, F.: The Levantine Intermediate Water Experiment (LIWEX) Group:
Levantine basin - A laboratory for multiple water mass formation processes, J. Geophys. Res-
Oceans, 108, doi:10.1029/2002JC001643, 2003. 890
Marañón, E., Van Wambeke, F., Uitz, J., Boss, E.S., Pérez-Lorenzo, M., Dinasquet, J., Haëntjens,
N., Dimier, C., Taillandier, V.: Deep maxima of phytoplankton biomass, primary production
and bacterial production in the Mediterranean Sea during late spring, Biogeosciences
Discuss., https://doi.org/10.5194/bg-2020-261, 2020
Martinez, J. and Azam, F.: Aminopeptidase activity in marine chroococcoid cyanobacteria. Appl. 895
Environ. Microb., 59, 3701-3707, 1993.
Martinez, J., Smith, D. C., Steward, G. F., and Azam, F.: Variability in ectohydrolytic enzyme
activities of pelagic marine bacteria and its significance for substrate processing in the sea.,
Aquat. Microb. Ecol., 10, 223-230, 1996.
Misic, C., Povero, P., and Fabiano, M.: Ectoenzymatic ratios in relation to particulate organic 900
matter distribution (Ross Sea, Antarctica), Microb. Ecol., 44, 224-234, doi:10.1007/s00248-
002-2017-9, 2002.
20
Piontek, J., Sperling, M., Nothig, E.-V., and Engel, A.: Regulation of bacterioplankton activity in
Fram Strait (Arctic Ocean) during early summer: The role of organic matter supply and
temperature, J. Marine Syst., 132, 83-94, doi: 10.1016/j.jmarsys.2014.01.003, 2014. 905
Placenti, F., Azzaro, M., Artale, V., La Ferla, R., Caruso, G., Santinelli, C., Maimone, G.,
Monticelli, L. S., Quinci, E. M., and Sprovieri, M.: Biogeochemical patterns and microbial
processes in the Eastern Mediterranean Deep Water of Ionian Sea, Hydrobiologia, 815, 97-
112, doi: 10.1007/s10750-018-3554-7, 2018.
Pulido-Villena, E., Van Wambeke, F., Desboeufs, K., Petrenko, A., Barrillon, S., Djaoudi, K., 910
Doglioli, A., D’Ortenzio, F., Fu, Y., Gaillard, T., Guasco, S., Nunige, S., Raimbault, P.,
Taillandier, V., Triquet, S., Guieu, C.: Analysis of external and internal sources contributing
to phosphate supply to the upper waters of the Mediterranean Sea (Peacetime cruise), in
prep for Biogeosciences, special issue PEACETIME.
Raimbault, P., Pouvesle W., Diaz F., Garcia N., Sempere, R.: Wet-oxidation and automated 915
colorimetry for simultaneous determination of organic carbon, nitrogen and phosphorus
dissolved in seawater, Marine Chemistry 66, 161-169, 1999.
Rath, J., and Herndl, G. J.: Characteristics and Diversity of ß-D-Glucosidase (EC 3.2.1.21) Activity
in Marine Snow, Appl. Environ. Microbiol., 60, 807-813, 1994.
Sala, M. M., Karner, M., Arin, L., and Marrassé, C.: Measurement of ectoenzyme activities as an 920
indication of inorganic nutrient imbalance in microbial communities, Aquat. Microb. Ecol.,
23, 301-311, doi:10.3354/ame023301, 2001.
Sebastian, M. and Ammerman, J. W.: The alkaline phosphatase PhoX is more widely distributed in
marine bacteria than the classical PhoA, The ISME journal, 3, 563-572, doi:
10.1038/ismej.2009.102009, 2009. 925
Severin, T., Sauret, C., Boutrif, M., Duhaut, T., Kessouri, F., Oriol, L., Caparros, J., Pujo-Pay, M.,
Durrieu de Madron, X., Garel, M., Tamburini, C., Conan, P., and Ghiglione, J. F.: Impact of
an intense water column mixing (0–1500 m) on prokaryotic diversity and activities during an
open-ocean convection event in the NW Mediterranean Sea, Environ. Microbiol., 18, 4378-
4390, doi:10.1111/1462-2920.13324, 2016. 930
Stocker, R.: Marine Microbes See a Sea of gradients, Science, 38, 628-633, 2012.
Sharp, J. H.: Improved analysis for "particulate" organic carbon and nitrogen from seawater,
Limnol.Oceanogr., 19, 984-989, 1974.
Sinsabaugh, R. and Follstad Shah, J.: Ectoenzymatic Stoichiometry and Ecological Theory, Annu.
Rev. Ecol., Evol. S., 43, 313-343, doi:10.1146/annurev-ecolsys-071112-124414, 2012. 935
Smith, D. C. and Azam, F.: A simple,economical method for measuring bacterial protein synthesis
rates in sea water using 3H-Leucine, Mar. Microb. Food Webs, 6, 107-114, 1992.
Smith, D. C., Simon, M., Alldredge, A. L., and Azam, F.: Intense hydrolytic activity on marine
aggregates and implications for rapid particle dissolution, Nature, 359, 139-142, 1992.
Taillandier, V., Prieur, L., D’Ortenzio, F., Riberad’Alcala, M., Pulido-Villena, E.: Profiling float 940
observation of thermohaline staircases in the westernMediterranean Sea and impact on
nutrient fluxes, Biogeosciences, 17, 3343–3366, https://doi.org/10.5194/bg-17-3343-2020,
2020
Tamburini, C., Garcin, J., Ragot, M., and Bianchi, A.: Biopolymer hydrolysis and bacterial
production under ambient hydrostatic pressure through a 2000 m water column in the NW 945
Mediterranean. Deep-Sea Res. PT II, 49, 2109–2123, doi:10.1016/S0967-0645(02)00030-9,
2002.
Tamburini, C., Garcin, J., and Bianchi, A.: Role of deep-sea bacteria in organic matter
mineralization and adaptation to hydrostatic pressure conditions in the NW Mediterranean
Sea, Aquat. Microb. Ecol., 32, 209–218, doi: 10.3354/ame032209, 2003. 950
Tamburini, C., Garel, M., Al Ali, B., Mérigot, B., Kriwy, P., Charrière, B., and Budillon, G.:
Distribution and activity of Bacteria and Archaea in the different water masses of the
Tyrrhenian Sea, Deep Sea Res.PT II, 56, 700-714, doi: 10.1016/j.dsr2.2008.07.021, 2009.
Thingstad, T. F. and Rassoulzadegan, F.: Nutrient limitations, microbial food webs, and 'biological
C-pumps': suggested interactions in a P-limited Mediterranean, Mar. Ecol. Prog. Ser., 117, 955
299-306, 1995.
21
Tholosan, O., Lamy, F., Garcin, J., Polychronaki, T., and Bianchi, A.: Biphasic extracellular
proteolytic enzyme activity in benthic water and sediment in the North Western
Mediterranean Sea, Appl. Environ.Microb., 65, 1619-1626, 1999.
Unanue, M., Azua, I., Arrieta, J. M., Labirua-Iturburu, A., Egea, L., and Iriberri, J.: Bacterial 960
colonization and ectoenzymatic activity in phytoplankton-derived model particles: Cleavage
of peptides and uptake of amino acids, Microb. Ecol., 35, 136-146, doi:
10.1007/s002489900068, 1998.
Unanue, M., Ayo, B., Agis, M., Slezak, D., Herndl, G. J., andIriberri, J.: Ectoenzymatic activity and
uptake of monomers inmarine bacterioplankton described by a biphasic kinetic model, 965
Microb. Ecol., 37, 36–48, doi:10.1007/s002489900128,1999.
Van Wambeke, F., Christaki, U., Giannakourou, A., Moutin, T. and Souvemerzoglou, K.:
Longitudinal and vertical trends of bacterial limitation by phosphorus and carbon in the
Mediterranean Sea. Microb. Ecol., 43, 119-133, doi: 10.1007/s00248-001-0038-4, 2002.
Van Wambeke, F., Taillandier, V., Deboeufs, K., Pulido-Villena, E., Dinasquet, J., Engel, A., 970
Maranon, E., Guieu, C. : The mixed layer in Mediterranean Sea under the influence of
atmospheric deposition: biogeochemical cycles & nitrogen budget after dry & wet
deposition events. In prep for Biogeosciences
Zaccone, R., and Caruso, G.: Microbial enzymes in the Mediterranean Sea: relationship with
climate changes, AIMS Microbiology, 5, 251-272, 2019. 975
Zaccone, R., Caruso, G., Azzaro, M., Azzaro, F., Crisafi, E., Decembrini, F., De Domenico, E., De
Domenico, M., La Ferla, R., Leonardi, M., Lo Giudice, A., Maimone, G., Mancuso, M.,
Michaud, L., Monticelli, L. S., Raffa, F., Ruggeri, G., and Bruni, V.: Prokaryotic activities
and abundance in pelagic areas of the Ionian Sea, Chem. Ecol., 26, 169-197, doi:
10.1080/02757541003772914, 2010. 980
Zaccone, R., Boldrin, A., Caruso, G., La Ferla, R., Maimone, G., Santinelli, C., and Turchetto, M.:
Enzymatic Activities and Prokaryotic Abundance in Relation to Organic Matter along a
West–East Mediterranean Transect (TRANSMED Cruise), Microb. Ecol., 64, 54-66, 2012.
Zhang, J.-Z. and Chi, J.: Automated analysis of nano-molar concentrations of phosphate in natural
waters with liquid waveguide, Environ. Sci. Technol., 36, 1048-1053, 985
doi:10.1021/es011094v, 2002.
Zhao, Z., Baltar, B., and Herndl, G. J.: Linking extracellular enzymes to phylogeny indicates a
predominantly particle-associated lifestyle of deep-sea prokaryotes, Sciences Advances, 6,
eaaz4354, https://doi.org/10.1126/sciadv.aaz4354, 2020.
22
Figure Legends 990
Figure 1. Sampling sites. Color codes on dots correspond to the plots on Fig. 2.
Figure 2. Physical properties along the different sites: a) Oxygen versus depths, b T/S diagram.
Color codes correspond to the stations mapped Fig. 1. Principal water masses are indicated. MAW: 995
Modified Atlantic Waters, LIW: Levantine intermediate Waters, WMDW: Western Mediterranean
Deep waters, EMDW: Eastern Mediterranean Deep Waters.
Figure 3. Example of Michaelis-Menten plots, dcm layer at station FAST. Dots are data, continuous
lines the nonlinear regression plot derived from all concentrations added (0.025 to 50 µM). Smallest 1000
graphs inside show dotted lines corresponding to regression plots derived from a restricted substrate
range (0.025-1 µM).
Figure 4. Distribution of leucine aminopeptidase (LAP) kinetic parameters Vm (a) and Km (b). Red
values are Vm50 and Km50 derived from the whole substrate MCA-leu range (0.025-50 µM) and 1005
pink values are Vm1 and Km1 derived from a restricted substrate range (0.025-1 µM). The bars are
not cumulative but absolute values. The error bars are standard errors derived from the nonlinear
regressions. At each station four data are presented, corresponding to, from left to right, ‘surf’,
‘dcm’,’ liw’ and ‘mdw’ layers, respectively.
1010
Figure 5. Distribution of glucosidase (GLU) kinetic parameters Vm (a) and Km (b). Yellow
values are Vm50 and Km50 derived from the whole substrate MCA-leu range (0.025-50 µM) and
white values are Vm1 and Km1 derived from a restricted substrate range (0.025-1 µM). The bars
are not cumulative but absolute values. The error bars are standard errors derived from the nonlinear
regressions. At each station four data are presented, corresponding to, from left to right, surface and 1015
dcm layers, respectively. For ‘liw’ and ‘mdw’ layers (black bars) we presented only a mean
available rate detectable (kinetics were impossible to compute due to the low range of rates
measurable). This value is assumed to represent a minimal value for Vm50.
Figure 6. Distribution of alkaline phosphatase (AP) kinetic parameters Vm (a) and Km (b). Blue 1020
values are Vm50 and Km50 derived from the whole substrate MUF-P range (0.025-50 µM) and
pale blue values are Vm1 and Km1 derived from a restricted substrate range (0.025-1 µM). The
bars are not cumulative but absolute values. The error bars are standard errors derived from the
nonlinear regressions. At each station four data are presented, corresponding to, from left to right,
’surf’, ‘dcm’, ‘liw’ and ‘mdw’ layers, respectively. Vm1 and Km1 are not available at station FAST 1025
mdw layer, due to a lack of significant rates below 1 µM MUF-P added.
Figure 7. Box plot distributions of specific Vm1 and Vm50 per bacterial cell, for alkaline
phosphatase (a: per cell Vm50AP, b: per cell Vm1AP) and leucine aminopeptidase (c: per cell
Vm50 LAP, d: per celVm1LAP). Box limits 25% and 75% percentiles, horizontal bar is median, 1030
red cross is mean, blue dots are outliers.
Figure 8. Depth decreasing factor (DVF, unitless) among different specific activities. DVF is
calculated as the mean of pooled data from ‘surf’ and ‘dcm’ layers divided by the mean of pooled
data from ‘liw’ and ‘mdw’ layers. In red per cell Vm50LAP and per cell Vm1LAP: DVF of specific 1035
aminopeptidase activities calculated for large (0.025-50 µM) and low (0.025-1 µM) substrate range,
respectively; in blue same thing for alkaline phosphatase (per cell Vm50AP, par cell Vm1AP). For
glucosidase, specific activities are based on the few detectable rates at high concentration (per
cell Vglu, yellow dots). Black crosses are specific heterotrophic prokaryotic production per cell
(per cell BP). 1040
23
Figure 9. In situ hydrolysis rates of dissolved proteins and particulate detrital N-proteins (nmol N L-
1 h
-1), determined from LAP ectoenzyme kinetics Vm1/Km1 versus Vm50 Km50, and comparison
to heterotrophic bacterial nitrogen demand. a) epipelagic layers (surf, dcm), b) deeper layers (liw,
mdw) 1045
Figure 10. In situ rates of hydrolysis of dissolved and particulate detrital carbohydrates and C-
proteins (nmol C L-1
h-1
), determined from LAP and GLU ectoenzymatic parameters Vm1 &Km1
versus Vm50 & Km50, and comparison to heterotrophic bacterial carbon demand (BCD) in
epipelagic waters. Note the x10 scale for bacterial carbon demand on the right. 1050
24
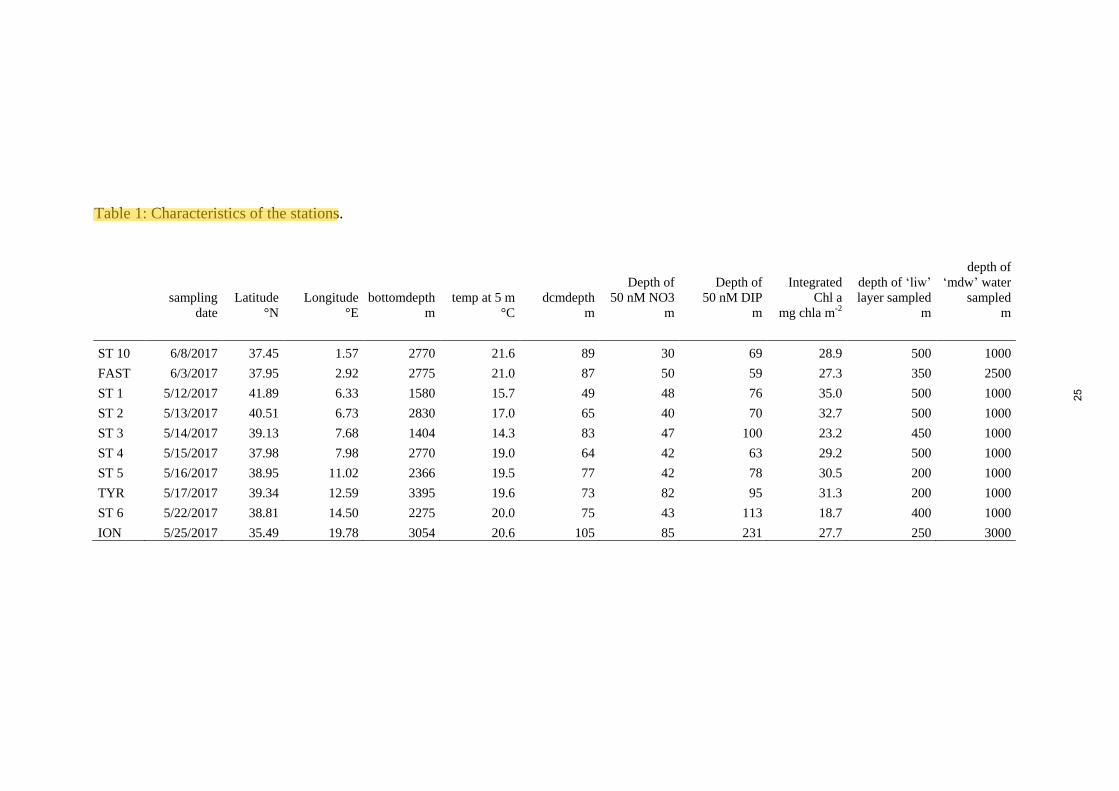
Table 1: Characteristics of the stations.
sampling
date
Latitude
°N
Longitude
°E
bottomdepth
m
temp at 5 m
°C
dcmdepth
m
Depth of
50 nM NO3
m
Depth of
50 nM DIP
m
Integrated
Chl a
mg chla m-2
depth of ‘liw’
layer sampled
m
depth of
‘mdw’ water
sampled
m
ST 10 6/8/2017 37.45 1.57 2770 21.6 89 30 69 28.9 500 1000
FAST 6/3/2017 37.95 2.92 2775 21.0 87 50 59 27.3 350 2500
ST 1 5/12/2017 41.89 6.33 1580 15.7 49 48 76 35.0 500 1000
ST 2 5/13/2017 40.51 6.73 2830 17.0 65 40 70 32.7 500 1000
ST 3 5/14/2017 39.13 7.68 1404 14.3 83 47 100 23.2 450 1000
ST 4 5/15/2017 37.98 7.98 2770 19.0 64 42 63 29.2 500 1000
ST 5 5/16/2017 38.95 11.02 2366 19.5 77 42 78 30.5 200 1000
TYR 5/17/2017 39.34 12.59 3395 19.6 73 82 95 31.3 200 1000
ST 6 5/22/2017 38.81 14.50 2275 20.0 75 43 113 18.7 400 1000
ION 5/25/2017 35.49 19.78 3054 20.6 105 85 231 27.7 250 3000
25
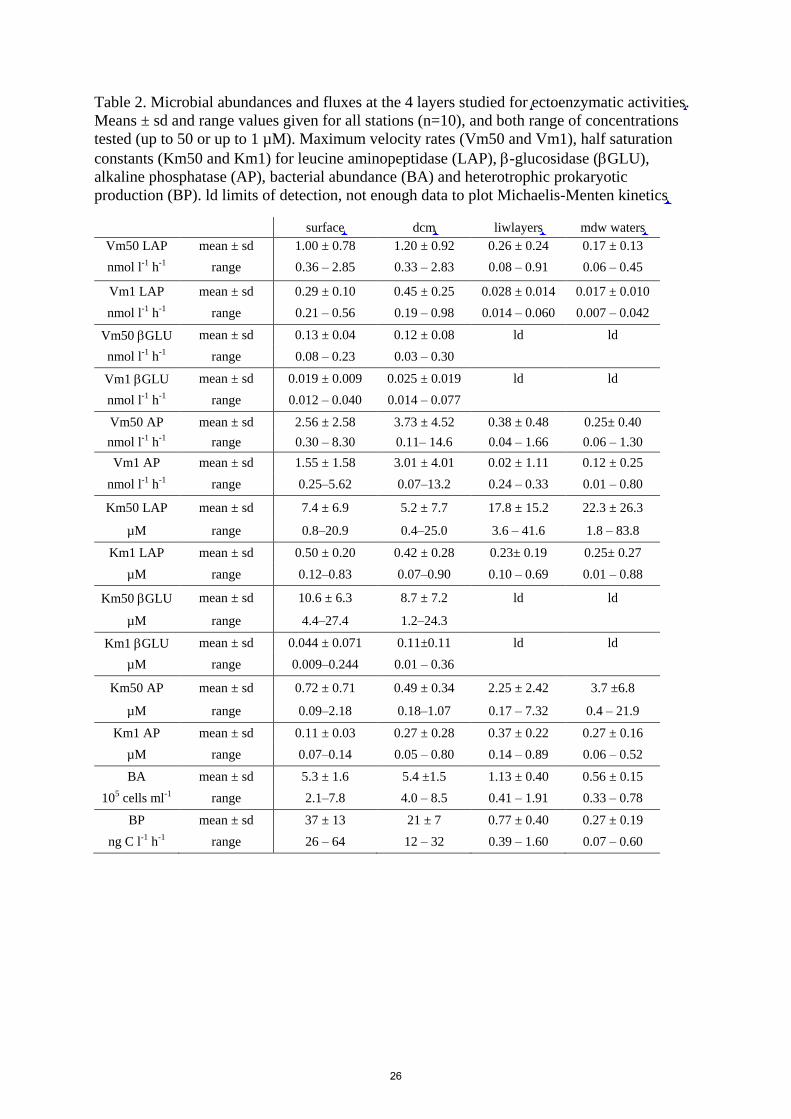
Table 2. Microbial abundances and fluxes at the 4 layers studied for ectoenzymatic activities.
Means ± sd and range values given for all stations (n=10), and both range of concentrations
tested (up to 50 or up to 1 µM). Maximum velocity rates (Vm50 and Vm1), half saturation
constants (Km50 and Km1) for leucine aminopeptidase (LAP), -glucosidase (GLU),
alkaline phosphatase (AP), bacterial abundance (BA) and heterotrophic prokaryotic
production (BP). ld limits of detection, not enough data to plot Michaelis-Menten kinetics
surface dcm liwlayers mdw waters
Vm50 LAP mean ± sd 1.00 ± 0.78 1.20 ± 0.92 0.26 ± 0.24 0.17 ± 0.13
nmol l-1 h-1 range 0.36 – 2.85 0.33 – 2.83 0.08 – 0.91 0.06 – 0.45
Vm1 LAP mean ± sd 0.29 ± 0.10 0.45 ± 0.25 0.028 ± 0.014 0.017 ± 0.010
nmol l-1 h-1 range 0.21 – 0.56 0.19 – 0.98 0.014 – 0.060 0.007 – 0.042
Vm50 GLU mean ± sd 0.13 ± 0.04 0.12 ± 0.08 ld ld
nmol l-1 h-1 range 0.08 – 0.23 0.03 – 0.30
Vm1 GLU mean ± sd 0.019 ± 0.009 0.025 ± 0.019 ld ld
nmol l-1 h-1 range 0.012 – 0.040 0.014 – 0.077
Vm50 AP mean ± sd 2.56 ± 2.58 3.73 ± 4.52 0.38 ± 0.48 0.25± 0.40
nmol l-1 h-1 range 0.30 – 8.30 0.11– 14.6 0.04 – 1.66 0.06 – 1.30
Vm1 AP mean ± sd 1.55 ± 1.58 3.01 ± 4.01 0.02 ± 1.11 0.12 ± 0.25
nmol l-1 h-1 range 0.25–5.62 0.07–13.2 0.24 – 0.33 0.01 – 0.80
Km50 LAP mean ± sd 7.4 ± 6.9 5.2 ± 7.7 17.8 ± 15.2 22.3 ± 26.3
µM range 0.8–20.9 0.4–25.0 3.6 – 41.6 1.8 – 83.8
Km1 LAP mean ± sd 0.50 ± 0.20 0.42 ± 0.28 0.23± 0.19 0.25± 0.27
µM range 0.12–0.83 0.07–0.90 0.10 – 0.69 0.01 – 0.88
Km50 GLU mean ± sd 10.6 ± 6.3 8.7 ± 7.2 ld ld
µM range 4.4–27.4 1.2–24.3
Km1 GLU mean ± sd 0.044 ± 0.071 0.11±0.11 ld ld
µM range 0.009–0.244 0.01 – 0.36
Km50 AP mean ± sd 0.72 ± 0.71 0.49 ± 0.34 2.25 ± 2.42 3.7 ±6.8
µM range 0.09–2.18 0.18–1.07 0.17 – 7.32 0.4 – 21.9
Km1 AP mean ± sd 0.11 ± 0.03 0.27 ± 0.28 0.37 ± 0.22 0.27 ± 0.16
µM range 0.07–0.14 0.05 – 0.80 0.14 – 0.89 0.06 – 0.52
BA mean ± sd 5.3 ± 1.6 5.4 ±1.5 1.13 ± 0.40 0.56 ± 0.15
105 cells ml-1 range 2.1–7.8 4.0 – 8.5 0.41 – 1.91 0.33 – 0.78
BP mean ± sd 37 ± 13 21 ± 7 0.77 ± 0.40 0.27 ± 0.19
ng C l-1 h-1 range 26 – 64 12 – 32 0.39 – 1.60 0.07 – 0.60
26
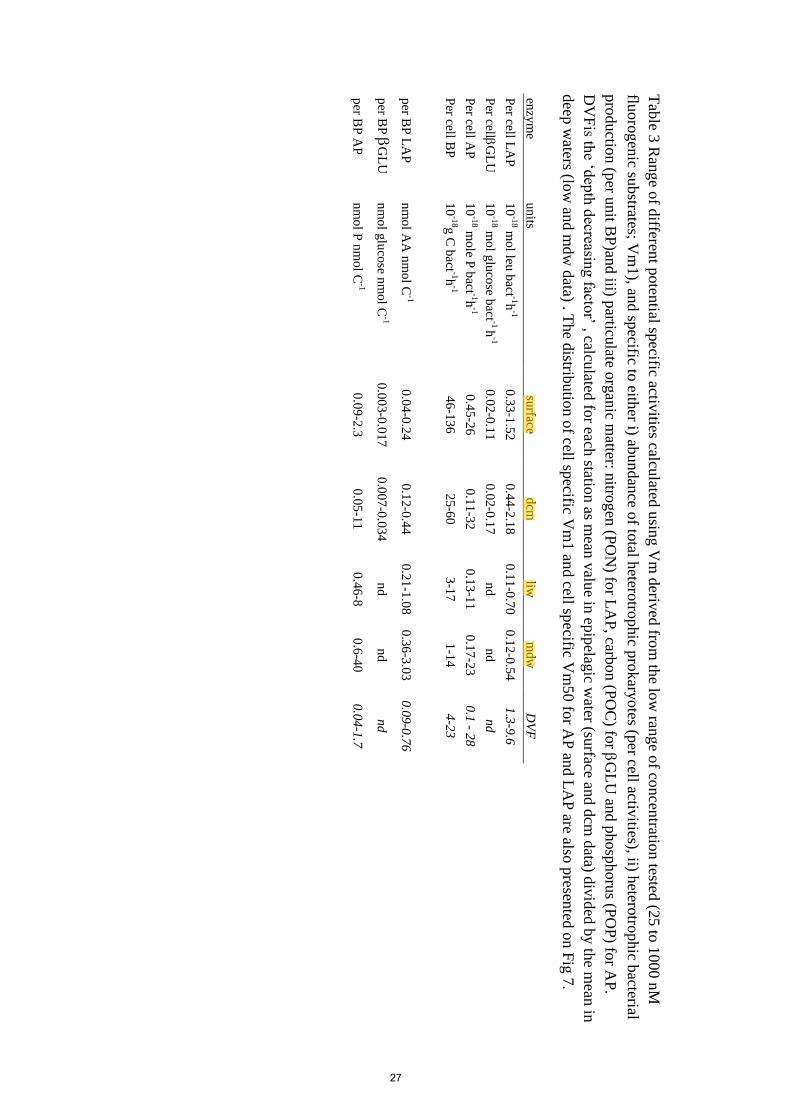
Tab
le 3 R
ange o
f differen
t poten
tial specific activ
ities calculated
usin
g V
m d
erived
from
the lo
w ran
ge o
f concen
tration
tested (2
5 to
1000 n
M
fluoro
gen
ic substrates; V
m1), an
d sp
ecific to eith
er i) abundan
ce of to
tal hetero
trophic p
rokary
otes (p
er cell activities), ii) h
eterotro
phic b
acterial
pro
ductio
n (p
er unit B
P)an
d iii) p
articulate o
rgan
ic matter: n
itrogen
(PO
N) fo
r LA
P, carb
on (P
OC
) for
GL
U an
d p
hosp
horu
s (PO
P) fo
r AP
.
DV
Fis th
e ‘dep
th d
ecreasing facto
r’ , calculated
for each
station as m
ean v
alue in
epip
elagic w
ater (surface an
d d
cm d
ata) div
ided
by th
e mean
in
deep
waters (lo
w an
d m
dw
data) . T
he d
istributio
n o
f cell specific V
m1 an
d cell sp
ecific Vm
50
for A
P an
d L
AP
are also p
resented
on F
ig 7
.
enzy
me
un
its su
rface d
cm
liw
md
w
DV
F
Per cell L
AP
1
0-1
8 mol leu
bact -1h
-1 0
.33-1
.52
0.4
4-2
.18
0.1
1-0
.70
0.1
2-0
.54
1.3
-9.6
Per cell
GL
U
10
-18 m
ol g
luco
se bact -1
h-1
0.0
2-0
.11
0.0
2-0
.17
nd
nd
nd
Per cell A
P
10
-18 m
ole P
bact -1h
-1 0
.45-2
6
0.1
1-3
2
0.1
3-1
1
0.1
7-2
3
0.1
- 28
Per cell B
P
10
-18g
C b
act -1h-1
46-1
36
25-6
0
3-1
7
1-1
4
4-2
3
p
er BP
LA
P
nm
ol A
A n
mol C
-1 0
.04-0
.24
0.1
2-0
.44
0.2
1-1
.08
0.3
6-3
.03
0.0
9-0
.76
per B
P
GL
U
nm
ol g
luco
se nm
ol C
-1 0
.003-0
.017
0.0
07-0
.034
nd
nd
nd
per B
P A
P
nm
ol P
nm
ol C
-1 0
.09-2
.3
0.0
5-1
1
0.4
6-8
0
.6-4
0
0.0
4-1
.7
27
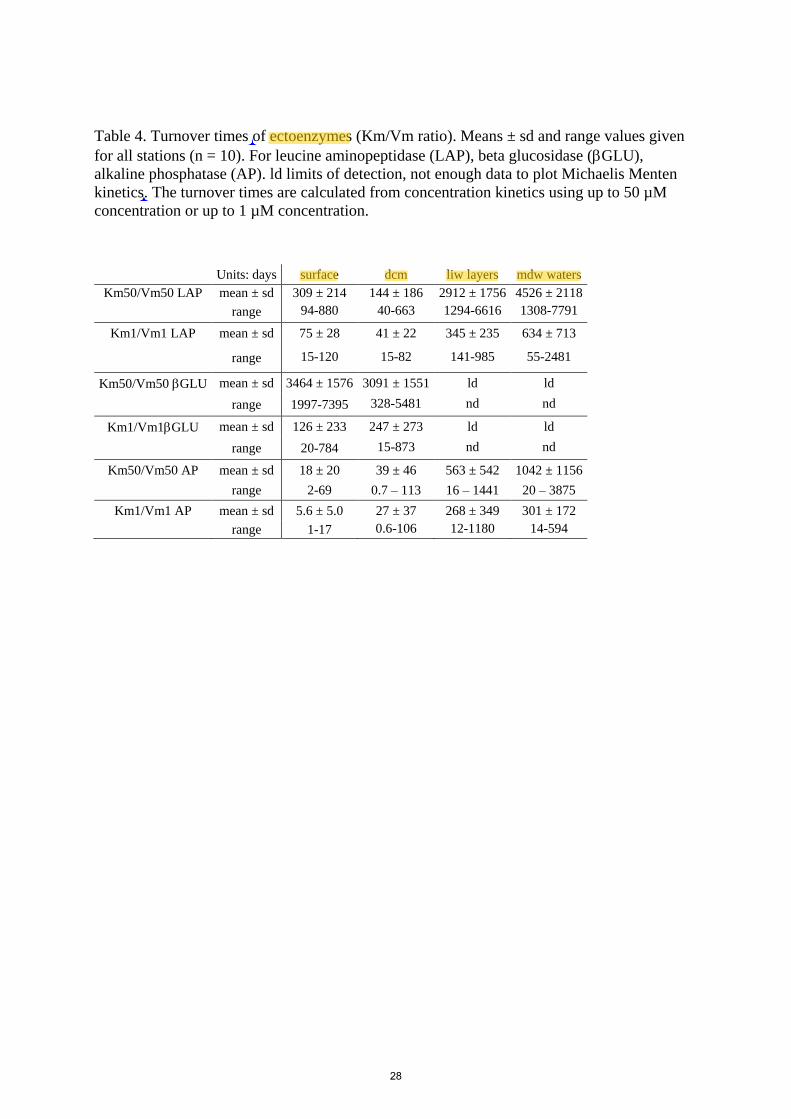
Table 4. Turnover times of ectoenzymes (Km/Vm ratio). Means ± sd and range values given
for all stations (n = 10). For leucine aminopeptidase (LAP), beta glucosidase (GLU),
alkaline phosphatase (AP). ld limits of detection, not enough data to plot Michaelis Menten
kinetics. The turnover times are calculated from concentration kinetics using up to 50 µM
concentration or up to 1 µM concentration.
Units: days surface dcm liw layers mdw waters
Km50/Vm50 LAP mean ± sd 309 ± 214 144 ± 186 2912 ± 1756 4526 ± 2118
range 94-880 40-663 1294-6616 1308-7791
Km1/Vm1 LAP mean ± sd 75 ± 28 41 ± 22 345 ± 235 634 ± 713
range 15-120 15-82 141-985 55-2481
Km50/Vm50 GLU mean ± sd 3464 ± 1576 3091 ± 1551 ld ld
range 1997-7395 328-5481 nd nd
Km1/Vm1GLU mean ± sd 126 ± 233 247 ± 273 ld ld
range 20-784 15-873 nd nd
Km50/Vm50 AP mean ± sd 18 ± 20 39 ± 46 563 ± 542 1042 ± 1156
range 2-69 0.7 – 113 16 – 1441 20 – 3875
Km1/Vm1 AP mean ± sd 5.6 ± 5.0 27 ± 37 268 ± 349 301 ± 172
range 1-17 0.6-106 12-1180 14-594
28
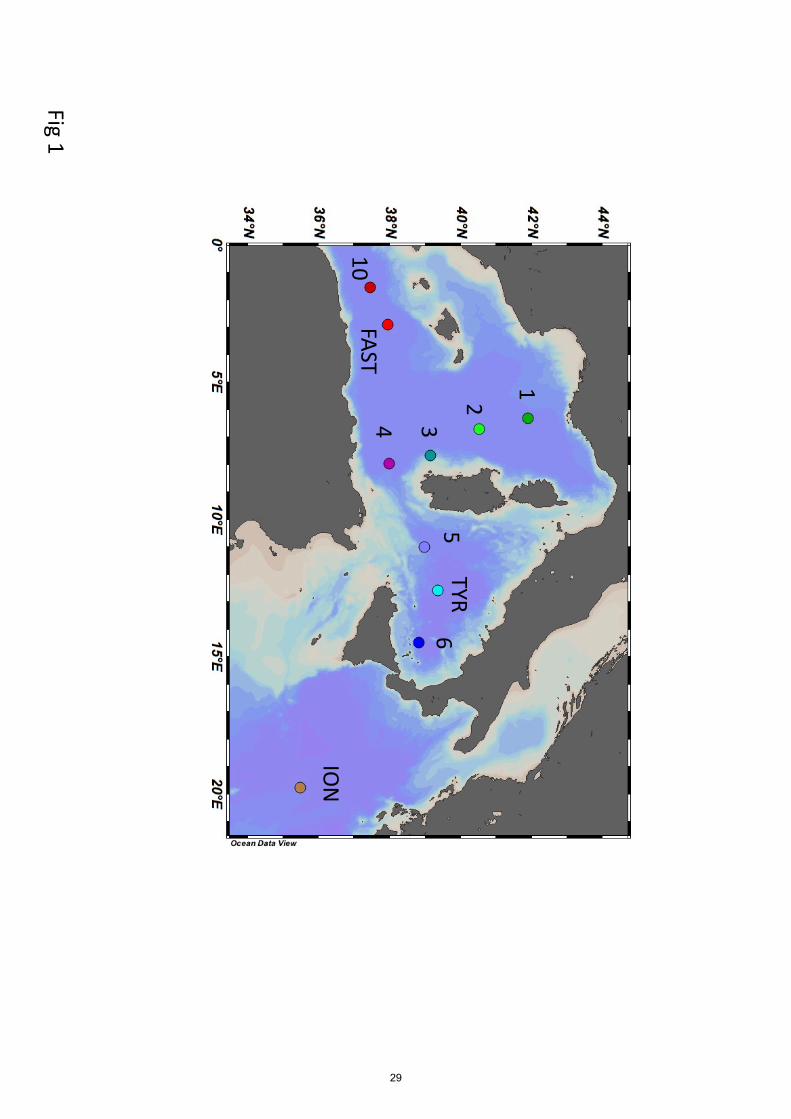
1
TYR2
34
65
10IO
N
FAST4
Fig1
29
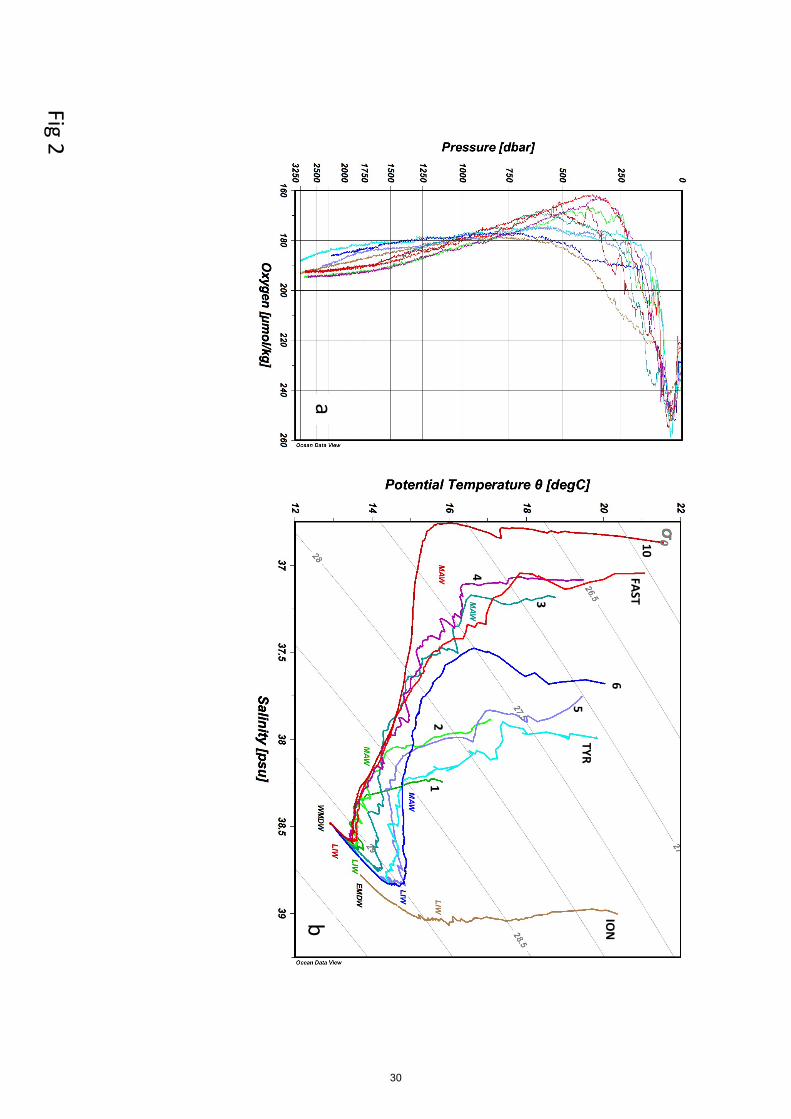
10FAST
4
3
6
5TYR
1
ION
2
ab
Fig2
30
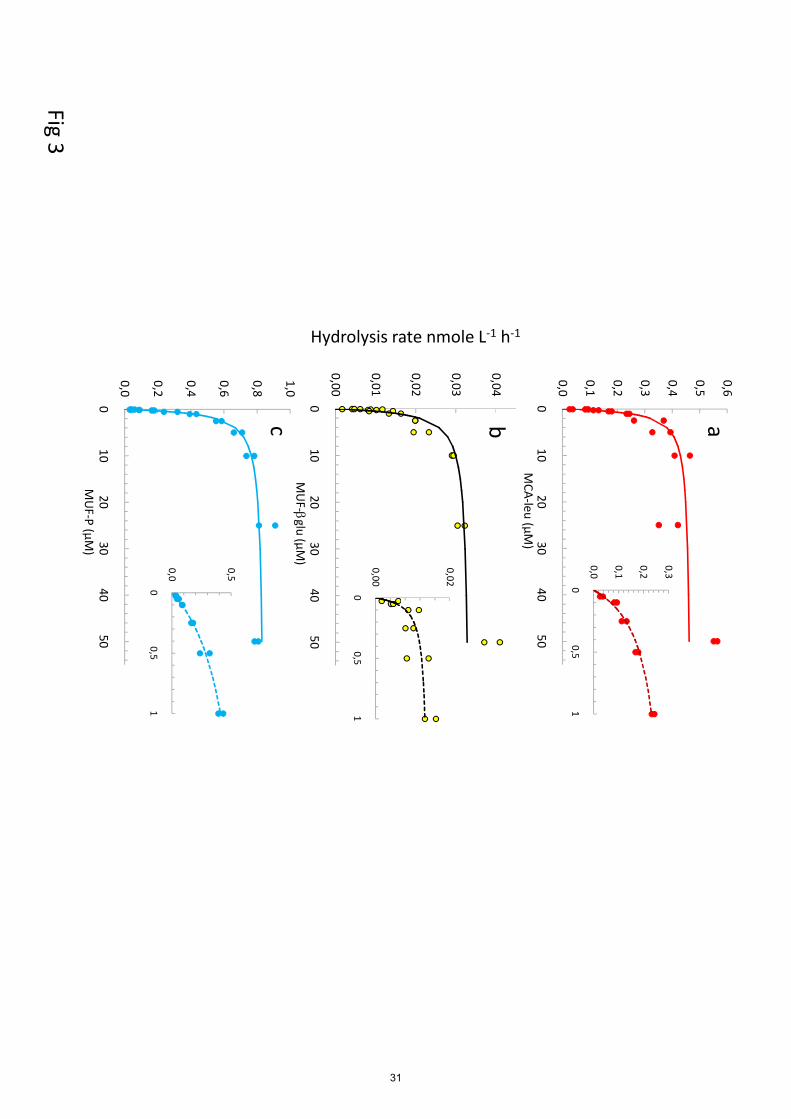
0,0
0,1
0,2
0,3
0,4
0,5
0,6
010
2030
4050
MCA-leu (µM
)
0,02
0,03
0,04
0,0
0,1
0,2
0,3
00,5
1
0,02
ab
rate nmole L-1 h-1
Fig3
0,00
0,01
010
2030
4050
MU
F-bglu(µM
)
0,0
0,2
0,4
0,6
0,8
1,0
010
2030
4050
MU
F-P (µM)
0,00
00,5
1
0,0
0,5
00,5
1
c
Hydrolysis rate
31
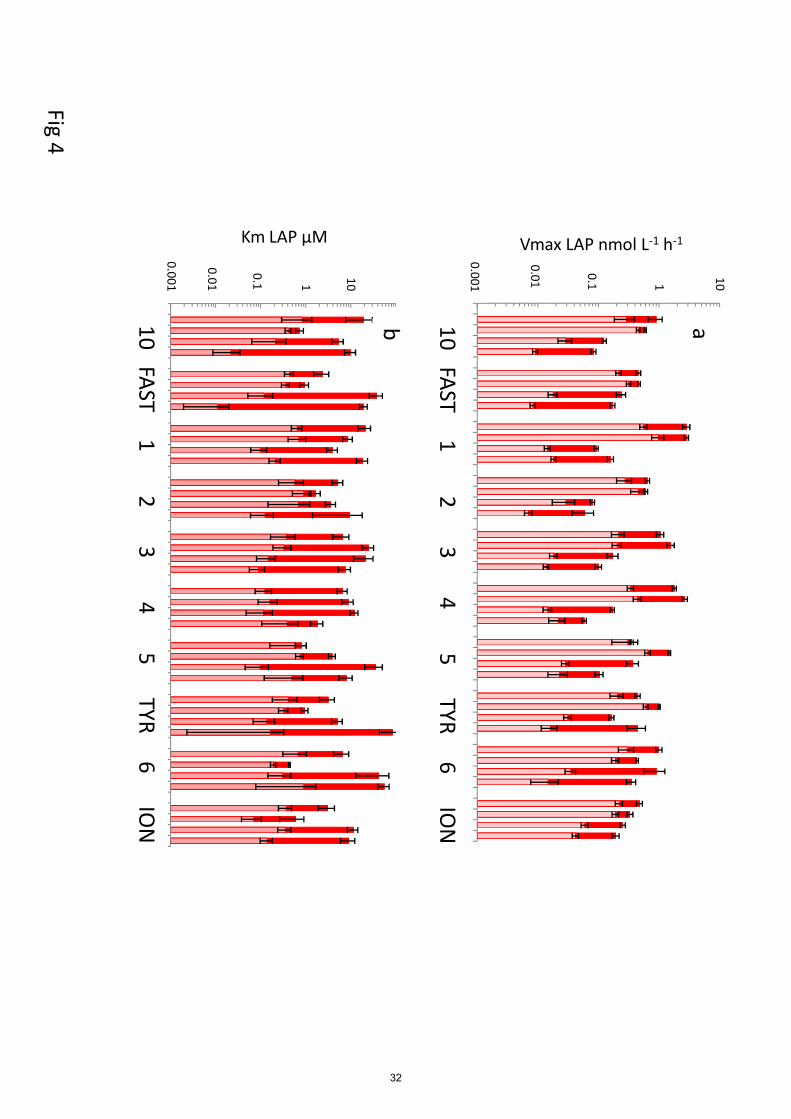
0,001
0,01
0,1 1 10
ST 10 dcm
ST 10 deep
FAST surf
FAST liw
ST 1 dcm
ST 1 deep
ST 2 surf
ST 2 liw
ST 3 dcm
ST 3 deep
ST 4 surf
ST 4 liw
ST 5 dcm
ST 5 deep
TYR surf
TYR liw
ST 6 dcm
ST 6 deep
ION surf
ION liw
10 FAST 1 2 3 4 5 TYR 6 ION
Vmax LAP nmol L-1 h-1
0.1
0.01
0.001
ab
0,001
0,01
0,1 1 10
ST 10 …
ST 10 …
FAST …
FAST liw
ST 1 dcm
ST 1 …
ST 2 surf
ST 2 liw
ST 3 dcm
ST 3 …
ST 4 surf
ST 4 liw
ST 5 dcm
ST 5 …
TYR surf
TYR liw
ST 6 dcm
ST 6 …
ION surf
ION liw
10 FAST 1 2 3 4 5 TYR 6 ION
Km LAP µM
0.01
0.001
0.1
Fig4
b
32
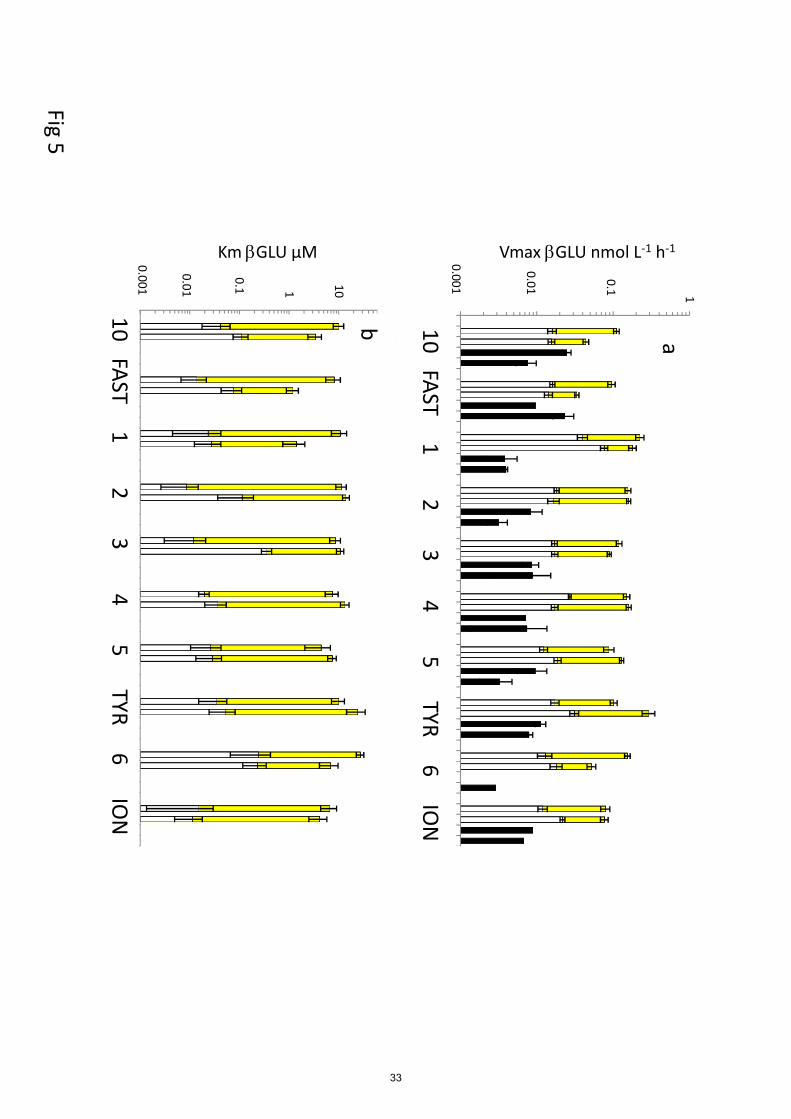
Vmax bGLU nmol L-1 h-1
a
0,001
0,01
0,1 1
ST 10 dcm
ST 10 deep
FAST surf
FAST liw
ST 1 dcm
ST 1 deep
ST 2 surf
ST 2 liw
ST 3 dcm
ST 3 deep
ST 4 surf
ST 4 liw
ST 5 dcm
ST 5 deep
TYR surf
TYR liw
ST 6 dcm
ST 6 deep
ION surf
ION liw
10 FAST 1 2 3 4 5 TYR 6 ION
0.1
0.01
0.001
0,001
0,01
0,1 1 10
ST 10 dcm
ST 10 deep
FAST surf
FAST liw
ST 1 dcm
ST 1 deep
ST 2 surf
ST 2 liw
ST 3 dcm
ST 3 deep
ST 4 surf
ST 4 liw
ST 5 dcm
ST 5 deep
TYR surf
TYR liw
ST 6 dcm
ST 6 deep
ION surf
ION liw
Km bGLU µM
0.01
0.001
0.1
10 FAST 1 2 3 4 5 TYR 6 ION
Fig5
b
ST 10 dcm
ST 10 deep
ST 1 deep
ST 3 deep
ST 5 deep
ST 6 deep
33
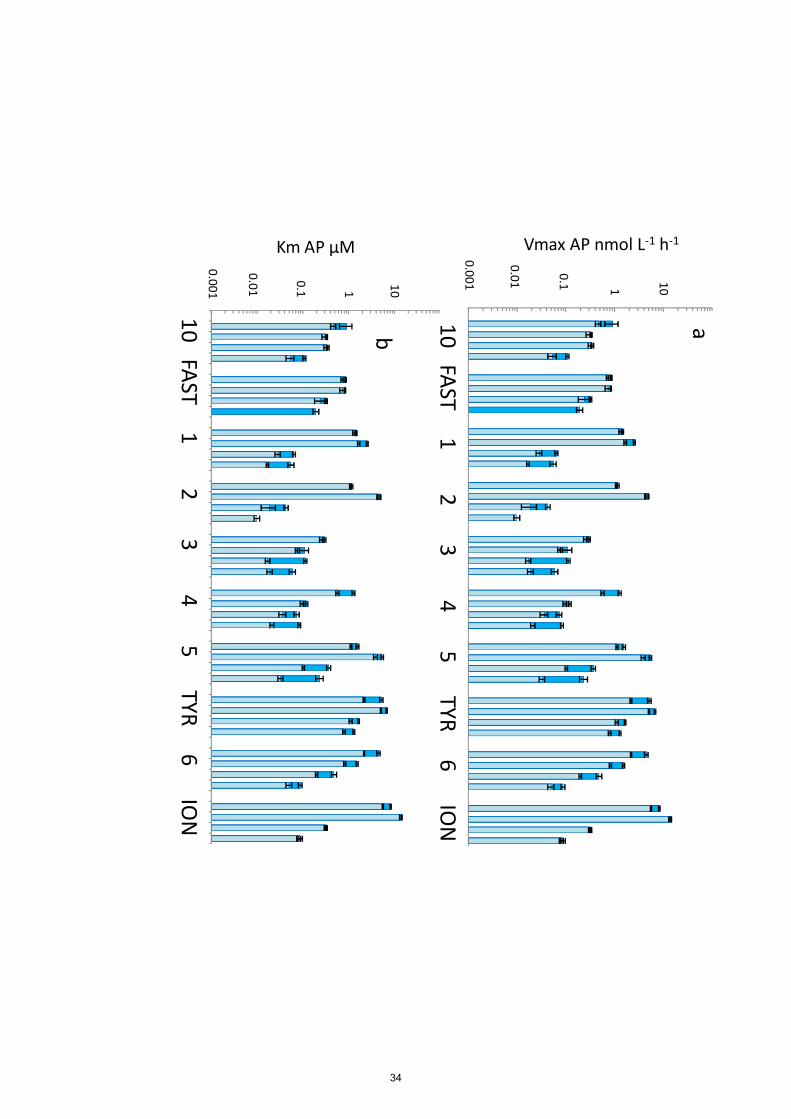
0,001
0,01
0,1 1 10
ST 10 dcm
ST 10 deep
FAST surf
FAST liw
ST 1 dcm
ST 1 deep
ST 2 surf
ST 2 liw
ST 3 dcm
ST 3 deep
ST 4 surf
ST 4 liw
ST 5 dcm
ST 5 deep
TYR surf
TYR liw
ST 6 dcm
ST 6 deep
ION surf
ION liw
0.1
0.01
0.001
10 FAST 1 2 3 4 5 TYR 6 ION
Vmax AP nmol L-1 h-1
a
10b
0,001
0,01
0,1 1 10
ST 10 dcm
ST 10 deep
FAST surf
FAST liw
ST 1 dcm
ST 1 deep
ST 2 surf
ST 2 liw
ST 3 dcm
ST 3 deep
ST 4 surf
ST 4 liw
ST 5 dcm
ST 5 deep
TYR surf
TYR liw
ST 6 dcm
ST 6 deep
ION surf
ION liw
0.01
0.1
Km AP µM
b
0.001
10 FAST 1 2 3 4 5 TYR 6 ION
34
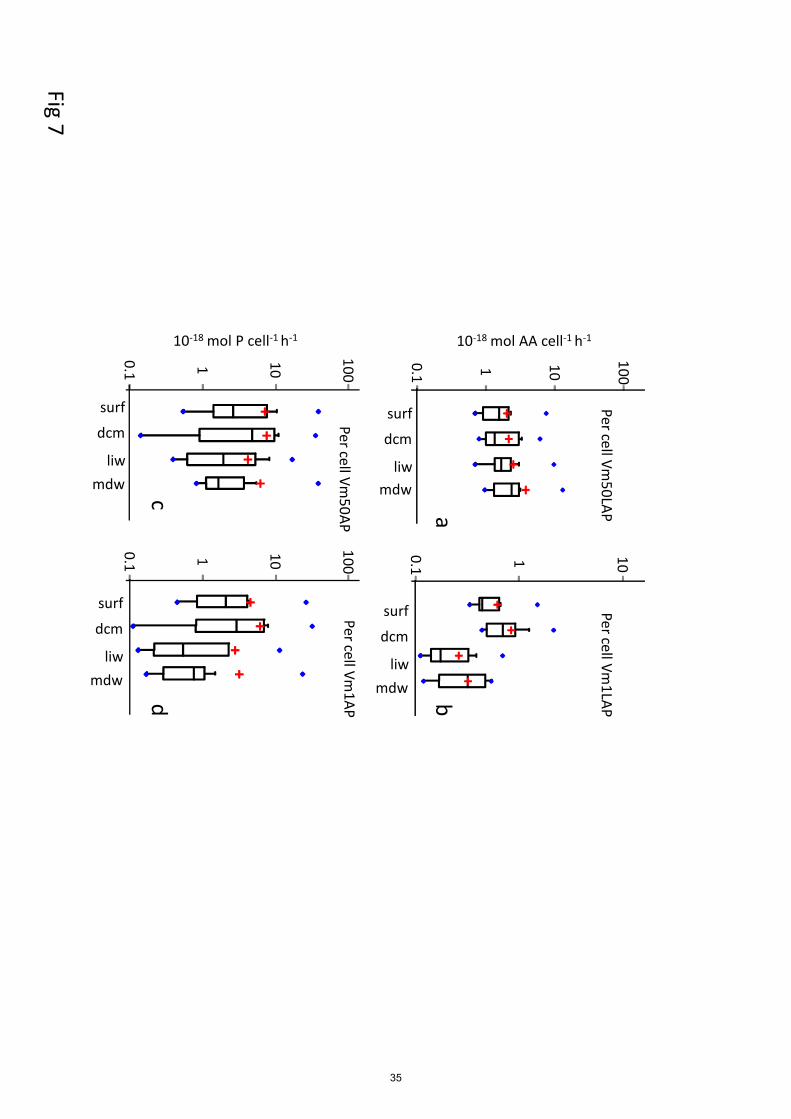
0.1 1 10
100Per cellVm
50LAP
0.1 1 10Per cellVm
1LAP
10-18 mol AA cell-1 h-1a
b
surf
dcm
liwmdw
surf
dcm
liwmdw
10-18 mol P cell-1 h-1
0.1 1 10
100Per cellVm
50AP
0.1 1 10
100Per cellVm
1AP
Fig7
cd
surf
dcm
liwmdw
surf
dcm
liwmdw
surf
dcm
liwmdw
surf
dcm
liwmdw
35
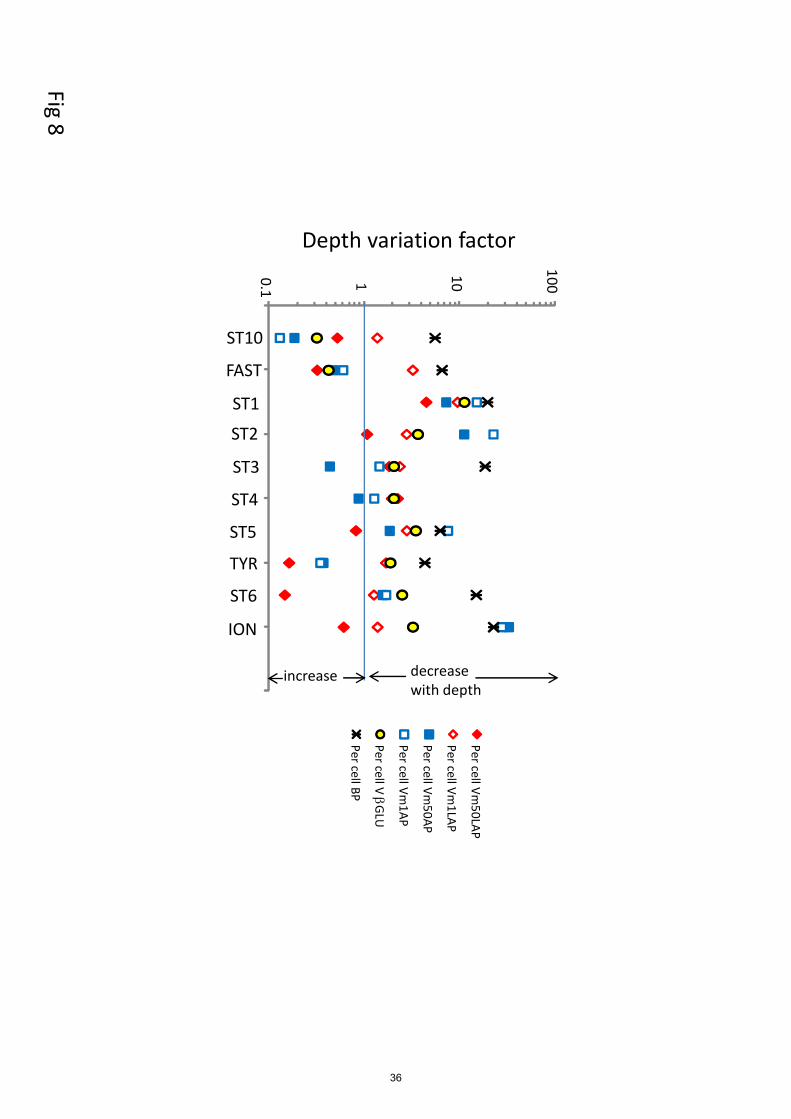
10
100
Per cellVm50LAP
Per cellVm1LAP
Per cellVm50AP
Per cellVm1AP
variation factor
decreasewith depth
0.1 1Per cellV bG
LU
PercellBP
ST10
ST2
ST3
ST4
ST5
TYR
ST6
ION
FAST
ST1
Fig8
Depth variation factor
increase
36
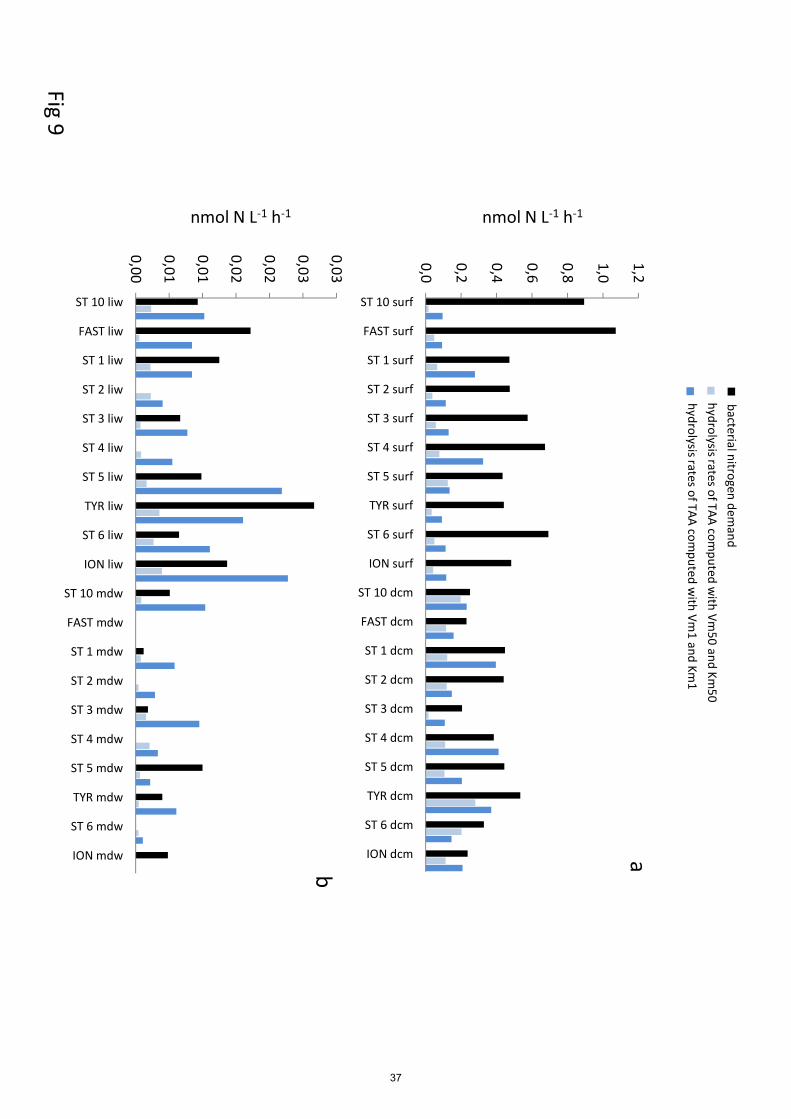
a
hydrolysisrates of TAA computed
with
Vm50 and Km
50hydrolysisrates of TAA com
putedw
ithVm
1 and Km1
nmol N L-1 h-1
bacterialnitrogendem
and
0,0
0,2
0,4
0,6
0,8
1,0
1,2
ST 10 surf
FAST surf
ST 1 surf
ST 2 surf
ST 3 surf
ST 4 surf
ST 5 surf
TYR surf
ST 6 surf
ION surf
ST 10 dcm
FAST dcm
ST 1 dcm
ST 2 dcm
ST 3 dcm
ST 4 dcm
ST 5 dcm
TYR dcm
ST 6 dcm
ION dcm
Fig9
b
nmol N L-1 h-1
ST 10 surf
FAST surf
ST 1 surf
ST 2 surf
ST 3 surf
ST 4 surf
ST 5 surf
TYR surf
ST 6 surf
ION surf
ST 10 dcm
FAST dcm
ST 1 dcm
ST 2 dcm
ST 3 dcm
ST 4 dcm
ST 5 dcm
TYR dcm
ST 6 dcm
ION dcm
0,00
0,01
0,01
0,02
0,02
0,03
0,03
ST 10 liw
FAST liw
ST 1 liw
ST 2 liw
ST 3 liw
ST 4 liw
ST 5 liw
TYR liw
ST 6 liw
ION liw
ST 10 mdw
FAST mdw
ST 1 mdw
ST 2 mdw
ST 3 mdw
ST 4 mdw
ST 5 mdw
TYR mdw
ST 6 mdw
ION mdw
37
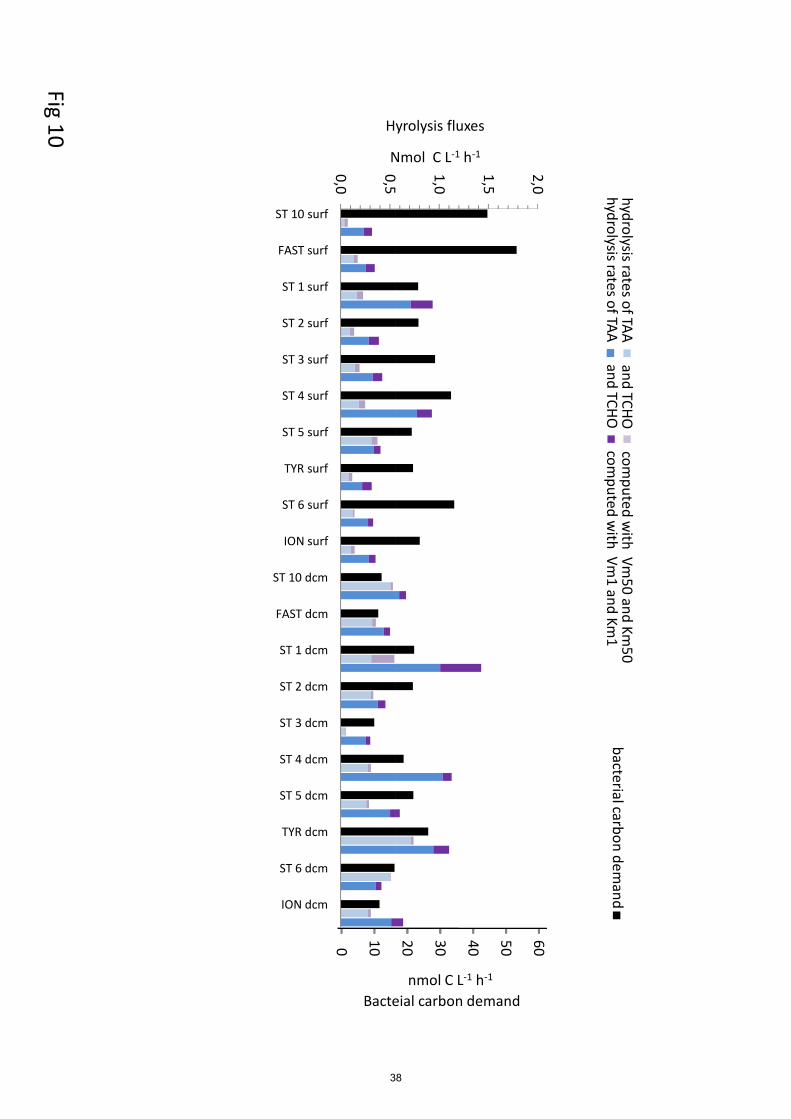
hydrolysisrates of TAA and TCHO
computed
with
Vm50 and Km
50bacterialcarbon
demand
hydrolysisrates of TAA and TCHO
computed
with
Vm1 and Km
1
0,5
1,0
1,5
2,0
20 30 40 50 60
Nmol C L-1 h-1
nmol C L-1 h-1
Hyrolysis fluxes
Bacteial carbon demand
Fig10
0,0
0,5
ST 10 surf
FAST surf
ST 1 surf
ST 2 surf
ST 3 surf
ST 4 surf
ST 5 surf
TYR surf
ST 6 surf
ION surf
ST 10 dcm
FAST dcm
ST 1 dcm
ST 2 dcm
ST 3 dcm
ST 4 dcm
ST 5 dcm
TYR dcm
ST 6 dcm
ION dcm
0 10
Nmol
Hyrolysis
Bacteial
38