Embed Size (px)
Citation preview
Statistical Appendix for “The social foundations ofworld happiness”, John F. Helliwell, Haifang Huang
and Shun Wang, Chapter 2, World HappinessReport 2017
March 21, 2017
1 Data Sources and Variable Definitions
• Happiness score or subjective well-being (variable name ladder): The surveymeasure of SWB is from the Dec 23, 2016 release of the Gallup World Poll(GWP), which covers the years from 2005 to 2016. Unless stated otherwise, itis the national average response to the question of life evaluations. The Englishwording of the question is “Please imagine a ladder, with steps numbered from0 at the bottom to 10 at the top. The top of the ladder represents the bestpossible life for you and the bottom of the ladder represents the worst possiblelife for you. On which step of the ladder would you say you personally feel youstand at this time?” This measure is also referred to as Cantril life ladder, orjust life ladder in our analysis.
• Inequality/distribution statistics of happiness scores by WP5-year (variablesnames giniLadder and more) from the GWP release. WP5 is GWP’s codingof countries, including some sub-country territories such as Hong Kong. Thestatistics are named giniLadder, p95Ladder, p90Ladder, p75Ladder, p50Ladder,p25Ladder, p10Ladder, p05Ladder, maxLadder, minLadder, respectively thegini score, the various percentiles, the maximum and the minimum. They areall derived from the STATA command ineqdec0 using observations in an indi-vidual country/territory in a given survey year with sample weights. Accordingto Stephen P. Jenkins (May 2008, STATA Help), the command ineqdec0 “esti-mate[s] a range of inequality and related indices” using unit record or ‘micro’level data, and that the calculations do not exclude observations whose value isequal to zero.
• Alternative measures of inequality in happiness scores by wp5-year (variablenames sdLadder and cvLadder). These extra measures are sdLadder “Standarddeviation of ladder by country-year” and cvLadder “Standard deviation/Meanof ladder by country-year”.
1
• The statistics of GDP per capita (variable name gdp) in purchasing power parity(PPP) at constant 2011 international dollar prices are from the August 10,2016 release of the World Development Indicators (WDI). The GDP figures forTaiwan are from the Penn World Table 7.1. Syria and Argentina are missingthe GDP numbers in the WDI release but were present in earlier releases. Weuse the numbers from the earlier release, after adjusting their levels by a factorof 1.17 to take into account changes in the implied prices when switching fromthe PPP 2005 prices used in the earlier release to the PPP 2011 prices used inthe latest release. The factor of 1.17 is the average ratio derived by dividingthe US GDP per capita under the 2011 prices with their counterparts under the2005 prices. The same 1.17 is used to adjust the Taiwanese numbers, which areoriginally PPP dollars at 2005 constant prices.
– GPD per capita in 2016 are not yet available as of September 2016. Weextend the GDP-per-capita time series from 2015 to 2016 using country-specific forecasts of real GDP growth in 2016 first from the OECD Eco-nomic Outlook No. 99 (Edition 2016/1) and then, if missing, forecasts fromWorld Bank’s Global Economic Prospects (Last Updated: 01/06/2016).The GDP growth forecasts are adjusted for population growth with thesubtraction of 2014-15 population growth as the projected 2015-16 growth.
• Healthy Life Expectancy (HLE). The time series of healthy life expectancy atbirth are calculated by the authors based on data from the World Health Or-ganization (WHO), the World Development Indicators (WDI), and statisticspublished in journal articles. The challenge is that the healthy life expectancy,unlike the simple life expectancy, is not widely available as time series. In theWHO’s Global Health Observatory Data Repository, the statistics of healthylife expectancy are reported only for the years of 2000 and 2012. In our ef-fort to derive the time series of healthy life expectancy for our sample period(2005 to 2016), we use WDI’s non-health adjusted life expectancy, which isavailable as time series up to the year 2014, as the basis of our calculation.Using country-specific ratios of healthy life expectancy to total life expectancyin 2012, available from the WHO, we adjust the time series of total life ex-pectancy to healthy life expectancy by simple multiplication, assuming that theratio remains constant within each country over the sample period. Three coun-tries/regions are missing due to the lack of health/total life expectancy ratio.One is Hong Kong. We calculate its ratio using relevant estimates in “Healthylife expectancy in Hong Kong Special Administrative Region of China,” by C.K.Law, & P.S.F. Yip, published at the Bulletin of the World Health Organization,2003, 81 (1). Another is Puerto Rico. We set its ratio to the U.S. ratio of0.886. The third is Kosovo, we set its ratio to the world average. The esti-mated life expectancy for Taiwan and the Palestinian Territories are availablein “Healthy life expectancy for 187 countries, 1990 - 2010: a systematic analysisfor the Global Burden Disease Study 2010,” by Joshua A Salomon et al, TheLancet, Volume 380, Issue 9859. Once we have the data, we use intrapolation
2
and extrapolation to fill in the missing values (when necessary) and to extendthe period to 2016. Not all the countries/territories mentioned above are neces-sarily included in the most recent happiness ranking. The HLE is constructedregardless of a country/territory’s presence in a particular ranking.
• Social support (or having someone to count on in times of trouble) is the nationalaverage of the binary responses (either 0 or 1) to the GWP question “If youwere in trouble, do you have relatives or friends you can count on to help youwhenever you need them, or not?”
• Freedom to make life choices is the national average of responses to the GWPquestion “Are you satisfied or dissatisfied with your freedom to choose whatyou do with your life?”
• Generosity is the residual of regressing national average of response to the GWPquestion “Have you donated money to a charity in the past month?” on GDPper capita.
• Corruption Perception: The measure is the national average of the survey re-sponses to two questions in the GWP: “Is corruption widespread throughoutthe government or not” and “Is corruption widespread within businesses ornot?” The overall perception is just the average of the two 0-or-1 responses. Incase the perception of government corruption is missing, we use the perceptionof business corruption as the overall perception. The corruption perception atthe national level is just the average response of the overall perception at theindividual level.
• Positive affect is defined as the average of three positive affect measures inGWP: happiness, laugh and enjoyment in the Gallup World Poll waves 3-7.These measures are the responses to the following three questions, respectively:“Did you experience the following feelings during A LOT OF THE DAY yes-terday? How about Happiness?”, “Did you smile or laugh a lot yesterday?”,and “Did you experience the following feelings during A LOT OF THE DAYyesterday? How about Enjoyment?” Waves 3-7 cover years 2008 to 2012 anda small number of countries in 2013. For waves 1-2 and those from wave 8 on,positive affect is defined as the average of laugh and enjoyment only, due to thelimited availability of happiness.
• Negative affect is defined as the average of three negative affect measures inGWP. They are worry, sadness and anger, respectively the responses to “Didyou experience the following feelings during A LOT OF THE DAY yesterday?How about Worry?”, “Did you experience the following feelings during A LOTOF THE DAY yesterday? How about Sadness?”, and “Did you experience thefollowing feelings during A LOT OF THE DAY yesterday? How about Anger?”
• Gini of household income reported in the GWP (variable name giniIncGallup).The income variable, namely INC 001, is described in Gallup’s “WORLDWIDE
3
RESEARCH METHODOLOGY AND CODEBOOK” (Updated July 2015) as“Household Income International Dollars [...] To calculate income, respondentsare asked to report their household income in local currency. Those respondentswho have difficulty answering the question are presented a set of ranges in localcurrency and are asked which group they fall into. Income variables are cre-ated by converting local currency to International Dollars (ID) using purchasingpower parity (PPP) ratios.” The gini measure is generated using STATA com-mand ineqdec0 by WP5-year with sample weights.
• GINI index from the World Bank (variable name giniIncWB and giniIncW-Bavg) from the World Development Indicators (Last Updated: 22-Dec-2015).The variable labeled at the source as “GINI index (World Bank estimate)”,series code “SI.POV.GINI”. According to the source, the data source is “WorldBank, Development Research Group. Data are based on primary household sur-vey data obtained from government statistical agencies and World Bank countrydepartments.” The variable giniIncWB is an unbalanced panel of yearly index.The data availability is patchy at the yearly frequency. The variable giniIncW-Bavg is the average of giniIncWB in the period 2000-2013. The average doesnot imply that a country has the gini index in all years in that period. In fact,most do not.
• Variables in the expanded data set: Confidence in national government fromthe GWP. The English wording of the question is “Do you have confidence ineach of the following, or not? How about the national government? (WP139)”.
• Variables in the expanded data set: “Most people can be trusted” from theGWP. The question’s English wording is “Generally speaking, would you saythat most people can be trusted or that you have to be careful in dealing withpeople?” This indicator has a limited coverage.
• Variables in the expanded data set: “Most people can be trusted” from the6-wave World Value Surveys. The question’s English wording is “Generallyspeaking, would you say that most people can be trusted or that you need to bevery careful in dealing with people?” The measure is defined as the percentageof respondents saying that most people can be trusted, excluding those who didnot provide an answer.
• Variables in the expanded data set: Democratic and delivery quality measuresof governance are based on Worldwide Governance Indicators (WGI) project(Kaufmann, Kraay and Mastruzzi). The original data have six dimensions:Voice and Accountability, Political Stability and Absence of Violence, Govern-ment Effectiveness, Regulatory Quality, Rule of Law, Control of Corruption.The indicators are on a scale roughly with mean zero and a standard deviationof 1. We reduce the number of dimensions to two using the simple average ofthe first two measures as an indicator of democratic quality, and the simpleaverage of the other four measures as an indicator of delivery quality, followingHelliwell and Huang (2008).
4
2 Coverage, Summary Statistics and Regression
Tables
WP5 is GWP’s coding of countries including some sub-country territories such asHong Kong. Not all the countries and territories appear in all the years. Our analysisdoes not cover all of the country/territories that have valid happiness scores. Tables1-3 show the WP5-year pairs that are covered.
The 2014-2016 ranking of happiness scores includes 154 countries/territories thathave the happiness scores in the 2014-2016 period, plus 1 country/territory that hasthe happiness score in 2013 but not in 2014-16; a later table has the list of thecountry/countries.
To appear in regression analysis that uses data from outside the GWP survey, aWP5-year needs to have the necessary external information (GDP, healthy life ex-pectancy, etc). The regression analysis thus does not necessarily cover all of the coun-tries/territories in the GWP. Nor does it necessarily cover all the countries/territoriesthat are ranked by their happiness scores in this report. The underlying principle isthat we always use the largest available sample. For different kind of analysis/ranking,the largest available samples can be different.
Regions: Some of the analysis includes dummy indicator for regions, namely West-ern Europe, Central and Eastern Europe, Commonwealth of Independent States,Southeast Asia, South Asia, East Asia, Latin America and Caribbean, North Amer-ica and ANZ, Middle East and North Africa, and Sub-Saharan Africa. A later set oftables list individual countries by their region grouping.
5

Table 1: Number of ladder (WP16) observations for WP5-years - Part 1
Country/territory (wp5 ID) 2005 2006 2007 2008 2009 2010 2011 2012 2013 2014 2015 2016
United States (1) 1001 1225 1004 1003 1005 1008 2094 1005 2048 1019 1032Egypt (2) 999 1024 1105 2112 2053 5296 4186 1149 1000 1000 1000Morocco (3) 1006 1001 3000 1007 2050 1008Lebanon (4) 996 1000 1000 2010 2027 2007 2013 1000 1000 1000 1000Saudi Arabia (5) 1004 1006 1150 2052 2038 2022 1077 2036 2035 1012 1000Jordan (6) 1000 1016 1007 2016 2000 2000 2000 1000 1000 1000 1000Syria (7) 1209 2100 2035 2041 2043 1022 1002Turkey (8) 995 1001 1004 999 1000 1001 2000 1000 2003 1002 1001Pakistan (9) 1001 1502 2484 3122 1030 1000 3012 1000 1000 1000 1000Indonesia (10) 1180 1000 1050 1080 1080 1000 3000 1000 1000 1000 1000Bangladesh (11) 1048 1200 1000 1000 1000 1000 3000 1000 1000 1000 1000United Kingdom (12) 1037 1204 1001 1002 1000 9239 13408750 2000 1000 1000France (13) 1002 1220 1006 1000 1004 1001 2005 751 2000 1000 1000Germany (14) 1001 1221 3016 2010 1007 9105 13269751 2014 1000 2000Netherlands (15) 1000 1000 1000 1001 1000 1000 751 2002 1003 1000Belgium (16) 1003 1022 1002 1003 1002 1001 1006 2004 1037 1000Spain (17) 1000 1004 1009 1005 1000 1006 2003 1004 2000 1000 1000Italy (18) 1002 1008 1008 1005 1000 1005 2007 1004 2000 1000 1000Poland (19) 1000 1000 1000 2000 1029 1000 1000 1000 1000 1000Hungary (20) 1025 1010 1008 1008 1014 1004 1019 1003 1000 1000Czech Republic (21) 1001 1072 2082 1000 1005 1001 1008 1000 1000Romania (22) 1022 1000 1000 1000 1008 1000 1000 998 1001 1001Sweden (23) 1000 1001 1000 1002 1002 1006 1000 750 2001 1000 1000Greece (24) 1002 1000 1000 1000 1000 1000 1003 1000 1000 1000Denmark (25) 1004 1009 1001 1000 1000 1005 1001 753 2002 1005 1000Iran (26) 1300 1004 1040 1003 3507 1000 2009 1001 1000Hong Kong S.A.R. of China (27) 800 751 755 756 1028 1006 2017 1005Singapore (28) 1095 1000 2551 1005 1001 1000 1000 1000 1000 1000Japan (29) 1000 1150 3000 1000 1000 1000 2000 1001 2006 1003 1003China (30) 3730 3733 3712 3833 4151 4220 9413 4244 4696 4265 4373India (31) 2100 3186 2000 3010 6000 3518 100805540 3000 3000 3000Venezuela (32) 1000 1000 1000 1000 1000 1000 1000 1000 1000 1000 1000Brazil (33) 1029 1038 1032 1031 1043 1042 1002 2006 1007 1004 1001Mexico (34) 1007 999 1000 1000 1000 1000 2000 1000 1017 1031 1000Nigeria (35) 1000 1000 1000 1000 1000 2000 1002 1000 1000Kenya (36) 1000 1000 2200 1000 1000 1000 1000 1000 1000 1000 1000Tanzania (37) 1000 1000 1000 1000 1000 1000 1000 1008 1008 1000 1000Israel (38) 1002 1001 1001 1000 1000 1000 1000 1000 1000 1000 1000Palestinian Territories (39) 1000 1000 1000 2014 2000 2000 2000 1000 1000 1000 1000Ghana (40) 1000 1000 1000 1000 1000 1000 1000 1008 1000 1000 1000Uganda (41) 1000 1000 1000 1000 1000 1000 1000 1000 1000 1000 1000Benin (42) 1000 1000 1000 1000 1000 1000 1000 1000Madagascar (43) 1000 1000 1000 1000 1008 1008 1000 1000Malawi (44) 1000 1000 1000 1000 1000 1000 1000 1000 1000South Africa (45) 1001 1000 1000 1000 1000 1000 2000 1000 1000 1000 1000Canada (46) 1355 1010 1005 1011 1007 1013 2003 1021 2025 1011 1016Australia (47) 1000 1205 1005 1000 1010 1002 1002 2002 1001 1004Philippines (48) 1200 1000 1000 1000 1000 1000 2000 1000 1000 1000 1000Sri Lanka (49) 1033 1000 1000 1000 1030 1000 2031 1030 1062 1062Vietnam (50) 1023 1015 1016 1008 1000 1000 2000 1017 1000 1000 1039Thailand (51) 1410 1006 1038 1019 1000 1000 2000 1000 1000 1000 1000Cambodia (52) 1000 1000 1024 1000 1000 1000 1000 1000 1000 1000 1000Laos (53) 1001 1000 1000 1000 1000Myanmar (54) 1020 1020 1020 1020 1020New Zealand (55) 1028 750 750 750 1000 1008 500 2001 1007 1004
6
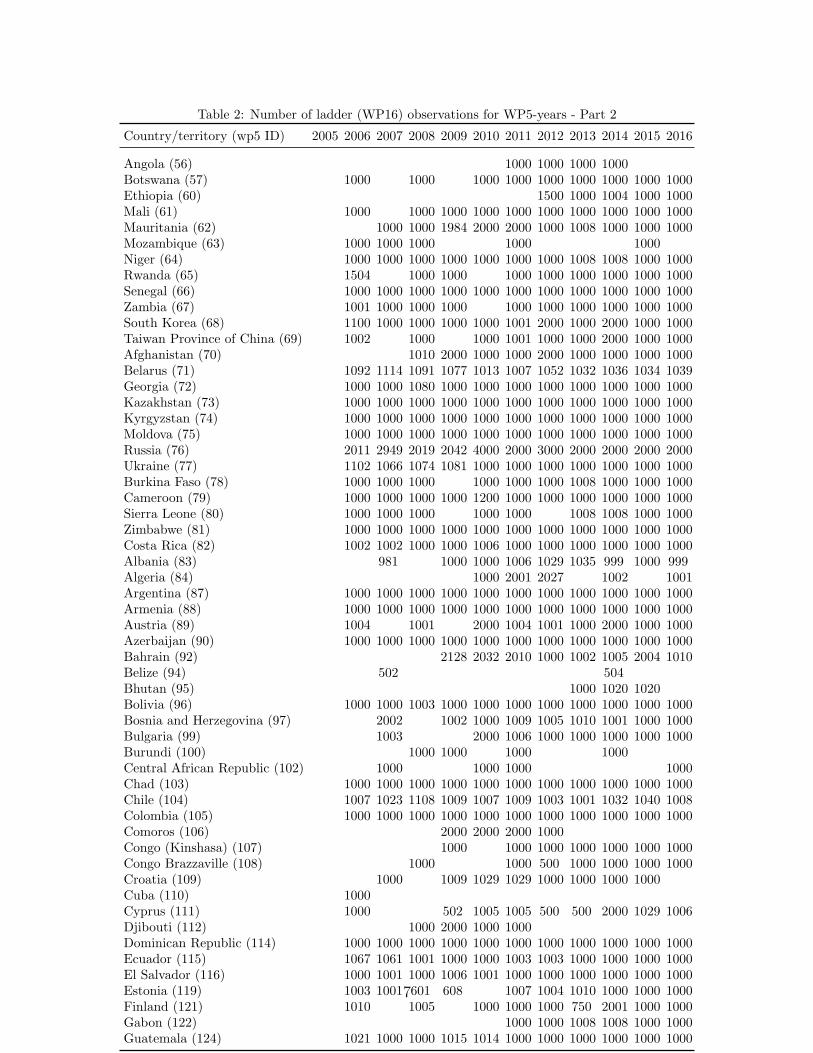
Table 2: Number of ladder (WP16) observations for WP5-years - Part 2
Country/territory (wp5 ID) 2005 2006 2007 2008 2009 2010 2011 2012 2013 2014 2015 2016
Angola (56) 1000 1000 1000 1000Botswana (57) 1000 1000 1000 1000 1000 1000 1000 1000 1000Ethiopia (60) 1500 1000 1004 1000 1000Mali (61) 1000 1000 1000 1000 1000 1000 1000 1000 1000 1000Mauritania (62) 1000 1000 1984 2000 2000 1000 1008 1000 1000 1000Mozambique (63) 1000 1000 1000 1000 1000Niger (64) 1000 1000 1000 1000 1000 1000 1000 1008 1008 1000 1000Rwanda (65) 1504 1000 1000 1000 1000 1000 1000 1000 1000Senegal (66) 1000 1000 1000 1000 1000 1000 1000 1000 1000 1000 1000Zambia (67) 1001 1000 1000 1000 1000 1000 1000 1000 1000 1000South Korea (68) 1100 1000 1000 1000 1000 1001 2000 1000 2000 1000 1000Taiwan Province of China (69) 1002 1000 1000 1001 1000 1000 2000 1000 1000Afghanistan (70) 1010 2000 1000 1000 2000 1000 1000 1000 1000Belarus (71) 1092 1114 1091 1077 1013 1007 1052 1032 1036 1034 1039Georgia (72) 1000 1000 1080 1000 1000 1000 1000 1000 1000 1000 1000Kazakhstan (73) 1000 1000 1000 1000 1000 1000 1000 1000 1000 1000 1000Kyrgyzstan (74) 1000 1000 1000 1000 1000 1000 1000 1000 1000 1000 1000Moldova (75) 1000 1000 1000 1000 1000 1000 1000 1000 1000 1000 1000Russia (76) 2011 2949 2019 2042 4000 2000 3000 2000 2000 2000 2000Ukraine (77) 1102 1066 1074 1081 1000 1000 1000 1000 1000 1000 1000Burkina Faso (78) 1000 1000 1000 1000 1000 1000 1008 1000 1000 1000Cameroon (79) 1000 1000 1000 1000 1200 1000 1000 1000 1000 1000 1000Sierra Leone (80) 1000 1000 1000 1000 1000 1008 1008 1000 1000Zimbabwe (81) 1000 1000 1000 1000 1000 1000 1000 1000 1000 1000 1000Costa Rica (82) 1002 1002 1000 1000 1006 1000 1000 1000 1000 1000 1000Albania (83) 981 1000 1000 1006 1029 1035 999 1000 999Algeria (84) 1000 2001 2027 1002 1001Argentina (87) 1000 1000 1000 1000 1000 1000 1000 1000 1000 1000 1000Armenia (88) 1000 1000 1000 1000 1000 1000 1000 1000 1000 1000 1000Austria (89) 1004 1001 2000 1004 1001 1000 2000 1000 1000Azerbaijan (90) 1000 1000 1000 1000 1000 1000 1000 1000 1000 1000 1000Bahrain (92) 2128 2032 2010 1000 1002 1005 2004 1010Belize (94) 502 504Bhutan (95) 1000 1020 1020Bolivia (96) 1000 1000 1003 1000 1000 1000 1000 1000 1000 1000 1000Bosnia and Herzegovina (97) 2002 1002 1000 1009 1005 1010 1001 1000 1000Bulgaria (99) 1003 2000 1006 1000 1000 1000 1000 1000Burundi (100) 1000 1000 1000 1000Central African Republic (102) 1000 1000 1000 1000Chad (103) 1000 1000 1000 1000 1000 1000 1000 1000 1000 1000 1000Chile (104) 1007 1023 1108 1009 1007 1009 1003 1001 1032 1040 1008Colombia (105) 1000 1000 1000 1000 1000 1000 1000 1000 1000 1000 1000Comoros (106) 2000 2000 2000 1000Congo (Kinshasa) (107) 1000 1000 1000 1000 1000 1000 1000Congo Brazzaville (108) 1000 1000 500 1000 1000 1000 1000Croatia (109) 1000 1009 1029 1029 1000 1000 1000 1000Cuba (110) 1000Cyprus (111) 1000 502 1005 1005 500 500 2000 1029 1006Djibouti (112) 1000 2000 1000 1000Dominican Republic (114) 1000 1000 1000 1000 1000 1000 1000 1000 1000 1000 1000Ecuador (115) 1067 1061 1001 1000 1000 1003 1003 1000 1000 1000 1000El Salvador (116) 1000 1001 1000 1006 1001 1000 1000 1000 1000 1000 1000Estonia (119) 1003 1001 601 608 1007 1004 1010 1000 1000 1000Finland (121) 1010 1005 1000 1000 1000 750 2001 1000 1000Gabon (122) 1000 1000 1008 1008 1000 1000Guatemala (124) 1021 1000 1000 1015 1014 1000 1000 1000 1000 1000 1000
7
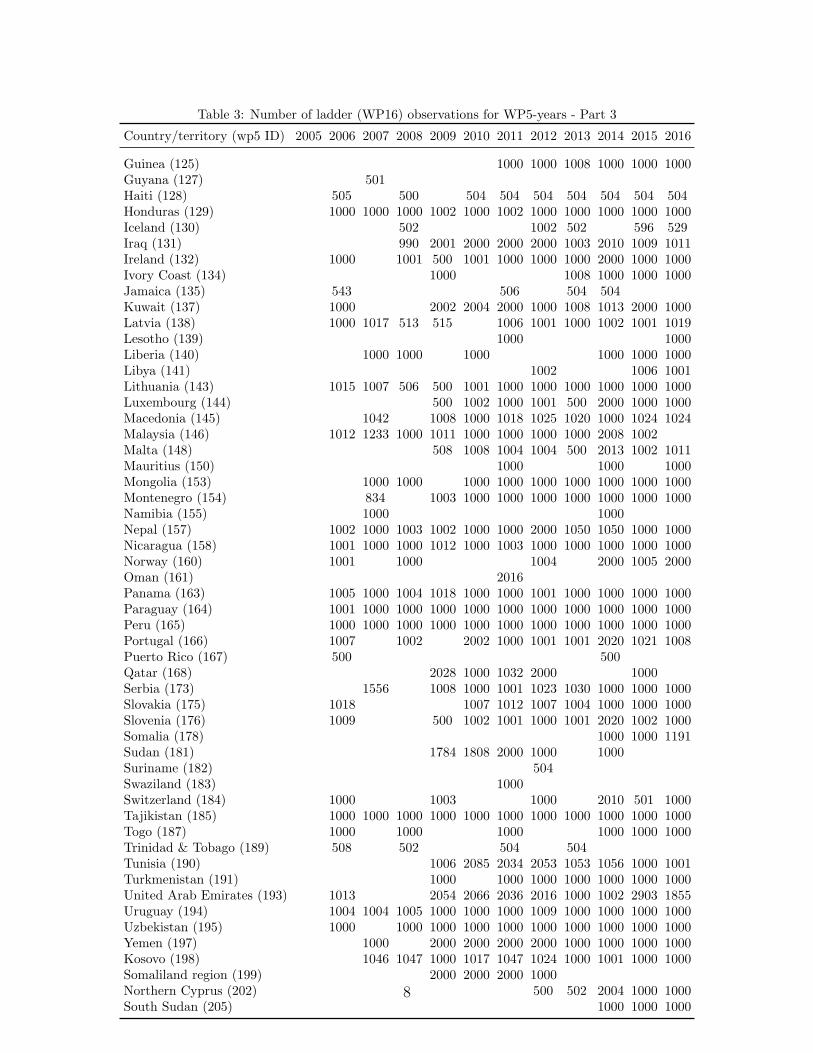
Table 3: Number of ladder (WP16) observations for WP5-years - Part 3
Country/territory (wp5 ID) 2005 2006 2007 2008 2009 2010 2011 2012 2013 2014 2015 2016
Guinea (125) 1000 1000 1008 1000 1000 1000Guyana (127) 501Haiti (128) 505 500 504 504 504 504 504 504 504Honduras (129) 1000 1000 1000 1002 1000 1002 1000 1000 1000 1000 1000Iceland (130) 502 1002 502 596 529Iraq (131) 990 2001 2000 2000 2000 1003 2010 1009 1011Ireland (132) 1000 1001 500 1001 1000 1000 1000 2000 1000 1000Ivory Coast (134) 1000 1008 1000 1000 1000Jamaica (135) 543 506 504 504Kuwait (137) 1000 2002 2004 2000 1000 1008 1013 2000 1000Latvia (138) 1000 1017 513 515 1006 1001 1000 1002 1001 1019Lesotho (139) 1000 1000Liberia (140) 1000 1000 1000 1000 1000 1000Libya (141) 1002 1006 1001Lithuania (143) 1015 1007 506 500 1001 1000 1000 1000 1000 1000 1000Luxembourg (144) 500 1002 1000 1001 500 2000 1000 1000Macedonia (145) 1042 1008 1000 1018 1025 1020 1000 1024 1024Malaysia (146) 1012 1233 1000 1011 1000 1000 1000 1000 2008 1002Malta (148) 508 1008 1004 1004 500 2013 1002 1011Mauritius (150) 1000 1000 1000Mongolia (153) 1000 1000 1000 1000 1000 1000 1000 1000 1000Montenegro (154) 834 1003 1000 1000 1000 1000 1000 1000 1000Namibia (155) 1000 1000Nepal (157) 1002 1000 1003 1002 1000 1000 2000 1050 1050 1000 1000Nicaragua (158) 1001 1000 1000 1012 1000 1003 1000 1000 1000 1000 1000Norway (160) 1001 1000 1004 2000 1005 2000Oman (161) 2016Panama (163) 1005 1000 1004 1018 1000 1000 1001 1000 1000 1000 1000Paraguay (164) 1001 1000 1000 1000 1000 1000 1000 1000 1000 1000 1000Peru (165) 1000 1000 1000 1000 1000 1000 1000 1000 1000 1000 1000Portugal (166) 1007 1002 2002 1000 1001 1001 2020 1021 1008Puerto Rico (167) 500 500Qatar (168) 2028 1000 1032 2000 1000Serbia (173) 1556 1008 1000 1001 1023 1030 1000 1000 1000Slovakia (175) 1018 1007 1012 1007 1004 1000 1000 1000Slovenia (176) 1009 500 1002 1001 1000 1001 2020 1002 1000Somalia (178) 1000 1000 1191Sudan (181) 1784 1808 2000 1000 1000Suriname (182) 504Swaziland (183) 1000Switzerland (184) 1000 1003 1000 2010 501 1000Tajikistan (185) 1000 1000 1000 1000 1000 1000 1000 1000 1000 1000 1000Togo (187) 1000 1000 1000 1000 1000 1000Trinidad & Tobago (189) 508 502 504 504Tunisia (190) 1006 2085 2034 2053 1053 1056 1000 1001Turkmenistan (191) 1000 1000 1000 1000 1000 1000 1000United Arab Emirates (193) 1013 2054 2066 2036 2016 1000 1002 2903 1855Uruguay (194) 1004 1004 1005 1000 1000 1000 1009 1000 1000 1000 1000Uzbekistan (195) 1000 1000 1000 1000 1000 1000 1000 1000 1000 1000Yemen (197) 1000 2000 2000 2000 2000 1000 1000 1000 1000Kosovo (198) 1046 1047 1000 1017 1047 1024 1000 1001 1000 1000Somaliland region (199) 2000 2000 2000 1000Northern Cyprus (202) 500 502 2004 1000 1000South Sudan (205) 1000 1000 1000
8
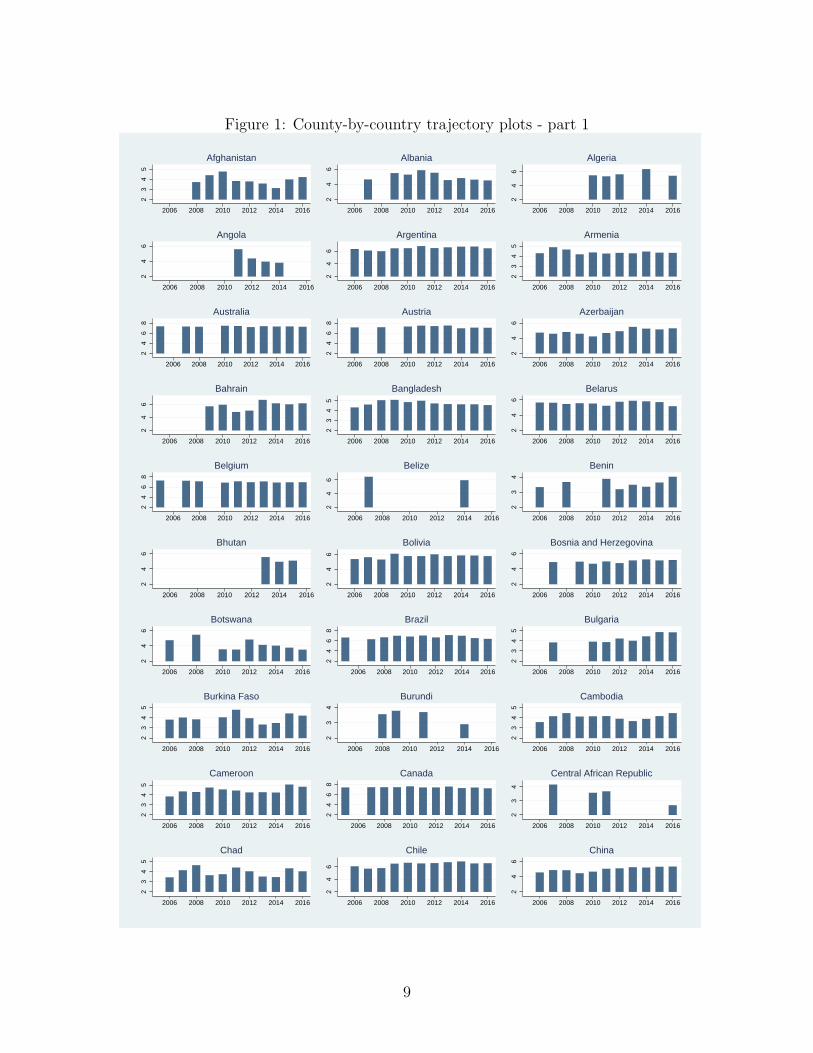
Figure 1: County-by-country trajectory plots - part 12
34
5
2006 2008 2010 2012 2014 2016
Afghanistan
24
6
2006 2008 2010 2012 2014 2016
Albania
24
6
2006 2008 2010 2012 2014 2016
Algeria
24
6
2006 2008 2010 2012 2014 2016
Angola
24
6
2006 2008 2010 2012 2014 2016
Argentina
23
45
2006 2008 2010 2012 2014 2016
Armenia
24
68
2006 2008 2010 2012 2014 2016
Australia
24
68
2006 2008 2010 2012 2014 2016
Austria
24
6
2006 2008 2010 2012 2014 2016
Azerbaijan
24
6
2006 2008 2010 2012 2014 2016
Bahrain
23
45
2006 2008 2010 2012 2014 2016
Bangladesh
24
6
2006 2008 2010 2012 2014 2016
Belarus
24
68
2006 2008 2010 2012 2014 2016
Belgium
24
6
2006 2008 2010 2012 2014 2016
Belize
23
42006 2008 2010 2012 2014 2016
Benin
24
6
2006 2008 2010 2012 2014 2016
Bhutan
24
6
2006 2008 2010 2012 2014 2016
Bolivia
24
6
2006 2008 2010 2012 2014 2016
Bosnia and Herzegovina
24
6
2006 2008 2010 2012 2014 2016
Botswana
24
68
2006 2008 2010 2012 2014 2016
Brazil
23
45
2006 2008 2010 2012 2014 2016
Bulgaria
23
45
2006 2008 2010 2012 2014 2016
Burkina Faso
23
4
2006 2008 2010 2012 2014 2016
Burundi
23
45
2006 2008 2010 2012 2014 2016
Cambodia
23
45
2006 2008 2010 2012 2014 2016
Cameroon
24
68
2006 2008 2010 2012 2014 2016
Canada
23
4
2006 2008 2010 2012 2014 2016
Central African Republic
23
45
2006 2008 2010 2012 2014 2016
Chad
24
6
2006 2008 2010 2012 2014 2016
Chile
24
6
2006 2008 2010 2012 2014 2016
China
9
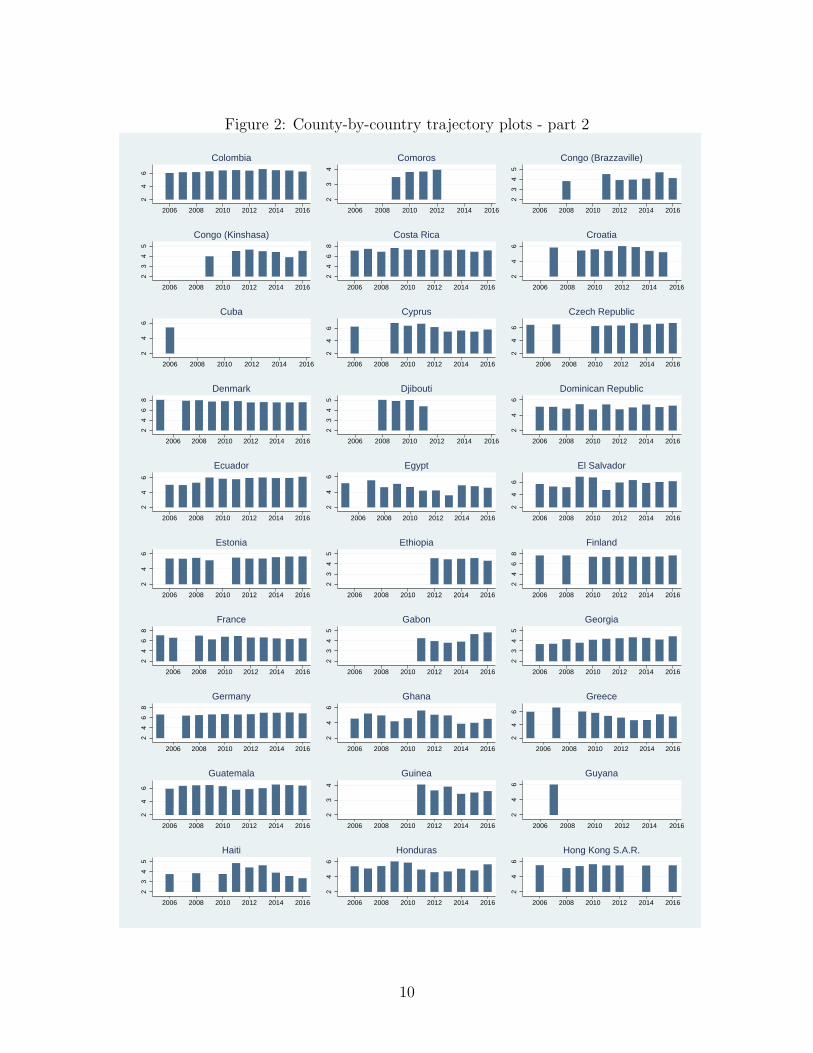
Figure 2: County-by-country trajectory plots - part 22
46
2006 2008 2010 2012 2014 2016
Colombia
23
4
2006 2008 2010 2012 2014 2016
Comoros
23
45
2006 2008 2010 2012 2014 2016
Congo (Brazzaville)
23
45
2006 2008 2010 2012 2014 2016
Congo (Kinshasa)
24
68
2006 2008 2010 2012 2014 2016
Costa Rica
24
6
2006 2008 2010 2012 2014 2016
Croatia
24
6
2006 2008 2010 2012 2014 2016
Cuba
24
6
2006 2008 2010 2012 2014 2016
Cyprus
24
6
2006 2008 2010 2012 2014 2016
Czech Republic
24
68
2006 2008 2010 2012 2014 2016
Denmark
23
45
2006 2008 2010 2012 2014 2016
Djibouti
24
6
2006 2008 2010 2012 2014 2016
Dominican Republic
24
6
2006 2008 2010 2012 2014 2016
Ecuador
24
6
2006 2008 2010 2012 2014 2016
Egypt
24
62006 2008 2010 2012 2014 2016
El Salvador
24
6
2006 2008 2010 2012 2014 2016
Estonia
23
45
2006 2008 2010 2012 2014 2016
Ethiopia
24
68
2006 2008 2010 2012 2014 2016
Finland
24
68
2006 2008 2010 2012 2014 2016
France
23
45
2006 2008 2010 2012 2014 2016
Gabon
23
45
2006 2008 2010 2012 2014 2016
Georgia
24
68
2006 2008 2010 2012 2014 2016
Germany
24
6
2006 2008 2010 2012 2014 2016
Ghana
24
6
2006 2008 2010 2012 2014 2016
Greece
24
6
2006 2008 2010 2012 2014 2016
Guatemala
23
4
2006 2008 2010 2012 2014 2016
Guinea
24
6
2006 2008 2010 2012 2014 2016
Guyana
23
45
2006 2008 2010 2012 2014 2016
Haiti
24
6
2006 2008 2010 2012 2014 2016
Honduras
24
6
2006 2008 2010 2012 2014 2016
Hong Kong S.A.R.
10
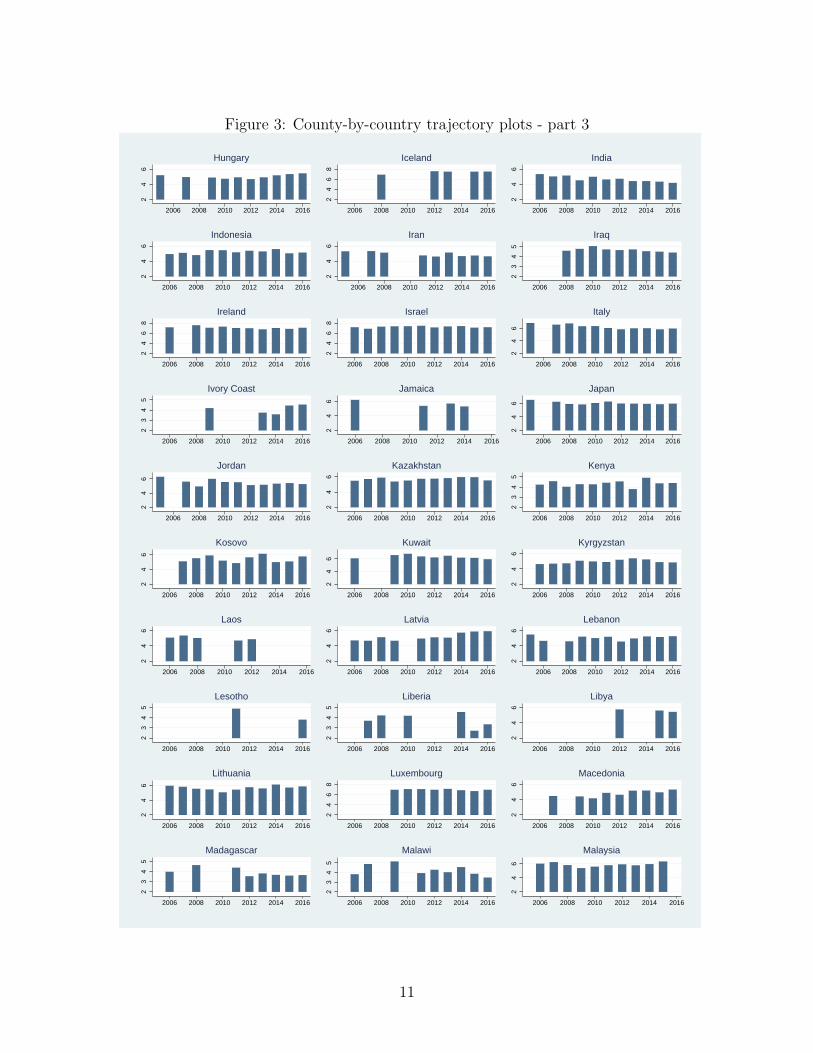
Figure 3: County-by-country trajectory plots - part 32
46
2006 2008 2010 2012 2014 2016
Hungary
24
68
2006 2008 2010 2012 2014 2016
Iceland
24
6
2006 2008 2010 2012 2014 2016
India
24
6
2006 2008 2010 2012 2014 2016
Indonesia
24
6
2006 2008 2010 2012 2014 2016
Iran
23
45
2006 2008 2010 2012 2014 2016
Iraq
24
68
2006 2008 2010 2012 2014 2016
Ireland
24
68
2006 2008 2010 2012 2014 2016
Israel
24
6
2006 2008 2010 2012 2014 2016
Italy
23
45
2006 2008 2010 2012 2014 2016
Ivory Coast
24
6
2006 2008 2010 2012 2014 2016
Jamaica
24
6
2006 2008 2010 2012 2014 2016
Japan
24
6
2006 2008 2010 2012 2014 2016
Jordan
24
6
2006 2008 2010 2012 2014 2016
Kazakhstan
23
45
2006 2008 2010 2012 2014 2016
Kenya
24
6
2006 2008 2010 2012 2014 2016
Kosovo
24
6
2006 2008 2010 2012 2014 2016
Kuwait
24
6
2006 2008 2010 2012 2014 2016
Kyrgyzstan
24
6
2006 2008 2010 2012 2014 2016
Laos
24
6
2006 2008 2010 2012 2014 2016
Latvia
24
6
2006 2008 2010 2012 2014 2016
Lebanon
23
45
2006 2008 2010 2012 2014 2016
Lesotho
23
45
2006 2008 2010 2012 2014 2016
Liberia
24
6
2006 2008 2010 2012 2014 2016
Libya
24
6
2006 2008 2010 2012 2014 2016
Lithuania
24
68
2006 2008 2010 2012 2014 2016
Luxembourg
24
6
2006 2008 2010 2012 2014 2016
Macedonia
23
45
2006 2008 2010 2012 2014 2016
Madagascar
23
45
2006 2008 2010 2012 2014 2016
Malawi
24
6
2006 2008 2010 2012 2014 2016
Malaysia
11
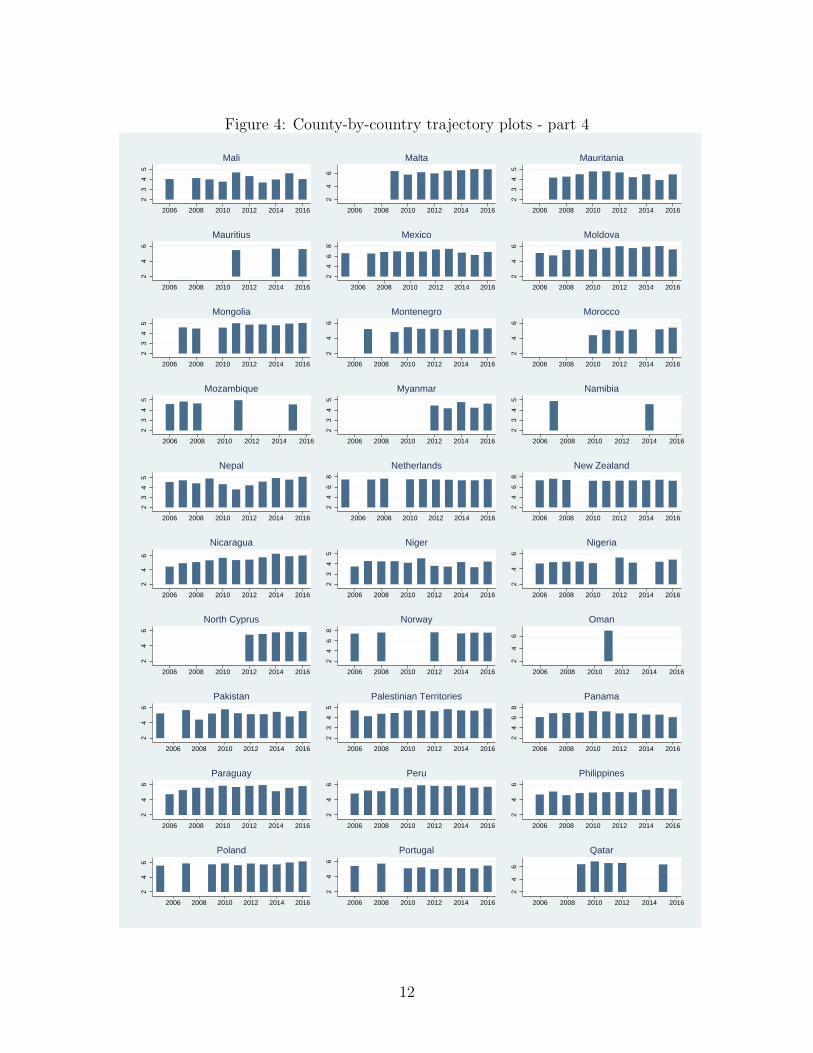
Figure 4: County-by-country trajectory plots - part 42
34
5
2006 2008 2010 2012 2014 2016
Mali
24
6
2006 2008 2010 2012 2014 2016
Malta
23
45
2006 2008 2010 2012 2014 2016
Mauritania
24
6
2006 2008 2010 2012 2014 2016
Mauritius
24
68
2006 2008 2010 2012 2014 2016
Mexico
24
6
2006 2008 2010 2012 2014 2016
Moldova
23
45
2006 2008 2010 2012 2014 2016
Mongolia
24
6
2006 2008 2010 2012 2014 2016
Montenegro
24
6
2006 2008 2010 2012 2014 2016
Morocco
23
45
2006 2008 2010 2012 2014 2016
Mozambique
23
45
2006 2008 2010 2012 2014 2016
Myanmar
23
45
2006 2008 2010 2012 2014 2016
Namibia
23
45
2006 2008 2010 2012 2014 2016
Nepal
24
68
2006 2008 2010 2012 2014 2016
Netherlands
24
68
2006 2008 2010 2012 2014 2016
New Zealand
24
6
2006 2008 2010 2012 2014 2016
Nicaragua
23
45
2006 2008 2010 2012 2014 2016
Niger
24
6
2006 2008 2010 2012 2014 2016
Nigeria
24
6
2006 2008 2010 2012 2014 2016
North Cyprus
24
68
2006 2008 2010 2012 2014 2016
Norway
24
6
2006 2008 2010 2012 2014 2016
Oman
24
6
2006 2008 2010 2012 2014 2016
Pakistan
23
45
2006 2008 2010 2012 2014 2016
Palestinian Territories
24
68
2006 2008 2010 2012 2014 2016
Panama
24
6
2006 2008 2010 2012 2014 2016
Paraguay
24
6
2006 2008 2010 2012 2014 2016
Peru
24
6
2006 2008 2010 2012 2014 2016
Philippines
24
6
2006 2008 2010 2012 2014 2016
Poland
24
6
2006 2008 2010 2012 2014 2016
Portugal
24
6
2006 2008 2010 2012 2014 2016
Qatar
12
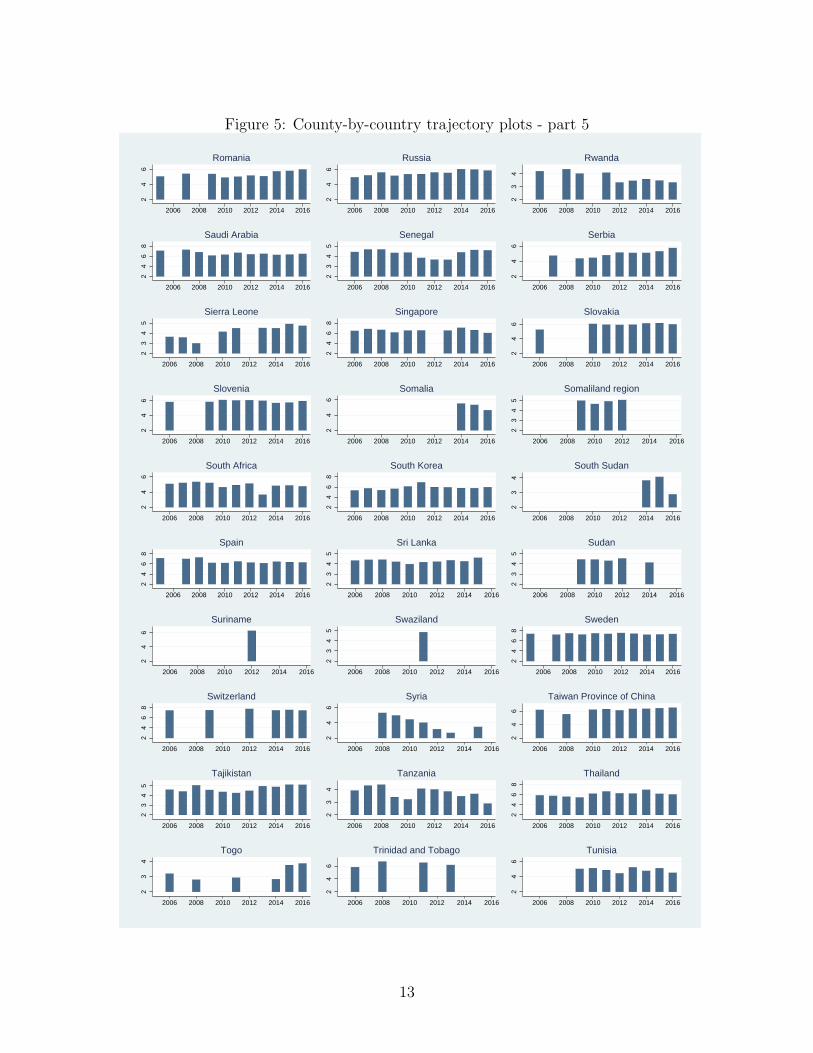
Figure 5: County-by-country trajectory plots - part 52
46
2006 2008 2010 2012 2014 2016
Romania
24
6
2006 2008 2010 2012 2014 2016
Russia
23
4
2006 2008 2010 2012 2014 2016
Rwanda
24
68
2006 2008 2010 2012 2014 2016
Saudi Arabia
23
45
2006 2008 2010 2012 2014 2016
Senegal
24
6
2006 2008 2010 2012 2014 2016
Serbia
23
45
2006 2008 2010 2012 2014 2016
Sierra Leone
24
68
2006 2008 2010 2012 2014 2016
Singapore
24
6
2006 2008 2010 2012 2014 2016
Slovakia
24
6
2006 2008 2010 2012 2014 2016
Slovenia
24
6
2006 2008 2010 2012 2014 2016
Somalia
23
45
2006 2008 2010 2012 2014 2016
Somaliland region
24
6
2006 2008 2010 2012 2014 2016
South Africa
24
68
2006 2008 2010 2012 2014 2016
South Korea
23
42006 2008 2010 2012 2014 2016
South Sudan
24
68
2006 2008 2010 2012 2014 2016
Spain
23
45
2006 2008 2010 2012 2014 2016
Sri Lanka
23
45
2006 2008 2010 2012 2014 2016
Sudan
24
6
2006 2008 2010 2012 2014 2016
Suriname
23
45
2006 2008 2010 2012 2014 2016
Swaziland
24
68
2006 2008 2010 2012 2014 2016
Sweden
24
68
2006 2008 2010 2012 2014 2016
Switzerland
24
6
2006 2008 2010 2012 2014 2016
Syria
24
6
2006 2008 2010 2012 2014 2016
Taiwan Province of China
23
45
2006 2008 2010 2012 2014 2016
Tajikistan
23
4
2006 2008 2010 2012 2014 2016
Tanzania
24
68
2006 2008 2010 2012 2014 2016
Thailand
23
4
2006 2008 2010 2012 2014 2016
Togo
24
6
2006 2008 2010 2012 2014 2016
Trinidad and Tobago
24
6
2006 2008 2010 2012 2014 2016
Tunisia
13
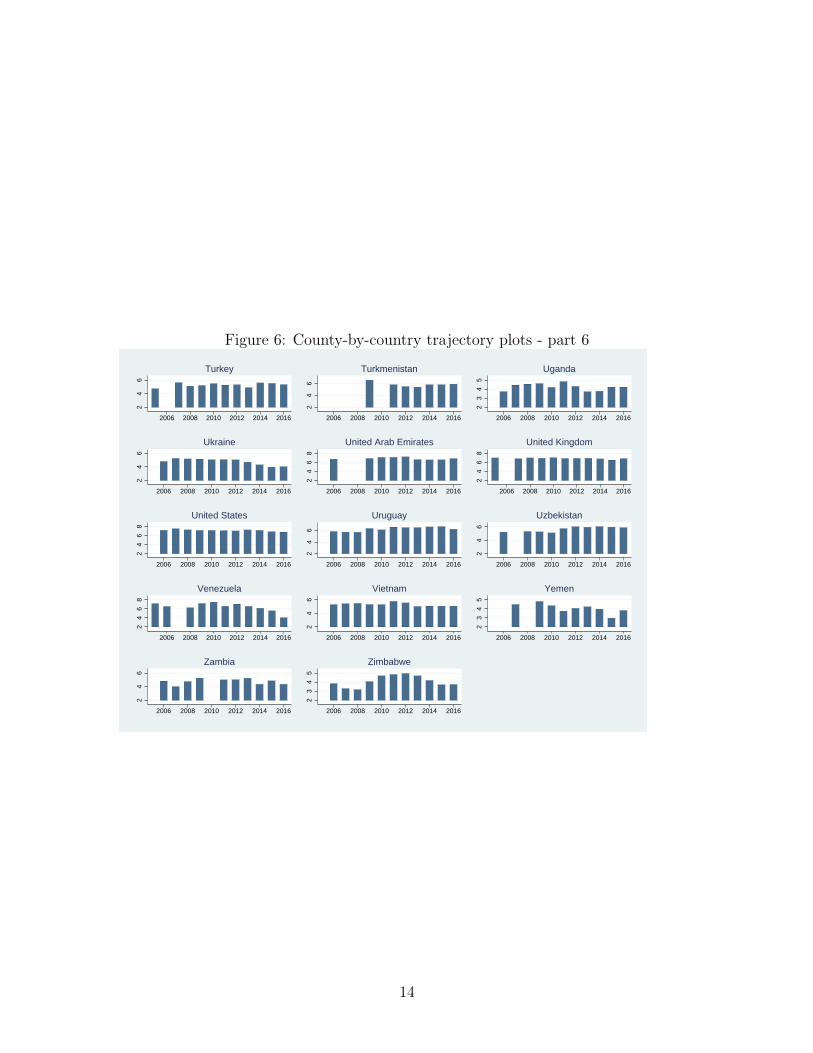
Figure 6: County-by-country trajectory plots - part 6
24
6
2006 2008 2010 2012 2014 2016
Turkey
24
6
2006 2008 2010 2012 2014 2016
Turkmenistan
23
45
2006 2008 2010 2012 2014 2016
Uganda
24
6
2006 2008 2010 2012 2014 2016
Ukraine
24
68
2006 2008 2010 2012 2014 2016
United Arab Emirates
24
68
2006 2008 2010 2012 2014 2016
United Kingdom
24
68
2006 2008 2010 2012 2014 2016
United States
24
6
2006 2008 2010 2012 2014 2016
Uruguay
24
6
2006 2008 2010 2012 2014 2016
Uzbekistan
24
68
2006 2008 2010 2012 2014 2016
Venezuela
24
6
2006 2008 2010 2012 2014 2016
Vietnam
23
45
2006 2008 2010 2012 2014 2016
Yemen
24
6
2006 2008 2010 2012 2014 2016
Zambia
23
45
2006 2008 2010 2012 2014 2016
Zimbabwe
14
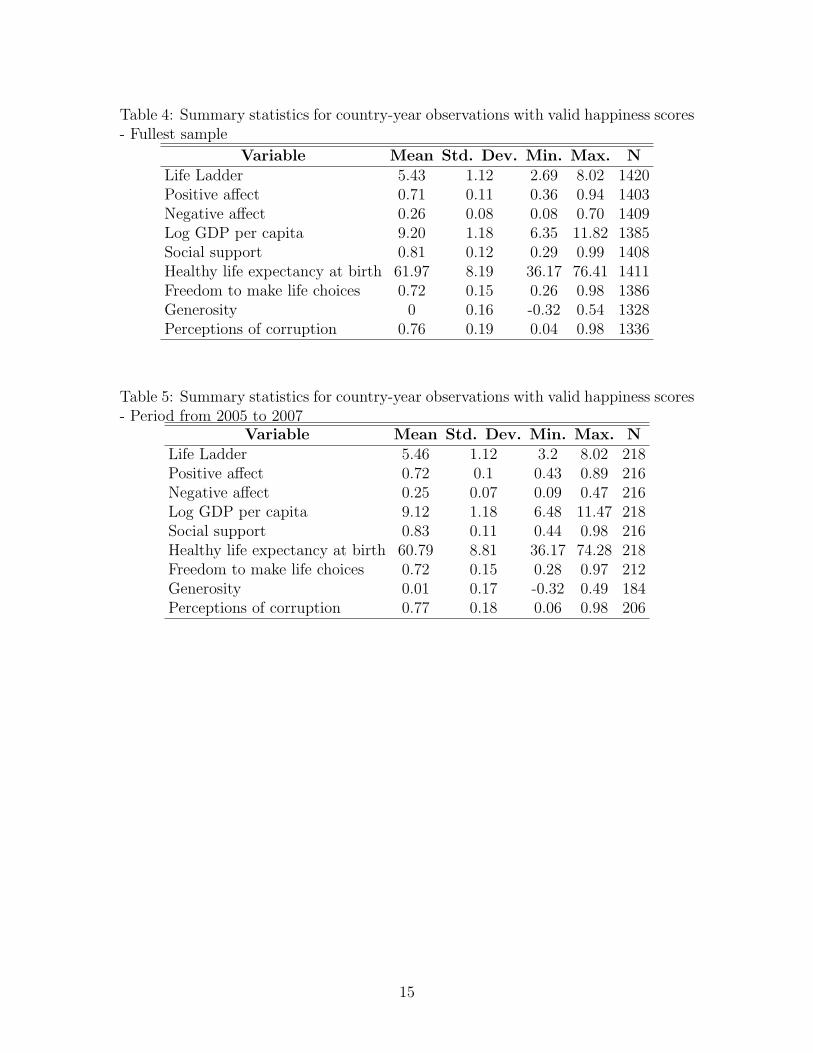
Table 4: Summary statistics for country-year observations with valid happiness scores- Fullest sample
Variable Mean Std. Dev. Min. Max. NLife Ladder 5.43 1.12 2.69 8.02 1420Positive affect 0.71 0.11 0.36 0.94 1403Negative affect 0.26 0.08 0.08 0.70 1409Log GDP per capita 9.20 1.18 6.35 11.82 1385Social support 0.81 0.12 0.29 0.99 1408Healthy life expectancy at birth 61.97 8.19 36.17 76.41 1411Freedom to make life choices 0.72 0.15 0.26 0.98 1386Generosity 0 0.16 -0.32 0.54 1328Perceptions of corruption 0.76 0.19 0.04 0.98 1336
Table 5: Summary statistics for country-year observations with valid happiness scores- Period from 2005 to 2007
Variable Mean Std. Dev. Min. Max. NLife Ladder 5.46 1.12 3.2 8.02 218Positive affect 0.72 0.1 0.43 0.89 216Negative affect 0.25 0.07 0.09 0.47 216Log GDP per capita 9.12 1.18 6.48 11.47 218Social support 0.83 0.11 0.44 0.98 216Healthy life expectancy at birth 60.79 8.81 36.17 74.28 218Freedom to make life choices 0.72 0.15 0.28 0.97 212Generosity 0.01 0.17 -0.32 0.49 184Perceptions of corruption 0.77 0.18 0.06 0.98 206
15
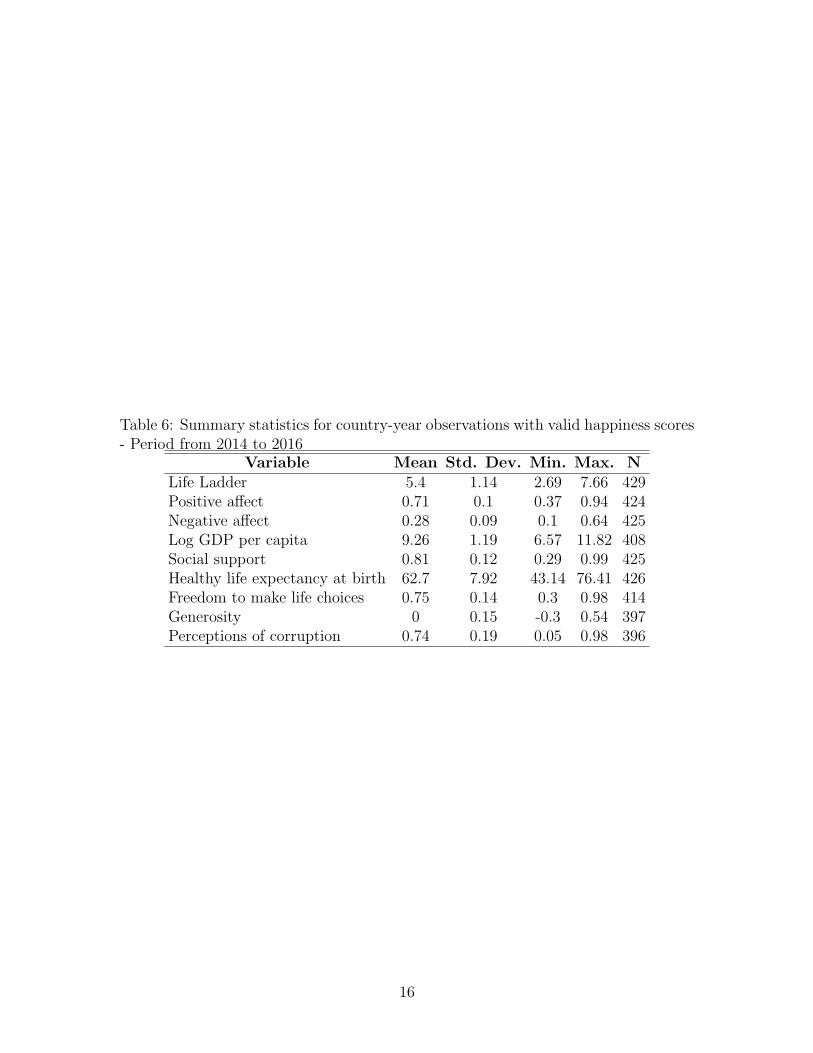
Table 6: Summary statistics for country-year observations with valid happiness scores- Period from 2014 to 2016
Variable Mean Std. Dev. Min. Max. NLife Ladder 5.4 1.14 2.69 7.66 429Positive affect 0.71 0.1 0.37 0.94 424Negative affect 0.28 0.09 0.1 0.64 425Log GDP per capita 9.26 1.19 6.57 11.82 408Social support 0.81 0.12 0.29 0.99 425Healthy life expectancy at birth 62.7 7.92 43.14 76.41 426Freedom to make life choices 0.75 0.14 0.3 0.98 414Generosity 0 0.15 -0.3 0.54 397Perceptions of corruption 0.74 0.19 0.05 0.98 396
16
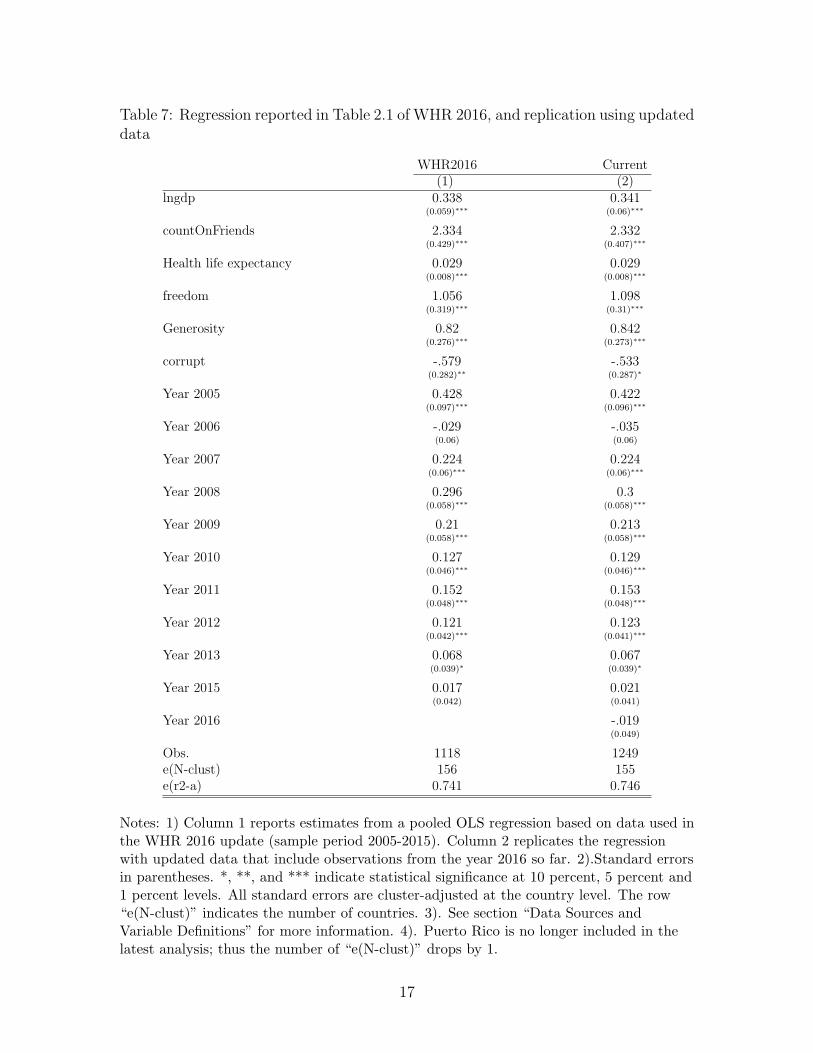
Table 7: Regression reported in Table 2.1 of WHR 2016, and replication using updateddata
WHR2016 Current(1) (2)
lngdp 0.338 0.341(0.059)∗∗∗ (0.06)∗∗∗
countOnFriends 2.334 2.332(0.429)∗∗∗ (0.407)∗∗∗
Health life expectancy 0.029 0.029(0.008)∗∗∗ (0.008)∗∗∗
freedom 1.056 1.098(0.319)∗∗∗ (0.31)∗∗∗
Generosity 0.82 0.842(0.276)∗∗∗ (0.273)∗∗∗
corrupt -.579 -.533(0.282)∗∗ (0.287)∗
Year 2005 0.428 0.422(0.097)∗∗∗ (0.096)∗∗∗
Year 2006 -.029 -.035(0.06) (0.06)
Year 2007 0.224 0.224(0.06)∗∗∗ (0.06)∗∗∗
Year 2008 0.296 0.3(0.058)∗∗∗ (0.058)∗∗∗
Year 2009 0.21 0.213(0.058)∗∗∗ (0.058)∗∗∗
Year 2010 0.127 0.129(0.046)∗∗∗ (0.046)∗∗∗
Year 2011 0.152 0.153(0.048)∗∗∗ (0.048)∗∗∗
Year 2012 0.121 0.123(0.042)∗∗∗ (0.041)∗∗∗
Year 2013 0.068 0.067(0.039)∗ (0.039)∗
Year 2015 0.017 0.021(0.042) (0.041)
Year 2016 -.019(0.049)
Obs. 1118 1249e(N-clust) 156 155e(r2-a) 0.741 0.746
Notes: 1) Column 1 reports estimates from a pooled OLS regression based on data used inthe WHR 2016 update (sample period 2005-2015). Column 2 replicates the regressionwith updated data that include observations from the year 2016 so far. 2).Standard errorsin parentheses. *, **, and *** indicate statistical significance at 10 percent, 5 percent and1 percent levels. All standard errors are cluster-adjusted at the country level. The row“e(N-clust)” indicates the number of countries. 3). See section “Data Sources andVariable Definitions” for more information. 4). Puerto Rico is no longer included in thelatest analysis; thus the number of “e(N-clust)” drops by 1.
17
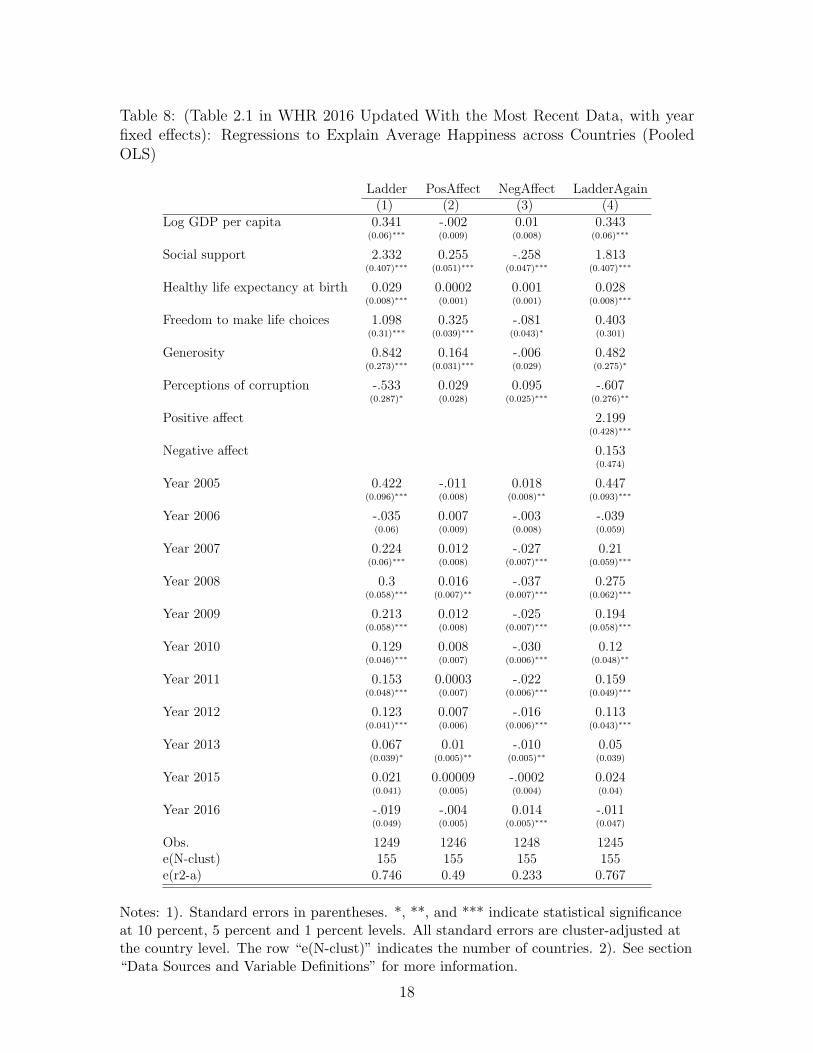
Table 8: (Table 2.1 in WHR 2016 Updated With the Most Recent Data, with yearfixed effects): Regressions to Explain Average Happiness across Countries (PooledOLS)
Ladder PosAffect NegAffect LadderAgain(1) (2) (3) (4)
Log GDP per capita 0.341 -.002 0.01 0.343(0.06)∗∗∗ (0.009) (0.008) (0.06)∗∗∗
Social support 2.332 0.255 -.258 1.813(0.407)∗∗∗ (0.051)∗∗∗ (0.047)∗∗∗ (0.407)∗∗∗
Healthy life expectancy at birth 0.029 0.0002 0.001 0.028(0.008)∗∗∗ (0.001) (0.001) (0.008)∗∗∗
Freedom to make life choices 1.098 0.325 -.081 0.403(0.31)∗∗∗ (0.039)∗∗∗ (0.043)∗ (0.301)
Generosity 0.842 0.164 -.006 0.482(0.273)∗∗∗ (0.031)∗∗∗ (0.029) (0.275)∗
Perceptions of corruption -.533 0.029 0.095 -.607(0.287)∗ (0.028) (0.025)∗∗∗ (0.276)∗∗
Positive affect 2.199(0.428)∗∗∗
Negative affect 0.153(0.474)
Year 2005 0.422 -.011 0.018 0.447(0.096)∗∗∗ (0.008) (0.008)∗∗ (0.093)∗∗∗
Year 2006 -.035 0.007 -.003 -.039(0.06) (0.009) (0.008) (0.059)
Year 2007 0.224 0.012 -.027 0.21(0.06)∗∗∗ (0.008) (0.007)∗∗∗ (0.059)∗∗∗
Year 2008 0.3 0.016 -.037 0.275(0.058)∗∗∗ (0.007)∗∗ (0.007)∗∗∗ (0.062)∗∗∗
Year 2009 0.213 0.012 -.025 0.194(0.058)∗∗∗ (0.008) (0.007)∗∗∗ (0.058)∗∗∗
Year 2010 0.129 0.008 -.030 0.12(0.046)∗∗∗ (0.007) (0.006)∗∗∗ (0.048)∗∗
Year 2011 0.153 0.0003 -.022 0.159(0.048)∗∗∗ (0.007) (0.006)∗∗∗ (0.049)∗∗∗
Year 2012 0.123 0.007 -.016 0.113(0.041)∗∗∗ (0.006) (0.006)∗∗∗ (0.043)∗∗∗
Year 2013 0.067 0.01 -.010 0.05(0.039)∗ (0.005)∗∗ (0.005)∗∗ (0.039)
Year 2015 0.021 0.00009 -.0002 0.024(0.041) (0.005) (0.004) (0.04)
Year 2016 -.019 -.004 0.014 -.011(0.049) (0.005) (0.005)∗∗∗ (0.047)
Obs. 1249 1246 1248 1245e(N-clust) 155 155 155 155e(r2-a) 0.746 0.49 0.233 0.767
Notes: 1). Standard errors in parentheses. *, **, and *** indicate statistical significanceat 10 percent, 5 percent and 1 percent levels. All standard errors are cluster-adjusted atthe country level. The row “e(N-clust)” indicates the number of countries. 2). See section“Data Sources and Variable Definitions” for more information.
18
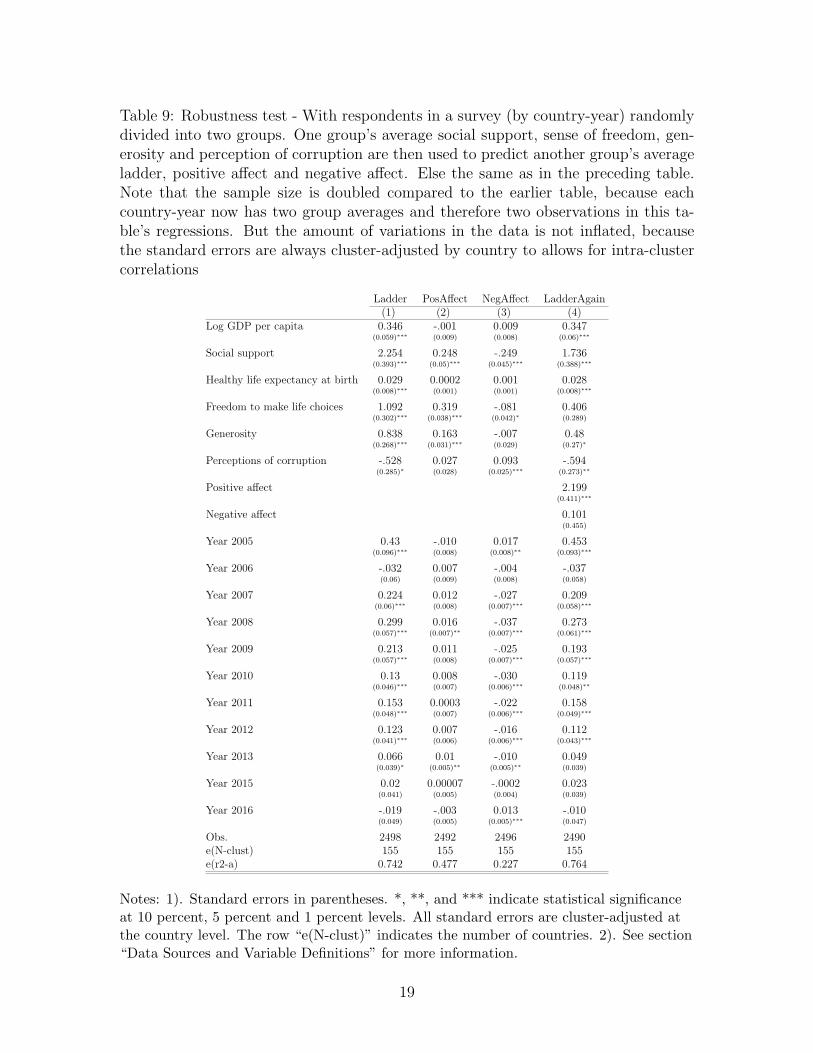
Table 9: Robustness test - With respondents in a survey (by country-year) randomlydivided into two groups. One group’s average social support, sense of freedom, gen-erosity and perception of corruption are then used to predict another group’s averageladder, positive affect and negative affect. Else the same as in the preceding table.Note that the sample size is doubled compared to the earlier table, because eachcountry-year now has two group averages and therefore two observations in this ta-ble’s regressions. But the amount of variations in the data is not inflated, becausethe standard errors are always cluster-adjusted by country to allows for intra-clustercorrelations
Ladder PosAffect NegAffect LadderAgain(1) (2) (3) (4)
Log GDP per capita 0.346 -.001 0.009 0.347(0.059)∗∗∗ (0.009) (0.008) (0.06)∗∗∗
Social support 2.254 0.248 -.249 1.736(0.393)∗∗∗ (0.05)∗∗∗ (0.045)∗∗∗ (0.388)∗∗∗
Healthy life expectancy at birth 0.029 0.0002 0.001 0.028(0.008)∗∗∗ (0.001) (0.001) (0.008)∗∗∗
Freedom to make life choices 1.092 0.319 -.081 0.406(0.302)∗∗∗ (0.038)∗∗∗ (0.042)∗ (0.289)
Generosity 0.838 0.163 -.007 0.48(0.268)∗∗∗ (0.031)∗∗∗ (0.029) (0.27)∗
Perceptions of corruption -.528 0.027 0.093 -.594(0.285)∗ (0.028) (0.025)∗∗∗ (0.273)∗∗
Positive affect 2.199(0.411)∗∗∗
Negative affect 0.101(0.455)
Year 2005 0.43 -.010 0.017 0.453(0.096)∗∗∗ (0.008) (0.008)∗∗ (0.093)∗∗∗
Year 2006 -.032 0.007 -.004 -.037(0.06) (0.009) (0.008) (0.058)
Year 2007 0.224 0.012 -.027 0.209(0.06)∗∗∗ (0.008) (0.007)∗∗∗ (0.058)∗∗∗
Year 2008 0.299 0.016 -.037 0.273(0.057)∗∗∗ (0.007)∗∗ (0.007)∗∗∗ (0.061)∗∗∗
Year 2009 0.213 0.011 -.025 0.193(0.057)∗∗∗ (0.008) (0.007)∗∗∗ (0.057)∗∗∗
Year 2010 0.13 0.008 -.030 0.119(0.046)∗∗∗ (0.007) (0.006)∗∗∗ (0.048)∗∗
Year 2011 0.153 0.0003 -.022 0.158(0.048)∗∗∗ (0.007) (0.006)∗∗∗ (0.049)∗∗∗
Year 2012 0.123 0.007 -.016 0.112(0.041)∗∗∗ (0.006) (0.006)∗∗∗ (0.043)∗∗∗
Year 2013 0.066 0.01 -.010 0.049(0.039)∗ (0.005)∗∗ (0.005)∗∗ (0.039)
Year 2015 0.02 0.00007 -.0002 0.023(0.041) (0.005) (0.004) (0.039)
Year 2016 -.019 -.003 0.013 -.010(0.049) (0.005) (0.005)∗∗∗ (0.047)
Obs. 2498 2492 2496 2490e(N-clust) 155 155 155 155e(r2-a) 0.742 0.477 0.227 0.764
Notes: 1). Standard errors in parentheses. *, **, and *** indicate statistical significanceat 10 percent, 5 percent and 1 percent levels. All standard errors are cluster-adjusted atthe country level. The row “e(N-clust)” indicates the number of countries. 2). See section“Data Sources and Variable Definitions” for more information.
19
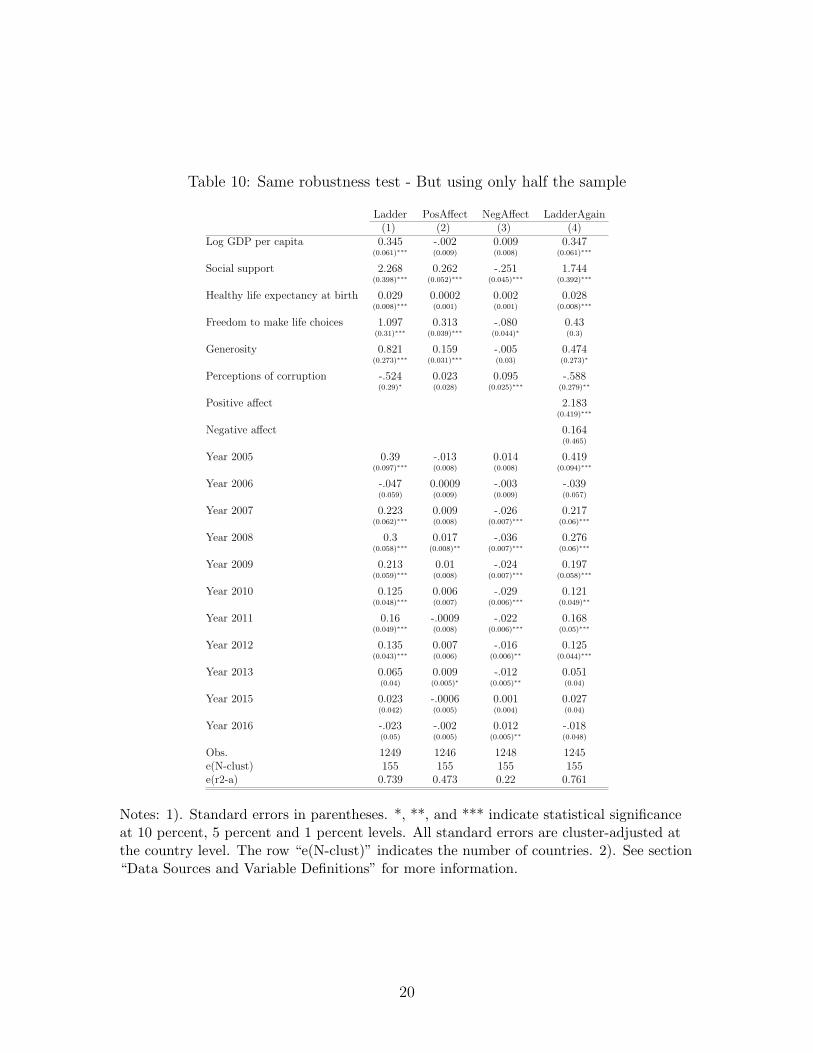
Table 10: Same robustness test - But using only half the sample
Ladder PosAffect NegAffect LadderAgain(1) (2) (3) (4)
Log GDP per capita 0.345 -.002 0.009 0.347(0.061)∗∗∗ (0.009) (0.008) (0.061)∗∗∗
Social support 2.268 0.262 -.251 1.744(0.398)∗∗∗ (0.052)∗∗∗ (0.045)∗∗∗ (0.392)∗∗∗
Healthy life expectancy at birth 0.029 0.0002 0.002 0.028(0.008)∗∗∗ (0.001) (0.001) (0.008)∗∗∗
Freedom to make life choices 1.097 0.313 -.080 0.43(0.31)∗∗∗ (0.039)∗∗∗ (0.044)∗ (0.3)
Generosity 0.821 0.159 -.005 0.474(0.273)∗∗∗ (0.031)∗∗∗ (0.03) (0.273)∗
Perceptions of corruption -.524 0.023 0.095 -.588(0.29)∗ (0.028) (0.025)∗∗∗ (0.279)∗∗
Positive affect 2.183(0.419)∗∗∗
Negative affect 0.164(0.465)
Year 2005 0.39 -.013 0.014 0.419(0.097)∗∗∗ (0.008) (0.008) (0.094)∗∗∗
Year 2006 -.047 0.0009 -.003 -.039(0.059) (0.009) (0.009) (0.057)
Year 2007 0.223 0.009 -.026 0.217(0.062)∗∗∗ (0.008) (0.007)∗∗∗ (0.06)∗∗∗
Year 2008 0.3 0.017 -.036 0.276(0.058)∗∗∗ (0.008)∗∗ (0.007)∗∗∗ (0.06)∗∗∗
Year 2009 0.213 0.01 -.024 0.197(0.059)∗∗∗ (0.008) (0.007)∗∗∗ (0.058)∗∗∗
Year 2010 0.125 0.006 -.029 0.121(0.048)∗∗∗ (0.007) (0.006)∗∗∗ (0.049)∗∗
Year 2011 0.16 -.0009 -.022 0.168(0.049)∗∗∗ (0.008) (0.006)∗∗∗ (0.05)∗∗∗
Year 2012 0.135 0.007 -.016 0.125(0.043)∗∗∗ (0.006) (0.006)∗∗ (0.044)∗∗∗
Year 2013 0.065 0.009 -.012 0.051(0.04) (0.005)∗ (0.005)∗∗ (0.04)
Year 2015 0.023 -.0006 0.001 0.027(0.042) (0.005) (0.004) (0.04)
Year 2016 -.023 -.002 0.012 -.018(0.05) (0.005) (0.005)∗∗ (0.048)
Obs. 1249 1246 1248 1245e(N-clust) 155 155 155 155e(r2-a) 0.739 0.473 0.22 0.761
Notes: 1). Standard errors in parentheses. *, **, and *** indicate statistical significanceat 10 percent, 5 percent and 1 percent levels. All standard errors are cluster-adjusted atthe country level. The row “e(N-clust)” indicates the number of countries. 2). See section“Data Sources and Variable Definitions” for more information.
20

Table 11: Robustness test - Using the other half the sample
Ladder PosAffect NegAffect LadderAgain(1) (2) (3) (4)
Log GDP per capita 0.348 -.0003 0.01 0.348(0.059)∗∗∗ (0.009) (0.008) (0.059)∗∗∗
Social support 2.242 0.235 -.247 1.729(0.396)∗∗∗ (0.048)∗∗∗ (0.046)∗∗∗ (0.392)∗∗∗
Healthy life expectancy at birth 0.029 0.0003 0.001 0.029(0.008)∗∗∗ (0.001) (0.001) (0.008)∗∗∗
Freedom to make life choices 1.088 0.325 -.081 0.381(0.3)∗∗∗ (0.039)∗∗∗ (0.042)∗ (0.284)
Generosity 0.856 0.168 -.010 0.485(0.266)∗∗∗ (0.032)∗∗∗ (0.029) (0.27)∗
Perceptions of corruption -.530 0.032 0.092 -.600(0.283)∗ (0.028) (0.025)∗∗∗ (0.27)∗∗
Positive affect 2.214(0.412)∗∗∗
Negative affect 0.037(0.456)
Year 2005 0.469 -.007 0.021 0.487(0.096)∗∗∗ (0.009) (0.009)∗∗ (0.092)∗∗∗
Year 2006 -.016 0.013 -.005 -.036(0.064) (0.009) (0.009) (0.063)
Year 2007 0.225 0.016 -.028 0.2(0.06)∗∗∗ (0.009)∗ (0.007)∗∗∗ (0.06)∗∗∗
Year 2008 0.297 0.015 -.037 0.269(0.06)∗∗∗ (0.007)∗∗ (0.007)∗∗∗ (0.064)∗∗∗
Year 2009 0.213 0.013 -.025 0.189(0.059)∗∗∗ (0.008) (0.007)∗∗∗ (0.059)∗∗∗
Year 2010 0.134 0.01 -.030 0.117(0.047)∗∗∗ (0.007) (0.006)∗∗∗ (0.049)∗∗
Year 2011 0.147 0.001 -.023 0.147(0.049)∗∗∗ (0.008) (0.006)∗∗∗ (0.05)∗∗∗
Year 2012 0.11 0.007 -.016 0.098(0.043)∗∗∗ (0.006) (0.006)∗∗ (0.044)∗∗
Year 2013 0.068 0.011 -.009 0.047(0.041) (0.005)∗∗ (0.006) (0.042)
Year 2015 0.018 0.0008 -.001 0.019(0.043) (0.005) (0.004) (0.042)
Year 2016 -.015 -.005 0.015 -.003(0.052) (0.005) (0.005)∗∗∗ (0.05)
Obs. 1249 1246 1248 1245e(N-clust) 155 155 155 155e(r2-a) 0.741 0.475 0.224 0.765
Notes: 1). Standard errors in parentheses. *, **, and *** indicate statistical significanceat 10 percent, 5 percent and 1 percent levels. All standard errors are cluster-adjusted atthe country level. The row “e(N-clust)” indicates the number of countries. 2). See section“Data Sources and Variable Definitions” for more information.
21
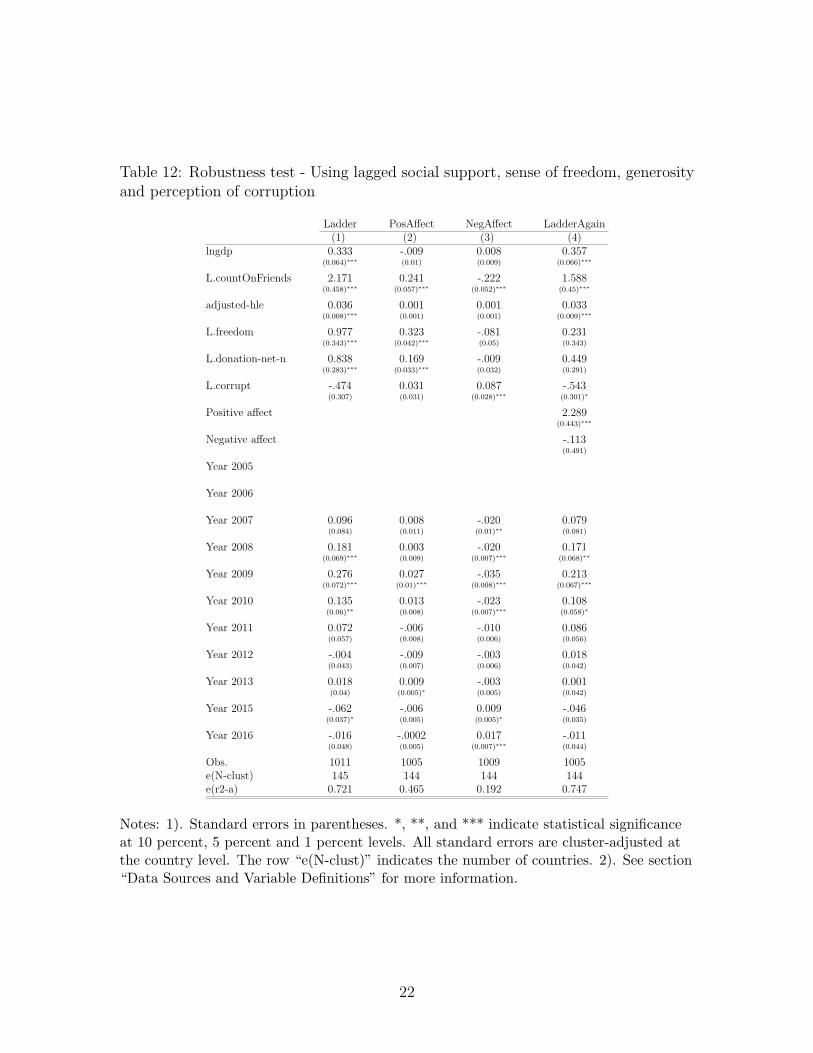
Table 12: Robustness test - Using lagged social support, sense of freedom, generosityand perception of corruption
Ladder PosAffect NegAffect LadderAgain(1) (2) (3) (4)
lngdp 0.333 -.009 0.008 0.357(0.064)∗∗∗ (0.01) (0.009) (0.066)∗∗∗
L.countOnFriends 2.171 0.241 -.222 1.588(0.458)∗∗∗ (0.057)∗∗∗ (0.052)∗∗∗ (0.45)∗∗∗
adjusted-hle 0.036 0.001 0.001 0.033(0.008)∗∗∗ (0.001) (0.001) (0.009)∗∗∗
L.freedom 0.977 0.323 -.081 0.231(0.343)∗∗∗ (0.042)∗∗∗ (0.05) (0.343)
L.donation-net-n 0.838 0.169 -.009 0.449(0.283)∗∗∗ (0.033)∗∗∗ (0.032) (0.291)
L.corrupt -.474 0.031 0.087 -.543(0.307) (0.031) (0.028)∗∗∗ (0.301)∗
Positive affect 2.289(0.443)∗∗∗
Negative affect -.113(0.491)
Year 2005
Year 2006
Year 2007 0.096 0.008 -.020 0.079(0.084) (0.011) (0.01)∗∗ (0.081)
Year 2008 0.181 0.003 -.020 0.171(0.069)∗∗∗ (0.009) (0.007)∗∗∗ (0.068)∗∗
Year 2009 0.276 0.027 -.035 0.213(0.072)∗∗∗ (0.01)∗∗∗ (0.008)∗∗∗ (0.067)∗∗∗
Year 2010 0.135 0.013 -.023 0.108(0.06)∗∗ (0.008) (0.007)∗∗∗ (0.058)∗
Year 2011 0.072 -.006 -.010 0.086(0.057) (0.008) (0.006) (0.056)
Year 2012 -.004 -.009 -.003 0.018(0.043) (0.007) (0.006) (0.042)
Year 2013 0.018 0.009 -.003 0.001(0.04) (0.005)∗ (0.005) (0.042)
Year 2015 -.062 -.006 0.009 -.046(0.037)∗ (0.005) (0.005)∗ (0.035)
Year 2016 -.016 -.0002 0.017 -.011(0.048) (0.005) (0.007)∗∗∗ (0.044)
Obs. 1011 1005 1009 1005e(N-clust) 145 144 144 144e(r2-a) 0.721 0.465 0.192 0.747
Notes: 1). Standard errors in parentheses. *, **, and *** indicate statistical significanceat 10 percent, 5 percent and 1 percent levels. All standard errors are cluster-adjusted atthe country level. The row “e(N-clust)” indicates the number of countries. 2). See section“Data Sources and Variable Definitions” for more information.
22
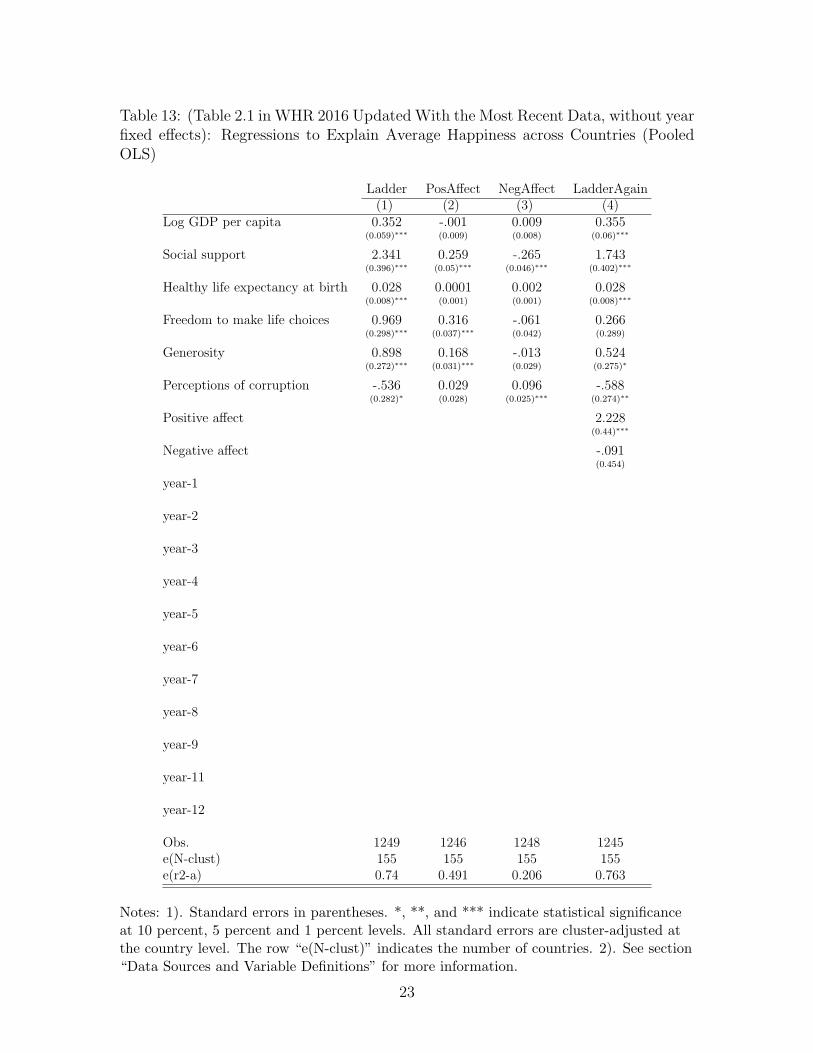
Table 13: (Table 2.1 in WHR 2016 Updated With the Most Recent Data, without yearfixed effects): Regressions to Explain Average Happiness across Countries (PooledOLS)
Ladder PosAffect NegAffect LadderAgain(1) (2) (3) (4)
Log GDP per capita 0.352 -.001 0.009 0.355(0.059)∗∗∗ (0.009) (0.008) (0.06)∗∗∗
Social support 2.341 0.259 -.265 1.743(0.396)∗∗∗ (0.05)∗∗∗ (0.046)∗∗∗ (0.402)∗∗∗
Healthy life expectancy at birth 0.028 0.0001 0.002 0.028(0.008)∗∗∗ (0.001) (0.001) (0.008)∗∗∗
Freedom to make life choices 0.969 0.316 -.061 0.266(0.298)∗∗∗ (0.037)∗∗∗ (0.042) (0.289)
Generosity 0.898 0.168 -.013 0.524(0.272)∗∗∗ (0.031)∗∗∗ (0.029) (0.275)∗
Perceptions of corruption -.536 0.029 0.096 -.588(0.282)∗ (0.028) (0.025)∗∗∗ (0.274)∗∗
Positive affect 2.228(0.44)∗∗∗
Negative affect -.091(0.454)
year-1
year-2
year-3
year-4
year-5
year-6
year-7
year-8
year-9
year-11
year-12
Obs. 1249 1246 1248 1245e(N-clust) 155 155 155 155e(r2-a) 0.74 0.491 0.206 0.763
Notes: 1). Standard errors in parentheses. *, **, and *** indicate statistical significanceat 10 percent, 5 percent and 1 percent levels. All standard errors are cluster-adjusted atthe country level. The row “e(N-clust)” indicates the number of countries. 2). See section“Data Sources and Variable Definitions” for more information.
23
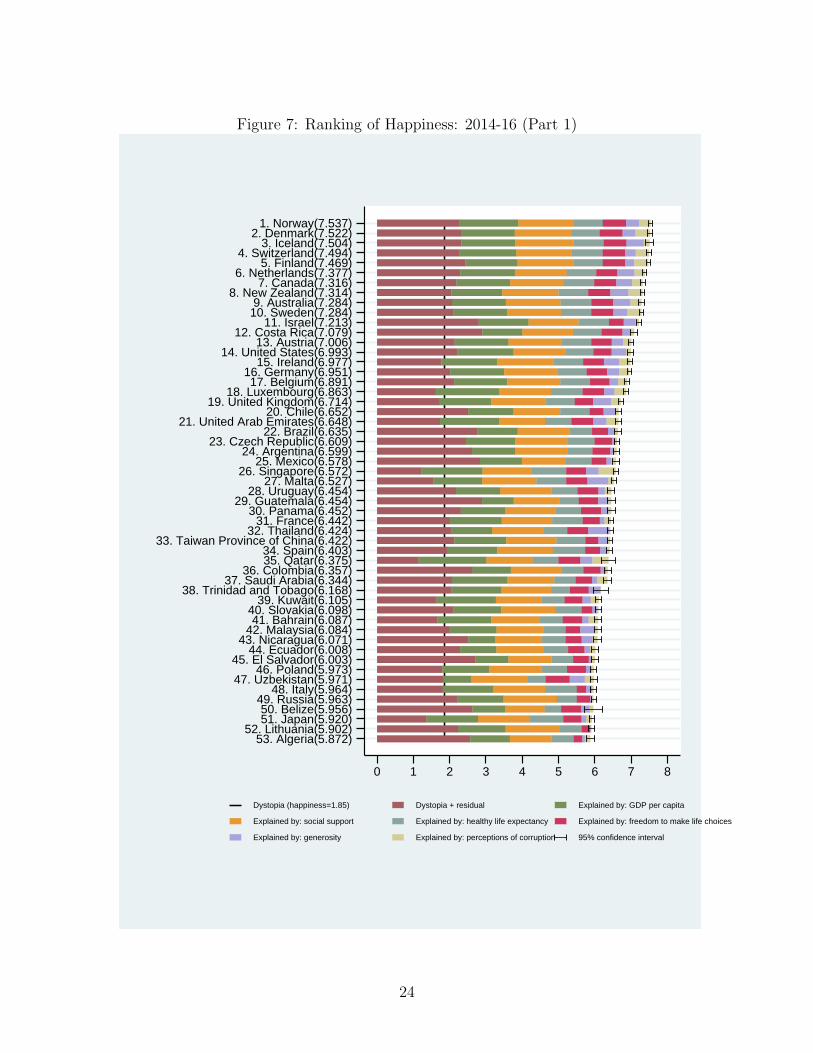
Figure 7: Ranking of Happiness: 2014-16 (Part 1)
53. Algeria(5.872)52. Lithuania(5.902)
51. Japan(5.920)50. Belize(5.956)
49. Russia(5.963)48. Italy(5.964)
47. Uzbekistan(5.971)46. Poland(5.973)
45. El Salvador(6.003)44. Ecuador(6.008)
43. Nicaragua(6.071)42. Malaysia(6.084)41. Bahrain(6.087)
40. Slovakia(6.098)39. Kuwait(6.105)
38. Trinidad and Tobago(6.168)37. Saudi Arabia(6.344)
36. Colombia(6.357)35. Qatar(6.375)34. Spain(6.403)
33. Taiwan Province of China(6.422)32. Thailand(6.424)
31. France(6.442)30. Panama(6.452)
29. Guatemala(6.454)28. Uruguay(6.454)
27. Malta(6.527)26. Singapore(6.572)
25. Mexico(6.578)24. Argentina(6.599)
23. Czech Republic(6.609)22. Brazil(6.635)
21. United Arab Emirates(6.648)20. Chile(6.652)
19. United Kingdom(6.714)18. Luxembourg(6.863)
17. Belgium(6.891)16. Germany(6.951)
15. Ireland(6.977)14. United States(6.993)
13. Austria(7.006)12. Costa Rica(7.079)
11. Israel(7.213)10. Sweden(7.284)9. Australia(7.284)
8. New Zealand(7.314)7. Canada(7.316)
6. Netherlands(7.377)5. Finland(7.469)
4. Switzerland(7.494)3. Iceland(7.504)
2. Denmark(7.522)1. Norway(7.537)
0 1 2 3 4 5 6 7 8
Dystopia (happiness=1.85) Dystopia + residual Explained by: GDP per capita
Explained by: social support Explained by: healthy life expectancy Explained by: freedom to make life choices
Explained by: generosity Explained by: perceptions of corruption 95% confidence interval
24
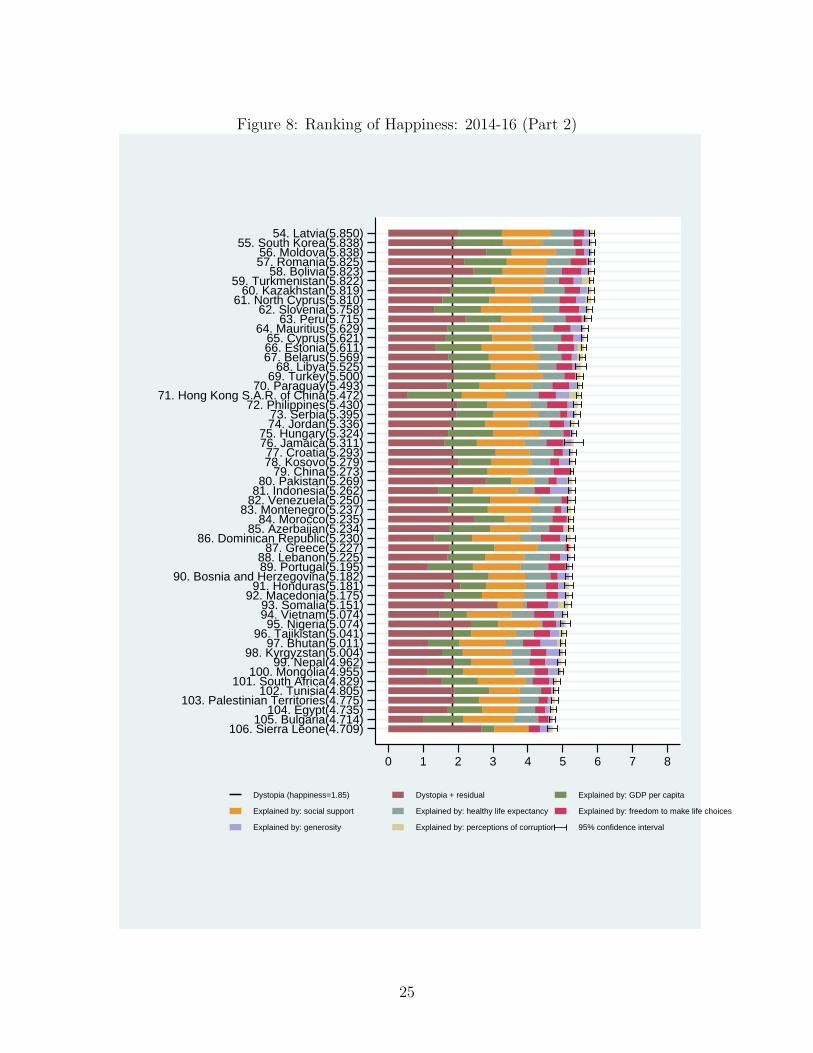
Figure 8: Ranking of Happiness: 2014-16 (Part 2)
106. Sierra Leone(4.709)105. Bulgaria(4.714)
104. Egypt(4.735)103. Palestinian Territories(4.775)
102. Tunisia(4.805)101. South Africa(4.829)
100. Mongolia(4.955)99. Nepal(4.962)
98. Kyrgyzstan(5.004)97. Bhutan(5.011)
96. Tajikistan(5.041)95. Nigeria(5.074)
94. Vietnam(5.074)93. Somalia(5.151)
92. Macedonia(5.175)91. Honduras(5.181)
90. Bosnia and Herzegovina(5.182)89. Portugal(5.195)88. Lebanon(5.225)
87. Greece(5.227)86. Dominican Republic(5.230)
85. Azerbaijan(5.234)84. Morocco(5.235)
83. Montenegro(5.237)82. Venezuela(5.250)81. Indonesia(5.262)80. Pakistan(5.269)
79. China(5.273)78. Kosovo(5.279)77. Croatia(5.293)
76. Jamaica(5.311)75. Hungary(5.324)
74. Jordan(5.336)73. Serbia(5.395)
72. Philippines(5.430)71. Hong Kong S.A.R. of China(5.472)
70. Paraguay(5.493)69. Turkey(5.500)
68. Libya(5.525)67. Belarus(5.569)66. Estonia(5.611)65. Cyprus(5.621)
64. Mauritius(5.629)63. Peru(5.715)
62. Slovenia(5.758)61. North Cyprus(5.810)
60. Kazakhstan(5.819)59. Turkmenistan(5.822)
58. Bolivia(5.823)57. Romania(5.825)56. Moldova(5.838)
55. South Korea(5.838)54. Latvia(5.850)
0 1 2 3 4 5 6 7 8
Dystopia (happiness=1.85) Dystopia + residual Explained by: GDP per capita
Explained by: social support Explained by: healthy life expectancy Explained by: freedom to make life choices
Explained by: generosity Explained by: perceptions of corruption 95% confidence interval
25
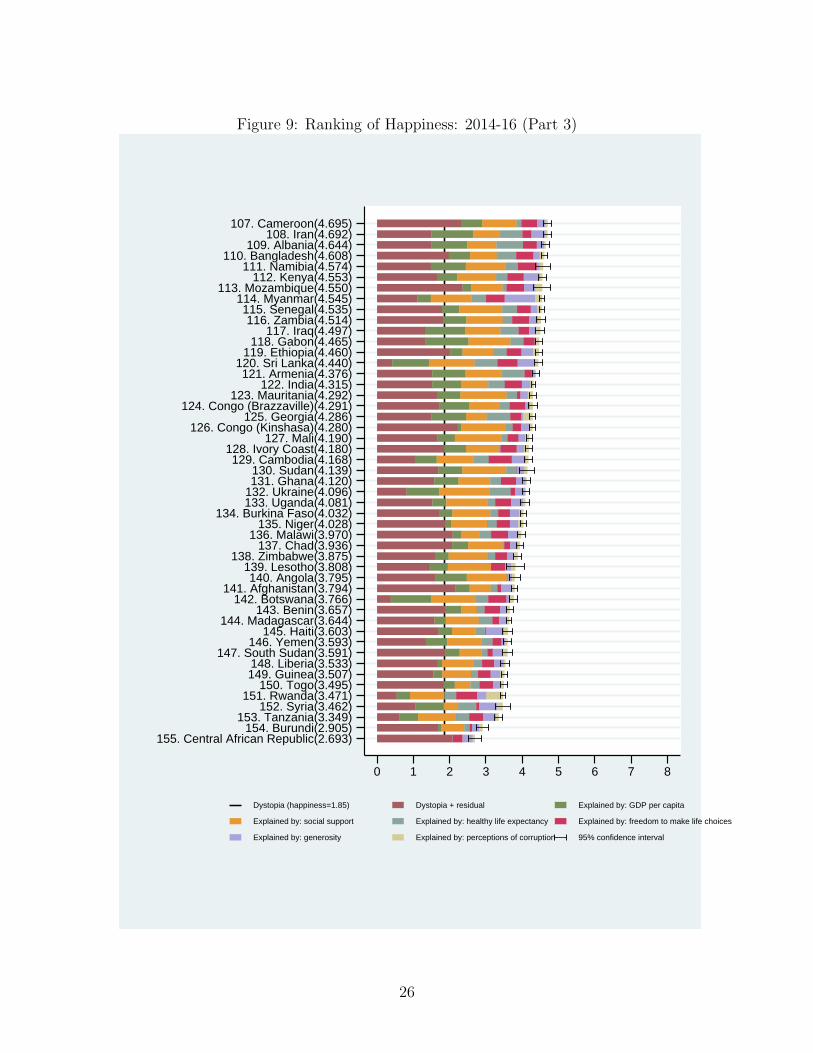
Figure 9: Ranking of Happiness: 2014-16 (Part 3)
155. Central African Republic(2.693)154. Burundi(2.905)
153. Tanzania(3.349)152. Syria(3.462)
151. Rwanda(3.471)150. Togo(3.495)
149. Guinea(3.507)148. Liberia(3.533)
147. South Sudan(3.591)146. Yemen(3.593)
145. Haiti(3.603)144. Madagascar(3.644)
143. Benin(3.657)142. Botswana(3.766)
141. Afghanistan(3.794)140. Angola(3.795)
139. Lesotho(3.808)138. Zimbabwe(3.875)
137. Chad(3.936)136. Malawi(3.970)
135. Niger(4.028)134. Burkina Faso(4.032)
133. Uganda(4.081)132. Ukraine(4.096)131. Ghana(4.120)130. Sudan(4.139)
129. Cambodia(4.168)128. Ivory Coast(4.180)
127. Mali(4.190)126. Congo (Kinshasa)(4.280)
125. Georgia(4.286)124. Congo (Brazzaville)(4.291)
123. Mauritania(4.292)122. India(4.315)
121. Armenia(4.376)120. Sri Lanka(4.440)
119. Ethiopia(4.460)118. Gabon(4.465)
117. Iraq(4.497)116. Zambia(4.514)
115. Senegal(4.535)114. Myanmar(4.545)
113. Mozambique(4.550)112. Kenya(4.553)
111. Namibia(4.574)110. Bangladesh(4.608)
109. Albania(4.644)108. Iran(4.692)
107. Cameroon(4.695)
0 1 2 3 4 5 6 7 8
Dystopia (happiness=1.85) Dystopia + residual Explained by: GDP per capita
Explained by: social support Explained by: healthy life expectancy Explained by: freedom to make life choices
Explained by: generosity Explained by: perceptions of corruption 95% confidence interval
26
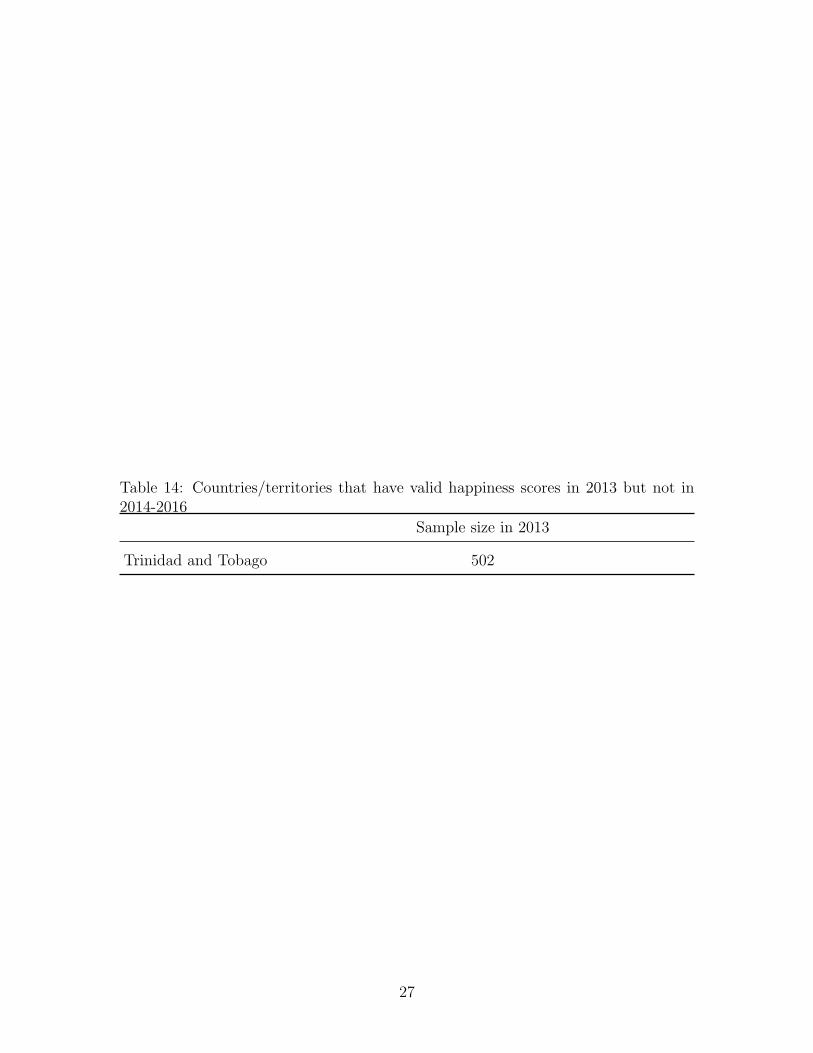
Table 14: Countries/territories that have valid happiness scores in 2013 but not in2014-2016
Sample size in 2013
Trinidad and Tobago 502
27
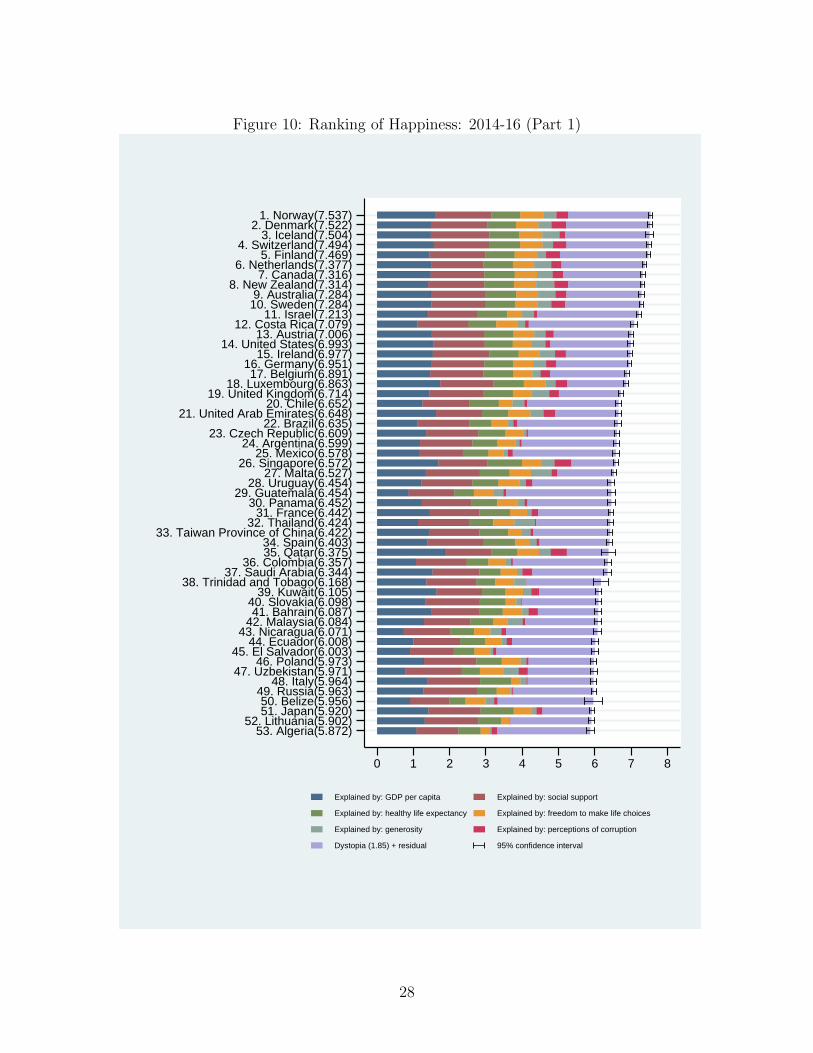
Figure 10: Ranking of Happiness: 2014-16 (Part 1)
53. Algeria(5.872)52. Lithuania(5.902)
51. Japan(5.920)50. Belize(5.956)
49. Russia(5.963)48. Italy(5.964)
47. Uzbekistan(5.971)46. Poland(5.973)
45. El Salvador(6.003)44. Ecuador(6.008)
43. Nicaragua(6.071)42. Malaysia(6.084)41. Bahrain(6.087)
40. Slovakia(6.098)39. Kuwait(6.105)
38. Trinidad and Tobago(6.168)37. Saudi Arabia(6.344)
36. Colombia(6.357)35. Qatar(6.375)34. Spain(6.403)
33. Taiwan Province of China(6.422)32. Thailand(6.424)
31. France(6.442)30. Panama(6.452)
29. Guatemala(6.454)28. Uruguay(6.454)
27. Malta(6.527)26. Singapore(6.572)
25. Mexico(6.578)24. Argentina(6.599)
23. Czech Republic(6.609)22. Brazil(6.635)
21. United Arab Emirates(6.648)20. Chile(6.652)
19. United Kingdom(6.714)18. Luxembourg(6.863)
17. Belgium(6.891)16. Germany(6.951)
15. Ireland(6.977)14. United States(6.993)
13. Austria(7.006)12. Costa Rica(7.079)
11. Israel(7.213)10. Sweden(7.284)9. Australia(7.284)
8. New Zealand(7.314)7. Canada(7.316)
6. Netherlands(7.377)5. Finland(7.469)
4. Switzerland(7.494)3. Iceland(7.504)
2. Denmark(7.522)1. Norway(7.537)
0 1 2 3 4 5 6 7 8
Explained by: GDP per capita Explained by: social support
Explained by: healthy life expectancy Explained by: freedom to make life choices
Explained by: generosity Explained by: perceptions of corruption
Dystopia (1.85) + residual 95% confidence interval
28
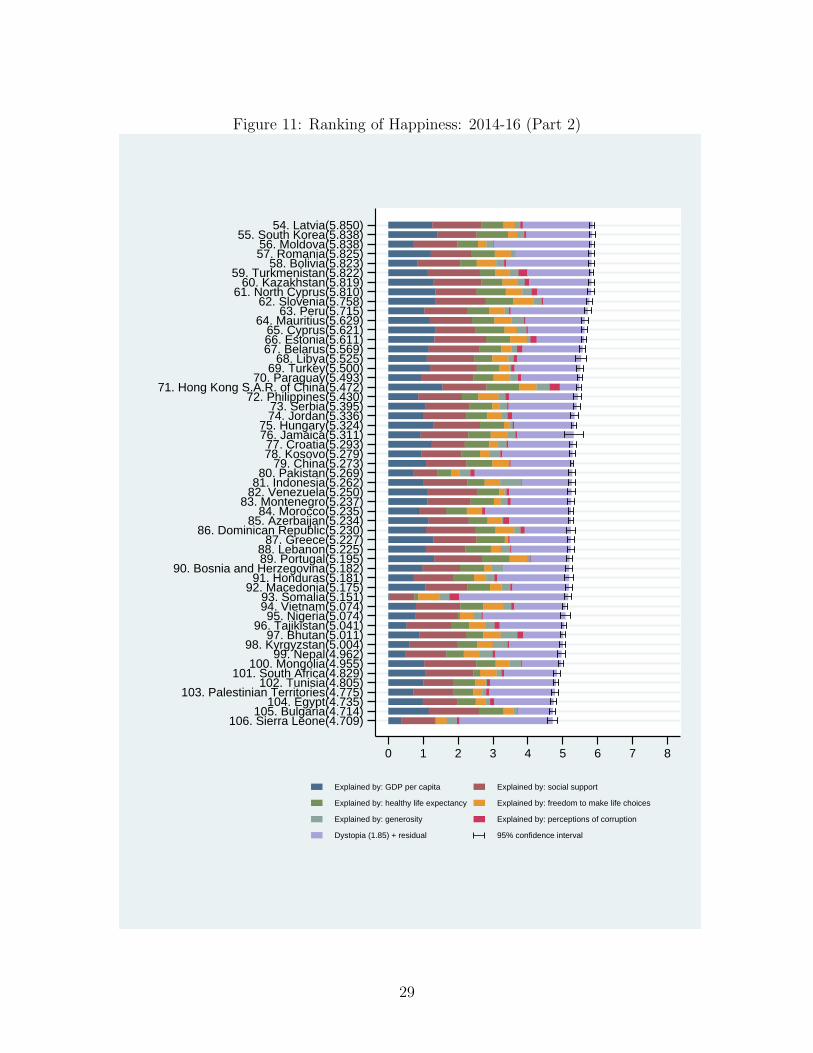
Figure 11: Ranking of Happiness: 2014-16 (Part 2)
106. Sierra Leone(4.709)105. Bulgaria(4.714)
104. Egypt(4.735)103. Palestinian Territories(4.775)
102. Tunisia(4.805)101. South Africa(4.829)
100. Mongolia(4.955)99. Nepal(4.962)
98. Kyrgyzstan(5.004)97. Bhutan(5.011)
96. Tajikistan(5.041)95. Nigeria(5.074)
94. Vietnam(5.074)93. Somalia(5.151)
92. Macedonia(5.175)91. Honduras(5.181)
90. Bosnia and Herzegovina(5.182)89. Portugal(5.195)88. Lebanon(5.225)
87. Greece(5.227)86. Dominican Republic(5.230)
85. Azerbaijan(5.234)84. Morocco(5.235)
83. Montenegro(5.237)82. Venezuela(5.250)81. Indonesia(5.262)80. Pakistan(5.269)
79. China(5.273)78. Kosovo(5.279)77. Croatia(5.293)
76. Jamaica(5.311)75. Hungary(5.324)
74. Jordan(5.336)73. Serbia(5.395)
72. Philippines(5.430)71. Hong Kong S.A.R. of China(5.472)
70. Paraguay(5.493)69. Turkey(5.500)
68. Libya(5.525)67. Belarus(5.569)66. Estonia(5.611)65. Cyprus(5.621)
64. Mauritius(5.629)63. Peru(5.715)
62. Slovenia(5.758)61. North Cyprus(5.810)
60. Kazakhstan(5.819)59. Turkmenistan(5.822)
58. Bolivia(5.823)57. Romania(5.825)56. Moldova(5.838)
55. South Korea(5.838)54. Latvia(5.850)
0 1 2 3 4 5 6 7 8
Explained by: GDP per capita Explained by: social support
Explained by: healthy life expectancy Explained by: freedom to make life choices
Explained by: generosity Explained by: perceptions of corruption
Dystopia (1.85) + residual 95% confidence interval
29
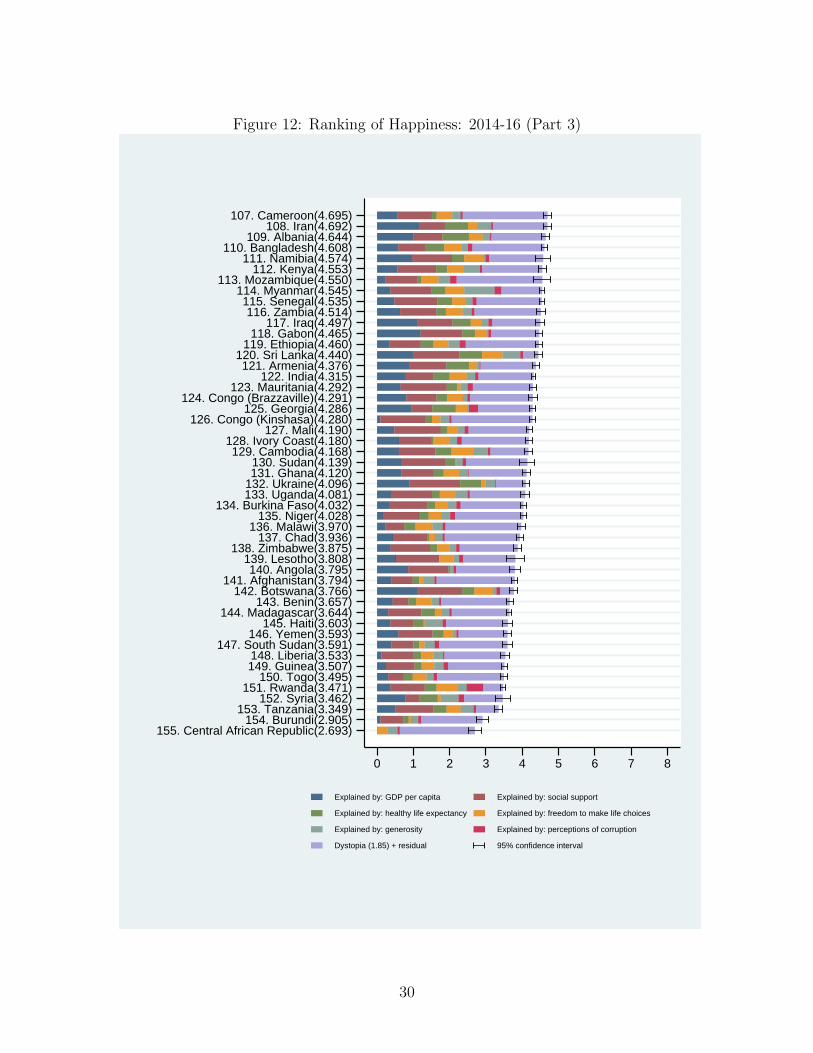
Figure 12: Ranking of Happiness: 2014-16 (Part 3)
155. Central African Republic(2.693)154. Burundi(2.905)
153. Tanzania(3.349)152. Syria(3.462)
151. Rwanda(3.471)150. Togo(3.495)
149. Guinea(3.507)148. Liberia(3.533)
147. South Sudan(3.591)146. Yemen(3.593)
145. Haiti(3.603)144. Madagascar(3.644)
143. Benin(3.657)142. Botswana(3.766)
141. Afghanistan(3.794)140. Angola(3.795)
139. Lesotho(3.808)138. Zimbabwe(3.875)
137. Chad(3.936)136. Malawi(3.970)
135. Niger(4.028)134. Burkina Faso(4.032)
133. Uganda(4.081)132. Ukraine(4.096)131. Ghana(4.120)130. Sudan(4.139)
129. Cambodia(4.168)128. Ivory Coast(4.180)
127. Mali(4.190)126. Congo (Kinshasa)(4.280)
125. Georgia(4.286)124. Congo (Brazzaville)(4.291)
123. Mauritania(4.292)122. India(4.315)
121. Armenia(4.376)120. Sri Lanka(4.440)
119. Ethiopia(4.460)118. Gabon(4.465)
117. Iraq(4.497)116. Zambia(4.514)
115. Senegal(4.535)114. Myanmar(4.545)
113. Mozambique(4.550)112. Kenya(4.553)
111. Namibia(4.574)110. Bangladesh(4.608)
109. Albania(4.644)108. Iran(4.692)
107. Cameroon(4.695)
0 1 2 3 4 5 6 7 8
Explained by: GDP per capita Explained by: social support
Explained by: healthy life expectancy Explained by: freedom to make life choices
Explained by: generosity Explained by: perceptions of corruption
Dystopia (1.85) + residual 95% confidence interval
30
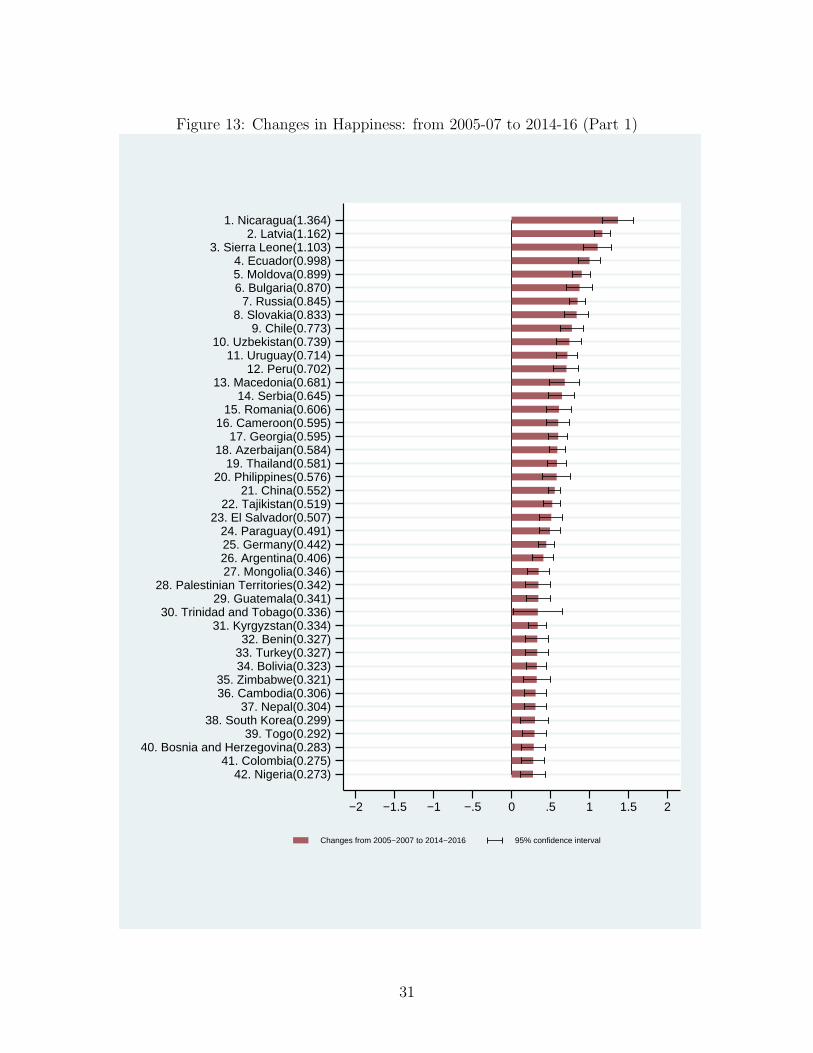
Figure 13: Changes in Happiness: from 2005-07 to 2014-16 (Part 1)
42. Nigeria(0.273)41. Colombia(0.275)
40. Bosnia and Herzegovina(0.283)39. Togo(0.292)
38. South Korea(0.299)37. Nepal(0.304)
36. Cambodia(0.306)35. Zimbabwe(0.321)
34. Bolivia(0.323)33. Turkey(0.327)32. Benin(0.327)
31. Kyrgyzstan(0.334)30. Trinidad and Tobago(0.336)
29. Guatemala(0.341)28. Palestinian Territories(0.342)
27. Mongolia(0.346)26. Argentina(0.406)25. Germany(0.442)24. Paraguay(0.491)
23. El Salvador(0.507)22. Tajikistan(0.519)
21. China(0.552)20. Philippines(0.576)
19. Thailand(0.581)18. Azerbaijan(0.584)
17. Georgia(0.595)16. Cameroon(0.595)
15. Romania(0.606)14. Serbia(0.645)
13. Macedonia(0.681)12. Peru(0.702)
11. Uruguay(0.714)10. Uzbekistan(0.739)
9. Chile(0.773)8. Slovakia(0.833)
7. Russia(0.845)6. Bulgaria(0.870)5. Moldova(0.899)4. Ecuador(0.998)
3. Sierra Leone(1.103)2. Latvia(1.162)
1. Nicaragua(1.364)
−2 −1.5 −1 −.5 0 .5 1 1.5 2
Changes from 2005−2007 to 2014−2016 95% confidence interval
31
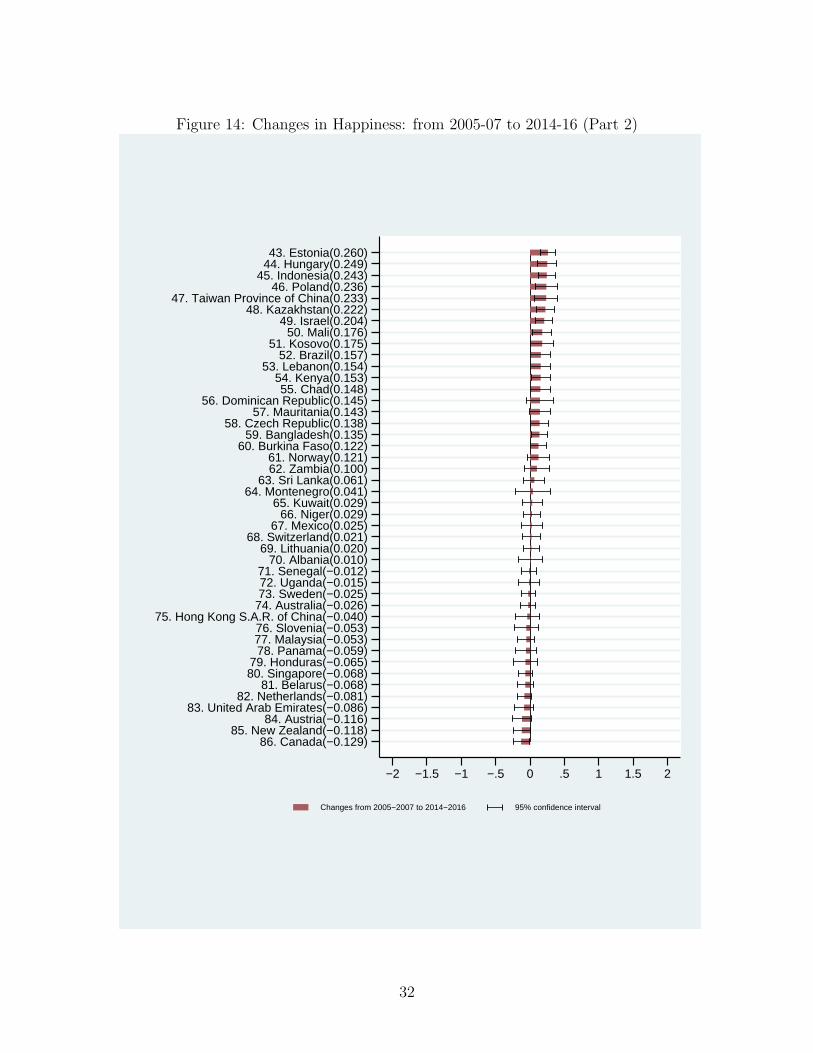
Figure 14: Changes in Happiness: from 2005-07 to 2014-16 (Part 2)
86. Canada(−0.129)85. New Zealand(−0.118)
84. Austria(−0.116)83. United Arab Emirates(−0.086)
82. Netherlands(−0.081)81. Belarus(−0.068)
80. Singapore(−0.068)79. Honduras(−0.065)
78. Panama(−0.059)77. Malaysia(−0.053)76. Slovenia(−0.053)
75. Hong Kong S.A.R. of China(−0.040)74. Australia(−0.026)73. Sweden(−0.025)72. Uganda(−0.015)71. Senegal(−0.012)
70. Albania(0.010)69. Lithuania(0.020)
68. Switzerland(0.021)67. Mexico(0.025)
66. Niger(0.029)65. Kuwait(0.029)
64. Montenegro(0.041)63. Sri Lanka(0.061)
62. Zambia(0.100)61. Norway(0.121)
60. Burkina Faso(0.122)59. Bangladesh(0.135)
58. Czech Republic(0.138)57. Mauritania(0.143)
56. Dominican Republic(0.145)55. Chad(0.148)
54. Kenya(0.153)53. Lebanon(0.154)
52. Brazil(0.157)51. Kosovo(0.175)
50. Mali(0.176)49. Israel(0.204)
48. Kazakhstan(0.222)47. Taiwan Province of China(0.233)
46. Poland(0.236)45. Indonesia(0.243)
44. Hungary(0.249)43. Estonia(0.260)
−2 −1.5 −1 −.5 0 .5 1 1.5 2
Changes from 2005−2007 to 2014−2016 95% confidence interval
32
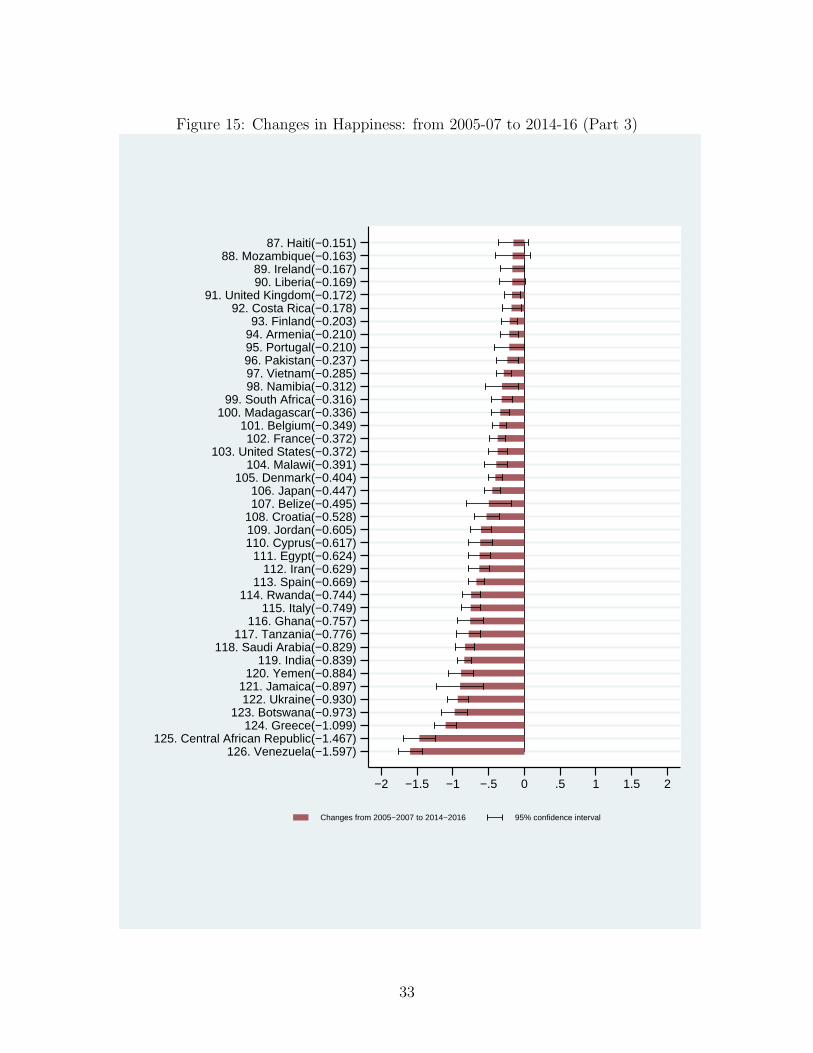
Figure 15: Changes in Happiness: from 2005-07 to 2014-16 (Part 3)
126. Venezuela(−1.597)125. Central African Republic(−1.467)
124. Greece(−1.099)123. Botswana(−0.973)
122. Ukraine(−0.930)121. Jamaica(−0.897)120. Yemen(−0.884)
119. India(−0.839)118. Saudi Arabia(−0.829)
117. Tanzania(−0.776)116. Ghana(−0.757)
115. Italy(−0.749)114. Rwanda(−0.744)
113. Spain(−0.669)112. Iran(−0.629)
111. Egypt(−0.624)110. Cyprus(−0.617)109. Jordan(−0.605)108. Croatia(−0.528)107. Belize(−0.495)106. Japan(−0.447)
105. Denmark(−0.404)104. Malawi(−0.391)
103. United States(−0.372)102. France(−0.372)
101. Belgium(−0.349)100. Madagascar(−0.336)
99. South Africa(−0.316)98. Namibia(−0.312)97. Vietnam(−0.285)96. Pakistan(−0.237)95. Portugal(−0.210)94. Armenia(−0.210)93. Finland(−0.203)
92. Costa Rica(−0.178)91. United Kingdom(−0.172)
90. Liberia(−0.169)89. Ireland(−0.167)
88. Mozambique(−0.163)87. Haiti(−0.151)
−2 −1.5 −1 −.5 0 .5 1 1.5 2
Changes from 2005−2007 to 2014−2016 95% confidence interval
33
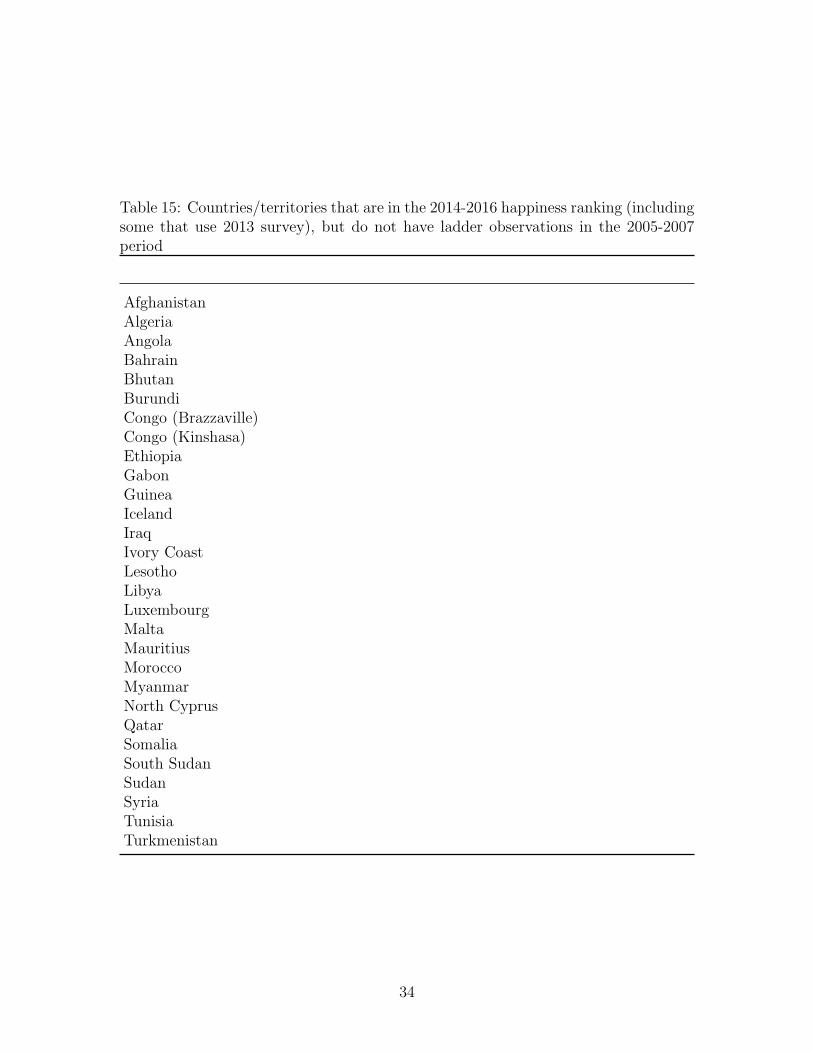
Table 15: Countries/territories that are in the 2014-2016 happiness ranking (includingsome that use 2013 survey), but do not have ladder observations in the 2005-2007period
AfghanistanAlgeriaAngolaBahrainBhutanBurundiCongo (Brazzaville)Congo (Kinshasa)EthiopiaGabonGuineaIcelandIraqIvory CoastLesothoLibyaLuxembourgMaltaMauritiusMoroccoMyanmarNorth CyprusQatarSomaliaSouth SudanSudanSyriaTunisiaTurkmenistan
34
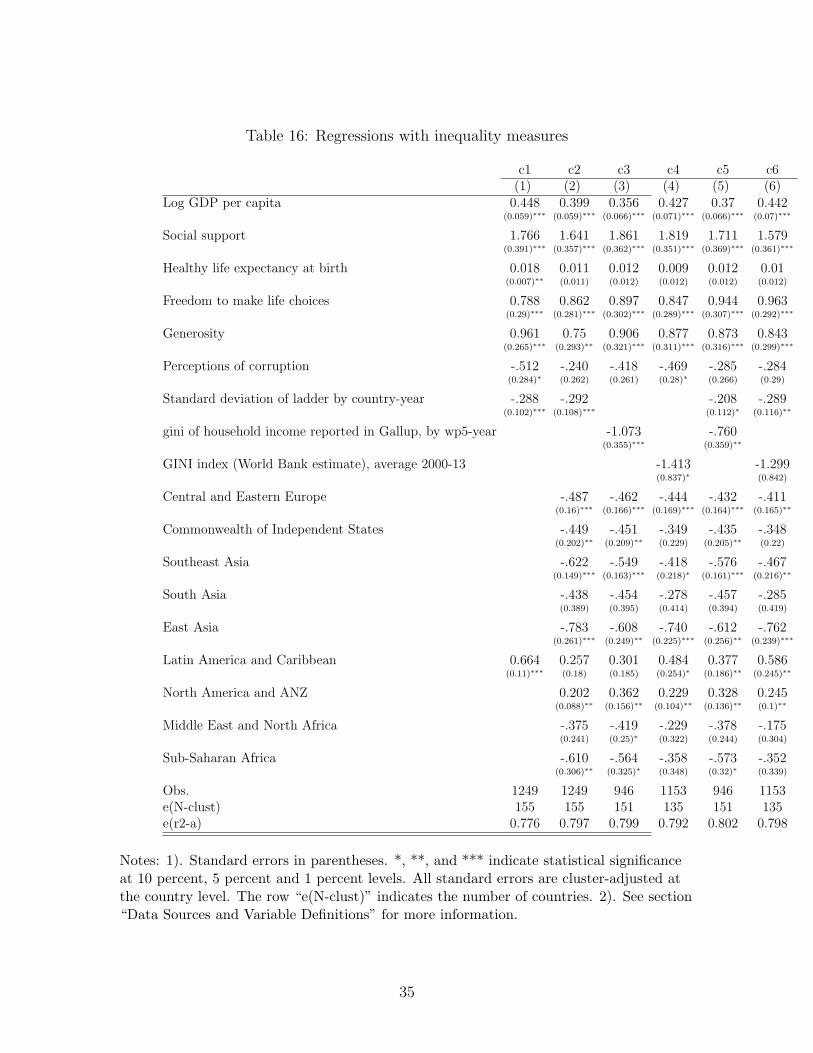
Table 16: Regressions with inequality measures
c1 c2 c3 c4 c5 c6(1) (2) (3) (4) (5) (6)
Log GDP per capita 0.448 0.399 0.356 0.427 0.37 0.442(0.059)∗∗∗ (0.059)∗∗∗ (0.066)∗∗∗ (0.071)∗∗∗ (0.066)∗∗∗ (0.07)∗∗∗
Social support 1.766 1.641 1.861 1.819 1.711 1.579(0.391)∗∗∗ (0.357)∗∗∗ (0.362)∗∗∗ (0.351)∗∗∗ (0.369)∗∗∗ (0.361)∗∗∗
Healthy life expectancy at birth 0.018 0.011 0.012 0.009 0.012 0.01(0.007)∗∗ (0.011) (0.012) (0.012) (0.012) (0.012)
Freedom to make life choices 0.788 0.862 0.897 0.847 0.944 0.963(0.29)∗∗∗ (0.281)∗∗∗ (0.302)∗∗∗ (0.289)∗∗∗ (0.307)∗∗∗ (0.292)∗∗∗
Generosity 0.961 0.75 0.906 0.877 0.873 0.843(0.265)∗∗∗ (0.293)∗∗ (0.321)∗∗∗ (0.311)∗∗∗ (0.316)∗∗∗ (0.299)∗∗∗
Perceptions of corruption -.512 -.240 -.418 -.469 -.285 -.284(0.284)∗ (0.262) (0.261) (0.28)∗ (0.266) (0.29)
Standard deviation of ladder by country-year -.288 -.292 -.208 -.289(0.102)∗∗∗ (0.108)∗∗∗ (0.112)∗ (0.116)∗∗
gini of household income reported in Gallup, by wp5-year -1.073 -.760(0.355)∗∗∗ (0.359)∗∗
GINI index (World Bank estimate), average 2000-13 -1.413 -1.299(0.837)∗ (0.842)
Central and Eastern Europe -.487 -.462 -.444 -.432 -.411(0.16)∗∗∗ (0.166)∗∗∗ (0.169)∗∗∗ (0.164)∗∗∗ (0.165)∗∗
Commonwealth of Independent States -.449 -.451 -.349 -.435 -.348(0.202)∗∗ (0.209)∗∗ (0.229) (0.205)∗∗ (0.22)
Southeast Asia -.622 -.549 -.418 -.576 -.467(0.149)∗∗∗ (0.163)∗∗∗ (0.218)∗ (0.161)∗∗∗ (0.216)∗∗
South Asia -.438 -.454 -.278 -.457 -.285(0.389) (0.395) (0.414) (0.394) (0.419)
East Asia -.783 -.608 -.740 -.612 -.762(0.261)∗∗∗ (0.249)∗∗ (0.225)∗∗∗ (0.256)∗∗ (0.239)∗∗∗
Latin America and Caribbean 0.664 0.257 0.301 0.484 0.377 0.586(0.11)∗∗∗ (0.18) (0.185) (0.254)∗ (0.186)∗∗ (0.245)∗∗
North America and ANZ 0.202 0.362 0.229 0.328 0.245(0.088)∗∗ (0.156)∗∗ (0.104)∗∗ (0.136)∗∗ (0.1)∗∗
Middle East and North Africa -.375 -.419 -.229 -.378 -.175(0.241) (0.25)∗ (0.322) (0.244) (0.304)
Sub-Saharan Africa -.610 -.564 -.358 -.573 -.352(0.306)∗∗ (0.325)∗ (0.348) (0.32)∗ (0.339)
Obs. 1249 1249 946 1153 946 1153e(N-clust) 155 155 151 135 151 135e(r2-a) 0.776 0.797 0.799 0.792 0.802 0.798
Notes: 1). Standard errors in parentheses. *, **, and *** indicate statistical significanceat 10 percent, 5 percent and 1 percent levels. All standard errors are cluster-adjusted atthe country level. The row “e(N-clust)” indicates the number of countries. 2). See section“Data Sources and Variable Definitions” for more information.
35
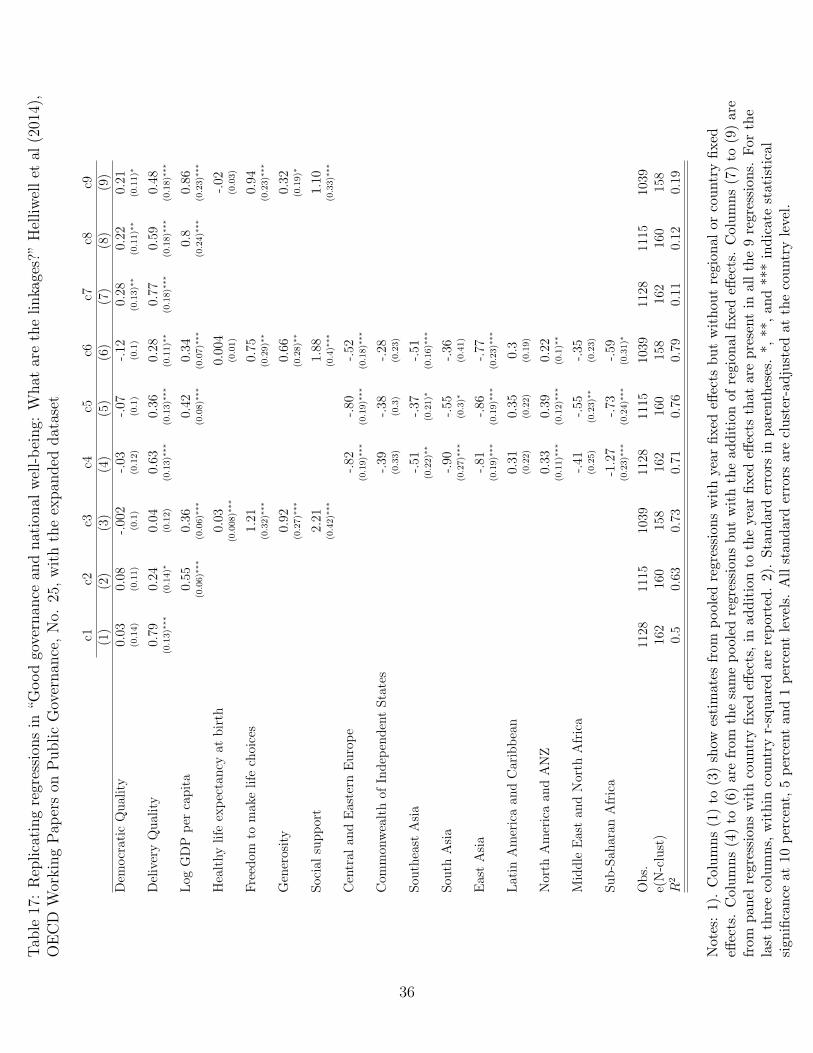
Tab
le17:Replicatingregression
sin
“Goodgovernan
cean
dnational
well-being:
What
arethelinkages?”Helliwellet
al(2014),
OECD
WorkingPap
erson
PublicGovernan
ce,No.
25,withtheexpan
ded
dataset
c1c2
c3c4
c5c6
c7c8
c9(1)
(2)
(3)
(4)
(5)
(6)
(7)
(8)
(9)
Dem
ocratic
Quality
0.03
0.08
-.002
-.03
-.07
-.12
0.28
0.22
0.21
(0.14)
(0.11)
(0.1)
(0.12)
(0.1)
(0.1)
(0.13)∗
∗(0.11)∗
∗(0.11)∗
DeliveryQuality
0.79
0.24
0.04
0.63
0.36
0.28
0.77
0.59
0.48
(0.13)∗
∗∗(0.14)∗
(0.12)
(0.13)∗
∗∗(0.13)∗
∗∗(0.11)∗
∗(0.18)∗
∗∗(0.18)∗
∗∗(0.18)∗
∗∗
Log
GDPper
capita
0.55
0.36
0.42
0.34
0.8
0.86
(0.06)∗
∗∗(0.06)∗
∗∗(0.08)∗
∗∗(0.07)∗
∗∗(0.24)∗
∗∗(0.23)∗
∗∗
Healthylife
expectancy
atbirth
0.03
0.004
-.02
(0.008)∗
∗∗(0.01)
(0.03)
Freedom
tomakelife
choices
1.21
0.75
0.94
(0.32)∗
∗∗(0.29)∗
∗(0.23)∗
∗∗
Generosity
0.92
0.66
0.32
(0.27)∗
∗∗(0.28)∗
∗(0.19)∗
Social
support
2.21
1.88
1.10
(0.42)∗
∗∗(0.4)∗
∗∗(0.33)∗
∗∗
Central
andEastern
Europe
-.82
-.80
-.52
(0.19)∗
∗∗(0.19)∗
∗∗(0.18)∗
∗∗
Com
mon
wealthof
Indep
endentStates
-.39
-.38
-.28
(0.33)
(0.3)
(0.23)
Sou
theast
Asia
-.51
-.37
-.51
(0.22)∗
∗(0.21)∗
(0.16)∗
∗∗
Sou
thAsia
-.90
-.55
-.36
(0.27)∗
∗∗(0.3)∗
(0.41)
EastAsia
-.81
-.86
-.77
(0.19)∗
∗∗(0.19)∗
∗∗(0.23)∗
∗∗
Latin
Americaan
dCaribbean
0.31
0.35
0.3
(0.22)
(0.22)
(0.19)
North
Americaan
dANZ
0.33
0.39
0.22
(0.11)∗
∗∗(0.12)∗
∗∗(0.1)∗
∗
Middle
Eastan
dNorth
Africa
-.41
-.55
-.35
(0.25)
(0.23)∗
∗(0.23)
Sub-Sah
aran
Africa
-1.27
-.73
-.59
(0.23)∗
∗∗(0.24)∗
∗∗(0.31)∗
Obs.
1128
1115
1039
1128
1115
1039
1128
1115
1039
e(N-clust)
162
160
158
162
160
158
162
160
158
R2
0.5
0.63
0.73
0.71
0.76
0.79
0.11
0.12
0.19
Notes:1).Columns(1)to
(3)show
estimates
from
pooled
regressionswithyearfixed
effects
butwithoutregionalorcountryfixed
effects.Columns(4)to
(6)arefrom
thesamepooled
regression
sbutwiththead
ditionofregionalfixed
effects.Columns(7)to
(9)are
from
panel
regression
swithcountryfixed
effects,in
additionto
theyearfixed
effects
that
arepresentin
allthe9regressions.
Forthe
last
threecolumns,
within
countryr-squared
arereported.2).Standarderrors
inparentheses.*,**,and***indicate
statistical
sign
ificance
at10
percent,5percentan
d1percentlevels.
Allstan
darderrors
arecluster-adjusted
atthecountrylevel.
36
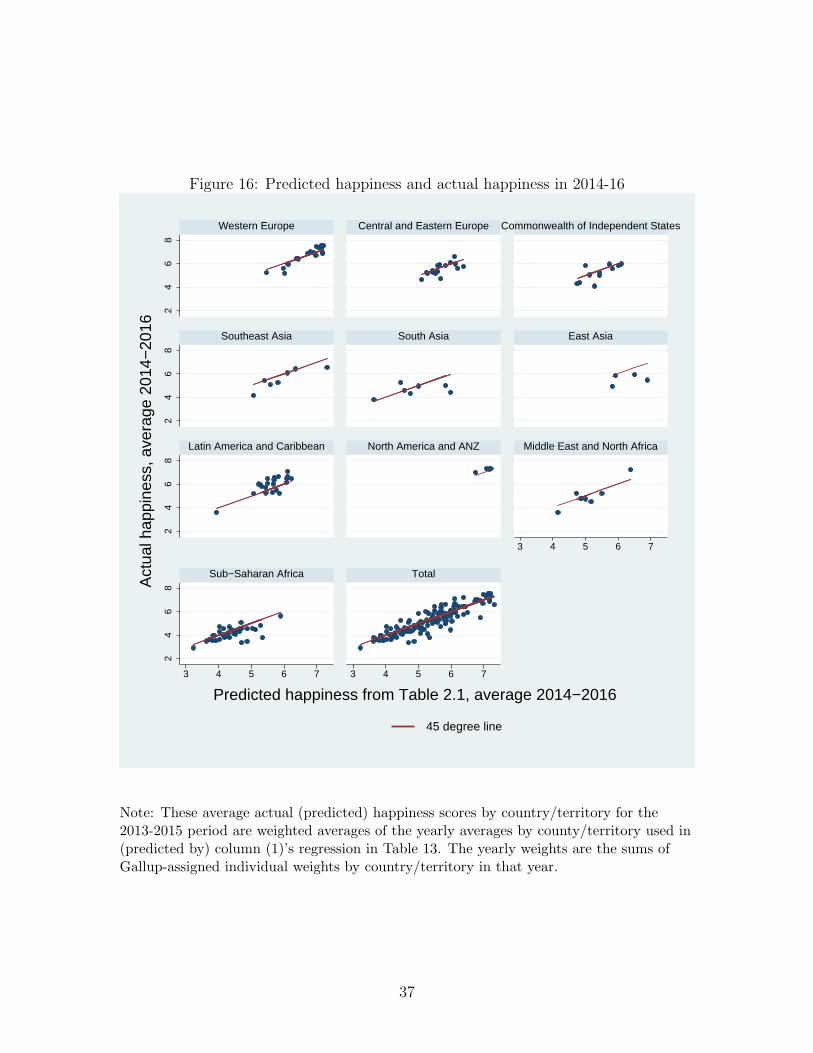
Figure 16: Predicted happiness and actual happiness in 2014-162
46
82
46
82
46
82
46
8
3 4 5 6 7
3 4 5 6 7 3 4 5 6 7
Western Europe Central and Eastern Europe Commonwealth of Independent States
Southeast Asia South Asia East Asia
Latin America and Caribbean North America and ANZ Middle East and North Africa
Sub−Saharan Africa Total
45 degree line
Act
ual h
appi
ness
, ave
rage
201
4−20
16
Predicted happiness from Table 2.1, average 2014−2016
Note: These average actual (predicted) happiness scores by country/territory for the2013-2015 period are weighted averages of the yearly averages by county/territory used in(predicted by) column (1)’s regression in Table 13. The yearly weights are the sums ofGallup-assigned individual weights by country/territory in that year.
37
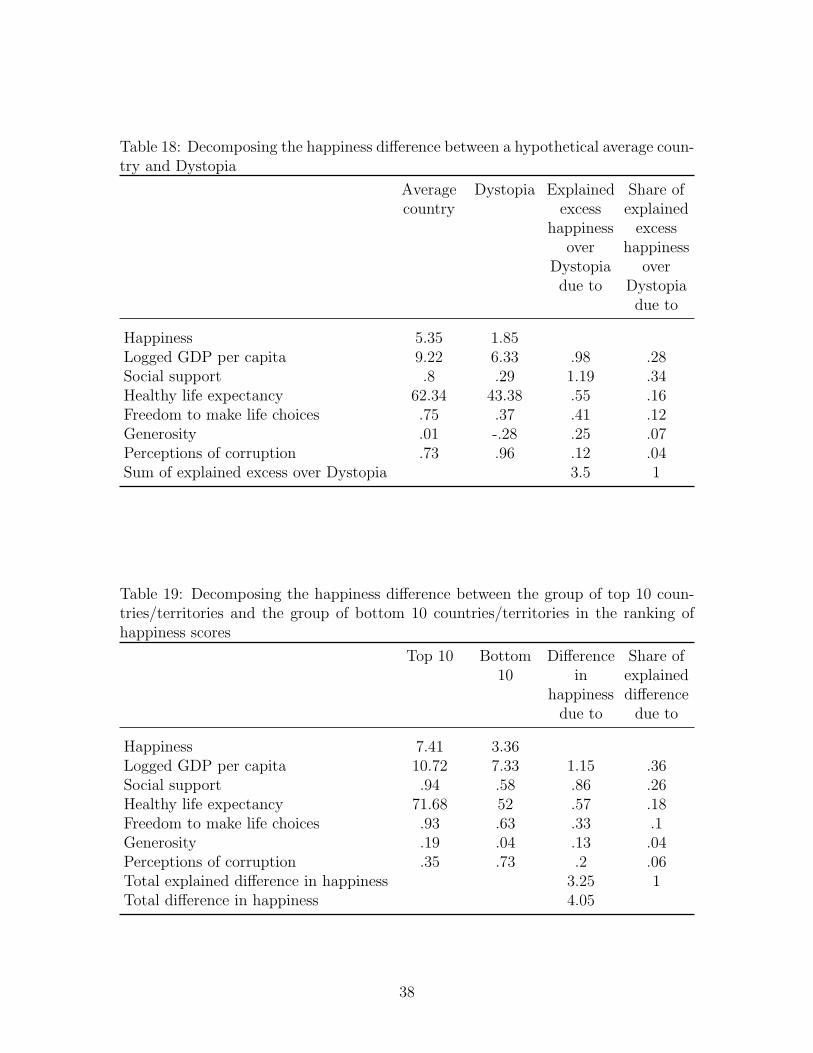
Table 18: Decomposing the happiness difference between a hypothetical average coun-try and Dystopia
Averagecountry
Dystopia Explainedexcess
happinessover
Dystopiadue to
Share ofexplainedexcess
happinessover
Dystopiadue to
Happiness 5.35 1.85Logged GDP per capita 9.22 6.33 .98 .28Social support .8 .29 1.19 .34Healthy life expectancy 62.34 43.38 .55 .16Freedom to make life choices .75 .37 .41 .12Generosity .01 -.28 .25 .07Perceptions of corruption .73 .96 .12 .04Sum of explained excess over Dystopia 3.5 1
Table 19: Decomposing the happiness difference between the group of top 10 coun-tries/territories and the group of bottom 10 countries/territories in the ranking ofhappiness scores
Top 10 Bottom10
Differencein
happinessdue to
Share ofexplaineddifferencedue to
Happiness 7.41 3.36Logged GDP per capita 10.72 7.33 1.15 .36Social support .94 .58 .86 .26Healthy life expectancy 71.68 52 .57 .18Freedom to make life choices .93 .63 .33 .1Generosity .19 .04 .13 .04Perceptions of corruption .35 .73 .2 .06Total explained difference in happiness 3.25 1Total difference in happiness 4.05
38
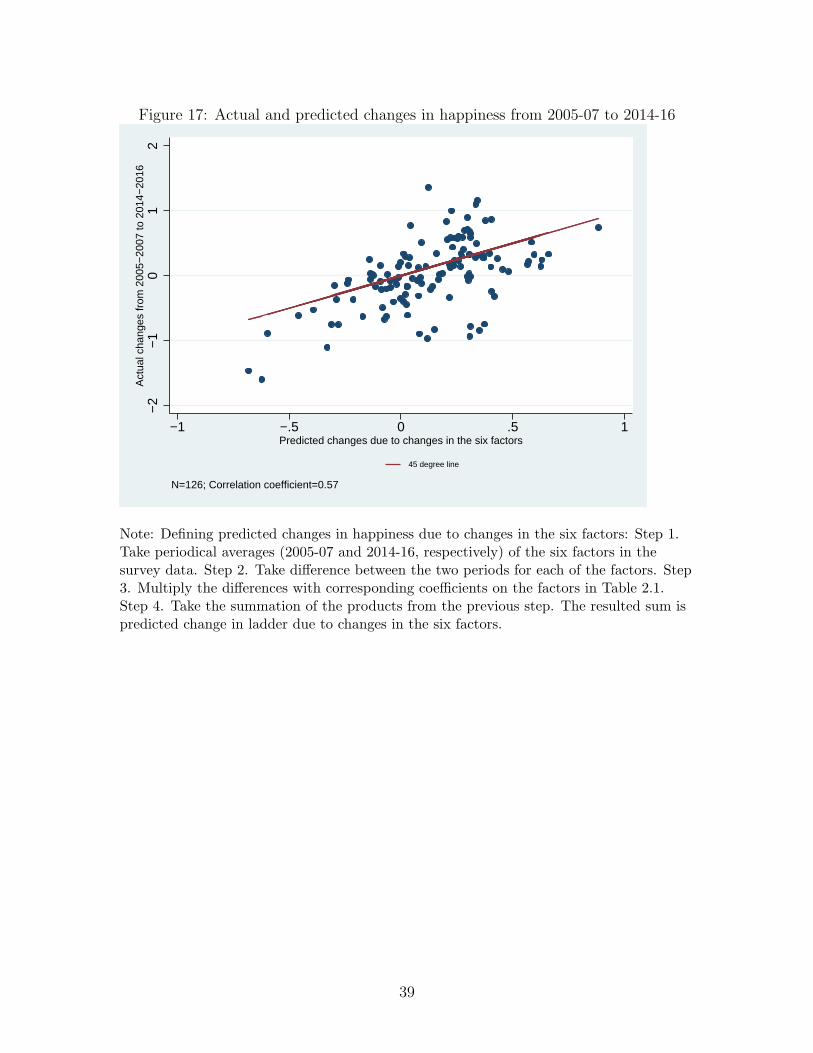
Figure 17: Actual and predicted changes in happiness from 2005-07 to 2014-16
−2
−1
01
2A
ctua
l cha
nges
from
200
5−20
07 to
201
4−20
16
−1 −.5 0 .5 1Predicted changes due to changes in the six factors
45 degree line
N=126; Correlation coefficient=0.57
Note: Defining predicted changes in happiness due to changes in the six factors: Step 1.Take periodical averages (2005-07 and 2014-16, respectively) of the six factors in thesurvey data. Step 2. Take difference between the two periods for each of the factors. Step3. Multiply the differences with corresponding coefficients on the factors in Table 2.1.Step 4. Take the summation of the products from the previous step. The resulted sum ispredicted change in ladder due to changes in the six factors.
39
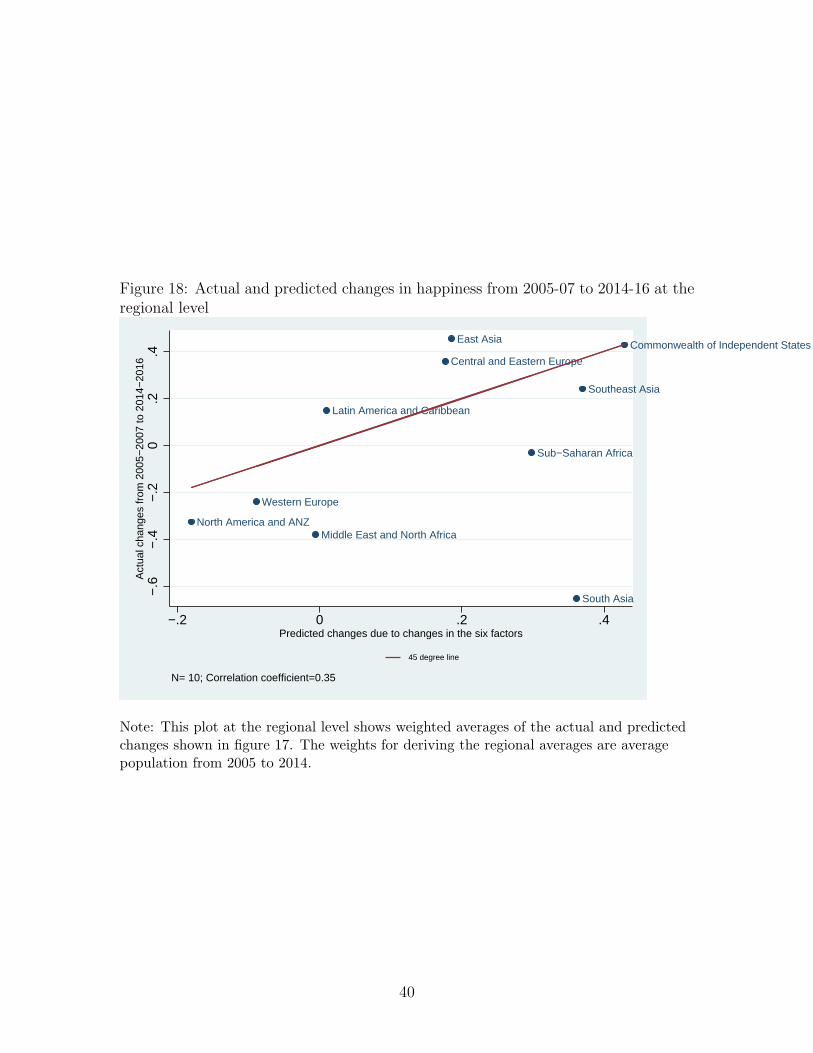
Figure 18: Actual and predicted changes in happiness from 2005-07 to 2014-16 at theregional level
Western Europe
Central and Eastern Europe
Commonwealth of Independent States
Southeast Asia
South Asia
East Asia
Latin America and Caribbean
North America and ANZMiddle East and North Africa
Sub−Saharan Africa
−.6
−.4
−.2
0.2
.4A
ctua
l cha
nges
from
200
5−20
07 to
201
4−20
16
−.2 0 .2 .4Predicted changes due to changes in the six factors
45 degree line
N= 10; Correlation coefficient=0.35
Note: This plot at the regional level shows weighted averages of the actual and predictedchanges shown in figure 17. The weights for deriving the regional averages are averagepopulation from 2005 to 2014.
40
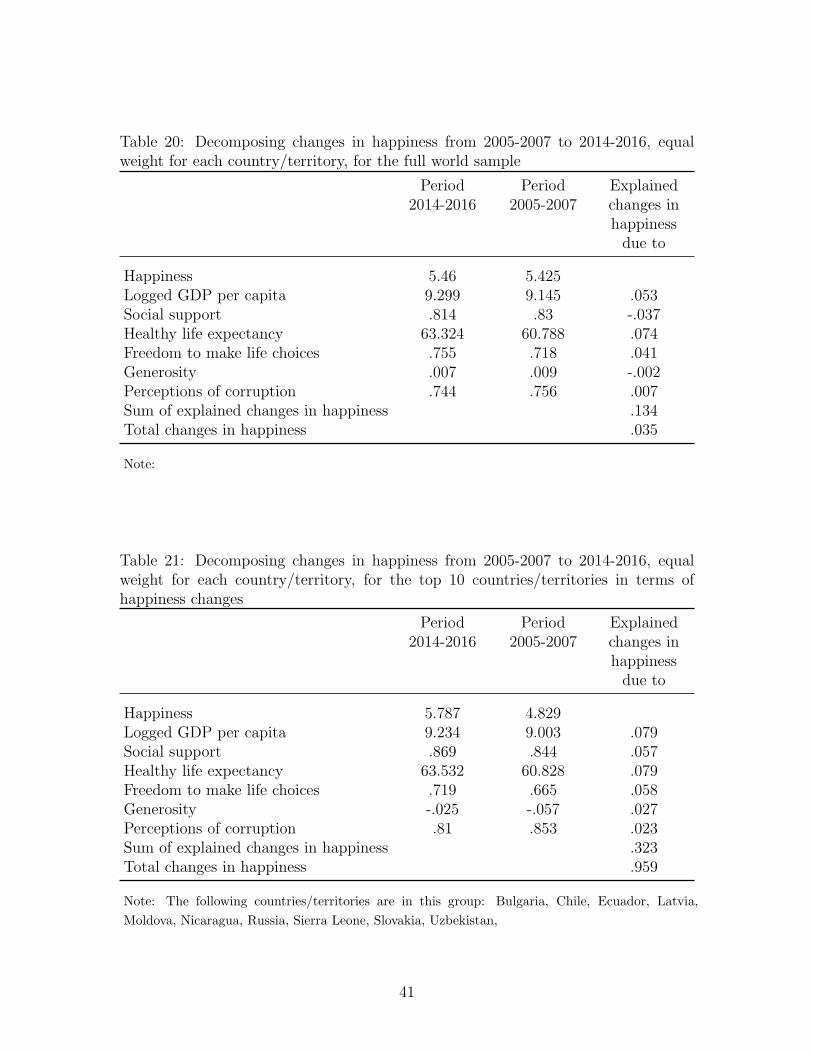
Table 20: Decomposing changes in happiness from 2005-2007 to 2014-2016, equalweight for each country/territory, for the full world sample
Period2014-2016
Period2005-2007
Explainedchanges inhappinessdue to
Happiness 5.46 5.425Logged GDP per capita 9.299 9.145 .053Social support .814 .83 -.037Healthy life expectancy 63.324 60.788 .074Freedom to make life choices .755 .718 .041Generosity .007 .009 -.002Perceptions of corruption .744 .756 .007Sum of explained changes in happiness .134Total changes in happiness .035
Note:
Table 21: Decomposing changes in happiness from 2005-2007 to 2014-2016, equalweight for each country/territory, for the top 10 countries/territories in terms ofhappiness changes
Period2014-2016
Period2005-2007
Explainedchanges inhappinessdue to
Happiness 5.787 4.829Logged GDP per capita 9.234 9.003 .079Social support .869 .844 .057Healthy life expectancy 63.532 60.828 .079Freedom to make life choices .719 .665 .058Generosity -.025 -.057 .027Perceptions of corruption .81 .853 .023Sum of explained changes in happiness .323Total changes in happiness .959
Note: The following countries/territories are in this group: Bulgaria, Chile, Ecuador, Latvia,
Moldova, Nicaragua, Russia, Sierra Leone, Slovakia, Uzbekistan,
41
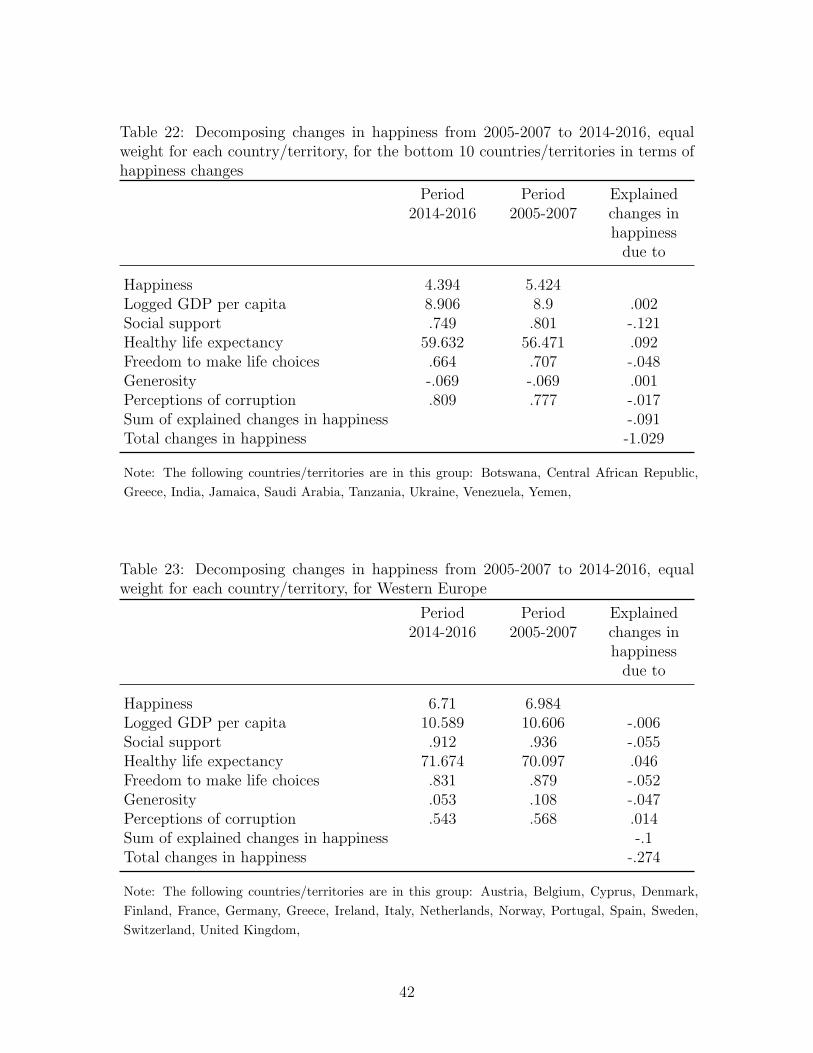
Table 22: Decomposing changes in happiness from 2005-2007 to 2014-2016, equalweight for each country/territory, for the bottom 10 countries/territories in terms ofhappiness changes
Period2014-2016
Period2005-2007
Explainedchanges inhappinessdue to
Happiness 4.394 5.424Logged GDP per capita 8.906 8.9 .002Social support .749 .801 -.121Healthy life expectancy 59.632 56.471 .092Freedom to make life choices .664 .707 -.048Generosity -.069 -.069 .001Perceptions of corruption .809 .777 -.017Sum of explained changes in happiness -.091Total changes in happiness -1.029
Note: The following countries/territories are in this group: Botswana, Central African Republic,
Greece, India, Jamaica, Saudi Arabia, Tanzania, Ukraine, Venezuela, Yemen,
Table 23: Decomposing changes in happiness from 2005-2007 to 2014-2016, equalweight for each country/territory, for Western Europe
Period2014-2016
Period2005-2007
Explainedchanges inhappinessdue to
Happiness 6.71 6.984Logged GDP per capita 10.589 10.606 -.006Social support .912 .936 -.055Healthy life expectancy 71.674 70.097 .046Freedom to make life choices .831 .879 -.052Generosity .053 .108 -.047Perceptions of corruption .543 .568 .014Sum of explained changes in happiness -.1Total changes in happiness -.274
Note: The following countries/territories are in this group: Austria, Belgium, Cyprus, Denmark,
Finland, France, Germany, Greece, Ireland, Italy, Netherlands, Norway, Portugal, Spain, Sweden,
Switzerland, United Kingdom,
42
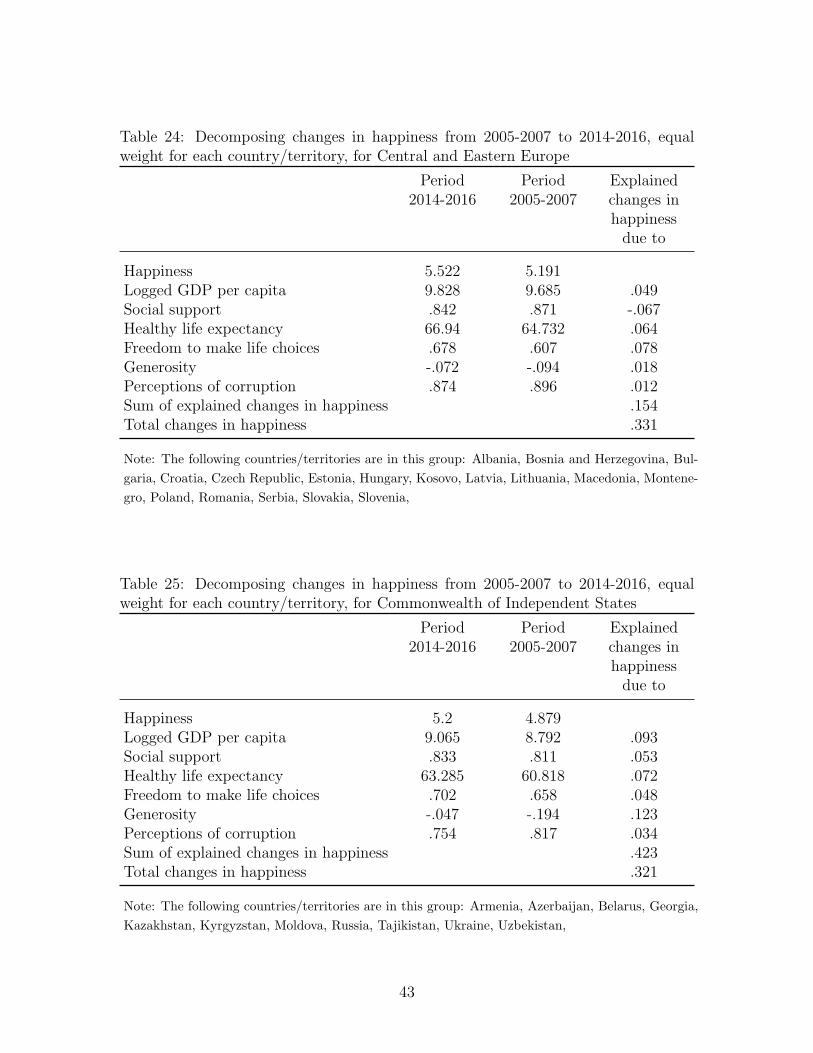
Table 24: Decomposing changes in happiness from 2005-2007 to 2014-2016, equalweight for each country/territory, for Central and Eastern Europe
Period2014-2016
Period2005-2007
Explainedchanges inhappinessdue to
Happiness 5.522 5.191Logged GDP per capita 9.828 9.685 .049Social support .842 .871 -.067Healthy life expectancy 66.94 64.732 .064Freedom to make life choices .678 .607 .078Generosity -.072 -.094 .018Perceptions of corruption .874 .896 .012Sum of explained changes in happiness .154Total changes in happiness .331
Note: The following countries/territories are in this group: Albania, Bosnia and Herzegovina, Bul-
garia, Croatia, Czech Republic, Estonia, Hungary, Kosovo, Latvia, Lithuania, Macedonia, Montene-
gro, Poland, Romania, Serbia, Slovakia, Slovenia,
Table 25: Decomposing changes in happiness from 2005-2007 to 2014-2016, equalweight for each country/territory, for Commonwealth of Independent States
Period2014-2016
Period2005-2007
Explainedchanges inhappinessdue to
Happiness 5.2 4.879Logged GDP per capita 9.065 8.792 .093Social support .833 .811 .053Healthy life expectancy 63.285 60.818 .072Freedom to make life choices .702 .658 .048Generosity -.047 -.194 .123Perceptions of corruption .754 .817 .034Sum of explained changes in happiness .423Total changes in happiness .321
Note: The following countries/territories are in this group: Armenia, Azerbaijan, Belarus, Georgia,
Kazakhstan, Kyrgyzstan, Moldova, Russia, Tajikistan, Ukraine, Uzbekistan,
43
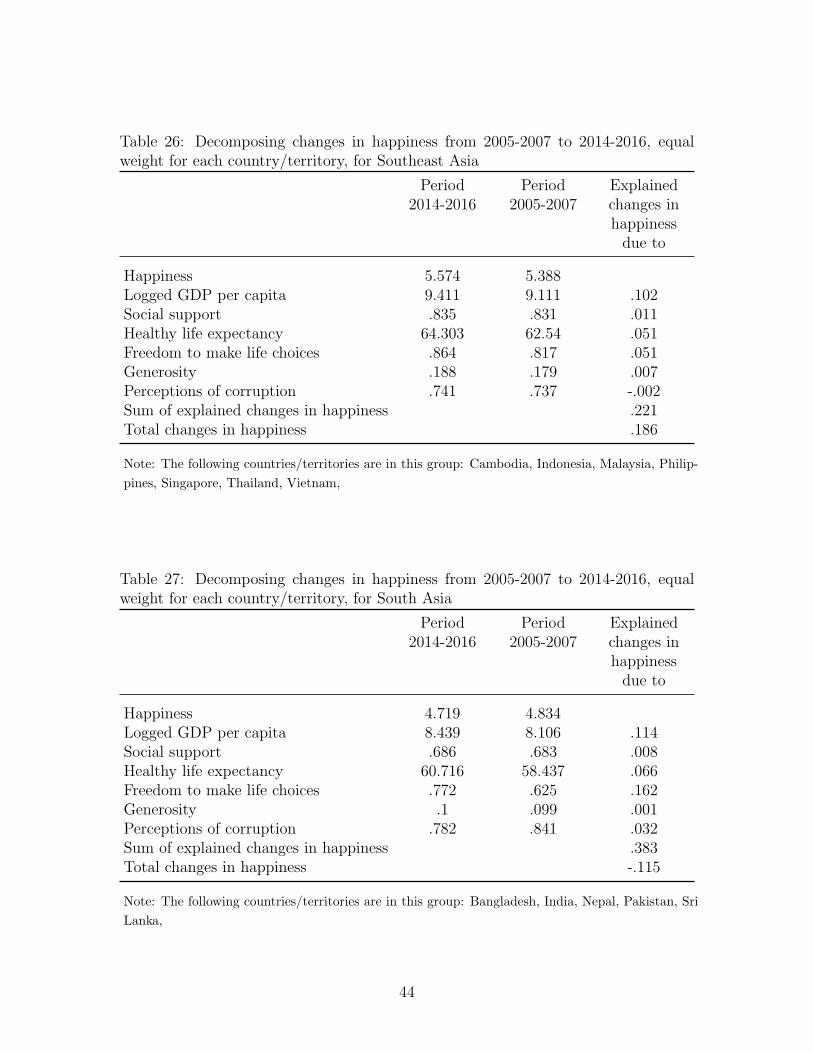
Table 26: Decomposing changes in happiness from 2005-2007 to 2014-2016, equalweight for each country/territory, for Southeast Asia
Period2014-2016
Period2005-2007
Explainedchanges inhappinessdue to
Happiness 5.574 5.388Logged GDP per capita 9.411 9.111 .102Social support .835 .831 .011Healthy life expectancy 64.303 62.54 .051Freedom to make life choices .864 .817 .051Generosity .188 .179 .007Perceptions of corruption .741 .737 -.002Sum of explained changes in happiness .221Total changes in happiness .186
Note: The following countries/territories are in this group: Cambodia, Indonesia, Malaysia, Philip-
pines, Singapore, Thailand, Vietnam,
Table 27: Decomposing changes in happiness from 2005-2007 to 2014-2016, equalweight for each country/territory, for South Asia
Period2014-2016
Period2005-2007
Explainedchanges inhappinessdue to
Happiness 4.719 4.834Logged GDP per capita 8.439 8.106 .114Social support .686 .683 .008Healthy life expectancy 60.716 58.437 .066Freedom to make life choices .772 .625 .162Generosity .1 .099 .001Perceptions of corruption .782 .841 .032Sum of explained changes in happiness .383Total changes in happiness -.115
Note: The following countries/territories are in this group: Bangladesh, India, Nepal, Pakistan, Sri
Lanka,
44
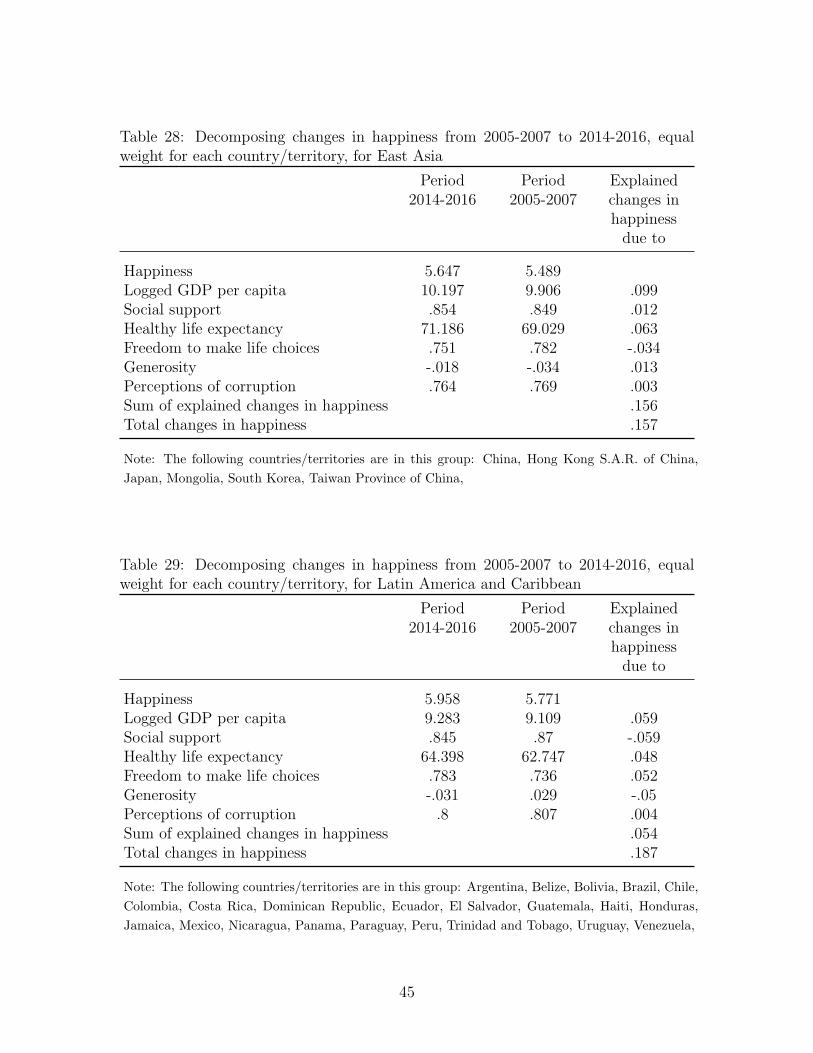
Table 28: Decomposing changes in happiness from 2005-2007 to 2014-2016, equalweight for each country/territory, for East Asia
Period2014-2016
Period2005-2007
Explainedchanges inhappinessdue to
Happiness 5.647 5.489Logged GDP per capita 10.197 9.906 .099Social support .854 .849 .012Healthy life expectancy 71.186 69.029 .063Freedom to make life choices .751 .782 -.034Generosity -.018 -.034 .013Perceptions of corruption .764 .769 .003Sum of explained changes in happiness .156Total changes in happiness .157
Note: The following countries/territories are in this group: China, Hong Kong S.A.R. of China,
Japan, Mongolia, South Korea, Taiwan Province of China,
Table 29: Decomposing changes in happiness from 2005-2007 to 2014-2016, equalweight for each country/territory, for Latin America and Caribbean
Period2014-2016
Period2005-2007
Explainedchanges inhappinessdue to
Happiness 5.958 5.771Logged GDP per capita 9.283 9.109 .059Social support .845 .87 -.059Healthy life expectancy 64.398 62.747 .048Freedom to make life choices .783 .736 .052Generosity -.031 .029 -.05Perceptions of corruption .8 .807 .004Sum of explained changes in happiness .054Total changes in happiness .187
Note: The following countries/territories are in this group: Argentina, Belize, Bolivia, Brazil, Chile,
Colombia, Costa Rica, Dominican Republic, Ecuador, El Salvador, Guatemala, Haiti, Honduras,
Jamaica, Mexico, Nicaragua, Panama, Paraguay, Peru, Trinidad and Tobago, Uruguay, Venezuela,
45
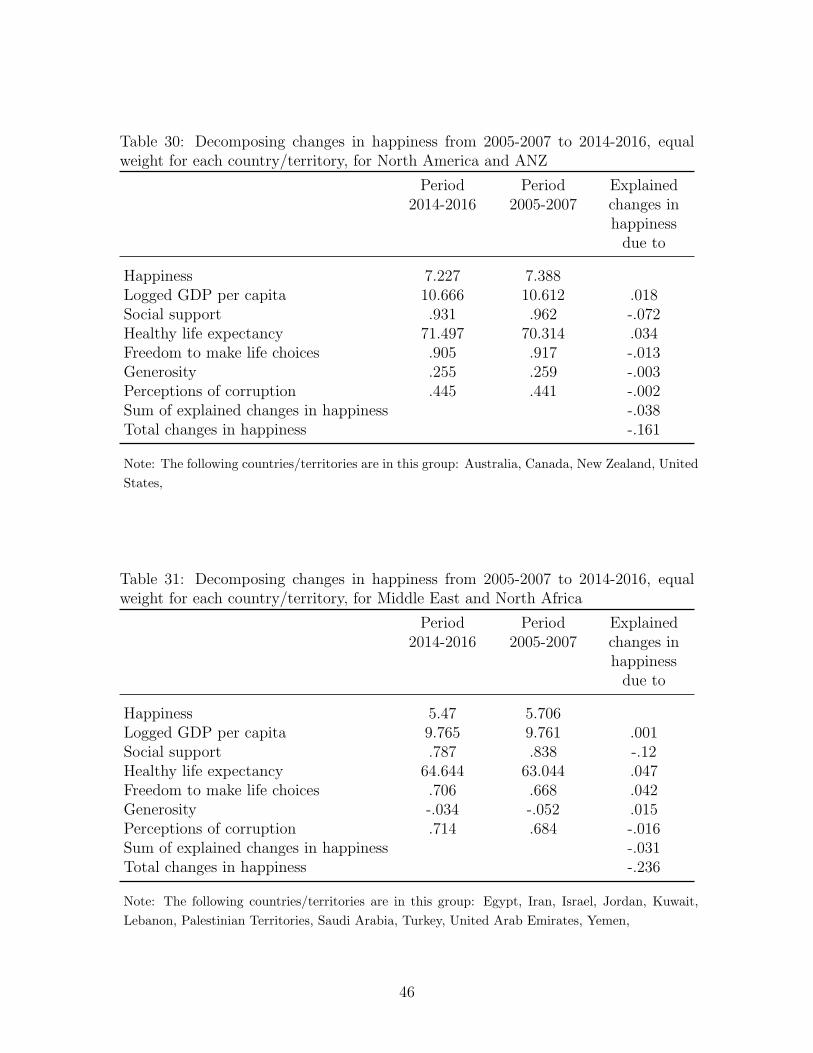
Table 30: Decomposing changes in happiness from 2005-2007 to 2014-2016, equalweight for each country/territory, for North America and ANZ
Period2014-2016
Period2005-2007
Explainedchanges inhappinessdue to
Happiness 7.227 7.388Logged GDP per capita 10.666 10.612 .018Social support .931 .962 -.072Healthy life expectancy 71.497 70.314 .034Freedom to make life choices .905 .917 -.013Generosity .255 .259 -.003Perceptions of corruption .445 .441 -.002Sum of explained changes in happiness -.038Total changes in happiness -.161
Note: The following countries/territories are in this group: Australia, Canada, New Zealand, United
States,
Table 31: Decomposing changes in happiness from 2005-2007 to 2014-2016, equalweight for each country/territory, for Middle East and North Africa
Period2014-2016
Period2005-2007
Explainedchanges inhappinessdue to
Happiness 5.47 5.706Logged GDP per capita 9.765 9.761 .001Social support .787 .838 -.12Healthy life expectancy 64.644 63.044 .047Freedom to make life choices .706 .668 .042Generosity -.034 -.052 .015Perceptions of corruption .714 .684 -.016Sum of explained changes in happiness -.031Total changes in happiness -.236
Note: The following countries/territories are in this group: Egypt, Iran, Israel, Jordan, Kuwait,
Lebanon, Palestinian Territories, Saudi Arabia, Turkey, United Arab Emirates, Yemen,
46
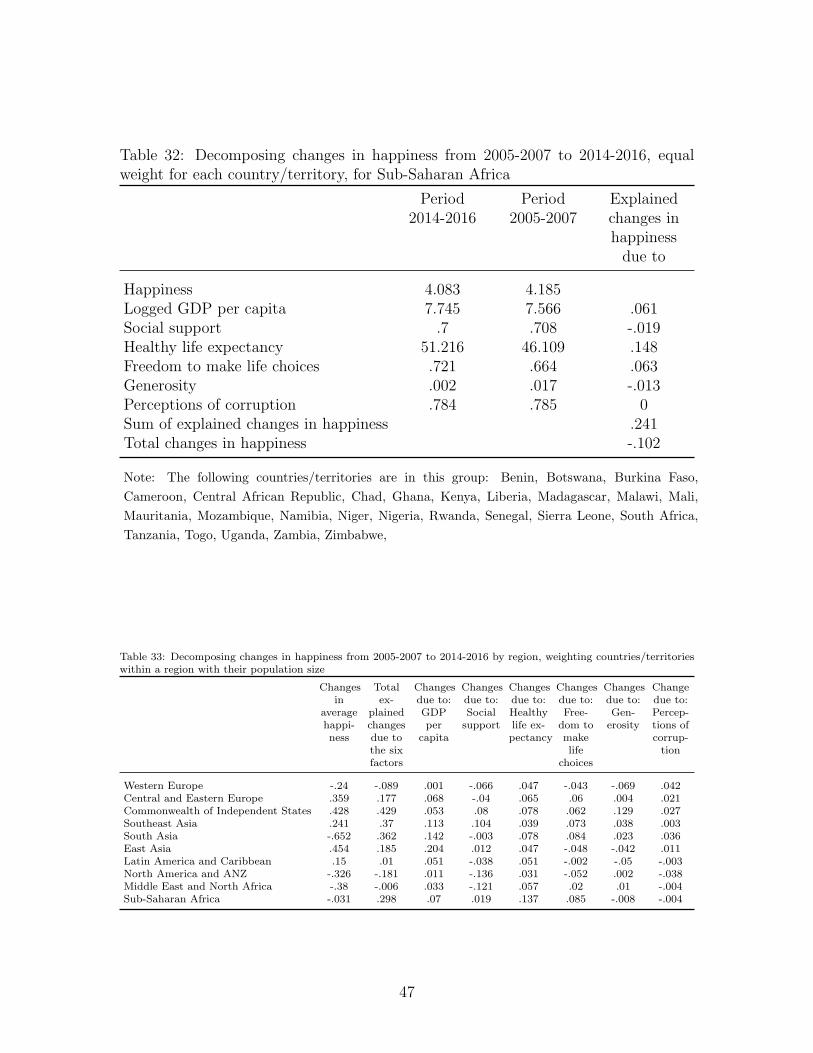
Table 32: Decomposing changes in happiness from 2005-2007 to 2014-2016, equalweight for each country/territory, for Sub-Saharan Africa
Period2014-2016
Period2005-2007
Explainedchanges inhappinessdue to
Happiness 4.083 4.185Logged GDP per capita 7.745 7.566 .061Social support .7 .708 -.019Healthy life expectancy 51.216 46.109 .148Freedom to make life choices .721 .664 .063Generosity .002 .017 -.013Perceptions of corruption .784 .785 0Sum of explained changes in happiness .241Total changes in happiness -.102
Note: The following countries/territories are in this group: Benin, Botswana, Burkina Faso,
Cameroon, Central African Republic, Chad, Ghana, Kenya, Liberia, Madagascar, Malawi, Mali,
Mauritania, Mozambique, Namibia, Niger, Nigeria, Rwanda, Senegal, Sierra Leone, South Africa,
Tanzania, Togo, Uganda, Zambia, Zimbabwe,
Table 33: Decomposing changes in happiness from 2005-2007 to 2014-2016 by region, weighting countries/territorieswithin a region with their population size
Changesin
averagehappi-ness
Totalex-
plainedchangesdue tothe sixfactors
Changesdue to:GDPper
capita
Changesdue to:Socialsupport
Changesdue to:Healthylife ex-pectancy
Changesdue to:Free-dom tomakelife
choices
Changesdue to:Gen-erosity
Changedue to:Percep-tions ofcorrup-tion
Western Europe -.24 -.089 .001 -.066 .047 -.043 -.069 .042Central and Eastern Europe .359 .177 .068 -.04 .065 .06 .004 .021Commonwealth of Independent States .428 .429 .053 .08 .078 .062 .129 .027Southeast Asia .241 .37 .113 .104 .039 .073 .038 .003South Asia -.652 .362 .142 -.003 .078 .084 .023 .036East Asia .454 .185 .204 .012 .047 -.048 -.042 .011Latin America and Caribbean .15 .01 .051 -.038 .051 -.002 -.05 -.003North America and ANZ -.326 -.181 .011 -.136 .031 -.052 .002 -.038Middle East and North Africa -.38 -.006 .033 -.121 .057 .02 .01 -.004Sub-Saharan Africa -.031 .298 .07 .019 .137 .085 -.008 -.004
47
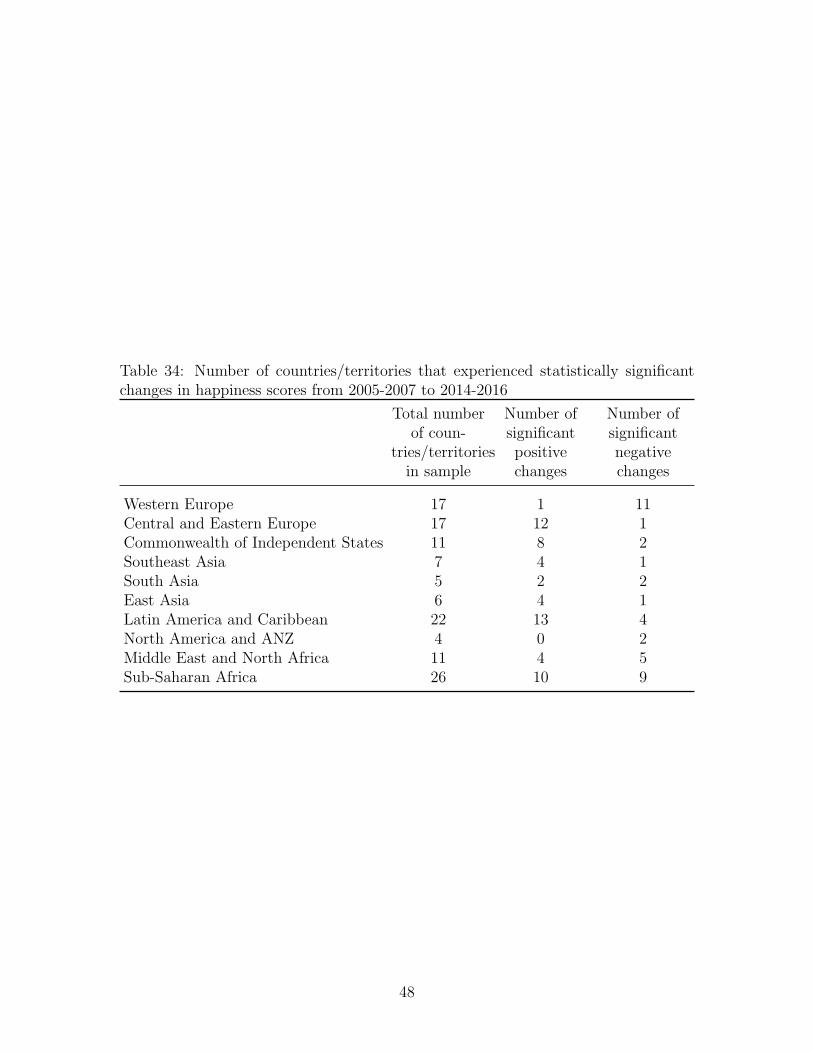
Table 34: Number of countries/territories that experienced statistically significantchanges in happiness scores from 2005-2007 to 2014-2016
Total numberof coun-
tries/territoriesin sample
Number ofsignificantpositivechanges
Number ofsignificantnegativechanges
Western Europe 17 1 11Central and Eastern Europe 17 12 1Commonwealth of Independent States 11 8 2Southeast Asia 7 4 1South Asia 5 2 2East Asia 6 4 1Latin America and Caribbean 22 13 4North America and ANZ 4 0 2Middle East and North Africa 11 4 5Sub-Saharan Africa 26 10 9
48
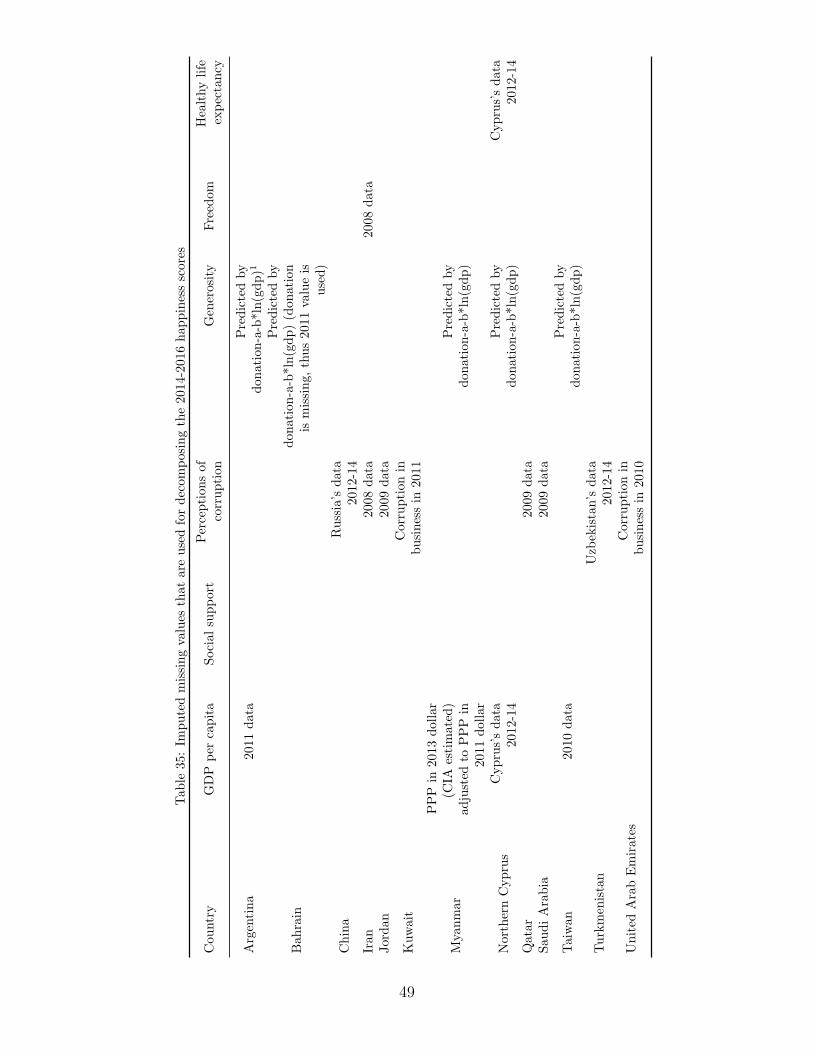
Tab
le35
:Im
putedmissingvalues
that
areusedfordecom
posingthe20
14-201
6hap
pinessscores
Cou
ntry
GDP
per
capita
Social
support
Perception
sof
corruption
Gen
erosity
Freed
omHealthylife
expectancy
Argentina
2011
data
Predictedby
don
ation-a-b*ln(gdp)1
Bah
rain
Predictedby
don
ation-a-b*ln(gdp)(don
ation
ismissing,
thus20
11valueis
used)
China
Russia’s
data
2012
-14
Iran
2008
data
2008
data
Jordan
2009
data
Kuwait
Corruption
inbusinessin
2011
Myan
mar
PPP
in20
13dollar
(CIA
estimated
)ad
justed
toPPP
in20
11dollar
Predictedby
don
ation-a-b*ln(gdp)
NorthernCyprus
Cyprus’sdata
2012
-14
Predictedby
don
ation-a-b*ln(gdp)
Cyprus’sdata
2012-14
Qatar
2009
data
Sau
diArabia
2009
data
Taiwan
2010
data
Predictedby
don
ation-a-b*ln(gdp)
Turkmenistan
Uzb
ekistan’s
data
2012
-14
United
ArabEmirates
Corruption
inbusinessin
2010
49
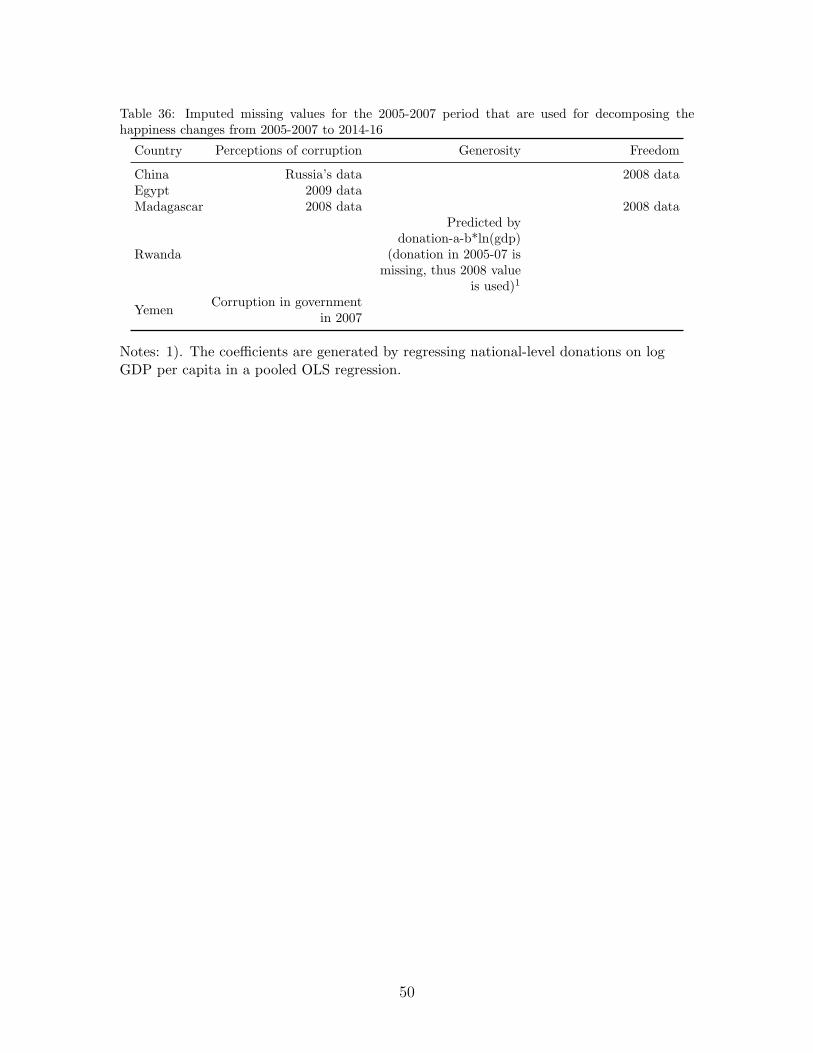
Table 36: Imputed missing values for the 2005-2007 period that are used for decomposing thehappiness changes from 2005-2007 to 2014-16
Country Perceptions of corruption Generosity Freedom
China Russia’s data 2008 dataEgypt 2009 dataMadagascar 2008 data 2008 data
Rwanda
Predicted bydonation-a-b*ln(gdp)
(donation in 2005-07 ismissing, thus 2008 value
is used)1
YemenCorruption in government
in 2007
Notes: 1). The coefficients are generated by regressing national-level donations on logGDP per capita in a pooled OLS regression.
50
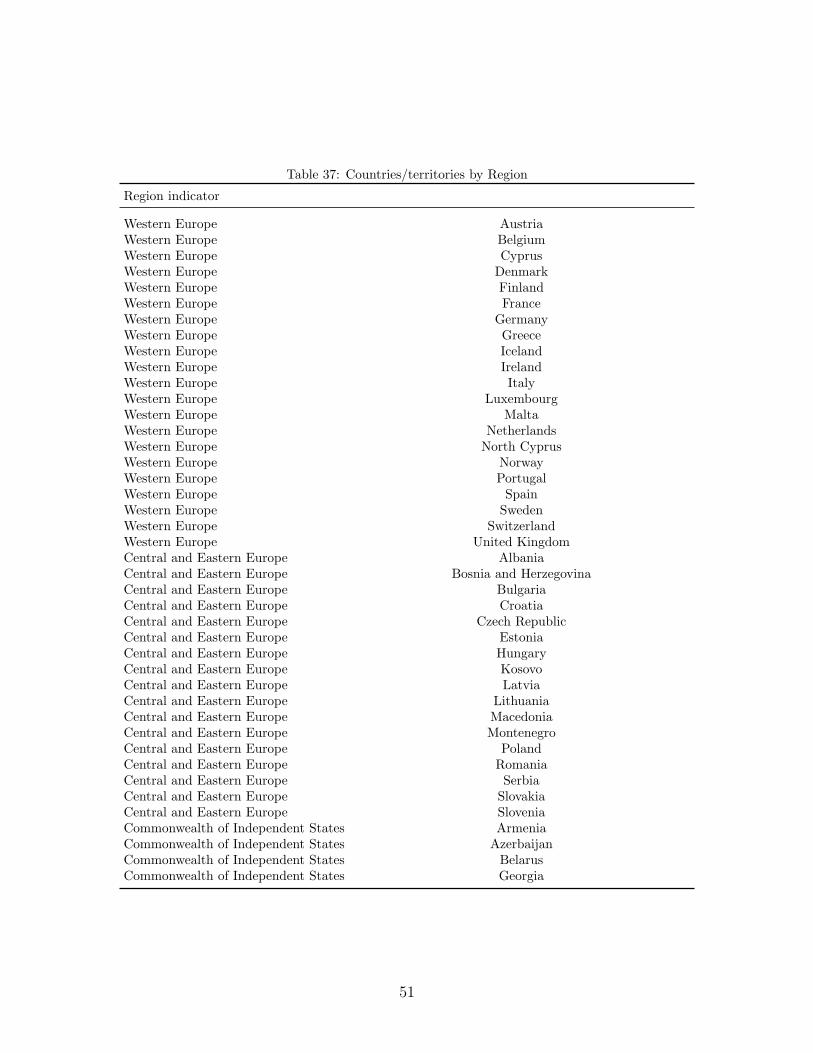
Table 37: Countries/territories by Region
Region indicator
Western Europe AustriaWestern Europe BelgiumWestern Europe CyprusWestern Europe DenmarkWestern Europe FinlandWestern Europe FranceWestern Europe GermanyWestern Europe GreeceWestern Europe IcelandWestern Europe IrelandWestern Europe ItalyWestern Europe LuxembourgWestern Europe MaltaWestern Europe NetherlandsWestern Europe North CyprusWestern Europe NorwayWestern Europe PortugalWestern Europe SpainWestern Europe SwedenWestern Europe SwitzerlandWestern Europe United KingdomCentral and Eastern Europe AlbaniaCentral and Eastern Europe Bosnia and HerzegovinaCentral and Eastern Europe BulgariaCentral and Eastern Europe CroatiaCentral and Eastern Europe Czech RepublicCentral and Eastern Europe EstoniaCentral and Eastern Europe HungaryCentral and Eastern Europe KosovoCentral and Eastern Europe LatviaCentral and Eastern Europe LithuaniaCentral and Eastern Europe MacedoniaCentral and Eastern Europe MontenegroCentral and Eastern Europe PolandCentral and Eastern Europe RomaniaCentral and Eastern Europe SerbiaCentral and Eastern Europe SlovakiaCentral and Eastern Europe SloveniaCommonwealth of Independent States ArmeniaCommonwealth of Independent States AzerbaijanCommonwealth of Independent States BelarusCommonwealth of Independent States Georgia
51
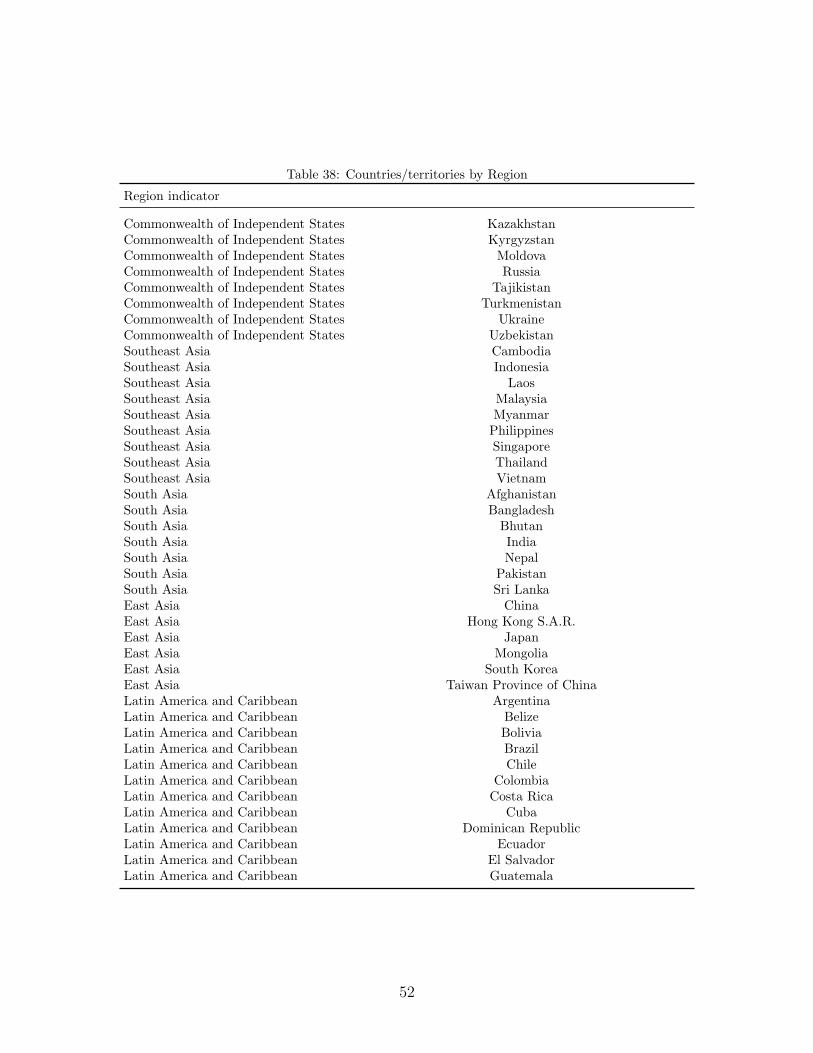
Table 38: Countries/territories by Region
Region indicator
Commonwealth of Independent States KazakhstanCommonwealth of Independent States KyrgyzstanCommonwealth of Independent States MoldovaCommonwealth of Independent States RussiaCommonwealth of Independent States TajikistanCommonwealth of Independent States TurkmenistanCommonwealth of Independent States UkraineCommonwealth of Independent States UzbekistanSoutheast Asia CambodiaSoutheast Asia IndonesiaSoutheast Asia LaosSoutheast Asia MalaysiaSoutheast Asia MyanmarSoutheast Asia PhilippinesSoutheast Asia SingaporeSoutheast Asia ThailandSoutheast Asia VietnamSouth Asia AfghanistanSouth Asia BangladeshSouth Asia BhutanSouth Asia IndiaSouth Asia NepalSouth Asia PakistanSouth Asia Sri LankaEast Asia ChinaEast Asia Hong Kong S.A.R.East Asia JapanEast Asia MongoliaEast Asia South KoreaEast Asia Taiwan Province of ChinaLatin America and Caribbean ArgentinaLatin America and Caribbean BelizeLatin America and Caribbean BoliviaLatin America and Caribbean BrazilLatin America and Caribbean ChileLatin America and Caribbean ColombiaLatin America and Caribbean Costa RicaLatin America and Caribbean CubaLatin America and Caribbean Dominican RepublicLatin America and Caribbean EcuadorLatin America and Caribbean El SalvadorLatin America and Caribbean Guatemala
52
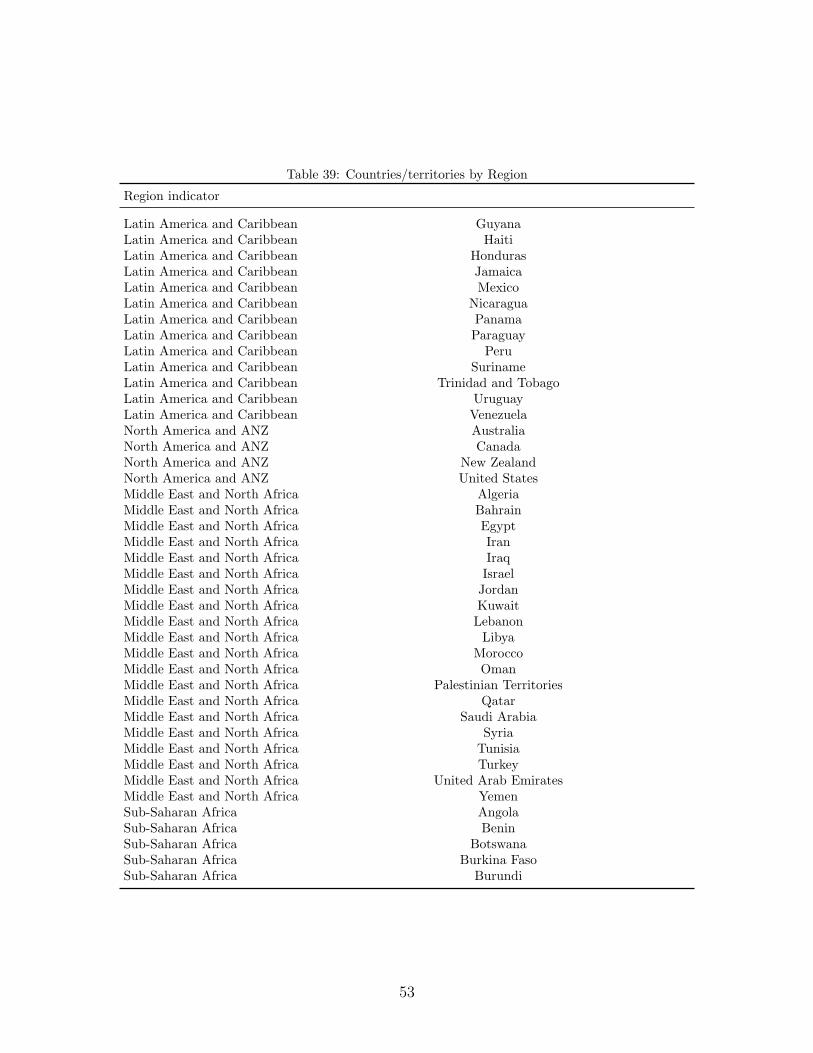
Table 39: Countries/territories by Region
Region indicator
Latin America and Caribbean GuyanaLatin America and Caribbean HaitiLatin America and Caribbean HondurasLatin America and Caribbean JamaicaLatin America and Caribbean MexicoLatin America and Caribbean NicaraguaLatin America and Caribbean PanamaLatin America and Caribbean ParaguayLatin America and Caribbean PeruLatin America and Caribbean SurinameLatin America and Caribbean Trinidad and TobagoLatin America and Caribbean UruguayLatin America and Caribbean VenezuelaNorth America and ANZ AustraliaNorth America and ANZ CanadaNorth America and ANZ New ZealandNorth America and ANZ United StatesMiddle East and North Africa AlgeriaMiddle East and North Africa BahrainMiddle East and North Africa EgyptMiddle East and North Africa IranMiddle East and North Africa IraqMiddle East and North Africa IsraelMiddle East and North Africa JordanMiddle East and North Africa KuwaitMiddle East and North Africa LebanonMiddle East and North Africa LibyaMiddle East and North Africa MoroccoMiddle East and North Africa OmanMiddle East and North Africa Palestinian TerritoriesMiddle East and North Africa QatarMiddle East and North Africa Saudi ArabiaMiddle East and North Africa SyriaMiddle East and North Africa TunisiaMiddle East and North Africa TurkeyMiddle East and North Africa United Arab EmiratesMiddle East and North Africa YemenSub-Saharan Africa AngolaSub-Saharan Africa BeninSub-Saharan Africa BotswanaSub-Saharan Africa Burkina FasoSub-Saharan Africa Burundi
53
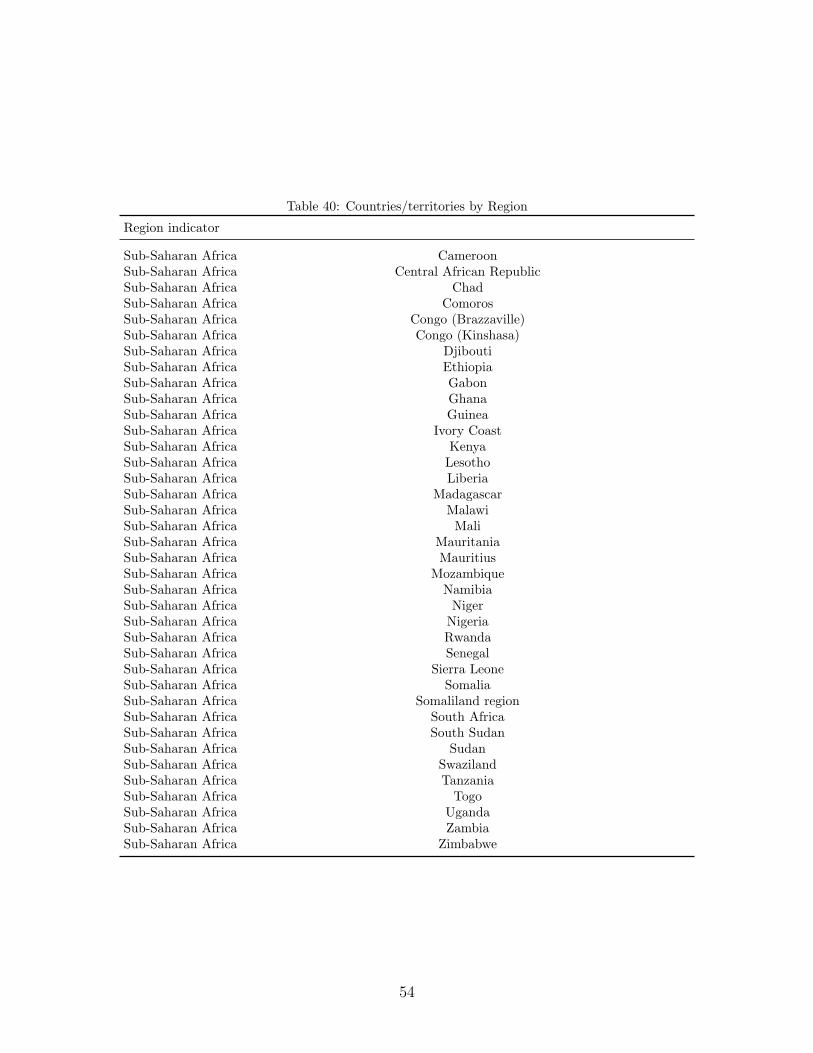
Table 40: Countries/territories by Region
Region indicator
Sub-Saharan Africa CameroonSub-Saharan Africa Central African RepublicSub-Saharan Africa ChadSub-Saharan Africa ComorosSub-Saharan Africa Congo (Brazzaville)Sub-Saharan Africa Congo (Kinshasa)Sub-Saharan Africa DjiboutiSub-Saharan Africa EthiopiaSub-Saharan Africa GabonSub-Saharan Africa GhanaSub-Saharan Africa GuineaSub-Saharan Africa Ivory CoastSub-Saharan Africa KenyaSub-Saharan Africa LesothoSub-Saharan Africa LiberiaSub-Saharan Africa MadagascarSub-Saharan Africa MalawiSub-Saharan Africa MaliSub-Saharan Africa MauritaniaSub-Saharan Africa MauritiusSub-Saharan Africa MozambiqueSub-Saharan Africa NamibiaSub-Saharan Africa NigerSub-Saharan Africa NigeriaSub-Saharan Africa RwandaSub-Saharan Africa SenegalSub-Saharan Africa Sierra LeoneSub-Saharan Africa SomaliaSub-Saharan Africa Somaliland regionSub-Saharan Africa South AfricaSub-Saharan Africa South SudanSub-Saharan Africa SudanSub-Saharan Africa SwazilandSub-Saharan Africa TanzaniaSub-Saharan Africa TogoSub-Saharan Africa UgandaSub-Saharan Africa ZambiaSub-Saharan Africa Zimbabwe
54
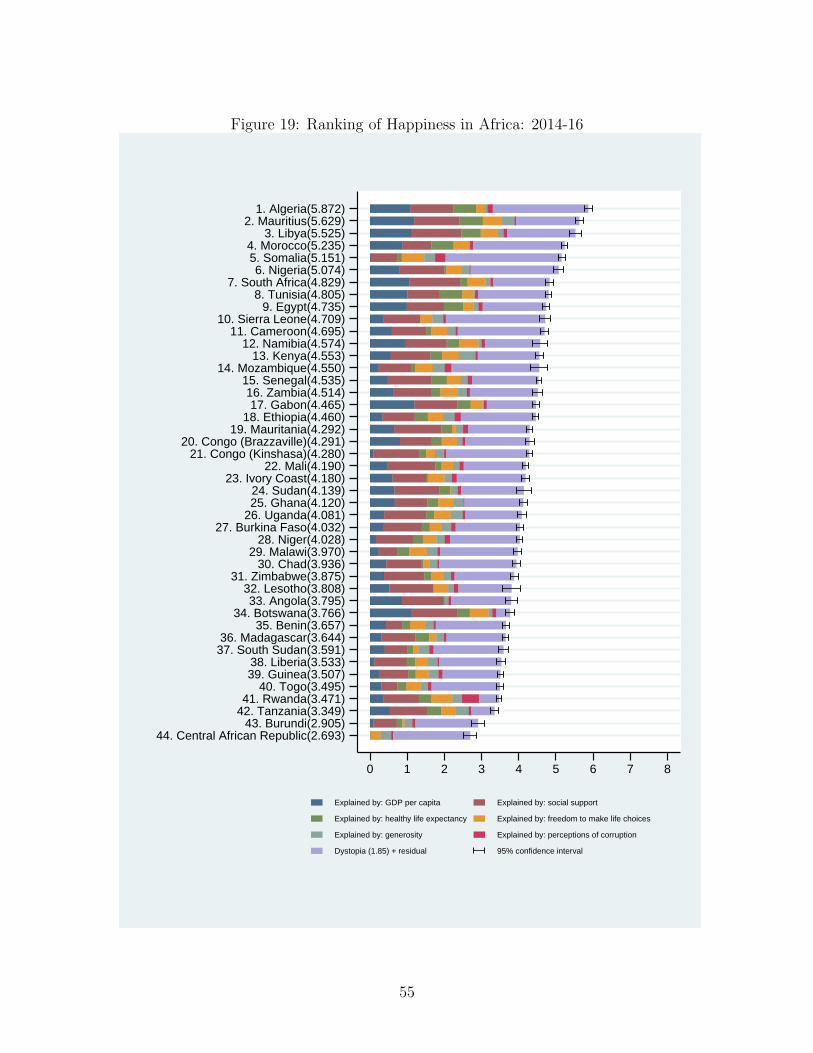
Figure 19: Ranking of Happiness in Africa: 2014-16
44. Central African Republic(2.693)43. Burundi(2.905)
42. Tanzania(3.349)41. Rwanda(3.471)
40. Togo(3.495)39. Guinea(3.507)38. Liberia(3.533)
37. South Sudan(3.591)36. Madagascar(3.644)
35. Benin(3.657)34. Botswana(3.766)
33. Angola(3.795)32. Lesotho(3.808)
31. Zimbabwe(3.875)30. Chad(3.936)
29. Malawi(3.970)28. Niger(4.028)
27. Burkina Faso(4.032)26. Uganda(4.081)25. Ghana(4.120)24. Sudan(4.139)
23. Ivory Coast(4.180)22. Mali(4.190)
21. Congo (Kinshasa)(4.280)20. Congo (Brazzaville)(4.291)
19. Mauritania(4.292)18. Ethiopia(4.460)
17. Gabon(4.465)16. Zambia(4.514)
15. Senegal(4.535)14. Mozambique(4.550)
13. Kenya(4.553)12. Namibia(4.574)
11. Cameroon(4.695)10. Sierra Leone(4.709)
9. Egypt(4.735)8. Tunisia(4.805)
7. South Africa(4.829)6. Nigeria(5.074)
5. Somalia(5.151)4. Morocco(5.235)
3. Libya(5.525)2. Mauritius(5.629)
1. Algeria(5.872)
0 1 2 3 4 5 6 7 8
Explained by: GDP per capita Explained by: social support
Explained by: healthy life expectancy Explained by: freedom to make life choices
Explained by: generosity Explained by: perceptions of corruption
Dystopia (1.85) + residual 95% confidence interval
55
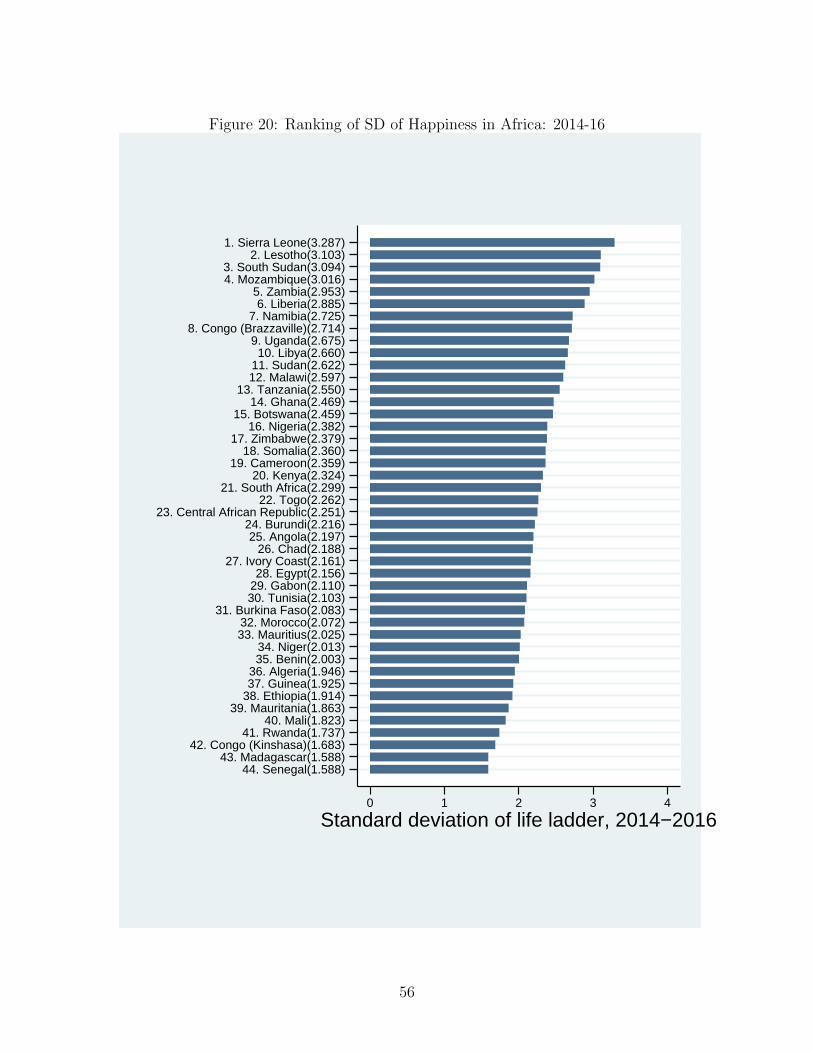
Figure 20: Ranking of SD of Happiness in Africa: 2014-16
44. Senegal(1.588)43. Madagascar(1.588)
42. Congo (Kinshasa)(1.683)41. Rwanda(1.737)
40. Mali(1.823)39. Mauritania(1.863)
38. Ethiopia(1.914)37. Guinea(1.925)36. Algeria(1.946)35. Benin(2.003)34. Niger(2.013)
33. Mauritius(2.025)32. Morocco(2.072)
31. Burkina Faso(2.083)30. Tunisia(2.103)29. Gabon(2.110)28. Egypt(2.156)
27. Ivory Coast(2.161)26. Chad(2.188)
25. Angola(2.197)24. Burundi(2.216)
23. Central African Republic(2.251)22. Togo(2.262)
21. South Africa(2.299)20. Kenya(2.324)
19. Cameroon(2.359)18. Somalia(2.360)
17. Zimbabwe(2.379)16. Nigeria(2.382)
15. Botswana(2.459)14. Ghana(2.469)
13. Tanzania(2.550)12. Malawi(2.597)11. Sudan(2.622)10. Libya(2.660)
9. Uganda(2.675)8. Congo (Brazzaville)(2.714)
7. Namibia(2.725)6. Liberia(2.885)
5. Zambia(2.953)4. Mozambique(3.016)3. South Sudan(3.094)
2. Lesotho(3.103)1. Sierra Leone(3.287)
0 1 2 3 4
Standard deviation of life ladder, 2014−2016
56
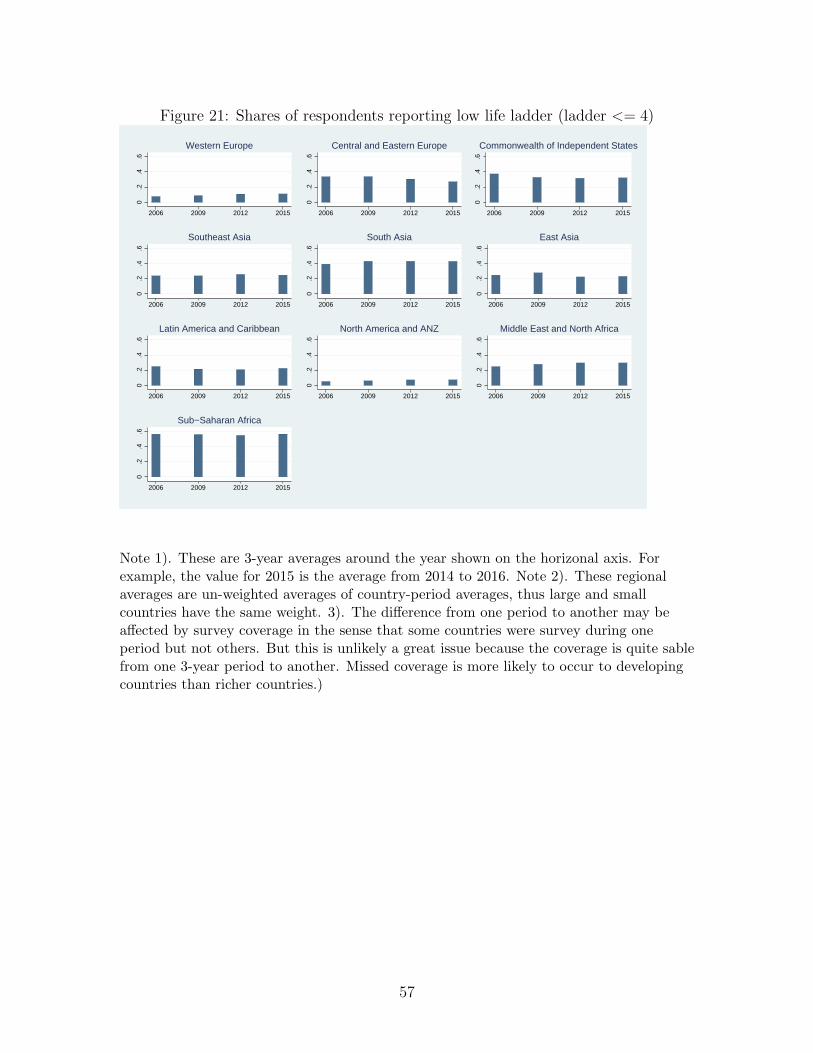
Figure 21: Shares of respondents reporting low life ladder (ladder <= 4)
0.2
.4.6
2006 2009 2012 2015
Western Europe
0.2
.4.6
2006 2009 2012 2015
Central and Eastern Europe
0.2
.4.6
2006 2009 2012 2015
Commonwealth of Independent States0
.2.4
.6
2006 2009 2012 2015
Southeast Asia
0.2
.4.6
2006 2009 2012 2015
South Asia
0.2
.4.6
2006 2009 2012 2015
East Asia
0.2
.4.6
2006 2009 2012 2015
Latin America and Caribbean
0.2
.4.6
2006 2009 2012 2015
North America and ANZ
0.2
.4.6
2006 2009 2012 2015
Middle East and North Africa
0.2
.4.6
2006 2009 2012 2015
Sub−Saharan Africa
Note 1). These are 3-year averages around the year shown on the horizonal axis. Forexample, the value for 2015 is the average from 2014 to 2016. Note 2). These regionalaverages are un-weighted averages of country-period averages, thus large and smallcountries have the same weight. 3). The difference from one period to another may beaffected by survey coverage in the sense that some countries were survey during oneperiod but not others. But this is unlikely a great issue because the coverage is quite sablefrom one 3-year period to another. Missed coverage is more likely to occur to developingcountries than richer countries.)
57
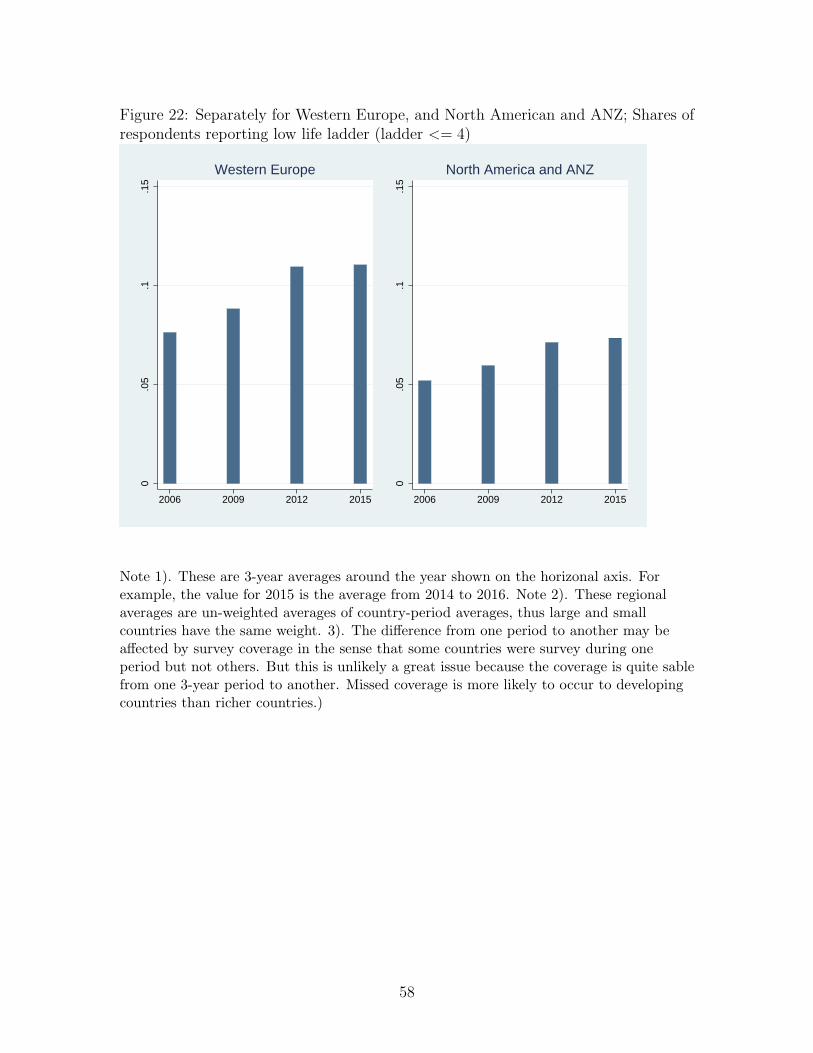
Figure 22: Separately for Western Europe, and North American and ANZ; Shares ofrespondents reporting low life ladder (ladder <= 4)
0.0
5.1
.15
2006 2009 2012 2015
Western Europe
0.0
5.1
.15
2006 2009 2012 2015
North America and ANZ
Note 1). These are 3-year averages around the year shown on the horizonal axis. Forexample, the value for 2015 is the average from 2014 to 2016. Note 2). These regionalaverages are un-weighted averages of country-period averages, thus large and smallcountries have the same weight. 3). The difference from one period to another may beaffected by survey coverage in the sense that some countries were survey during oneperiod but not others. But this is unlikely a great issue because the coverage is quite sablefrom one 3-year period to another. Missed coverage is more likely to occur to developingcountries than richer countries.)
58
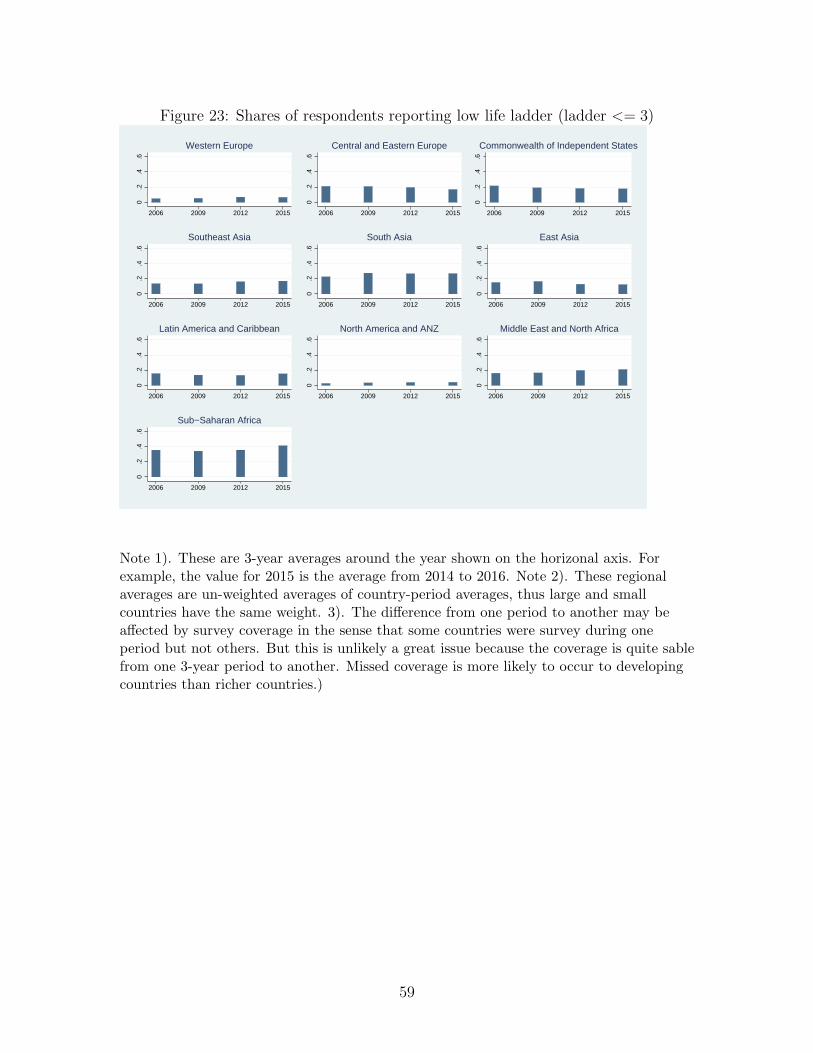
Figure 23: Shares of respondents reporting low life ladder (ladder <= 3)
0.2
.4.6
2006 2009 2012 2015
Western Europe
0.2
.4.6
2006 2009 2012 2015
Central and Eastern Europe
0.2
.4.6
2006 2009 2012 2015
Commonwealth of Independent States0
.2.4
.6
2006 2009 2012 2015
Southeast Asia
0.2
.4.6
2006 2009 2012 2015
South Asia
0.2
.4.6
2006 2009 2012 2015
East Asia
0.2
.4.6
2006 2009 2012 2015
Latin America and Caribbean
0.2
.4.6
2006 2009 2012 2015
North America and ANZ
0.2
.4.6
2006 2009 2012 2015
Middle East and North Africa
0.2
.4.6
2006 2009 2012 2015
Sub−Saharan Africa
Note 1). These are 3-year averages around the year shown on the horizonal axis. Forexample, the value for 2015 is the average from 2014 to 2016. Note 2). These regionalaverages are un-weighted averages of country-period averages, thus large and smallcountries have the same weight. 3). The difference from one period to another may beaffected by survey coverage in the sense that some countries were survey during oneperiod but not others. But this is unlikely a great issue because the coverage is quite sablefrom one 3-year period to another. Missed coverage is more likely to occur to developingcountries than richer countries.)
59
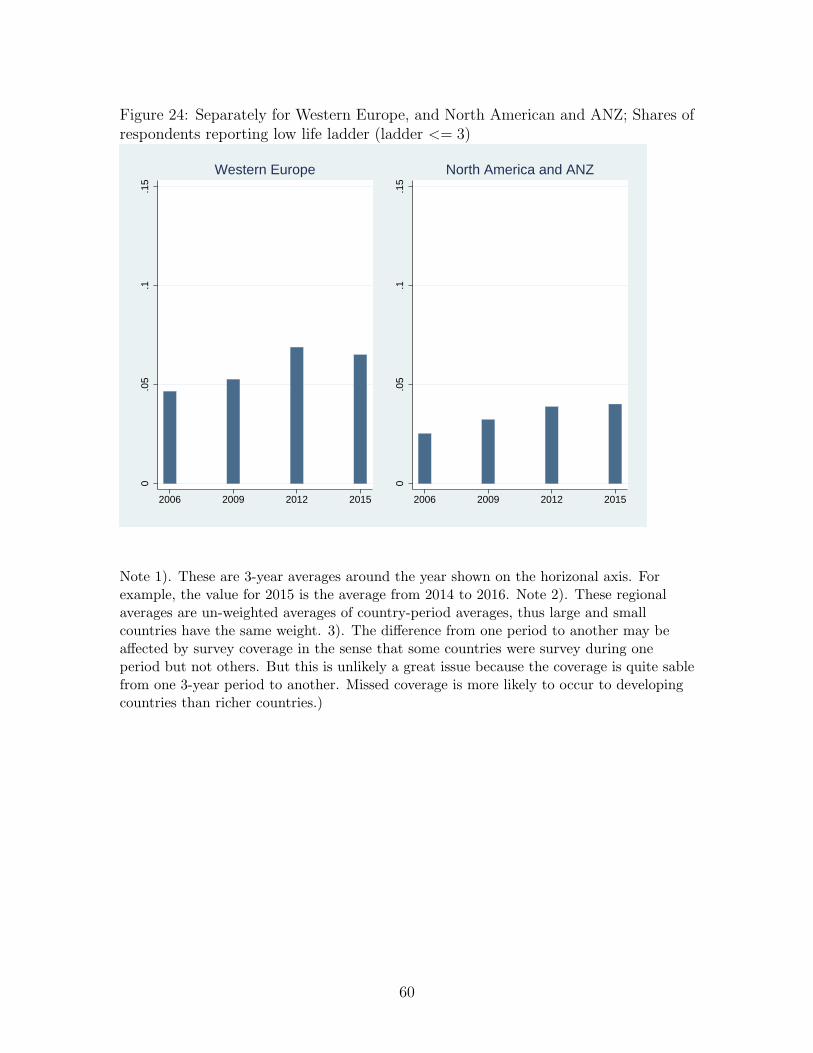
Figure 24: Separately for Western Europe, and North American and ANZ; Shares ofrespondents reporting low life ladder (ladder <= 3)
0.0
5.1
.15
2006 2009 2012 2015
Western Europe
0.0
5.1
.15
2006 2009 2012 2015
North America and ANZ
Note 1). These are 3-year averages around the year shown on the horizonal axis. Forexample, the value for 2015 is the average from 2014 to 2016. Note 2). These regionalaverages are un-weighted averages of country-period averages, thus large and smallcountries have the same weight. 3). The difference from one period to another may beaffected by survey coverage in the sense that some countries were survey during oneperiod but not others. But this is unlikely a great issue because the coverage is quite sablefrom one 3-year period to another. Missed coverage is more likely to occur to developingcountries than richer countries.)
60