Embed Size (px)
Citation preview
The Science ofWorkplace Collaboration
Gabor Nagy, Ph.D.
Collaboration and the physical work environment
Quantifying and visualizing F2F interactions
Social and spatial implications
The “Innovation Potential” or “Innovation Index”
Group / Departmental adjacencies
Interactive visualization (blocking & stacking)
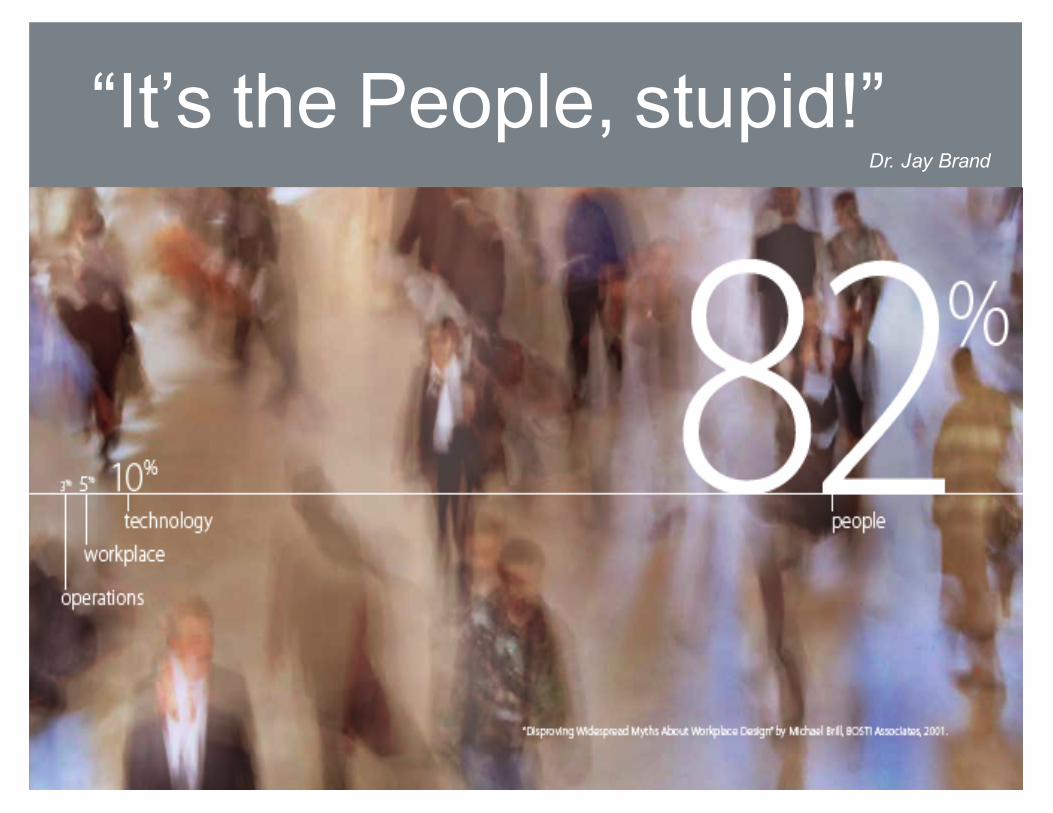
“It’s the People, stupid!”Dr. Jay Brand
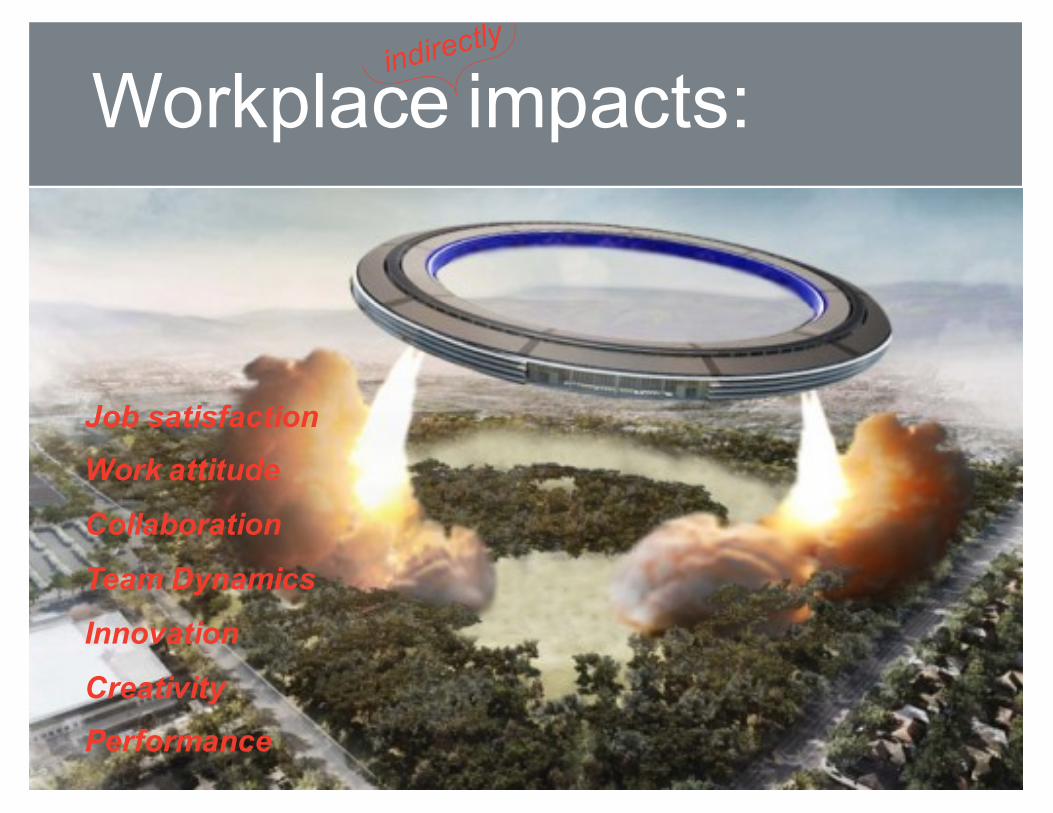
Workplace impacts:
Job satisfactionWork attitude
Collaboration
Team Dynamics
Innovation
CreativityPerformance
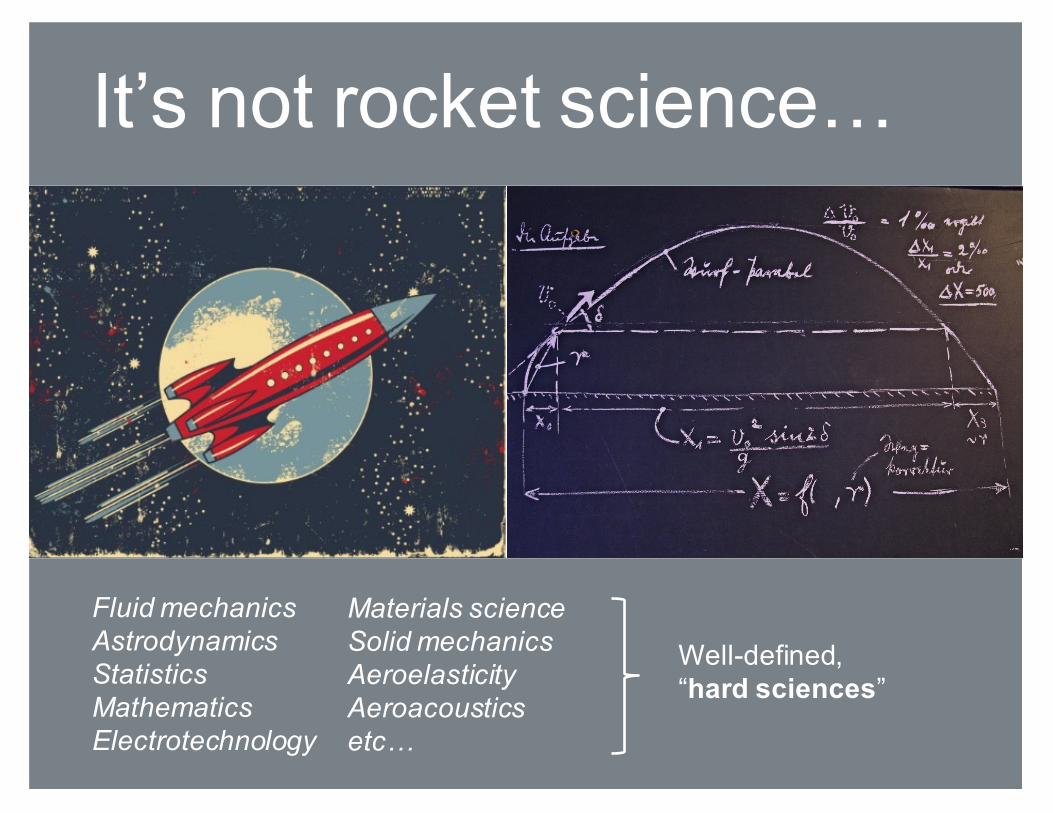
It’s not rocket science…
Well-defined,“hard sciences”
Fluid mechanicsAstrodynamicsStatisticsMathematicsElectrotechnology
Materials scienceSolid mechanicsAeroelasticityAeroacousticsetc…
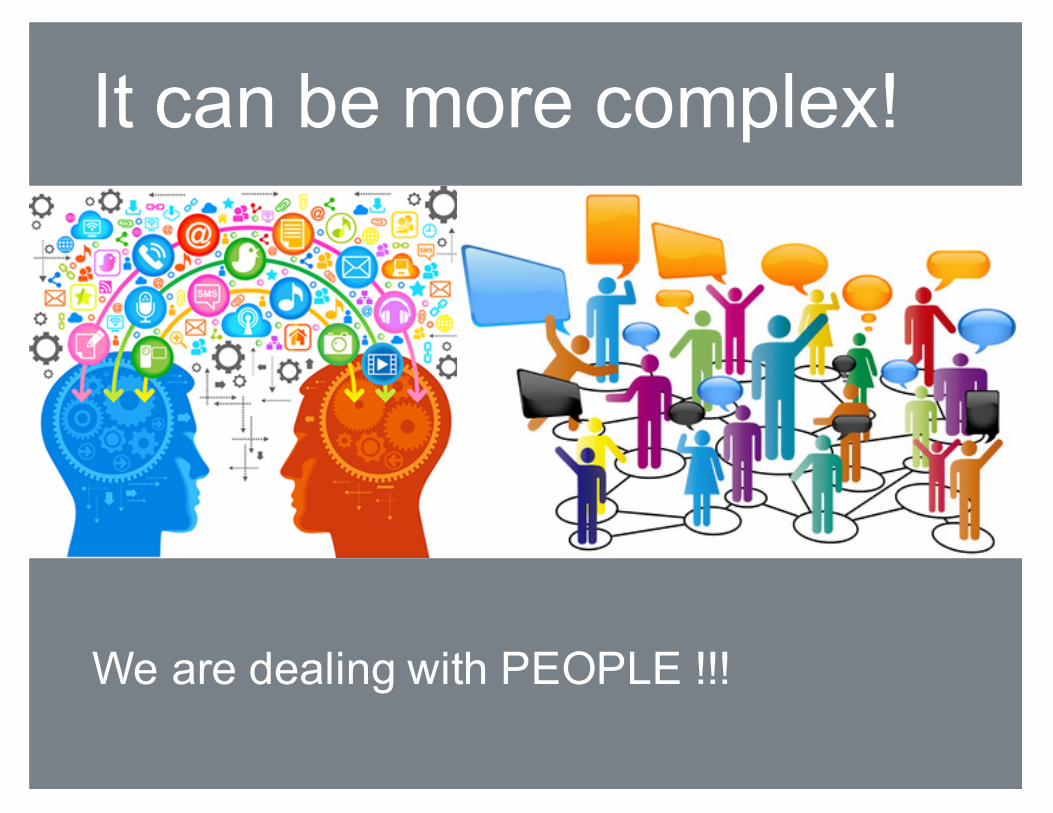
It can be more complex!
We are dealing with PEOPLE !!!
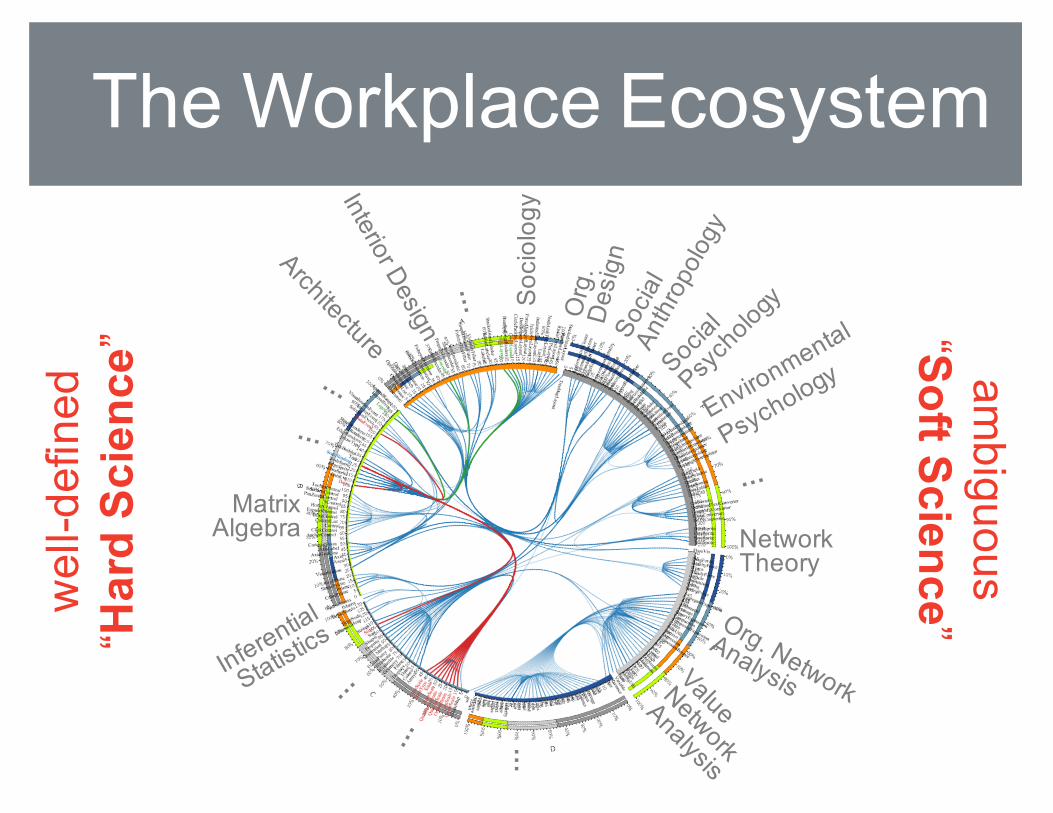
The Workplace Ecosystem
Soc
iolo
gyMatrix
Algebra NetworkTheory
wel
l-def
ined
“Har
d Sc
ienc
e” ambiguous
“Soft Science”
…
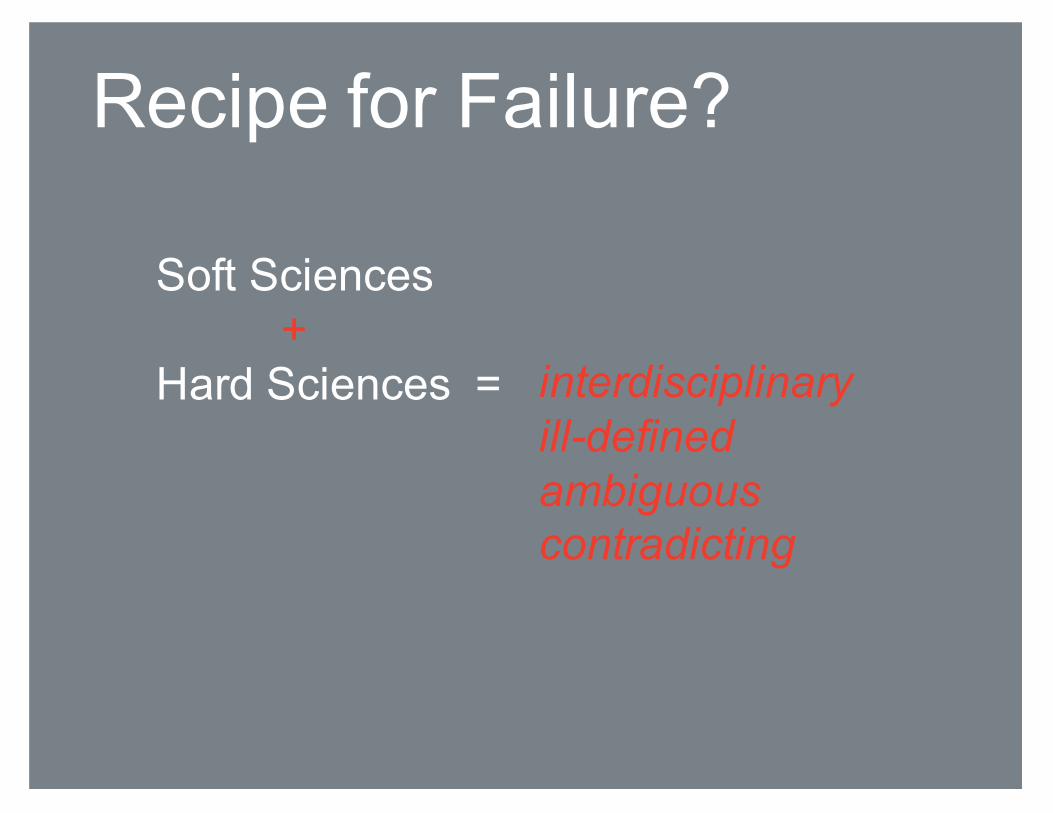
Soft Sciences+
Hard Sciences = interdisciplinaryill-definedambiguouscontradicting
Recipe for Failure?

The “soft stuff” is the hard stuff !
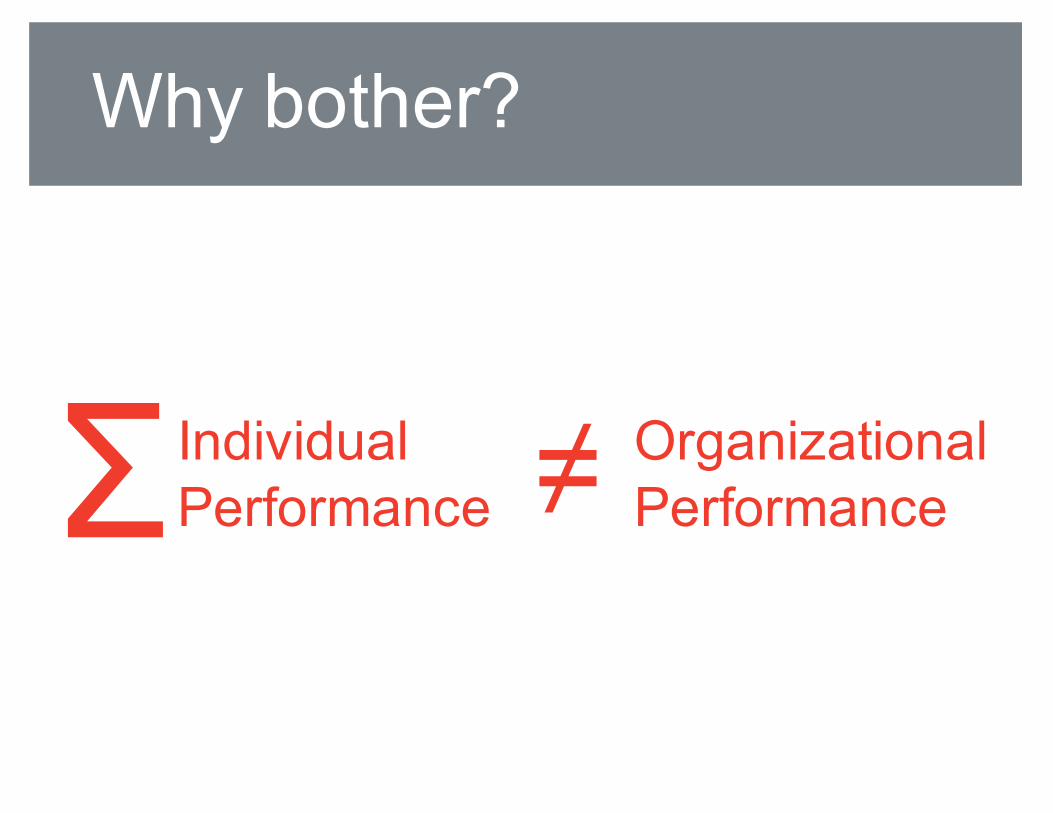
Why bother?
ΣIndividualPerformance
OrganizationalPerformance≠
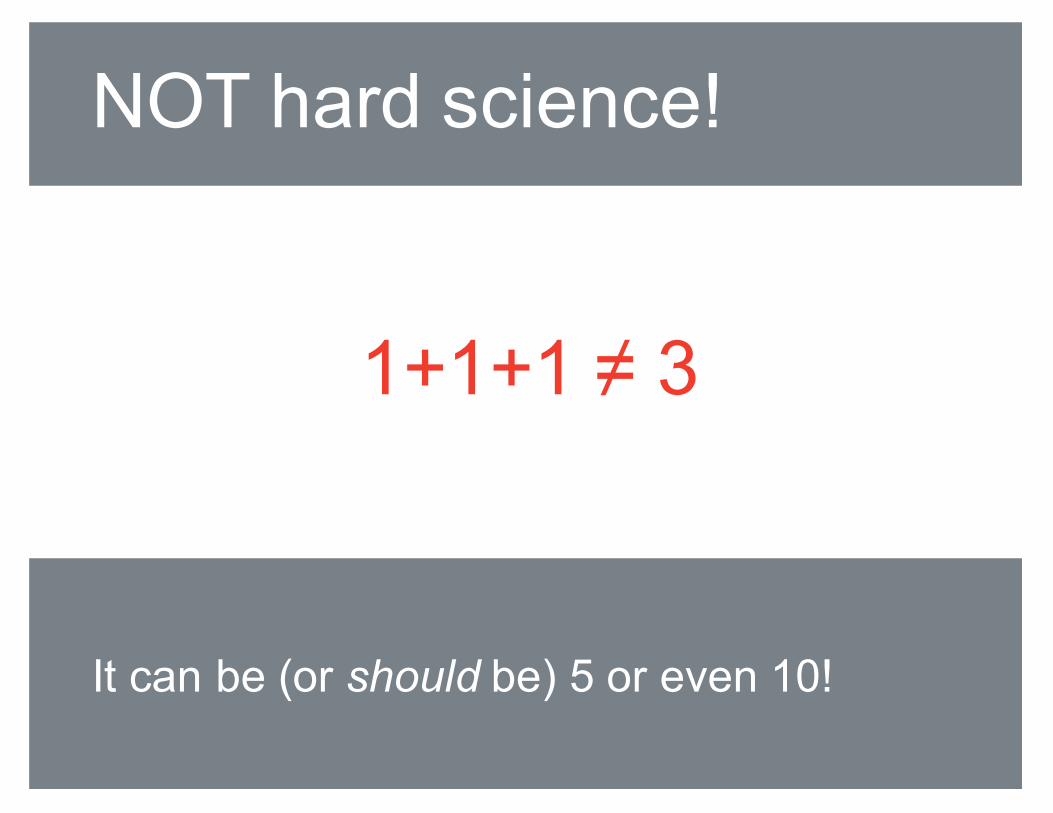
NOT hard science!
1+1+1 ≠ 3
It can be (or should be) 5 or even 10!
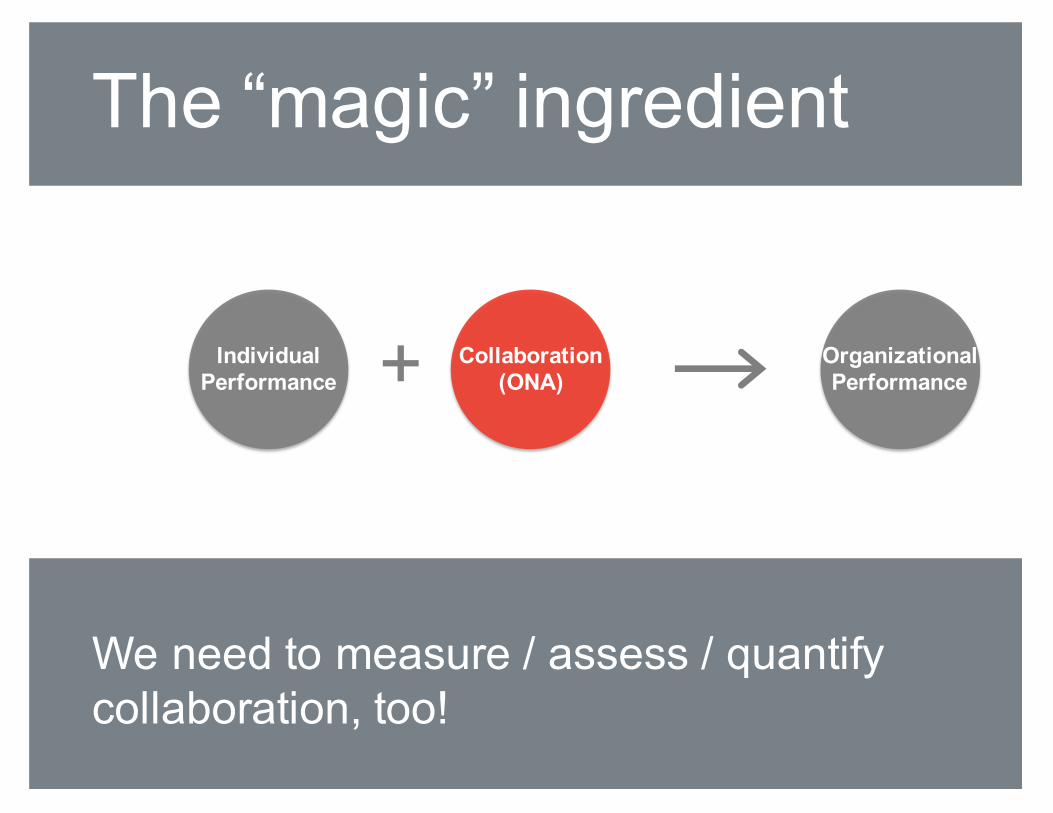
The “magic” ingredient
We need to measure / assess / quantify collaboration, too!
IndividualPerformance
Collaboration(ONA)
OrganizationalPerformance+
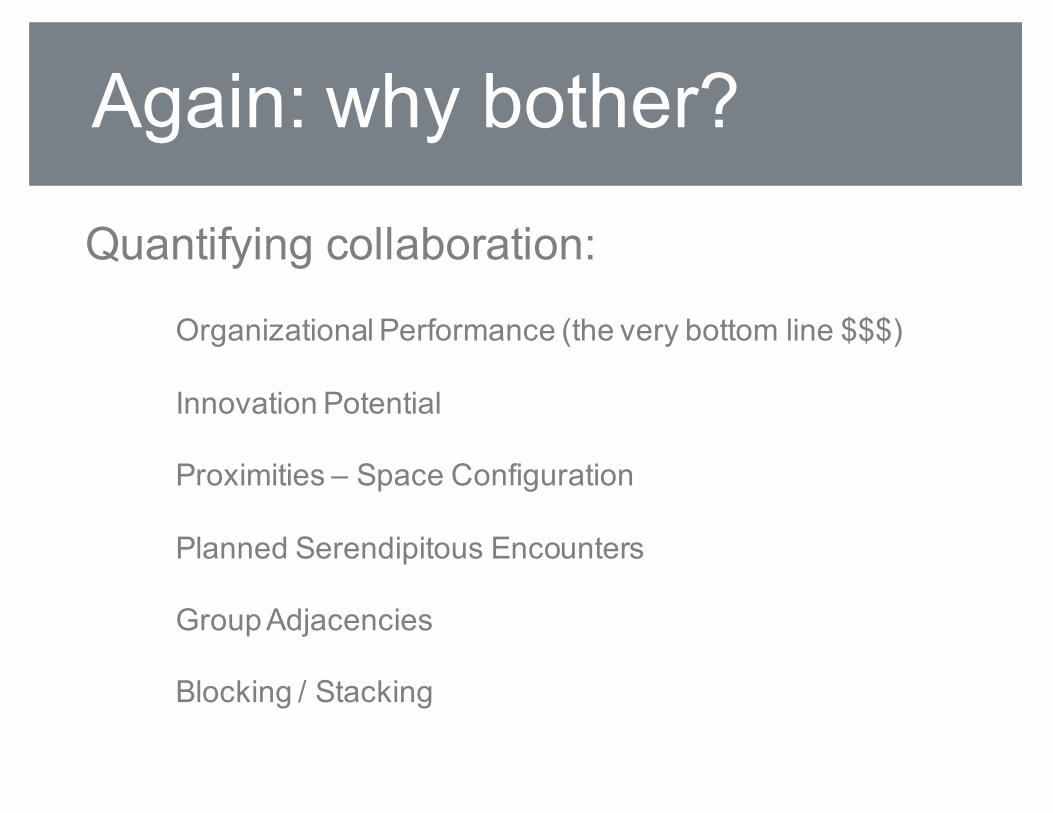
Again: why bother?
Quantifying collaboration:
Organizational Performance (the very bottom line $$$)
Innovation Potential
Proximities – Space Configuration
Planned Serendipitous Encounters
Group Adjacencies
Blocking / Stacking
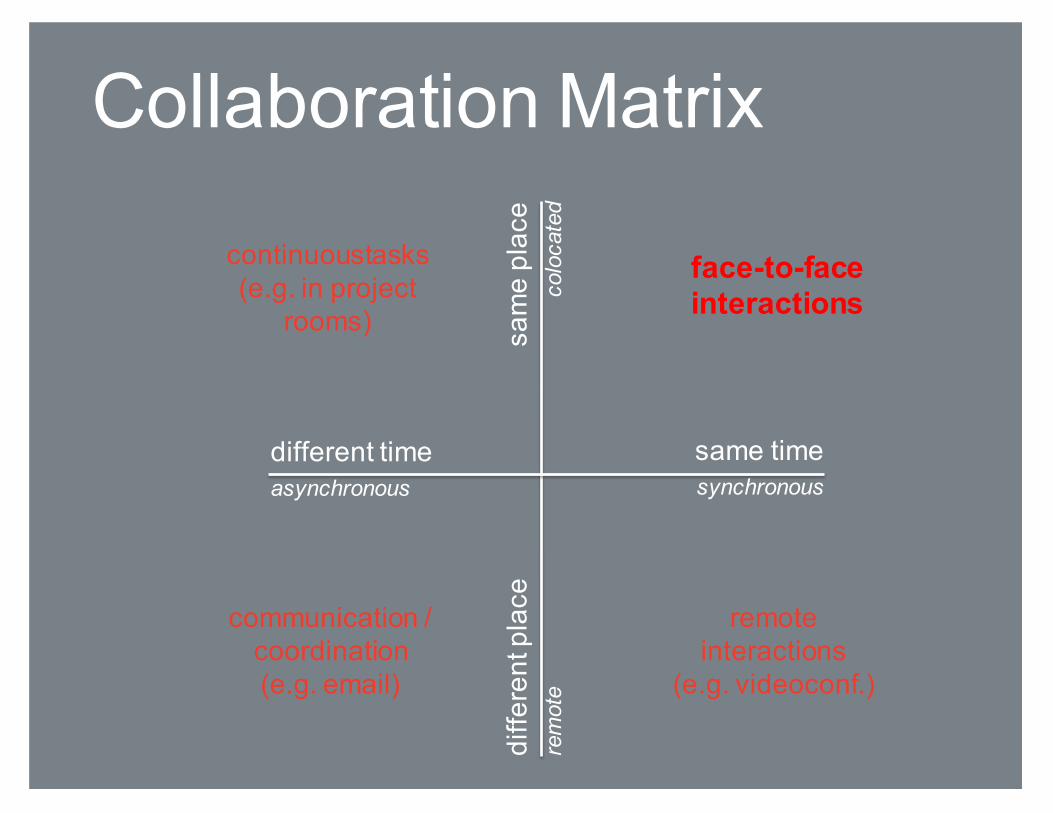
Collaboration Matrix
same timesynchronous
sam
e pl
ace
colo
cate
d
different timeasynchronous
face-to-face interactions
diffe
rent
pla
cere
mot
e
remoteinteractions
(e.g. videoconf.)
communication / coordination(e.g. email)
continuoustasks(e.g. in project
rooms)
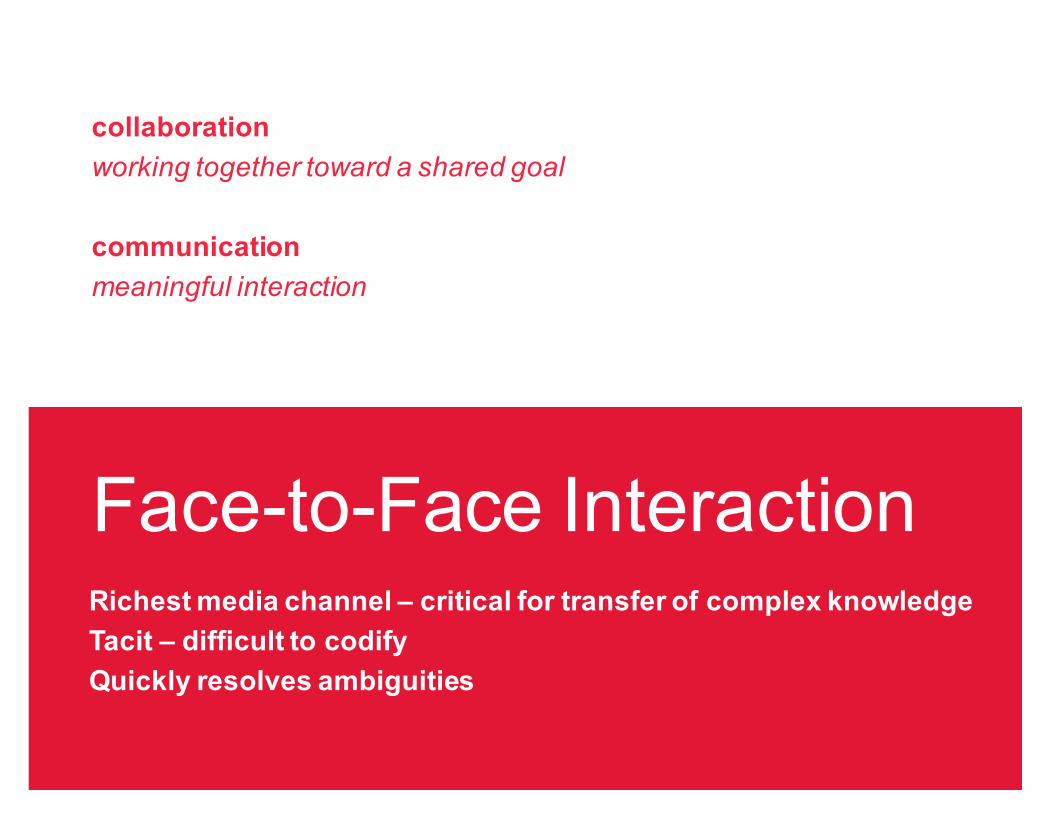
Richest media channel – critical for transfer of complex knowledgeTacit – difficult to codify Quickly resolves ambiguities
collaborationworking together toward a shared goal
communicationmeaningful interaction
Face-to-Face Interaction
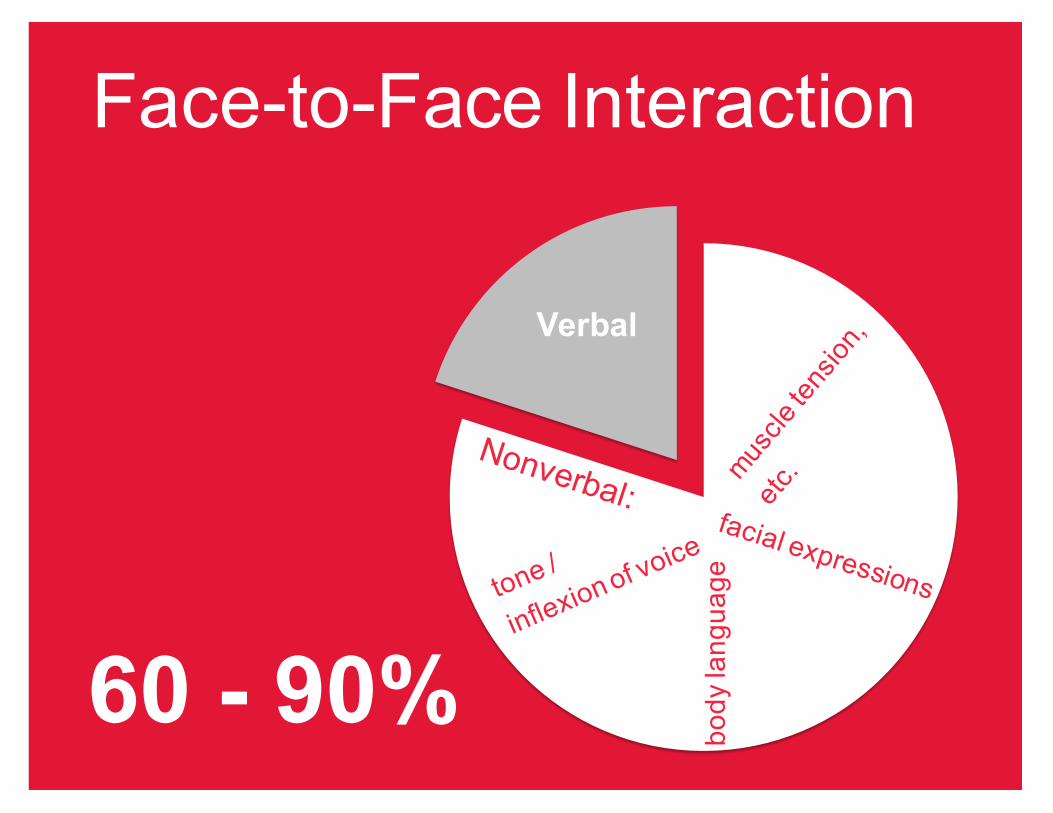
60 - 90%
Verbal
Face-to-Face Interaction
body
lang
uage
“Emoticons”
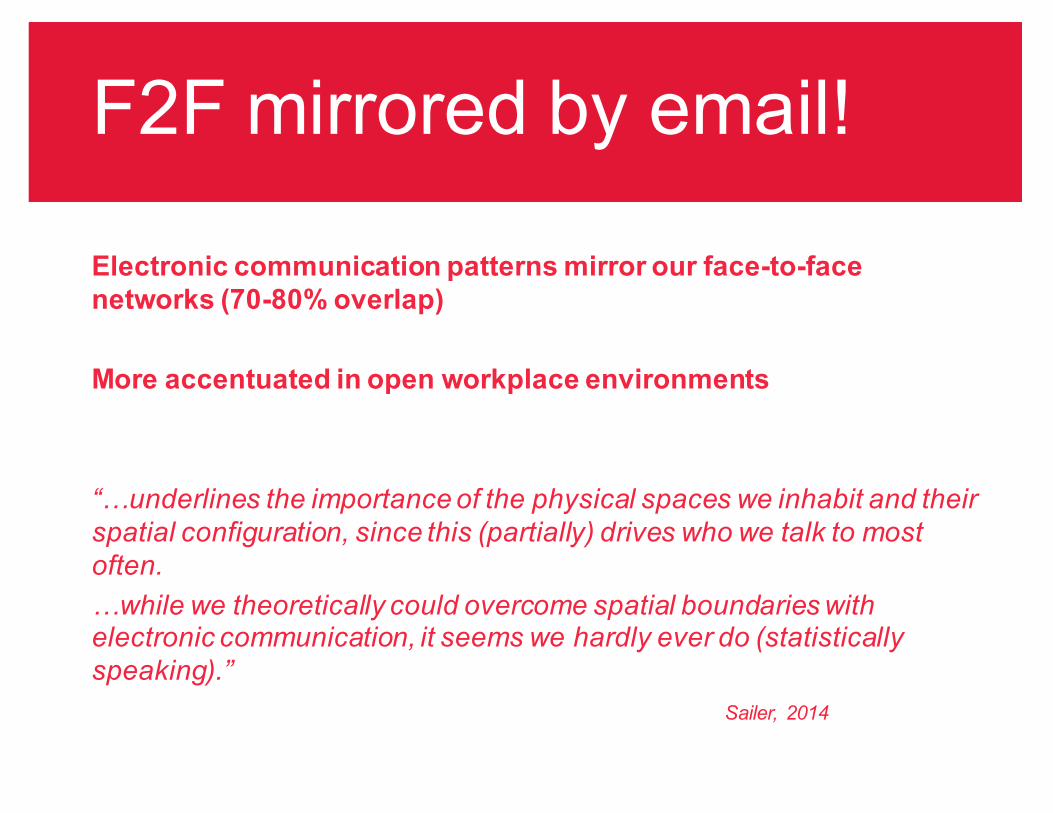
F2F mirrored by email!
Electronic communication patterns mirror our face-to-face networks (70-80% overlap)
More accentuated in open workplace environments
“…underlines the importance of the physical spaces we inhabit and their spatial configuration, since this (partially) drives who we talk to most often.…while we theoretically could overcome spatial boundaries with electronic communication, it seems we hardly ever do (statistically speaking).”
Sailer, 2014
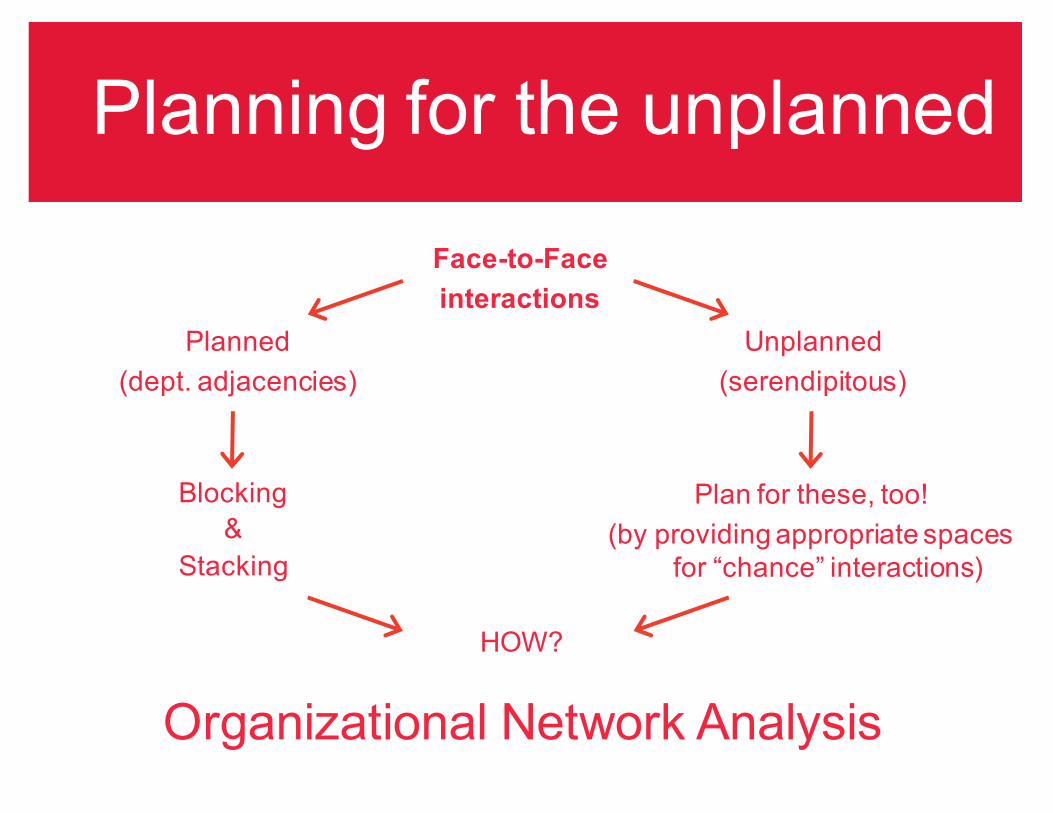
Planning for the unplanned
Face-to-Faceinteractions
Planned(dept. adjacencies)
Unplanned(serendipitous)
Blocking&
Stacking
Plan for these, too!(by providing appropriate spaces
for “chance” interactions)
HOW?
Organizational Network Analysis

Social Capital
Social CapitalPhysical Capital Cultural / Human Capital
Just as your Mac or your university education can increase your productivity, so do your social contacts – people you interact with!
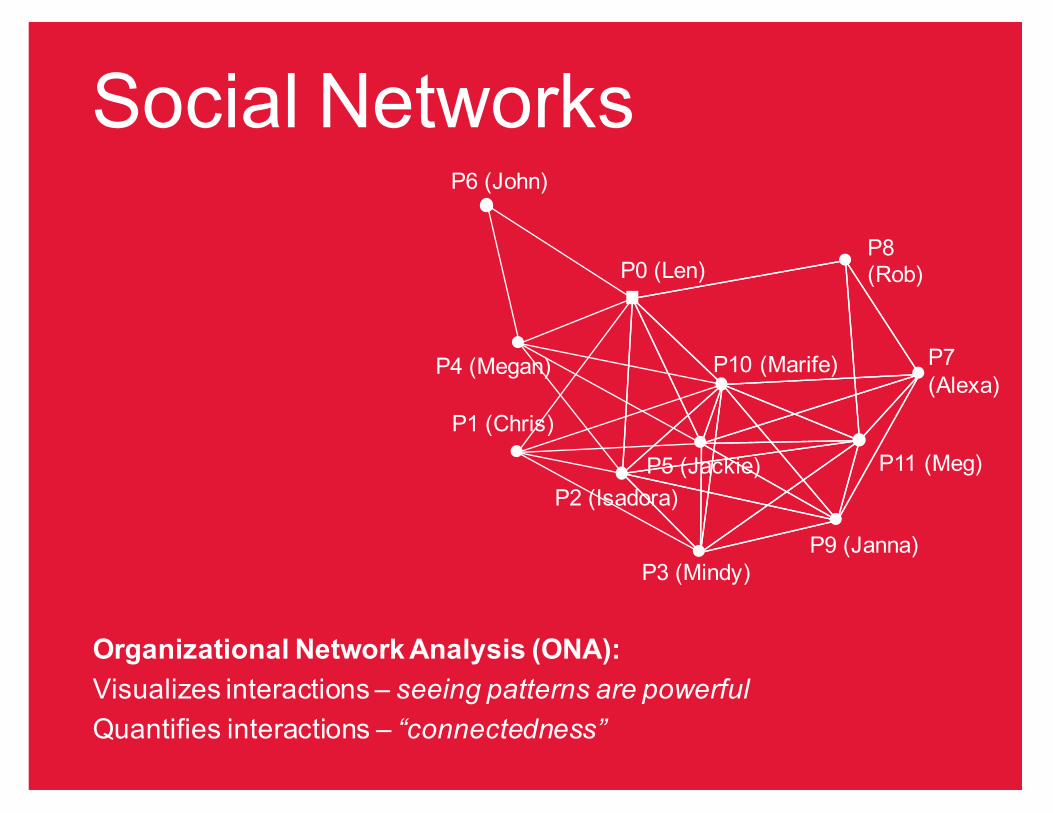
P0 (Len)
P1 (Chris)
P10 (Marife)
P11 (Meg)P2 (Isadora)
P3 (Mindy)
P4 (Megan)
P5 (Jackie)
P6 (John)
P7 (Alexa)
P8 (Rob)
P9 (Janna)
Organizational Network Analysis (ONA):Visualizes interactions – seeing patterns are powerfulQuantifies interactions – “connectedness”
Social Networks

Measuring Face-to-Face Interaction at the Workplace
Self-Report Surveyssubjectiveself-serving biasnon-intrusive
Observations
Using Technology
subjectiveobserver biassomewhat intrusive
objectivemore intrusivepeople adjust quickly
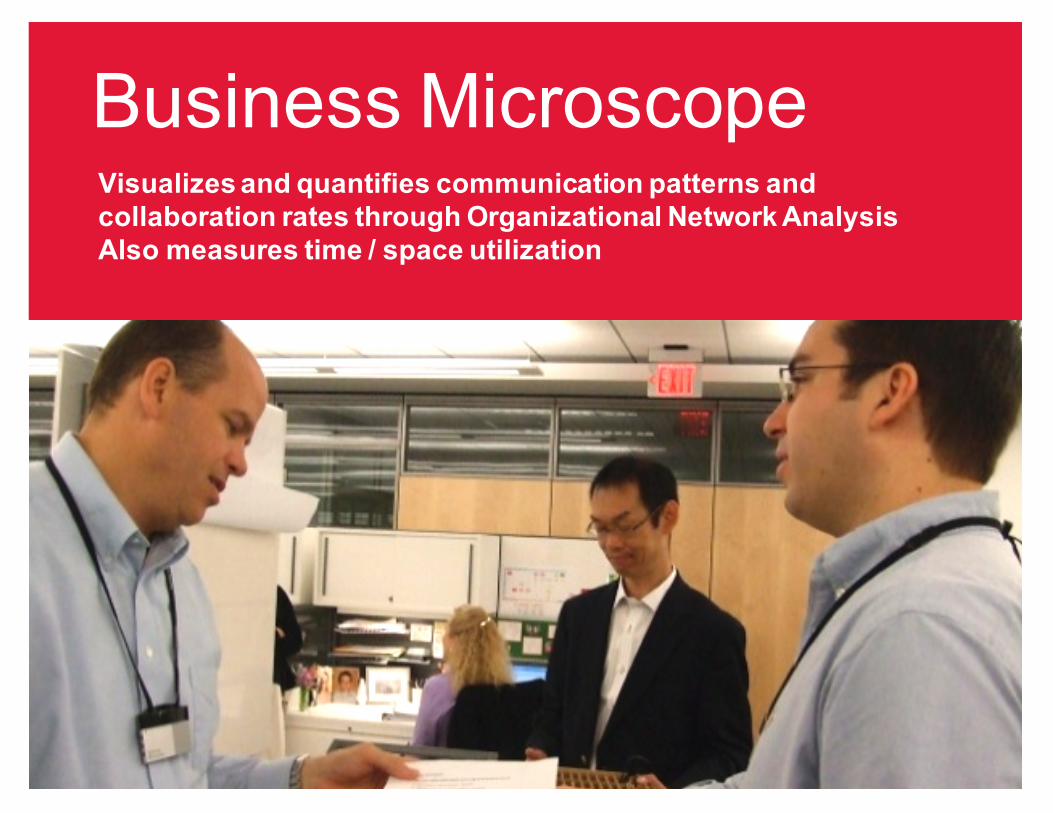
Visualizes and quantifies communication patterns and collaboration rates through Organizational Network AnalysisAlso measures time / space utilization
Business Microscope
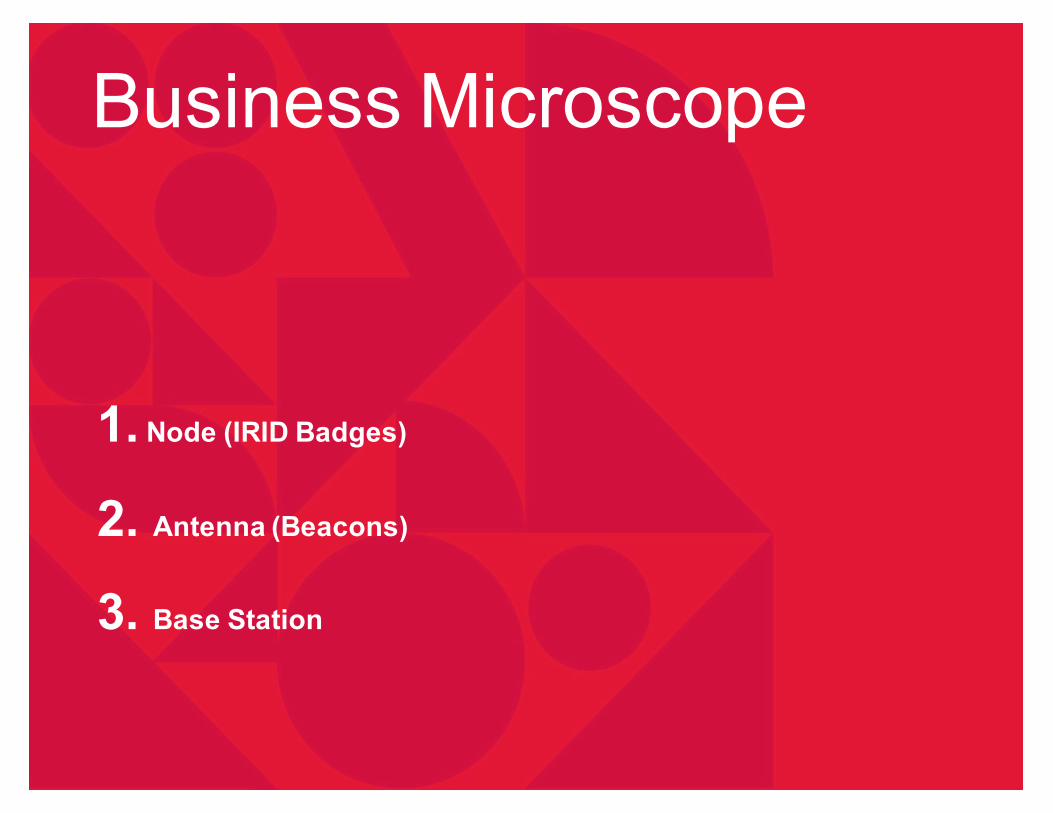
1. Node (IRID Badges)
2. Antenna (Beacons)
3. Base Station
Business Microscope
G
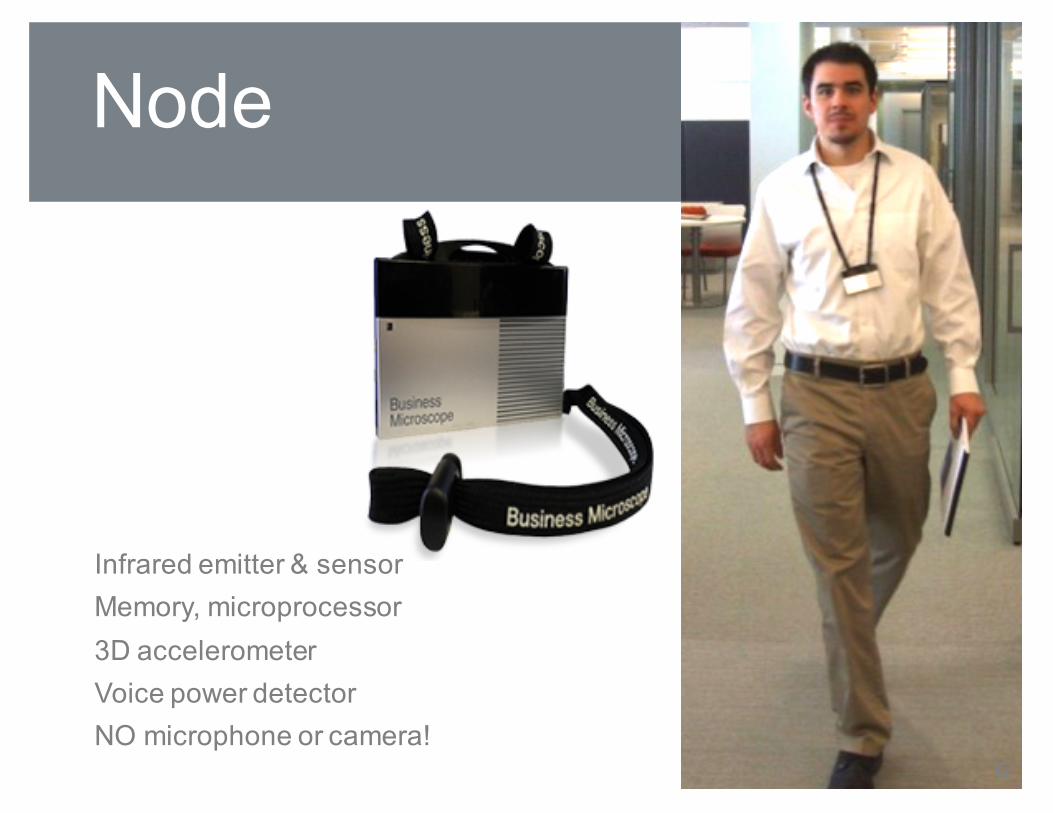
Node
Infrared emitter & sensorMemory, microprocessor3D accelerometerVoice power detectorNO microphone or camera!
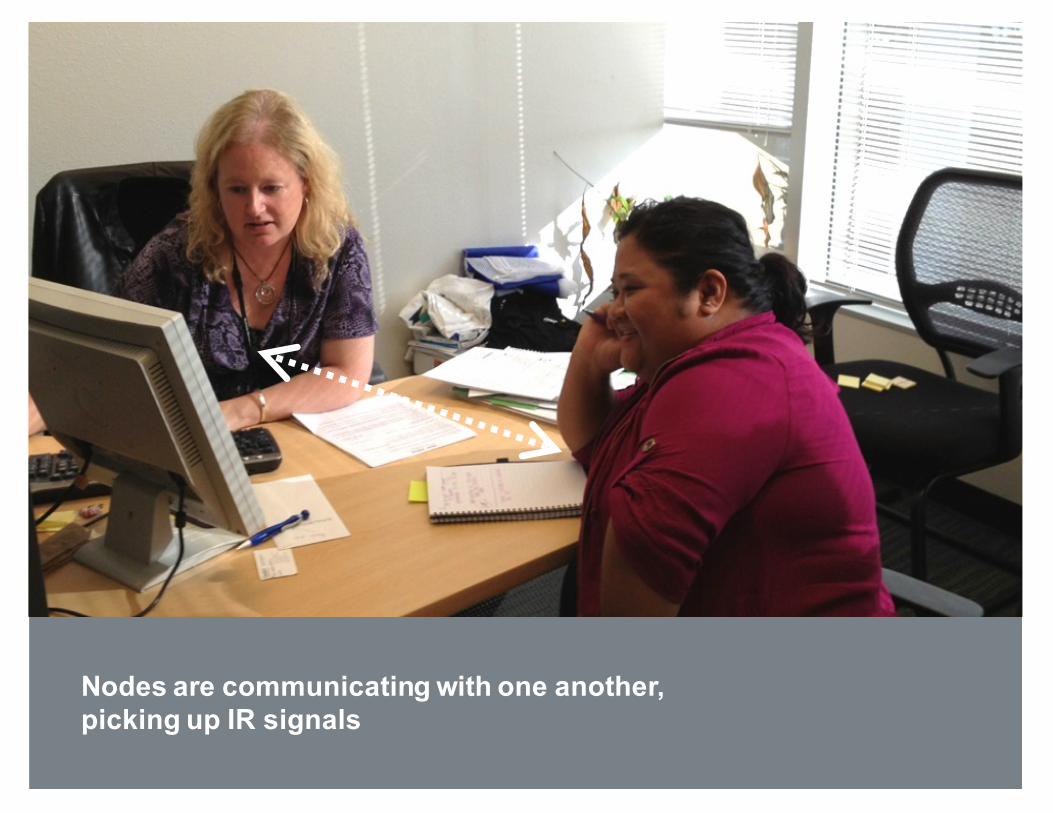
Nodes are communicating with one another, picking up IR signals
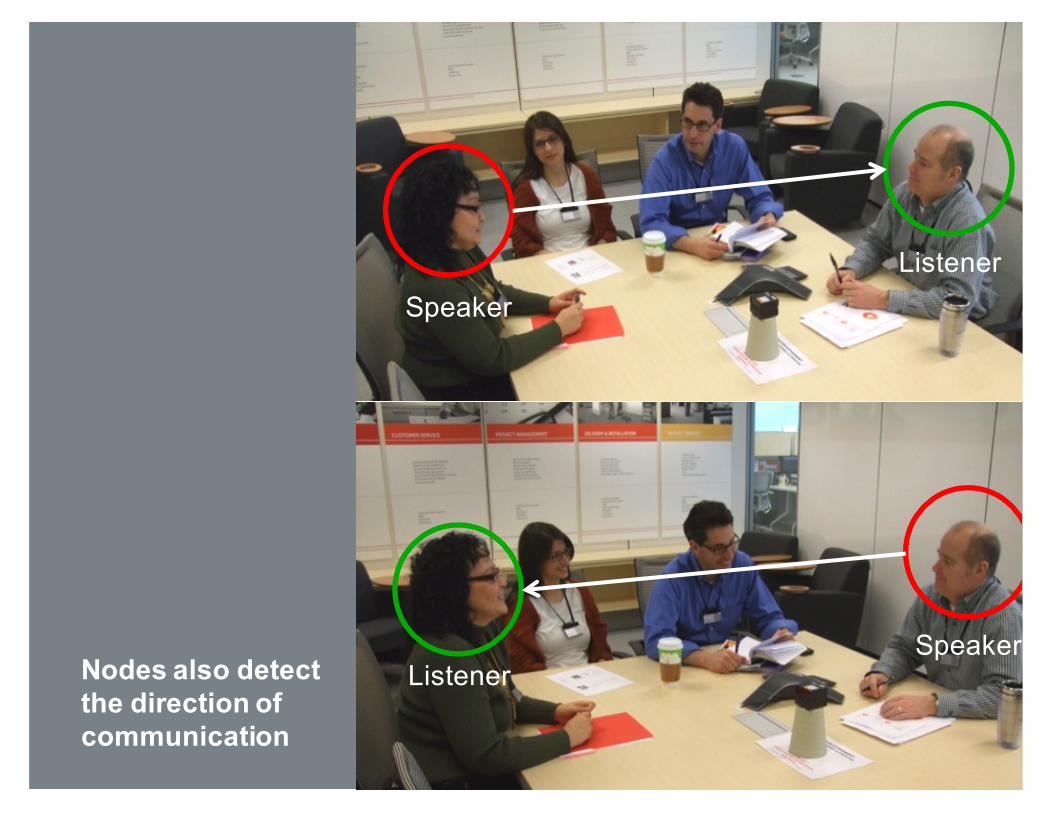
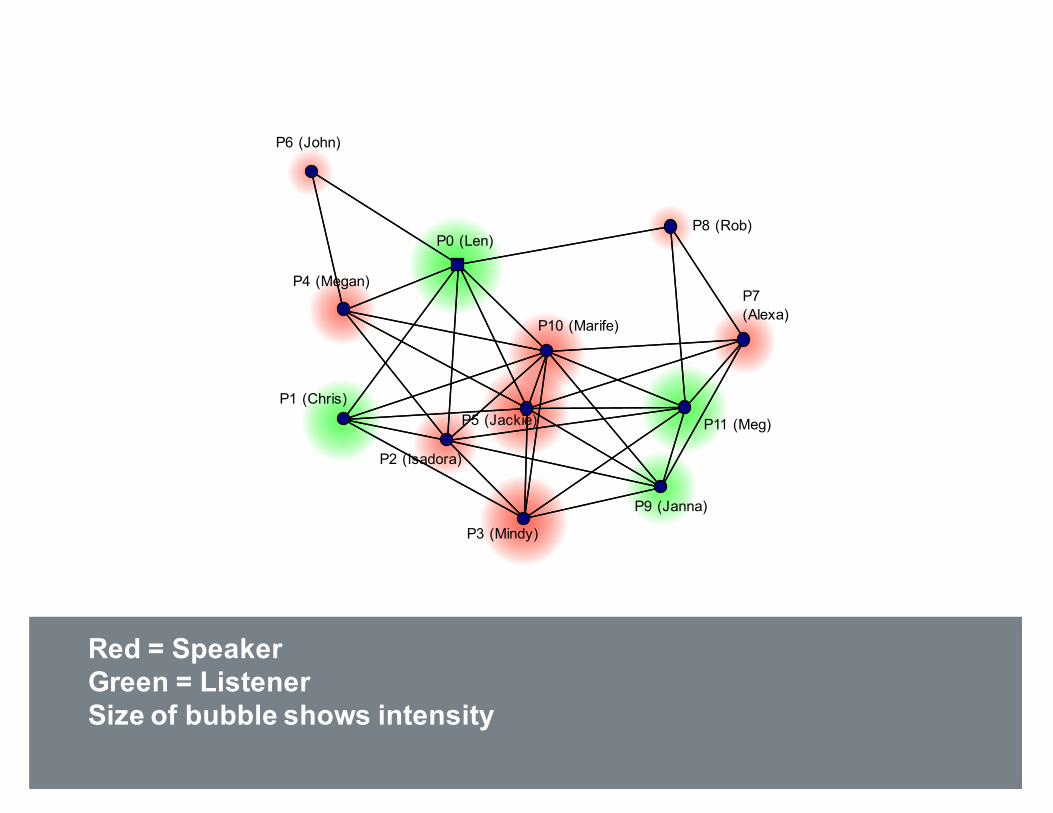
SpeakerListener
Nodes also detect the direction of communication
ListenerSpeaker
P0 (Len)
P1 (Chris)
P10 (Marife)
P11 (Meg)
P2 (Isadora)
P3 (Mindy)
P4 (Megan)
P5 (Jackie)
P6 (John)
P7 (Alexa)
P8 (Rob)
P9 (Janna)
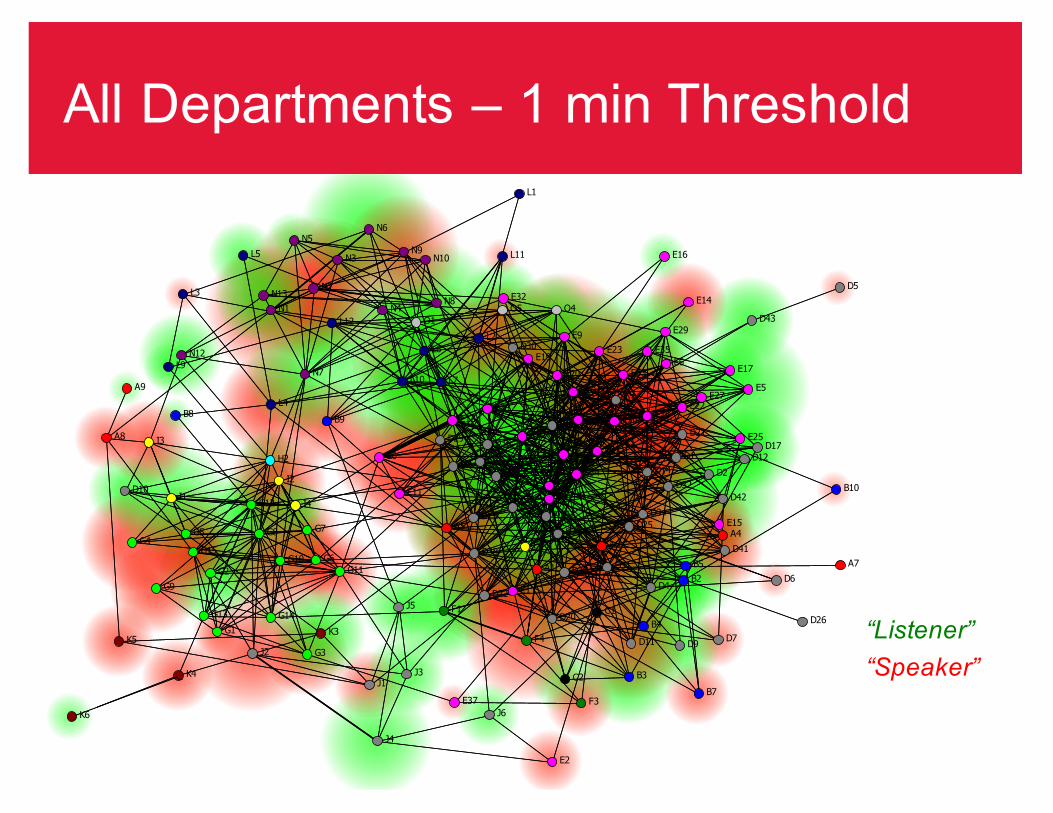
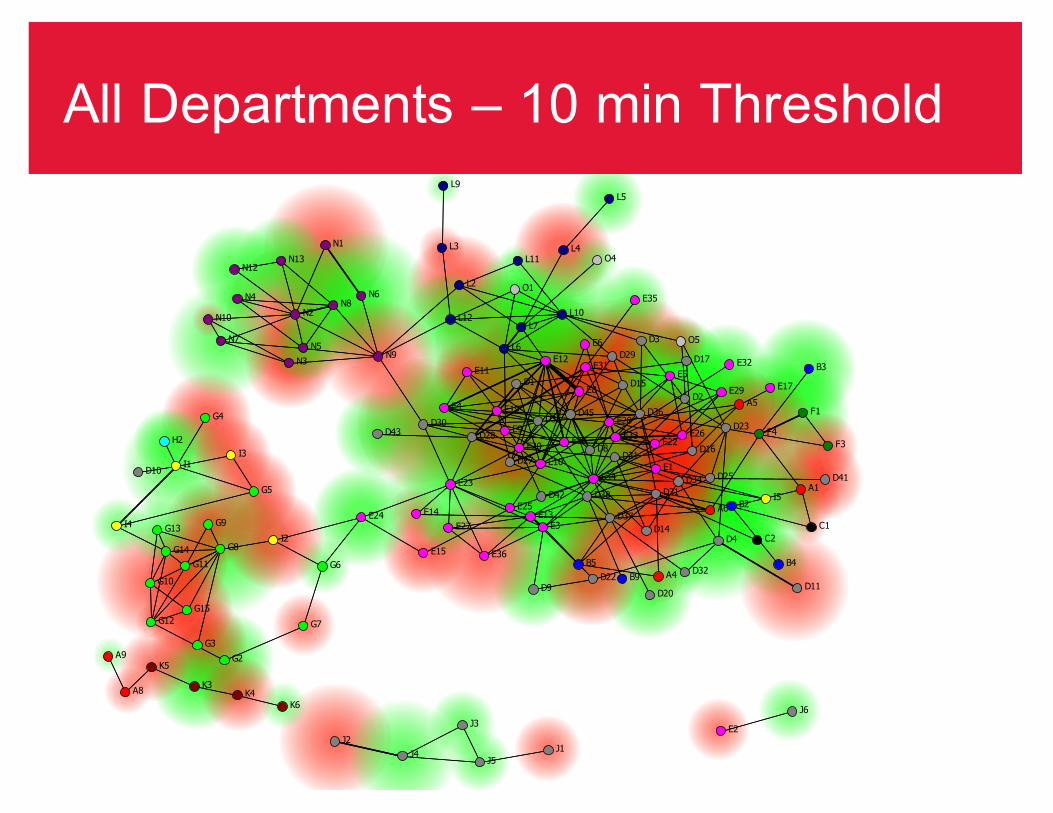
Red = SpeakerGreen = ListenerSize of bubble shows intensity
Direction of communication
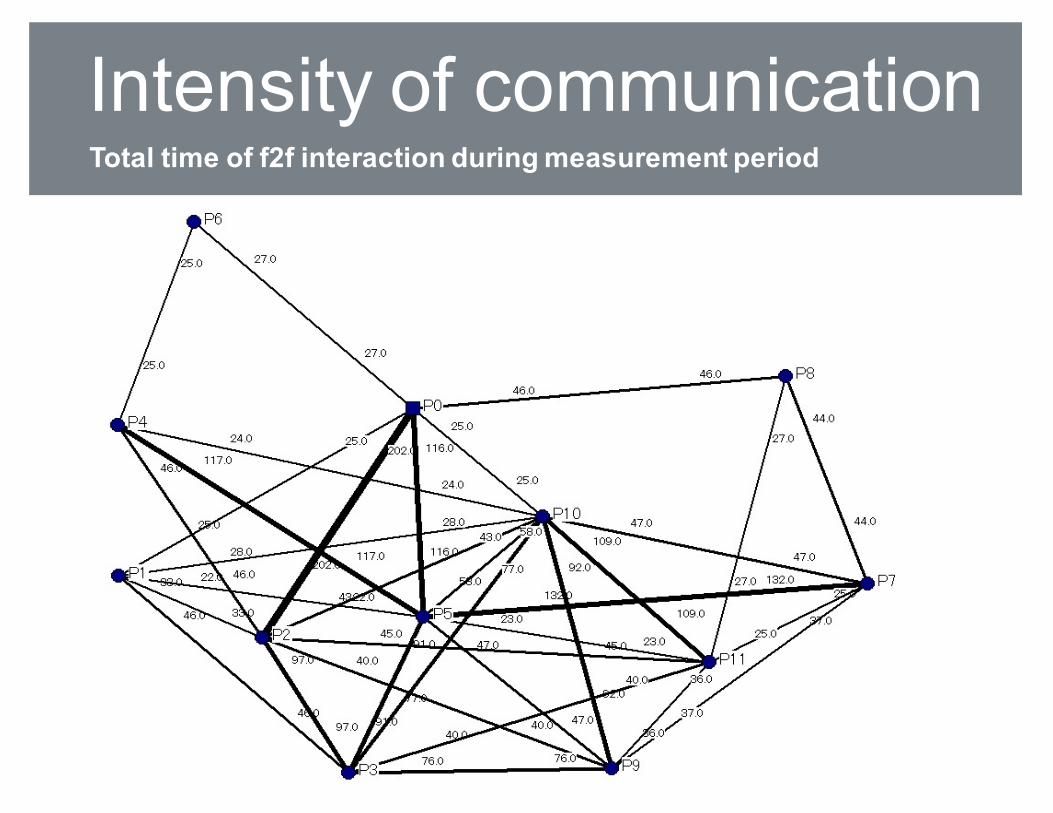
Intensity of communicationTotal time of f2f interaction during measurement period
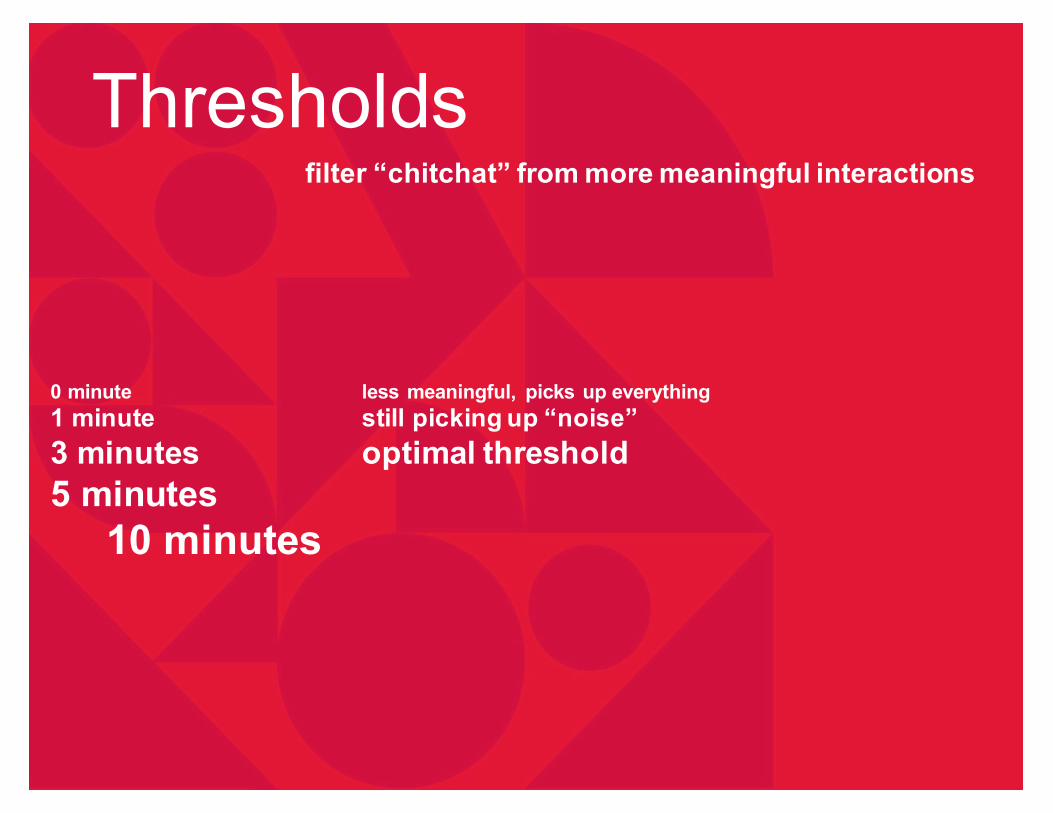
0 minute1 minute3 minutes5 minutes
10 minutes
filter “chitchat” from more meaningful interactions
Thresholds
less meaningful, picks up everythingstill picking up “noise”optimal threshold
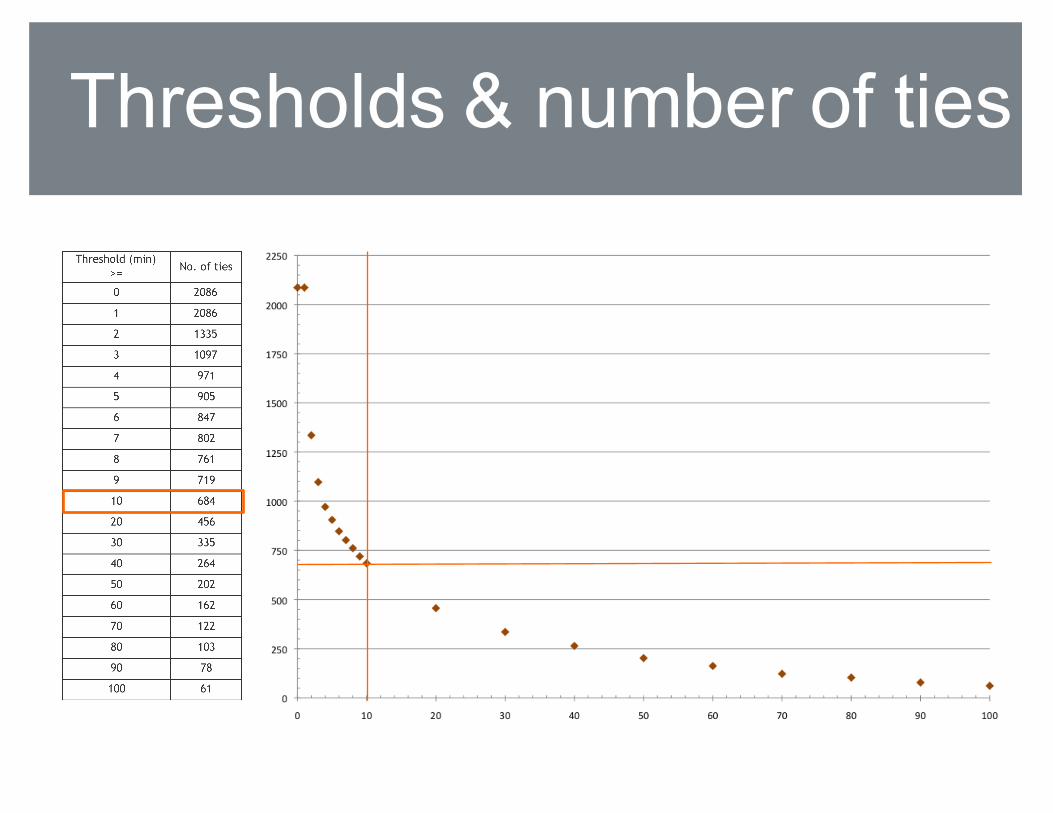
Thresholds & number of ties
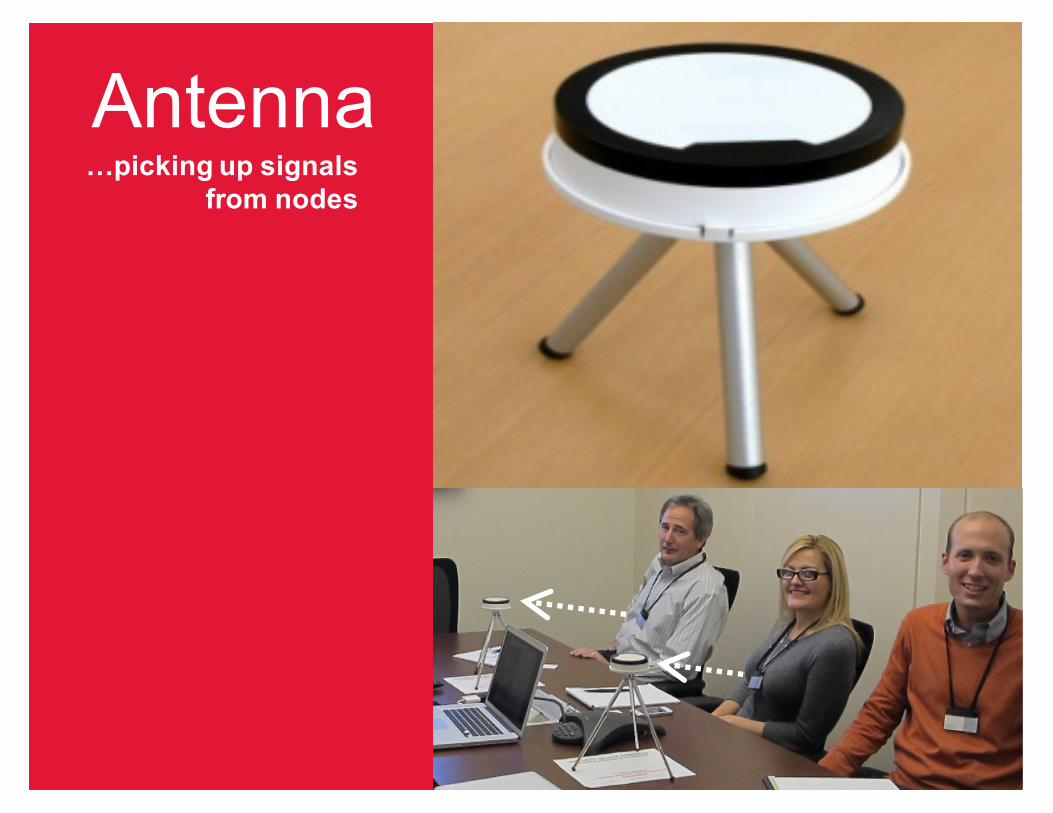
…picking up signals from nodes
Antenna
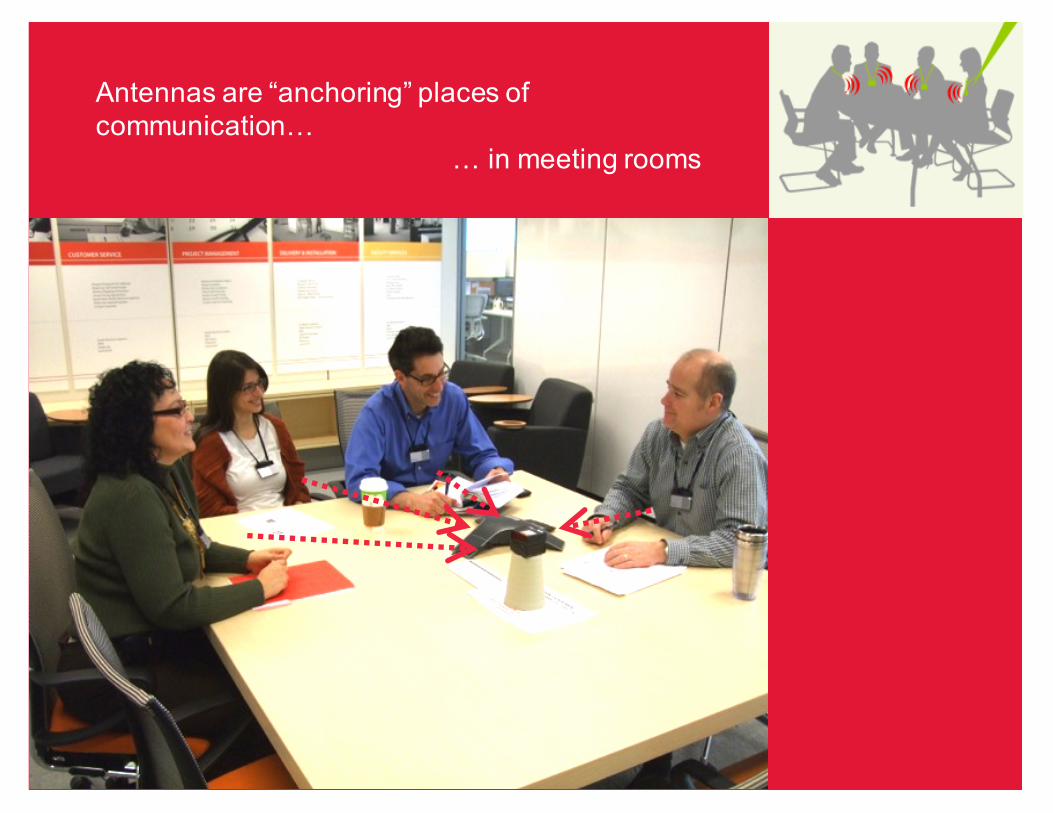
Antennas are “anchoring” places of communication…
… in meeting rooms
Antennas are “anchoring” places of communication…
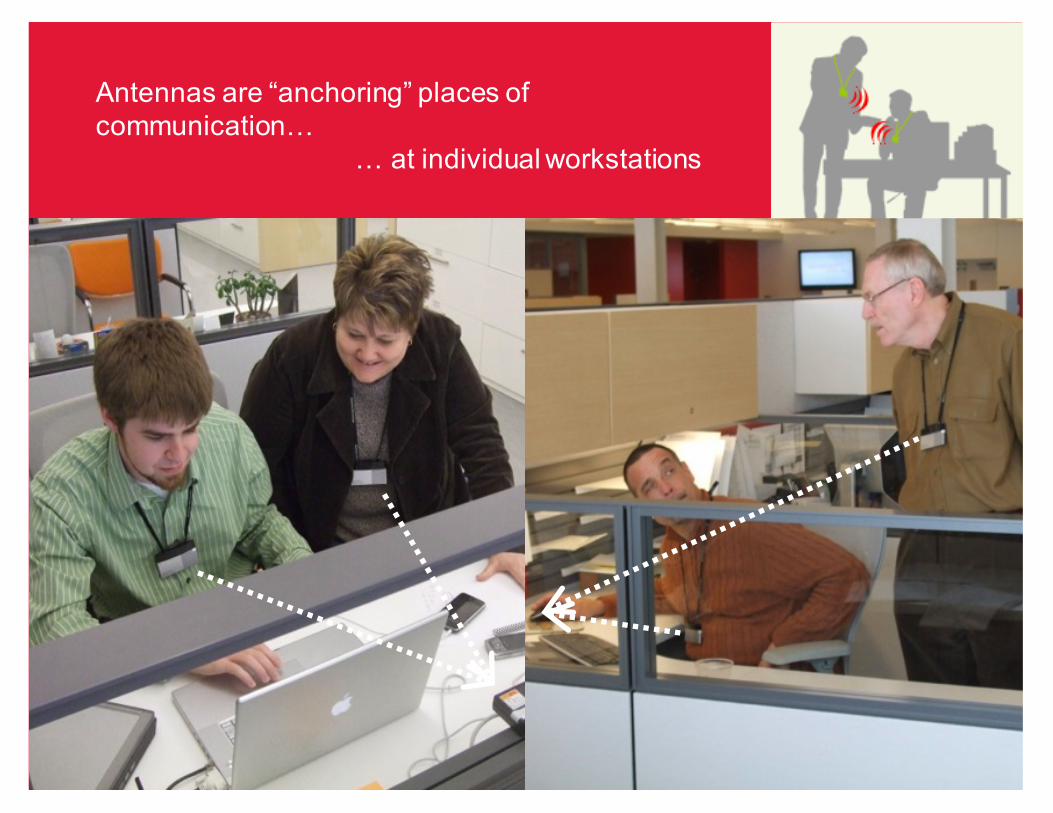
… at individual workstations
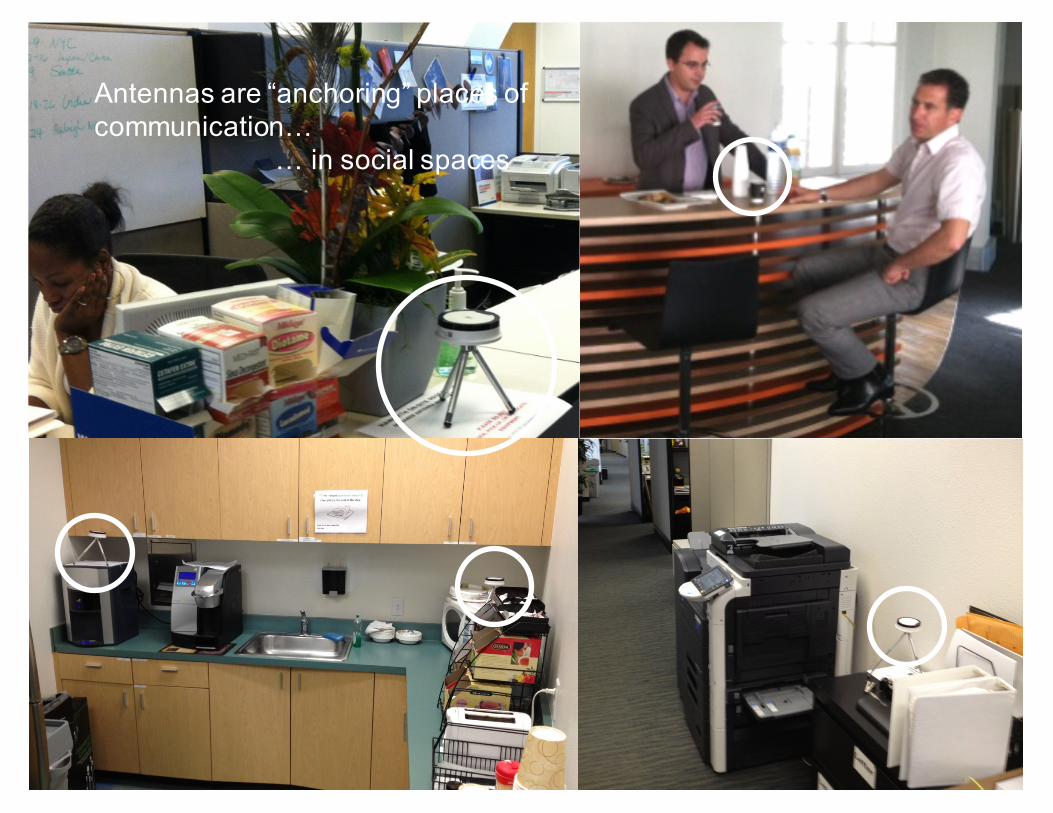
Antennas are “anchoring” places of communication…
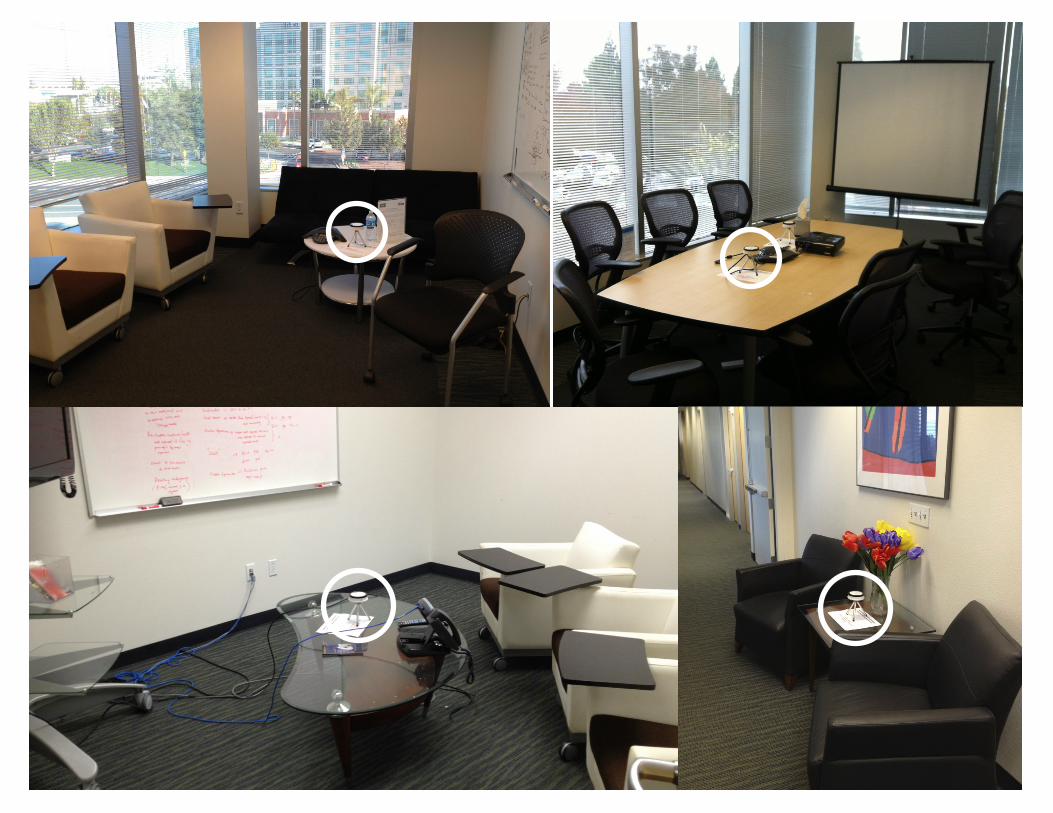
… in social spaces
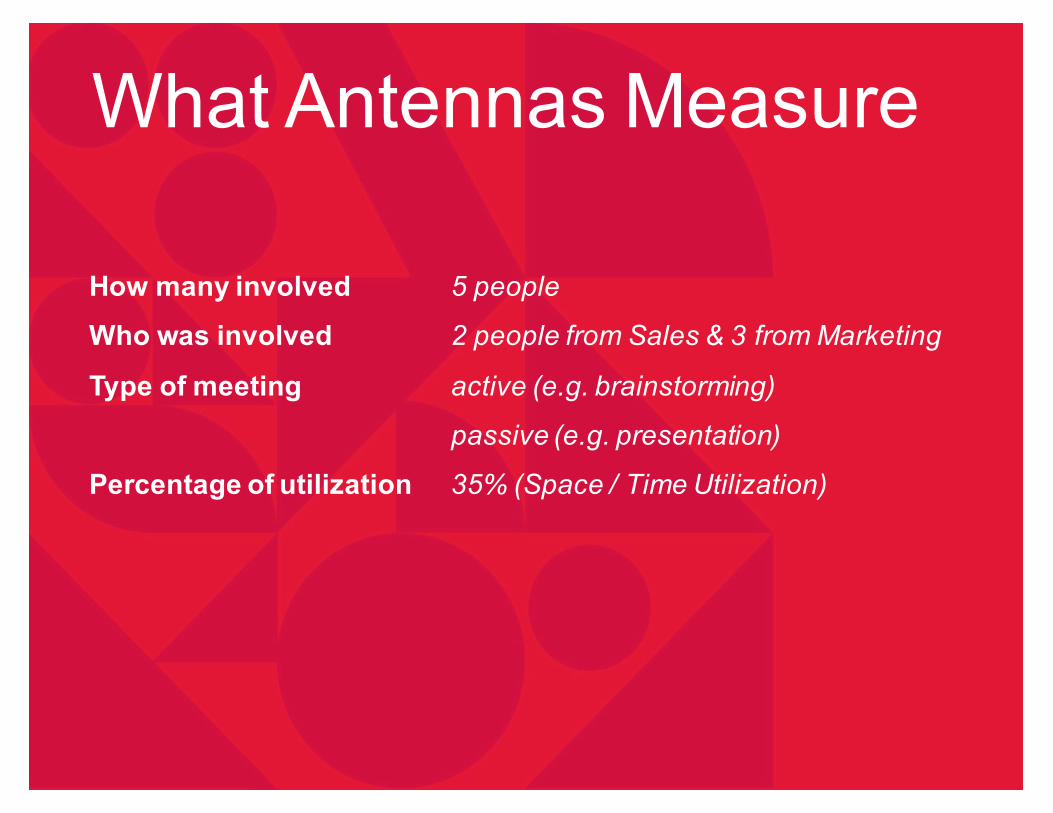
What Antennas Measure
How many involved 5 people
Who was involved 2 people from Sales & 3 from Marketing
Type of meeting active (e.g. brainstorming)
passive (e.g. presentation)
Percentage of utilization 35% (Space / Time Utilization)
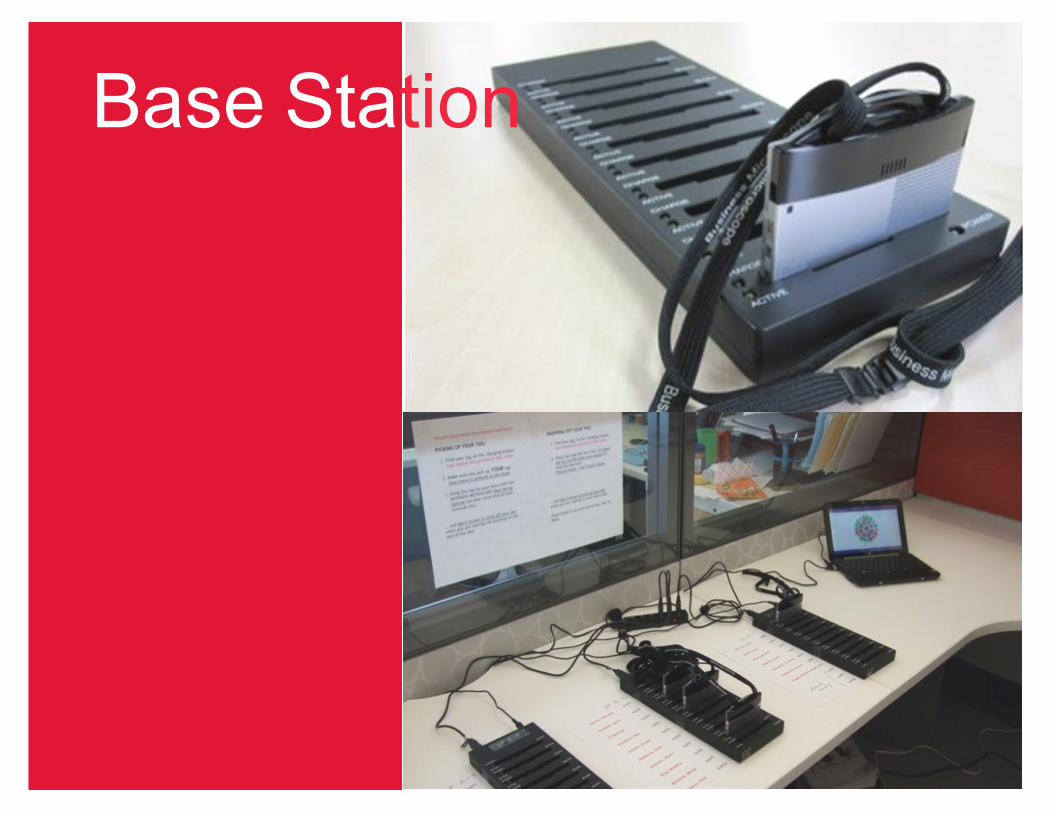
Base Station
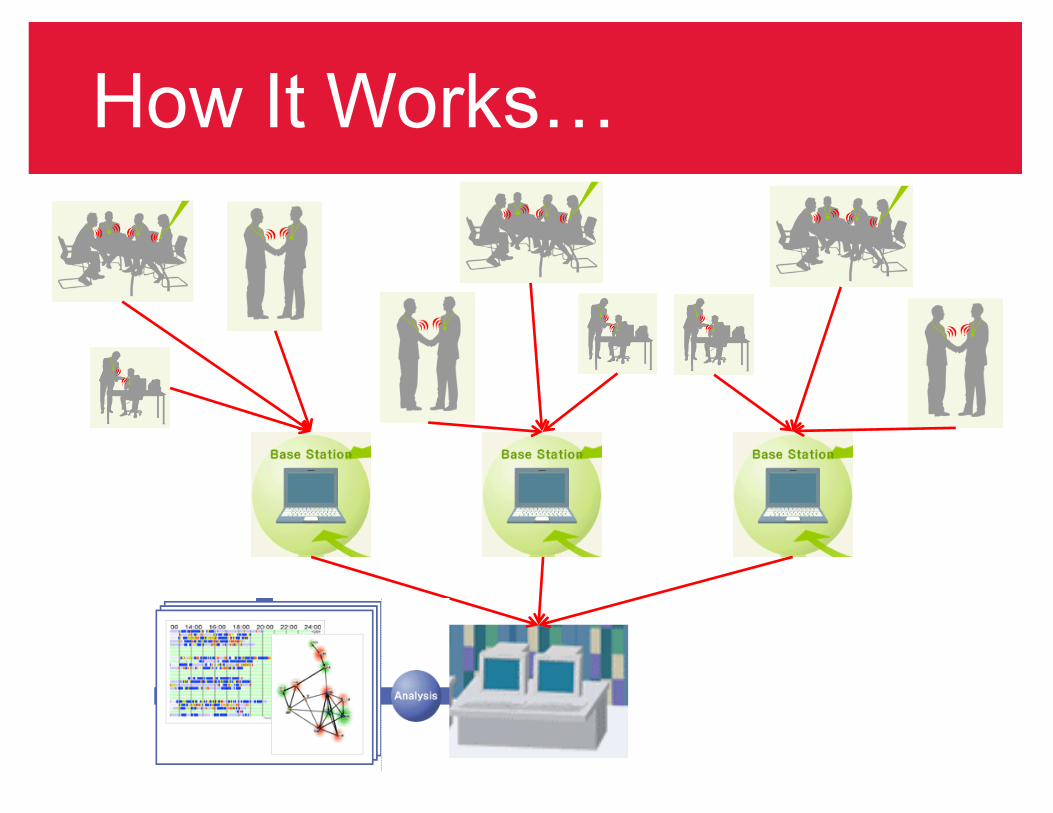
How It Works…
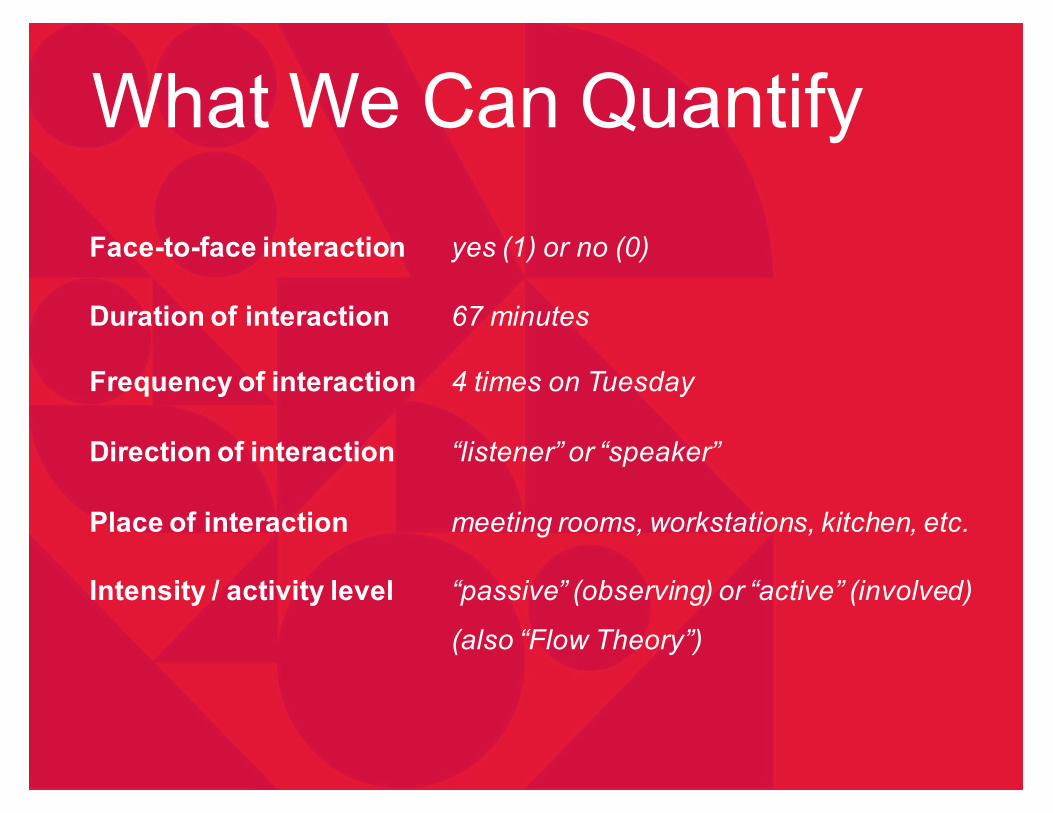
Face-to-face interaction yes (1) or no (0)
What We Can Quantify
Duration of interaction 67 minutes
Frequency of interaction 4 times on Tuesday
Direction of interaction “listener” or “speaker”
Place of interaction meeting rooms, workstations, kitchen, etc.
Intensity / activity level “passive” (observing) or “active” (involved)
(also “Flow Theory”)
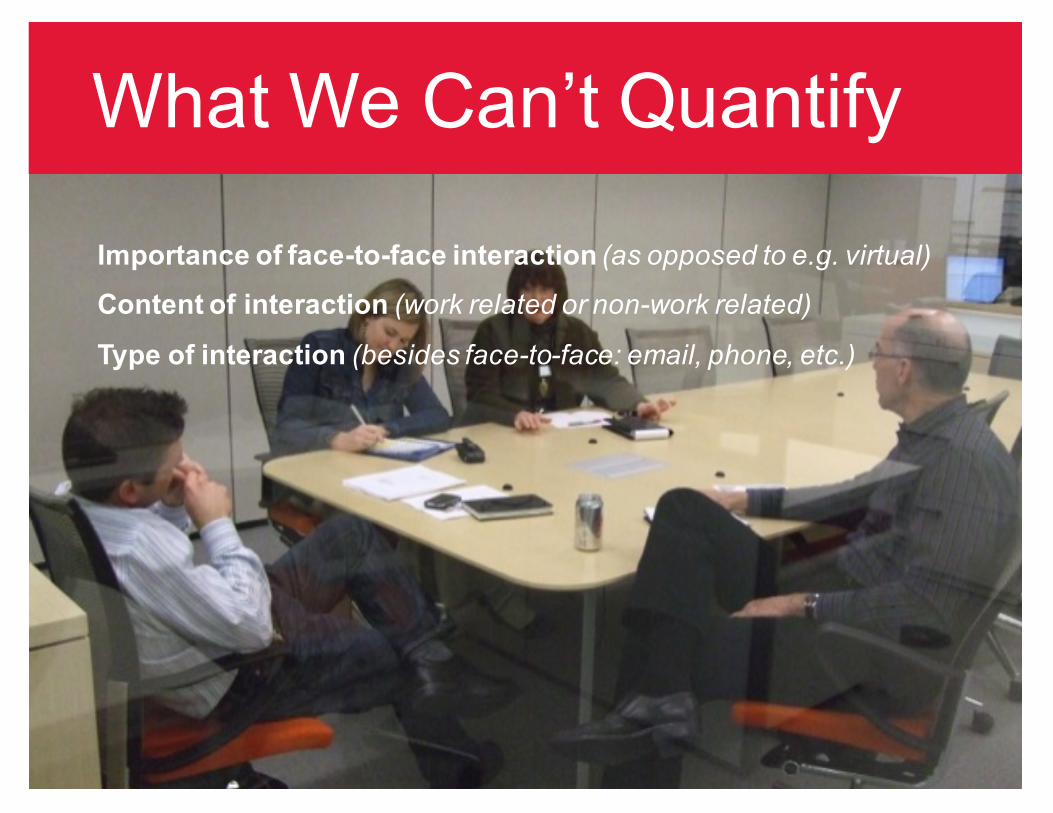
What We Can’t Quantify
Importance of face-to-face interaction (as opposed to e.g. virtual)
Content of interaction (work related or non-work related)
Type of interaction (besides face-to-face: email, phone, etc.)
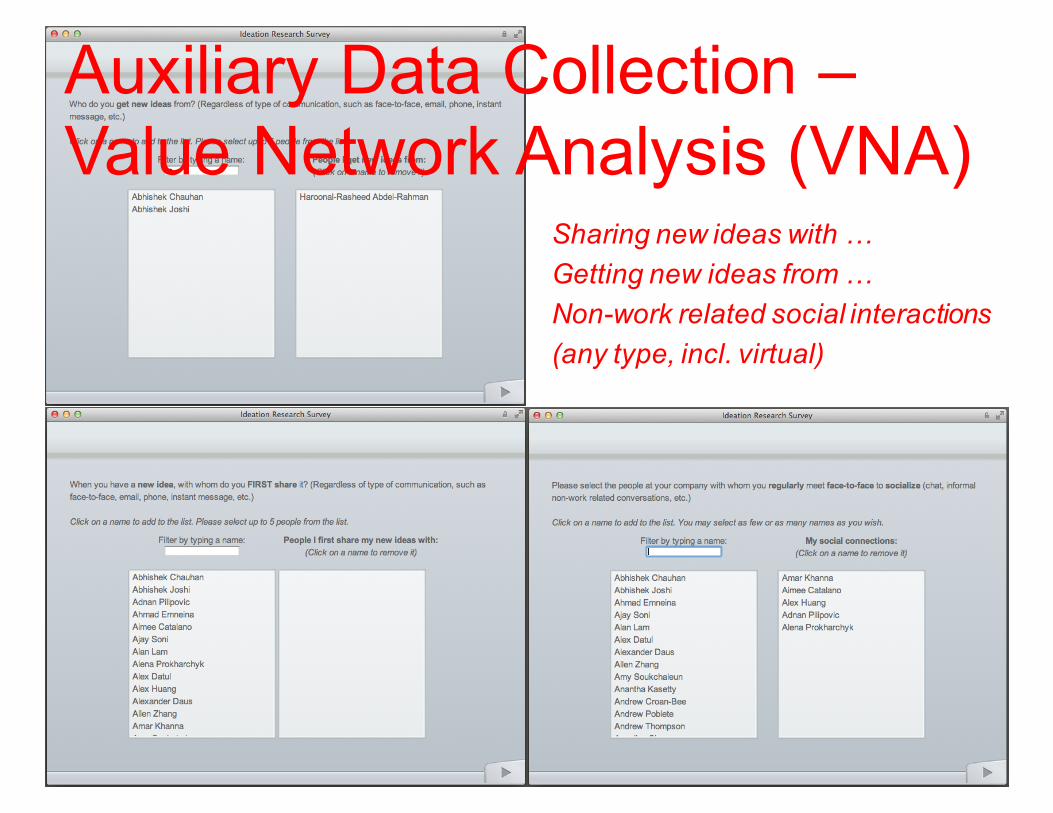
Sharing new ideas with …Getting new ideas from …Non-work related social interactions (any type, incl. virtual)
Auxiliary Data Collection –Value Network Analysis (VNA)
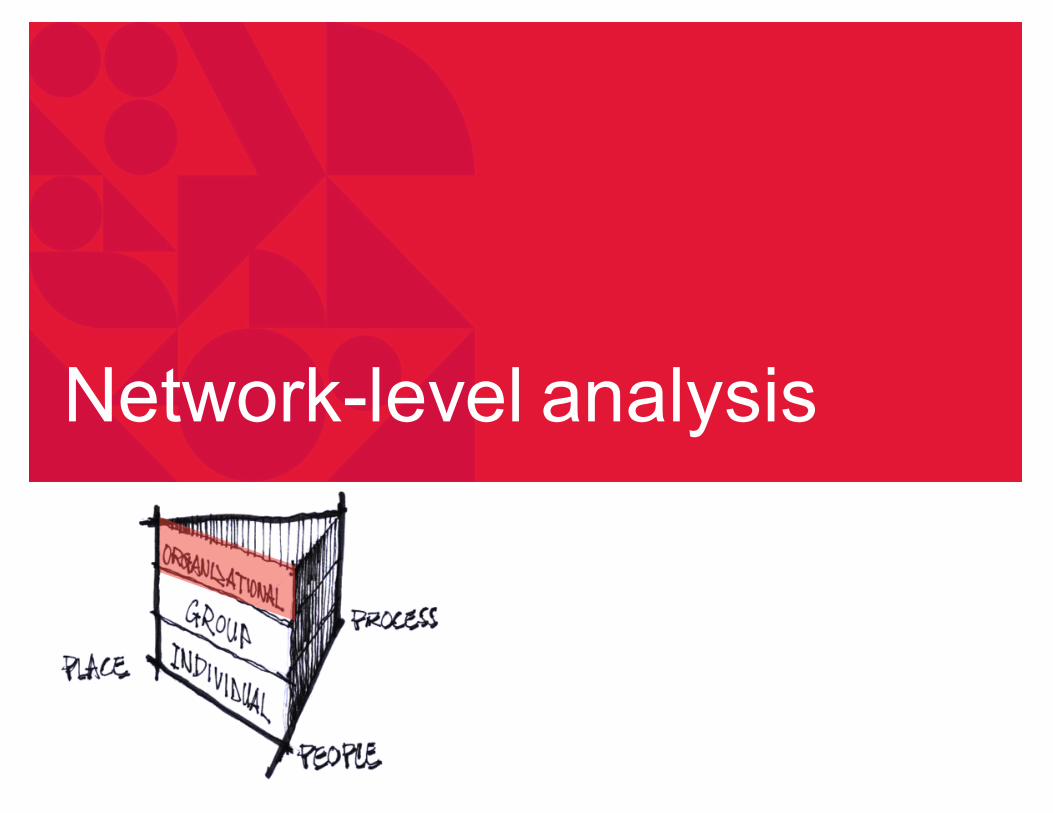
Network-level analysis
A1
A2
A3
A4A5
A6
A7
A8
A9
B1
B2
B3
B4
B5
B6
B7
B8 B9
B10
C1
C2
D1
D2
D3
D4
D5
D6
D7
D8
D9
D10
D11
D12
D13
D14
D15
D16
D17
D18
D19
D20
D21
D22
D23
D24
D25
D26
D27
D28D29
D30
D31
D32
D33
D34
D35
D36
D37
D38
D39
D40
D41
D42
D43
D44
D45
D46
E1
E2
E3
E4
E5
E6
E7
E8
E9
E10
E11
E12
E13
E14
E15
E16
E17
E18
E19
E20
E21
E22
E23
E24
E25
E26
E27
E28
E29
E30E31
E32
E33
E34
E35
E36
E37
F1
F2
F3
F4G1
G2
G3
G4G5
G6
G7G8
G9
G10G11
G12
G13 G14
G15
H1H2
I1
I2
I3
I4
I5
J1
J2
J3
J4
J5
J6
K1
K2
K3
K4
K5
K6
K7
L1
L2
L3
L4
L5
L6
L7
L8
L9L10
L11
L12
M1
M2
N1
N2
N3
N4
N5N6
N7
N8
N9N10
N11
N12
N13
O1
O2
O3
O4O5
All Departments – 1 min Threshold
“Listener”“Speaker”
A1
A2
A3
A4
A5
A6
A7
A8
A9
B1
B2
B3
B4B5
B6
B7
B8
B9
B10
C1C2
D1
D2
D3
D4
D5
D6
D7
D8
D9
D10
D11
D12
D13
D14
D15
D16
D17
D18
D19
D20
D21
D22
D23D24
D25
D26
D27
D28
D29
D30
D31
D32
D33
D34
D35D36
D37
D38
D39
D40D41
D42
D43
D44
D45
D46
E1
E2
E3
E4
E5
E6
E7
E8
E9
E10
E11E12
E13E14
E15
E16
E17
E18
E19
E20
E21
E22
E23
E24E25
E26
E27
E28
E29
E30
E31 E32
E33
E34
E35
E36
E37
F1
F2
F3F4
G1
G2
G3
G4
G5
G6
G7
G8
G9
G10
G11
G12
G13
G14
G15
H1
H2
I1
I2
I3
I4
I5
J1J2
J3
J4J5
J6
K1
K2
K3K4
K5
K6
K7
L1
L2
L3 L4
L5
L6
L7
L8
L9
L10
L11
L12
M1
M2
N1
N2
N3
N4
N5
N6
N7
N8
N9
N10
N11
N12N13
O1
O2
O3
O4
O5
All Departments – 10 min Threshold
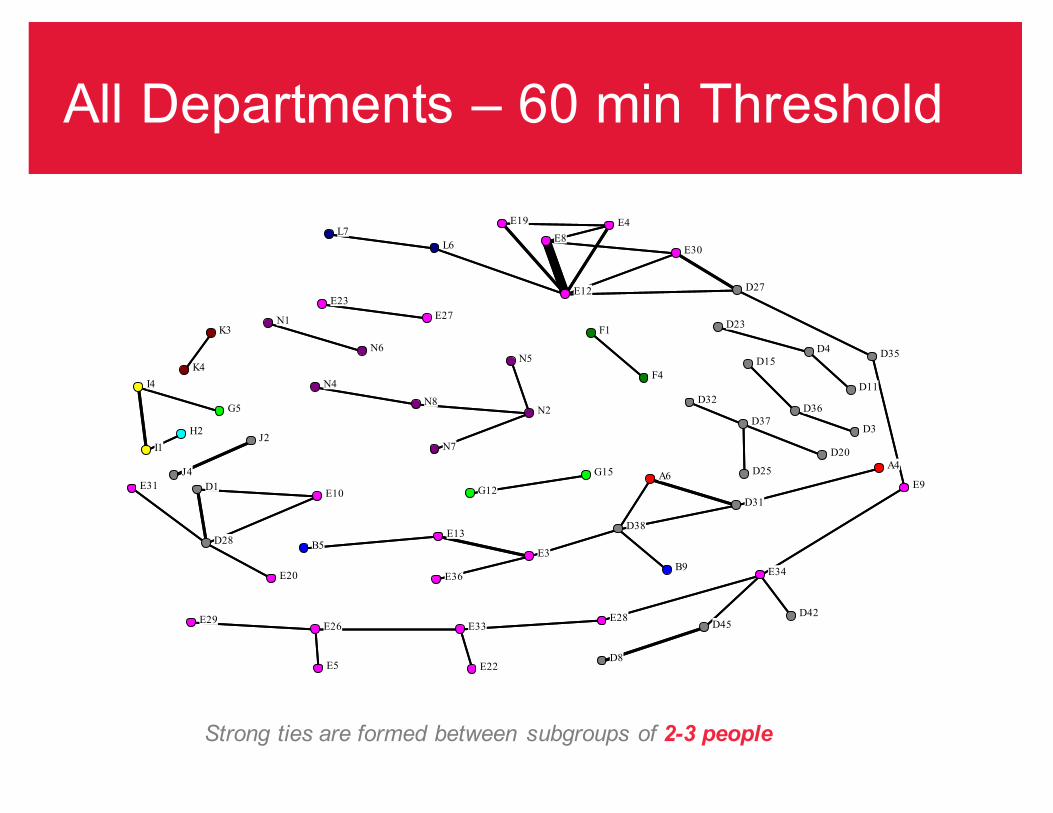
Strong ties are formed between subgroups of 2-3 people
All Departments – 60 min ThresholdB3B4
B9
J4
K1
D38
B10
F4
O1D46E2
E20
L7
L8
D35
D36
J5L9F3B2E11B1
E12
B8F2D33E16A3
E19
C2
E9
C1D24
D27
D28
E1B7D29D30A2
D15
O3A1J6L4E7
D1
D2
D3
E8
E23
E24E25
E26
D37
A6
E27
D39D40
D32
D34E17E18
E36
E21D6
E22
A5D22
D23
E10
A4D25
D26
E13
E14
D31
E15O2
D8
L1L2
J2
E4
L3E37M1D13
E30
O5E32L10D43
F1
D45
L11L12
B5
J3B6D18L5D19D5M2
L6
O4
I1
N1
A8G1G2G10N13
N2
G3G4G8
N5
K7
H2
N11J1G14
N6
N7
G15
G12
G7A7N3A9G13K5
I4 N4
D41
E28E29
E31
D42
D44
E33
D7
E34
E35
N8
G9D10K6N9N10D9
E3
I5
E5
H1I3
G5
I2G11K2G6
K3
N12
K4
D11
D12D14D16E6D17
D4
D20
D21
“Ego”-level analysis
A1
A2
A3
A4A5
A6
A7A8
A9
B1
B2
B3
B4
B5
B6
B7
B8
B9
B10
C1
C2
D1
D2
D3
D4
D5
D6
D7
D8
D9
D10
D11
D12
D13
D14
D15
D16
D17
D18
D19
D20
D21
D22
D23
D24
D25
D26
D27
D28
D29
D30
D31
D32
D33
D34
D35D36
D37D38
D39
D40
D41
D42
D43
D44D45D46
E1
E2
E3
E4
E5
E6
E7
E8E9
E10
E11
E12
E13
E14
E15
E16
E17
E18
E19
E20
E21
E22
E23
E24
E25
E26
E27
E28
E29
E30
E31
E32
E33
E34
E35
E36
E37
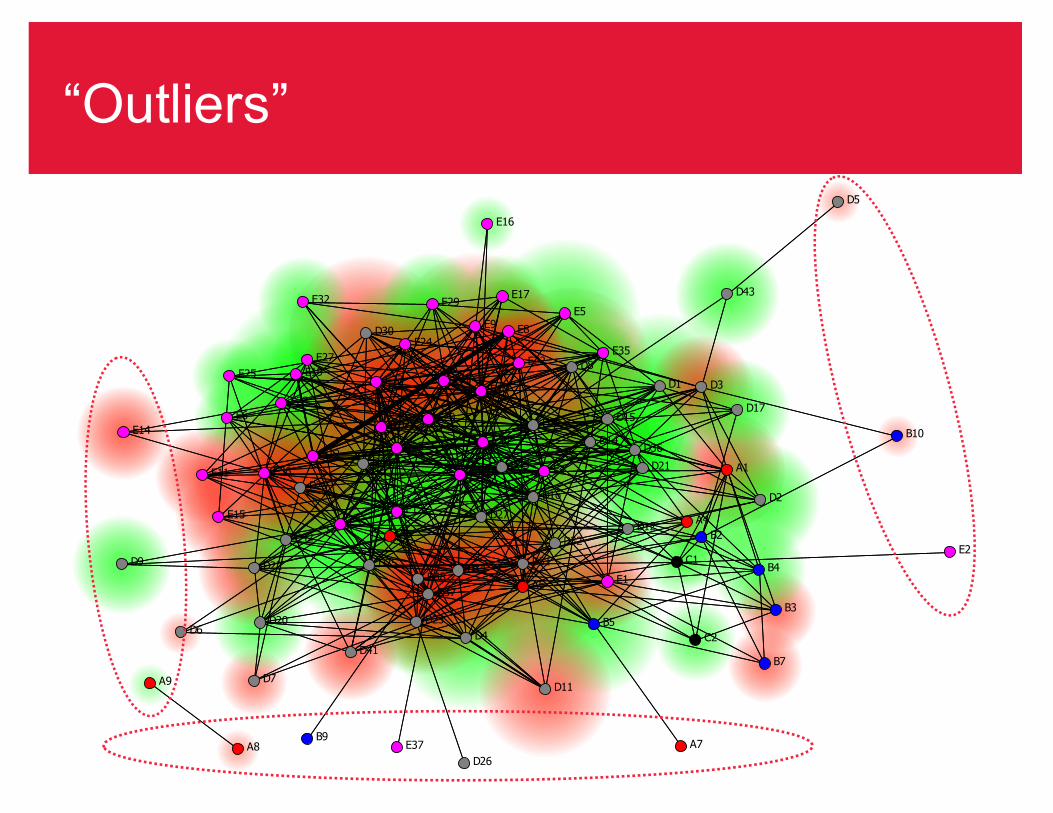
“Outliers”
D1
C1
E1
E2
B1A1
E3
Z1
A2
E6
B2
E5
C0
E7
B3
B0
E8
D2
C3
A3
A0
E9 B5
B6
B7
E10
F1
O0
L1
J1
O2
O3
O4
P1
M1
O5
N0
J2
P2
I1
P3
O6
F2
F3
N1
M2
O7
I2
N2
H1
F4
M3
P4P5
F5
P0
F6
N3
N4
K2
F8
P6
H2
P7
O8
H3
M4
P8
P9
P10
F9
F10
O9
P11
C2
B4
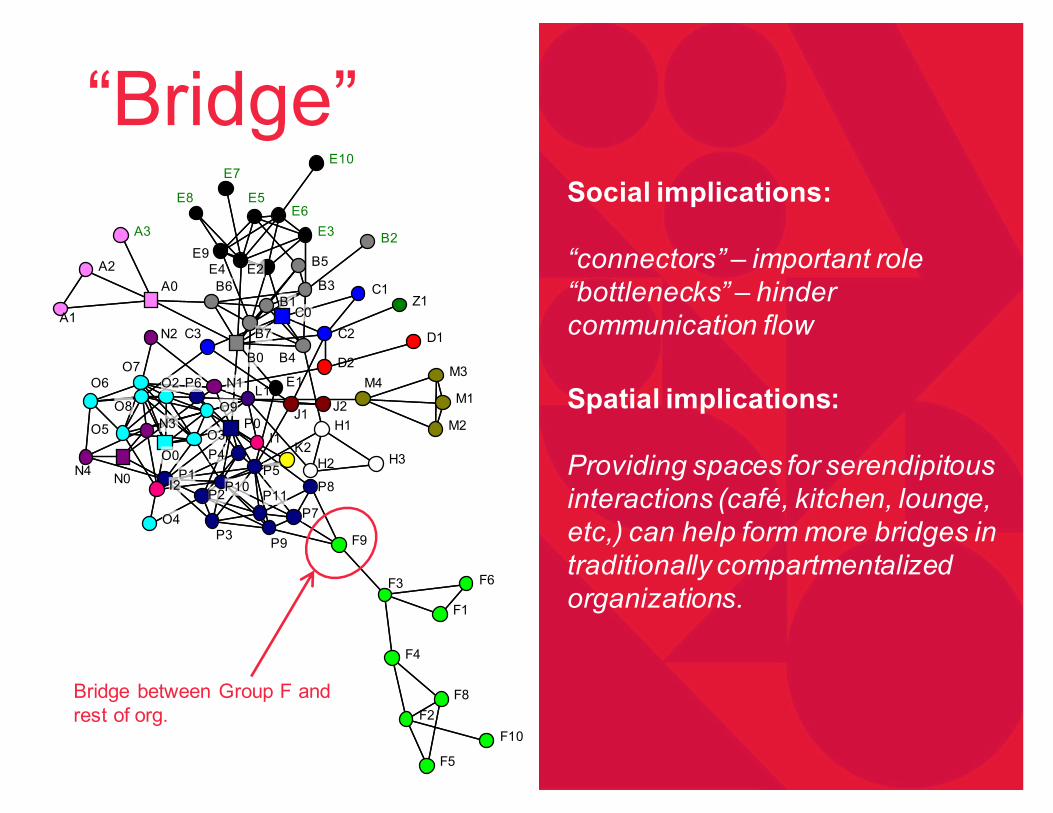
E4
Bridge between Group F and rest of org.
Social implications:
“connectors” – important role“bottlenecks” – hinder communication flow
Spatial implications:
Providing spaces for serendipitous interactions (café, kitchen, lounge, etc,) can help form more bridges in traditionally compartmentalized organizations.
“Bridge”
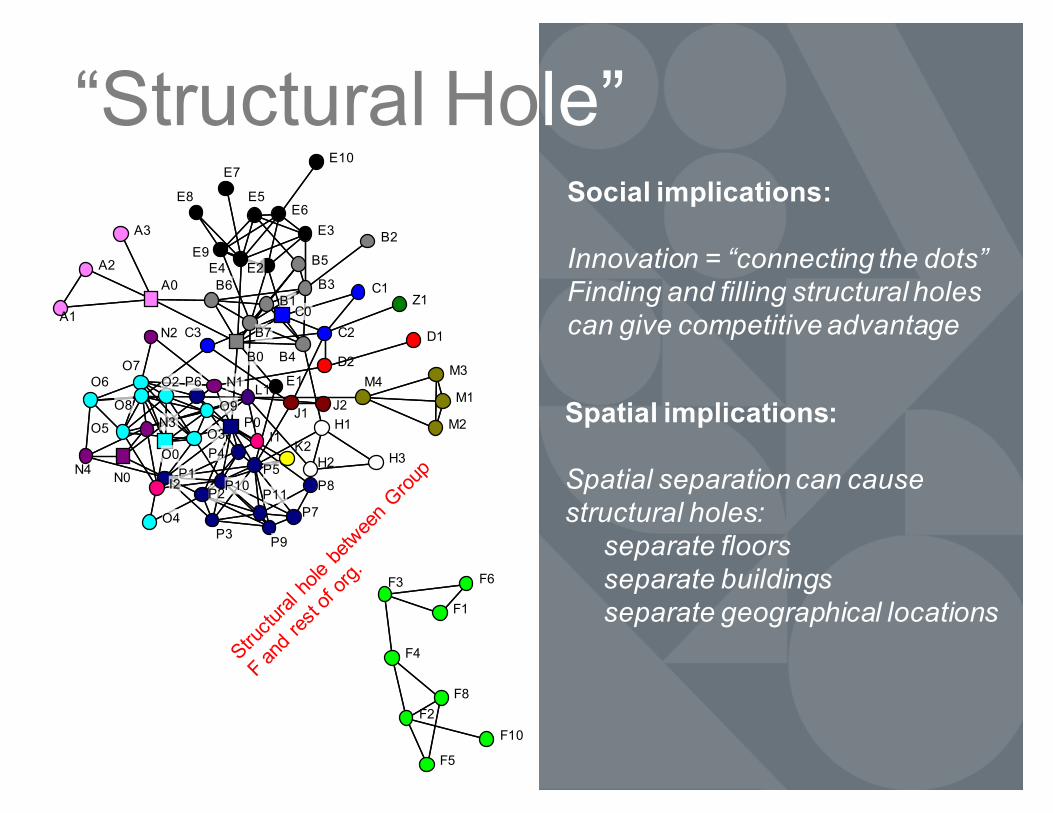
D1
C1
E1
E2
B1A1
E3
Z1
A2
E6
B2
E5
C0
E7
B3
B0
E8
D2
C3
A3
A0
E9 B5
B6
B7
E10
F1
O0
L1
J1
O2
O3
O4
P1
M1
O5
N0
J2
P2
I1
P3
O6
F2
F3
N1
M2
O7
I2
N2
H1
F4
M3
P4P5
F5
P0
F6
N3
N4
K2
F8
P6
H2
P7
O8
H3
M4
P8
P9
P10
F10
O9
P11
C2
B4
E4
Social implications:
Innovation = “connecting the dots” Finding and filling structural holes can give competitive advantage
Spatial implications:
Spatial separation can cause structural holes:
separate floorsseparate buildingsseparate geographical locations
“Structural Hole”
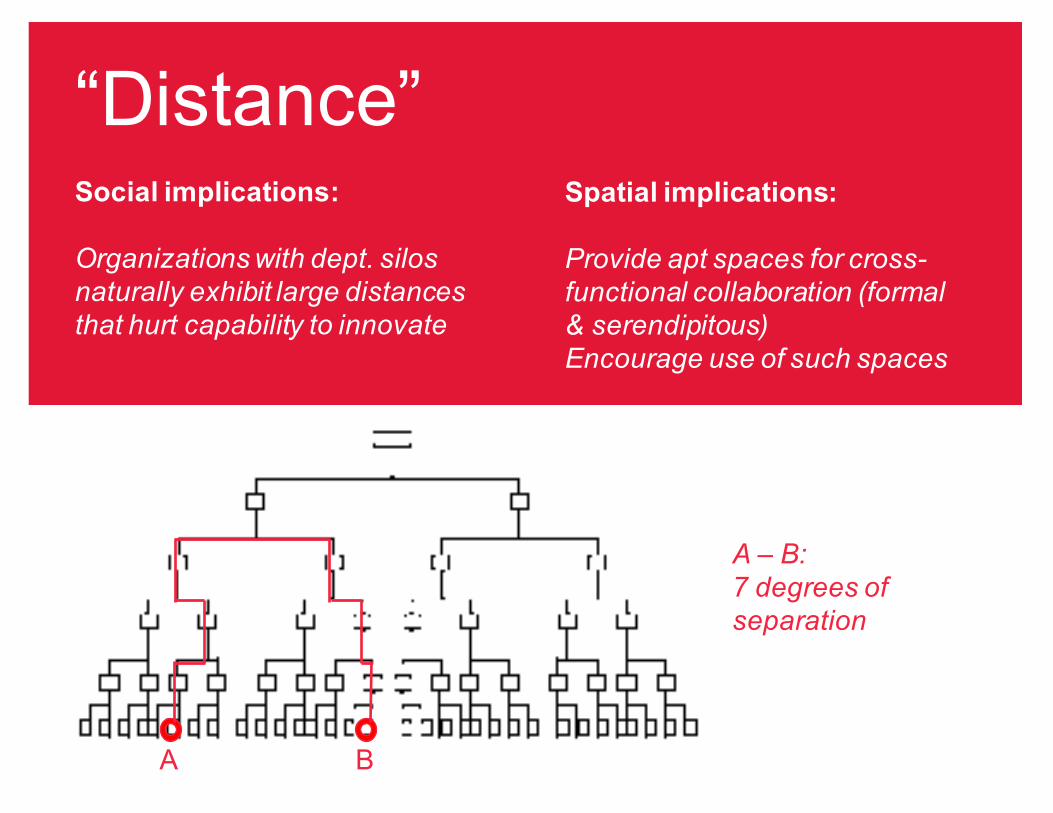
Social implications:
Organizations with dept. silos naturally exhibit large distances that hurt capability to innovate
Spatial implications:
Provide apt spaces for cross-functional collaboration (formal & serendipitous)Encourage use of such spaces
A – B:7 degrees of separation
A B
“Distance”
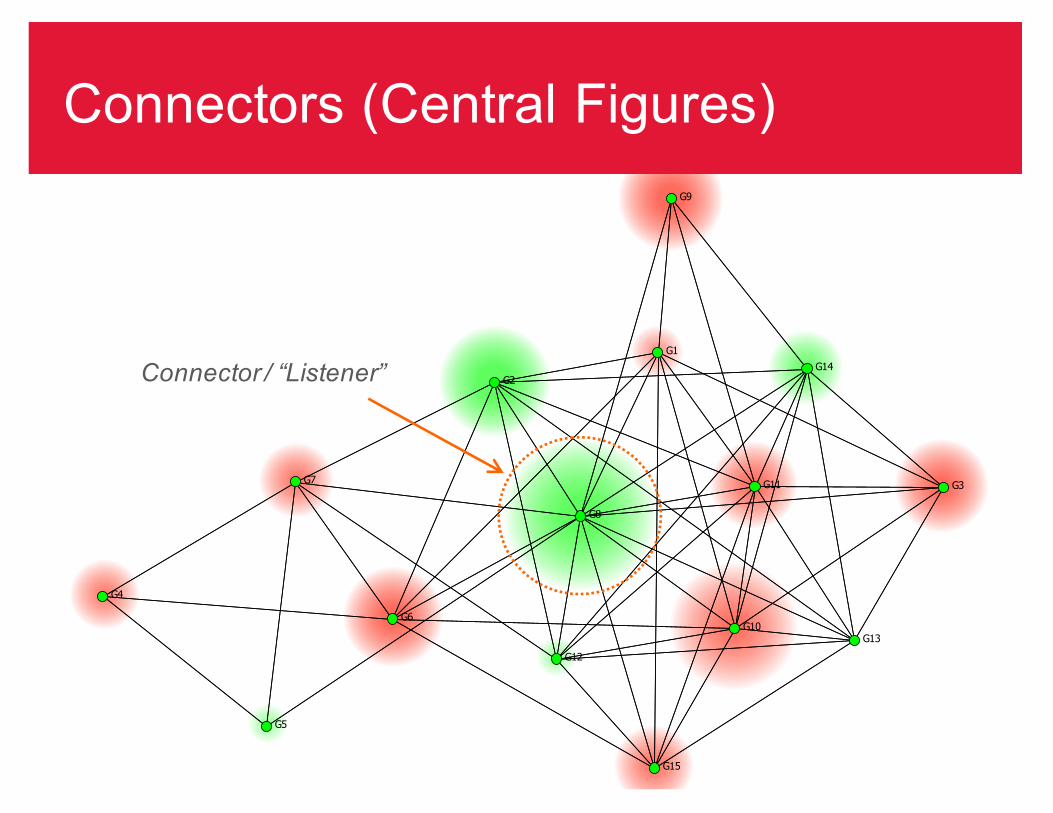
G1
G2
G3
G4
G5
G6
G7
G8
G9
G10
G11
G12
G13
G14
G15
Connector / “Listener”
Connectors (Central Figures)
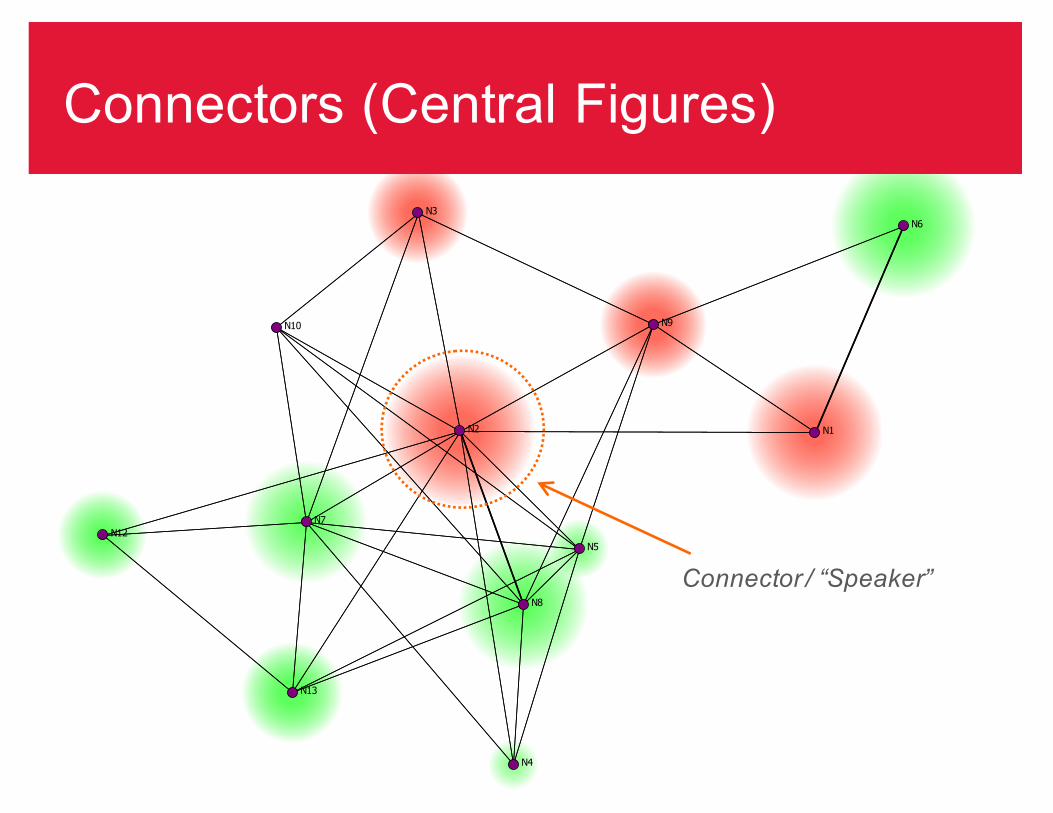
N1N2
N3
N4
N5
N6
N7
N8
N9N10
N11
N12
N13
Connector / “Speaker”
Connectors (Central Figures)
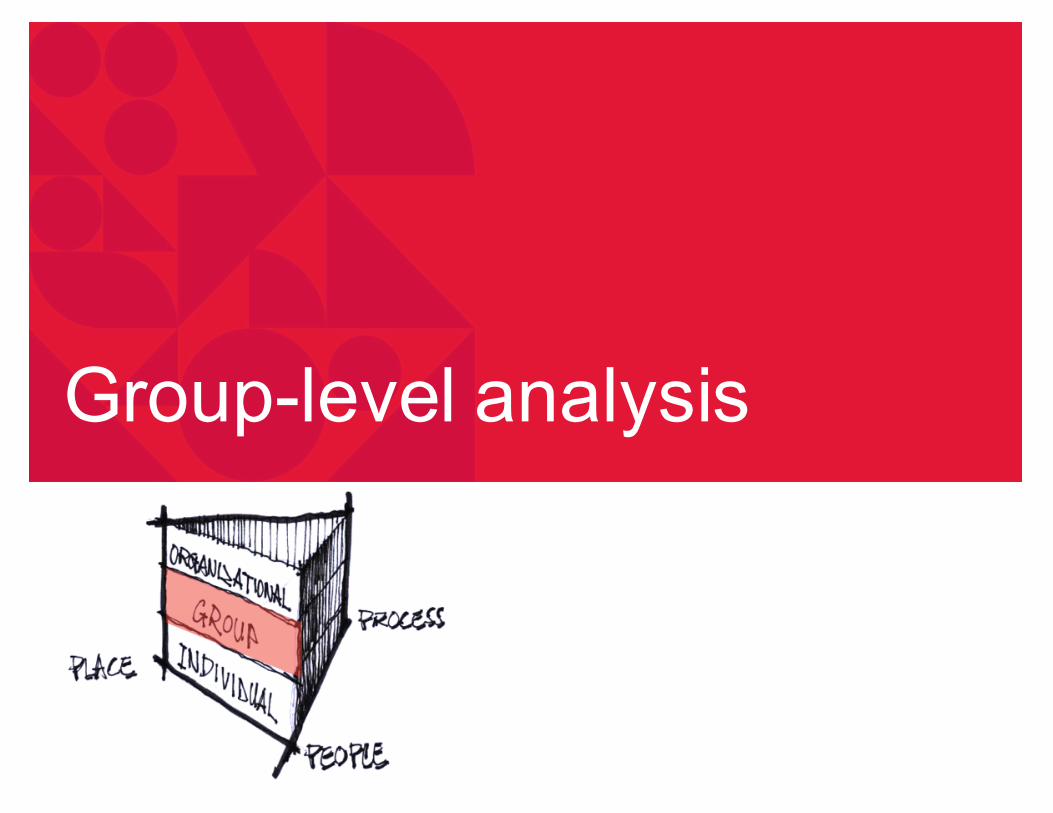
Group-level analysis
G1
G2
G10
G3
G4
G8
G14
G15
G12
G7
G13
G9
G5
G11
G6
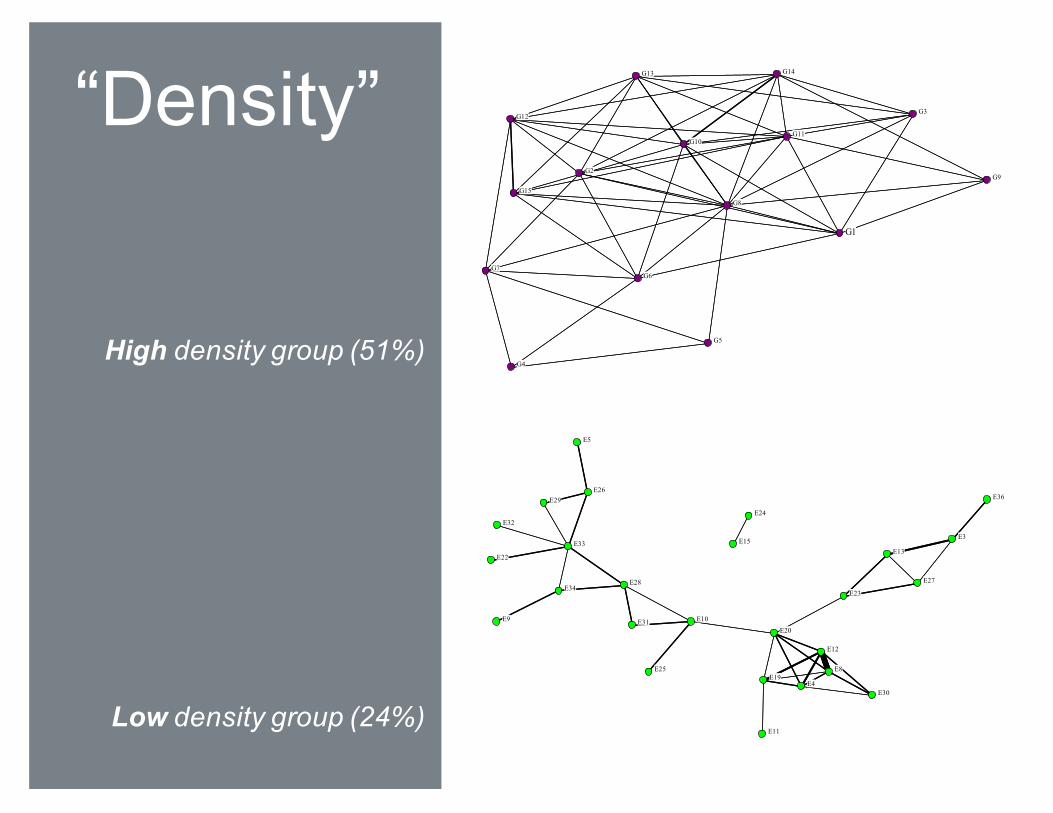
“Density”
High density group (51%)
Low density group (24%)
E28
E29
E31
E2
E20
E11
E12
E16
E19
E9
E1E7
E8
E23
E24
E25
E26
E27
E17E18
E36
E21
E22
E10
E13
E14
E15
E4
E37
E30
E32
E33
E34
E35
E3
E5
E6
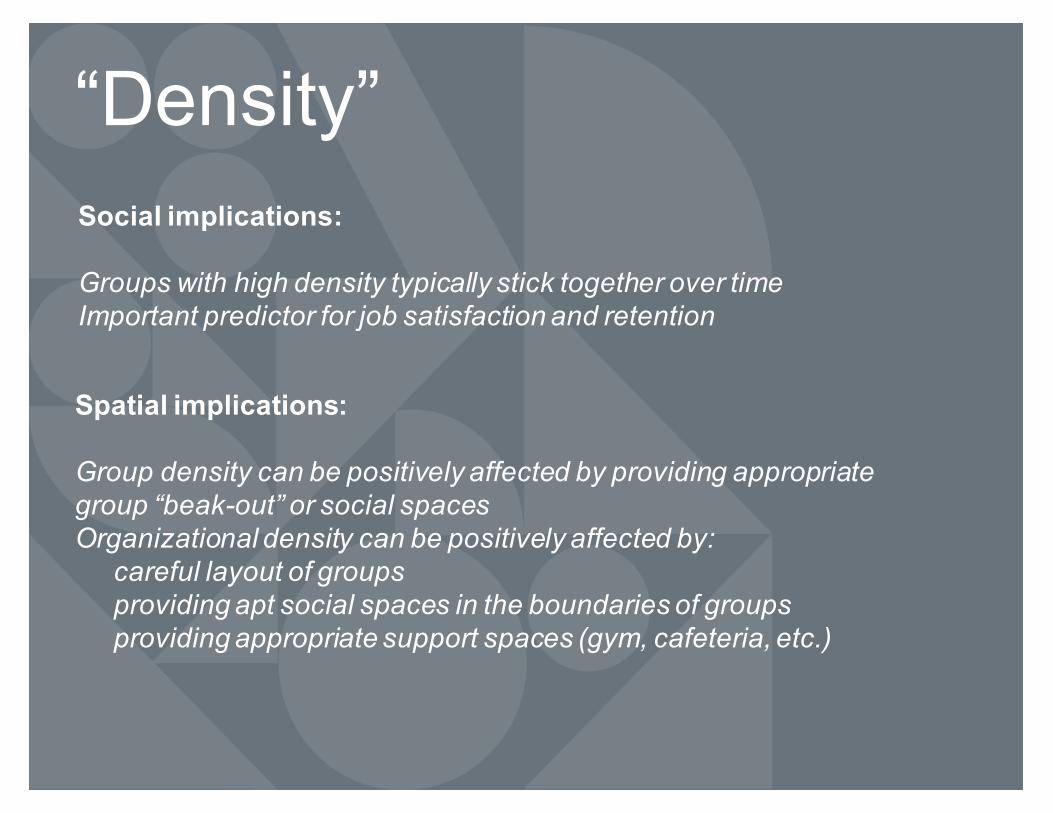
Social implications:
Groups with high density typically stick together over timeImportant predictor for job satisfaction and retention
Spatial implications:
Group density can be positively affected by providing appropriate group “beak-out” or social spacesOrganizational density can be positively affected by:
careful layout of groupsproviding apt social spaces in the boundaries of groupsproviding appropriate support spaces (gym, cafeteria, etc.)
“Density”
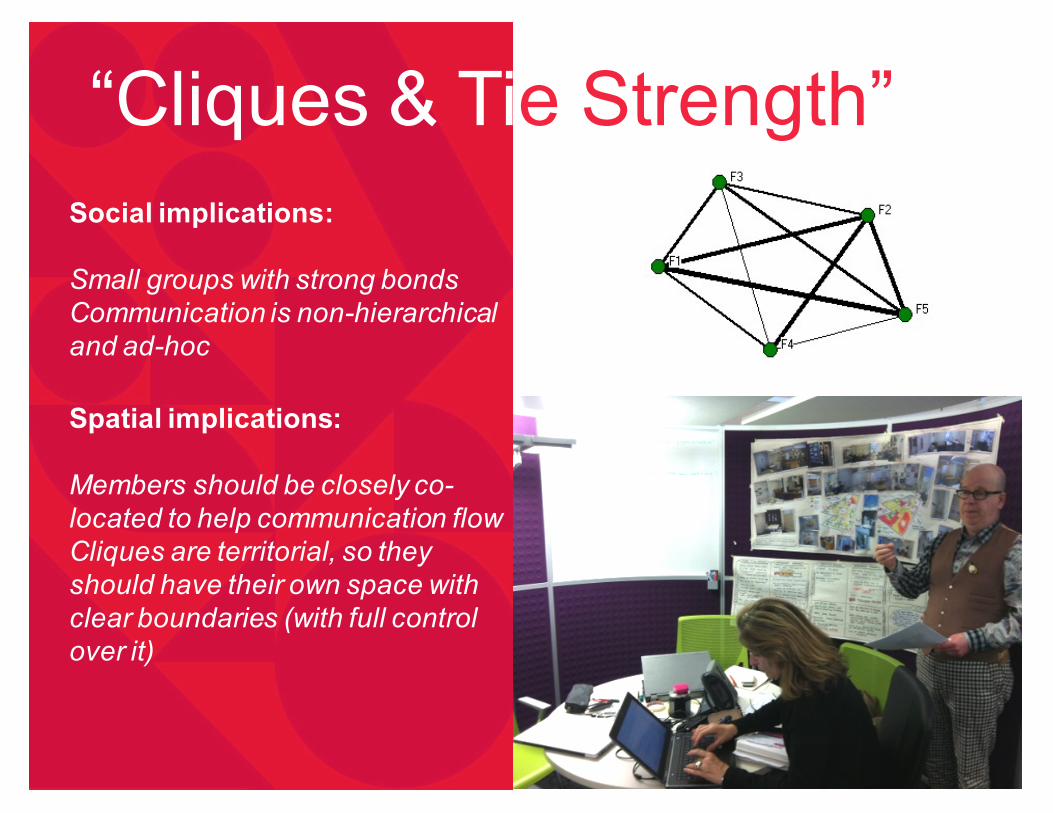
“Cliques & Tie Strength”Social implications:
Small groups with strong bondsCommunication is non-hierarchical and ad-hoc
Spatial implications:
Members should be closely co-located to help communication flowCliques are territorial, so they should have their own space with clear boundaries (with full control over it)
F1
F2
F3
F4
G1
G2
G3
G4
G5
G6
G7
G8
G9
G10
G11
G12G13
G14
G15
H1
H2
I1
I2
I3
I4
I5
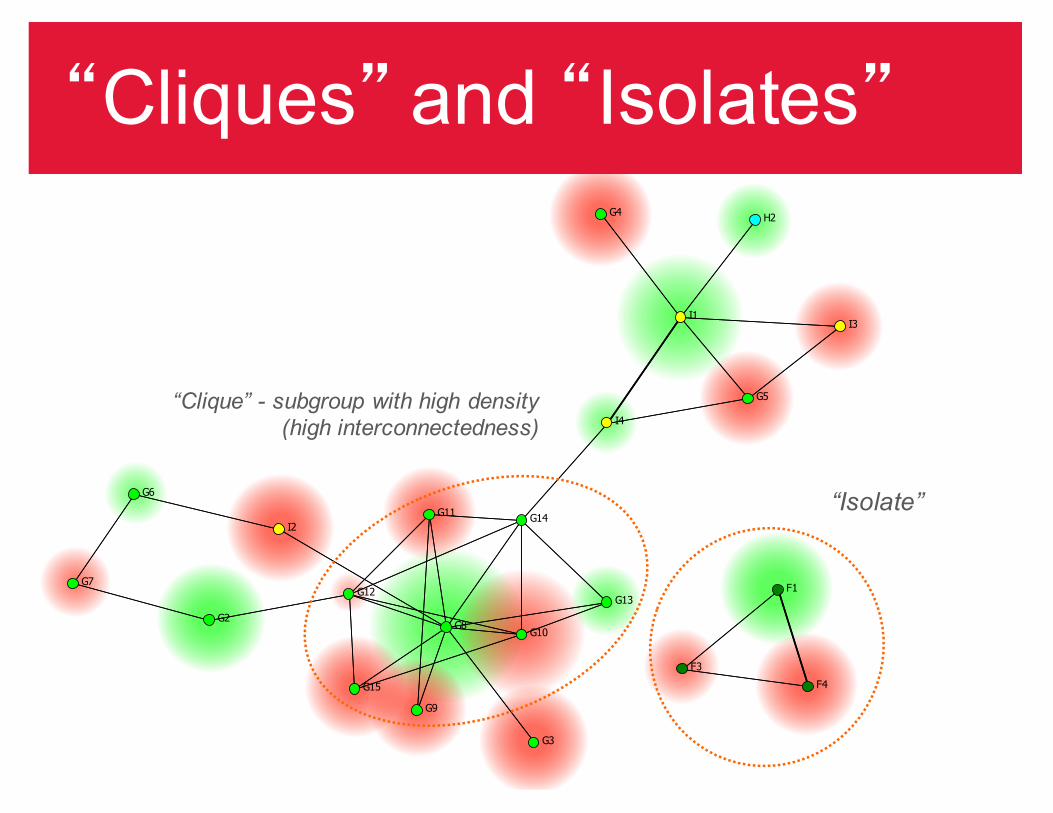
“Isolate”
“Clique” - subgroup with high density (high interconnectedness)
“Cliques” and “Isolates”
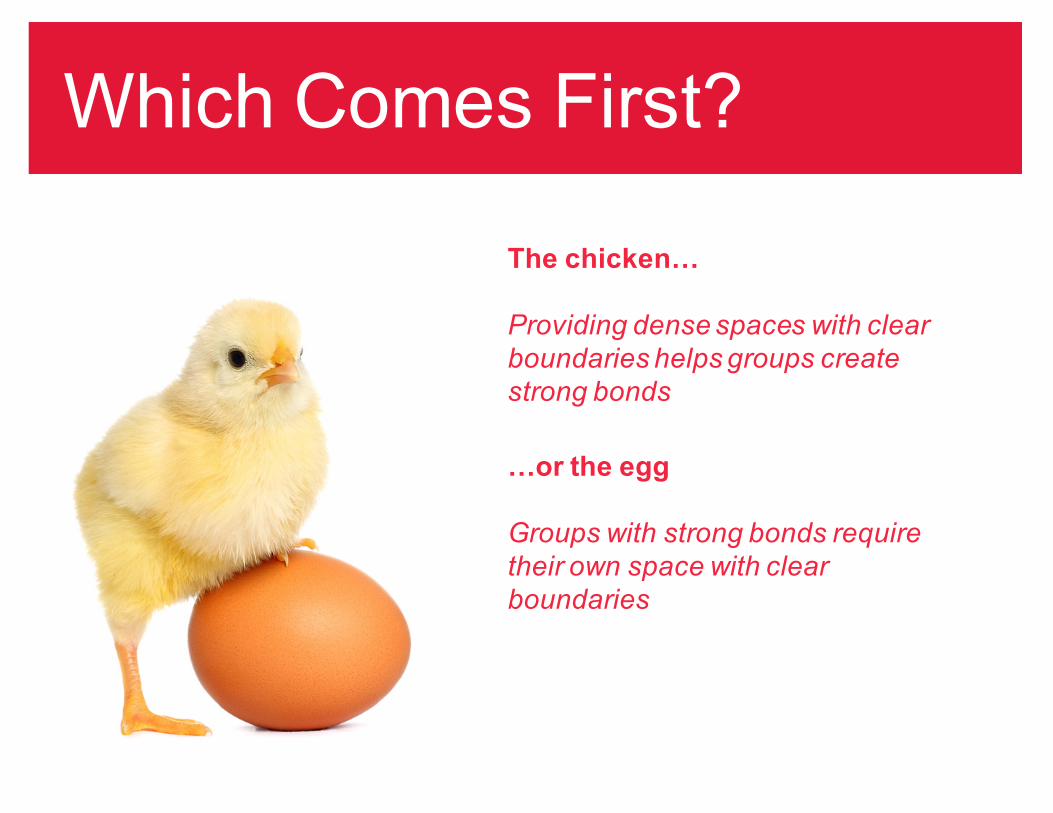
Which Comes First?
The chicken…
Providing dense spaces with clear boundaries helps groups create strong bonds
…or the egg
Groups with strong bonds require their own space with clear boundaries
Spatial implications
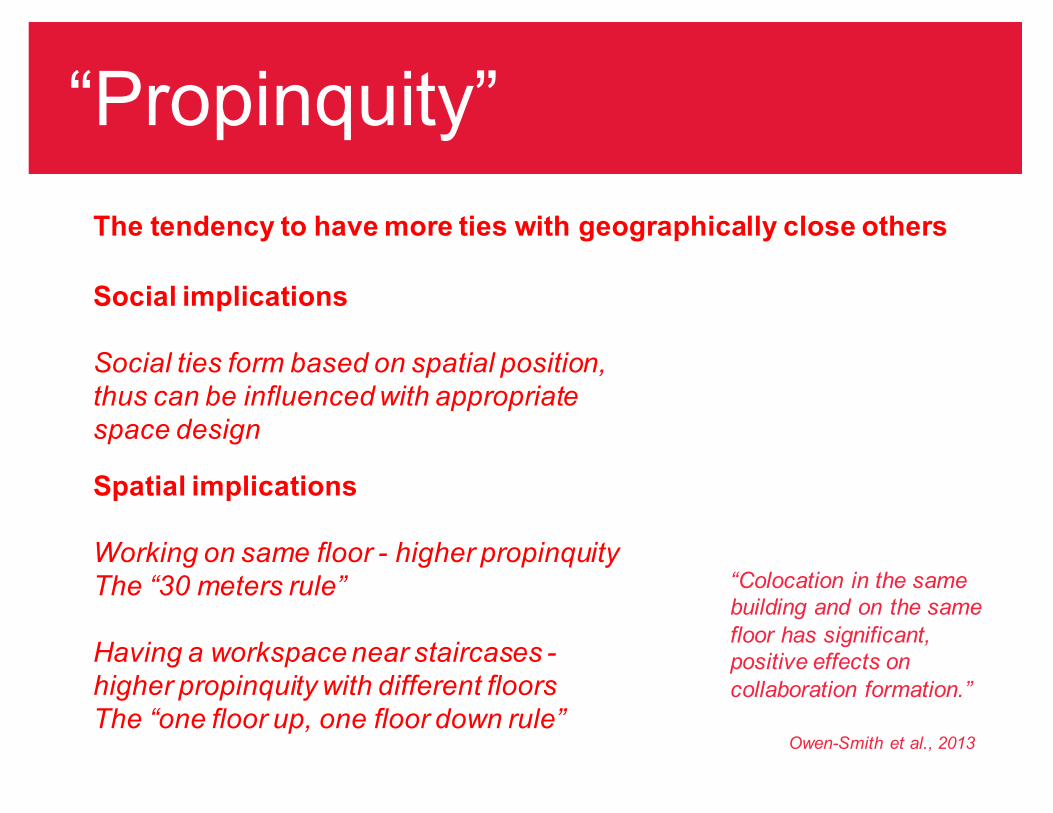
Working on same floor - higher propinquityThe “30 meters rule”
Having a workspace near staircases -higher propinquity with different floorsThe “one floor up, one floor down rule”
The tendency to have more ties with geographically close others
“Propinquity”
“Colocation in the same building and on the same floor has significant, positive effects on collaboration formation.”
Owen-Smith et al., 2013
Social implications
Social ties form based on spatial position, thus can be influenced with appropriate space design
D41
E28
E29
E31
D42
B3
B4B9
J4
K1
D38
B10
F4
O1
D46
E2
E20
L7
L8
D35
D36
J5
L9
F3
B2
E11
B1
E12
B8
F2D33
E16
A3
E19
C2E9
C1
D24
D27
D28
E1
B7
D29
D30
A2
D15
O3
A1
J6
L4
E7
D1
D2
D3
E8
E23
E24
E25 E26
D37A6
E27
D39D40
D32D34
E17
E18
E36
E21
D6
E22
A5
D22
D23
E10A4
D25
D26
E13
E14
D31
E15
O2
D8L1
L2
J2
E4
L3
E37
M1D13
E30
O5E32 L10
D43
F1D45
L11 L12B5
J3
B6D18
L5
D19
D5
M2
L6
O4
I1
N1
A8
G1 G2
G10N13
N2G3G4
G8
N5
K7
H2
N11
J1
G14
N6
N7
G15
G12
G7
A7
N3
A9
G13 K5
I4N4
D44
E33 D7
E34
E35
N8
G9
D10
K6
N9
N10
D9E3
I5
E5
H1 I3 G5I2
G11
K2G6
K3N12
K4
D11
D12
D14
D16
E6D17
D4
D20
D21
2nd Floor
3rd Floor 4th Floor
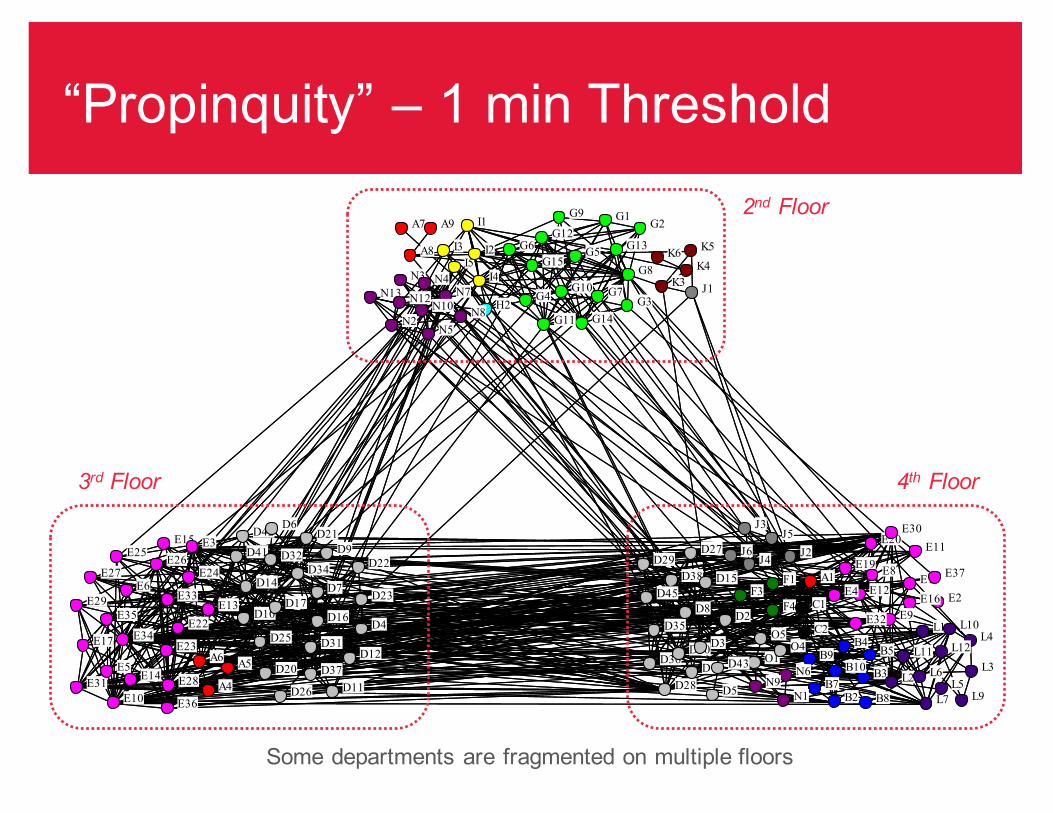
Some departments are fragmented on multiple floors
“Propinquity” – 1 min Threshold
D41
E28
E29
E31
D42
B3
B4B9
J4
K1
D38
B10
F4
O1
D46
E2
E20
L7
L8
D35
D36
J5
L9
F3
B2
E11
B1
E12
B8
F2D33
E16
A3
E19
C2E9
C1
D24
D27
D28
E1
B7
D29
D30
A2
D15
O3
A1
J6
L4
E7
D1
D2
D3
E8
E23
E24
E25 E26
D37A6
E27
D39D40
D32D34
E17
E18
E36
E21
D6
E22
A5
D22
D23
E10A4
D25
D26
E13
E14
D31
E15
O2
D8L1
L2
J2
E4
L3
E37
M1D13
E30
O5E32 L10
D43
F1D45
L11 L12B5
J3
B6D18
L5
D19
D5
M2
L6
O4
I1
N1
A8
G1 G2
G10N13
N2G3G4
G8
N5
K7
H2
N11
J1
G14
N6
N7
G15
G12
G7
A7
N3
A9
G13 K5
I4N4
D44
E33 D7
E34
E35
N8
G9
D10
K6
N9
N10
D9E3
I5
E5
H1 I3 G5I2
G11
K2G6
K3N12
K4
D11
D12
D14
D16
E6D17
D4
D20
D21
2nd Floor
3rd Floor 4th Floor
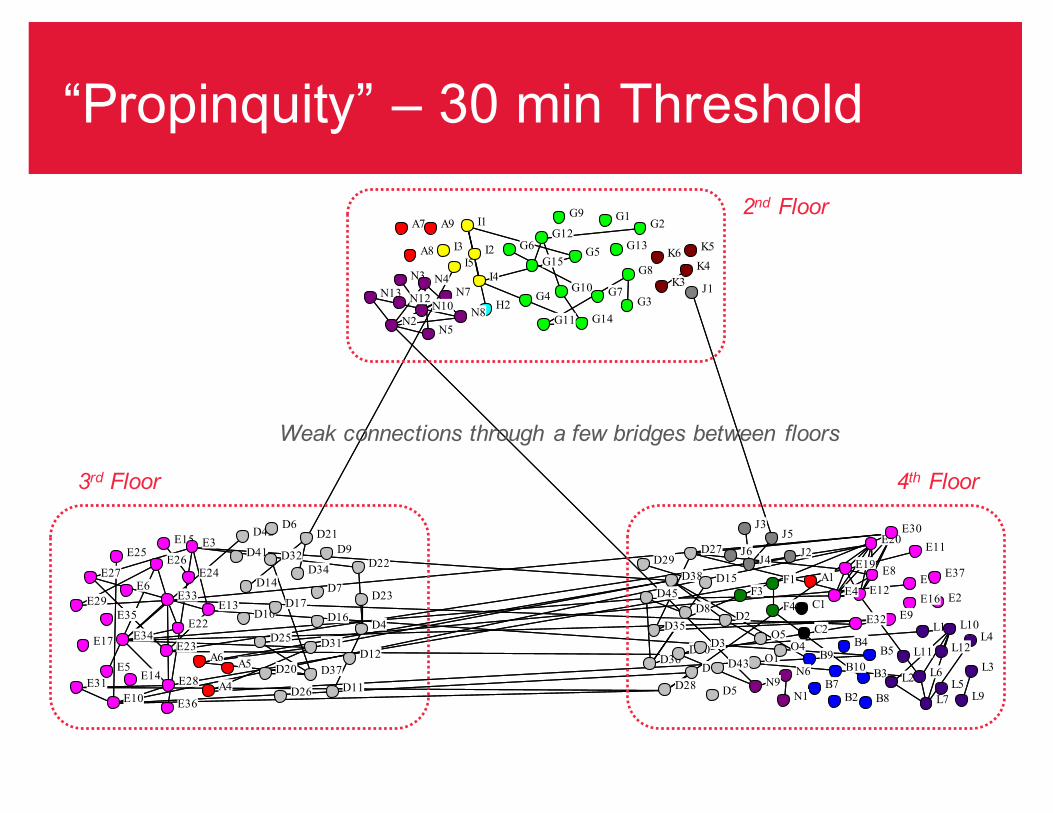
“Propinquity” – 30 min Threshold
Weak connections through a few bridges between floors
D41
E28
E29
E31
D42
B3
B4B9
J4
K1
D38
B10
F4
O1
D46
E2
E20
L7
L8
D35
D36
J5
L9
F3
B2
E11
B1
E12
B8
F2D33
E16
A3
E19
C2E9
C1
D24
D27
D28
E1
B7
D29
D30
A2
D15
O3
A1
J6
L4
E7
D1
D2
D3
E8
E23
E24
E25E26
D37A6
E27
D39D40
D32D34
E17
E18
E36
E21
D6
E22
A5
D22
D23
E10A4
D25
D26
E13
E14
D31
E15
O2
D8
L1
L2
J2
E4
L3
E37
M1D13
E30
O5E32 L10
D43
F1D45
L11 L12B5
J3
B6D18
L5
D19
D5
M2
L6
O4
I1
N1
A8
G1 G2
G10N13
N2
G3G4
G8
N5
K7
H2
N11
J1
G14
N6
N7
G15
G12
G7
A7
N3
A9
G13 K5
I4N4
D44
E33 D7
E34E35
N8
G9
D10
K6
N9
N10
D9E3
I5
E5
H1 I3 G5I2
G11
K2
G6
K3
N12
K4
D11
D12
D14
D16
E6D17
D4
D20
D21
2nd Floor
3rd Floor 4th Floor
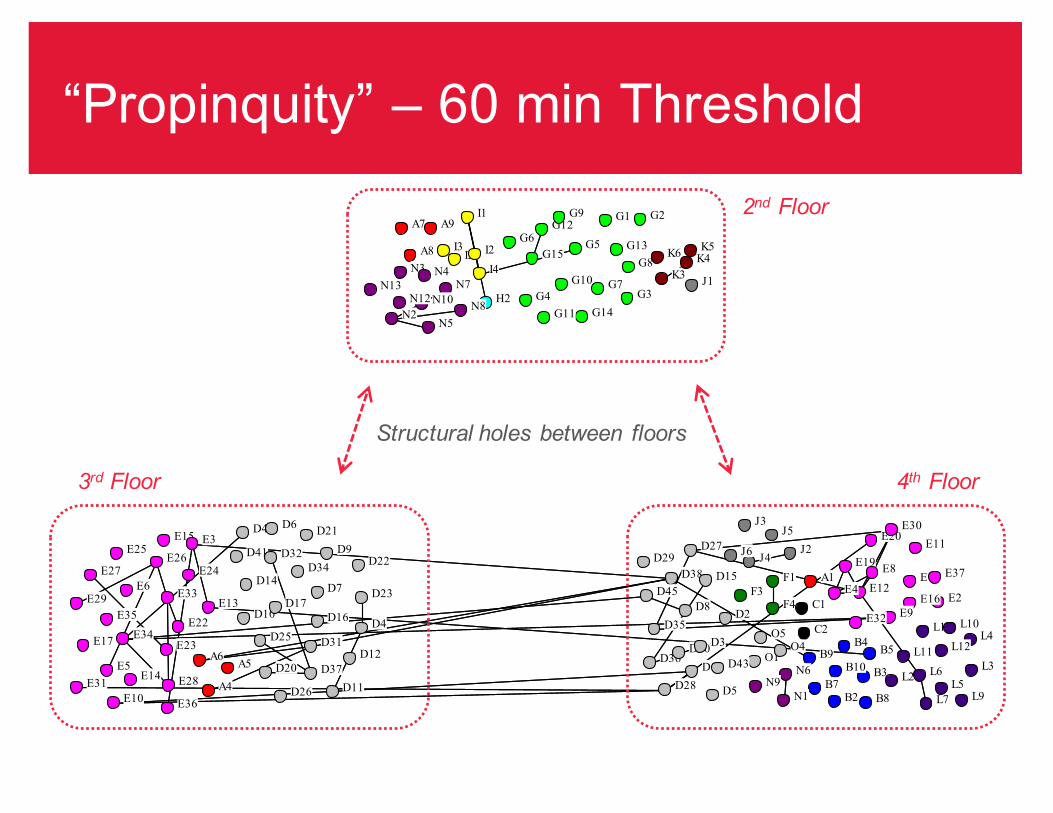
Structural holes between floors
“Propinquity” – 60 min Threshold
D41
E28E29E31
D42
B3
B4B9J4K1
D38
B10F4O1D46E2E20L7L8
D35
D36
J5L9F3B2E11B1E12B8F2D33E16A3E19C2E9C1D24
D27
D28
E1B7
D29
D30
A2
D15
O3A1J6L4E7
D1
D2
D3
E8E23E24E25E26
D37
A6E27D39D40
D32
D34
E17E18E36E21
D6
E22A5
D22
D23
E10A4
D25D26
E13E14
D31
E15O2
D8
L1L2J2E4L3E37M1D13E30O5E32L10
D43
F1
D45
L11L12B5J3B6D18L5D19
D5
M2L6O4N1N6D44E33
D7
E34E35D10N9
D9
E3E5
D11
D12
D14
D16
E6
D17D4
D20
D21
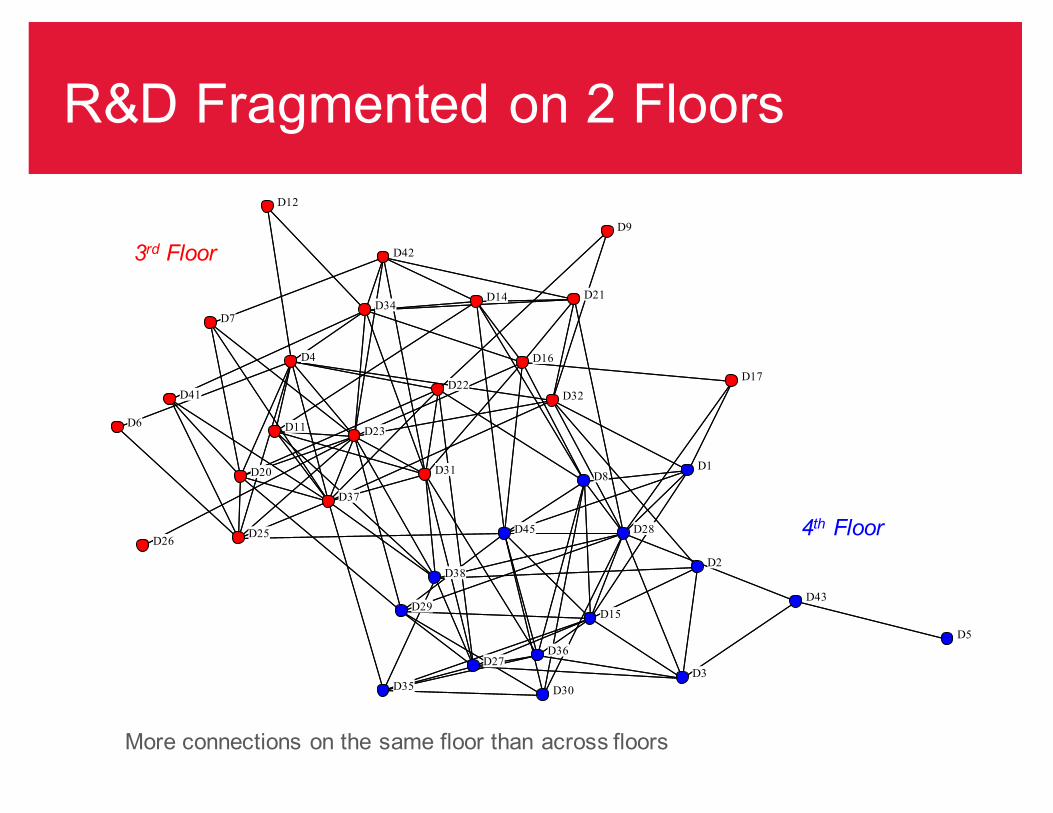
3rd Floor
4th Floor
R&D Fragmented on 2 Floors
More connections on the same floor than across floors
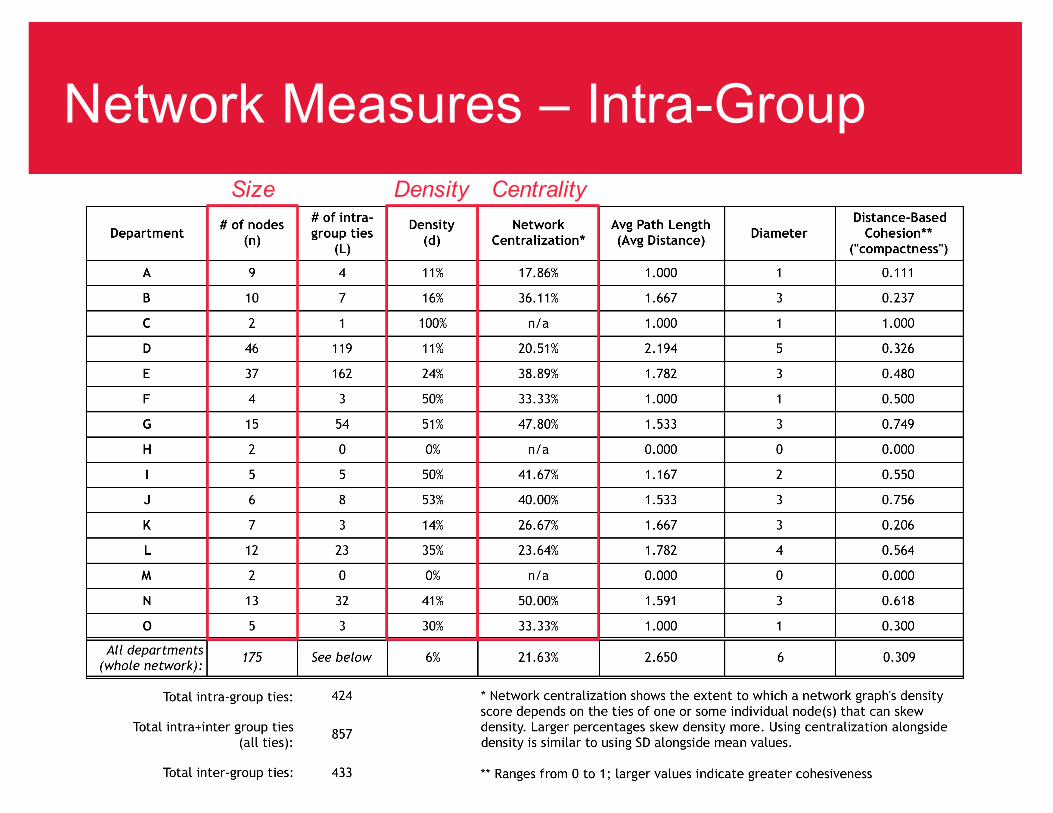
Network Measures – Intra-GroupSize Density Centrality
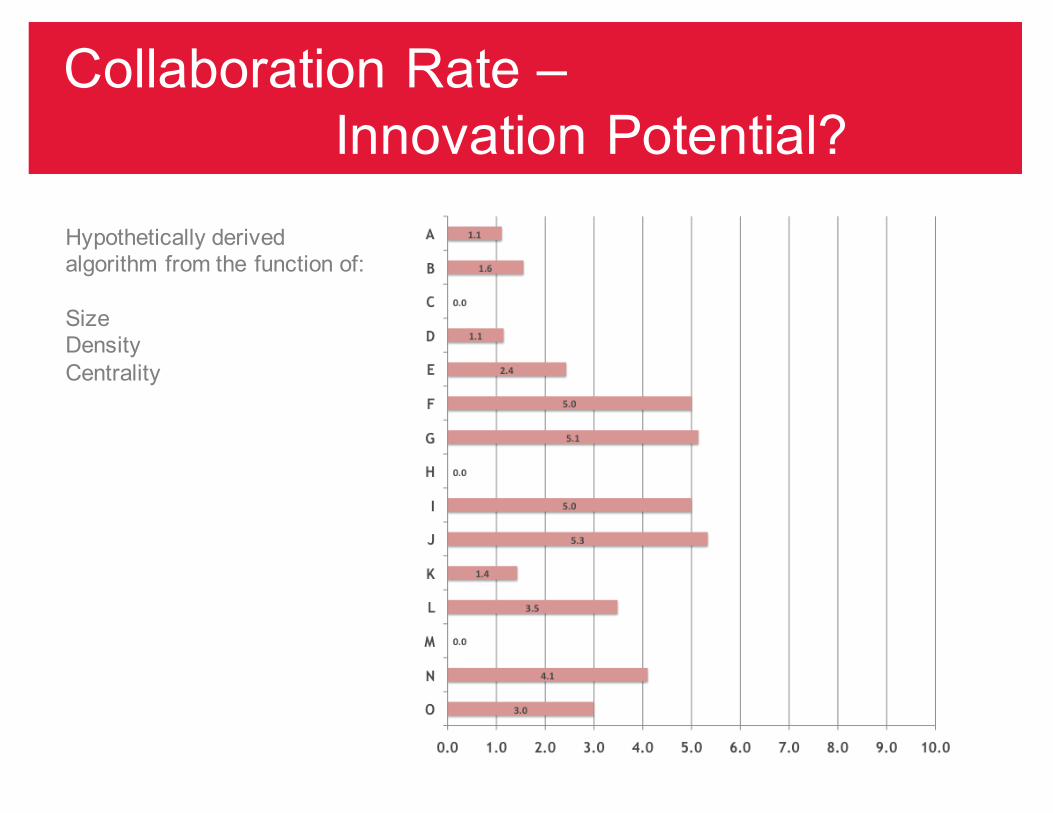
Collaboration Rate –Innovation Potential?
Hypothetically derived algorithm from the function of:
SizeDensityCentrality
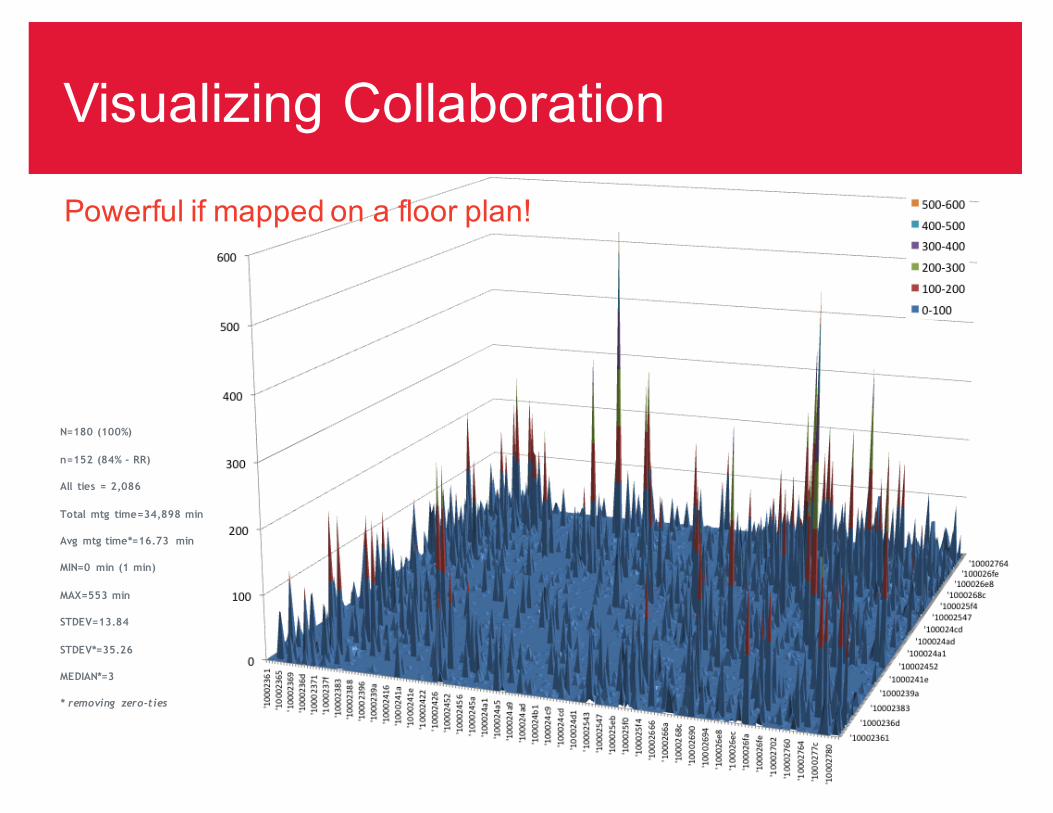
N=180 (100%)
n=152 (84% - RR)
All ties = 2,086
Total mtg time=34,898 min
Avg mtg time*=16.73 min
MIN=0 min (1 min)
MAX=553 min
STDEV=13.84
STDEV*=35.26
MEDIAN*=3
* removing zero-ties
Powerful if mapped on a floor plan!
Visualizing Collaboration
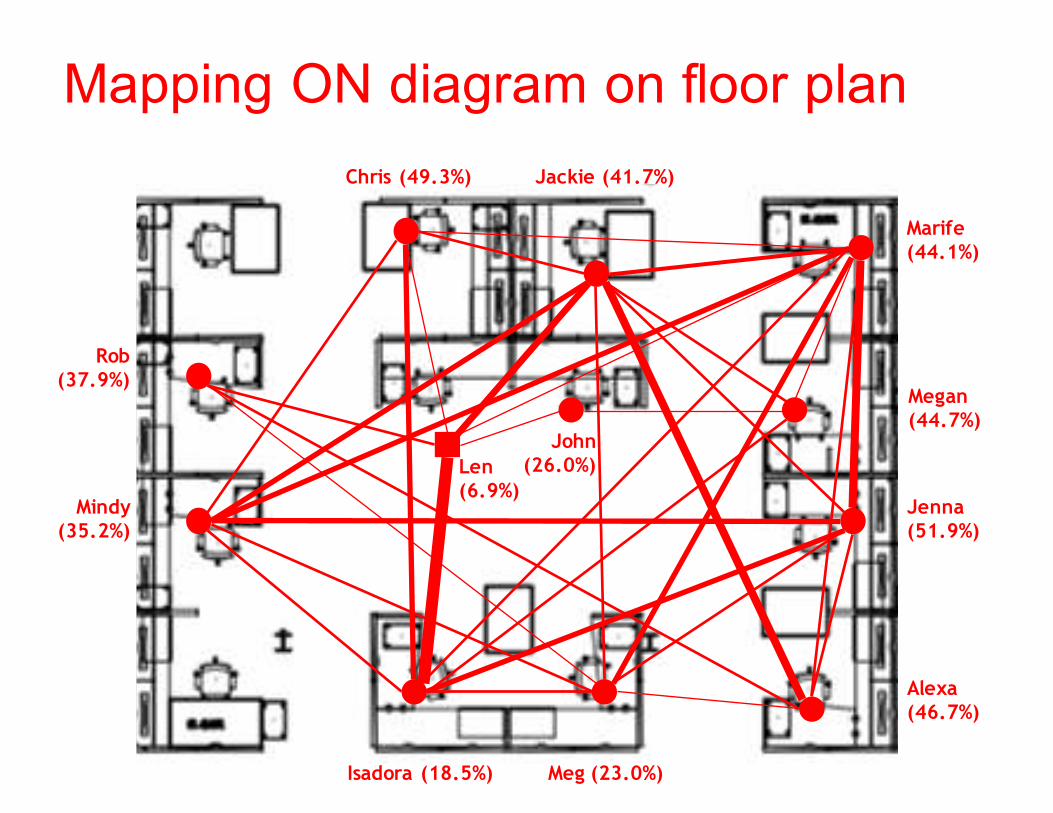
Chris (49.3%)
Isadora (18.5%)
Mindy(35.2%)
Jackie (41.7%)
John(26.0%)
Alexa(46.7%)
Rob(37.9%)
Jenna(51.9%)
Marife(44.1%)
Meg (23.0%)
Megan(44.7%)
Len(6.9%)
Social Network & Space Utilization
Mapping ON diagram on floor plan
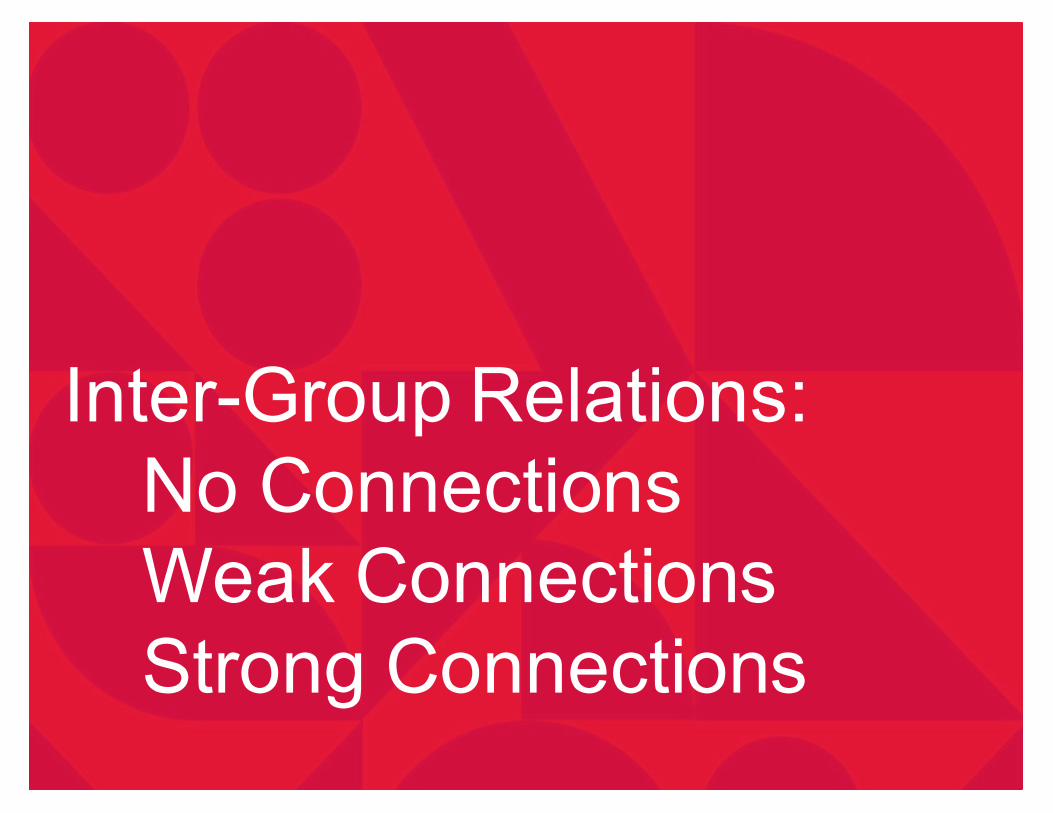
Inter-Group Relations:No ConnectionsWeak ConnectionsStrong Connections
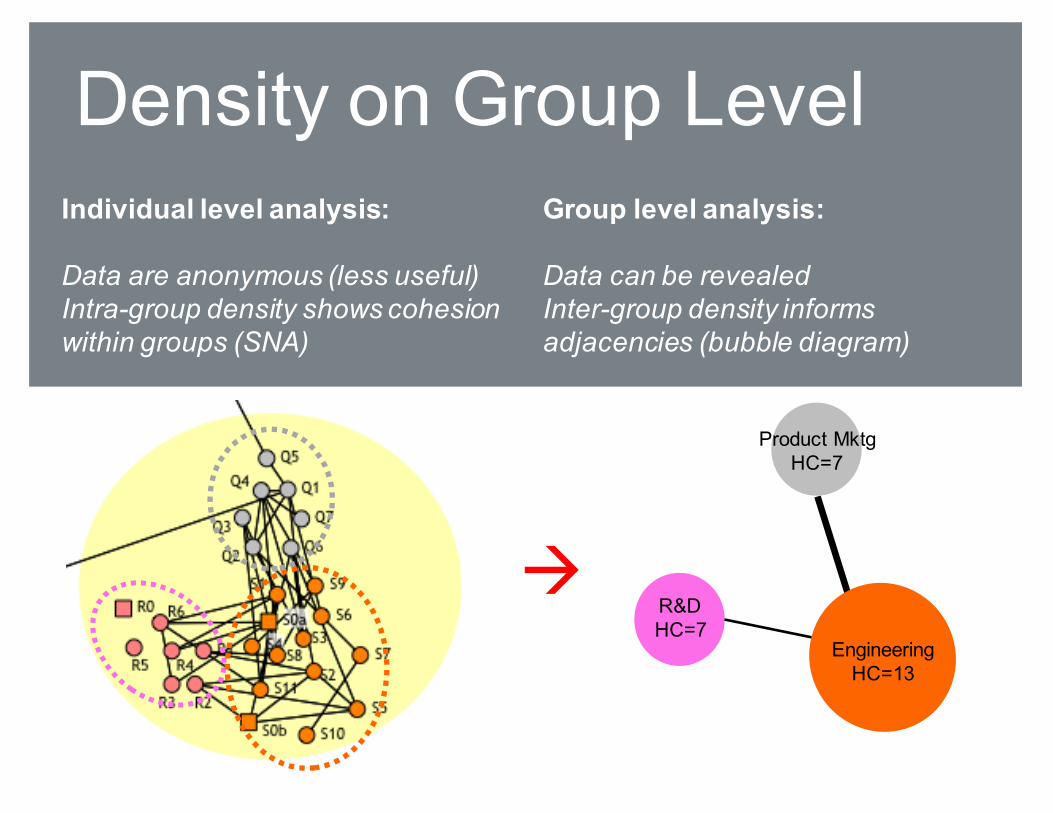
àR&DHC=7
EngineeringHC=13
Product MktgHC=7
Density on Group LevelIndividual level analysis:
Data are anonymous (less useful)Intra-group density shows cohesion within groups (SNA)
Group level analysis:
Data can be revealedInter-group density informs adjacencies (bubble diagram)
F4
L7
L8
L9
F3
F2
L4
L1L2L3
L10
F1
L11
L12
L5
L6
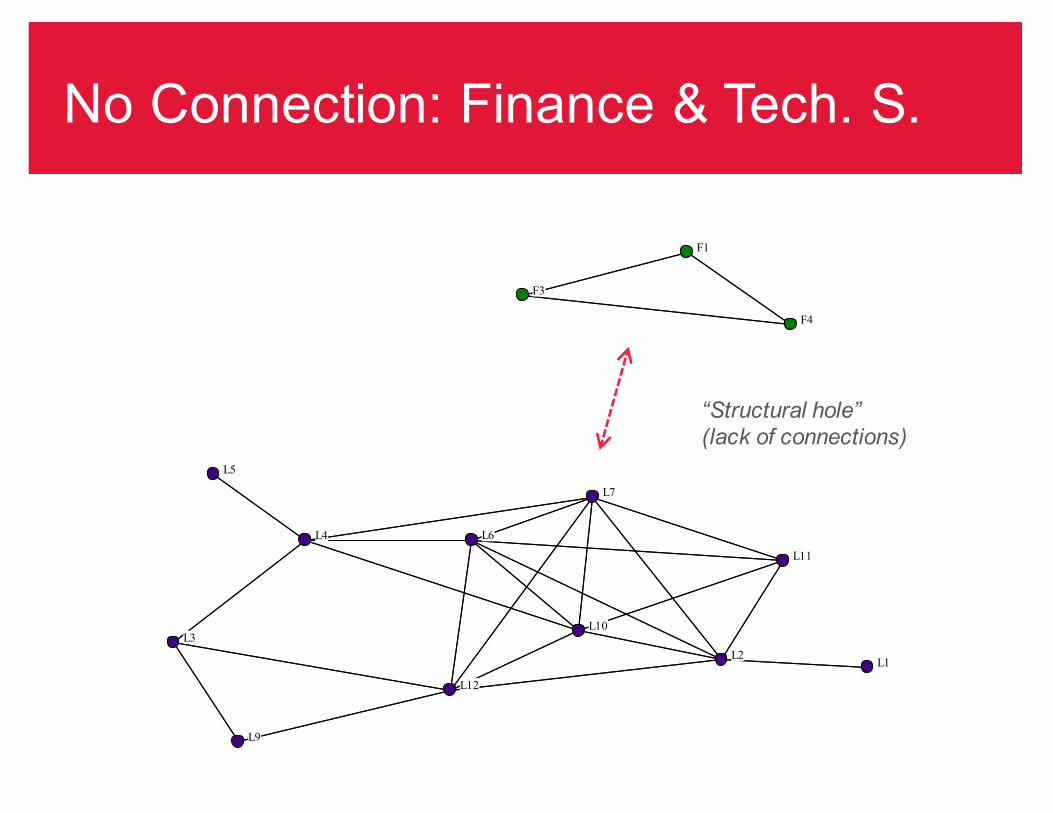
“Structural hole”(lack of connections)
No Connection: Finance & Tech. S.
E28
E29
E31
E2
E20
E11E12
E16
E19
E9
E1
E7
E8
E23
E24
E25
E26
E27
E17E18
E36
E21
E22
E10
E13
E14
E15
E4
E37
E30
E32
G1
G2
G10
G3
G4
G8
G14
G15
G12
G7
G13
E33E34
E35
G9
E3
E5
G5
G11
G6
E6
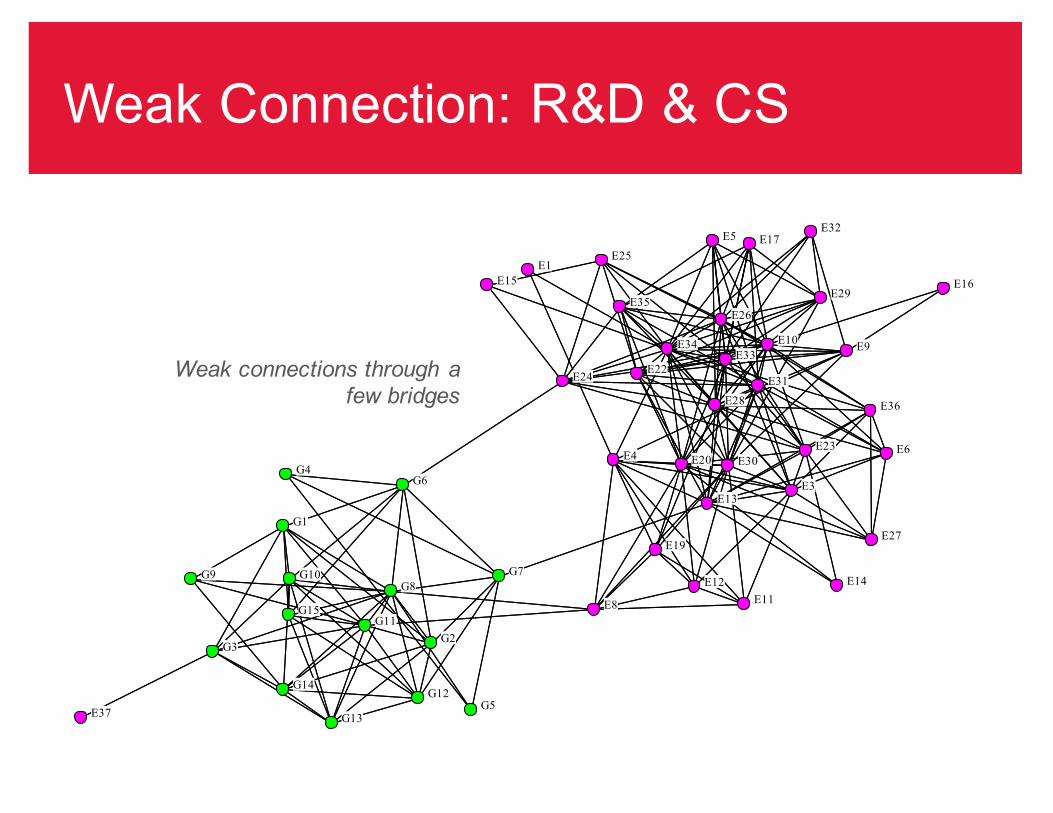
Weak connections through a few bridges
Weak Connection: R&D & CS
I1
G1
G2
G10
G3
G4
G8
G14
G15
G12
G7
G13
I4
G9
I5
I3
G5I2
G11
G6
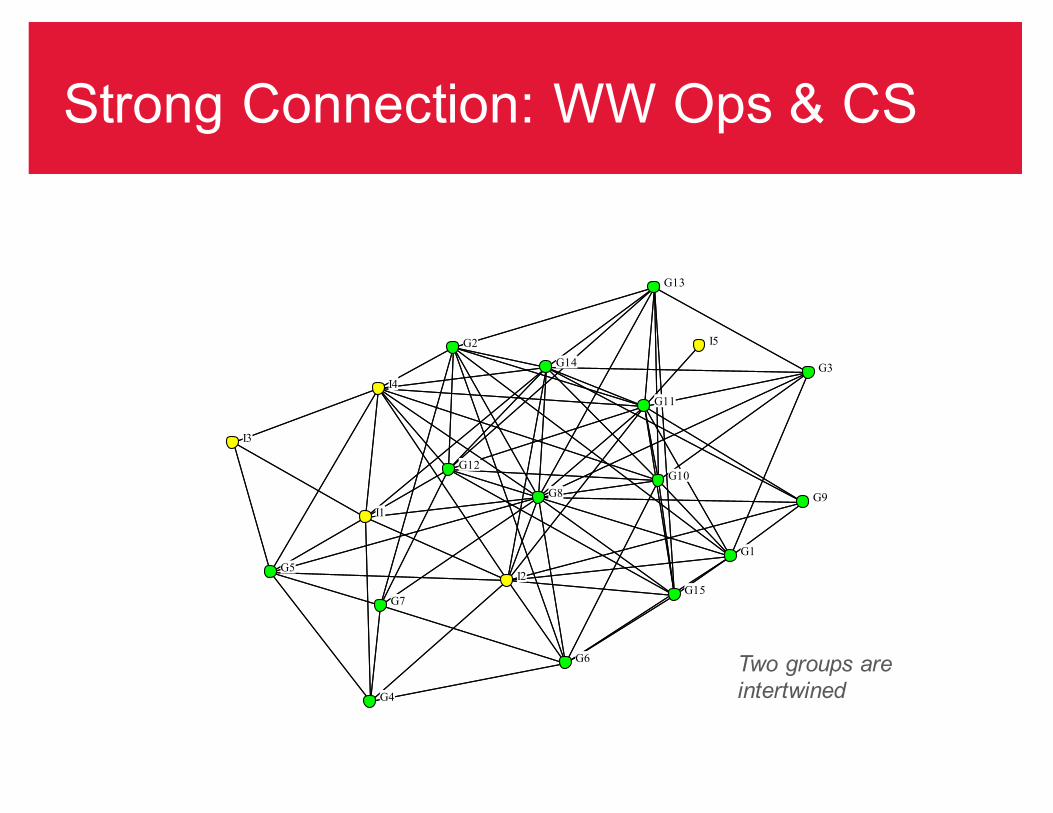
Strong Connection: WW Ops & CS
Two groups are intertwined
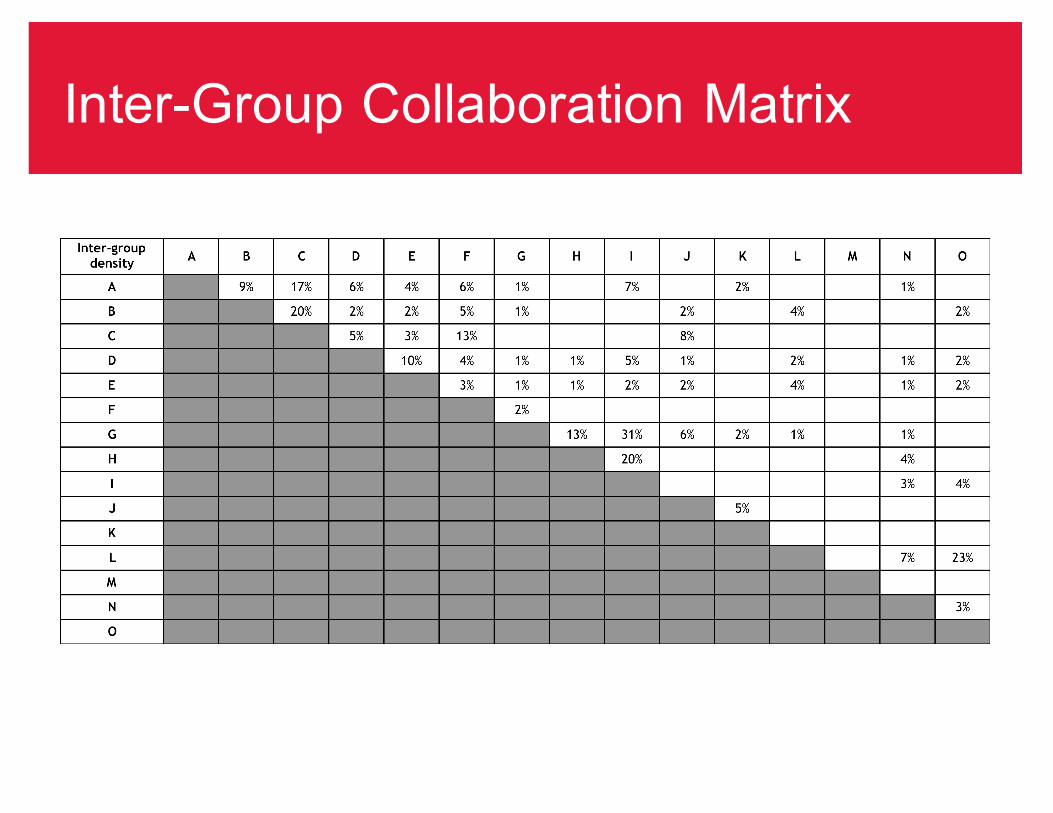
Inter-Group Collaboration Matrix
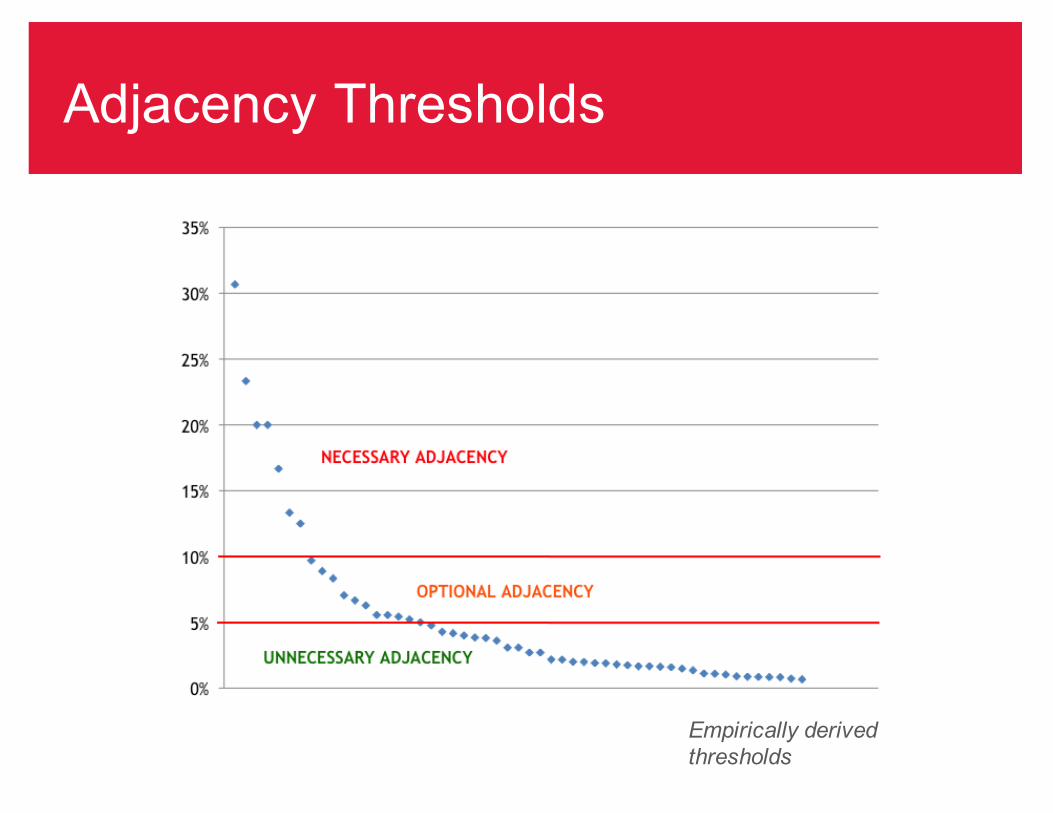
Adjacency Thresholds
Empirically derived thresholds
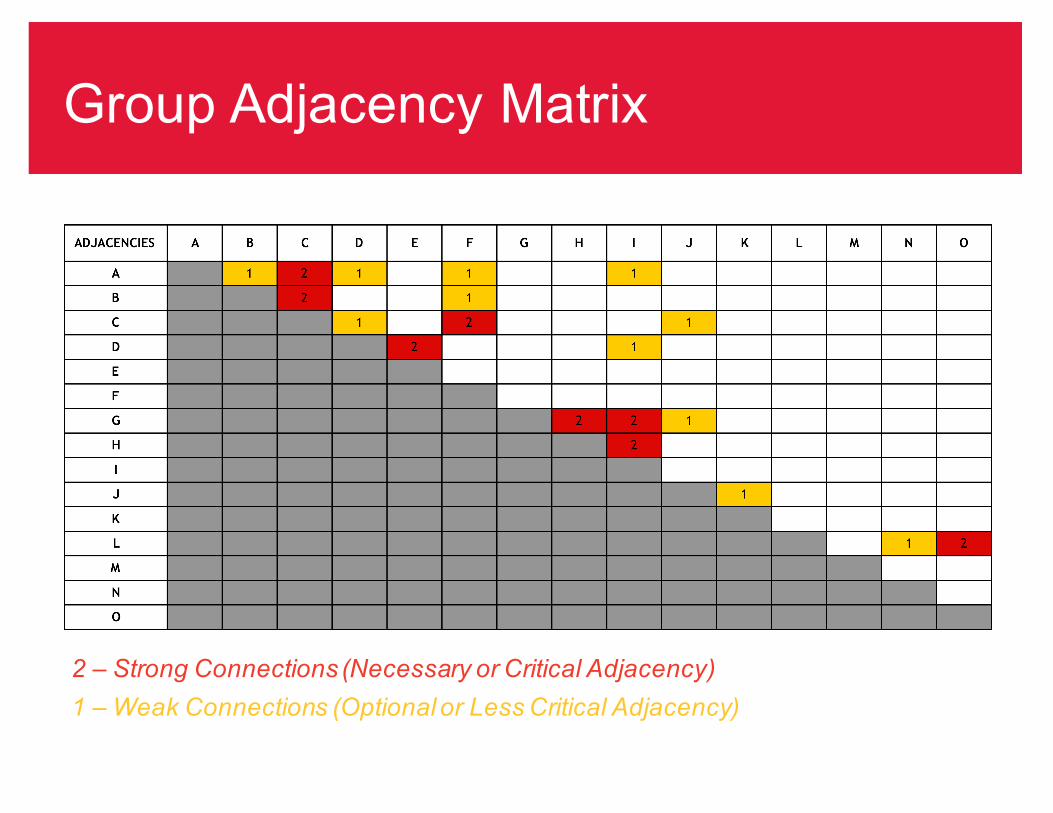
Group Adjacency Matrix
2 – Strong Connections (Necessary or Critical Adjacency)1 – Weak Connections (Optional or Less Critical Adjacency)
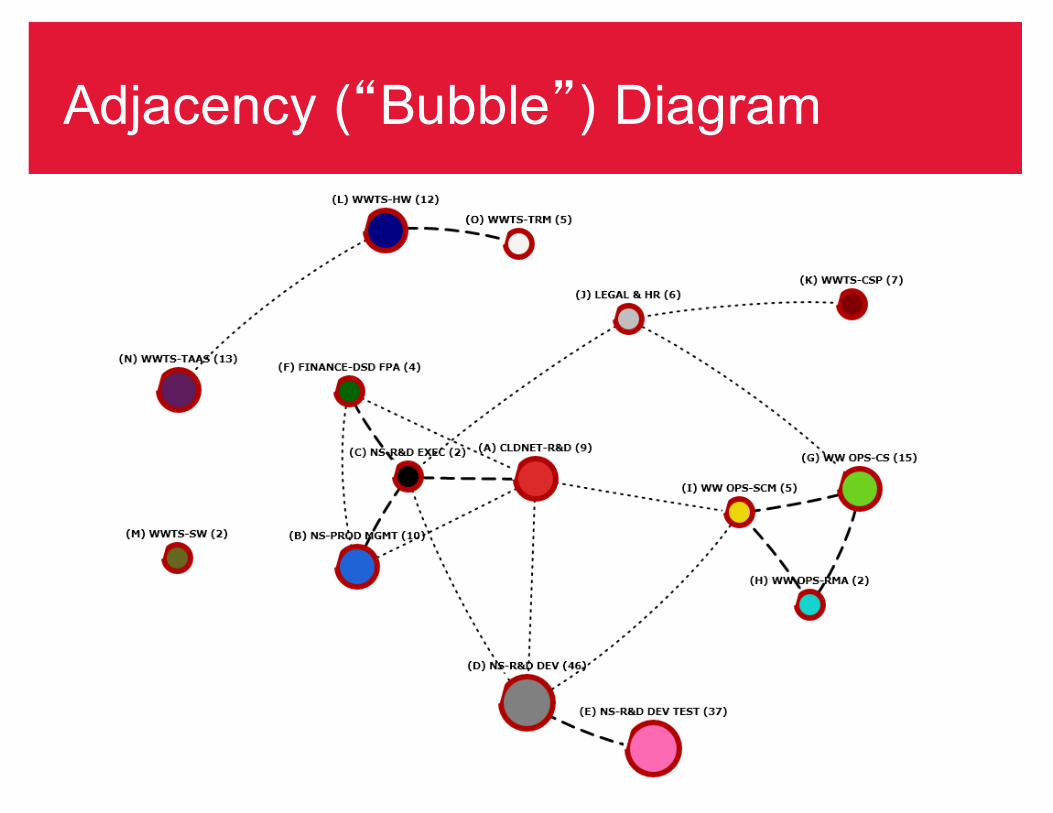
Adjacency (“Bubble”) Diagram
Adjacency Map (demo)
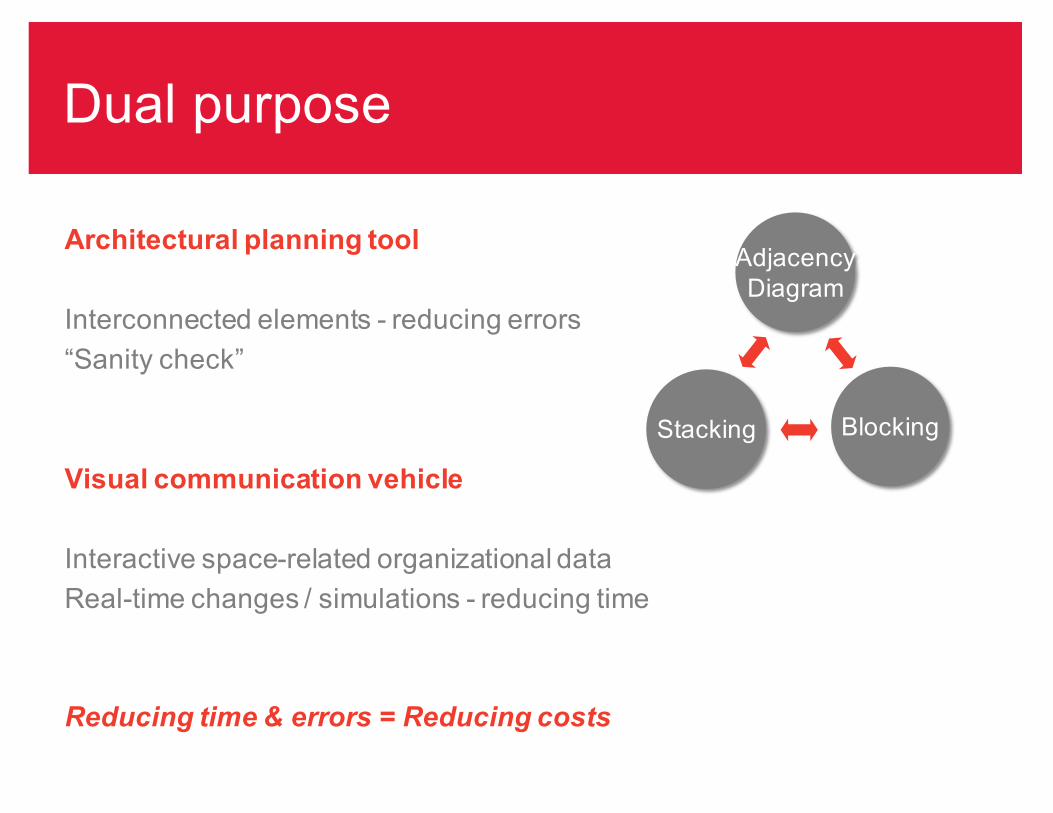
Dual purpose
Architectural planning tool
Interconnected elements - reducing errors“Sanity check”
Visual communication vehicle
Interactive space-related organizational dataReal-time changes / simulations - reducing time
Reducing time & errors = Reducing costs
AdjacencyDiagram
BlockingStacking
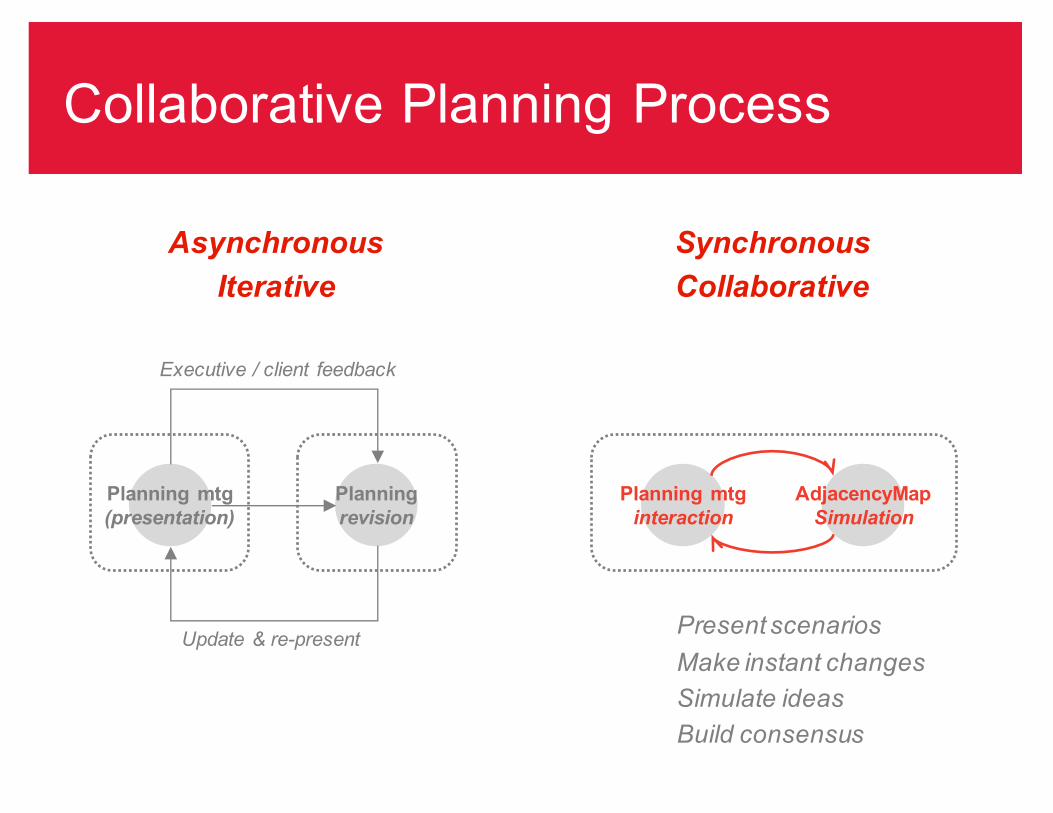
Collaborative Planning Process
Planning mtg(presentation)
Planningrevision
AsynchronousIterative
Update & re-present
Executive / client feedback
Planning mtginteraction
AdjacencyMapSimulation
Present scenariosMake instant changesSimulate ideasBuild consensus
SynchronousCollaborative
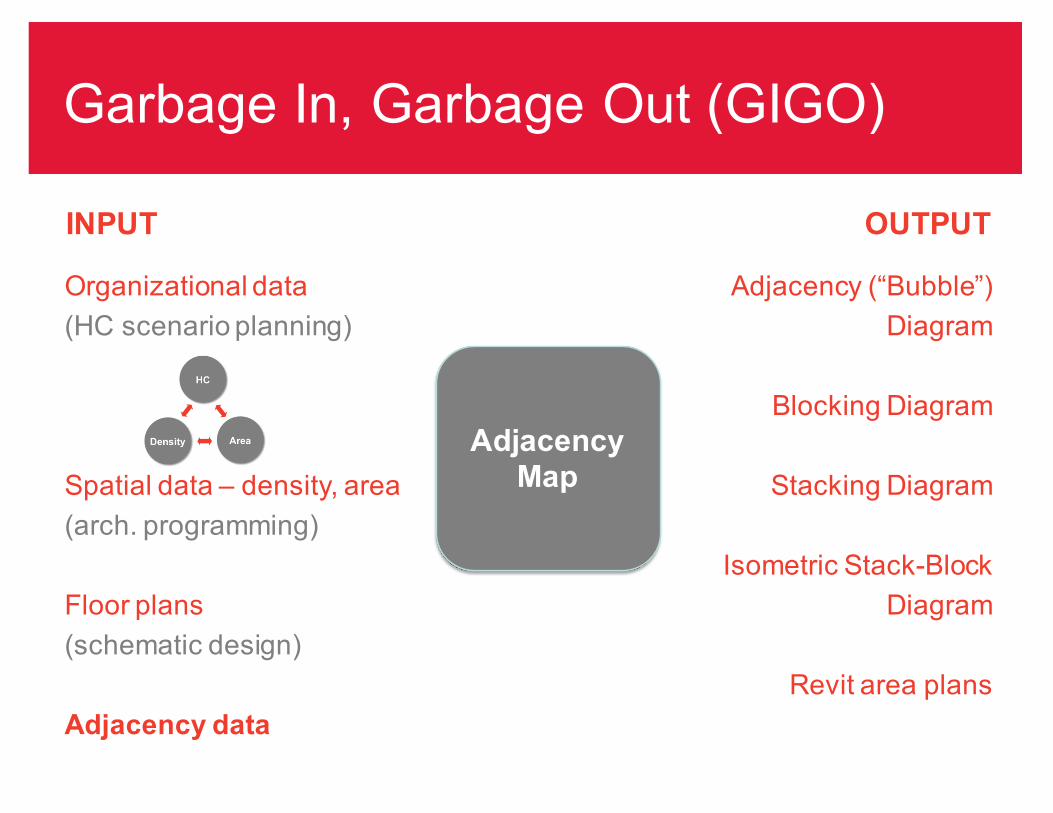
Organizational data(HC scenario planning)
Spatial data – density, area(arch. programming)
Floor plans(schematic design)
Adjacency data
Garbage In, Garbage Out (GIGO)
AdjacencyMap
INPUT OUTPUT
Adjacency (“Bubble”) Diagram
Blocking Diagram
Stacking Diagram
Isometric Stack-BlockDiagram
Revit area plans
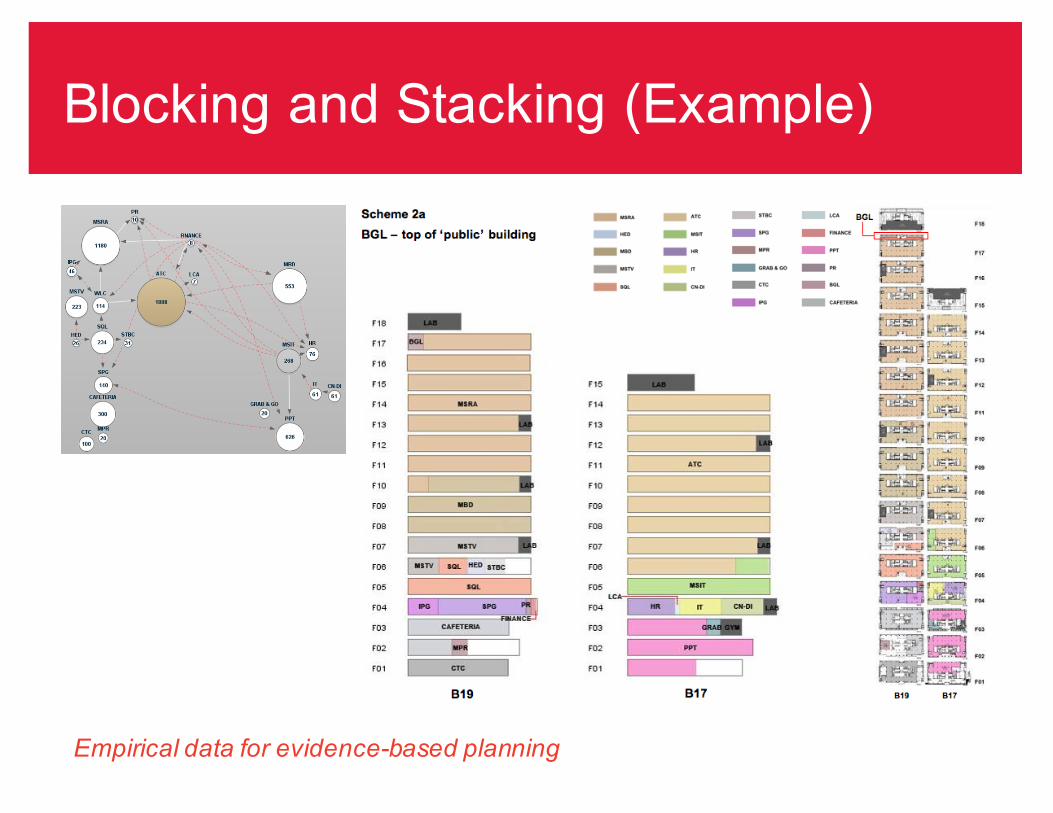
Blocking and Stacking (Example)
Empirical data for evidence-based planning
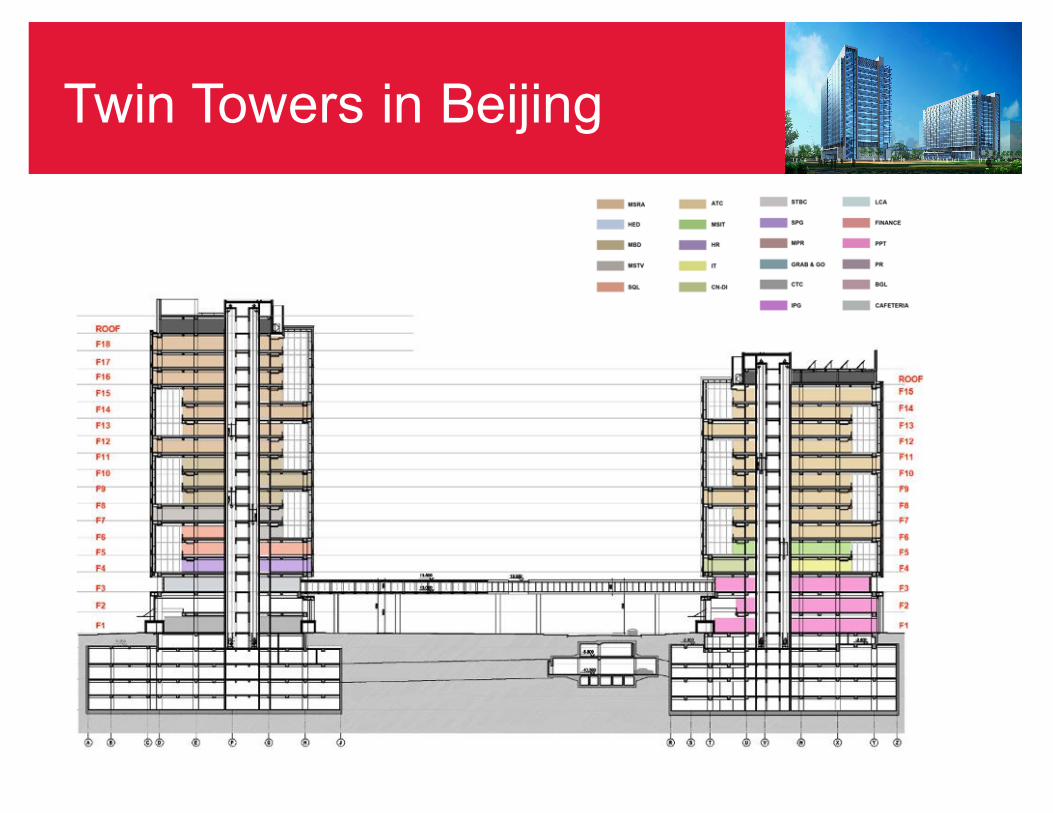
Twin Towers in Beijing
Time & Space Utilization
Active / Passive
(more heads-down work)
All Departments Avg.
(Client predicted 15%!)
35%
Antennas–Space Utilization
Space utilization – individual workstation (A4)
11/17 (Thu) Daily Average Utilization: 53.8%
Average Utilization: 35.2%(7 days avg.)
0
2
4
6:00 9:00 12:00 15:00 18:00Num
ber
of p
eopl
e
Individual workstations
Time range: 8:00 – 5:00 incl. lunch
Antennas–Space Utilization
DepartmentsAntennas–Space Utilization
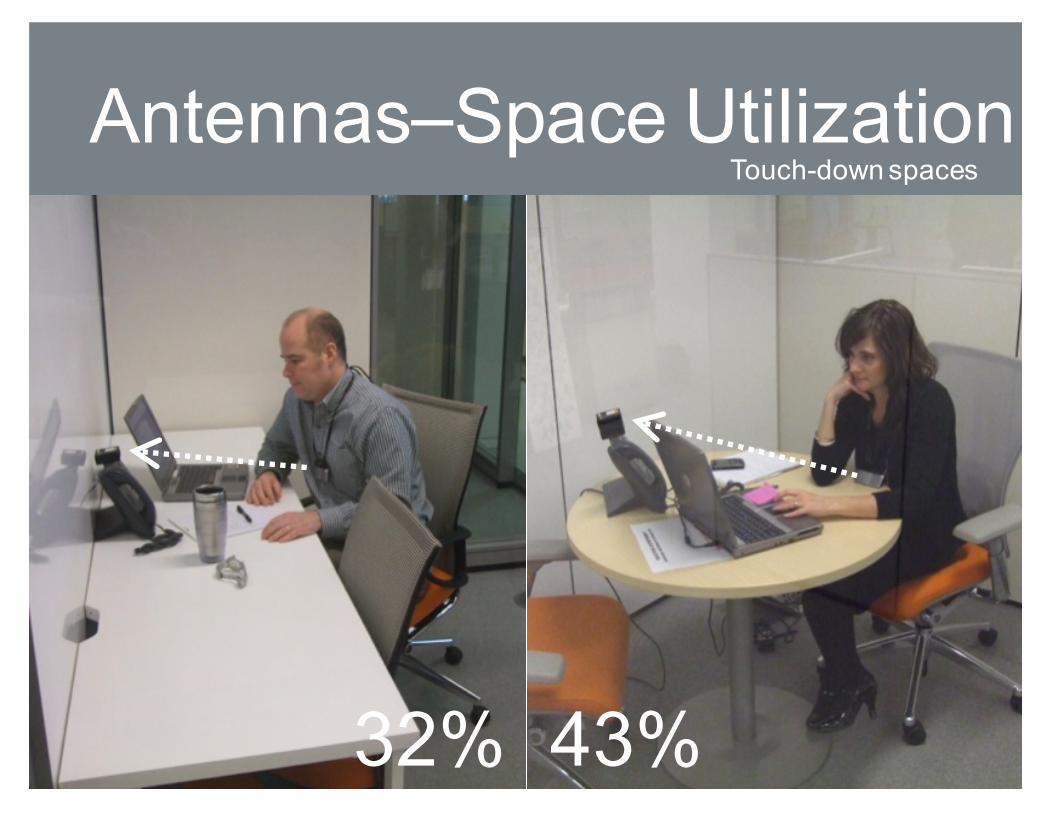
32% 43%
Touch-down spacesAntennas–Space Utilization
0
2
4
6
8
6:00 9:00 12:00 15:00 18:00
Num
ber
of p
eopl
e
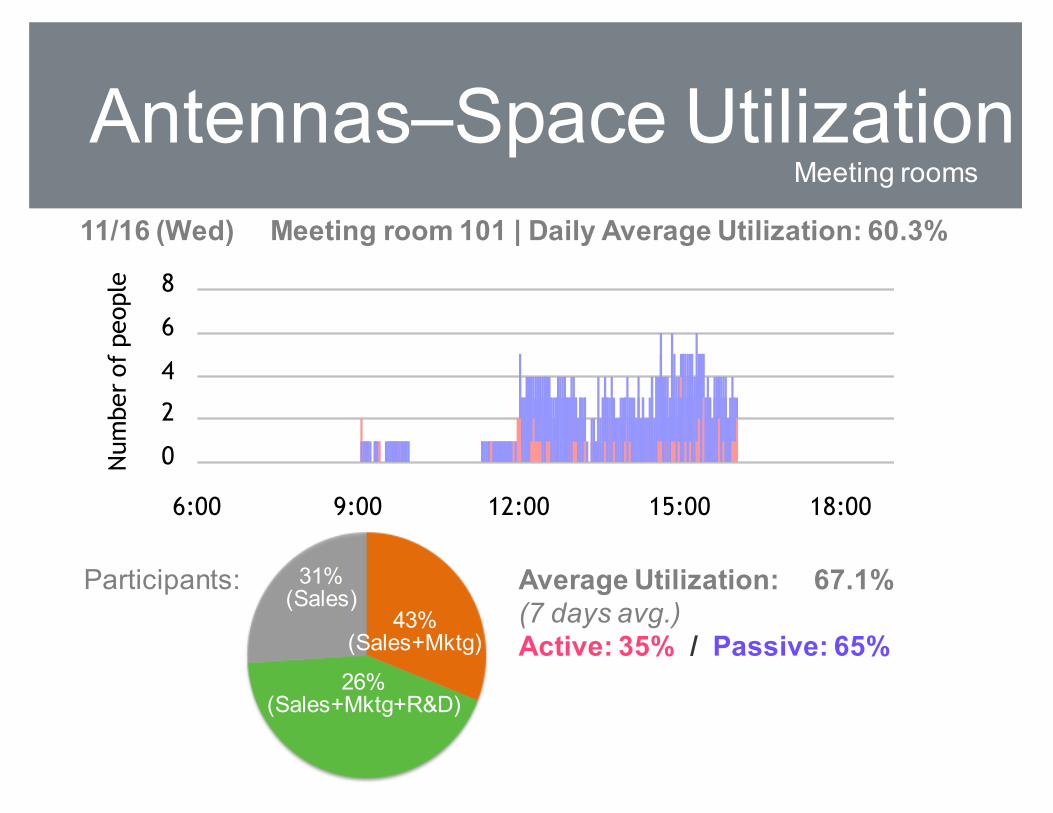
Average Utilization: 67.1%(7 days avg.)Active: 35% / Passive: 65%
31%(Sales)
43%(Sales+Mktg)
26%(Sales+Mktg+R&D)
Meeting rooms
11/16 (Wed) Meeting room 101 | Daily Average Utilization: 60.3%
Antennas–Space Utilization
Participants:
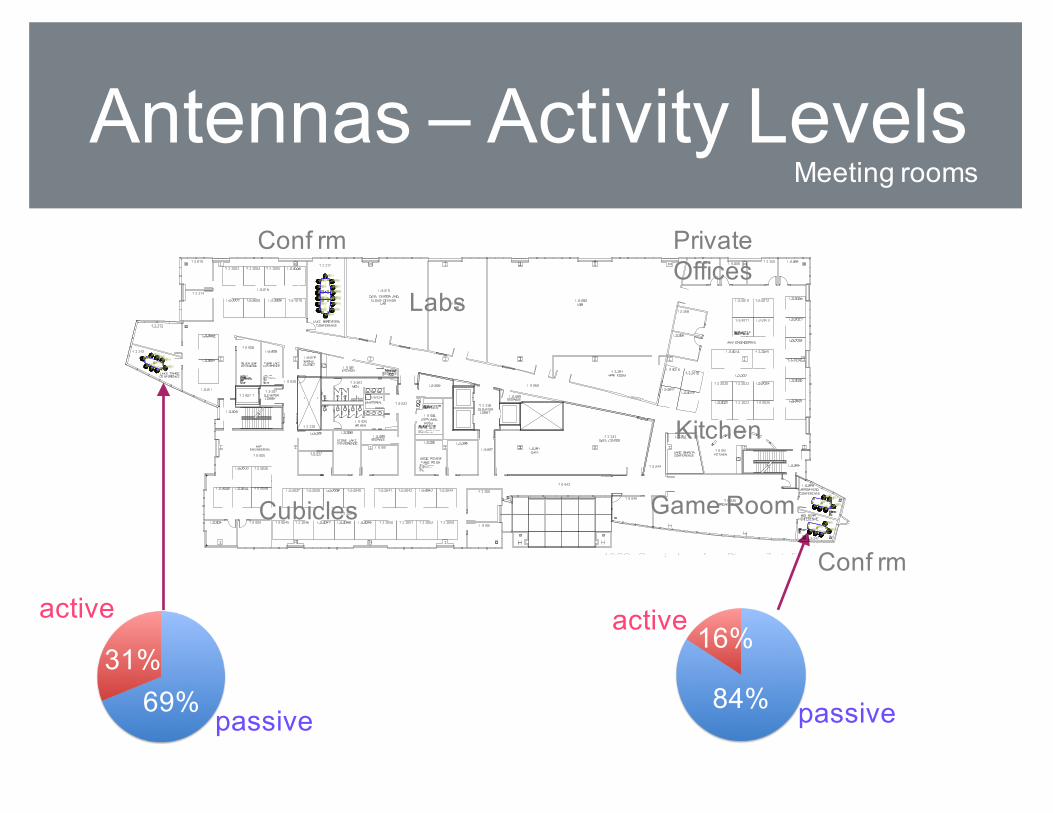
31%69%
16%
84%
active
passive
active
passive
Meeting rooms
Cubicles Game Room
Labs
Kitchen
Private Offices
Conf rm
Conf rm
Antennas – Activity Levels
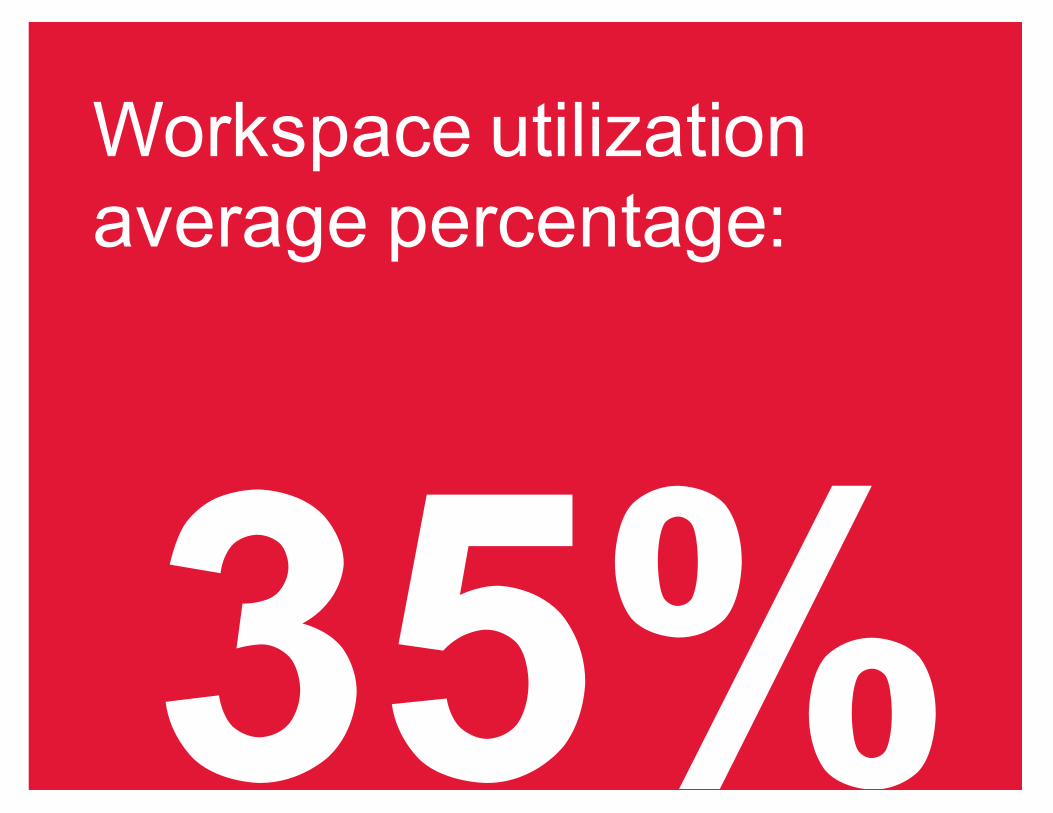
Workspace utilization average percentage:
35%
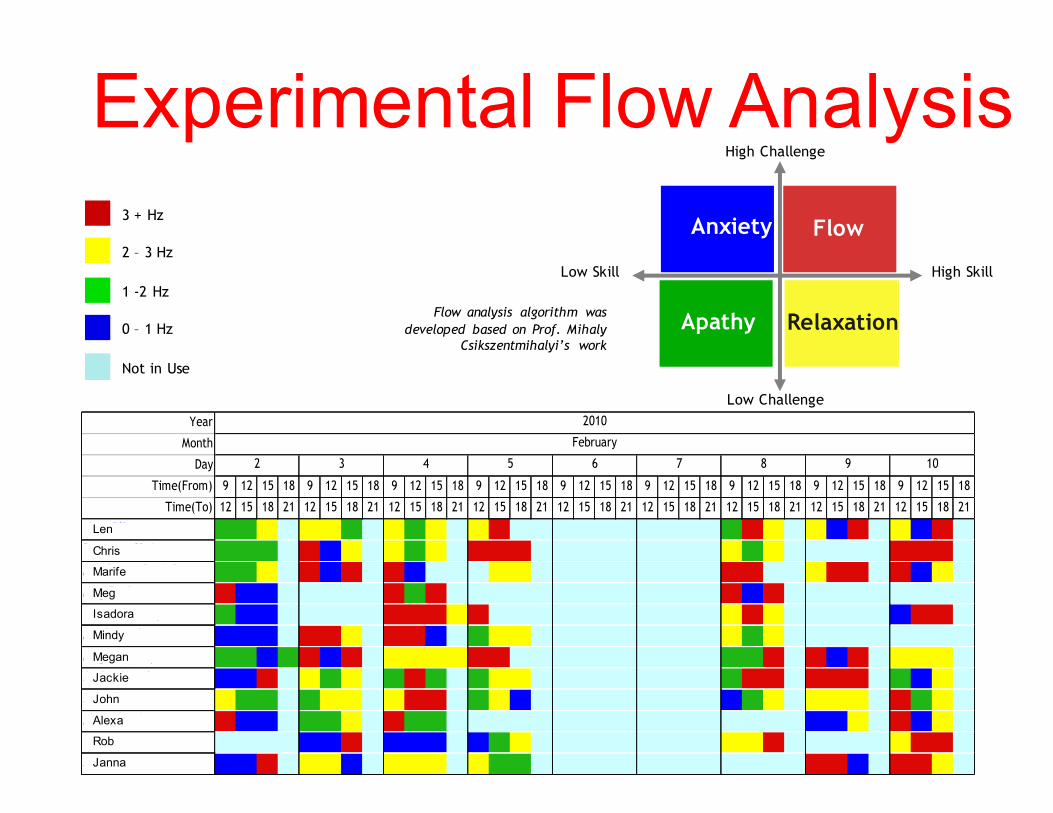
“Flow” Analysis of a Department
FlowAnxiety
Relaxation
High Challenge
High Skill
Apathy
Low Challenge
Low Skill
Flow analysis algorithm wasdeveloped based on Prof. Mihaly
Csikszentmihalyi’s work
Year
Month
Day
Time(From) 9 12 15 18 9 12 15 18 9 12 15 18 9 12 15 18 9 12 15 18 9 12 15 18 9 12 15 18 9 12 15 18 9 12 15 18
Time(To) 12 15 18 21 12 15 18 21 12 15 18 21 12 15 18 21 12 15 18 21 12 15 18 21 12 15 18 21 12 15 18 21 12 15 18 21
Len Pilon 3 3 2 0 2 2 3 0 2 3 2 0 2 1 0 0 0 0 0 0 0 0 0 0 3 1 2 0 2 4 1 0 2 4 1 0
Datema, Chris 3 3 3 0 1 4 2 0 2 3 2 0 1 1 1 0 0 0 0 0 0 0 0 0 2 3 2 0 0 0 0 0 1 1 1 0
Marife Vander Schuur 3 3 2 0 1 4 1 0 1 4 0 0 0 2 2 0 0 0 0 0 0 0 0 0 1 1 0 0 2 1 1 0 1 4 2 0
Meg Zerfas 1 4 4 0 0 0 0 0 1 3 1 0 0 0 0 0 0 0 0 0 0 0 0 0 1 4 1 0 0 0 0 0 0 0 0 0
Isadora Godley 3 4 4 0 0 0 0 0 1 1 1 2 1 0 0 0 0 0 0 0 0 0 0 0 2 1 2 0 0 0 0 0 4 1 1 0
Mindy Heyboer 4 4 4 0 1 1 2 0 1 1 4 0 3 2 2 0 0 0 0 0 0 0 0 0 2 3 2 0 0 0 0 0 0 0 0 0
Megen Murray 3 3 4 3 1 4 1 0 2 2 2 2 1 1 0 0 0 0 0 0 0 0 0 0 3 3 1 0 1 4 1 0 2 2 2 0
Jackie Neerken 4 4 1 0 2 3 2 0 3 1 3 0 3 2 2 0 0 0 0 0 0 0 0 0 3 1 1 0 1 1 1 0 3 4 2 0
John Scott 2 3 3 0 3 2 2 0 2 1 1 0 3 2 4 0 0 0 0 0 0 0 0 0 4 3 2 0 2 2 2 0 1 3 2 0
Alexa Smith 1 4 4 0 3 3 2 0 1 3 3 0 0 0 0 0 0 0 0 0 0 0 0 0 0 0 0 0 4 4 2 0 1 4 2 0
Rob Standish 0 0 0 0 4 4 1 0 4 4 4 0 4 3 2 0 0 0 0 0 0 0 0 0 2 2 1 0 0 0 0 0 2 1 1 0
Janna Szotko 4 4 1 0 2 2 4 0 2 2 2 0 2 3 3 0 0 0 0 0 0 0 0 0 0 0 0 0 1 1 4 0 1 1 2 0
8 9 10
2010
February
2 3 4 5 6 7
Len
Chris
Marife
Meg
Isadora
Mindy
Megan
Jackie
John
Alexa
Rob
Janna
3 + Hz
2 – 3 Hz
1 -2 Hz
0 – 1 Hz
Not in Use
Experimental Flow Analysis
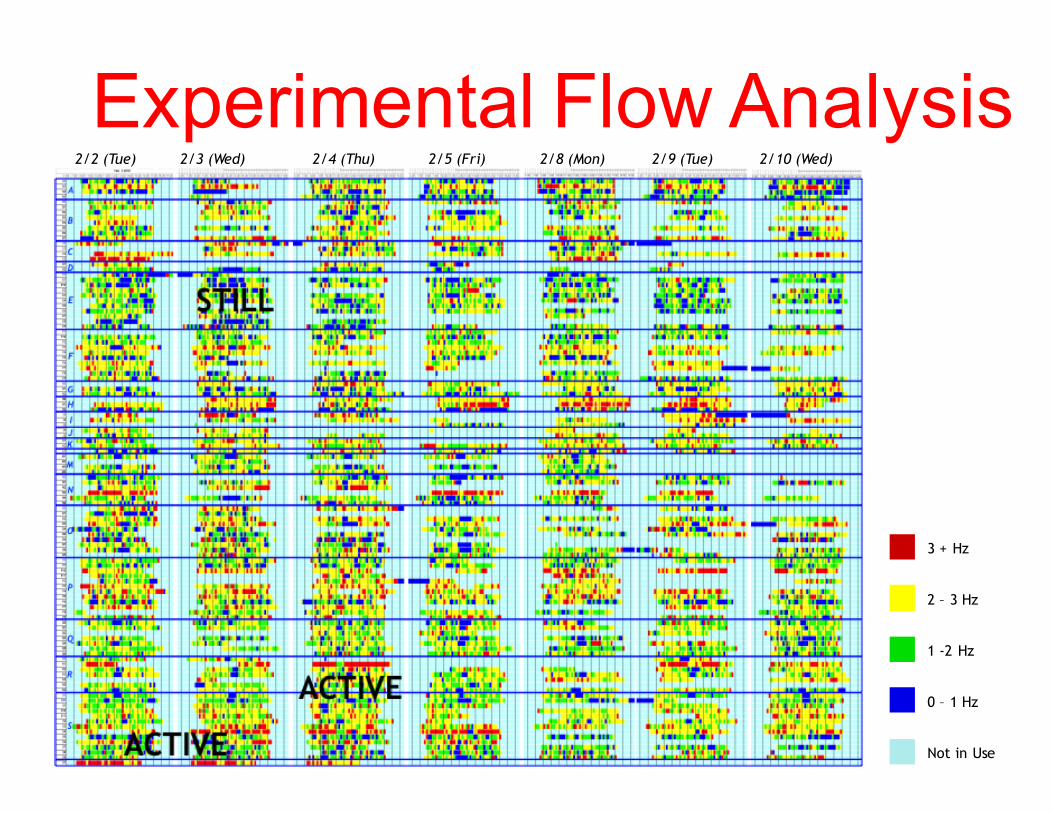
2/2 (Tue) 2/3 (Wed) 2/4 (Thu) 2/5 (Fri) 2/9 (Tue) 2/10 (Wed)2/8 (Mon)
“Flow” Pattern Diagnosis for All Departments
3 + Hz
2 – 3 Hz
1 -2 Hz
0 – 1 Hz
Not in Use
Experimental Flow Analysis
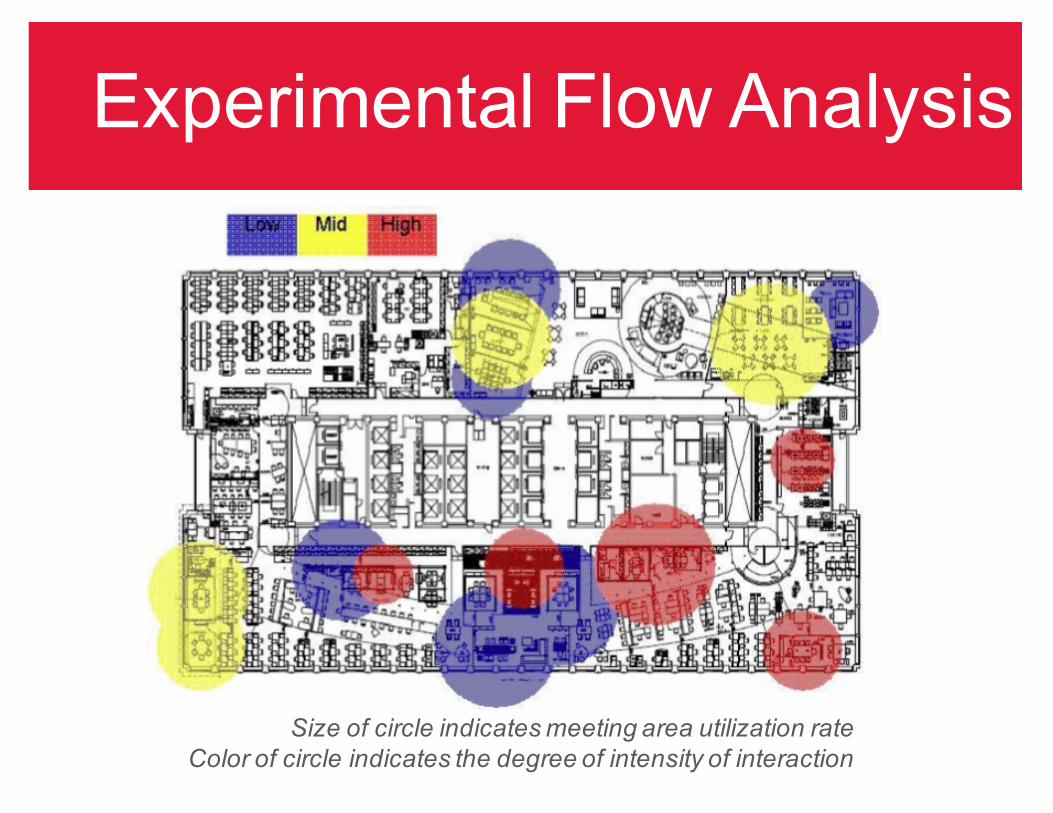
Size of circle indicates meeting area utilization rateColor of circle indicates the degree of intensity of interaction
Intensity of Interaction (Hitachi High-Tech)
Experimental Flow Analysis