Embed Size (px)
Citation preview
The Science Behind Sustainable Communities Strategies
Susan Handy
ARB Research Seminar October 7, 2014
1
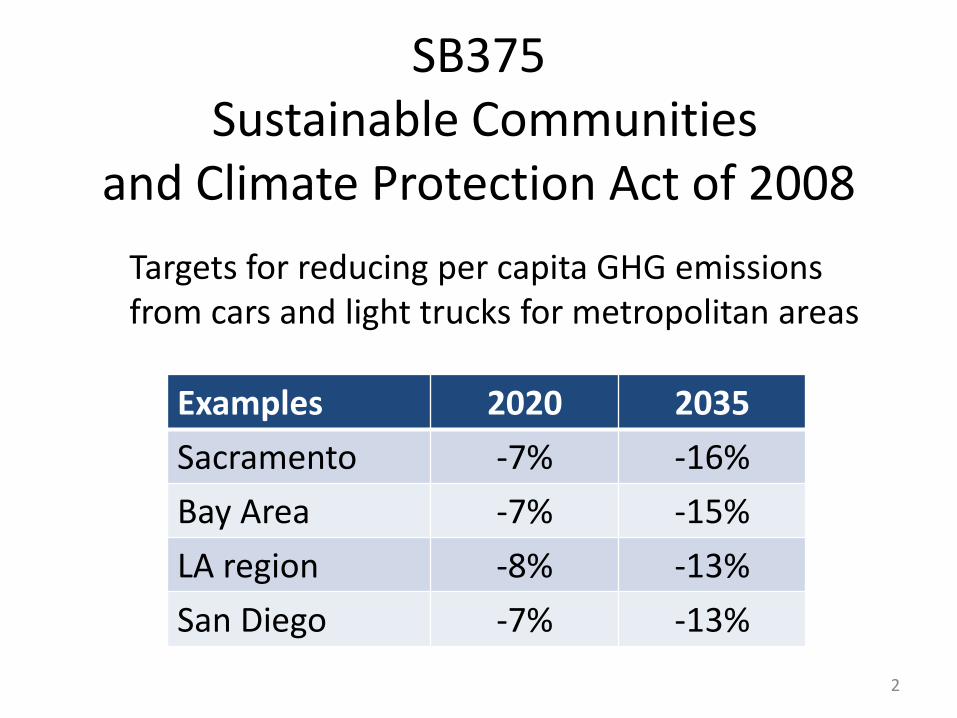
SB375 Sustainable Communities
and Climate Protection Act of 2008
Targets for reducing per capita GHG emissions from cars and light trucks for metropolitan areas
Examples 2020 2035
Sacramento -7% -16%
Bay Area -7% -15%
LA region -8% -13%
San Diego -7% -13%
2
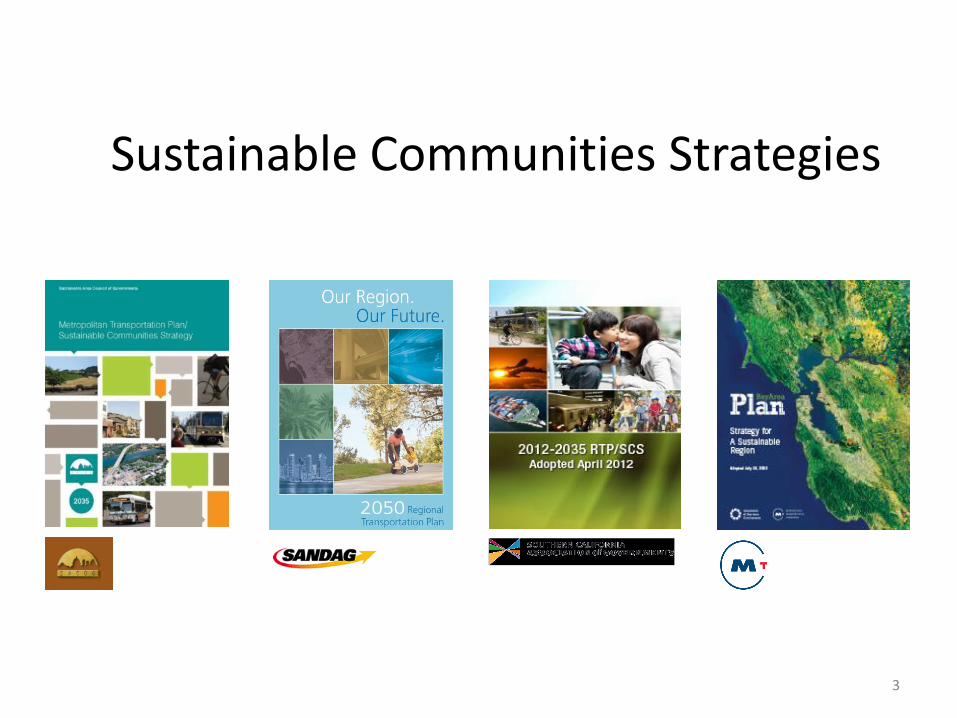
Sustainable Communities Strategies
3
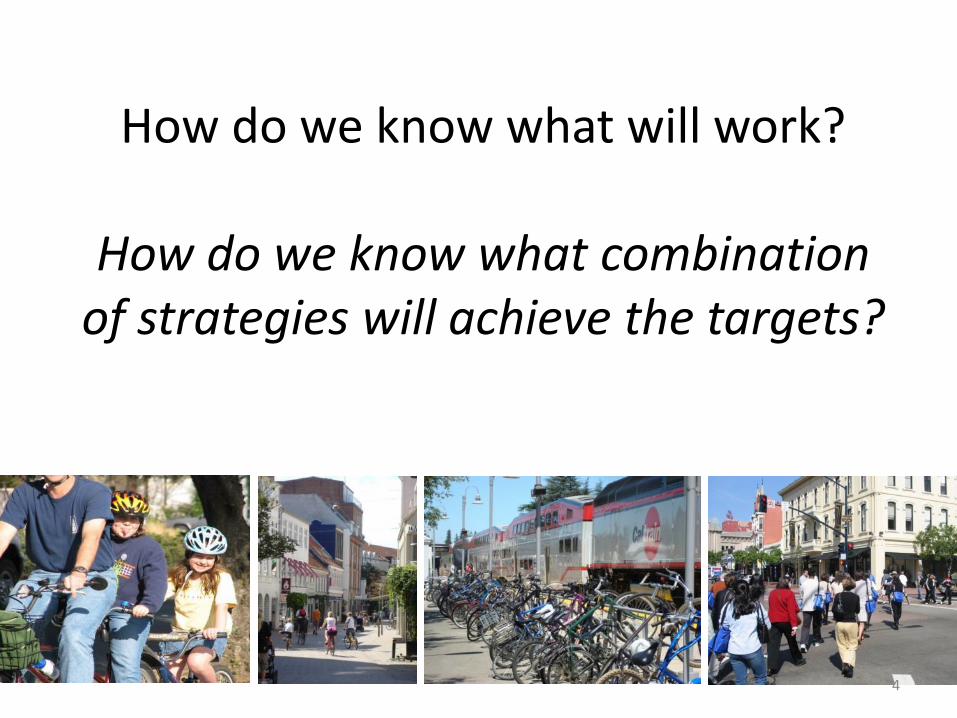
How do we know what will work?
How do we know what combination of strategies will achieve the targets?
4
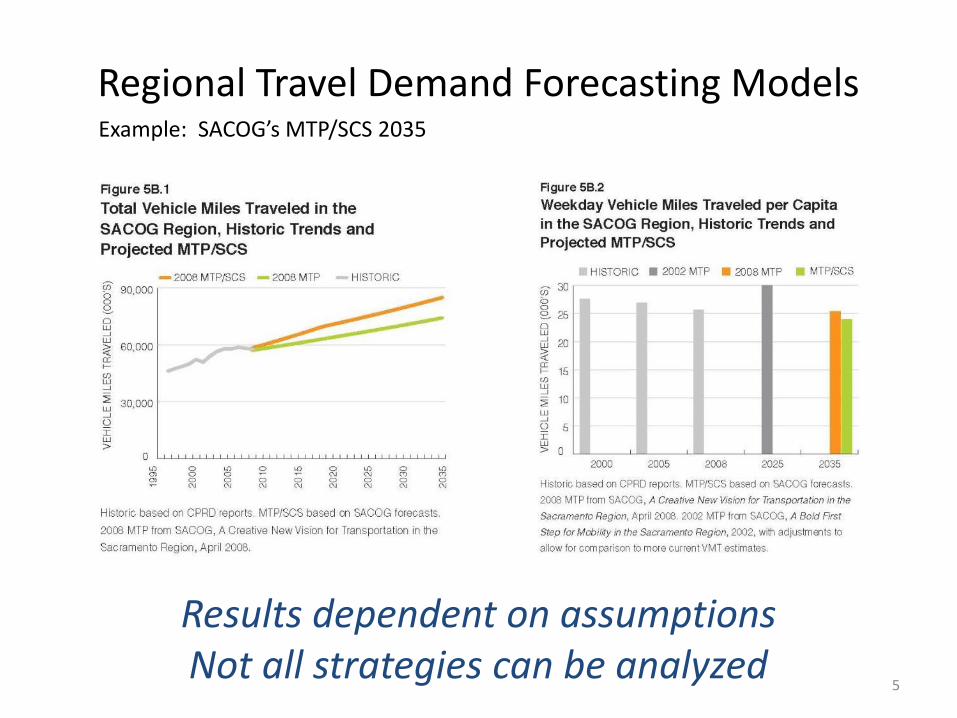
Regional Travel Demand Forecasting Models
Results dependent on assumptions Not all strategies can be analyzed
Example: SACOG’s MTP/SCS 2035
5
Impact of Transportation and Land-Use Related Policies on Passenger Vehicle Use
and GHG Emissions
2010: 15 strategies
2012-14: updates plus 8 more strategies
Susan Handy, UC Davis, and Marlon Boarnet, USC
with Gil Tal, Kristin Lovejoy, Caroline Rodier, Giovanni Circella,
and Steven Spears, Hsin-Ping Shu, David Weinreich
6
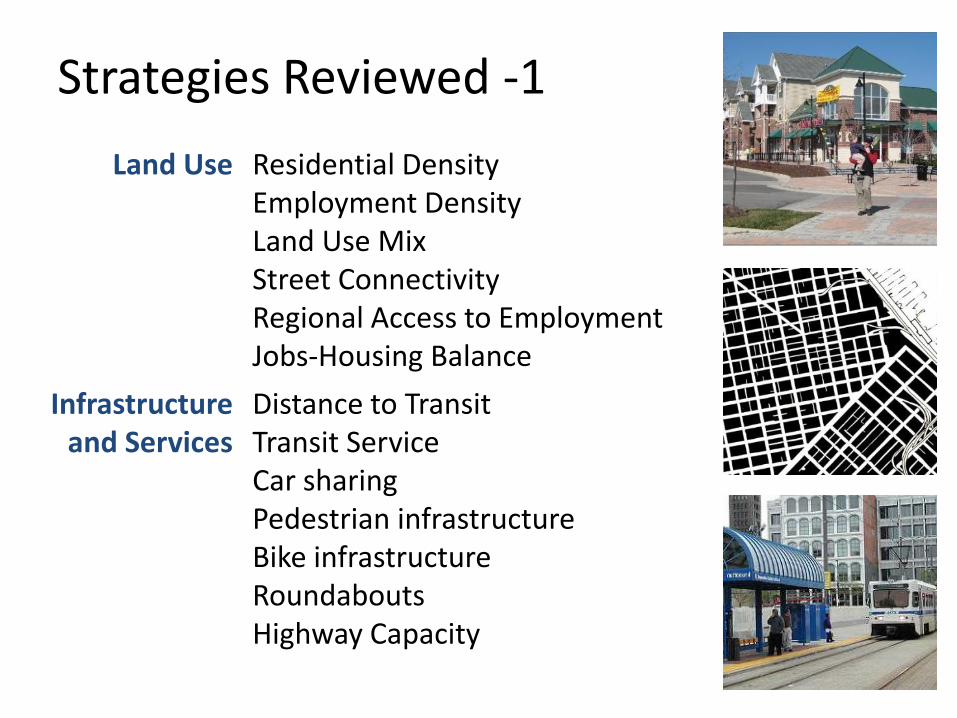
Strategies Reviewed -1
Land Use Residential Density Employment Density Land Use Mix Street Connectivity Regional Access to Employment Jobs-Housing Balance
Infrastructure and Services
Distance to Transit Transit Service Car sharing Pedestrian infrastructure Bike infrastructure Roundabouts Highway Capacity
7
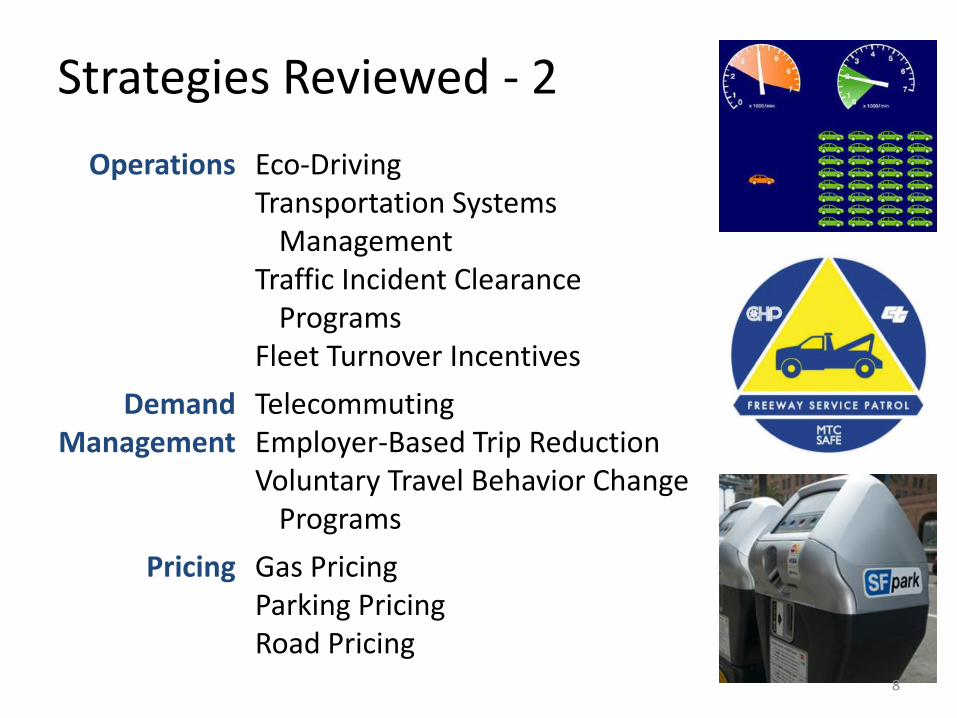
Operations Eco-Driving Transportation Systems
Management Traffic Incident Clearance
Programs Fleet Turnover Incentives
Demand Management
Telecommuting Employer-Based Trip Reduction Voluntary Travel Behavior Change
Programs
Pricing Gas Pricing Parking Pricing Road Pricing
Strategies Reviewed - 2
8
Evidence from the peer-reviewed literature
Some research reports included Reliance on review papers when available
9
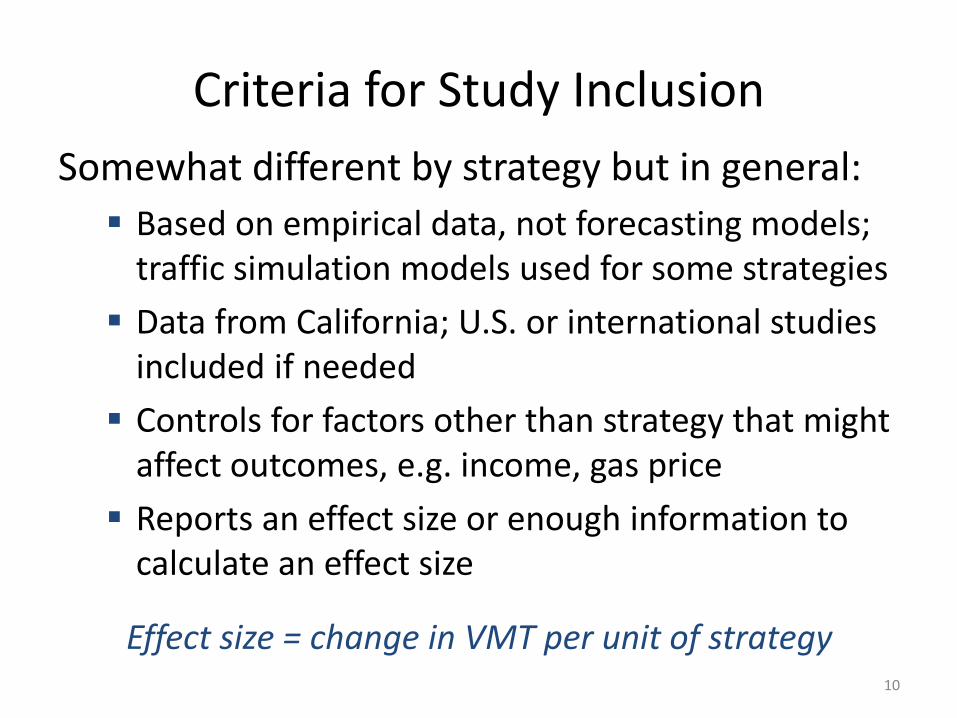
Criteria for Study Inclusion
Somewhat different by strategy but in general:
Based on empirical data, not forecasting models; traffic simulation models used for some strategies
Data from California; U.S. or international studies included if needed
Controls for factors other than strategy that might affect outcomes, e.g. income, gas price
Reports an effect size or enough information to calculate an effect size
10
Effect size = change in VMT per unit of strategy
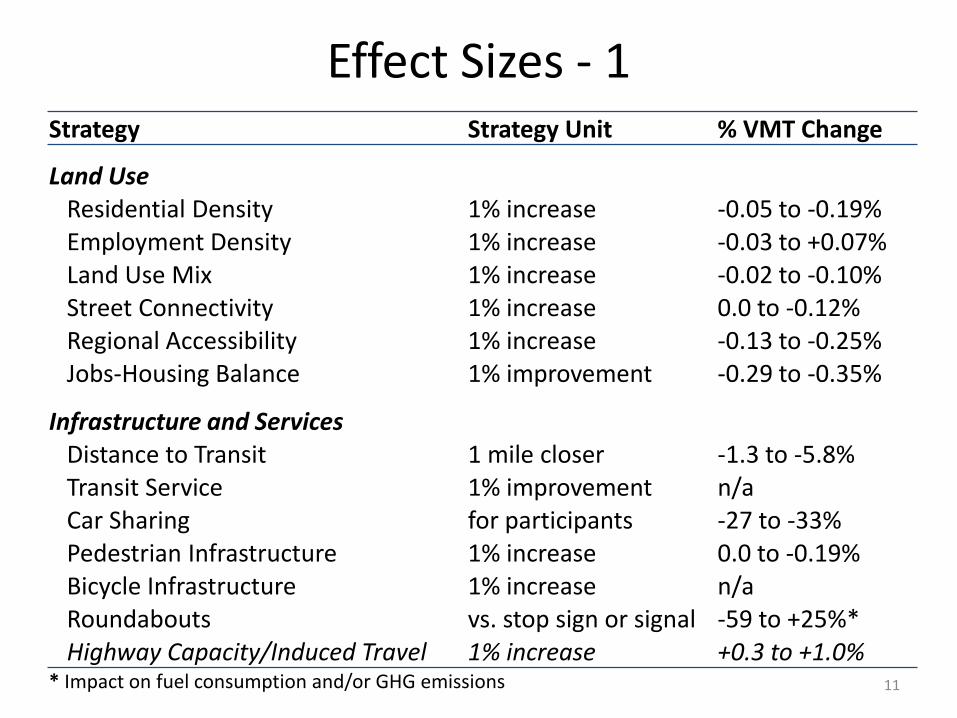
Strategy Strategy Unit % VMT Change
Land Use Residential Density 1% increase -0.05 to -0.19% Employment Density 1% increase -0.03 to +0.07% Land Use Mix 1% increase -0.02 to -0.10% Street Connectivity 1% increase 0.0 to -0.12% Regional Accessibility 1% increase -0.13 to -0.25% Jobs-Housing Balance 1% improvement -0.29 to -0.35%
Infrastructure and Services Distance to Transit 1 mile closer -1.3 to -5.8% Transit Service 1% improvement n/a Car Sharing for participants -27 to -33% Pedestrian Infrastructure 1% increase 0.0 to -0.19% Bicycle Infrastructure 1% increase n/a Roundabouts vs. stop sign or signal -59 to +25%* Highway Capacity/Induced Travel 1% increase +0.3 to +1.0% * Impact on fuel consumption and/or GHG emissions
Effect Sizes - 1
11
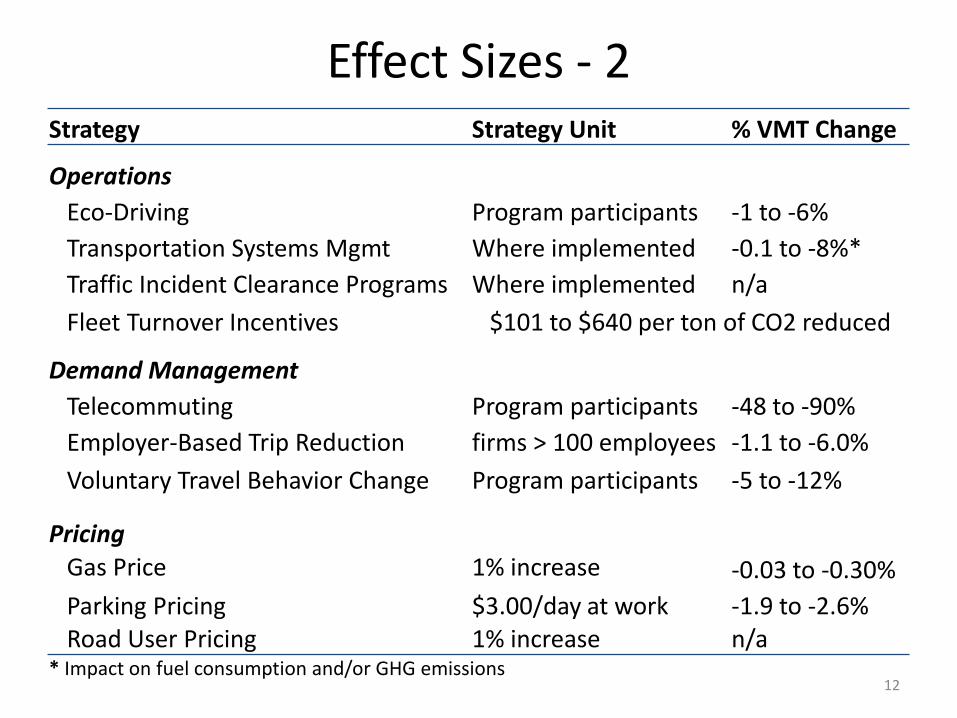
Effect Sizes - 2 Strategy Strategy Unit % VMT Change
Operations
Eco-Driving Program participants -1 to -6%
Transportation Systems Mgmt Where implemented -0.1 to -8%*
Traffic Incident Clearance Programs Where implemented n/a
Fleet Turnover Incentives $101 to $640 per ton of CO2 reduced
Demand Management
Telecommuting Program participants -48 to -90%
Employer-Based Trip Reduction firms > 100 employees -1.1 to -6.0%
Voluntary Travel Behavior Change Program participants -5 to -12%
Pricing
Gas Price 1% increase -0.03 to -0.30%
Parking Pricing $3.00/day at work -1.9 to -2.6% Road User Pricing 1% increase n/a * Impact on fuel consumption and/or GHG emissions
12
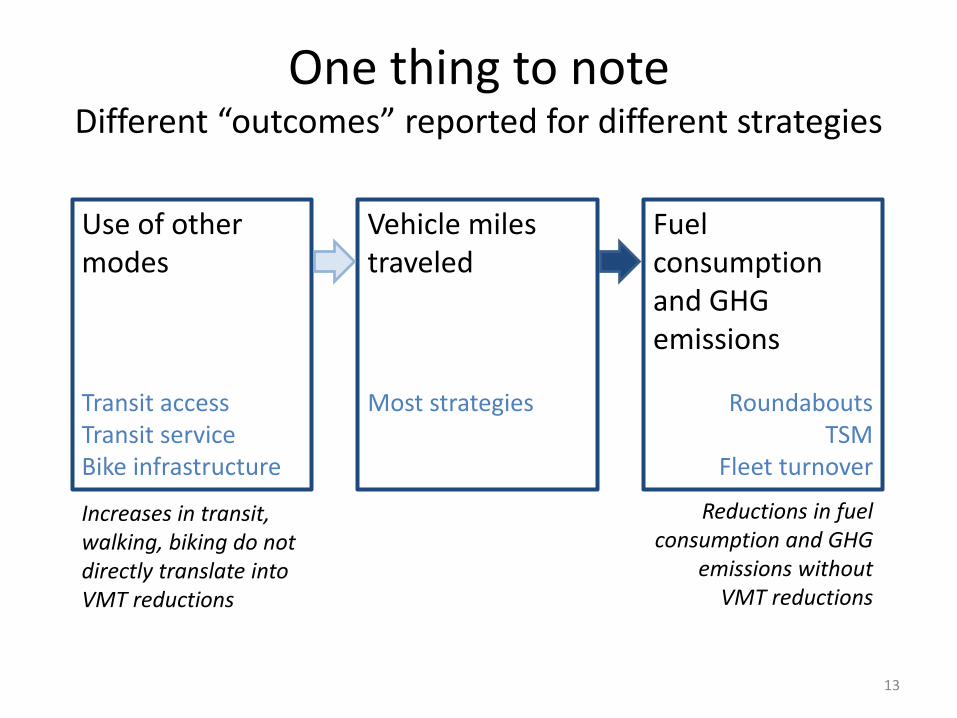
One thing to note Different “outcomes” reported for different strategies
Vehicle miles traveled
Most strategies
Fuel consumption and GHG emissions
Roundabouts TSM
Fleet turnover
Reductions in fuel consumption and GHG
emissions without VMT reductions
Use of other modes
Transit access Transit service Bike infrastructure
Increases in transit, walking, biking do not directly translate into VMT reductions
13
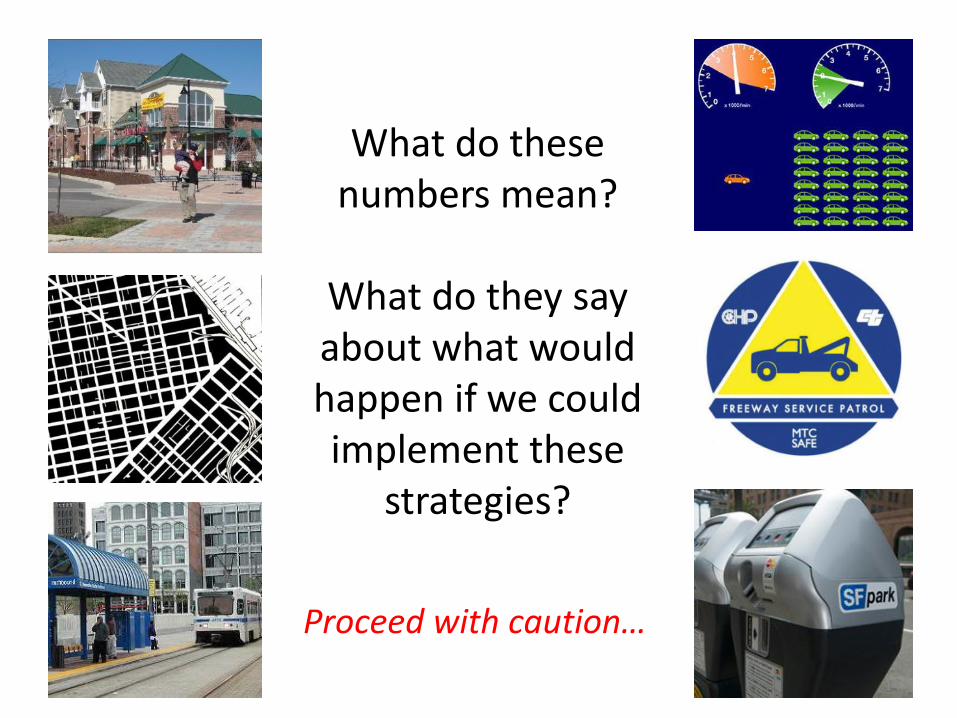
What do these numbers mean?
What do they say about what would happen if we could implement these
strategies?
Proceed with caution…
14
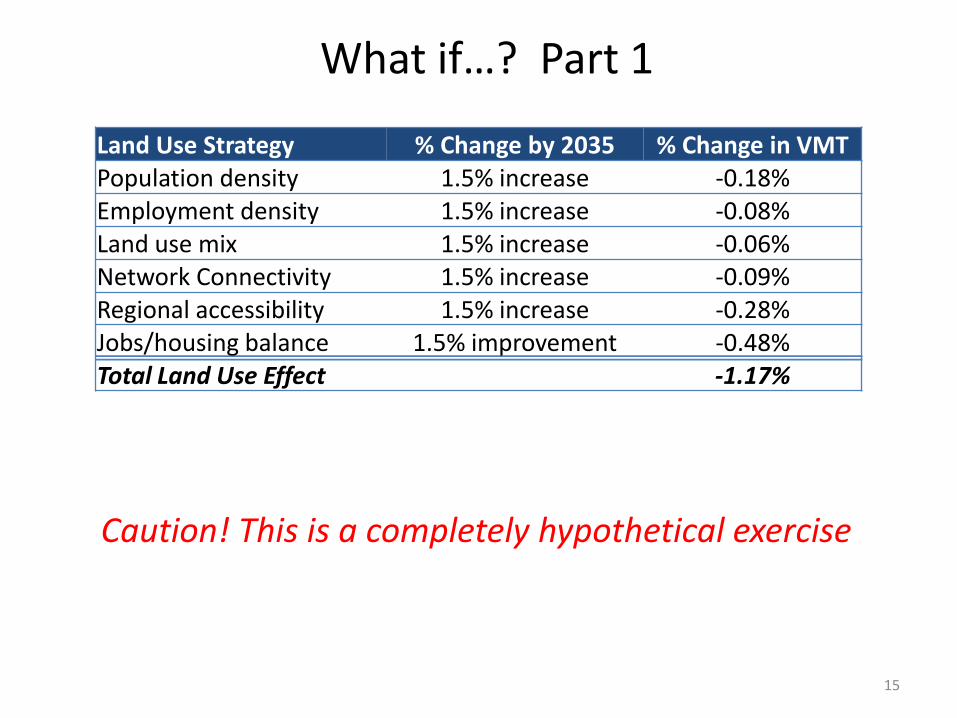
What if…? Part 1
Land Use Strategy % Change by 2035 % Change in VMT Population density 1.5% increase -0.18% Employment density 1.5% increase -0.08% Land use mix 1.5% increase -0.06% Network Connectivity 1.5% increase -0.09% Regional accessibility 1.5% increase -0.28% Jobs/housing balance 1.5% improvement -0.48% Total Land Use Effect -1.17%
Caution! This is a completely hypothetical exercise
15
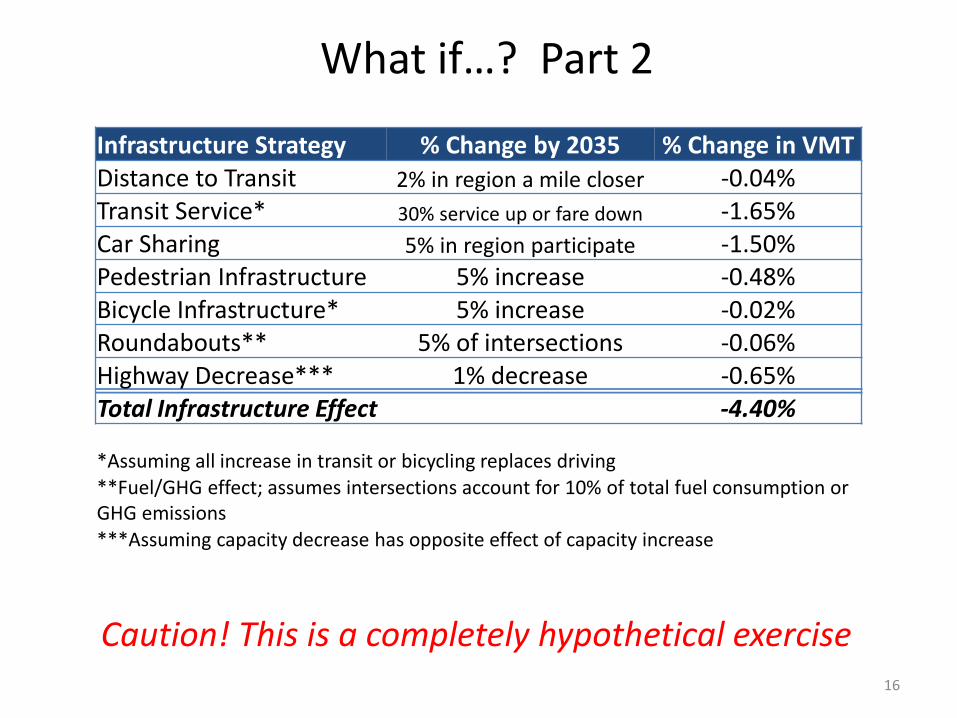
What if…? Part 2
Infrastructure Strategy % Change by 2035 % Change in VMT Distance to Transit 2% in region a mile closer -0.04% Transit Service* 30% service up or fare down -1.65% Car Sharing 5% in region participate -1.50% Pedestrian Infrastructure 5% increase -0.48% Bicycle Infrastructure* 5% increase -0.02% Roundabouts** 5% of intersections -0.06% Highway Decrease*** 1% decrease -0.65% Total Infrastructure Effect -4.40%
*Assuming all increase in transit or bicycling replaces driving **Fuel/GHG effect; assumes intersections account for 10% of total fuel consumption or GHG emissions
***Assuming capacity decrease has opposite effect of capacity increase
Caution! This is a completely hypothetical exercise
16
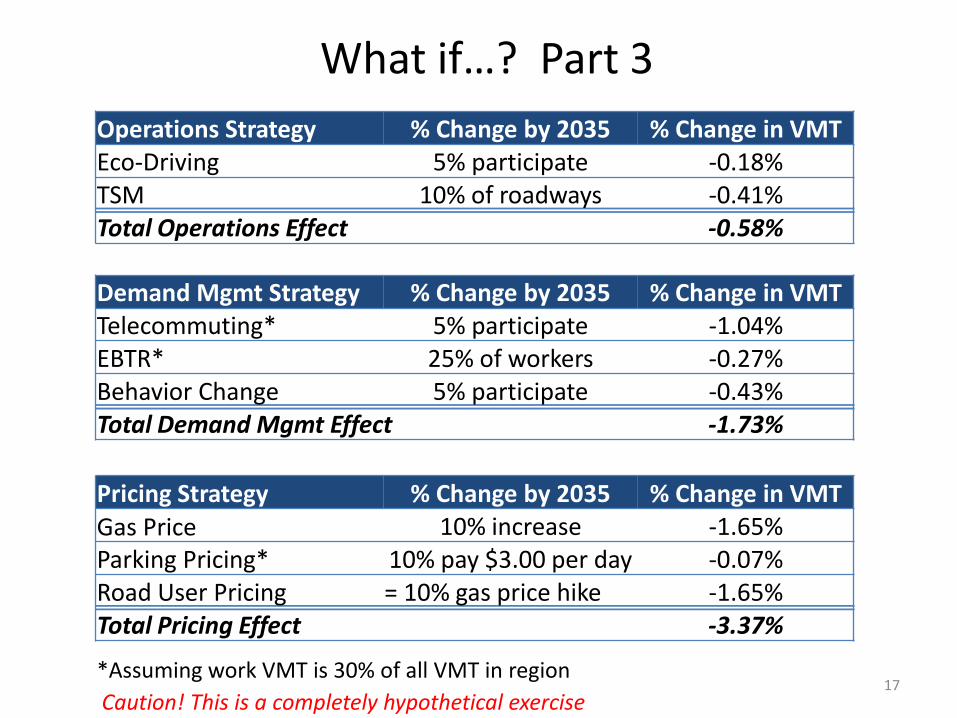
What if…? Part 3
Operations Strategy % Change by 2035 % Change in VMT Eco-Driving 5% participate -0.18% TSM 10% of roadways -0.41% Total Operations Effect -0.58%
Demand Mgmt Strategy % Change by 2035 % Change in VMT Telecommuting* 5% participate -1.04% EBTR* 25% of workers -0.27% Behavior Change 5% participate -0.43% Total Demand Mgmt Effect -1.73%
Pricing Strategy % Change by 2035 % Change in VMT
Gas Price 10% increase -1.65% Parking Pricing* 10% pay $3.00 per day -0.07% Road User Pricing = 10% gas price hike -1.65% Total Pricing Effect -3.37%
*Assuming work VMT is 30% of all VMT in region
Caution! This is a completely hypothetical exercise 17
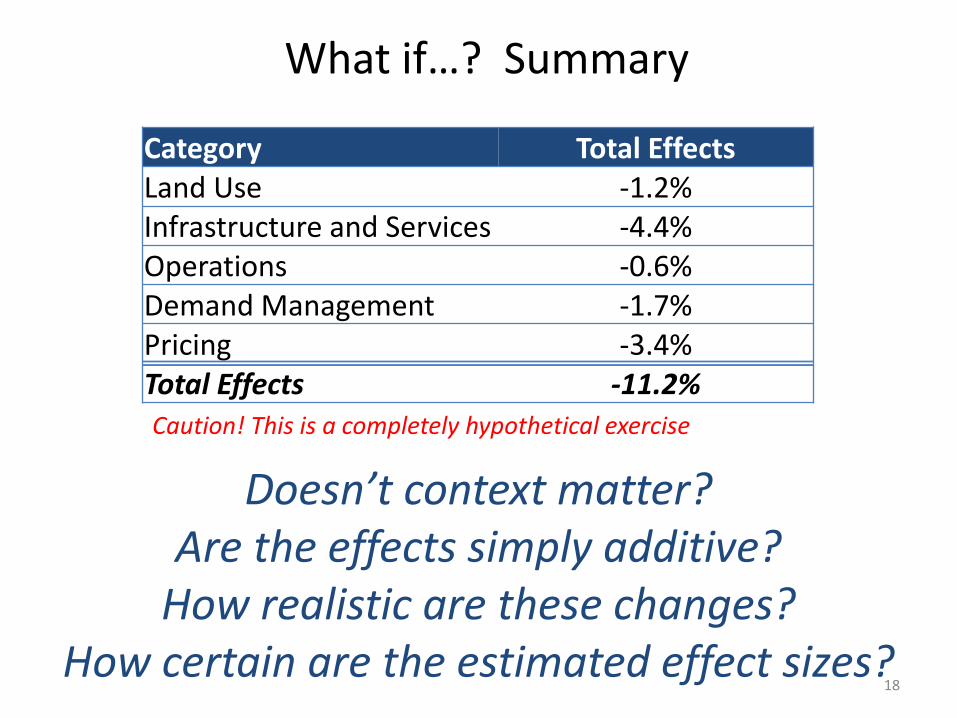
What if…? Summary
Category Total Effects Land Use -1.2% Infrastructure and Services -4.4% Operations -0.6% Demand Management -1.7% Pricing -3.4% Total Effects -11.2%
Doesn’t context matter? Are the effects simply additive?
How realistic are these changes? How certain are the estimated effect sizes?
Caution! This is a completely hypothetical exercise
18
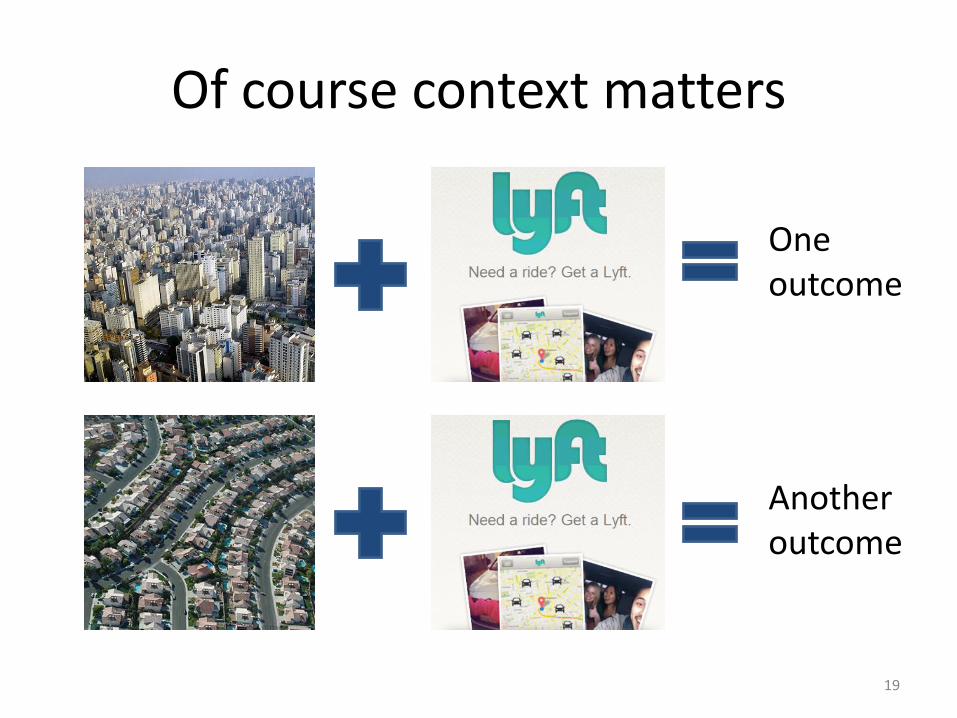
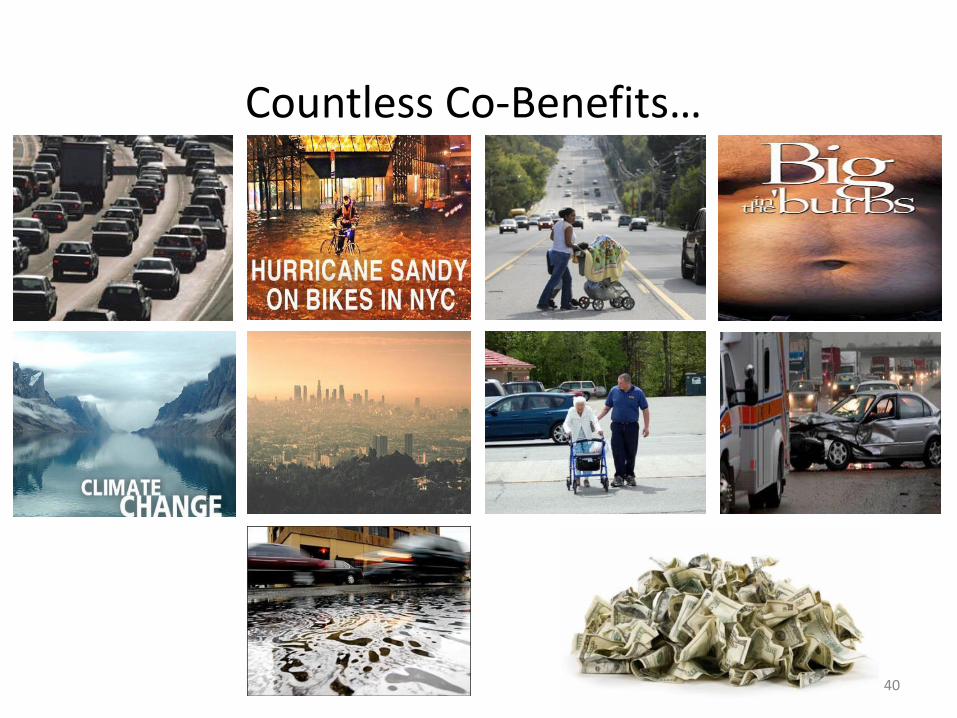
Of course context matters
One outcome
Another outcome
19
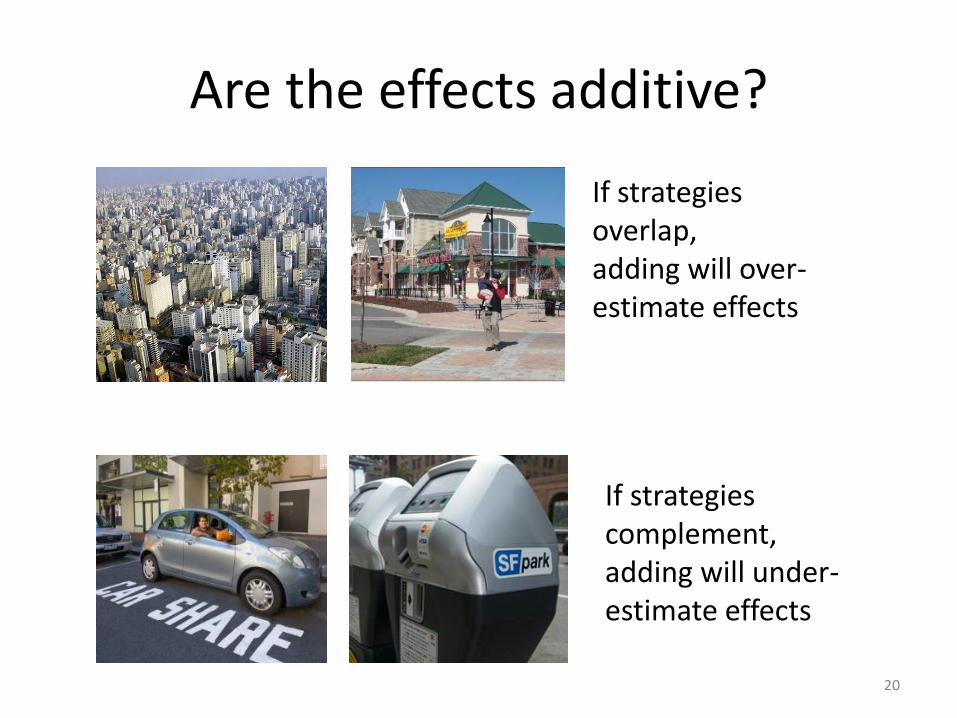
Are the effects additive?
If strategies overlap, adding will over-estimate effects
If strategies complement, adding will under-estimate effects
20
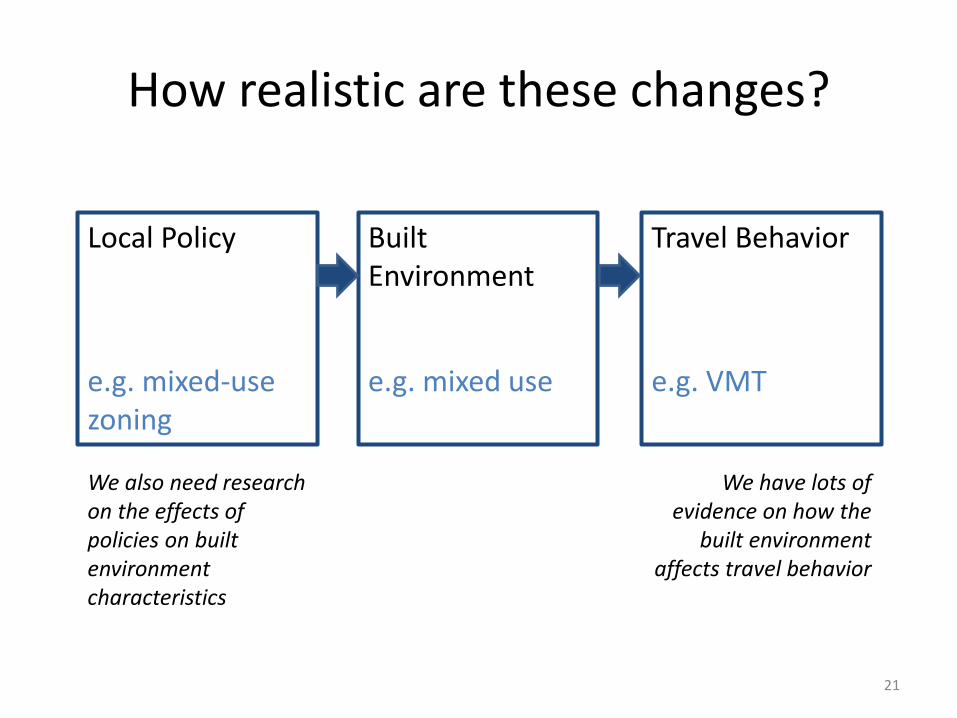
Built Environment
e.g. mixed use
Travel Behavior
e.g. VMT
How realistic are these changes?
Local Policy
e.g. mixed-use zoning
We also need research on the effects of policies on built environment characteristics
We have lots of evidence on how the
built environment affects travel behavior
21
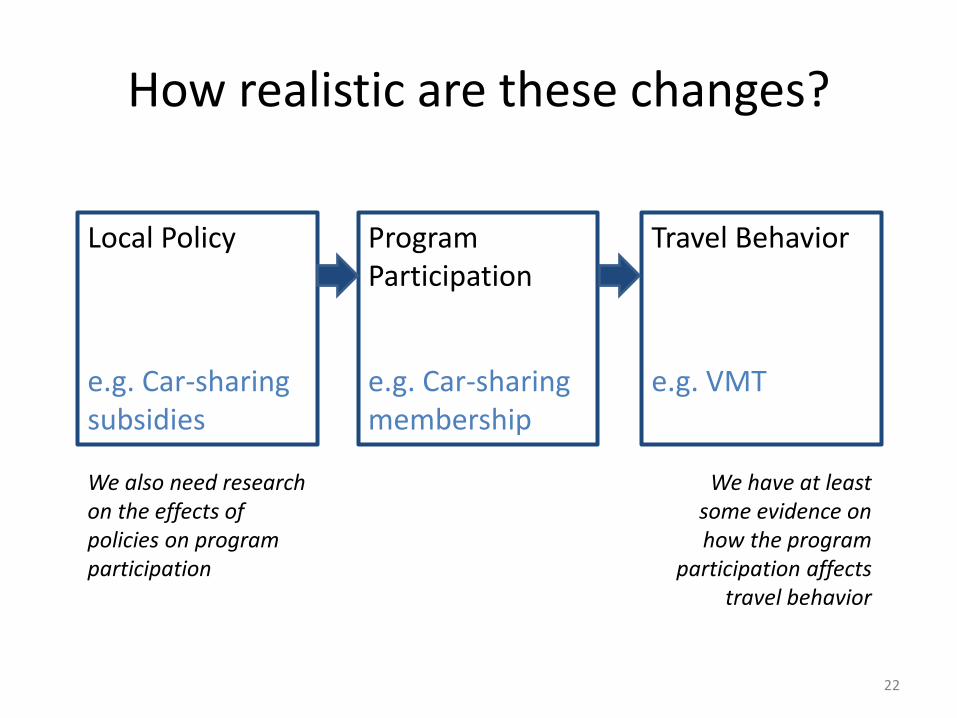
Program Participation
e.g. Car-sharing membership
Travel Behavior
e.g. VMT
How realistic are these changes?
Local Policy
e.g. Car-sharing subsidies
We also need research on the effects of policies on program participation
We have at least some evidence on how the program
participation affects travel behavior
22
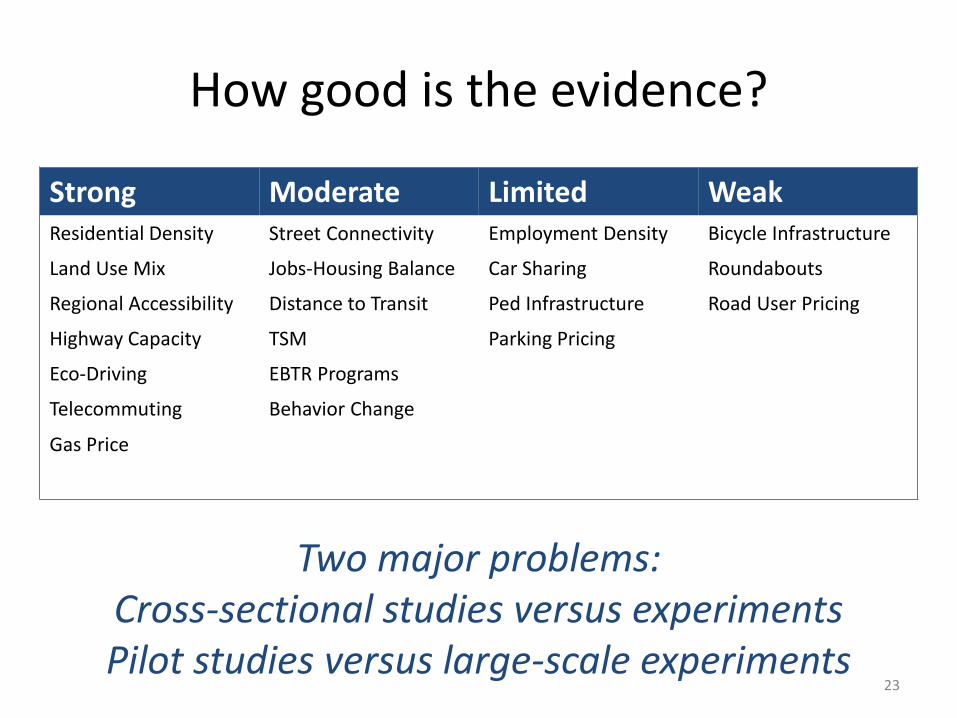
How good is the evidence?
Strong Moderate Limited Weak Residential Density Street Connectivity Employment Density Bicycle Infrastructure
Land Use Mix Jobs-Housing Balance Car Sharing Roundabouts
Regional Accessibility Distance to Transit Ped Infrastructure Road User Pricing
Highway Capacity TSM Parking Pricing
Eco-Driving EBTR Programs
Telecommuting Behavior Change
Gas Price
Two major problems: Cross-sectional studies versus experiments Pilot studies versus large-scale experiments
23
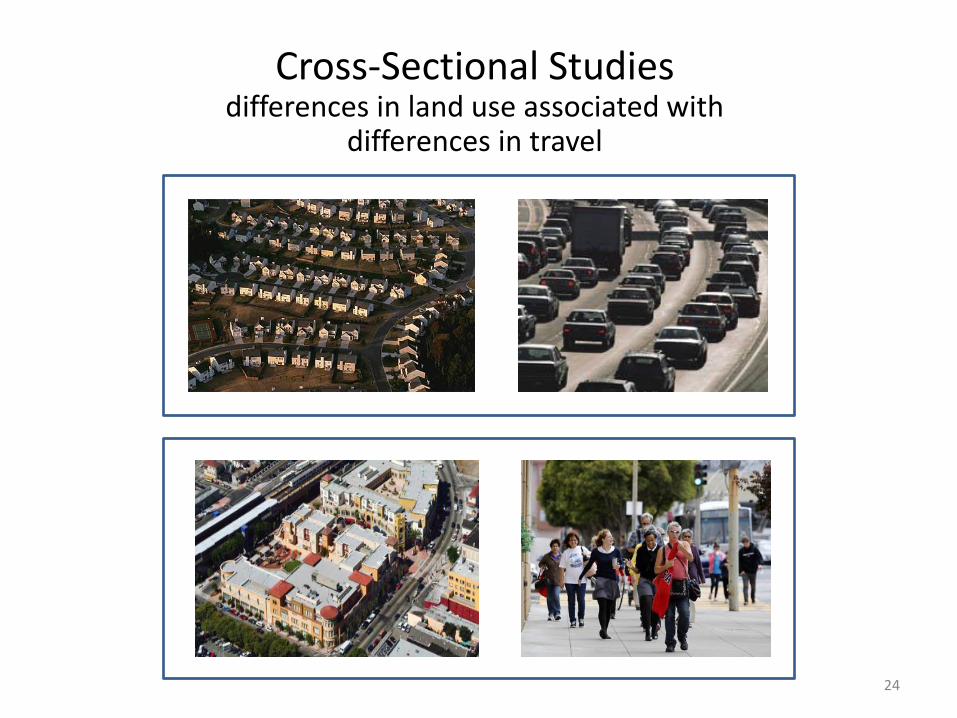
Cross-Sectional Studies differences in land use associated with
differences in travel
24
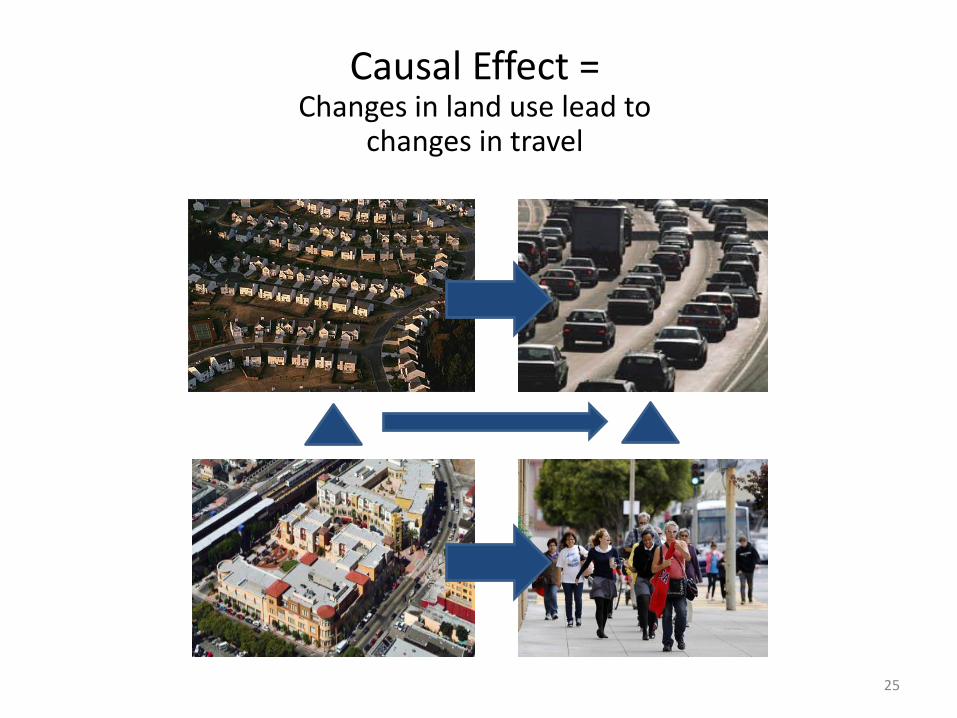
Causal Effect = Changes in land use lead to
changes in travel
25
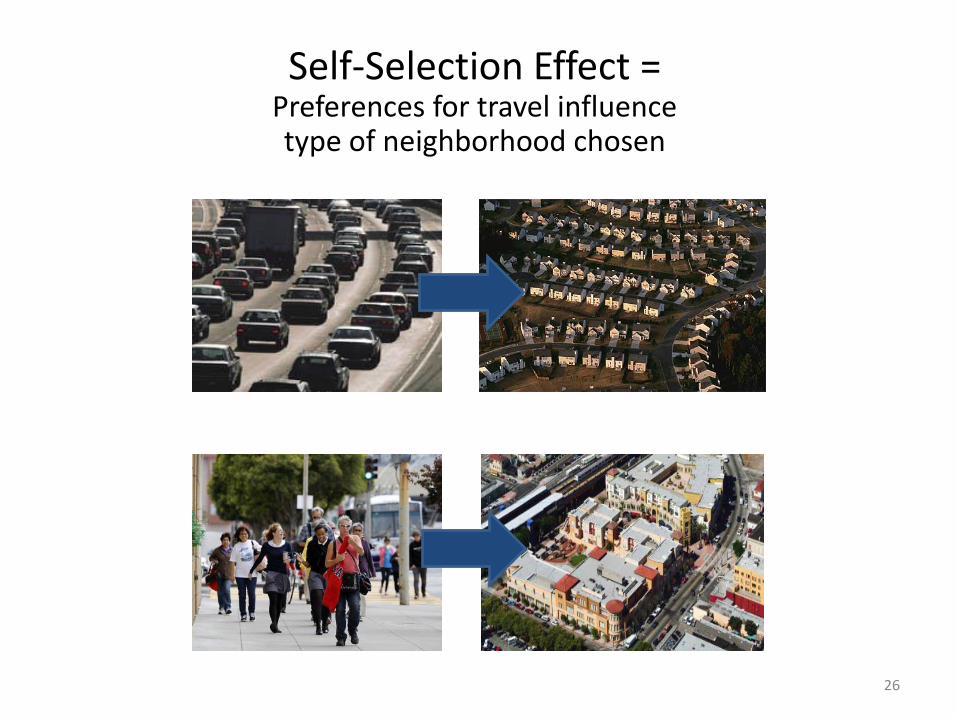
Self-Selection Effect = Preferences for travel influence type of neighborhood chosen
26
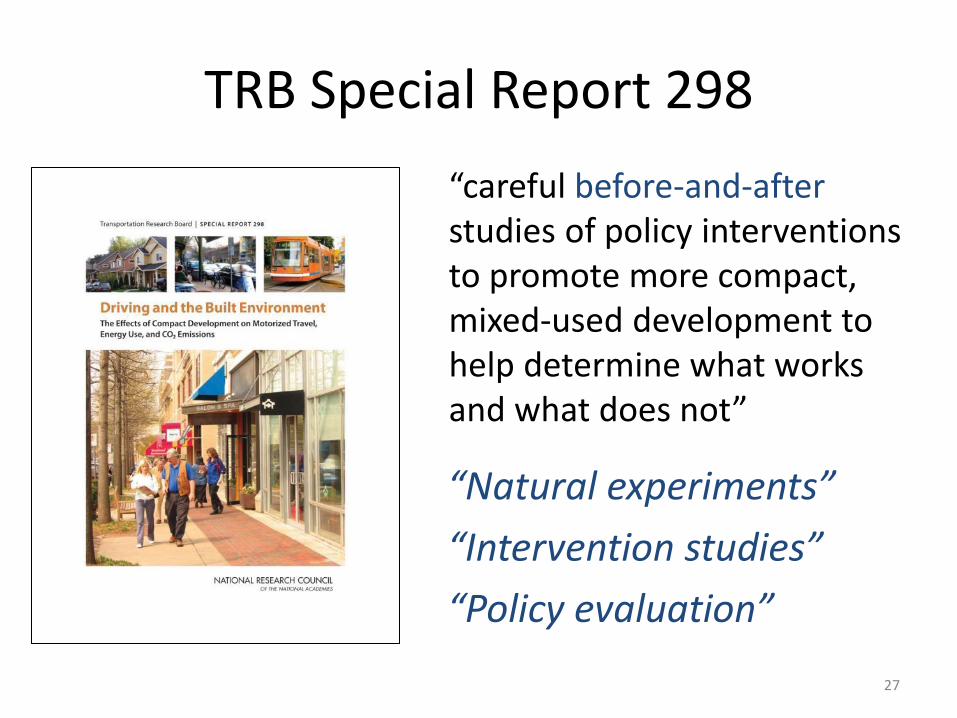
TRB Special Report 298
“careful before-and-after studies of policy interventions to promote more compact, mixed-used development to help determine what works and what does not”
“Natural experiments”
“Intervention studies”
“Policy evaluation”
27
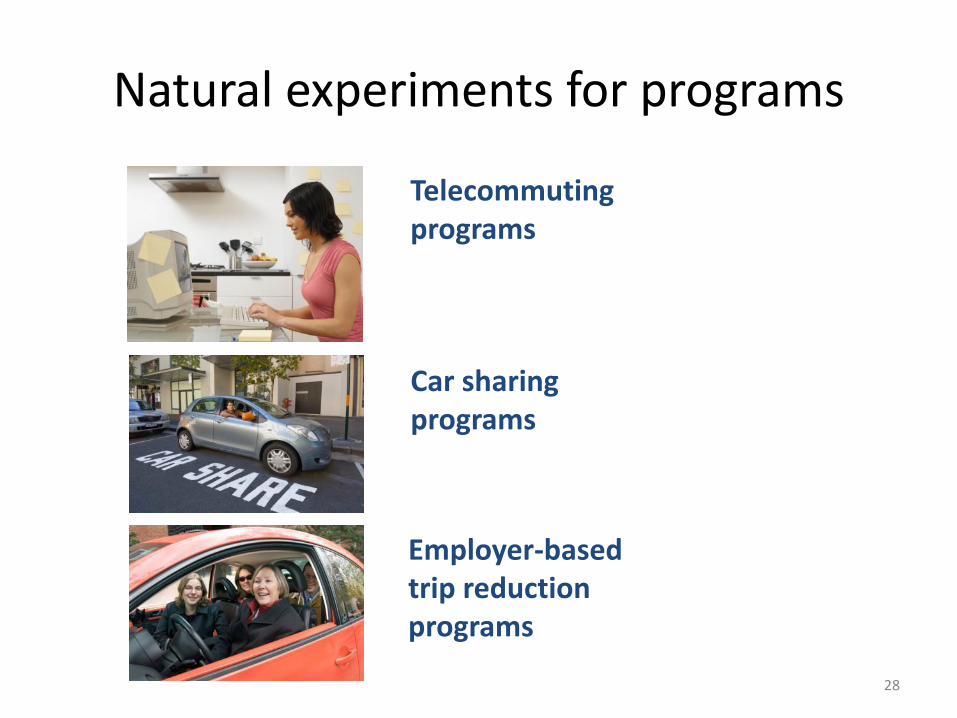
Natural experiments for programs
Telecommuting programs
Car sharing programs
Employer-based trip reduction programs
28
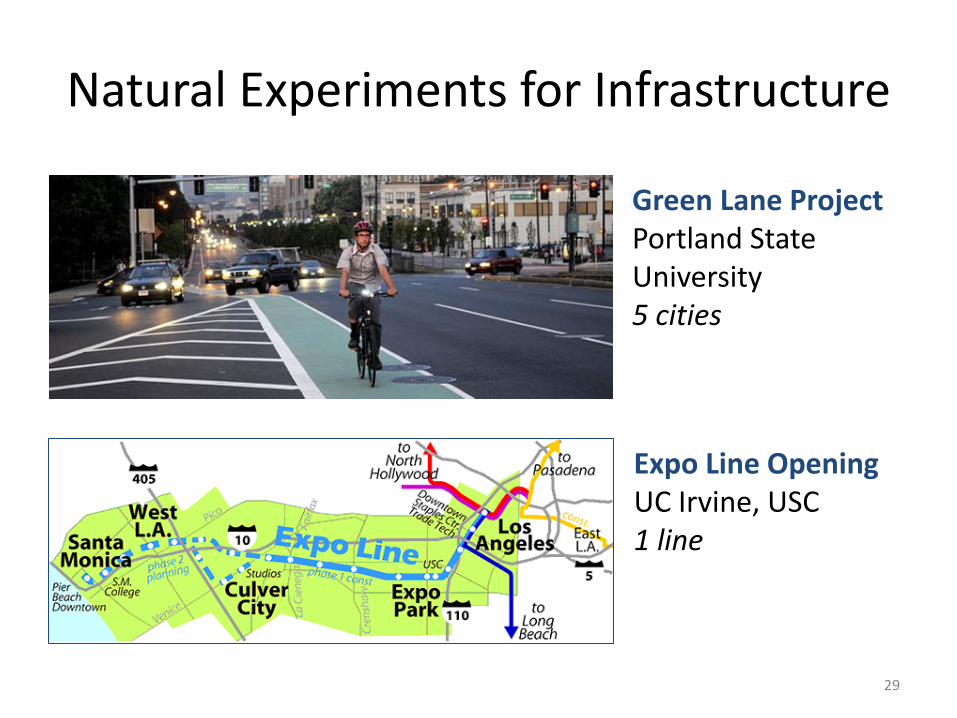
Natural Experiments for Infrastructure
Green Lane Project Portland State University 5 cities
http://www.google.com/url?sa=i&rct=j&q=&esrc=s&frm=1&source=images&cd=&docid=GF_snfCPpwuiRM&tbnid=CbYUWDLESWlnQM:&ved=0CAEQjxw&url=http%3A%2F%2Fgreenlaneproject.org%2F&ei=nr0zUsOvMom4igLCyYDQCQ&bvm=bv.52164340,d.cGE&psig=AFQjCNFV1BMutZ6GjiFrxkM4Vidcp0TcJg&ust=1379208956696122
Expo Line Opening UC Irvine, USC 1 line http://latimesblogs.latimes.com/photos/uncat
egorized/2009/02/20/expomap_2.gif
29
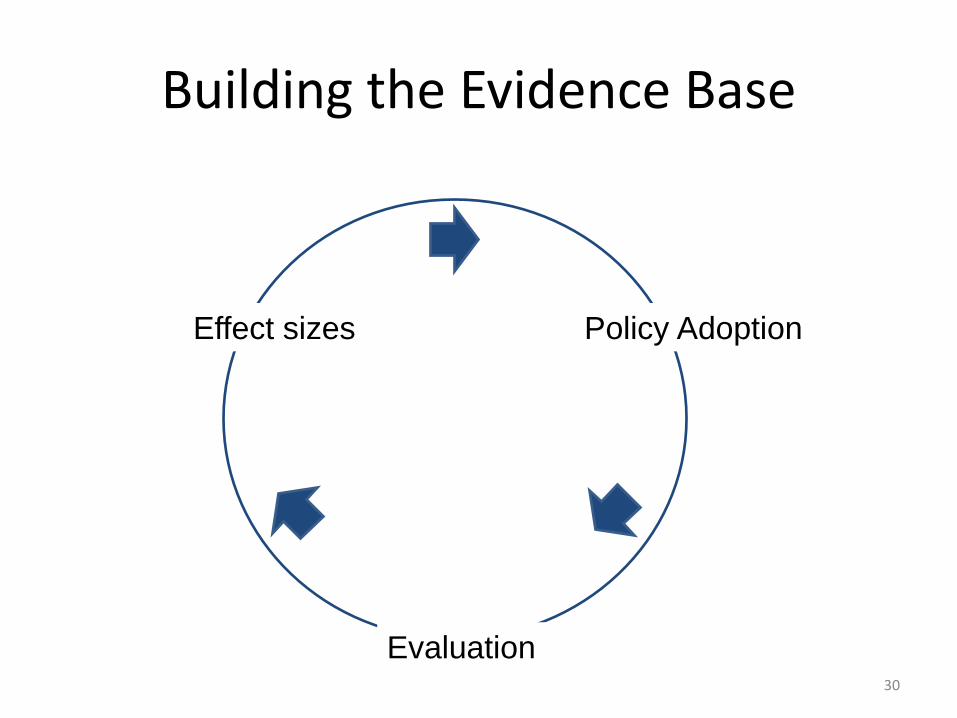
Effect sizes Policy Adoption
Evaluation
Building the Evidence Base
30
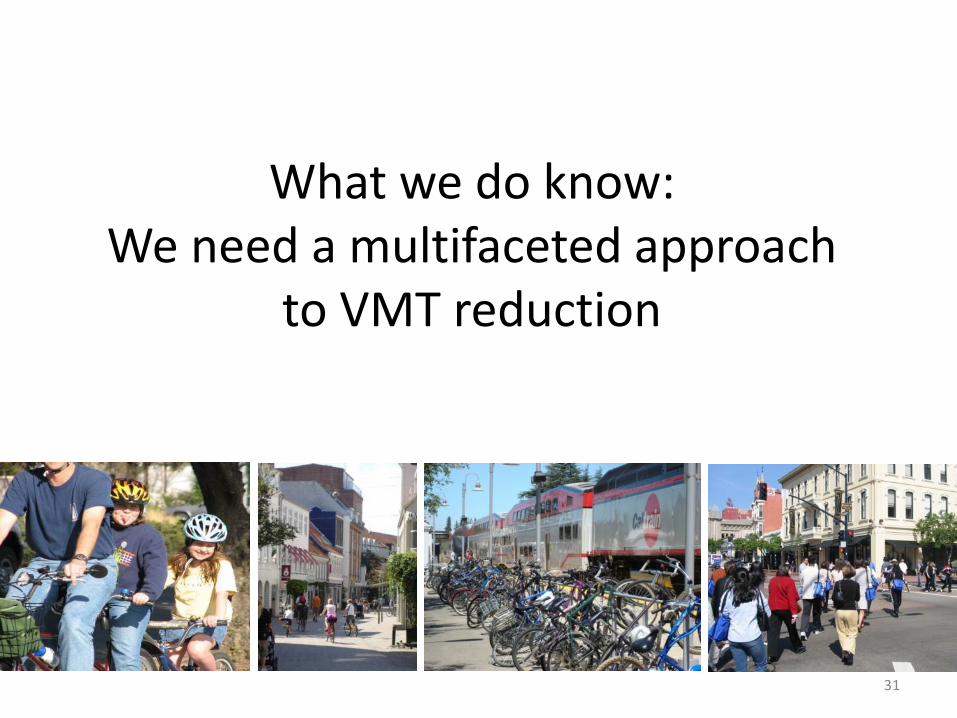
What we do know: We need a multifaceted approach
to VMT reduction
31
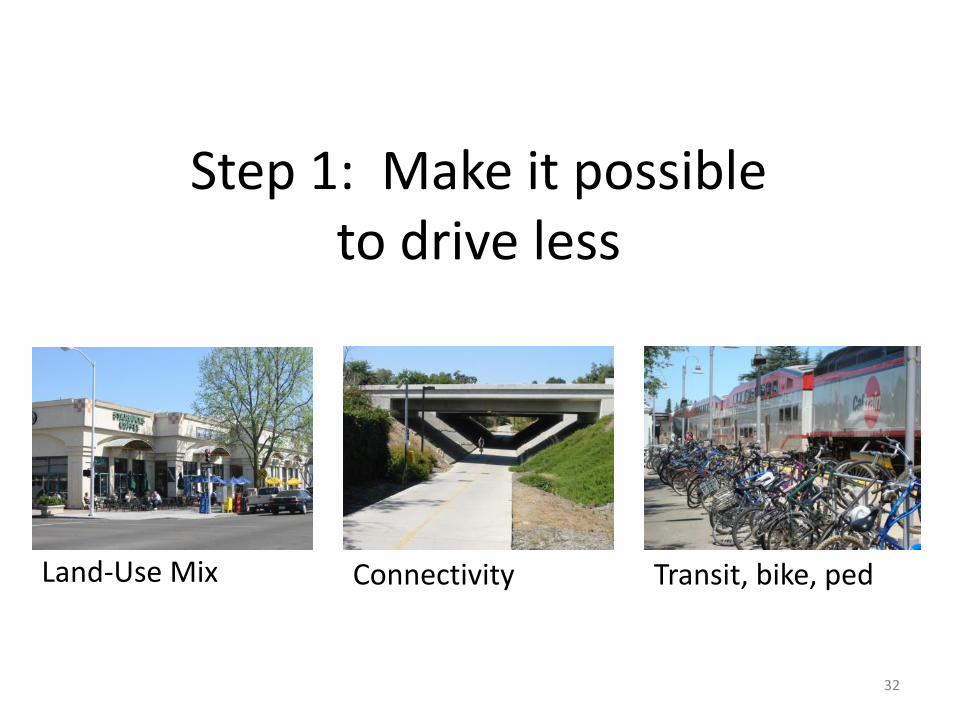
Step 1: Make it possible to drive less
Land-Use Mix Connectivity Transit, bike, ped
32
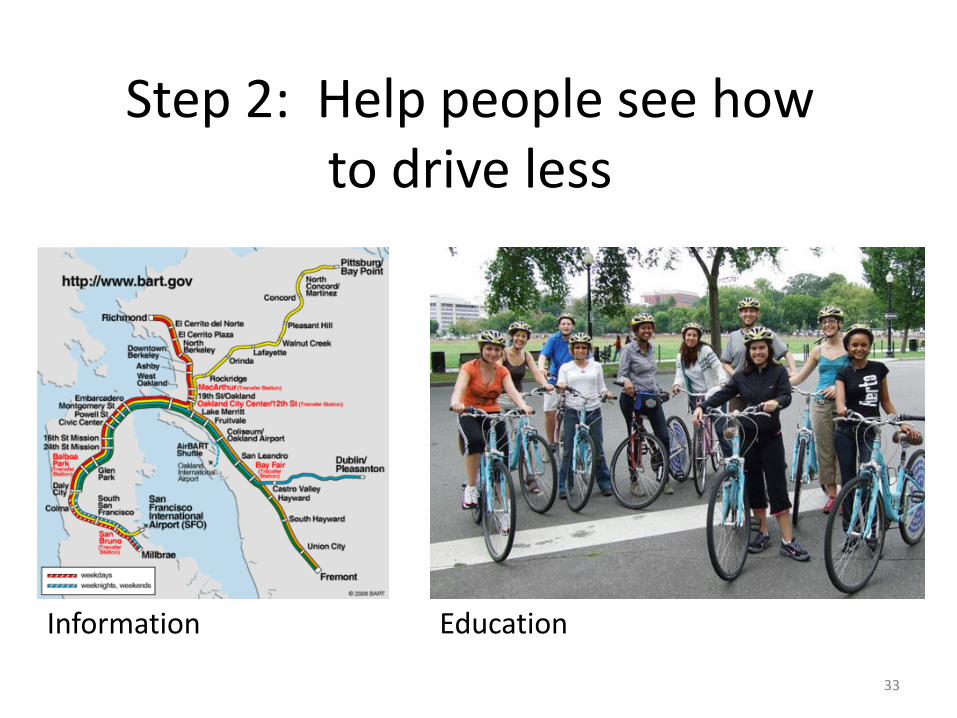
Step 2: Help people see how to drive less
http://www.bikearlington.com/pages/biking-in-arlington/bike-education/
Information Education
33
Step 3: Make people want to drive less
http://www.tasteslikecabbage.com/category/your-war/
34
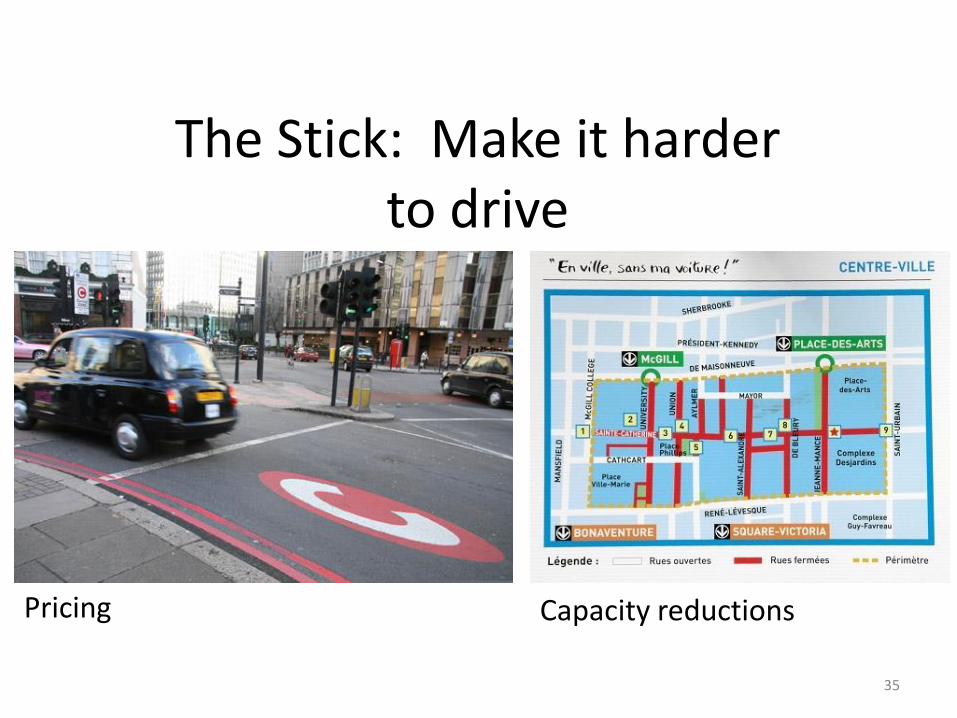
The Stick: Make it harder to drive
http://www.blork.org/blorkblog/2004/09/23/no-car-day/
http://www.streetsblog.org/2007/07/11/london-releases-its-fifth-annual-congestion-pricing-study/
Pricing Capacity reductions
35
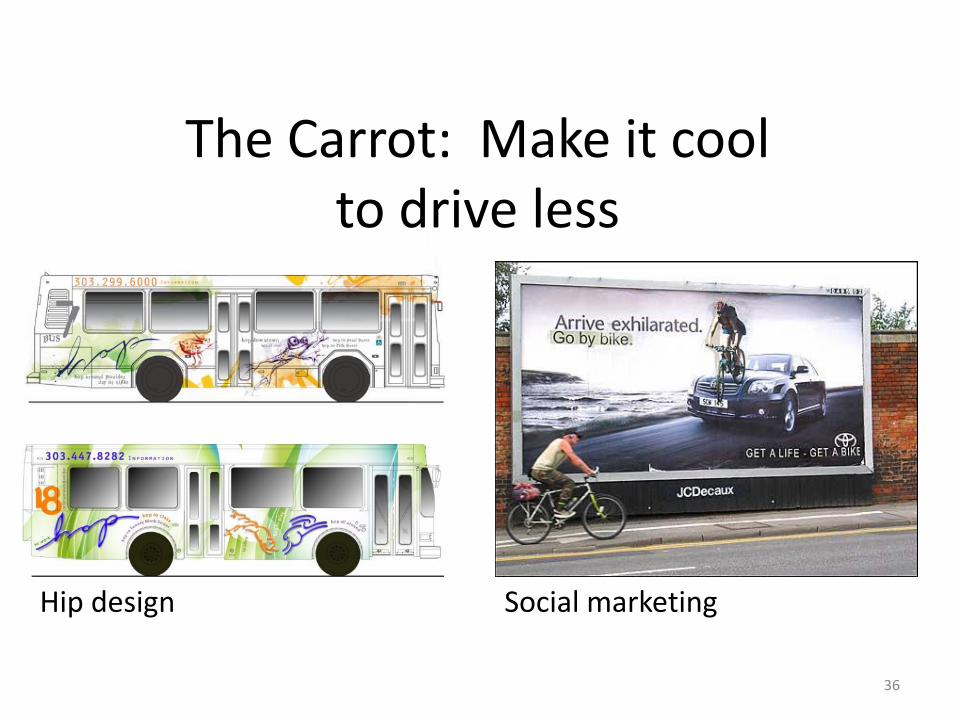
http://www.mattpolaine.com/
Social marketing Hip design
The Carrot: Make it cool to drive less
36
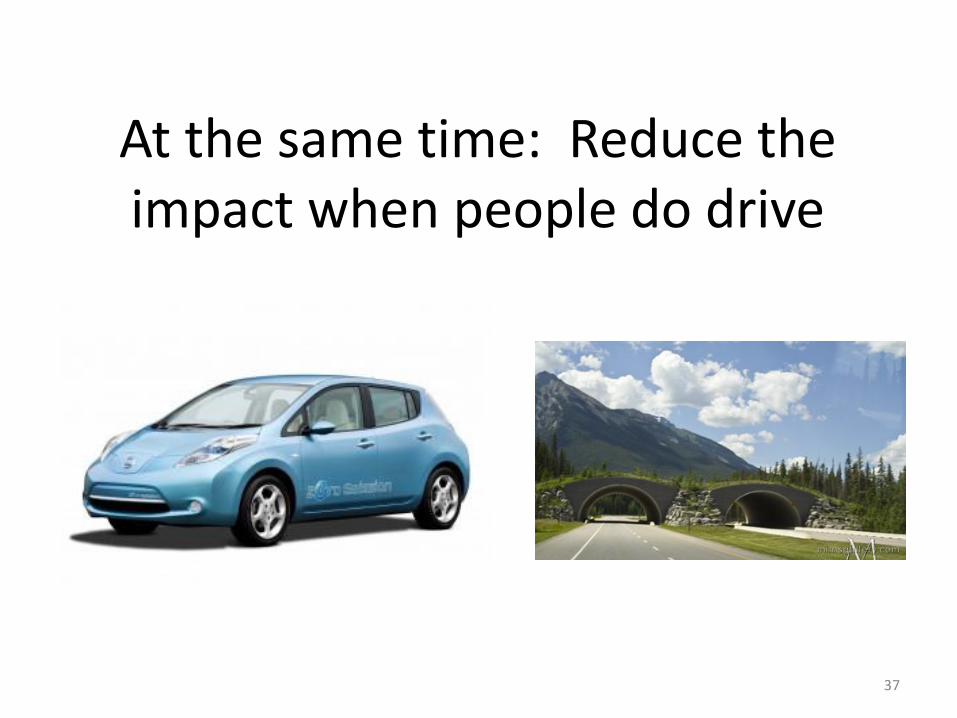
At the same time: Reduce the impact when people do drive
37
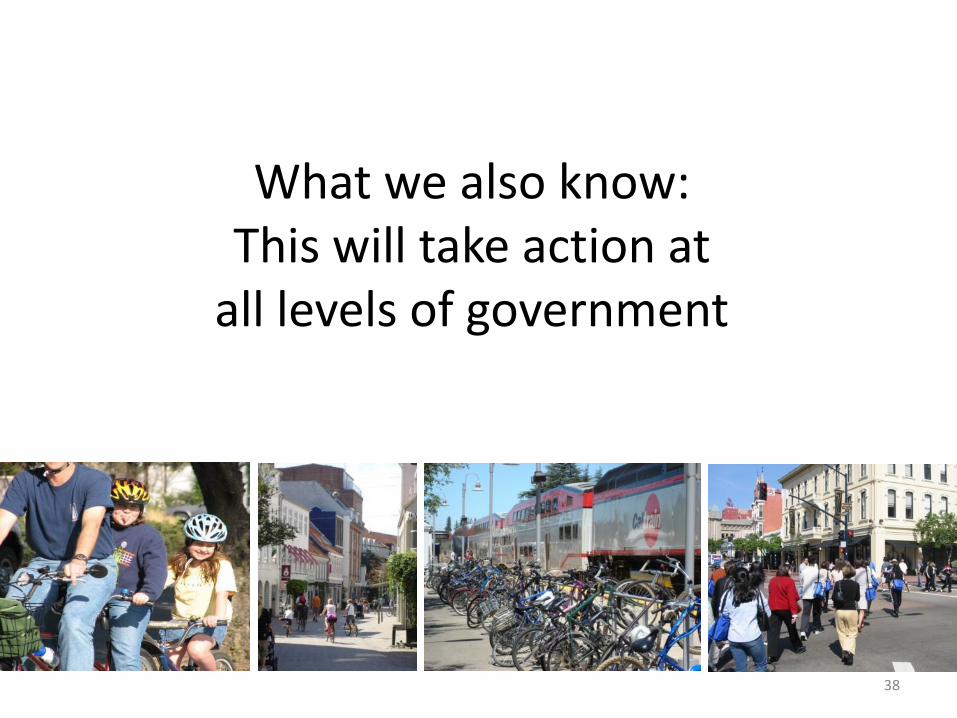
What we also know: This will take action at
all levels of government
38
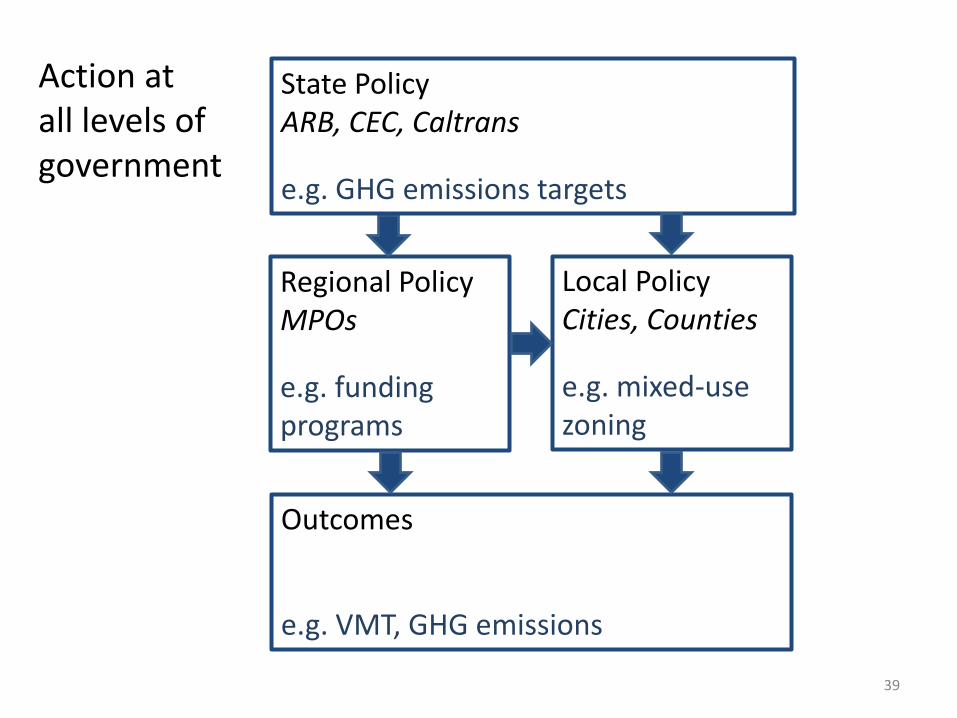
Local Policy Cities, Counties
e.g. mixed-use zoning
Outcomes
e.g. VMT, GHG emissions
Regional Policy MPOs
e.g. funding programs
State Policy ARB, CEC, Caltrans
e.g. GHG emissions targets
Action at all levels of government
39
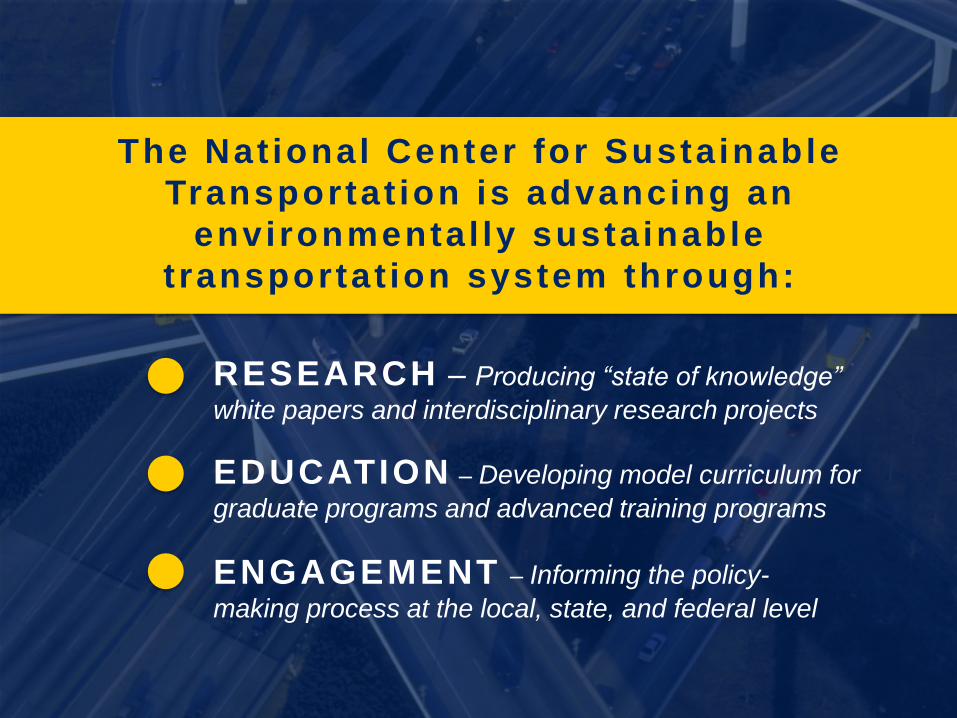
The Nat ional Center for Sustainable
Transportat ion is advancing an
environmental ly sustainable
t ransportat ion system through:
EDUCATION – Developing model curriculum for
graduate programs and advanced training programs
RESEARCH – Producing “state of knowledge”
white papers and interdisciplinary research projects
ENGAGEMENT – Informing the policy-
making process at the local, state, and federal level
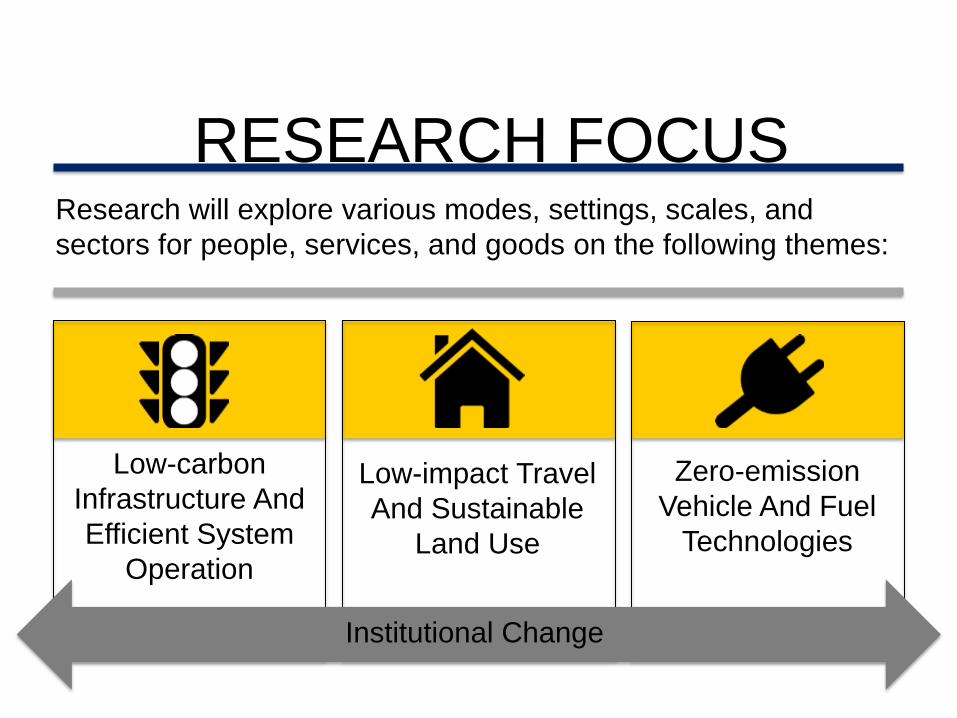
Low-carbon
Infrastructure And
Efficient System
Operation
Zero-emission
Vehicle And Fuel
Technologies
Low-impact Travel
And Sustainable
Land Use
RESEARCH FOCUS Research will explore various modes, settings, scales, and
sectors for people, services, and goods on the following themes:
Institutional Change
For more information
Susan Handy [email protected]
Laura Podolsky
www.its.ucdavis.edu www.ncst.ucdavis.edu